


Languages
Pages
Legal

Broward County, Florida PHASE 2: Impact and Tourist Development Tax Investment Analysis
SUBMITTED TO
Broward Workshop
SUBMITTED BY
C.H. Johnson Consulting, Incorporated
UPDATED July 2015

6 East Monroe Street | Fifth Floor | Chicago, Illinois 60603 | Phone: 312.447.2010 | Fax: 312.444.1125
www.chjc.com | [email protected]
TABLE OF CONTENTS
SECTION I
TRANSMITTAL LETTER
SECTION II
INTRODUCTION .......................................................................................................................................... 1
SECTION III
ECONOMIC AND FISCAL IMPACT OF TDT INVENTMENTS ..................................................... 2

6 East Monroe Street | Fifth Floor | Chicago, Illinois 60603 | Phone: 312.447.2010 | Fax: 312.444.1125
www.chjc.com | [email protected]
SECTION I
TRANSMITTAL LETTER

6 East Monroe Street | Fifth Floor | Chicago, Illinois 60603 | Phone: 312.447.2010 | Fax: 312.444.1125
www.chjc.com | [email protected]
July 30, 2015
Ms. Kareen Boutros
Executive Director
Broward Workshop
150 E. Davie Blvd., #200
Fort Lauderdale, Florida 33316
Re: Broward County, Florida Impact and Tourist Development Tax Investment Analysis
Dear Ms. Boutros:
Johnson Consulting is pleased to present submit this report regarding economic and fiscal impact analysis and
Tourist Development Tax (TDT) investment analysis in Broward County, Florida. Pursuant to our
engagement, this report serves as Phase II of our Room Tax Policy Analysis, submitted in April, 2015, and
documents our research for and findings from analyses on the aforementioned subjects.
Johnson Consulting has no responsibility to update this report for events and circumstances occurring after
the date of this report. The findings presented herein reflect analyses of primary and secondary sources of
information. Johnson Consulting used sources deemed to be reliable, but cannot guarantee their accuracy.
Moreover, some of the estimates and analyses presented in this study are based on trends and assumptions,
which can result in differences between the projected results and the actual results. Because events and
circumstances frequently do not occur as expected, those differences may be material. This report is intended
for the clients’ internal use and cannot be used for project underwriting purposes without Johnson
Consulting’s written consent.
We have enjoyed serving you on this engagement and look forward to providing you with continuing service.
Sincerely,
C.H. JOHNSON CONSULTING, INC.

6 East Monroe Street | Fifth Floor | Chicago, Illinois 60603 | Phone: 312.447.2010 | Fax: 312.444.1125
www.chjc.com | [email protected]
SECTION II
INTRODUCTION

6 East Monroe Street | Fifth Floor | Chicago, Illinois 60603 | Phone: 312.447.2010 | Fax: 312.444.1125
www.chjc.com | [email protected]
Section 2 – Introduction | REVISED July 2015
Broward County, Florida Room Tax Policy Analysis – Phase II
PAGE 1
INTRODUCTION
Johnson Consulting was retained by Broward Workshop to undertake a two-phase room tax policy analysis
related to tourism trends and Tourist Development Tax (TDT) collections and use policies in Broward
County, Florida. In Phase I, our assignments included a review of Broward County’s TDT current fund
governance and administration process as well as current and proposed uses of TDT; interviews with various
stakeholders, key representatives, and key decision makers; research of TDT fund governance, administration,
and disbursements in other markets; comparison with Broward County’s existing practices; and commentary
and recommendations on relevant issues. This Phase II focuses on economic and fiscal impact analysis, TDT
investment analysis, and descriptions of best practices.
METHODOLOGY
In order to complete the analysis required for this Phase II of the project, Johnson Consulting performed the
following tasks:
Profiled how Tourist Development Councils (TDCs) work in a set of Florida Counties.
Worked with client group to identify representative events to be analyzed,
Performed an economic and fiscal impact analysis of National Hockey League (NHL) Florida
Panthers games at BB&T Center; (The County recently retained a consultant to research, analyze and
report upon arena operations and the agreement with the Panthers organization). This instant report
is limited in scope in this regard to consideration of attendance at Panthers games as it relates to
impact on TDT and only for the purpose of providing an example of an application of a potential
formulaic method.
Consistent with the above item, prepared examples of Cultural Tourism Arts-based initiatives/
events, a major signature event, and the planned Broward County Convention Center expansion, and
Described how the model could be applied in Broward County, and
REPORT OUTLINE
Section 1 – Transmittal Letter
Section 2 – Introduction
Section 3 – Economic and Fiscal Impact Analysis

6 East Monroe Street | Fifth Floor | Chicago, Illinois 60603 | Phone: 312.447.2010 | Fax: 312.444.1125
www.chjc.com | [email protected]
SECTION III
ECONOMIC AND FISCAL IMPACT OF TDT INVESTMENTS

6 East Monroe Street | Fifth Floor | Chicago, Illinois 60603 | Phone: 312.447.2010 | Fax: 312.444.1125
www.chjc.com | [email protected]
Section 3 – Impact of TDT Investments | REVISED July 2015
Broward County, Florida Room Tax Policy Analysis – Phase II
PAGE 2
ECONOMIC AND FISCAL IMPACT ANALYSIS OF TDT INVESTMENTS
This section discusses two aspects in relation to Broward County Tourist Development Tax (TDT)
investments - firstly, it considers how Tourist Development Councils (TDCs) in other Florida counties
analyze and support recommendations to their County Commissions; and secondly, it provides quantitative
analyses of current TDT investments by the County, measuring economic impact and fiscal benefit generated
by selected projects that are currently receiving funding from TDT revenues. Through the research, we have
provided a quantitative model for Broward County, which can serve as a measuring tool as the County
considers various types of TDT investments. In Phase 1 of this report, recommendations were made
regarding grant application review. In each of the case study examples, quantitative analysis was only one
factor in the decision to grant funds and spend resources. Many other factors were recommended to be
included in the consideration process. The key point of that analysis was to emphasize the need to add
structure to the current process in Broward County.
This analysis is solely a recommendation and implementation of the TDT will require concurrence of the
County and staff support to continually analyze investment options. This recommended model is outlined in
the balance of this report.
OVERSIGHT OF TOURISM EXPENDITURES
Florida statutes define how the TDT is to be used by counties. While proscriptive in broad terms, how
execution occurs in individual counties is less formalized. We have investigated how the defined advisory
boards, called the Tourism Development Councils (TDCs), work in the top tourism counties in Florida. We
interviewed hospitality representatives, reviewed TDC Board reports and looked at products prepared by
TDCs in nine counties across Florida. Counties analyzed in this evaluation include:
Broward County,
Dade County,
Hillsborough County,
Monroe County,
Orange County,
Osceola County,
Palm Beach County,
Pinellas County, and
Volusia County.
Each of these TDCs operates in serves an advisory role to their County Commission. The services and
support provided by the TDCs is outlined below:
Advisory – In some cases (Dade County, Hillsborough County, Orange County, Volusia County) the
County’s TDC and other committees or County Departments) meet monthly or quarterly and hold
occasional retreats to discuss performance in the market, review and comment on how funds are
spent by category, and provide a voice of the hospitality and tourism industry as a “conscience” to
the County, to support in general, the County’s decisions.

6 East Monroe Street | Fifth Floor | Chicago, Illinois 60603 | Phone: 312.447.2010 | Fax: 312.444.1125
www.chjc.com | [email protected]
Section 3 – Impact of TDT Investments | REVISED July 2015
Broward County, Florida Room Tax Policy Analysis – Phase II
PAGE 3
CVB staff – The CVB serves as the “staff” of the TDC, with or without its Board of Directors that
support the CVB. The CVB prepares a marketing plan for the County, which the County utilizes,
but the County still directs the ultimate expenditures of funds - Broward County, with support of
the MAC Committee; Pinellas County, Osceola County fall into this category.
Independently staffed TDC – A small, independent staff conducts research and analysis of how to
best use room tax dollars, with data and research going to the TDC Board, the Board then advises
the County on how to use the tax dollars. This is the case in Palm Beach County and Monroe
County.
The approaches employed in Palm Beach and Monroe Counties are the most impartial and sound models.
These models provide fair, impartial and a structured basis for decision-making. The TDC model used in
Palm Beach is described in more detail below.
The TDC staff in Palm Beach County spends, about $1 million per year. One quarter of this spending goes
towards salaries, conducting analysis and research on categories of expenditures deemed important to their
County’s economy. This research supports the TDC in its advisory role to the County, which still makes the
final determination of spending allocations. The TDC’s input has weight however, as it comes from a base of
analysis and research. Categories are analyzed annually and discussed at monthly TDC Board meetings. The
following figure (Figure 3-1) is the Palm Beach County’s budget message, which outlines the categories of
expenditures.

6 East Monroe Street | Fifth Floor | Chicago, Illinois 60603 | Phone: 312.447.2010 | Fax: 312.444.1125
www.chjc.com | [email protected]
Section 3 – Impact of TDT Investments | REVISED July 2015
Broward County, Florida Room Tax Policy Analysis – Phase II
PAGE 4
Figure 3- 1
The following figure presents examples of the research conducted and results found by TDC staff.

6 East Monroe Street | Fifth Floor | Chicago, Illinois 60603 | Phone: 312.447.2010 | Fax: 312.444.1125
www.chjc.com | [email protected]
Section 3 – Impact of TDT Investments | REVISED July 2015
Broward County, Florida Room Tax Policy Analysis – Phase II
PAGE 5
Figure 3- 2
While the data above may not be current (2004), it is interesting to note the relative spending categories,
which may help justify alternative sources of funding in Broward County.
The following figure discusses the County’s Equestrian industry and is an example of the data which is
yielded from the research that the county contracts.

6 East Monroe Street | Fifth Floor | Chicago, Illinois 60603 | Phone: 312.447.2010 | Fax: 312.444.1125
www.chjc.com | [email protected]
Section 3 – Impact of TDT Investments | REVISED July 2015
Broward County, Florida Room Tax Policy Analysis – Phase II
PAGE 6
Figure 3- 3
The approach being used in Palm Beach County is deemed superior to that being used in Broward County. In
Broward County, research is prepared by disparate groups including County staff, the CVB and interest
groups that may or may not have certain levels of political influence or power bases to influence the County
regarding allocations. Some groups may not prepare any research at all, shortchanging what could be wise
options for investment.
Monroe County has a local ordinance that describes how the TDC operates. One aspect of the local
ordinance defines the independent support function proscribed to support the TDC:
“There is hereby created an executive office for the tourist development council. The governing board of the county shall employ by contract, or establish a county department and employ an executive director and such other personnel as may be required to operate the executive office. Any contract for employment entered into by and between the executive director or other personnel authorized by this article shall provide that such director and personnel will be responsible and answerable directly to the tourist development council and indirectly to the board of county

6 East Monroe Street | Fifth Floor | Chicago, Illinois 60603 | Phone: 312.447.2010 | Fax: 312.444.1125
www.chjc.com | [email protected]
Section 3 – Impact of TDT Investments | REVISED July 2015
Broward County, Florida Room Tax Policy Analysis – Phase II
PAGE 7
commissioners. If contracted, such persons shall serve at the pleasure of and be subject to removal by the board of county commissioners. The tourist development council may make recommendations concerning the contracts. The executive director shall carry out the policies and programs established by the council and shall be in charge of the day-to-day operations of those policies and programs. The executive director and the staff of the executive office of the tourist development council shall be compensated, and the costs and expense of the operation of the executive office shall be paid from the proceeds of the tourist development tax prior to any other use or distribution thereof. In the furtherance of the provision of this section, the amount to be expended shall not exceed seven percent of the annual two-cent budget and three percent of the annual third-cent budget.”
It is recommended that an ordinance like this be passed in Broward County, creating an independent
analytical arm for the TDC, and then the TDC be used more effectively to advise on TDT expenditures.
IMPACT ANALYSIS OF TDT INVESTMENTS
The scope of work for this task requires that tools be created to allow the TDC and County to analyze
individual event types. This is an objective analysis, and does not consider the intangible merits of cultural
and recreational enhancements and broader depth of experience in the County overall. These factors must be
considered in the overall decisions regarding allocations as well.
Recently, the County has used TDT revenues to support various types of projects. This analysis examines the
potential economic and fiscal benefits of selected set of projects currently receiving funding from TDT
revenues. The benefits can be viewed as the quantifiable returns of the TDT investments made by the
County.
Four types of projects have been selected to be analyzed:
The National Hockey League (NHL) Florida Panthers games at BB&T Center, or commonly
known as Broward County Civic Arena,
Representative Cultural Tourism Arts-based initiatives/ events,
A representative Major Signature Event, and
The expansion of Broward County Convention Center.
DEFINITIONS
Economic impact is defined as incremental new spending in an economy that is the direct result of certain
activities, facilities, or events. For the purpose of this analysis, impact totals are discussed in terms of the
Broward County economy. The levels of impacts are described as follows:

6 East Monroe Street | Fifth Floor | Chicago, Illinois 60603 | Phone: 312.447.2010 | Fax: 312.444.1125
www.chjc.com | [email protected]
Section 3 – Impact of TDT Investments | REVISED July 2015
Broward County, Florida Room Tax Policy Analysis – Phase II
PAGE 8
Direct Spending – is an expression of the spending that occurs as a direct result of the games and
activities in a subject facility or subject event. (e.g. a hockey game attendee’s expenditures on hotel
rooms, shopping, and meals are direct spending).
Indirect Spending – consists of re-spending of the initial or direct expenditures, or, the supply of
goods and services resulting from the initial direct spending in the subject facility or subject event.
(e.g. a hockey game patron’s direct expenditure on a restaurant meal causes the restaurant to
purchase food and other items from suppliers. The portion of these restaurant purchases that are
within the local, regional, or state economies is counted as an indirect spending).
Induced Spending – represent changes in local consumption due to the personal spending by
employees whose incomes are affected by direct and indirect spending. (e.g. a waiter at the restaurant
may have more personal income as a result of the hockey game attendee’s visit. The amount of the
increased income the waiter spends in the local economy is called an induced spending).
Increased Earnings – measures increased employee and worker compensation related to the facility/
event/ project being analyzed. This figure represents increased payroll expenditures, including
benefits paid to workers locally. It also expresses how the employees of local businesses share in the
increased outputs.
Employment – measures the number of jobs supported in the study area related to the spending
generated as a result of the game and events being analyzed. Employment impact is noted as the
number of full-time equivalent jobs.
Indirect and induced spending, increased earnings, and employment are estimated using a set of multiplier
rates shown on Table 3-1 below. The multipliers are based on the IMPLAN, input-output model, which was
recently used for the impact analysis of a project in Broward County. IMPLAN is a nationally recognized
model commonly used to estimate economic impacts. The input-output model analyzes the commodities and
income that normally flow through the various sectors of the economy.

6 East Monroe Street | Fifth Floor | Chicago, Illinois 60603 | Phone: 312.447.2010 | Fax: 312.444.1125
www.chjc.com | [email protected]
Section 3 – Impact of TDT Investments | REVISED July 2015
Broward County, Florida Room Tax Policy Analysis – Phase II
PAGE 9
Table 3-1
The multiplier rates can be interpreted as an additional $0.96 of value to the economy for every $1.00 spent
by people in Broward County. Broward County’s FTE employment is calculated at 13.68 and can be
interpreted as an increase in 13.68 jobs per each $1 million of direct spending.
SPENDING PER VISITOR
Ideally, the estimate of direct spending associated with each project comes primarily from the event
promoter(s) and/ or organizer(s), who shall be most familiar with the subject event. In most cases however,
for practical and objectivity reasons, the values of direct spending impacts were based on unbiased, generic,
publicly available average day-visitor spending estimates. The main source of these generic spending estimates
used to be a spending survey done by Destination Marketing Association International (DMAI), formerly
known as International Association of Convention & Visitor Bureaus (IACVB). However, DMAI has not
done such surveys for sometime – the most recent one was completed in 2004. Today, two main sources of
spending estimates are recommended:
Per diem by U.S. General Services Administration, which provides breakdown of spending on
lodging, meals, and incidentals for nearly every location in the U.S., and
Corporate Travel Index by Business Travel News, which publishes the daily costs of business travel
(i.e. hotel, meals, and car rentals) in 200 major U.S. cities.
If additional spending data is available for a specific event, the generic spending estimate can be fine-tuned
accordingly.
ESTIMATES FOR INDIRECT AND INDUCED SPENDING, INCREASED EARNINGS, AND EMPLOYMENT
Indirect and induced impacts are often referred to as the multiplier effect. The multiplier effect includes the
indirect and induced spending that the infusion of direct spending in the economy generates. Indirect and
induced impacts vary depending upon the size and composition of the region’s economy.
Broward County, Florida
Economic Impact Multipliers
Impact Multiplier Base
Indirect Spending 0.279 of direct spending
Induced Spending 0.298 of direct spending
Increased Earnings 0.386 of direct spending
Increased Employment (FTE) 13.68 per $1 million of direct spending
Source: Implan, Johnson Consulting

6 East Monroe Street | Fifth Floor | Chicago, Illinois 60603 | Phone: 312.447.2010 | Fax: 312.444.1125
www.chjc.com | [email protected]
Section 3 – Impact of TDT Investments | REVISED July 2015
Broward County, Florida Room Tax Policy Analysis – Phase II
PAGE 10
The methodology for estimating the indirect and induced spending generated by the direct spending involves
the use of industry multipliers that reflect the relationship between various sectors of an economy. These
industry multipliers estimate the impact that an increase in spending on particular sectors of the economy has
upon the overall economy, based on IMPLAN input-output model. An input-output model analyzes the
commodities and income that normally flow through the various sectors of the economy. The multipliers
utilized for Broward County are as shown in Table 3-1.
FISCAL IMPACT ANALYSIS
Fiscal impact analysis measures the estimated tax revenues resulting from direct spending occurring in certain
activities, facilities, or events. For this analysis, fiscal impact estimates focus on major categories of tax
revenues that are directly affected by a visitor’s activity (i.e. general sales tax, hotel/motel occupancy tax, and
corporate income tax (there is no individual income tax in Florida).
Sales Tax – is 6.00 percent in Florida.
Local-Option Tourist Development Tax (Bed Tax) – is 5.00 percent on spending on lodging.
Corporate Income Tax – is 5.50 percent in Florida.
As a rule, every dollar that circulates in an economy is subjected to a wide array of fees and taxes imposed at
various levels of government. For practicality purposes, and since the main objective of the analysis is to
measure the impact of TDT investment, it is recommended that the analysis focuses major categories of tax
revenues that are directly affected by a visitor’s activity: general sales tax, hotel/ motel occupancy tax, and
corporate income tax.
CONCEPTUAL CHART
The following figure illustrates conceptually the calculation of economic and fiscal impact of a subject event.

6 East Monroe Street | Fifth Floor | Chicago, Illinois 60603 | Phone: 312.447.2010 | Fax: 312.444.1125
www.chjc.com | [email protected]
Section 3 – Impact of TDT Investments | REVISED July 2015
Broward County, Florida Room Tax Policy Analysis – Phase II
PAGE 11
Figure 3- 4
Using the method illustrated in the chart above, the following subsections describe economic and fiscal
impact analysis for the four types of representative projects.
IMPACT OF NHL EVENTS AT BB&T CENTER
Impact analysis of NHL Florida Panthers events at the BB&T Center is based on the hockey game visitation
volume. According to Broward County Civic Arena Report prepared by the Office of Broward County
Administrator in February 2014, the Arena hosted over 700,000 attendees annually, including approximately
350,000 spectators to the Panthers games, as shown in Table 3-2.
Subject
Event
Overnight Attendees
Day-trip Attendees
Overnight Other Visitors*
Day-trip Other Visitors*
Average Daily Spending
(by relevant
categories)
Direct Spending
Indirect Spending
Induced Spending
Increased Earnings
Employment
IMPLAN
Detailed Direct Spending
by Sector
(Tax Base)
Tax Revenues Effective
Tax Rates
Economic Impact
Fiscal Impact
Net Direct Spending
Economic and Fiscal Impact Analysis
(all measured in person-days)
*Representing visiting athletes, sports teams, performers,
production support crew, and other event participants.

6 East Monroe Street | Fifth Floor | Chicago, Illinois 60603 | Phone: 312.447.2010 | Fax: 312.444.1125
www.chjc.com | [email protected]
Section 3 – Impact of TDT Investments | REVISED July 2015
Broward County, Florida Room Tax Policy Analysis – Phase II
PAGE 12
Table 3-2
These 350,000 visitors are the basis for this analysis. They will spend money in Broward County and many
will originate from out of the County, and by legislation are defined as “tourists”. Average daily spending
used in this analysis is derived from several sources. The estimates for lodging, meals, and incidental expenses
are based on per person, per diem rates for Broward County per U.S. General Services Administration for an
October 2014-September 2015 period, which can be viewed as an average amount of spending across various
hotels, restaurants, retail and other establishments. The estimate for spending on tickets is based on the
County Administrator’s February 2014 Arena Report. The following table (Table 3-3) displays the average
daily spending per visitor, based on the given DMAI ratios.
Table 3-3
BB&T Center, Broward County
FYE 2013 Attendance
# of Event
Spectators
Hockey Events 350,000
Non-Hockey Events 365,742
Total 715,742
Source: Broward County
Impact Analysis for Broward County
Average Daily Spending per Visitor
NHL Florida
Panthers
Events
1 Lodging $140
2 Meals and Incidental Expenses 71
3 Tickets 56
4 Retail 25
5 Total $292
Notes:
Lines 1 and 2 - Based on GSA Per Diem rate for Broward County.
Line 3 - Page 33 of the Broward County Civic Arena Report
by Broward County Adminstrator, Feb 2014.
Line 4 - Estimates.
Source: U.S. General Services Administration, Broward County,
Johnson Consulting

6 East Monroe Street | Fifth Floor | Chicago, Illinois 60603 | Phone: 312.447.2010 | Fax: 312.444.1125
www.chjc.com | [email protected]
Section 3 – Impact of TDT Investments | REVISED July 2015
Broward County, Florida Room Tax Policy Analysis – Phase II
PAGE 13
Conceptually, multiplying number of total visitors with average daily spending will result in total direct
spending. However, not all visitors will spend money on lodging. Therefore, assumptions about visitors who
do and do not require lodging need to be developed first. Such estimates are shown in the table below (Table
3-4).
Table 3-4
Approximately 68 percent of single-game spectators are from outside of Miami-Dade, Broward, or Palm
Beach County. Meanwhile, in absence of specific data on season ticket holders, it has been assumed that a
greater proportion of them are from the nearby area. Therefore, the overnight factor for overall out-of-
market visitors (non-season and season ticket holders, combined) has been reduced from the typically used 8
percent to 5 percent. The Panthers did not participate in this analysis, notwithstanding several requests. As
previously mentioned, the County has retained a consultant to research and analyze the County’s agreement
with the Panthers organization.
As shown on the table, spectators to the hockey games and the teams playing at BB&T Center are estimated
to generate 353,750 person-days and 14,400 room nights, annually.
Based on the assumptions shown in Table 3-3 and Table 3-4, total direct spending by all visitors, hockey
players, and team operations is estimated in the table below (Table 3-5).
NHL Florida Panthers Events at BB&T Center, Broward County
Estimated Day and Overnight Attendees
# of Person-
Days
% Out of
Tri-County
Region (1)
% Staying
Overnight
(2)
# of Room
Nights
1 Hockey Events Spectators (3) 350,000 68% 5% 11,900
2 NHL Teams (4) 3,750 100% 100% 2,500
3 Total 353,750 14,400
Notes:
1) Reflecting visitors from outside of Broward, Miami-Dade, and Palm Beach counties.
2) Indicating visitors who stay overnight in hotels and thus generate room nights,
largely those from northern parts of Florida, outside Florida, or overseas.
3) Page 30 of Feb 2014 Broward County Civic Arena Report by Broward County Adminstrator
says that 68% of single game revenues are from individuals that reside outside of Miami-Dade, Broward
or Palm Beach counties. Only a small fraction of those would stay overnight. Such overnight visitors include
those from northern counties in Florida, other states in the U.S., or overseas.
4) Page 31 of Feb 2014 Broward County Civic Arena Report by Broward County Adminstrator
says that more than 2,500 hotel nights per hockey season are generated by visiting teams in hotels
located in Broward County. It is assumed that, on average, each person of the visiting teams
stays in Broward County for 1.5 days per visit.
Source: Broward County, Johnson Consulting

6 East Monroe Street | Fifth Floor | Chicago, Illinois 60603 | Phone: 312.447.2010 | Fax: 312.444.1125
www.chjc.com | [email protected]
Section 3 – Impact of TDT Investments | REVISED July 2015
Broward County, Florida Room Tax Policy Analysis – Phase II
PAGE 14
Table 3-5
Based on FYE 2013 visitation volume, all NHL games-related visitors to the Arena are projected to spend
$57.7 million, combined, annually during their visits.
ECONOMIC IMPACT
Based on the calculations and assumptions described thus far, the following table (Table 3-6) summarizes the
total estimated economic impacts of hockey events at the Arena.
Table 3-6
NHL Florida Panthers Events at BB&T Center, Broward County
Estimated Direct Spending
Calculations Estimated Amount
1 On Lodging $140 x 14,400 room nights = $2,016,000
2 Meals and Incidental Expenses $71 x 353,750 total person-days = 25,116,250
3 On Tickets $56 x 350,000 ticketed attendees = 19,512,500
4 Retail $25 x 353,750 total person-days = 8,843,750
5 Sub-Total $55,488,500
6 Team Operations (Florida Panthers) annual operation (1) $2,200,000
7 Total $57,688,500
Notes:
1) Page 26 of the Broward County Civic Arena Report by Broward County Adminstrator, Feb 2014.
Source: Broward County, Johnson Consulting
NHL Florida Panthers Events at BB&T Center,
Broward County
Estimated Annual Economic Impact
Multiplier*Impact
($Millions)
Direct Spending $57.69
Indirect Spending 0.28 16.09
Induced Spending 0.30 17.19
Total Spending $90.97
Increased Earnings 0.39 $22.26
Employment (FTE Jobs) 13.68** 789
*Reflects the impact for each $1 million of direct spending.
**Meaning, each $1 million of direct spending supports 13.68 FTE jobs in
the County.
Source: Johnson Consulting

6 East Monroe Street | Fifth Floor | Chicago, Illinois 60603 | Phone: 312.447.2010 | Fax: 312.444.1125
www.chjc.com | [email protected]
Section 3 – Impact of TDT Investments | REVISED July 2015
Broward County, Florida Room Tax Policy Analysis – Phase II
PAGE 15
NHL Florida Panthers events at the Arena are estimated to generate $91 million of total spending, $22.3
million of increased earnings, and support 789 full-time equivalent jobs in the County, annually.
FISCAL IMPACT
Table 3-7) displays the estimated annual fiscal impact of NHL Florida Panthers events at the Arena.
Table 3-7
NHL events at the Arena are estimated to generate approximately $4.4 million of tax revenues annually.
RETURN OF TDT FUNDING RECEIVED
Currently, the Florida Panthers’ County-owned arena receives $8 million in funding from TDT revenues each
year. In return, Broward County collects approximately $4.4 million of tax revenues from NHL games-related
spending from all sources, of which an estimated $101,000 relates to lodging tax. This results in a relationship
of 1.3 percent of invested money being returned to the TDT coffers. With all taxes considered, the return is
54 percent. This $8 million TDT investment helps generate $57.7 million of direct spending in the County’s
economy, a lot of which does come from visitors from outside the County. The hockey games are only a
fraction of the events held at the arena, and they too would contribute to the value of visitation to the county.
These templates provide a framework for other events to be evaluated.
It is our belief that suburban arenas will always have less impact than arenas near hotels and shopping, and in
downtown settings. Nevertheless, it is incumbent upon the team and the County to continue to attract higher
impact events, put a better product in the arena, package all events with hotel stays and enticements to visit
other assets in the County. It is also deemed essential that the surrounding real estate be developed to both
create other tax revenue that could be used to fund the arena, and to create an environment that encourages
an improved environment around the arena.
NHL Florida Panthers Events at BB&T Center, Broward County
Estimated Annual Fiscal Impact
Tax Rate Taxable SpendingTax
Revenues
Sales Tax - State** 5.00% $57,688,500 of direct spending $2,884,000
Sales Tax - Local** 1.00% $57,688,500 of direct spending 577,000
Local-Option Tourist Development Tax (Bed Tax) 5.00% $2,016,000 of spending on lodging 101,000
Corporate Income Tax 5.50% $14,422,125 or 25% of direct spending* 793,000
Total $4,355,000
*Assuming that 25% of direct spending goes to taxable corporate income of vendors.
**Only the 1% local tax is returned to Broward County, while the 5% state tax is used by the state as general revenue.
Source: Johnson Consulting

6 East Monroe Street | Fifth Floor | Chicago, Illinois 60603 | Phone: 312.447.2010 | Fax: 312.444.1125
www.chjc.com | [email protected]
Section 3 – Impact of TDT Investments | REVISED July 2015
Broward County, Florida Room Tax Policy Analysis – Phase II
PAGE 16
IMPACT OF CULTURAL TOURISM ARTS-BASED INITIATIVES/ EVENTS
The impact analysis of Cultural Tourism Arts-based initiatives/events uses the same methodology utilized in
the analysis of the NHL events. Two shows at the Au-Rene Theater, Broward Center for the Performing Arts
were selected as representative events: Phantom of the Opera and Ron White’s Stand-Up Comedy Show.
Phantom of the Opera was an off-Broadway production that ran for multiple days, while Ron White Stand-
Up Comedy was a one-time show. The table below (Table 3-8) summarizes selected event statistics of these
two events, as provided by the Broward Center for the Performing Arts.
Table 3-8
The table below (Table 3-9) translates these event statistics (seen in Table 3-8) into the number of person-
days and room nights that are generated. This number includes the show patrons, the performers and their
production staff. Generally, based on our experience, patrons from within the Tri-County region and other
immediately surrounding areas will travel, and while the may be considered, statutorily, as “tourists” they do
not create the same rate of overnight hotel occupancy as those who travel from greater distances. Therefore,
the core category of visitors that would require lodging are those primarily from more distant counties in
Florida, other states in the U.S., and foreign countries. In lieu of available source data but in order to establish
Representative Cultural Tourism Arts-based Initiatives/
Events in Broward County
Selected Event Statistics
Phantom of
the Opera
(Broadway)
Ron White
(Stand-up
Comedy)
Location Au-Rene
Theater,
Broward
Center for the
Performing
Arts
Au-Rene
Theater,
Broward
Center for the
Performing
Arts
# of Performances 32 1
# of Tickets Sold (# of Spectators) 37,000 2,042
# of Performers and Support 60 2
Ticket Sales $2,500,000 $96,000
Patron Origin
Broward County 55% 68%
Miami-Dade County 19% 11%
Palm Beach County 12% 12%
Other counties in Florida 6% 5%
Outside Florida 6% 3%
Overseas 2% 1%
Total 100% 100%
Source: Broward Center for the Performing Arts, Johnson Consulting

6 East Monroe Street | Fifth Floor | Chicago, Illinois 60603 | Phone: 312.447.2010 | Fax: 312.444.1125
www.chjc.com | [email protected]
Section 3 – Impact of TDT Investments | REVISED July 2015
Broward County, Florida Room Tax Policy Analysis – Phase II
PAGE 17
a reasonable basis for calculations and discussion of a plausible formula, we estimate ”non-Tri-County”
tourism influx to total 14 percent for the Broadway event and 9 percent for the comedy event.
Table 3-9
The table below (Table 3-10) shows the average daily spending assumptions for visitors attending each
profiled event.
Representative Cultural Tourism Arts-based Initiatives/ Events in Broward
County
Estimated Day and Overnight Attendees
# of Person-
Days
% Out of
Tri-County
Region (1)
% Staying
Overnight
(2)
# of Room
Nights
Phantom of the Opera (Broadway)
1 Spectators 37,000 14% 8% 2,960
2 # of Performers and Support (3) 1,320 100% 100% 1,260
3 Total 38,320 4,220
Ron White (Stand-up Comedy)
4 Spectators 2,042 9% 4% 82
5 # of Performers and Support (4) 2 100% 100% 2
6 Total 2,044 84
Notes:
1) Reflecting visitors from outside of Broward, Miami-Dade, and Palm Beach counties.
2) Indicating visitors who stay overnight in hotels and thus generate room nights,
largely those from northern parts of Florida, outside Florida, or overseas.
3) Assuming that the production runs for 21 days.
4) Representing the comedian and an assistant.
Source: Broward Center for the Performing Arts, Johnson Consulting

6 East Monroe Street | Fifth Floor | Chicago, Illinois 60603 | Phone: 312.447.2010 | Fax: 312.444.1125
www.chjc.com | [email protected]
Section 3 – Impact of TDT Investments | REVISED July 2015
Broward County, Florida Room Tax Policy Analysis – Phase II
PAGE 18
Table 3-10
Based on the assumptions shown in Table 3-9 and Table 3-10, total direct spending by all visitors,
performers, and members of the production staff is estimated in the table below (Table 3-11).
Table 3-11
Impact Analysis for Broward County
Average Daily Spending per Visitor
Impact Analysis for Broward County
Average Daily Spending per Visitor
Phantom of
the Opera
(Broadway)
1 Lodging
2 Meals and Incidental Expenses
3 Tickets
4 Retail
5 Total
Notes:
Lines 1 and 2 - Based on GSA Per Diem rate for Broward County.
Phantom of
the Opera
(Broadway)
Ron White
(Stand-up
Comedy)
$140 $140
71 71
68 47
25 25
$304 $283
Lines 1 and 2 - Based on GSA Per Diem rate for Broward County.
Line 3 - Based on average sales per ticket.
Line 4 - Estimates.
Source: U.S. General Services Administration, Broward County,
Johnson Consulting
Source: U.S. General Services Administration, Broward County,
Representative Cultural Tourism Arts-based Initiatives/ Events in Broward County
Estimated Direct Spending
Calculations Estimated Amount
Phantom of the Opera (Broadway)
1 On Lodging $140 x 4,220 room nights = $590,800
2 Meals and Incidental Expenses $71 x 38,320 total person-days = 2,720,720
3 On Tickets $68 x 37,000 ticketed attendees = 2,500,000
4 Retail $25 x 38,320 total person-days = 958,000
5 Total $6,769,520
Ron White (Stand-up Comedy)
6 On Lodging $140 x 84 room nights = $11,720
7 Meals and Incidental Expenses $71 x 2,044 total person-days = 145,120
8 On Tickets $47 x 2,042 ticketed attendees = 96,000
9 Retail $25 x 2,044 total person-days = 51,100
10 Total $303,940
Source: Johnson Consulting

6 East Monroe Street | Fifth Floor | Chicago, Illinois 60603 | Phone: 312.447.2010 | Fax: 312.444.1125
www.chjc.com | [email protected]
Section 3 – Impact of TDT Investments | REVISED July 2015
Broward County, Florida Room Tax Policy Analysis – Phase II
PAGE 19
As shown in the table, Phantom of the Opera-related visitors are estimated to have spent $6.8 million, while
the Ron White-related visitors are estimated to have spent over $303,000.
IT IS EXPECTED WHEN ALL THE VARIOUS ARTS ARE CONSIDERED (MUSEUMS, ART GALLERIES,
FESTIVALS AND CONCERTS AND PERFORMING ARTS EVENTS) SUBSTANTIALLY MORE ROOM NIGHTS
ARE GENERATED ANNUALLY. HOWEVER, THIS MODEL PROVIDES A FAIR BASIS FOR CULTURAL EVENTS
TO BE EVALUATED, BEING MINDFUL THAT WE WERE PROVIDED DATA ON JUST THESE TWO EVENTS. AS
WITH THE PANTHERS, IT WOULD BE PRUDENT FOR THE VARIOUS ARTS GROUPS TO MAINTAIN A HIGHER
LEVEL OF CONSUMER RESEARCH SO THIS SECTOR CAN BETTER POSITION ITSELF FOR FUNDING
SUPPORT FROM THE TDC SPECIFICALLY AND THE COUNTY IN GENERAL. ECONOMIC IMPACT
Based on the calculations and assumptions described thus far, the following table (Table 3-12) summarizes
the total estimated economic impacts of the two events.
Table 3-12
The running of the Phantom of the Opera at the Au-Rene Theater is estimated to have generated $10.7
million of total spending, $2.6 million of increased earnings, and support 93 full-time equivalent jobs in the
economy for a year at an average salary of just over $28,000. Ron White’s Stand-Up Comedy Show is
estimated to have generated $48,000 of total spending, $120,000 of increased earnings, and support 4 full-
time equivalent jobs from a single show.
Representative Cultural Tourism Arts-based Initiatives/ Events in
Broward County
Estimated Economic Impact
Impact ($Millions)
Multiplier*
Phantom of the
Opera
(Broadway)
Ron White
(Stand-up
Comedy)
Direct Spending $6.77 $0.30
Indirect Spending 0.28 1.89 0.08
Induced Spending 0.30 2.02 0.09
Total Spending $10.67 $0.48
Increased Earnings 0.39 $2.61 $0.12
Employment (FTE Jobs) 13.68** 93 4
*Reflects the impact for each $1 million of direct spending.
**Meaning, each $1 million of direct spending supports 13.68 FTE jobs in
the County.
Source: Johnson Consulting

6 East Monroe Street | Fifth Floor | Chicago, Illinois 60603 | Phone: 312.447.2010 | Fax: 312.444.1125
www.chjc.com | [email protected]
Section 3 – Impact of TDT Investments | REVISED July 2015
Broward County, Florida Room Tax Policy Analysis – Phase II
PAGE 20
FISCAL IMPACT
The table below (Table 3-13) shows the estimated annual fiscal impact of the two Cultural Tourism Arts-
based events.
Table 3-13
Phantom of the Opera shows are estimated to have generated over $528,000 of total tax revenues from its
run, and almost $30,000 in TDT revenues. Ron White’s Stand-Up Comedy Show is estimated to have
generated over $23,000 of tax revenues from a single show, and about $600 in TDT revenue. These templates
are a fair tool to use to judge the economics of the myriad cultural events held in the County.
RETURN OF TDT FUNDING RECEIVED
At the time of the writing of this report, information on the exact amounts of funding from TDT revenues
that were received by each of the two representative Cultural Tourism Arts-based initiatives/ events – i.e., the
Phantom of the Opera and Ron White Stand-up Comedy show – were unavailable (i.e. it is not specifically
and separately listed out in the TDT Fund statements.)
IMPACT OF A MAJOR SIGNATURE EVENT
Impact analysis of a representative major signature event uses the same methodology utilized in the analysis
of the NHL events. The annual Tortuga Music Festival is selected as the representative major signature event
Representative Cultural Tourism Arts-based Initiatives/ Events in Broward County
Estimated Fiscal Impact
Tax Rate Taxable SpendingTax
Revenues
Phantom of the Opera (Broadway)
Sales Tax - State** 5.00% $6,769,520 of direct spending $338,476
Sales Tax - Local** 1.00% $6,769,520 of direct spending 67,695
Local-Option Tourist Development Tax (Bed Tax) 5.00% $590,800 of spending on lodging 29,540
Corporate Income Tax 5.50% $1,692,380 or 25% of direct spending* 93,081
Total $528,792
Ron White (Stand-up Comedy)
Sales Tax - State** 5.00% $303,940 of direct spending $15,197
Sales Tax - Local** 1.00% $303,940 of direct spending 3,039
Local-Option Tourist Development Tax (Bed Tax) 5.00% $11,720 of spending on lodging 586
Corporate Income Tax 5.50% $75,985 or 25% of direct spending* 4,179
Total $23,002
*Assuming that 25% of direct spending goes to taxable corporate income of vendors.
**Only the 1% local tax is returned to Broward County, while the 5% state tax is used by the state as general revenue.
Source: Johnson Consulting

6 East Monroe Street | Fifth Floor | Chicago, Illinois 60603 | Phone: 312.447.2010 | Fax: 312.444.1125
www.chjc.com | [email protected]
Section 3 – Impact of TDT Investments | REVISED July 2015
Broward County, Florida Room Tax Policy Analysis – Phase II
PAGE 21
to be analyzed. The event is a two-day, multi-stage music festival on Fort Lauderdale Beach Park The event
most recently was held on April 11-12th of 2015,with 26 bands performing on three stages, generating a total
of 75,000 attendees. The festival aims to raise awareness for marine conservation, working with Rock The
Ocean Foundation to increase public awareness about the issues impacting the world’s oceans and to support
scientific research, education, and ocean conservation initiatives. The table below (Table 3-14) summarizes
selected event statistics of the festival.
Table 3-14
The following table (Table 3-15) translates those event statistics into the number of person-days and room
nights that are generated by the show patrons, the music performers and their production staff . Assumptions
on the origin of patrons and percentage of overnighters are derived from those of the representative Cultural
Tourism Arts-based events, however they could be slightly better in terms of out of county and overnight
visitation. Management of the Tortuga Festival did not share this data with us.
Representative Major Signature Event in
Broward County
Selected Event Statistics
Tortuga
Music
Festival
Location Fort
Lauderdale
Beach Park
Dates (of Most Recent Event) Apr 11-12, '15
# of Performances 26*
# of Tickets Sold (# of Spectators) 75,000
# of Performers and Crew 650**
Ticket Sales $6,675,000***
Notes:
*There were 26 bands performing during the two-day event.
**Assuming that an average performance band consists of
25 persons, including support staff.
***Based on a typical single-day ticket price of $89.
Source: Broward County, Johnson Consulting

6 East Monroe Street | Fifth Floor | Chicago, Illinois 60603 | Phone: 312.447.2010 | Fax: 312.444.1125
www.chjc.com | [email protected]
Section 3 – Impact of TDT Investments | REVISED July 2015
Broward County, Florida Room Tax Policy Analysis – Phase II
PAGE 22
Table 3-15
Table 3-16 shows the average daily spending assumptions for visitors to the Tortuga Festival.
Table 3-16
Based on the assumptions shown in Table 3-15 and Table 3-16, total direct spending by all visitors,
performers, and production crew is estimated in the table below (Table 3-17).
Representative Major Signature Event in Broward County
Estimated Day and Overnight Attendees
# of Person-
Days
% Out of
Tri-County
Region (1)
% Staying
Overnight
(2)
# of Room
Nights
Tortuga Music Festival
1 Spectators 75,000 12% 6% 4,500
2 Performers and Crew (3) 2,600 100% 100% 1,950
3 Total 77,600 6,450
Notes:
1) Reflecting visitors from outside of Broward, Miami-Dade, and Palm Beach counties.
2) Indicating visitors who stay overnight in hotels and thus generate room nights,
largely those from northern parts of Florida, outside Florida, or overseas.
3) Assuming that each of the performers and production crew stays for 4 days, 3 nights for the Festival.
Source: Broward County, Johnson Consulting
Impact Analysis for Broward County
Average Daily Spending per Visitor
Impact Analysis for Broward County
Average Daily Spending per Visitor
Tortuga
Music
Festival
1 Lodging
2 Meals and Incidental Expenses
3 Tickets
4 Retail
5 Total
Notes:
Lines 1 and 2 - Based on GSA Per Diem rate for Broward County.
Tortuga
Music
Festival
$140
71
89
25
$325
Lines 1 and 2 - Based on GSA Per Diem rate for Broward County.
Line 3 - Based on single-day ticket price.
Line 4 - Estimates.
Source: U.S. General Services Administration, Broward County,
Johnson Consulting
Source: U.S. General Services Administration, Broward County,

6 East Monroe Street | Fifth Floor | Chicago, Illinois 60603 | Phone: 312.447.2010 | Fax: 312.444.1125
www.chjc.com | [email protected]
Section 3 – Impact of TDT Investments | REVISED July 2015
Broward County, Florida Room Tax Policy Analysis – Phase II
PAGE 23
Table 3-17
All Tortuga Festival-related visitors are estimated to have spent $15 million during their visits.
ECONOMIC IMPACT
Based on the calculations and assumptions described thus far, the table below (Table 3-18) summarizes the
total estimated economic impacts of Tortuga Festival.
Table 3-18
Tortuga Music Festival is estimated to have generated $23.7 million of total spending, $5.8 million of
increased earnings, and supports 206 full-time equivalent jobs during its two-day event.
Representative Cultural Tourism Arts-based Initiatives/ Events in Broward County
Estimated Direct Spending
Calculations Estimated Amount
Tortuga Music Festival
1 On Lodging $140 x 6,450 room nights = $903,000
2 Meals and Incidental Expenses $71 x 77,600 total person-days = 5,509,600
3 On Tickets $89 x 75,000 ticketed attendees = 6,675,000
4 Retail $25 x 77,600 total person-days = 1,940,000
5 Total $15,027,600
Source: Johnson Consulting
Representative Major Signature Event in Broward
County: Tortuga Music Festival
Estimated Economic Impact
Multiplier*Impact
($Millions)
Direct Spending $15.03
Indirect Spending 0.28 4.19
Induced Spending 0.30 4.48
Total Spending $23.70
Increased Earnings 0.39 $5.80
Employment (FTE Jobs) 13.68** 206
*Reflects the impact for each $1 million of direct spending.
**Meaning, each $1 million of direct spending supports 13.68 FTE jobs in
the County.
Source: Johnson Consulting

6 East Monroe Street | Fifth Floor | Chicago, Illinois 60603 | Phone: 312.447.2010 | Fax: 312.444.1125
www.chjc.com | [email protected]
Section 3 – Impact of TDT Investments | REVISED July 2015
Broward County, Florida Room Tax Policy Analysis – Phase II
PAGE 24
FISCAL IMPACT
The table below (Table 3-19) displays the estimated annual fiscal impact of the Tortuga Festival.
Table 3-19
Tortuga Music Festival is estimated to have generated approximately $1.2 million of tax revenues and just
over $45,000 in TDT funding.
RETURN OF TDT FUNDING RECEIVED
At the time of the writing of this report, information on the amount of funding from TDT revenues that was
received by Tortuga Music Festival was not available (i.e. it is not specifically and separately listed out in the
TDT Fund statements.
IMPACT OF CONVENTION CENTER EXPANSION
An impact analysis of Convention Center expansion was completed by HVS Convention, Sports and
Entertainment Facilities Consulting in March 2014, based on the recommended expansion including 70,000
square feet of additional multi-purpose space, 20,000 square feet of additional ballroom space, and 27,000
square feet of additional meeting space. The HVS’ analysis is not repeated in this study, however its findings
are summarized below. The table below (Table 3-20) shows the incremental number of events and total
attendance due to expansion.
Representative Major Signature Event in Broward County
Estimated Fiscal Impact
Tax Rate Taxable SpendingTax
Revenues
Tortuga Music Festival
Sales Tax - State** 5.00% $15,027,600 of direct spending $751,380
Sales Tax - Local** 1.00% $15,027,600 of direct spending 150,276
Local-Option Tourist Development Tax (Bed Tax) 5.00% $903,000 of spending on lodging 45,150
Corporate Income Tax 5.50% $3,756,900 or 25% of direct spending* 206,630
Total $1,153,436
*Assuming that 25% of direct spending goes to taxable corporate income of vendors.
**Only the 1% local tax is returned to Broward County, while the 5% state tax is used by the state as general revenue.
Source: Johnson Consulting

6 East Monroe Street | Fifth Floor | Chicago, Illinois 60603 | Phone: 312.447.2010 | Fax: 312.444.1125
www.chjc.com | [email protected]
Section 3 – Impact of TDT Investments | REVISED July 2015
Broward County, Florida Room Tax Policy Analysis – Phase II
PAGE 25
Table 3-20
The expansion is expected to generate 73 additional events and 72,450 additional attendees.
ECONOMIC IMPACT
The following table (Table 3-21) summarizes the total estimated economic impacts of the Convention Center
expansion.
Broward County Convention Center
Incremental Events and Attendance due to Expansion
No Expansion Expansion Incremental
# of Events
Conventions/ Trade Shows 26 43 17
Consumer Shows 13 18 5
Meetings and Conferences 64 85 21
Banquets 31 35 4
Sports 9 9 0
Other 26 26 26
Total 169 216 73
# of Attendees
Conventions/ Trade Shows 35,200 69,300 34,100
Consumer Shows 58,370 81,000 22,630
Meetings and Conferences 19,840 31,150 11,310
Banquets 15,190 19,600 4,410
Sports 19,800 19,800 0
Other 26,000 26,000 0
Total 174,400 246,850 72,450
Source: HVS' Impact Analysis of the Broward County CC (March 2014)

6 East Monroe Street | Fifth Floor | Chicago, Illinois 60603 | Phone: 312.447.2010 | Fax: 312.444.1125
www.chjc.com | [email protected]
Section 3 – Impact of TDT Investments | REVISED July 2015
Broward County, Florida Room Tax Policy Analysis – Phase II
PAGE 26
Table 3-21
The table displays that the Convention Center expansion is projected to generate an estimated $83.1 million
of total spending, $20.34 million of increased earnings, and support 721 full-time equivalent jobs, annually.
FISCAL IMPACT
The following table (Table 3-22) shows the estimated annual fiscal impact of the Convention Center
expansion.
Table 3-22
The table shows that the recommended Convention Center expansion is projected to generate approximately
$5 million of tax revenues annually, and $1.2 million in incremental TDT tax annually.
Broward County Convention Center Expansion
Estimated Annual Econonmic Impact
Multiplier*Impact
($Millions)
Direct Spending $52.70
Indirect Spending 0.28 14.70
Induced Spending 0.30 15.70
Total Spending $83.10
Increased Earnings 0.39 $20.34
Employment (FTE Jobs) 13.68 721
*Reflects the impact for each $1 million of direct spending.
Source: HVS' Impact Analysis of the Broward County CC (March 2014)
Broward County Convention Center Expansion
Estimated Annual Fiscal Impact
Tax Rate Taxable SpendingTax
Revenues
Sales Tax - State** 5.00% $52,700,000 of direct spending $2,635,000
Sales Tax - Local** 1.00% $52,700,000 of direct spending 527,000
Local-Option Tourist Development Tax (Bed Tax) 5.00% $23,215,720 of spending on lodging 1,160,786
Corporate Income Tax 5.50% $13,175,000 or 25% of direct spending* 724,625
Total $5,047,411
*Assuming that 25% of direct spending goes to taxable corporate income of vendors.
**Only the 1% local tax is returned to Broward County, while the 5% state tax is used by the state as general revenue.
Source: HVS' Impact Analysis of the Broward County CC (March 2014), Johnson Consulting
6 East Monroe Street | Fifth Floor | Chicago, Illinois 60603 | Phone: 312.447.2010 | Fax: 312.444.1125
www.chjc.com | [email protected]
Section 3 – Impact of TDT Investments | REVISED July 2015
Broward County, Florida Room Tax Policy Analysis – Phase II
PAGE 27
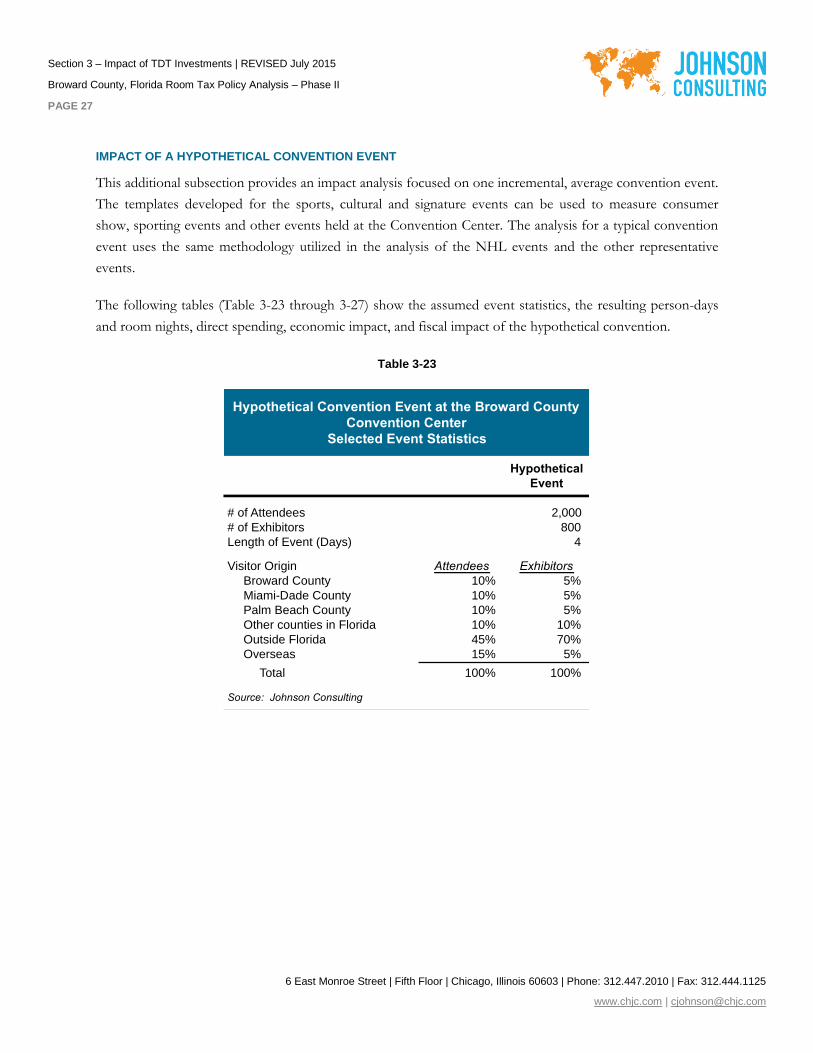
IMPACT OF A HYPOTHETICAL CONVENTION EVENT
This additional subsection provides an impact analysis focused on one incremental, average convention event.
The templates developed for the sports, cultural and signature events can be used to measure consumer
show, sporting events and other events held at the Convention Center. The analysis for a typical convention
event uses the same methodology utilized in the analysis of the NHL events and the other representative
events.
The following tables (Table 3-23 through 3-27) show the assumed event statistics, the resulting person-days
and room nights, direct spending, economic impact, and fiscal impact of the hypothetical convention.
Table 3-23
Hypothetical Convention Event at the Broward County
Convention Center
Selected Event Statistics
Hypothetical
Event
# of Attendees 2,000
# of Exhibitors 800
Length of Event (Days) 4
Visitor Origin Attendees Exhibitors
Broward County 10% 5%
Miami-Dade County 10% 5%
Palm Beach County 10% 5%
Other counties in Florida 10% 10%
Outside Florida 45% 70%
Overseas 15% 5%
Total 100% 100%
Source: Johnson Consulting

6 East Monroe Street | Fifth Floor | Chicago, Illinois 60603 | Phone: 312.447.2010 | Fax: 312.444.1125
www.chjc.com | [email protected]
Section 3 – Impact of TDT Investments | REVISED July 2015
Broward County, Florida Room Tax Policy Analysis – Phase II
PAGE 28
Table 3-24
Table 3-25
Hypothetical Convention Event at the Broward County Convention Center
Estimated Day and Overnight Attendees
# of Person-
Days
% Out of
Tri-County
Region (1)
% Staying
Overnight
(2)
# of Room
Nights
1 Attendees (3) 6,000 70% 60% 3,600
2 Exhibitors (4) 4,000 85% 75% 3,000
3 Total 10,000 6,600
Notes:
1) Reflecting visitors from outside of Broward, Miami-Dade, and Palm Beach counties.
2) Indicating visitors who stay overnight in hotels and thus generate room nights,
largely those from northern parts of Florida, outside Florida, or overseas.
3) Assuming that on average, an attendee stays for 3 days during the 4-day event.
4) Assuming that on average, an exhibitor stays for 5 days during the 4-day event.
Source: Johnson Consulting
Hypothetical Convention Event at the Broward County Convention Center
Estimated Direct Spending
Calculations Estimated Amount
1 On Lodging $140 x 6,600 room nights = $924,000
2 Meals and Incidental Expenses $71 x 10,000 total person-days = 710,000
3 On Tickets $89 x 6,000 attendee-days = 534,000
4 Retail $25 x 10,000 total person-days = 250,000
5 Total $2,418,000
Source: Johnson Consulting

6 East Monroe Street | Fifth Floor | Chicago, Illinois 60603 | Phone: 312.447.2010 | Fax: 312.444.1125
www.chjc.com | [email protected]
Section 3 – Impact of TDT Investments | REVISED July 2015
Broward County, Florida Room Tax Policy Analysis – Phase II
PAGE 29
Table 3-26
Table 3-27
The tables demonstrate that a hypothetical four-day convention has the potential to generate 2,000 attendees
and 800 exhibitors, the majority of whom are from outside tri-county region and is expected to result in $2.4
million in direct spending, $3.8 million of total spending, $930,000 of increased earnings, and support 33 full-
time equivalent jobs. Additionally, it is expected to result in $224,500 of tax revenue and $46,200 in TDT
funding.
Hypothetical Convention Event at the Broward County
Convention Center
Estimated Economic Impact
Multiplier*Impact
($Millions)
Direct Spending $2.42
Indirect Spending 0.28 0.67
Induced Spending 0.30 0.72
Total Spending $3.81
Increased Earnings 0.39 $0.93
Employment (FTE Jobs) 13.68** 33
*Reflects the impact for each $1 million of direct spending.
**Meaning, each $1 million of direct spending supports 13.68 FTE jobs in
the County.
Source: Johnson Consulting
Hypothetical Convention Event at the Broward County Convention Center
Estimated Fiscal Impact
Tax Rate Taxable SpendingTax
Revenues
Sales Tax - State** 5.00% $2,418,000 of direct spending $120,900
Sales Tax - Local** 1.00% $2,418,000 of direct spending 24,180
Local-Option Tourist Development Tax (Bed Tax) 5.00% $924,000 of spending on lodging 46,200
Corporate Income Tax 5.50% $604,500 or 25% of direct spending* 33,248
Total $224,528
*Assuming that 25% of direct spending goes to taxable corporate income of vendors.
**Only the 1% local tax is returned to Broward County, while the 5% state tax is used by the state as general revenue.
Source: Johnson Consulting

6 East Monroe Street | Fifth Floor | Chicago, Illinois 60603 | Phone: 312.447.2010 | Fax: 312.444.1125
www.chjc.com | [email protected]
Section 3 – Impact of TDT Investments | REVISED July 2015
Broward County, Florida Room Tax Policy Analysis – Phase II
PAGE 30
APPROACH FOR USING THE IMPACT ANALYSIS MODEL
As demonstrated by the selection of representative events, they can range from a single-day stand-up comedy
show, to a multi-day, multi-stage music performance, to a full season of professional sports events, and et
cetera – each type with its own specifics, attributes, and characteristics – that a single model that
comprehensively addresses all the specifics, attributes, and characteristics of any event is almost non-existing.
Great caution should be used not to present inflated or untested information, as the credibility of the impact
estimates would be jeopardized. These concepts are employed in each of the analyses of four representative
events described earlier, which can provide a guideline for Broward County and serve as a measuring tool as
the County considers various types of TDT investments.
The quality of information and integrity in developing an economic and fiscal impact analysis of a project is
critical if the analysis is to be credible. However, the types and character of events can vary so widely. Hence,
it is strongly recommended that a single research group- TDC staff or CVB staff or County staff, obtain
accurate and fair event data from event management staff. This research group then considers the nature of
the event and applies the right template, or a modified template as better data arises, to help judge the TDT
returned by each event type. This impartial analysis, prepared by a TDC or County staff, protects the integrity
of the analytical process. Subjective variables should then be considered by the TDC as well.
VISITATION VOLUME
Conceptually, visitation volume is the basis of the economic and fiscal impact analysis. The table below
(Table 3-28) displays the inputs required for a subject event to calculate the visitation volume.

6 East Monroe Street | Fifth Floor | Chicago, Illinois 60603 | Phone: 312.447.2010 | Fax: 312.444.1125
www.chjc.com | [email protected]
Section 3 – Impact of TDT Investments | REVISED July 2015
Broward County, Florida Room Tax Policy Analysis – Phase II
PAGE 31
Table 3-28
The inputs feed into the estimates of the number of person-days and the number of room nights, which are
the basis of an economic and fiscal impact analysis.
CONCLUSION
This section of the report provides the basis for key recommendations.
Of the three ways to support the TDC in its efforts- County directed, CVB staffed, or independent
research staff, Broward County’s approach is among the weakest. The CVB directly reports to the
County and the County staff vet spending options of TDC funds. This does not provide for a myriad
of voices to be heard and is not analytically based. The interest groups in the County with larger
budgets and more political sway have more capability to argue for funds, occluding an impartial view
of return on investment for TDT funds. The County and CVB staff do assess and analyze things,
and must address contractual obligations dictated by bond issues. But the TDC is not supported by
research, and the County and CVB have direct pipelines to the County Commission. A more
functional TDC, with an independent staff/ analytics arm could be constantly seeking and reviewing
proposals, and helping guide TDT investments, making the TDC a much more effective and
transparent advisor to the County. This seems to have been the intent of the State Statute that
created the TDC in the first place, to have representation from stakeholders that advise the County.
Impact Model for Broward County TDT Investment
Required Input
Name of Event Event A
Length of Events (# of Days) 0
Visitation
# of Attendees or Spectators 0
# of Event Performers, Participants, Support Crew 0
Total 0
Estimated Place of Origin
Attendees or
Spectators
Event
Performers or
Participants
Broward County 0% 0%
Miami-Dade County 0% 0%
Palm Beach County 0% 0%
Other counties in Florida 0% 0%
Outside Florida 0% 0%
Overseas 0% 0%
Total (100%) 0% 0%
Est. % Staying Overnight 0% 0%
Additional Specific Spending $0
TDT Funding Requested $0

6 East Monroe Street | Fifth Floor | Chicago, Illinois 60603 | Phone: 312.447.2010 | Fax: 312.444.1125
www.chjc.com | [email protected]
Section 3 – Impact of TDT Investments | REVISED July 2015
Broward County, Florida Room Tax Policy Analysis – Phase II
PAGE 32
Like in Monroe County, an ordinance should be passed that creates such a policy in Broward
County.
This section of the report also lays out tools to assess the value of TDT investment for major
categories of events. These templates can be used in the application process for funds. They can also
be refined to allow other investments, like a sports complex, a signature event or arena
improvements. Once this objective information, prepared by a central impartial entity, is prepared,
intangible factors, such as shifting spending from adjacent counties to Broward County,
redevelopment efforts around cultural and recreational assets and community fabric, all more
subjective and less objective can be weighed. Further, the County and TDC must have boundaries
and limits on how funds are used. The arena, the convention center beach renovation, and the CVB
are the big users of funds today. It is our belief that supplemental funds could and should be used for
some of these investments. This analytical arm could also provide research into supplemental
funding.
Top Related