


Languages
Pages
Legal


Bride Price and Female Education∗
Nava Ashraf† Natalie Bau‡ Nathan Nunn§ Alessandra Voena¶
October 17, 2015
DRAFT
Abstract
Traditional cultural practices can play an important role in development, but can also inspirecondemnation. The custom of bride price, prevalent throughout sub-Saharan Africa and inparts of Asia as a payment of the groom to the family of the bride, is one example. In thispaper, we show a surprising economic consequence of this practice. We revisit one of the best-studied historical development projects, the INPRES school construction program in Indonesia,and show that previously found small effects on female enrollment mask heterogeneity by brideprice tradition. Ethnic groups that traditionally engage in bride price payments at marriageincreased female enrollment in response to the program. Within these ethnic groups, higherfemale education at marriage is associated with a higher bride price payment received, providinga greater incentive for parents to invest in girls’ education and take advantage of the increasedsupply of schools. For those girls belonging to ethnic groups that do not practice bride price,we see no increase in education following school construction. We replicate these same findingsin Zambia, where we exploit a similar school expansion program that took place in the early2000s. While there may be significant downsides to a bride price tradition, our results suggestthat any change to this cultural custom should likely be considered alongside additional policiesto promote female education.
∗We thank Stephane Bonhomme, Raquel Fernandez, Ingvil Gaarder, Simone Lenzu, Corinne Low, Neale Mahoney,Bryce Millett Steinberg, Magne Mogstad, Claudia Olivetti, Al Roth, Glen Weyl and participants to the Chicago-areafamily economics workshop and presentations at Columbia GSB, Sciences-Po, DePaul, UIC, Barcelona GSE SummerForum, NBER Summer Institute, NYU and BC for helpful comments. Eva Ng, Parina Lalchandani and PoulodBorojerdi provided excellent research assistance.†Harvard University, NBER, and BREAD. (email: [email protected])‡University of Toronto. (email: [email protected])§Harvard University, NBER, and BREAD. (email: [email protected])¶University of Chicago and NBER. (email: [email protected])
1

1 Introduction
It has become increasingly recognized that culture plays an important role in economic devel-opment. However, we have a much less clear understanding of what traditional cultural practicesimply for development policy and whether the efficacy of development policies depends on the cul-tural traits of societies. Development policies generally have not been tailored to the particularcultural characteristics of a society. Increasingly, there has been recognition that this one-size-fits-all strategy may not always work (World Bank, 2015).
Our analysis looks at a particular cultural practice typically referred to as bride price (or alsoas bride wealth). A bride price is a transfer at the time of marriage from the groom and/or hisfamily to the bride’s family. The payment is typically significant in size, often greater than a year’sincome, and takes the form of money, animals, or commodities. This cultural practice was (andis) widely practiced in many parts of the world, including Asia and sub-Saharan Africa (Anderson,2007a). Recently, the custom has come under attack, receiving condemnation as a repugnant andharmful practice, and leading to calls for its abolishment (see e.g., Wendo, 2004; Mujuzi, 2010).
In this paper, we examine how the cultural practice of making bride price payments at marriageimpacts the efficacy of policies aimed at increasing education. We document that for two countrieswith large school construction programs – Indonesia in the 1970s and Zambia in the 2000s – thecultural practice of bride price was a crucial determinant of whether the increased availability ofschools resulted in increased enrollment rates for women. In areas where the practice existed,school construction had a large and statistically significant impact on educational attainment forgirls. However, in areas where the practice was absent, school construction did not have a detectableimpact on female education.
We begin our analysis by revisiting one of the best studied historical development projects, theSekolah Dasar INPRES school building program of the 1970s in Indonesia, where 61,807 primaryschools were constructed between 1974 and 1980. The seminal paper looking at the impacts of thisproject only examines a sample of males, which is in line with its objective of estimating the effectof education on wages (Duflo, 2001). In contrast, we examine the impacts of the program on girls’schooling. We first confirm that there appears to be no effect on female education, consistent withthe small effects found in Breierova and Duflo (2002). We then show that this average effect masksimportant heterogeneity that depends on a group’s marriage customs. We only observe a positiveimpact of the program on female education among girls from ethnic groups that traditionally engagein monetary bride price payments at the time of marriage. Our empirical analysis shows that thesefindings are not driven by other important cultural factors that may be correlated with bride price,such as women’s role in agricultural production and matrilineality.
We verify the findings by studying another school expansion program that took place in Zambiain the late 1990s and early 2000s, exploiting newly-collected data from the Zambian Ministry ofEducation. Zambia, like Indonesia, has societies that engage in bride price payments and others thatdo not. Although the school construction experiment in Zambia is not as clean from an empiricalpoint of view, a benefit of working in Zambia is that we have collected detailed, fine-grained datathat help us to better understand the mechanisms underlying our basic finding. We discuss this inmore detail below. Looking at the school building policy in Zambia, we observe the same patternsin the data. The school expansion had a substantially larger impact on female education amongethnic groups that engage in bride price payments at marriage.
Having documented this pattern in two countries, we then turn towards the goal of betterunderstanding the exact reasons behind this finding. Motivated by first-hand accounts of education
2

being an important determinant – actually, the most important determinant – of the bride pricereceived at marriage, we put forth and test the following explanation. Groups that engaged inbride price payments at marriage were more likely to take advantage of the increased supply ofschools by sending their girls to school because the returns to doing so were higher. Where brideprice was practiced, increased investments in education by parents led to an increase in the amountof bride price received by parents at the time of marriage. For societies that do not pay a brideprice at marriage, or societies that pay a symbolic (or “token”) bride price, this additional returnto parents’ investments in their daughters’ education did not exist.1
A second, and closely related, reason why the bride price would influence parental investmentsin daughters is through its ability to function, like other prices in the economy, as an aggregatorand transmitter of information that guides economic decisions – in this case, investments in humancapital (Hayek, 1945).2 If parents are uncertain about the returns to education for women, theexistence of a bride price, which provides information on the elasticity of bride price with respectto education may serve as valuable information about the returns to education. This is particularlylikely in rural areas, where traditional marriage payments are common, but information abouturban or formal-sector wages is difficult to observe.
Ultimately, both mechanisms serve to increase parents’ incentives to invest in their daughter’seducation and to take advantage of the increased opportunities for schooling brought on by theschool expansion policies considered here. We formalize this logic by developing a model thatoutlines the incomplete contracting mechanism, and the assumptions needed to explain our results.In the model, the presence of the bride price provides an additional rewards to parental investmentin a daughter’s education. For this reason, girls from ethnic groups that engage in bride pricepayments are more likely to be educated. We then show that as long as enrollment rates aresufficiently low and the returns to education are single-peaked, then ethnic groups that practicebride price will have have higher responsiveness to a school construction program that reducesthe cost of education. Interestingly, a number of additional hypotheses arise from the model. Inparticular, ethnic groups that practice bride price should have higher levels of average educationoverall. Despite higher ex ante levels of education, we still expect to see greater responsivenessof this group to the policy compared to ethnicities that do not practice bride price. In addition,because there is more education of women belonging to bride price groups, the average inherentability of bride price students will be lower than for non-bride price groups.
Guided by the structure of the model, we then turn to auxiliary analyses to verify the assump-
1This mechanism is particularly important if daughters cannot credibly commit to paying back their parents expost for educational investments made ex ante. The bride price provides a shorter-term and more certain monetarybenefit to educating daughters, which helps overcome the challenge of incomplete contracting (Gale and Scholz, 1994).The problem is summarized by Gary Becker’s words in his Nobel lecture: “Both the children and parents would bebetter off if the parents agreed to invest more in the children in return for a commitment by the children to carefor them when they need help. But how can such a commitment be enforced? Economists and lawyers usuallyrecommend a written contract to ensure commitment, but it is absurd to contemplate that a society will enforcecontracts between adults and ten-year-olds or teenagers” (Becker, 1993).
2As is well-known, for price to function as an aggregator, it requires very little information to be known by eachindividual: “The most significant fact about this system is the economy of knowledge with which it operates, or howlittle the individual participants need to know in order to be able to take the right action. In abbreviated form,by a kind of symbol, only the most essential information is passed on and passed on only to those concerned. Itis more than a metaphor to describe the price system as a kind of machinery for registering change, or a systemof telecommunications which enables individual producers to watch merely the movement of a few pointers, as anengineer might watch the hands of a few dials, in order to adjust their activities to changes of which they may neverknow more than is reflected in the price movement.” (Hayek, 1945, p. 526).
3

tions that are necessary in the model and to test the predictions that arise from the model. Firstof all, we show that, in Indonesia and Zambia, bride price is widely practiced and that the valueof the bride price is quantitatively important. We then show that the value of the bride priceincreases significantly with the level of education of the bride. In Indonesia, completing primaryschool is associated with a 66% increase in the bride price payment, completing junior secondaryis associated with a further 64% increase, and completing college with another 84% increase. Thisrelationships are very robust and remain strong even when conditioning on a large set of observ-able characteristics, including the groom’s education. In Zambia, we find comparable magnitudes.Using a survey implemented in that country, we ask individuals why they believe that bride priceincreases with a woman’s education. Responses provide no evidence that the association betweenbride price and education is spurious. Instead, the most common explanation was that the higherbride price was due to a moral obligation on the part of the groom’s family to compensate thebride’s family for the educational investments that they made in their daughter.3
We then test two additional predictions that emerge from the model, namely that the averagelevel of education of women belonging to bride price cultures should be higher than for women thatbelong to culture that do not have bride price, and that the average ability of enrolled studentsfrom bride price cultures should be lower than the average ability of enrolled students from culturesthat do not have bride price. We find that the first prediction holds in both Indonesia and Zambia.Looking at the cross-section, primary school completion rates are higher among bride price ethnicgroups than non-bride price groups. We test the second prediction within Indonesia by examiningstudent test scores. We find that, consistent with the model, the average test score among studentsbelonging to bride price ethnicities is lower than among students belonging to ethnic groups thatdo not have bride price.
Lastly, we also test a number of plausible alternative mechanisms that could also explain thedifferential response of cultures with different marriage customs to the school construction pro-grams. In particular, we test whether there is evidence that families with a tradition of bride priceare wealthier and therefore, have a greater ability to send their daughters to school in response tothe government programs. We also test whether women from bride price ethnicities have higherreturns to education, which could in turn generate the higher responsiveness to the programs. Wefind no evidence for either of these mechanisms. Bride price ethnic groups are not wealthier, andthey do not appear to have higher returns to female education in the labor market.
Our findings build on and advances the literature that examines the impacts of gender-relatedcultural norms (e.g. Fernandez, 2007; Fernandez and Fogli, 2009; Fernandez, 2011). We show thatimportant large-scale development policies can have very different effects on groups depending onthe cultural institution of bride price.
Our findings also contribute to a better understanding of the economics of marriage payments.While dowries have received a considerable amount of attention in the economics literature (Bot-ticini, 1999; Botticini and Siow, 2003; Anderson, 2003, 2007b), bride price payments have beenthe subject of fewer studies, despite the fact that the practice is relatively widespread (Anderson,2007a). By exploring the link between bride price and parental investment in daughters in bothIndonesia and Zambia, this paper also adds to the literature on the relationship between marriagepractices (in particular, virilocality and polygny) and investments in daughters in South-East Asia(Levine and Kevane, 2003) and in Sub-Saharan Africa (Jacoby, 1995; Tertilt, 2005, 2006; Gaspartand Platteau, 2010).
3See Dalton (1966); Moore (2016).
4

While there may be significant downsides to the cultural practice of bride price, particularlyif it justifies abuse or lowers the status of women within marriage (Bishai and Grossbard, 2010),our results on the benefits of bride price payments suggest that abolishing or discouraging thesepayments should likely be considered alongside additional policies to promote female education.
The paper is structured as follows. We begin in section 2 by providing context and an overviewof the custom of bride price, focusing particularly on the specifics of Indonesia and Zambia. Insection 3, we then turn to Indonesia’s school construction program. We show that although atfirst-glance the program appears to have had little effect on female education, this masks significantheterogeneity. For women from bride price cultures, school construction is estimated to have hada large positive impact on education, while for women from cultures that do not practice brideprice, there is no evidence of any increase in education. We then turn to Zambia and in section 4,document that one observes the same pattern there. In an attempt to propose a clear mechanismbehind this result, in section 5 we present a simple model that shows how the presence of a brideprice (that is increasing in the bride’s education) affects parent’s investments in their daughter’seducation and their response to an increase in the supply of schools. The model is particularlyuseful in highlighting the assumptions that are necessary to obtain the comparative static that wesee in the data, as well as deriving additional predictions that are not ex ante obvious. Therefore,in section 6, we use data from a variety of sources to verify the assumptions of the model and totest its auxiliary predictions. Lastly, in section 7, we provide concluding thoughts.
2 Context and Overview of Bride Price
The practice of paying a bride price at the time of marriage is a custom that is widespreadthroughout sub-Saharan Africa and many parts of Asia. Vroklage (1952) writes in detail on thepractice of bride price in Indonesia, describing it as “a compensation for the expense, the care andtrouble spent on the bride’s upbringing... It is compensation for the complete loss of a worker asa bride withdraws from her own kindred and henceforth belongs to her husband’s.” He adds thatthe bride price is also a compensation payment for the bride’s future children, who will no longerbelong to her parents’ family.4 The bride price in Indonesia is paid to the bride’s parents and islinked to adat (traditional culture which predates conversion to Islam) rather than religion. Thus,while in Indonesia both bride price and Islam are common, Indonesian bride price customs do notstem from Islamic bride price customs. In fact, in the nineteenth century, the Ulama (Islamicreligious scholars) worked with the British colonial government to try reduce the value of brideprice (Boomgaard, 2003, p. 201).
As in much of sub-Saharan Africa, in Zambia bride price is referred to as lobola, and is widelypracticed among some ethnic groups. In data collected during the Zambia Fertility Preferences
4In his qualitative research, the idea that bride price is equivalent to purchasing a woman is roundly rejected.Interviewees told him, “a bride is not a buffalo” and “a bride is not an animal.” Thus, he suggests that what hecalls “patriarchy” (likely referring to patrilineality, the practice of the bride and her children joining the husband’skinship group) is naturally associated with bride price. While he does mention that there are groups that practicewhat he calls “matriarchy,” he observes that the bride price customs likely originated in “patriarchal” societies andwere then imitated by “matriarchal” societies. In using the term “matriarchy,” Vroklage is likely referring to either(or both) matrilineality and matrilocality. These two practices often go hand-in-hand. Matrilineality means that thechildren join the kinship group of the bride, while matrilocality means that the bride and her husband live with herparents after marriage. Matrilocality may also incentivize parents to invest in daughters by increasing the proportionof the returns on their investments they expect to capture. Consistent with this hypothesis, Bau (2014) finds thatmatrilocality is associated with greater educational investment in daughters relative to sons.
5
Survey (ZFPS) in peri-urban Lusaka (we discuss this source in more detail below), bride price waspaid in 86 percent of marriages. In Zambia, bride price also functions as a legal proof of marriage,and some churches do not consider a couple married until bride price is paid in full. Therefore,bride price is also important for inheritance and determining the lineage of any children of themarriage since, if a husband dies, it allows a wife to prove in court that they were officially married.Chondoka (1988) writes that traditionally, “marriages were all legalized on delivery of the ‘main’payments” (p. 158).
Traditionally, many groups, e.g., the Tonga people, negotiated bride price in terms of cows andcontinue to negotiate in terms of cows to this day. Since cows have grown greatly in value, it isbelieved that this explains why Tonga bride prices are relatively high today. In his book TraditionalMarriages in Zambia: A Cultural History, Chondoka (1988) writes that in areas where cattle weretraditionally kept, marriage payments were negotiated in cattle, while in other areas they werenegotiated in terms of small valuable items such as iron tools, beads, grain, bark, cloth, animalskins, and money.
A lively public debate has ensued over the past decades, particularly in Africa, on the negativeconsequences of the bride price custom. The objections arise due to the perceived commodificationof women through a transaction, potentially leading to ill-treatment.5 Parents may have an incen-tive to “sell” their daughters early for bride price, and women may feel that they cannot leave amarriage because it would mean their parents would have to return the bride price. In Indonesia,where discussion of the negative consequences of bride price is less prevalent than in parts of Africa,concerns have been raised about women continually needing to “earn” their bride price throughobedience to their husbands (Sitompul, 2009).
This issue appears in much starker terms within policy debates on Africa: women’s rights groupMifumi in Uganda reports cases where men say “I am beating my cows” when they hit their wives, orwomen are denied ownership of property, and it is noted that women may be expected to be sexuallyavailable to their husbands at any time and without protection (Eryenyu, 2014). One housewifein Tanzania described what often happens when bride price is paid, saying, “Unfortunately, thisis overdone by some people who end up regarding a woman as mere property” (News, ed, 2006).Citing such stories, many activists have called for the abolishment of bride price. This abolition isperceived to be critical to promoting greater educational investment in young girls, whose parentsmay otherwise be tempted to marry their daughters off early (Mutebi, 2014).
Instead of banning bride price, some governments have attempted to legislate particular aspectsof the practice, such as banning refunds upon divorce or putting limits on the amount that can bepaid for bride price. For example, Kenya’s most recent set of marriage laws stipulates that a tokenbride price must be counted as sufficient to meet the needs of the custom (Dudley, 2014).6 TheZambian government has similarly spoken out to discourage families from requesting exorbitantamounts for their daughters, but this is not written into law and neither country defines what may
5The custom fits several core reasons why monetizing transactions involving human beings is seen as repugnant.Roth (2007) categorizes concerns about monetization into three classes: (1) concerns that putting a price on thingsmoves them into a category of impersonal objects; (2) concerns that offering substantial monetary payments mightcause individuals to engage in transactions they would not engage in otherwise, leaving them open to exploitation; and(3) concerns that monetizing certain transactions, while not themselves morally repugnant, could lead to a slipperyslope of more repugnant transactions. The first two categories are particularly well-represented in the debate on brideprices (Hague et al., 2011; Mangena and Ndlovu, 2013).
6To combat the potential of early marriage due to bride price, the local government in Laikipia County, Kenyahas also instituted a program to give cows to parents whose daughters graduate from high school.
6

be counted as token or exorbitant (Voice, ed, 2014).At the same time, many have argued that bride price is a positive tradition of appreciation for
women (Mugisha, 2008) that actually creates incentives to educate girls. From the same policydebate in Uganda are the voices of fathers who share their experiences of bride price negotiations,arguing that “education of the girl child should be emphasized in order to improve the family’sbargaining power in so far as bride price is concerned” (Muthegheki et al., 2012, p. 12).
Extensive focus groups conducted by our research team in Lusaka (Zambia) also suggest thatthe amount of bride price a bride’s family receives increases in the parents’ educational expenditureson the daughter: one respondent told us that when a parent negotiates lobola, he or she calculateshow much was spent on education. Parents perceive bride price as a future income stream arisingfrom investment in the girl-child, and view it as a substitute for old age support. For example, oneof our respondents told us, “A girl child is business and we all need money” and “For girl childrenyou benefit from charging while with boys support comes from them when you are old.” Bride-pricenegotiators know what factors increase price amounts. As one described in a focus group: “lobolais up with level of education because the family knows that the husband and his household willbe beneficiaries.” The positive relationship between education and bride price in Indonesia is alsopopularly discussed, including in media articles that encourage future brides to know how muchtheir individual bride-price increases with their education (Tang, 2014).
Our empirical strategy measures differences in the traditional marriage customs of ethnic groupsusing the Ethnographic Atlas (Murdock, 1957). The Atlas provides information on the transfersmade at marriage. In the Atlas, groups are categorized as belonging to one of the following cate-gories (Murdock, 1981, pp. 92–93):
1. Bride price: Also known as bride wealth. A transfer of a substantial consideration in theform of goods, livestock, or money from the groom or his relatives to the kinsmen of the bride.
2. Token bride price: A small or symbolic payment only.
3. Bride service: A substantive material consideration in which the principal element consistsof labor or other services rendered by the groom to the bride’s kinsmen.
4. Gift exchange: Reciprocal exchange of gifts of substantial value between the relatives ofthe bride and groom, or a continuing exchange of goods and services in approximately equalamounts between the groom or his kinsmen and the brides’ relatives.
5. Exchange: Transfer of a sister or other female relative of the groom in exchange for thebride.
6. Dowry: Transfer of a substantial amount of property from the bride’s relatives to the bride,the groom, or the kinsmen of the latter.
7. No significant consideration: Absence of any significant consideration, or giving of bridalgifts only.
Looking at traditional marriage customs globally using the Ethnographic Atlas, we finds thatbride price is the most commonly practiced tradition, occurring in approximately 52% of the soci-eties in the Ethnographic Atlas. The next most common outcome is for there to be no dominantpractice, which is the case for about 22% of societies. At the aggregate level, dowry is uncommon,
7

occurring in less than 3% of societies. The full distribution of marriage customs across all categoriesis reported in appendix table A1.
The practice of the bride price is ancient dating at least as far back as 3000BCE, being usedby the Ancient Egyptians, Mesopotamians, Hebrews, Aztecs, and the Incas. By contrast, thepractice of dowry is much more recent, having likely been first practiced in ancient Greece andRome (Anderson, 2007a, pp. 152-153). Historically and today, the bride price, like the dowry, istypically significant. Anderson (2007a) summarizes existing evidence on the magnitude of brideprice payments (table 4). Although there is significant heterogeneity, it it not uncommon for brideprice transfers to be in excess of a year’s income and sometimes as large as seven or eight timesannual income. Our evidence from modern Indonesia and Zambia is consistent with these numbers.As we discuss in more detail in section 6.1, in both countries bride price payments are very large,often in excess of a year’s income.
The Javanese are an example of an Indonesian ethnic group that does not pay bride price. In-stead, there is no common universal practice, although it is customary for the man to give a presentto the bride at the time of engagement and again another present at the time of marriage. Thesize of the present could be expensive or cheap, depending on the specific customs of the differentsocial group, with wealthier groups giving more expensive presents (Geertz, 1961, p. 62–65). Inthe Ethnographic Atlas, the Javanese are categorizes as having an “no significant consideration,”although “token bride price” is also listed as an alternate custom.
It is well known that bride price societies also tend to be societies that are patrilineal (e.g., thewife joins the husband’s kinship group following marriage).
In fact there is a strong negative relationship between both matrilineality and matrilocality andthe practice of the bride price at marriage looking across societies within the Ethnographic Atlas(see appendix table 2). One also observes that bride price societies are also more likely to practicepolygyny.
Relative to bride price, the dowry has received much more attention in the modern economicdevelopment literature. This is likely due to the fact that this is the dominant marriage paymentin South Asia (Anderson, 2007a) and has historically been prevalent in Europe. One might betempted to apply our analysis to countries with variation in whether dowry is practiced or not.While we feel this is a fruitful line of inquiry, one should not simply view the dowry as the flip-sideof the bride price and vice versa. As Goody and Tambiah (1973) put it: “Bridewealth and dowrythen are very far from being mirror opposites” (p. 6). There are important differences betweenthe two practices beside the direction of the payment. With bride price, the payment is made fromthe groom’s parents to the bride’s parents. However, with dowry, the payment is made from thebride’s family to the bride. Thus, the transfer is given to the new couple and not to the bride’sparents (Anderson, 2007a). This has led many scholars to view the dowry as having an importantpre-mortem bequest motive (e.g., Goody and Tambiah, 1973; Botticini and Siow, 2003). However,this is not true for the bride price. In addition, evidence does not indicate that the amount thatthe bride’s parents pay as a dowry decreases in the education of their daughter (e.g., Rao, 1993).
In bride price cultures, an interesting dynamic emerges, that has potentially important impli-cations for female education. Typically, bride price payments are sizeable and go to the father ofthe bride (or male kinsmen), who then decide which males of the family can use the bride price forpayment of their marriage. Thus, the bride price has a number of effects. It serves to increase theauthority of the father (he effectively decides who marries when); it emphasize a brother’s tie withhis sister; and it generates a system whereby all males in the family have aligned incentives and
8

want to receive the largest bride price possible from their sister’s marriage (Goody and Tambiah,1973, p. 5). Note that these effects will be particularly strong when the currency that is used isused solely for bride price. This is in fact the practice in many parts of Africa where the brideprice (i.e., lobola) is paid using livestock. An example is the Lovedu of Southern Africa who onlybuy and sell cows as part of marriage. Otherwise, families do not keep stock of cattle. Krig (1964)write that “cattle coming in as bride-price are not supposed to be used for any other purpose thanmarriage. . . most Lobedu families do not possess cattle except for short periods of time” (p. 160).
The use of cattle in much of Africa in general, and Zambia in particular, can be contrastedwith Indonesia, where bride price typically takes the form of goods, money and resources that havevalue and use outside of the circular sphere of marriage payments.
3 Evidence from Indonesia
We begin our empirical analysis by examining data from Indonesia, where bride price is com-monly practiced. As we document in full detail in section 6.1, within Indonesia, the practice ofbride price at marriage is common and the value of the transfer made is significant. For example, in2000, 87 percent of marriages that were recorded in the IFLS reported that a bride price was paid.In the 2007 IFLS, this figure was 85 percent. Among those ethnicities that traditionally practicebride price, the median value of the bride price transfer is 9 percent of average annual per capitaGDP and the mean value of the transfer is 82 percent of average annual per capita GDP.
To examine whether education-oriented development policies have differential effects based onthis cultural practice, we exploit the same quasi-experimental variation in number of schools builtby birth district in Indonesia as in Duflo (2001). We use the 1995 Indonesia Intercensal Survey,and study the differential effect of school construction policy on schooling by bride price custom.
We link individuals in the Intercensal Survey to their traditional marriage customs using theirself-reported language (i.e., mother tongue). In total, 174 different languages spoken are recordedas being spoken in the Intercensal Survey, which we manually match to ethnic groups in theEthnographic Atlas. In the end, the 174 language groups are matched to 28 distinct ethnic groupsfrom the Ethnographic Atlas.7 Table 1 presents the distribution of cultural practices for the 28ethnic groups. Of these groups, at the time of marriage, 13 practice bride price, 2 practice brideservice, 2 practice token bride price, 3 practice gift exchange, 4 practice sister or relative exchange,and 4 have no common practice. It is important to note that none of the ethnic groups withinIndonesia engage in the practice of dowry transfer at the time of marriage. Thus, our estimatesof differences between bride price cultures and non-bride price cultures do not reflect the effectsof whether a group practices dowry or not. As we will see, this is also true for the sample fromZambia.
The education intervention policy we examine is Indonesia’s school construction program ofthe 1970s. In 1973, the Indonesian government launched a large-scale school construction programcalled the Sekolah Dasar INPRES program. Over the course of the next five years, 61,800 primaryschools were constructed, leading to an increase in enrollment rates of children aged 7 to 12 – from69 percent in 1973 to 83 percent in 1978 (Duflo, 2001). This was equivalent to adding an averageof 2 schools per 1,000 children enrolled in 1971. Duflo (2001) shows that the program causally
7All but 11 of the 174 language groups in the Indonesia Intercensal survey could be matched to an ethnicity inthe Ethnographic Atlas. These comprise 0.43 percent of the observations with non-missing language data.
9

increased years of schooling completed by male students by 0.27 years and that controlling for aconcurrent program which improved sanitation and water allocation only strengthened this result.
We start with the baseline estimating equation from Duflo (2001):
yidk = αk + αd + β1IPostk × Intensityd +
∑j
X′dIjkΓj + εidk (1)
where i indexes individuals, d district of birth, and k year of birth. yidk is the dependent variableof interest, an indicator variable that equals 1 if individual i finished primary schooling. αk and αd
denote cohort (i.e., birth-year) fixed effects and district fixed effects. IPostk is an indicator variable
equal to 1 if an individual belongs to a cohort born between 1968 and 1972 (so that they wouldhave fully experienced the intervention). The untreated cohort is born between 1950 and 1962(and were already out of school by the time of the intervention). As in the baseline specificationof Duflo (2001), partial treatment cohorts are dropped from the analysis. Intensityd is the numberof schools (per 1,000 school-age children) built in birth district d during the school constructionprogram. Ijk is an indicator variable that equals 1 if individual i’s year of birth is equal to j and 0
otherwise, and∑
j X′dIjkΓj denotes cohort fixed effects interacted with the following district-level
covariates: the number of school-aged children in the district in 1971 before the school buildingprogram took place, the enrollment rate of the district in 1971, and the exposure of the district tothe second largest INPRES program, a water and sanitation program.
Panel A of table 3 presents summary statistics from the sample.Estimates of equation (1) are reported in table 4. The dependent variable is an indicator variable
that equals one if the individual completed primary school, and zero otherwise.8 Column 1 reportsestimates for the males only, which is the sample used by Duflo (2001). Column 2 reports estimatesfor the sample of females only. As shown, while one estimates strong effects of the treatment forthe sample of males, the estimated effects are much weaker, and not different from zero, whenexamining the female sample.
We next show that these modest impacts mask significant heterogeneity. To do this, we estimatean extension of equation (1) that allows for a differential impact of the school construction programdepending on whether an ethnic group practices the tradition of bride price payments:
yiedk = β1 IPostk × Intensityd × INoBridePrice
e + β2 IPostk × Intensityd × IBridePrice
e
+αkINoBridePricee + αkI
BridePricee + αe + αeI
Postk + αeIntensityd + αdI
NoBridePricee
+αdIBridePricee + INoBridePrice
e
∑j
X′dIjkΓj + IBridePrice
e
∑j
X′dIjkΥj + εiedk, (2)
where all indices and variables are defined as before. Additionally, e indexes the ethnicity ofindividual i and IBridePrice
e is an indicator variable equal to 1 if ethnic group e traditionally makesnon-token bride price payments at the time of marriage, and INoBridePrice
e is an indicator thatequals one if the group does not. The inclusion of IPost
k × Intensityd × INoBridePricee and IPost
k ×Intensityd×IBridePrice
e allows us to estimate the impact of school construction separately for ethnicgroups that undertake bride price payments at marriage and those that do not. Thus, β1 and β2are our coefficients of interest.
8Because the school construction program built elementary schools, we focus our analysis on the elementary schoolcompletion rates. Examining years of schooling, we find similar but less precise results.
10
The specification includes district fixed effects, but now allows the district fixed effects tovary depending on bride price customs of the ethnic group: αdI
NoBridePricee and αdI
BridePricee as
well. These absorb the double interaction components, Intensityd × INoBridePricee and Intensityd ×
IBridePricee , of the triple interaction specification. We also interact the ethnicity fixed effects with
the post-treatment indicator variable, αeIPostk . These absorb the double interaction terms IPost
k ×INoBridePricee and IPost
k ×IBridePricee . Lastly, we allow the impacts of our baseline set of district-level
covariates interacted with cohort fixed effects to vary depending on whether ethnicity e practicesbride price. We therefore control for the following interactions: INoBridePrice
e
∑j X′dI
jkΓj and
IBridePricee
∑j X′dI
jkΓj .
The estimates of equation (2) are reported in column 3 of table 4. As shown, we find a significant,positive effect of the school construction program on elementary school completion rates for brideprice females but not non-bride price females. The point estimates suggest that an increase of 1school per 1,000 school-aged children in a district increases the likelihood that a female from a brideprice ethnicity will complete primary school by 2.4 percentage points. We confirm this finding byestimating equation (2) separately for girls belonging to ethnic groups with bride price (column 4)and for ethnic groups without bride price (column 5).
Given that the practice of bride price is potentially correlated with other cultural characteristicsthat may themselves be related to gender outcomes, we investigate the robustness of our estimatesto accounting for heterogeneity in the impacts of the school construction program due to othercultural characteristics. The first cultural characteristic we consider is the role women traditionallyplayed in agriculture. Boserup (1970) argues that female participation is strongly associated withthe practice of bride price. Giuliano (2014) confirms this empirically, showing a correlation betweenbride price and female participation in agriculture across all ethnicities in the Ethnographic Atlas.Thus, we also account for traditional female participation in agriculture using variable v54 (SexDifferences: Agriculture) from the Ethnographic Atlas. The measure classifies ethnicities as being inone of eight categories: no information available, males only, males appreciably more, differentiatedbut equal participation, equal participation, females appreciably more, females only, agriculture isabsent or unimportant. Using this coding, we create an indicator variable that equals one if theethnicity is coded as having ‘females appreciably more’ or ‘females only’ traditionally engaged inagriculture.
Anthropologists commonly view bride price, or bridewealth, as being a transfer the husbandmakes to the wife’s family to compensate them for the loss of their daughter (see, for instance,Dalton (1966)). Thus, we would expect bride price to be more widely practiced among ethnicgroups that are patrilineal (i.e., the bride joins the kinship group of the groom and his familyat the time of marriage). In addition, Bau (2014) provides evidence that matrilocality, whichis strongly related to matrilineality, is associated with greater parental investment in daughtersrelative to sons. Therefore, using information from variable v43 (“descent: major type”) of theEthnographic Atlas, we create an indicator variable that equals one if the ethnicity is coded as beingmatrilineal.
For female agriculture, some ethnic groups are coded as having no information available. Thus,we also create an indicator variable that equals one if we do not have information to categorizethe ethnicity in question. Using these constructed covariates, we test for heterogeneity in theeffects of school construction by traditional female participation in agriculture and by traditionalmatrilineality. This is done by including the analogous interactions as for bride price, namely thenewly constructed variables are interacted with Intensityd×Ipostk with all of the appropriate double
11
interactions also included.The estimates are reported in table 5. The coefficients on the bride price and non-bride price
interactions are virtually unchanged. Column 1 reports the baseline estimates for comparison,column 2 includes the matrilocality interactions, column 3 includes the female agricultural inter-actions, and column 4 includes both sets simultaneously. The estimated differential effect by brideprice remains robust to the inclusion of these additional covariates. The coefficients of the controlsare also of interest.
An alternative data source to the 1995 Indonesian Intercensal Survey is the 2010 IndonesianCensus, which also reports elementary school completion. A benefit of the 2010 data over the 1995data is a sample size that is much larger. The estimates, which are reported in appendix table A3,show results that are qualitatively similar to the estimates using the 1995 data.
As a placebo test, one can estimate equations (1) and (2), but assigning children aged 12–17at the time of the school construction to be the placebo treated cohort and children aged 18–24 atthe time to be the placebo untreated cohort. The estimates show no statistically significant effectseffects of placebo treatment on males, female, bride price females, and non-bride price females. Seeappendix table A4 for the estimates.
As in Duflo (2001), we can also allow the effect of the school construction to vary by cohort,but restrict the effect of the construction to be zero for those that were older than 12 in 1974and therefore would be too old to attend primary school in 1974. Doing this, we find that theeffect of school construction for bride price females is generally positive, and the coefficients onthe interactions between the cohort indicator variables and the intensity of treatment are jointlysignificant (F -stat = 7.58, p < .01). In contrast, the coefficients for non-bride price females aretypically small and negative. The estimates are reported in appendix table A5.
In table A6, we test whether our Indonesia results are driven by Muslim bride price traditions.Muslim bride price, called mehr differs from the bride price we study, which is paid to the parentsof the bride at the time of marriage. Mehr serves as divorce insurance, and is paid to the bride ifa marriage ends in divorce. Ambrus et al. (2010), who study the interaction of mehr and dowriesin Bangladesh, provide a more complete discussion of mehr. In appendix table A4, we allow theeffects of school construction to differ by whether an individual reports being a Muslim, as well asthe traditional bride price practices of their ethnic group. We find that the effect of bride pricestatus is larger and more significant among non-Muslims, suggesting that neither an Islam effectnor the practice of mehr is driving our results.
4 Replicating the finding in Zambia
Having identified heterogeneous impacts of the 1970s Indonesian school construction project onfemale education, we now show that this finding is also found in a very different context: Zambiain the late-1990s and early-2000s.
There are a number of reasons why Zambia provides a very good setting to replicate the In-donesia finding. Like Indonesia, Zambia features a range of ethnic groups that practice bride pricepayments at marriage and a range of groups that do not. Also like Indonesia, Zambia had alarge school construction program in the late 1990s and early 2000s. Although the school con-struction occurred over a longer timespan and the process of choosing the location and timing ofschool construction was more opaque than in Indonesia, the episode provides large-scale variationin school construction like that in Indonesia. As in Indonesia, data on bride price payments and
12

their determinants are available in Zambia.9
Table 6 reports the distribution of marriage payments across the ethnic groups from the ZambianDemographic and Health Surveys (DHS), which we use for our Zambian analyses. As reported,ethnic groups either practice bride price payments, token bride price, or bride service. The ZambianDHS reports 52 distinct ethnic groups for the respondents. Of the 52 ethnicities, we are able tomatch 48 of them to 20 related and representative groups in the Ethnographic Atlas. The remainingfour groups are very small, and they comprise less than 0.01 percent of the DHS sample.
To determine whether bride price is related to other cultural traits that may influence femaleeducation in Zambia, we examine the relationship between the presence of a bride price norm andother gender-related traits in table 7. Many cultural traits that we expect to be related to genderpreferences are homogeneous across Zambian ethnic groups. The plough is not aboriginal for anyZambian groups, and all groups historically practice some form of polygamy. In contrast, matrilo-cality is strongly negatively correlated with the practice of bride price (ρ = −0.694, p < 0.01), asis matrilineality (ρ = −0.394, p < .1) , consistent with the idea that matrilineality/matrilocalityand bride price are substitutes. Within Zambia, there is no significant relationship between fe-male dominance in agriculture and bride price (ρ = −.083), although data on gender differences inagriculture are only available for 16 of the 20 ethnic groups from Zambia the Ethnographic Atlas.
Since the female agriculture variable in the Ethnographic Atlas contains additional informationabout relative female involvement in agriculture, we also run an ordered logit of this variable onbride price, excluding ethnicities that are not involved in agriculture. The coefficient from thisordered logit is very close to zero and not statistically different from zero. In fact, there is littlevariation in female agricultural involvement in Zambia. In 12 of the 16 ethnicities for which wehave data, females were traditionally “more involved” in agriculture than males.
Table 8 provides additional summary statistics for the two subsamples of the pooled 1996,2001, and 2007 rounds of the Zambian DHS that we use to analyze the effects of bride price andits interaction with the school construction program on enrollment.
To examine the effect of a large school expansion program on enrollment by bride price customs,we combine the pooled Zambia 1996, 2001, and 2007 DHS data with data provided by the ZambianMinistry of Education. Figure 6 graphs the number of schools built by year in Zambia between1940 and 2013. Figure 7 reports the number of schools constructed by province. The data indicatethat there was a large school construction boom between the mid-1990s and the early-2000s; a totalof 5,649 schools were built between 1994 and 2007.
In replicating our findings from Indonesia in the Zambian context, we maintain specificationsthat are as similar as possible, given data availability, to the specifications we have used for In-donesia. We begin by estimating a variant of equation (2) using a sample of children aged 5 to 12available from the three rounds of the DHS that include ethnicity data. The earliest round is from1996, a time period at the beginning of the school construction episode. The second round is from2001, during the middle of the episode, and the third is from 2007, near the end of the episode.Because exposed cohorts may not have completed primary school by 2007, our outcome variable is
9Within Africa, there are a number of other school expansion episodes that could potentially be used to examinethe impacts of the increased provision of schooling on female education. These are available for Zimbabwe (Agueroand Bharadwaj, 2014), Sierra Leone (Cannonier and Mocan, 2012), and Nigeria (Osili and Long, 2008). However,for Sierra Leone and Nigeria, there is not sufficient variation in the practice of bride price payments across ethnicgroups to undertake the necessary analysis. In both countries, the majority of people belong to an ethnic group thatpractices bride price payments at marriage. In Zimbabwe, sufficiently fine-grained data on individuals’ ethnicities arenot available from the existing data sources that could be used for the analysis.
13

enrollment in primary school.Unlike in the Indonesian setting, examined by Duflo (2001), construction in Zambia occurred
over a longer period of time and the strategy for building the schools was less clear. Therefore, ratherthan examining variation arising from the interaction between pre-treatment and post-treatmentcohorts with the spatial variation in treatment intensity, we estimate the relationship between thestock of schools in a district during a time period and the average enrollment of children aged 5 to12 in the same district and time period in our panel setting. As before, we examine differences inthe impact of the program on boys versus girls, and for girls, we examine differences in the impactfor ethnic groups that practice bride price and those that do not.
Our estimating equation is:
yiedkt = β1Schoolsdt/Aread × INoBridePricee + β2Schoolsdt/Aread × IBridePrice
e
+αktINoBridePricee + αktI
BridePricee + αet + αed + εiedkt, (3)
where i indexes children, e ethnic groups, d districts, k age of child at the time of the survey, and tthe year of the survey (1996, 2001 or 2007). Our outcome of interest is an indicator variable thatequals 1 if child i is enrolled in school at the time of the survey (year t): yiedkt. Our measure ofschool construction is given by Schoolsdt/Aread, which is the stock of schools in district d and yeart. As before, IBridePrice
e is an indicator variable that equals 1 if ethnic group e practices bride pricepayments at marriage, while INoBridePrice
e is an indicator variable that equals 1 if the ethnic groupdoes not.
The specification also includes age by survey year fixed effects interacted with the bride priceindicator variables, αktI
NoBridePricee and αktI
BridePricee . These are the equivalent of the cohort fixed
effects interacted with the bride price indicator variables in equation (2). We also include ethnicity-time period fixed effects, αet, and ethnicity-district fixed effects, αed, which are the equivalent ofthe ethnicity fixed effects interacted with the post-treatment indicator variable, and the districtfixed effects interacted with the bride price indicator variables in equation (2).
Estimates of equation (3) are reported in table 9. Columns 1–3 report estimates of a variant ofequation (3) that does not allow for a differential effect depending on an ethnic group’s marriagecustoms. We see that in Zambia a similar pattern emerges as in Indonesia. Among boys and girls,there is some weak evidence that school construction increases enrollment (column 1). This effectis concentrated among boys (column 2), and the estimated impact for girls is very close to zero(column 3).
Column 4 reports estimates of equation (3). As in Indonesia and consistent with proposition 3,the positive impacts of school construction are concentrated among girls from ethnic groups thattraditionally practice bride price payments at the time of marriage. Columns 5 and 6 confirm thisfinding by estimating equation (3) separately for the two sets of ethnic groups.
Table 10 tests whether the results in table 9 can be explained by pre-trends in districts thatreceived more schools. Table 10 duplicates the regressions in table 9, but it includes the forwardlag for the treatment, Schoolsd,t+1/Aread and its interactions with IBridePrice
e and INoBridePricee .
None of the forward lags positively predict enrollment. In fact, the negative coefficients for theforward lags suggest that schools may have been allocated to poorly performing districts.
Since bride price is likely to be related to other characteristics, we study whether our resultsare sensitive to controlling for the interaction between female agriculture and matrilineality andthe school construction program, as we did for Indonesia. There are only 21 ethnicities in the
14

Ethnographic Atlas for Zambia and female agriculture is only non-missing for 16. As a result, thecoefficients are identified by little variation. Appendix table A9 reports the results of the Zambiaschool construction regressions including interactions between the treatment Schoolsd,t+1/Areadand an indicator variable for whether agriculture is female-dominated and whether matrilinealityis practiced, as well as its interaction with an indicator variable for whether data on female partic-ipation in agricultural is missing. When female agriculture controls are included, both β1 and β2become larger, and the effect of the school building program becomes positive and significant fornon-bride price ethnicites as well. Nonetheless, a F-test for the final column of appendix table A9shows that β2 is significantly larger than β1 (F = 6.22, p < .05).
5 Model
Having provided evidence that school construction policies in both Indonesia and Zambiaexhibit different impacts on girls’ education depending on whether the ethnic group practices brideprice or not, we now turn towards gaining a better theoretical understanding of what in our opinionis the most natural explanation for this pattern: the returns to parents of education daughters arehigher in bride price ethnicities.
We present a simple model of parental education decisions that intends to show the impactthat bride price customs can have on parents’ decisions to invest in their daughters and howthis changes with government policies that increase access to school. In this basic framework,bride price payments, as long as they are increasing in the bride’s education, reward parentalinvestments in their daughters’ human capital. When parents are altruistic, they may invest in theeducation of their daughter as long as she receives a return from it. However, if the daughter cannotcommit to repaying them for the sunk investment, parents do not undertake as much investmentas the daughter would choose to make if she could pay for it. Bride price helps to overcome thisintergenerational incomplete contracting problem by ensuring a medium-term monetary return tothe parents.
There are two simple but important predictions from this model. The first is that even asmall amount of bride price can lead to higher education rates as long as there are householdson the margin of making that educational investment. The second prediction is that, withoutstrong assumptions about the nature of the preferences or of the savings technology, bride pricehas an ambiguous impact on the effects of education policy. However, we show that under mildassumptions on the distribution of the returns to education, we expect that reducing the cost ofschooling would have a larger effect on the enrollment rates of ethnicities that engage in bride pricepayments when enrollment rates are low, as we might expect in a developing country.
5.1 Setup
Parents live for two periods and receive utility from consumption ct and through the well-beingof their daughter V d via an altruism parameter γ ∈ (0, 1). Daughters are characterized by ability ai,which is distributed according to a probability density function f( ) and a cumulative distributionfunction F ( ).
The utility of the daughter V d(S, ai) depends on her her educational attainment S and abilityai. Define ∆V (ai) = V d(S = 1, ai)−V d(S = 0, ai) to be the returns to education for a daughter ofability ai. ∆V ( ) is a strictly increasing function. These returns are distributed with a probability
15

density function g( ), which is a monotone transformation of f( ), and cumulative distributionfunction G( ). The returns do not depend on the bride price custom and are meant to captureboth labor market and marriage market returns that are enjoyed by a woman of ability ai if she iseducated.
In the first period, parents decide how much to consume (c1) and whether or not to educatetheir daughter (S ∈ 0, 1) at the cost fS . In the second period, they only decide how much toconsume (c2).
The variable BridePricee ∈ 0, 1 denotes whether the household belongs to an ethnic groupthat engages in bride price payments or not. If it does, parents receive a bride price payment inperiod 2. We assume that in the absence of this custom, the bride price amount will be part of thetransfer to the daughter from her husband, and hence that the payment is incident on her. Brideprice amounts depend on a woman’s ability and on her educational attainment:
BP (BridePricee, S, ai) = BridePricee [πS + h(ai)] .
Assumption 1. Bride price amounts are increasing in a woman’s educational attainment: π > 0.
Household i solves the following problem:
maxS∈0,1,c≥0 c1 + βc2 + γ[V d(S, ai)− β ·BP (BridePricee, S, ai)] (4)
s.t. c1 + fS · S ≤ y1c2 ≤ y2 +BP (BridePricee, S, ai)
Note that there is no borrowing nor saving. We assume that y1 > fS , i.e. that the household doesnot need to borrow to finance the education of the daughter.
5.2 Bride price and the education decision
Substituting the budget constraints into the objective function, we have that a household edu-cates the daughter (Si = 1) whenever
−fS +BridePriceeβ(1− γ)π + γ∆V (ai) ≥ 0.
The household that is on the margin between making the educational investment or not, de-pending on the bride price custom BP and on the cost of education fS , has returns to educationfor the daughter equal to
∆V ∗(BridePricee, fS) =fSγ−BridePricee
β(1− γ)π
γ.
Define as a∗(BridePricee, fS) the corresponding ability level obtained by inverting function∆V ( ): ∆V ∗(BridePricee, fS) = ∆V (a∗(BridePricee, fS)).
Household i makes the educational investment as long as the returns for the daughter are higherthan the ones of the marginal household (∆V (ai) ≥ ∆V ∗(BridePricee, fS)). Hence, the probabilitythat household i educates the daughter is:
P (Si = 1|BridePricee, fS) = P (∆V (ai) ≥ ∆V ∗(BridePricee, fS)) = 1−G(∆V ∗(BridePricee, fS)).
16

Proposition 1. The probability of education P (Si = 1) is:(i) decreasing in the cost of education;(ii) higher among ethnicities that engage in bride price payments.
Proof. See Appendix A.
Proposition 1 simply tells us that we should observe higher rates of enrollment among ethnicitiesthat practice bride price. This result is intuitive: bride price provides an additional incentive forparents to educate their daughter, in addition to altruism. Higher enrollment rates among brideprice ethnicities imply, in this setting, that girls of relatively lower ability would get educated inbride price ethnicities because the bride price premium justifies the education investment of theparents.
Proposition 2. The average ability of educated girls is higher among ethnicities that do not engagein bride price payments relative to ethnicities that do.
Proof. See Appendix A.
It is worth noting that, as long as both the returns to education ∆V (ai) and bride pricepayments πS + h(ai) are increasing in ability ai, bride price amounts are higher for educatedwomen whether or not π > 0. If more able women are more likely to be educated and to receivehigh bride price, hedonic regressions of bride price payments do not have a causal interpretation,as mincerian regressions cannot typically identify the labor market returns to education wheneducational attainment is endogenous (Griliches, 1977; Card, 1994; Heckman et al., 2006).
5.3 Bride price and response to education policies
We now examine how a change in the cost of education fS affects the probability of educationdepending on the bride price custom, making two additional assumptions, which provide simplesufficient (but not necessary) conditions. The first is that the distribution of daughters’ returns toeducation is single peaked. The second is that, because of the low rates of female enrollment indeveloping countries, the marginal girl that gets educated in both Indonesia and Zambia has abilityabove the mode.10 Under these assumptions, it is straightforward to interpret the above empiricalresults.11
Proposition 3. A drop in the cost of education increases the probability of education more inethnicities that engage in bride price payments compared to other ethnicities.
Proof. See Appendix A.
Figure 1 provides a simple intuition for this result: when the density of the returns to educationis decreasing, a decline in the cost of schooling affects the group with higher schooling rates (brideprice ethnicities, in our case) more because this group has higher density on the margin of theeducational investment.
10If the distribution of returns is skewed to the right, this case applies when education rates are above 50%.11This argument is related to one put forth by Fabinger and Weyl (2013), who show that a unimodal distribution
of consumer valuations leads to S-shaped demand functions. Then, the elasticity of demand with respect to a pricechange depends on whether such a change occurs in a part of the demand curve that is concave or convex.
17

Intuitively, in a society where few women are educated, the ones who are must have very highreturns from education. The unimodal assumption guarantees, loosely, that there are only a fewwomen with such high returns, relative to the number of women with modal returns. A marginaldecrease in the cost of education leads women whose returns to education were previously marginallybelow the cost of education to become educated. If women in bride price ethnicities need slightlylower returns in order to get educated relative to women in non-bride-price ethnicities, there willbe more women on the margin of responding to the policy change in bride price ethnicities sincetheir returns are closer to the modal returns. Becker et al. (2010) use a related argument to explainwhy women’s education rates have overtaken those of men in developed countries.
6 Additional Evidence
In this section, we examine the main assumption and implications to our model and bringadditional datasets to show consistent evidence from both Indonesia and Zambia in support of ourinterpretation that the bride price custom can explain the heterogeneous effects of school expansionthat we have documented across ethnic groups.
6.1 Are bride price transfers large enough to affect parent’s decisions?
An important implication of the model is that, in order for there to be an effect of the brideprice custom on parental decisions regarding their daughters’ education, the bride price paymentdoes not have to be particularly large. Whether or not an ethnic group traditionally engagesin bride price payments will contribute to determining which households are on the margin ofeducating their daughter or not. Thus, even if the amount of the bride price is small, it can stillaffect those on the margins. However, the larger the bride price and the more strongly it increaseswith education, the larger we expect the effects to be. Thus, here we document that bride pricetransfers are sizeable in both Indonesia and Zambia.
Bride price payments are important in contemporary Indonesia. Figure 3 graphs the distributionof bride price payments for ethnicities that traditionally make payments at marriage using rounds3 and 4 of the Indonesia Family Life Survey, while figure 4 graphs the distribution for all non-zerobride price payments (including ethnicities that pay token bride price). In 2000, 87 percent ofmarriages reported to the IFLS had a bride price and in 2007, 85 percent of marriages included abride price.12 Appendix table A8 reports summary statistics for bride price marriages for rounds3 and 4 of the Indonesia Family Life Survey.
We find that across all marriages (i.e., in the full IFLS sample), the median bride price is 4percent of GDP per capita and the mean bride price is 45 percent of GDP per capita. Moreover,if we restrict the sample to ethnicities that we identify as having a bride price custom, the medianbride price is 9 percent of GDP per capita and the mean is 82 percent.13 Therefore, bride pricepayments are significant, particularly compared to a family’s annual income.
12The IFLS asks about dowry and bride price together and does not distinguish between the two. However,according to the IFLS documentation the marriage custom is typically bride price except for marriages among thematrilocal Minangkabau, who we omit from the analysis (RAND, 1999).
13We see little evidence of bride price inflation or deflation over time. Marriage year is negatively correlated withbride price, but this correlation is entirely driven by marriages that are reported to have occurred before 1980 (whichmake up 7 percent of the bride price ethnicity data), and these respondents had to recall bride prices from at least20 years ago when they responded to the survey.
18
In Zambia, bride price(lobola) is widespread. In the data from the Zambia Fertility Study(ZFPS - see the data appendix for a description of the data) in peri-urban Lusaka, a bride pricetransfer was made in 85.5% of all marriages and in 87.5% of marriage in which the wife belong toan ethnic group that traditionally engages in bride price. In the overall sample, the mean paymentcorresponds to 122% of the per capita GDP in the year of marriage, the median to 58%. Amongethnic groups that traditionally engage in bride price, the mean payment was 182%of the per capitaGDP in the year of marriage, the median was 72%
6.2 Are bride price transfers increasing with the bride’s education?
A crucial assumption in the mechanism of the model is that bride price transfers are increasingin the educational attainment of the bride. This was Assumption 1 of the model. We now verifythat there is a positive correlation between a woman’s educational attainment and the bride pricepayment in both Indonesia and Zambia.
Evidence from Indonesia
In Indonesia, we examine this relationship using the Indonesia Family Life Survey (2000 and2007). The survey reports information about the value of bride price transfers at marriage. Welink individuals to their traditional marriage practices using their self-reported ethnicity. The 2007IFLS contains information on 28 ethnicities that were matched manually to the ethnic groups listedin the Ethnographic Atlas.14
We begin by estimating the following hedonic regression:
ln(BP )iekt = αt + φk + β1I(PrimarySchool)i + β2I(JuniorSecondary)i
+β3I(College)i + XiΓ + εiekt (5)
where i indexes a marriage, e the ethnicity of the bride, k the year of the marriage, and t the surveyyear (2000 or 2007). BridePriceiekt is the reported amount of the bride price paid at the time ofmarriage. I(PrimarySchool)i is an indicator variable that equals one if individual i has completedprimary school and attended junior secondary school, I(JuniorSecondary)i is an indicator variableequal to 1 if an individual has completed junior secondary school and attended upper secondaryschool, and I(College)i is an indicator for having attended college. αt is a survey-year fixed effectand φk is a marriage-year fixed effect. Xi varies across specifications, but always includes controlsfor the bride’s age and her age squared at the time of marriage. Depending on the specification, italso includes either ethnicity effects or an indicator variable for belonging to a bride price ethnicity,as well as controls for the husband’s education, and the husband’s age at marriage.
Estimates of equation (5) are reported in table 11.15 Column 1 reports the returns to differenteducation levels controlling for only survey-year and marriage year fixed effects. Column 2 addsmarriage age controls and column 3 includes a control for belonging to a bride price ethnicity.In column 4, we include ethnicity fixed effects to capture any correlation between belonging to
14Of the ethnic groups listed in the IFLS, six cannoln(BP)t be matched to the Ethnographic Atlas. This comprises5.6 percent of the sample of recently married couples who were asked questions about their bride price payments andhad a recorded ethnicity.
15Summary statistics for rounds 3 and 4 of the Indonesia Family Life Survey (IFLS) are reported in appendix tableA8.
19

an ethnicity that practices higher bride price and receiving more education. The results are verysimilar.
The estimates show that more educational attainment by the bride is strongly associated with ahigher bride price transfer at marriage. According to the estimates reported in column 4, completionof primary school is associated with a 54% increase in the value of the bride price (relative to noschooling), completion of junior secondary school is associated with an additional 62% increase inthe bride price, and completion of upper secondary schooling and attendance of college is associatedwith an additional 89% increase. According to the estimates, parents of women who attendedcollege, on average, receive bride price payments that are 205% higher than payments to parentsof women who did not complete primary education.
The remaining columns in table 11 report estimates that include husband’s education, as wellas husband’s age (and age squared) at the time of marriage. Although the estimates in table11 must be taken with the caveat that the additional covariates are potentially endogenous toour variables of interest, the estimated effects of a bride’s educational attainment are consistentwith the estimates from the first four columns of the table. The potentially-endogenous variablesabsorb part of the effect of education on bride price amount, but the relationship between a bride’seducational attainment and bride price remains large, positive, and statistically significant.
Overall, the estimates reported in table 11, while not causal, are consistent with the hypothesisthat a bride’s education has a very large impact on the amount of bride price that the bride’sparents receive at the time of marriage.
While the correlations report in table 11 cannot be interpreted as causal, we can alternativelyfollow Duflo (2001) and instrument for primary school completion among females belonging to brideprice ethnicities using the number of schools built in a female’s birth district in rounds 3 and 4 ofthe IFLS.16 In line with Duflo (2001), we allow the effect of school construction to vary by a child’sage in 1974, restricting the effect to 0 if a child was older than 12 in 1974. Following Duflo (2001),we also restrict the sample to those born between 1950 and 1972. Unfortunately, the resultingsample of couples from bride price ethnicities who were asked questions about bride price is quitesmall (258). This results in the first stage estimating equation:
I(Completed Primary)idkt = αd + αk + αt +12∑a=2
βa Intensityd × I(age1974 = a)i
+∑j
X′dIjkΓj + εidkt, (6)
where d denotes the district, i denotes the individual, t denotes the survey year, and k denotes thecohort. αd denotes district fixed effects, αk cohort fixed effect, and αt survey-round fixed effects.∑
j X′dIjkΓj are the cohort-specific controls for the INPRES sanitation program, the enrollment
rate in 1971, and the total number of school-aged children in 1971.The second-stage equation is given by:
yidkt = αd + αk + αt + γI(CompletedPrimary)i +∑j
X′dIjkΓj + µidkt, (7)
16As we have shown in table 4, the school construction does not strongly effect primary completion for females whodo not belong to ethnicities that practice bride price.
20

where the outcome variable yidk is either the value of the bride price paid or the natural log of thebride price.
Appendix table A7 reports the results of these regressions. Column 1 shows that the instrumentsjointly significantly predict primary school completion among bride price females in the IFLS (F -statistic of 5.99). Columns 2 and 3 of the table, which report the effect of primary schooling onbride price and log bride price values, are imprecisely estimated but appear to corroborate theresults in the hedonic regressions: completing elementary school increases bride price paymentsby 180 percent (p < .10). However, self-reported bride prices in the IFLS are likely to be innominal terms. Therefore, in columns 4-6, we duplicate the regressions in columns 1-3 includingmarriage year fixed effects. The new first stage is quite weak, with an F-statistic of 1.72. The effectof primary school completion on bride price values in column 5 is large and significant at the 5percent level. Column 6 indicates that primary completion leads to an 80 percent increase in brideprice payments, but this effect size is imprecise and statistically insignificant. In general, given theweak first stage, these results should be interpreted with caution.
Evidence from Zambia
We investigate the relationship between the amount of bride price paid at the time of marriageand the bride’s characteristics and, in particular, her education, as postulated in assumption 1. Todo so, we included a dedicated module in the first wave of the Zambia Fertility Preferences Survey(Fall 2014), in which 728 households from a poor suburb of peri-urban Lusaka were interviewed.Each spouse was asked a series of questions on the practice of lobola, leading to a total of 1,456observations.17
Appendix table A11 reports summary statistics for the key variables. 94 percent of wiveshave completed primary education, 50 percent have completed junior secondary education, and27 percent have completed secondary education. Educational attainment is slightly higher amonghusbands, with 99 percent completing primary school, 73 percent completing junior secondaryschool and 47 percent secondary education. Almost no person interviewed had attended college.
To assess the empirical relationship between bride price payments and educational attainment,we estimate the following hedonic regressions for wife i, belonging to ethnic group e and marriedin year t:
ln(BP )iet = αt + β1 I(Primary)i + β2 I(JuniorSecondary)i + β3 I(Secondary)i
+XieΓ + εiet, (8)
where the dependent variable, ln(BP )iet, is the natural logarithm of the amount paid at marriage.We measure education using an indicator variable I(Primary)i that equals 1 if the bride has com-pleted primary education (and 0 otherwise) and an indicator variable I(JuniorSecondary)i thatequals 1 if the woman has completed junior secondary education and I(Secondary)i that equals 1if the woman has completed secondary education or above. The excluded category is no education.The control vector Xie includes a quadratic in the wife’s age, an indicator variable that equals oneif an ethnicity traditionally practices bride price, a marriage-year fixed effect, and the husband’scharacteristics.
Estimates of equation (8) are reported in table 12, columns 1–4. As in Indonesia, bride price
17See Appendix A for further details of the sample.
21

payments increase with the education of the bride. Completing primary school is associated witha 50 percentage point increase in the bride price payment, completing junior secondary school isassociated with another 27 percentage point increase, and completing secondary school with another40 percentage point increase.
We next include a vector of covariates related to the husband’s characteristics. These includean indicator of whether the husband has completed primary school or junior secondary school andthe husband’s age at marriage and age at marriage squared. The estimates are reported in columns5–8 of table 12. The coefficients for the education completion variables remain stable, although thecoefficient for primary school completion, β1, become less precisely estimated.
These results are consistent with qualitative evidence from focus groups. From these discussions,it is clear that bride price transfers increase with the education of the bride and that this is wellknown. For example, one respondent told us that when a parent negotiates lobola, he or shecalculates how much was spent on education. Parents are well aware of bride price as a futureincome stream and view it as a substitute for old age support. For example, one respondentexplained to us that “a girl child is business and we all need money” and “for girl children youbenefit from charging [lobola], while with boys support comes from them when you old.”
We also used the ZFPS survey to try and gain a better understanding of why bride price isincreasing with the education of women (or at least why it is perceived to increase). Thus, weasked respondents to indicate the reason why, in their view, bride price for more educated bridesis higher. Respondents, again unprompted, indicated several reasons that were categorized andare reported in column 1 of table 13. The most common answer given was that parents shouldbe compensated for the educational investments made in their daughter. This is consistent withthe common anthropological interpretation of the bride price as compensation for the parents’investments made in the bride (e.g., Vroklage, 1952). Other common explanations attributed thehigher bride price to increased productivity of the bride, either in relation to earnings in the labormarket, improved skills within the household, increased ability to maintain the health and educationof her children.
An important point is that these results, in general suggest a causal interpretation of the positiverelationship between education and bride price. Either due to a culture-based moral obligation, ordue to a perceived increase in the productivity of the bride, her increased education causes her toreceive a higher bride price. An alternative set of explanations are that the estimated relationshipis driven by omitted factors, the most obvious being that more educated brides tend to have richerparents, and if the bride’s parents are wealthier, then they will demand a higher bride price. Wewere particularly careful to look for explanations of this nature. Though some respondents didprovide an explanation along these lines, it was only chosen by less than 8% of the sample, makingit one of the least popular explanations.
After allowing respondents to answer unprompted, they were then prompted and asked directlyabout each potential explanation listed in table 13. Due to the well-known acquiescent responsebias, we must interpret the prompted responses with caution and we expect respondents’ agreementfrequencies to be upward biased and their disagreement frequencies to be downward biased. How-ever, the relative differences are likely still informative. The responses to the prompted questions,reported in columns 2 and 3, show that most people believe that the increase in bride price fromeducation is due to the belief that parents should be compensated for their investments in theirdaughter. When asked about this explanation, only 12% said that they felt this was not a reason.By contrast, 56% said that education being associated with a bride’s parents being wealthy was
22
not a reason.
6.3 Do bride price cultures have higher levels of female educational attainment?
We next turn to an examination of the relationship between an ethnic group’s bride price prac-tices and the level of female schooling. We do this by examining variation in schooling enrollmentacross ethnic groups (first in Indonesia and then in Zambia) and asking whether girls are morelikely to be enrolled in school in ethnic groups that engage in bride price payments at marriage, aspredicted by proposition 1.
Our estimating equation is:
IEnrolledijedt = αdt + β1I
BridePricee + XiΓ + XjΩ + XeΠ + εijedt, (9)
where i indexes girls aged 5–22, j indexes households, e indexes ethnic groups, and t the year ofthe survey. For Indonesia, we examine all girls from the 1995 Indonesia Intercensal Survey. ForZambia, we examine all girls from the pooled 1996, 2001, and 2007 Zambian DHS.
The dependent variable IEnrolledije is an indicator variable that equals 1 if individual i from
household j and ethnicity e is enrolled in school. As before, IBridePricee is an indicator variable that
equals 1 if ethnicity e traditionally engages in the practice of bride price payments at marriage.αdt denotes district fixed effects interacted with survey-year fixed effects. For Indonesia, we haveonly one survey-year so these are simply district fixed effects. The vector Xi consists of the age ofthe girl as well as her age squared. The vector Xe also includes our set of ethnicity-level controls.This is the same set as included in tables 5 and appendix table A9: an indicator that equals one ifethnicity e traditionally was matrilineal and a measure of the traditional participation of women inagriculture. We cluster standard errors at the ethnicity level. Since there are as few as 16 ethnicitiesin our sample, we also report confidence intervals from a wild bootstrap procedure (Cameron andMiller, 2015).
Estimates of equation (9) are reported in table 14. Columns 1 and 2 report estimates forIndonesia, while columns 3 and 4 report estimates for Zambia. The even numbered columns includethe ethnographic covariates, while the odd numbered columns do not. In all four specifications,we estimate a positive and significant relationship between bride price and the probability that agirl is enrolled in school. The point estimates are large. Bride price is associated with between a3.4 to 6.8 percentage point increase in the probability of school enrollment. These correlations areconsistent with proposition 1 of the model.
6.4 Do bride price cultures have lower test scores?
One of the predictions to emerge from the model states that bride price females should havelower academic ability on average conditional on attending school (proposition 2). We use self-reported test score data in rounds 3 and 4 of the IFLS to test whether this is the case for primaryschool students in Indonesia. We first restrict the data set to test-takers who took state examsbetween 1980 and 2001 during the Ebtanas exam system.18 This sample includes 77 percent ofprimary-school test-takers. After normalizing total test scores to have a mean of 0 and a standarddeviation of 1, we run the following regression for bride price females who reported primary school
18Ebtanas was instituted in 1980, and it was replaced by UNAS in 2001.
23

test scores:
TestScoreiekpst = αkt + δps + ageit + β1IBridePricee + β2I
NoBridePricee + XeΠ + εiekpst. (10)
where i denotes a female primary school student, e an ethnicity, k is the year of birth, p a province,s the year the test was taken, and t denotes the IFLS survey year. The variable αkt is a year-of-birthby survey-year fixed effect and δps is a province by test year fixed effect. We include δps since theEbtanas exam system was standardized at the province-level each year. The vector Xe includesour set of ethnicity-level controls. This is again the same set as included in table 5 and appendixtable A9: an indicator that equals one if ethnicity e traditionally was matrilineal and a measure ofthe traditional participation of women in agriculture. We cluster standard errors at the ethnicitylevel. Since there are only 13 ethnicities with test score data in the IFLS, we also report confidenceintervals from a wild bootstrap procedure (Cameron and Miller, 2015).
Table 15 reports the estimates of equation (10). Column 1 reports estimates without theethnographic controls and column 2 reports estimates including the controls. Consistent withproposition 2, bride price females’ test scores are estimated to be 0.08–0.09 standard deviationslower than those of non-bride price females.
6.5 Qualitative survey evidence from Zambia
The institution of bride price can only influence educational investment to the extent thatparents believe that bride price increases with education. To understand whether families perceivethe association between education and bride price as causal, we included a dedicated module inthe first wave of the Zambia Fertility Preferences Survey (Fall 2014), in which 728 households wereinterviewed. Each spouse was asked a series of questions on the practice of lobola, leading to a totalof 1,456 observations.
In the first set of questions, respondents were unprompted and asked to indicate the factorsthat affect bride price in their community today. The responses are summarized in table 16. Themajority of respondents (37%) listed education as the primary determinant of the value of thebride price at marriage. The next most commonly listed first determinant was family values (15%)and good morals (13%). Overall, 63% of respondents listed education as one of the three mostimportant factors affecting bride price.
Respondents were then asked to list all factors that lower bride price amounts. We coded thesequalitative answers to identify those indicating that low education is a negative determinant ofbride price.19 Overall, 17% of respondents report lack of education as a negative determinant ofbride price, with similar percentages among male and female respondents.
6.6 Testing other explanations for the differential schooling response by brideprice cultures
Below, we examine two categories of potential alternative explanations for our findings, whichinvolve possible differences in economic behavior across ethnic groups that are systematically cor-related with the bride price custom. Overall, we find no evidence that such systematic differencesexist.
19Examples of these qualitative answers are “Lack of education,” “Not going to school,” “The woman is unedu-cated,” “Education level of the girl,” “If a woman hasn’t been to school.”
24

Higher returns to education for bride price cultures
One potential explanation for our findings is that the the labor market returns to education arehigher for females from bride price cultures and this is why parents are more likely to educated theirdaughters in response to the school-building programs. We test whether the data are consistentwith this alternative explanation. Using the 1995 Indonesia Intercensal data, we check whether therelationship between a women’s level of education and either her employment status or her incomeis stronger for women from bride price cultures than women that are not.
In practice, we estimate the following equation:
yiked = αd + αk + β1I(PrimarySchool)i + β2I(PrimarySchool)i × IBridePricee
+β3I(Junior Secondary)i + β4I(Junior Secondary)i × IBridePricee
+β5I(College)i + β6I(College)i × IBridePricee + εkied (11)
where i indexes a woman between the ages of 25 and 45, e her ethnicity, d her district, and kher age. yiked is either an indicator variable that equals one if the individual is employed, thenatural log of the wage among women employed in the formal sector20, or the wealth index of awoman’s household.21 I(PrimarySchool)i is an indicator variable that equals one if individual ihas completed primary school and attended junior secondary school, I(Junior Secondary)i is anindicator variable equal to 1 if an individual has completed junior secondary school and attendedupper secondary school, and I(College)i is an indicator for having attended college. αd denotesdistrict fixed effects, which are intended to capture district-level differences in the labor market,and αk denotes age fixed effects.
The estimates are reported in table 17. Unsurprisingly, we find that more education is associatedwith more employment, higher wages, and greater household wealth. However, we find no evidencethat the relationship between education and employment or wages is stronger for women from brideprice cultures. In fact, in agreement with our prediction that educated women in bride price ethnicgroups have worse unobserved quality, we find somewhat lower coefficients in terms of maritalwealth associated with education for these women. Thus, it is unlikely that the differential policyresponse we document can be explained by higher returns to education for women from bride pricecultures.
Evidence from Zambia confirms our findings for Indonesia. We estimate a variant of equation(11) using the three available rounds of the Zambian DHS. As in Indonesia, we examine femaleemployment and a wealth index22. These estimates are reported in columns 1 and 2 of table 18.As in Indonesia, we find no evidence of a differential return to education for women belonging tobride price cultures.
Because the DHS does not include information on wages and therefore we are unable to examinethe wages of employed women, we instead use alternative measures of well-being that are availablefrom the DHS and likely correlated with female income (and household income). Specifically,we also examine an indicator variable that equal one if a woman’s child is categorized as beingstunted (having a height that is below three standard deviations below the mean of the growth
20The Indonesia Intercensal data only reports wages for formal sector employees.21The wealth index is constructed by a principal components analysis of indicator variables for owing an automobile,
tv, radio, stove, buffet, bicycle boat, and motorboat. The wealth index is the first component of this analysis.22The Zambia wealth index is constructed by the Demographic and Health Surveys based on answers to a large
number of questions about asset ownership and housing characteristics.
25
distribution for health children based on a study of six baseline countries chosen by the WHO –Brazil, India,Oman, Ghana, Norway and the USA) and an indicator that equals one if a woman’schild is categorized as being malnourished (having a weight that is below three standard deviationsbelow the mean). We estimate equation (11), looking at children aged 0-5 in the sample. Theestimates are reported in columns 3 and 4 of table 18. Again, we see no evidence of a differentialreturn to education for women belonging to bride price cultures.
Higher ability to pay for schooling for bride price cultures
An alternative explanation for our finding is that cultures that engage in bride price paymentsat the time of marriage have higher incomes and therefore are better able to send their daughtersto school in response to the large school construction programs. We test for this by estimatingthe determinants of the wealth index in Indonesia and Zambia. In particular, we are interestedin whether households that belong to bride price ethnic groups (defined as the ethnicity of thehousehold head) have greater wealth. The specification also includes district fixed effects andsurvey year fixed effects (for Zambia).
Estimates are reported in columns 1 and 3 of table 19. We find no significant difference in thewealth of bride price and non-bride price households in either Indonesia and Zambia. Thus, it isunlikely that differences in wealth levels explain our findings.
Even if household wealth is the same between bride price and non-bride price groups, it is stillpossible that bride price societies have less children and thus are more easily able to send theirchildren to school, including their daughters. For example, in Indonesia, it has been hypothesizedthat historically the bride price has led to delayed marriage (and to many women not marrying)and therefore to lower rates of fertility (Boomgaard, 2003).
To test for this, we look at a cross-section of women, aged 25–45, in both Indonesia and Zambia,and examine the correlates of the number of living children the women has at the time of the survey.In addition to a bride price indicator variable, the specification also includes age fixed effects, districtfixed effects, and survey-year fixed effects (for Zambia).
The estimates are reported in columns 2 and 4 of table 19. We find no evidence that bride pricefamilies have fewer children, and thus are more easily able to send daughters to school. In Zambia,we find that there is no statistically significant difference between bride price and non-bride pricegroups. In Indonesia, we do see a significant difference, but we find that bride price families actuallyhave more children than non-bride price families, not less. Thus, it is unlikely that differences infertility rates explain our findings.
7 Conclusions
Our analysis has documented a (perhaps surprising) economic consequence of the traditionalpractice of bride price payments, which is prevalent in many parts of the world including most ofsub-Saharan Africa and many parts of Asia.
Revisiting one of the best-studied historical development projects – the Sekolah Dasar INPRESschool construction program in Indonesia – we have shown that the impacts of the school-buildingproject on female education depended critically on this cultural practice. For ethnic groups thattraditionally make bride price payments at marriage, the increased supply of schools resulted in asignificant increase in female education. However, for those without this custom, the increase in
26

the number of schools had no impact on female education.To better understand the mechanisms behind this differential effect, we documented that for
groups practicing bride price payments, higher female education at marriage is associated with asignificantly higher bride price payment received. Thus, the bride price provides a greater incentivefor parents to invest in girls’ education. Furthermore, it is these parents that are more likely totake advantage of the increased supply of schools by educating their daughters.
We also replicated these same findings in Zambia, where we exploit a similar school expansionprogram that took place in the early 2000s. We find effects in Zambia to be qualitatively identicalto the effects in Indonesia. The impact of the school building program on female education isconcentrated among ethnic groups that traditionally make bride price payments at the time ofmarriage. As in Indonesia, the value of the bride price received at marriage increases with theeducation of the bride. Household survey data from Zambia reveals that parents believe that brideprice increases with education, which they attribute mainly to providing compensation for parentalinvestment in girl children.
We believe that our finding provides a number of important lessons. First, while there may besignificant downsides to a bride price tradition, our results suggest that any change to this culturalcustom should likely be considered alongside additional policies to promote female education. Sec-ond, our findings also highlight the importance of the culture of a society, and how this can becritical in determining the success of large-scale development policies.
8 Tables
Table 1: Distribution of Customs Practiced in Indonesia
Number of ethnic groups Percent of non-missing observations
Marriage CustomsBride Price 13 0.464Bride Service 2 0.071Token Bride Price 2 0.071Gift Exchange 3 0.107Sister Exchange 4 0.143No Custom 4 0.143Dowry 0 0.000
Other CustomsMatrilineal 4 0.143Matrilocal 5 0.185Plow 9 0.321Female Agriculture 4 0.174Polygamy 19 0.679
Notes: This table counts the number of ethnicities that practice different traditionalcustoms in the Ethnographic Atlas, which contains 28 ethnicities that are matched toIndonesian data.
27

Table 2: Correlations Between Bride Price and Other Customs in Indonesia
Indicator variable for bride price practice
Matrilineal -0.250(0.248)
Matrilocal -0.100(0.253)
Plow -0.029(0.209)
Female Agriculture -0.276(0.256)
Polygamy 0.029(0.209)
Constant 0.500*** 0.500*** 0.474*** 0.526*** 0.444***(0.106) (0.111) (0.119) (0.120) (0.172)
Number of observations 28 27 28 23 28Adjusted R2 -0.007 -0.034 -0.038 -0.002 -0.038
Notes: This table regresses an indicator variable for whether an ethnicity practicesnon-token bride price on indicator variables for practicing matrilineality, matrilocality,and female agriculture.
28
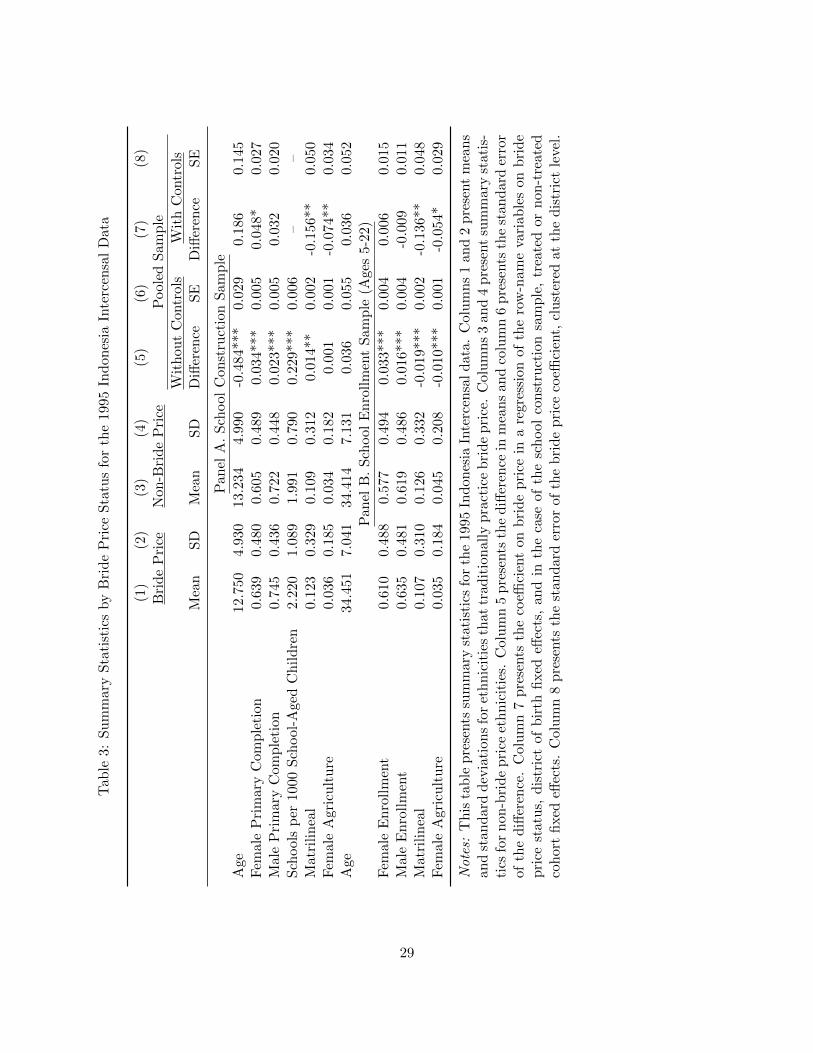
Tab
le3:
Su
mm
ary
Sta
tist
ics
by
Bri
de
Pri
ceS
tatu
sfo
rth
e19
95In
don
esia
Inte
rcen
sal
Data
(1)
(2)
(3)
(4)
(5)
(6)
(7)
(8)
Bri
de
Pri
ceN
on-B
rid
eP
rice
Pool
edS
am
ple
Wit
hou
tC
ontr
ols
Wit
hC
ontr
ols
Mea
nS
DM
ean
SD
Diff
eren
ceS
ED
iffer
ence
SE
Pan
elA
.S
chool
Con
stru
ctio
nS
amp
le
Age
12.7
504.
930
13.2
344.
990
-0.4
84**
*0.
029
0.1
86
0.1
45
Fem
ale
Pri
mar
yC
omp
leti
on0.
639
0.48
00.
605
0.48
90.
034*
**0.
005
0.0
48*
0.0
27
Mal
eP
rim
ary
Com
ple
tion
0.74
50.
436
0.72
20.
448
0.02
3***
0.00
50.0
32
0.0
20
Sch
ool
sp
er10
00S
chool
-Age
dC
hil
dre
n2.
220
1.08
91.
991
0.79
00.
229*
**0.
006
––
Mat
rili
nea
l0.
123
0.32
90.
109
0.31
20.
014*
*0.
002
-0.1
56**
0.0
50
Fem
ale
Agr
icu
ltu
re0.
036
0.18
50.
034
0.18
20.
001
0.00
1-0
.074**
0.0
34
Age
34.4
517.
041
34.4
147.
131
0.03
60.
055
0.0
36
0.0
52
Pan
elB
.S
chool
En
roll
men
tS
amp
le(A
ges
5-2
2)
Fem
ale
En
roll
men
t0.
610
0.48
80.
577
0.49
40.
033*
**0.
004
0.0
06
0.0
15
Mal
eE
nro
llm
ent
0.63
50.
481
0.61
90.
486
0.01
6***
0.00
4-0
.009
0.0
11
Mat
rili
nea
l0.
107
0.31
00.
126
0.33
2-0
.019
***
0.00
2-0
.136**
0.0
48
Fem
ale
Agr
icu
ltu
re0.
035
0.18
40.
045
0.20
8-0
.010
***
0.00
1-0
.054*
0.0
29
Note
s:T
his
tab
lepre
sents
sum
mar
yst
atis
tics
for
the
1995
Ind
ones
iaIn
terc
ensa
ld
ata.
Col
um
ns
1an
d2
pre
sent
mea
ns
and
stan
dar
dd
evia
tion
sfo
ret
hn
icit
ies
that
trad
itio
nal
lyp
ract
ice
bri
de
pri
ce.
Col
um
ns
3an
d4
pre
sent
sum
mary
stati
s-ti
csfo
rn
on-b
rid
epri
ceet
hn
icit
ies.
Col
um
n5
pre
sents
the
diff
eren
cein
mea
ns
and
colu
mn
6p
rese
nts
the
stan
dard
erro
rof
the
diff
eren
ce.
Col
um
n7
pre
sents
the
coeffi
cien
ton
bri
de
pri
cein
are
gres
sion
ofth
ero
w-n
ame
vari
ab
les
on
bri
de
pri
cest
atu
s,d
istr
ict
ofb
irth
fixed
effec
ts,
and
inth
eca
seof
the
sch
ool
con
stru
ctio
nsa
mp
le,
trea
ted
or
non
-tre
ate
dco
hor
tfi
xed
effec
ts.
Col
um
n8
pre
sents
the
stan
dar
der
ror
ofth
eb
rid
ep
rice
coeffi
cien
t,cl
ust
ered
at
the
dis
tric
tle
vel.
29

Tab
le4:
Bri
de
Pri
ceS
tatu
san
dth
eIN
PR
ES
Sch
ool
Exp
ansi
onin
the
1995
Ind
ones
iaIn
terc
ensa
lD
ata
(1)
(2)
(3)
(4)
(5)
Ind
icato
rvari
ab
lefo
rcom
ple
tion
of
pri
mary
sch
ool
Mal
esF
emal
esF
emal
esB
.P.
Fem
ales
Non
B.P
.F
emale
s
IPost
k×Intensity
d0.
012*
-0.0
020.
023*
*-0
.001
(0.0
06)
(0.0
07)
(0.0
12)
(0.0
10)
IPost
k×Intensity
d×IBrideP
rice
e0.
024*
*(0
.012
)IPost
k×Intensity
d×INoBrideP
rice
e-0
.001
(0.0
10)
Eth
nic
ity
FE
s×IPost
kN
NY
YY
Eth
nic
ity
FE
sN
NY
YY
Eth
nic
ity
FE
s×Intensity
dN
NY
YY
Dis
tric
tF
Es×IBrideP
rice
eN
NY
NN
Du
flo
Con
trol
s×IBrideP
rice
eN
NY
NN
Du
flo
Con
trol
sY
YY
YY
Dis
tric
tF
Es
YY
YY
YC
ohor
tF
Es×IBrideP
rice
eN
NY
NN
Coh
ort
FE
sY
YY
YY
Nu
mb
erof
obse
rvat
ion
s75
,286
76,9
5964
,426
9,70
755,6
96
Nu
mb
erof
clu
ster
s25
825
524
015
5217
Ad
just
edR
20.
124
0.17
90.
185
0.17
40.1
85
Note
s:E
du
cati
onat
tain
men
td
ata
are
taken
from
the
1995
Ind
ones
iaIn
terc
ensa
lS
urv
eyan
dm
erged
wit
het
hn
icit
yle
vel
nor
md
ata
from
Murd
ock
’s(1
967)
Eth
nog
raphic
Atl
as.IPost
kre
fers
toth
etr
eate
dco
hor
t,b
orn
bet
wee
n19
68an
d19
72.
Th
eu
ntr
eate
dco
hor
tis
bor
nb
etw
een
1950
and
1962.Intensity
d
isth
enu
mb
erof
sch
ool
sb
uil
tin
ad
istr
ict
per
1,00
0p
eop
lein
the
sch
ool
-age
dp
opu
lati
on
.A
llre
-gr
essi
ons
incl
ud
ed
istr
ict-
of-b
irth
fixed
effec
ts,
coh
ort
fixed
effec
ts,
and
the
inte
ract
ion
ofco
hort
fixed
effec
tsw
ith
nu
mb
erof
sch
ool
-age
dch
ild
ren
inth
ed
istr
ict
in19
71,
wit
hth
een
roll
men
tra
tein
1971
and
wit
hth
ere
gen
cyle
vel
imp
lem
enta
tion
ofa
wat
eran
dsa
nit
atio
np
rogr
amun
der
INP
RE
S.
Th
esu
bsc
rip
td
ind
exes
dis
tric
ts,i
ind
ivid
ual
s,k
coh
orts
,an
de
eth
nic
grou
ps.
Sta
nd
ard
erro
rsare
clu
s-te
red
atth
eb
irth
-dis
tric
tle
vel.
30
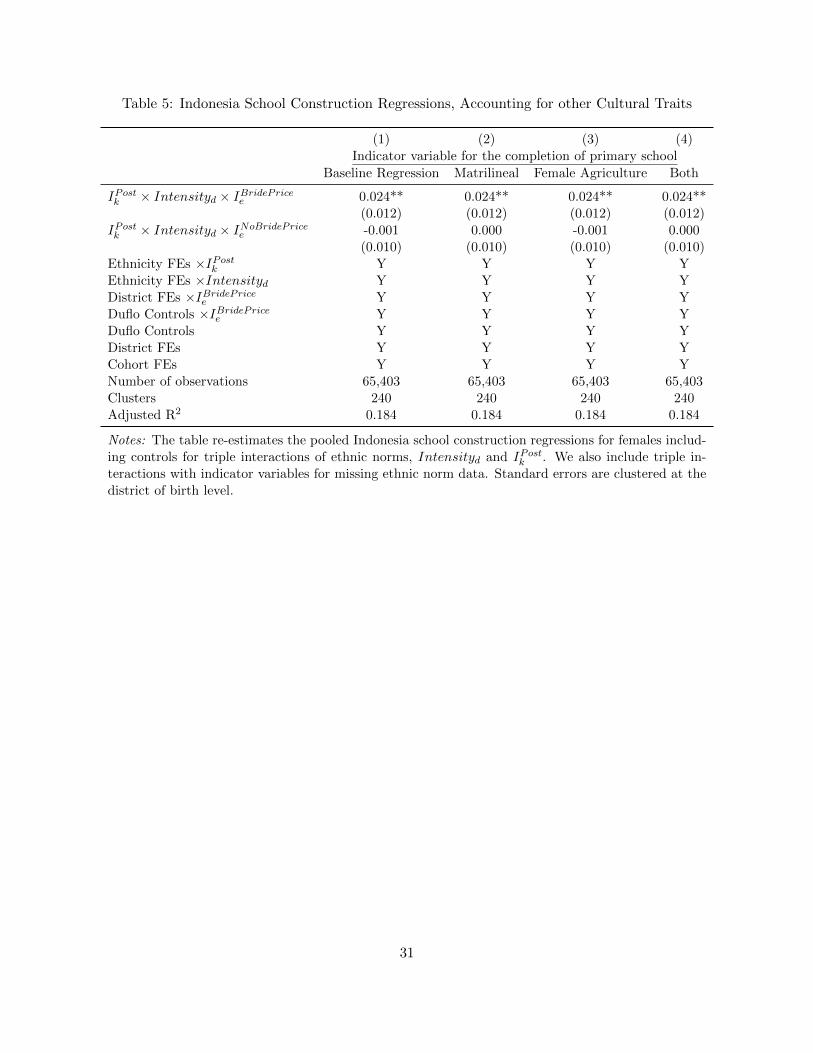
Table 5: Indonesia School Construction Regressions, Accounting for other Cultural Traits
(1) (2) (3) (4)Indicator variable for the completion of primary school
Baseline Regression Matrilineal Female Agriculture Both
IPostk × Intensityd × IBridePrice
e 0.024** 0.024** 0.024** 0.024**(0.012) (0.012) (0.012) (0.012)
IPostk × Intensityd × INoBridePrice
e -0.001 0.000 -0.001 0.000(0.010) (0.010) (0.010) (0.010)
Ethnicity FEs ×IPostk Y Y Y Y
Ethnicity FEs ×Intensityd Y Y Y YDistrict FEs ×IBridePrice
e Y Y Y YDuflo Controls ×IBridePrice
e Y Y Y YDuflo Controls Y Y Y YDistrict FEs Y Y Y YCohort FEs Y Y Y YNumber of observations 65,403 65,403 65,403 65,403Clusters 240 240 240 240Adjusted R2 0.184 0.184 0.184 0.184
Notes: The table re-estimates the pooled Indonesia school construction regressions for females includ-ing controls for triple interactions of ethnic norms, Intensityd and IPost
k . We also include triple in-teractions with indicator variables for missing ethnic norm data. Standard errors are clustered at thedistrict of birth level.
31
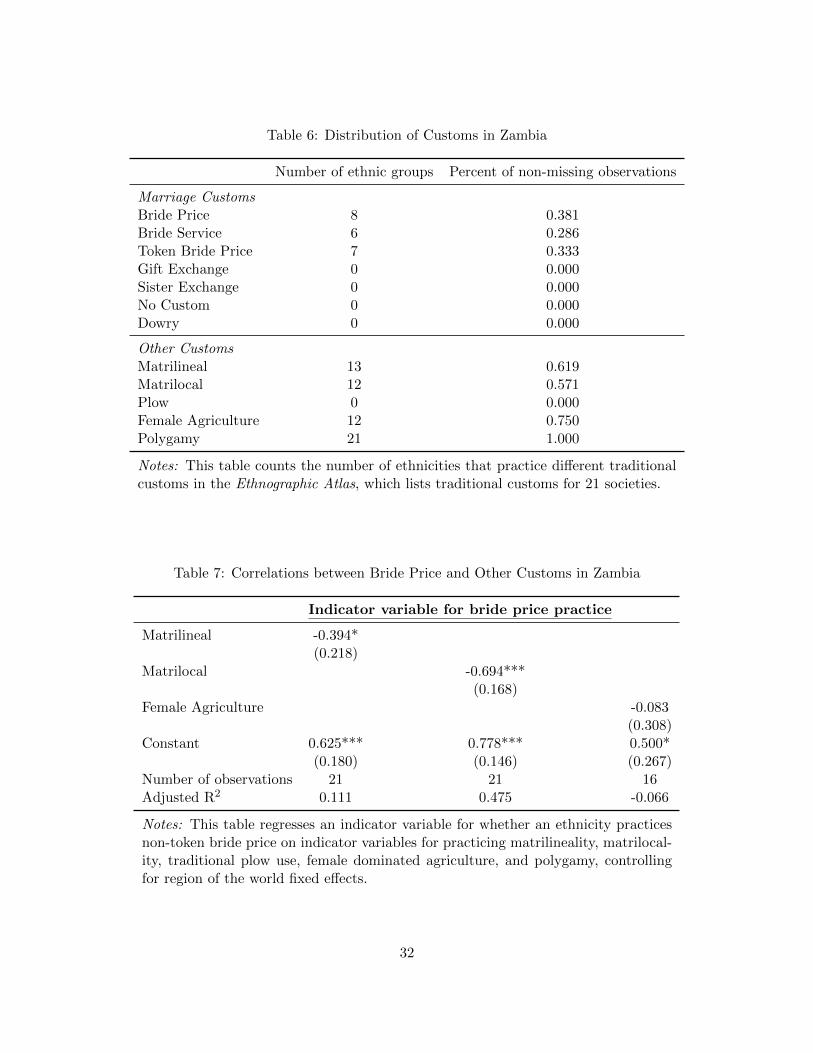
Table 6: Distribution of Customs in Zambia
Number of ethnic groups Percent of non-missing observations
Marriage CustomsBride Price 8 0.381Bride Service 6 0.286Token Bride Price 7 0.333Gift Exchange 0 0.000Sister Exchange 0 0.000No Custom 0 0.000Dowry 0 0.000
Other CustomsMatrilineal 13 0.619Matrilocal 12 0.571Plow 0 0.000Female Agriculture 12 0.750Polygamy 21 1.000
Notes: This table counts the number of ethnicities that practice different traditionalcustoms in the Ethnographic Atlas, which lists traditional customs for 21 societies.
Table 7: Correlations between Bride Price and Other Customs in Zambia
Indicator variable for bride price practice
Matrilineal -0.394*(0.218)
Matrilocal -0.694***(0.168)
Female Agriculture -0.083(0.308)
Constant 0.625*** 0.778*** 0.500*(0.180) (0.146) (0.267)
Number of observations 21 21 16Adjusted R2 0.111 0.475 -0.066
Notes: This table regresses an indicator variable for whether an ethnicity practicesnon-token bride price on indicator variables for practicing matrilineality, matrilocal-ity, traditional plow use, female dominated agriculture, and polygamy, controllingfor region of the world fixed effects.
32

Tab
le8:
Su
mm
ary
Sta
tist
ics
from
the
1996
,20
01,
and
2007
Zam
bia
Dem
ogra
ph
ican
dH
ealt
hS
urv
eys
(1)
(2)
(3)
(4)
(5)
(6)
(7)
(8)
Bri
de
Pri
ceN
on-B
rid
eP
rice
Fu
llS
am
ple
Mea
nS
DM
ean
SD
Diff
eren
ceS
eC
oeffi
cien
tS
e
Sch
ool
En
roll
men
tS
amp
le(A
ges
5to
22)
Fem
ale
En
roll
men
t0.
507
0.50
00.
489
0.50
00.
018*
*0.
004
0.0
13*
0.0
07
Mal
eE
nro
llm
ent
0.56
00.
496
0.57
60.
494
-0.0
160.
004
0.0
04
0.0
07
Age
12.5
505.
100
12.4
725.
054
0.07
80.
116
0.0
04
0.1
22
Sch
ool
s/A
rea
0.08
60.
217
0.08
70.
222
-0.0
010.
002
-0.0
07
0.0
06
Mat
rili
nea
l0.
012
0.10
90.
834
0.37
2-0
.822
***
0.00
2-0
.725***
0.0
40
Fem
ale
Agr
icu
ltu
re0.
902
0.29
80.
918
0.27
4-0
.016
***
0.00
2-0
.037
0.0
22
Wea
lth
Ind
ex3.
099
1.41
03.
139
1.38
3-0
.041
***
0.01
7-0
.004
0.0
98
Sch
ool
Con
stru
ctio
nS
amp
le(A
ges
5to
12)
Fem
ale
En
roll
men
t0.
578
0.49
40.
558
0.49
70.
021*
*0.
004
0.0
13*
0.0
07
Mal
eE
nro
llm
ent
0.55
50.
497
0.55
60.
497
-0.0
010.
004
0.0
04
0.0
07
Age
8.36
92.
273
8.38
22.
279
-0.0
140.
116
0.0
04
0.1
22
Sch
ool
s/A
rea
0.08
40.
215
0.08
30.
215
0.00
10.
002
-0.0
07
0.0
06
Mat
rili
nea
l0.
013
0.11
20.
839
0.36
7-0
.827
***
0.00
2-0
.725***
0.0
40
Fem
ale
Agr
icu
ltu
re0.
904
0.29
50.
914
0.28
0-0
.011
***
0.00
2-0
.037
0.0
22
Wea
lth
Ind
ex2.
947
1.40
82.
983
1.36
4-0
.036
***
0.01
7-0
.004
0.0
98
Fem
ale
Em
plo
ym
ent
Rat
e(A
llA
du
lts
25-4
5)0.
613
0.48
70.
672
0.46
9-0
.059
***
0.00
7-0
.014
0.0
13
Note
s:T
his
table
pre
sents
sum
mar
yst
atis
tics
by
bri
de
pri
cest
atu
sin
the
pool
ed19
96,
2001
,an
d2007
rou
nd
sof
the
Zam
bia
DH
S.
Th
efi
rst
pan
elof
the
tab
lep
rese
nts
sum
mar
yst
atis
tics
for
the
sam
ple
ofch
ild
ren
aged
5-2
2u
sed
inth
een
roll
men
tan
alysi
san
dth
ese
con
dp
anel
pre
sents
sum
mar
yst
atis
tics
for
the
sam
ple
ofch
ild
ren
aged
5-1
2u
sed
inth
esc
hool
con
stru
ctio
nan
alysi
s.C
olu
mn
s1
and
2p
rese
nt
mea
ns
and
stan
dar
der
rors
for
the
bri
de
pri
cegro
up
,an
dco
lum
ns
3an
d4
pre
sent
mea
ns
and
stan
dar
der
rors
for
the
non
-bri
de
pri
cegr
oup
.C
olu
mn
5p
rese
nts
the
diff
eren
cein
the
mea
ns
and
colu
mn
6gi
ves
the
stan
dar
der
ror
ofth
ed
iffer
ence
.C
olu
mn
7is
the
coeffi
cien
ton
bri
de
pri
cest
atu
sin
are
gre
ssio
nof
the
row
-nam
eva
riab
leon
bri
de
pri
cest
atu
san
dd
istr
ict
and
yea
rfi
xed
effec
ts.
Col
um
n8
isth
est
an
dard
erro
rof
this
coeffi
cien
tcl
ust
ered
atth
ed
istr
ict
leve
l.
33

Table 9: School Construction and Primary School Enrollment in the Pooled Zambia DHS (1996,2001, and 2007)
(1) (2) (3) (4) (5) (6)Dependent variable: School enrollment indicator
All Males Females Females B.P. Females Non B.P. Females
Schoolsdt/Aread 0.024 0.030 0.010 0.071** -0.016(0.020) (0.020) (0.026) (0.033) (0.035)
Schoolsdt/Aread × IBridePricee 0.071**
(0.035)Schoolsdt/Aread × INoBridePrice
e -0.016(0.035)
Age by Bride Price FE Y Y Y Y Y YEthnicity by Round FE Y Y Y Y Y YEthnicity by District FE Y Y Y Y Y YNumber of observations 24,273 11,996 12,277 12,277 3,514 8,763Number of clusters 70 70 70 70 64 69Adjusted R2 0.400 0.405 0.394 0.394 0.434 0.378
Notes: This table examines the differential impact of school building in Zambia on bride price and non-brideprice females. The sample consists of children aged 5–12 at the time of the survey in the 1996, 2001, and2007 rounds of the DHS. The treatment variable, Schoolsdt is the number of schools built in a district d byyear t (the survey round of the DHS). This is normalized by the area of the district, calculated using ArcGIS,Aread. Standard errors are clustered at the district level.
34

Table 10: Placebo Test of School Construction and Primary School Enrollment by Bride PriceStatus in the Pooled Zambia DHS (1996, 2001, and 2007)
(1) (2) (3) (4) (5) (6)Dep var: School enrollment indicator
All Male Females Females B.P. Females Non B.P. Females
Schoolsd,t+1/Aread -0.009 0.030 -0.093 -0.215* -0.050(0.054) (0.061) (0.077) (0.122) (0.100)
Schoolsd,t+1/Aread × IBridePricee -0.217*
(0.123)Schoolsd,t+1/Aread × INoBridePrice
e -0.046(0.105)
Schoolsd,t/Aread 0.032 0.002 0.098 0.278** 0.031(0.055) (0.066) (0.076) (0.121) (0.102)
Schoolsd,t/Aread × IBridePricee 0.277**
(0.120)Schoolsd,t/Aread × INoBridePrice
e 0.021(0.107)
Number of observations 24,273 11,996 12,277 12,277 3,514 8,763Adjusted R2 0.400 0.404 0.394 0.393 0.434 0.378Clusters 70 70 70 70 64 69
Notes: This table examines the differential impact of present and future school building in Zambia on brideprice and non-bride price females. The sample consists of children aged 5–12 at the time of the survey in the1996, 2001, and 2007 rounds of the DHS. The treatment variable, Schoolsdt is the number of schools built ina district d by year t (the survey round of the DHS). This is normalized by the area of the district, calculatedusing ArcGIS, Aread. Schoolsd,t+1 is the number of schools built by 2001 in 1996, the number of schools builtby 2007 in 2001, and the number of schools built by 2012 in 2007. Standard errors are clustered at the districtlevel.
35

Tab
le11
:D
eter
min
ants
ofB
rid
eP
rice
inth
eIF
LS
(1)
(2)
(3)
(4)
(5)
(6)
(7)
(8)
Dep
en
dent
Vari
ab
le:
Log
Bri
de
Pri
ce
Am
ou
nt
I(Com
pletedPrimary
) i0.
656*
**0.
621*
**0.
592*
**0.
544*
**0.
436*
**0.4
70***
0.4
58***
0.4
14***
(0.0
73)
(0.0
77)
(0.0
79)
(0.0
73)
(0.0
79)
(0.0
79)
(0.0
81)
(0.0
74)
I(Com
pletedJuniorSecondary
) i0.
644*
**0.
653*
**0.
617*
**0.
620*
**0.
451*
**0.4
88***
0.4
73***
0.4
61***
(0.0
73)
(0.0
77)
(0.0
79)
(0.0
72)
(0.0
78)
(0.0
77)
(0.0
79)
(0.0
72)
I(College)
i0.
837*
**0.
826*
**0.
824*
**0.
887*
**0.
400*
**0.3
71***
0.3
89***
0.4
76***
(0.0
81)
(0.0
83)
(0.0
87)
(0.0
80)
(0.0
94)
(0.0
94)
(0.0
98)
(0.0
90)
MarriageAge i
0.01
40.
016
0.00
60.
002
-0.0
01
0.0
07
-0.0
08
(0.0
14)
(0.0
14)
(0.0
13)
(0.0
14)
(0.0
14)
(0.0
13)
(0.0
14)
MarriageAge2 i
-0.0
00-0
.000
-0.0
00-0
.000
0.0
00
-0.0
00
0.0
00
(0.0
00)
(0.0
00)
(0.0
00)
(0.0
00)
(0.0
00)
(0.0
00)
(0.0
00)
I(BridePrice
) e0.
730*
**0.6
52***
(0.0
67)
(0.0
66)
I(HusbandCom
pletedPrimary
) i0.
297*
**0.2
34***
0.2
45***
0.1
94**
(0.0
90)
(0.0
88)
(0.0
90)
(0.0
82)
I(HusbandCom
pletedJuniorSecondary
) i0.
339*
**0.3
30***
0.2
94***
0.3
54***
(0.0
81)
(0.0
80)
(0.0
82)
(0.0
75)
I(HusbandCollege)
i0.
655*
**0.6
38***
0.6
24***
0.5
60***
(0.0
94)
(0.0
93)
(0.0
97)
(0.0
90)
HusbandMarriageAge i
0.0
09
-0.0
13
0.0
14
(0.0
15)
(0.0
15)
(0.0
14)
HusbandMarriageAge2 i
-0.0
00
0.0
00
-0.0
00
(0.0
00)
(0.0
00)
(0.0
00)
Yea
rof
Mar
riag
ef.
e.Y
YY
YY
YY
YE
thn
icit
yf.
e.N
NN
YN
NN
YS
urv
eyR
oun
df.
e.Y
YY
YY
YY
YO
bse
rvat
ion
s5,
403
5,07
64,
647
5,07
65,
064
4,9
34
4,5
20
4,9
34
Ad
just
edR
-Squ
ared
0.42
60.
426
0.45
00.
490
0.44
10.4
18
0.4
35
0.4
85
Note
s:C
olu
mn
sre
gres
sth
en
atu
ral
log
ofb
rid
ep
rice
pay
men
tsat
the
tim
eof
mar
riag
eon
vari
ous
cova
riate
s.T
he
mea
sure
sare
take
nfr
omro
un
ds
3an
d4
ofth
eIn
don
esia
Fam
ily
Lif
eS
urv
ey.
Rob
ust
stan
dar
der
rors
are
rep
orte
din
pare
nth
eses
.
36

Tab
le12
:D
eter
min
ants
ofB
rid
eP
rice
inZ
amb
ia
(1)
(2)
(3)
(4)
(5)
(6)
(7)
(8)
Dep
en
dent
vari
ab
le:
Log
Bri
de
Pri
ce
Am
ou
nt
I(Primary
) i0.
497*
0.52
5*0.5
36*
0.4
890.4
740.
473
0.4
73
0.4
20
(0.2
95)
(0.3
03)
(0.2
97)
(0.3
16)
(0.2
97)
(0.3
23)
(0.3
17)
(0.3
35)
I(JuniorSecondary
) i0.
279*
*0.
270*
*0.
271*
*0.
262*
*0.
273*
*0.
264*
*0.2
65**
0.2
67**
(0.1
23)
(0.1
24)
(0.1
23)
(0.1
27)
(0.1
23)
(0.1
26)
(0.1
25)
(0.1
30)
I(Secondary
) i0.
409*
**0.
454*
**0.
404*
**0.
402
***
0.4
31**
*0.4
79***
0.4
38***
0.4
46***
(0.1
17)
(0.1
24)
(0.1
25)
(0.1
30)
(0.1
25)
(0.1
36)
(0.1
35)
(0.1
43)
I(M
arriageAge)
i-0
.033
6-0
.024
5-0
.0287
-0.0
702
-0.0
633
-0.0
626
(0.1
20)
(0.1
22)
(0.1
30)
(0.1
22)
(0.1
22)
(0.1
28)
I(M
arriageAge)
2 i0.
000
-0.0
00
-0.0
00
0.00
10.0
01
0.0
01
(0.0
0251)
(0.0
03)
(0.0
03)
(0.0
03)
(0.0
03)
(0.0
03)
I(BridePrice
) e0.3
03**
*0.3
15***
(0.0
975)
(0.1
01)
I(HusbandPrimary
) i0.
932**
*0.
847*
**
0.9
24***
1.1
35***
(0.3
03)
(0.3
17)
(0.2
84)
(0.2
78)
I(HusbandJuniorSecondary
) i-0
.180
-0.1
44
-0.1
46
-0.1
99
(0.1
56)
(0.1
58)
(0.1
56)
(0.1
66)
I(HusbandSecondary
) i0.0
880.
084
0.0
54
0.0
74
(0.1
20)
(0.1
21)
(0.1
21)
(0.1
28)
I(HusbandMarriageAge)
i-0
.001
-0.0
01
-0.0
01
(0.0
01)
(0.0
01)
(0.0
01)
I(HusbandMarriageAge)
2 i0.
000
0.0
00
0.0
00
(0.0
00)
(0.0
00)
(0.0
00)
Yea
rof
mar
riag
ef.
e.Y
YY
YY
YY
YE
thnic
ity
f.e.
NN
NY
NN
NY
Obse
rvat
ions
442
442
439
439
442
430
427
427
R-s
quar
ed0.3
510.3
600.3
680.3
910.3
600.
372
0.3
82
0.4
06
Note
s:C
olum
ns
regr
ess
the
nat
ura
llo
gof
bri
de
pri
cepay
men
tsat
the
tim
eof
marr
iage
onva
rious
cova
riate
s.T
he
mea
-su
res
are
take
nfr
omth
eZ
FP
S.
Robust
stan
dar
der
rors
are
rep
orte
din
pare
nth
eses
.
37

Tab
le13:
Rea
sons
why
Bri
de
Pri
ceIn
crea
ses
wit
hE
du
cati
onin
Zam
bia
Rea
son
sw
hy
bri
de
pri
cein
crea
ses
wit
hed
uca
tion
(1)
(2)
(3)
Un
pro
mp
ted
Pro
mp
ted
Not
are
ason
reas
onre
ason
Imp
rove
sth
eb
rid
e’s
skil
lsin
the
hou
seob
s.21
748
572
815
.17%
33.9
2%50
.91%
Imp
rove
sth
eb
rid
e’s
kn
owle
dge
and
skil
lsas
am
oth
erob
s.17
761
363
112
.46%
43.1
4%44
.41%
Imp
rove
sth
ew
oman
’sea
rnin
gp
oten
tial
obs.
213
720
481
15.0
6%50
.92%
34.0
2%Im
pro
ves
the
lite
racy
of
chil
dre
nob
s.89
740
580
6.32
%52
.52%
41.1
6%B
rid
e’s
par
ents
shou
ldto
be
com
pen
sate
dfo
rin
vest
men
tsob
s.79
346
117
855
.38%
32.1
9%12
.43%
Isas
soci
ate
dw
ith
her
par
ents
bei
ng
rich
obs.
110
521
789
7.75
%36
.69%
55.5
6%O
ther
reaso
ns
obs.
27-
-3.
96%
--
Note
s:D
ata
from
the
firs
tw
ave
ofZ
FP
S(F
all
2014
).
38

Table 14: Relationship between Bride Price and Enrollment for Females in Indonesia and Zambia
(1) (2) (3) (4)Indicator variable equal to 1 if enrolled
Indonesia Zambia
IBridePricee 0.042*** 0.068*** 0.037*** 0.034***
(0.013) (0.014) (0.013) (0.014)[0.016, 0.067] [0.049,0.093] [0.013, 0.060] [0.010, 0.067]
Age Controls Y Y Y YDistrict by Survey Year FE N N Y YEthnicity Controls N Y N YNumber of observations 103,067 101,241 23,734 20,000Adjusted R2 0.412 0.413 0.350 0.355Clusters 26 22 21 16
The table regresses an indicator variable for whether a child between the ages of 5 and22 is enrolled in school on an indicator variable for whether the child is a member of anethnicity with non-token bride price norms. The Indonesia regressions use the 1995 In-donesia Intercensal data, and the Zambia regressions use the pooled 1996, 2001, and 2007Zambia DHS data. Age controls consist of age and age squared, and cultural norm con-trols consist of indicator variables for belonging to a matrilineal ethnicity and belongingto an ethnicity with a tradition of female agriculture. Standard errors, which are reportedin parentheses, are clustered at the ethnicity level. Wild boot-strapped 95 percent confi-dence intervals are reported in square brackets.
39

Table 15: The Relationship between Bride Price Status and Test-Scores for Primary-School Femalesin Indonesia
(1) (2)Total Test Score
IBridePricee -0.089** -0.079**
(0.036) (0.033)[-0.143,-0.0272] [-0.130, -0.030]
Cultural Norms Controls N YAge by Survey Year FE Y YProvince by Year-Tested FE Y YNumber of observations 2,923 2,901Clusters 13 11Adjusted R2 0.092 0.092
Notes: This table tests whether belonging to a bride price eth-nicity predicts lower test scores for females. The table uses self-reported data on test scores from the IFLS rounds 3 and 4 andrestricts the sample to test-takers who took the Ebtanas (thetesting regime prior to 2001). Since the Ebtanas was standard-ized at the province level, the table includes province by year-tested fixed effects. The outcome variable is the respondent’sself-reported total test score, normalized to have a mean of 0and a standard deviation of 1. Standard errors, in parenthe-ses, are clustered at the ethnicity level. Cultural norm controlsconsist of indicator variables for female-dominated agricultureand matrilineality. Confidence intervals obtained using the wildbootstrap proceedure with 100 draws appear in square brackets.
40

Table 16: Determinant of bride price in qualitative survey answers to ZFPS (2014)
Think about the factors that affect bride price today:what is the ... most important factor?
first second third not listed
Education obs 543 223 152 53837.29% 15.32% 10.44% 36.95%
Good morals obs 191 283 216 76613.12% 19.44% 14.84% 52.61%
Family values obs 214 272 206 76414.70% 18.68% 14.15% 52.47%
Virginity obs 137 186 179 9549.41% 12.77% 12.29% 65.52%
Age obs 41 94 141 11802.82% 6.46% 9.68% 81.04%
Tribe obs 104 117 190 10457.14% 8.04% 13.05% 71.77%
Other obs 144 118 85 11099.89% 8.10% 5.84% 76.17%
Notes: Data from the first wave of ZFPS (Fall 2014).
41

Table 17: The Relationship between Education and Wages for Bride Price and Non-Bride PriceFemales in Indonesia
(1) (2) (3)Employed ln (Wage) Wealth Index
IBridePricee -0.031 0.011 0.001
(0.030) (0.032) (0.092)[-0.079,0.018] [-0.045, 0.058] [-0.165, 0.165]
I(PrimarySchool)i -0.059*** 0.281*** 0.738***(0.004) (0.015) (0.013)
[-0.067, -0.052] [0.256, 0.305] [0.715,0.764]I(PrimarySchool)i × IBridePrice
e 0.002 0.083 -0.120**(0.018) (0.058) (0.052)
[-0.026, 0.033] [-0.026 , 0.177] [ -0.204, -0.039]I(Junior Secondary)i 0.092*** 0.827*** 0.991***
(0.010) (0.021) (0.031)[0.076, 0.108] [0.792, 0.863] [0.941,1.045]
I(Junior Secondary)i × IBridePricee 0.045 -0.106 -0.137**
(0.031) (0.071) (0.061)[-0.006, 0.097] [-0.220,0.020] [-0.235, -0.016]
I(College)i 0.179*** 0.184*** 0.315***(0.007) (0.016) (0.060)
[0.164, 0.190] [0.156, 0.213] [0.214, 0.413]I(College)i × IBridePrice
e -0.036 -0.032 -0.196(0.050) (0.045) (0.130)
[-0.119, 0.046] [-0.129, 0.055] [-0.427, 0.066]District FE Y Y YNumber of observations 84,501 12,423 84,491Clusters 26 23 26Adjusted R2 0.108 0.503 0.375
Notes: This table regresses employment status, formal sector wages, and an index ofhousehold assets from the 1995 Indonesia Intercensual data on educational attainment,allowing the returns to education to differ for bride price and non-bride price females.Wage or salary was only reported for formal sector employees. The standard errors areclustered at the ethnicity level. The sample consists of women between the ages of 25and 45.
42

Table 18: The Relationship between Education and Wages for Bride Price and Non-Bride PriceFemales in Zambia
(1) (2) (3) (4)Employment Wealth Index Child Stunting Child Malnutrition
I(Primary)i 0.044*** 0.274*** -0.022* -0.002(0.014) (0.024) (0.012) (0.002)
[0.010, 0.069] [0.223, 0.319] [-0.042, 0.001] [-0.005, 0.001]I(Primary)i × IBridePrice
e -0.024 -0.058 0.035 -0.006(0.036) (0.131) (0.025) (0.008)
[-0.090, 0.041] [-0.302, 0.193] [-0.019, 0.083] [-0.023, 0.008]I(Secondary)i 0.049** 0.873*** -0.068*** -0.005**
(0.016) (0.050) (0.007) (0.002)[0.022, 0.077] [0.772, 0.966] [-0.079, -0.055] [-0.009, -0.004]
I(Secondary)i × IBridePricee 0.025 -0.070 0.006 0.001
(0.019) (0.051) (0.028) (0.004)[-0.009, 0.061] [-0.155, 0.035] [-0.038, 0.057] [-0.004, 0.007]
I(SecondaryP lus)i 0.238*** 0.517*** -0.076*** -0.005(0.012) (0.085) (0.014) (0.007)
[0.216, 0.258] [0.391, 0.671] [-0.097, -0.054] [-0.018, 0.007]I(SecondaryP lus)i × IBridePrice
e 0.009 0.080 -0.036* 0.005(0.027) (0.196) (0.020) (0.020)
[-0.040, 0.060] [-0.322, 0.512] [-0.068, -0.006] [-0.032, 0.041]IBridePricee -0.025 -0.000 -0.036* 0.010
(0.045) (0.101) (0.019) (0.007)[-0.100, 0.050] [-0.180, 0.174] [-0.066, -0.003] [-0.003, 0.025]
District × Year FE Y Y Y YAge FE Y Y Y YF-test of Bride Price Interact Coefficients 1.29 0.80 1.95 0.35Number of observations 11,056 3,934 16,862 16,862Clusters 21 21 21 21Adjusted R2 0.171 0.522 0.075 0.010
Notes: This table regresses whether a female works, the household wealth index, child stunting (having a height3 standard deviations below the average for a healthy child according to a study in six baseline countries chosenby the WHO) and child malnutrition (having a height 3 standard deviations below the healthy-child average insix baseline countries chosen by the WHO) on a female’s education, allow the effects of education to differ forbride price and non-bride price females. An observation in columns 1 and 2 is a women over 25 years of age andless than or equal to 45. An observation in columns 2 and 3 is a child aged 0 to 5. The table uses data from the1996, 2001, and 2007 rounds of the Zambia DHS. The standard errors are clustered at the ethnicity level. Wildbootstrapped 95 percent confidence intervals appear below in brackets.
43

Table 19: Tests for Alternative Drivers of the Bride Price Effect in Zambia and Indonesia
(1) (2) (3) (4)Indonesia Zambia
Wealth Index Number of Children Born Wealth Index Number of Children Born
IBridePricee -0.006 0.223*** -0.004 -0.007
(0.059) (0.065) (0.126) (0.072)[-0.110, 0.093] [0.108, 0.357] [-0.228, 0.248] [ -0.149, 0.140]
Age FE N Y N YDistrict FE Y Y Y YSurvey Year FE N N Y YNumber of observations 132,511 79,140 32,669 11,076Clusters 26 26 21 21Adjusted R2 0.224 0.283 0.401 0.356
This table uses data from the Indonesia 1995 Intercensal survey and the pooled 1996, 2001, and 2007 Demographicand Health Surveys to investigate the relationship between bride price norms and other household or individualcharacteristics. In Indonesia, we construct the wealth index as the first factor of a principal components analysisof indicator variables for owning a tv, radio, stove, buffet, bicycle boat, and motor boat. In Zambia, the wealthindex is constructed by the DHS using a variety of asset ownership data in each survey year. In columns 1 and 3,an observation is a household. Columns 2 and 4 include all women aged 25-45. Standard errors are clustered atthe ethnicity level. Wild bootstrapped 95 percent confidence intervals appear in brackets.
44

9 Figures
0
0.05
0.1
0.15
0.2
0.25
0 2 4 6 8 10 12 14 16 18 20
Prob
abili
ty D
ensi
ty
Daughters' returns to education
ΔV*(BridePricee=1,fS) ΔV*(BridePricee=0,fS)
fS decline fS decline
Figure 1: Distribution of girls’ returns to education and declines in the cost of education
Indo
nesi
a B
ride
Pric
e Pe
rcen
tage
s, b
y Pr
ovin
ce
F
LegendProvince BridePrice %
0.00
0.01 -0.10
0.11 -0.20
0.21 -0.30
0.31 -0.40
0.41 -0.50
0.51 -0.60
0.61 -0.70
0.71 -0.80
0.81 -0.90
0.91 -1.00
0 510 1,020 1,530 2,040255Kilometers
Figure 2: Geographic distribution of bride price customs in Indonesia
45

Figure 3: The distribution of bride price payments as percent of GDP per capita for bride priceethnicities in the 2000 and 2007 rounds of the Indonesia Family Life Survey.
Figure 4: The distribution of bride price payments as percent of GDP per capita for all couples inthe 2000 and 2007 rounds of the Indonesia Family Life Survey.
46

Zam
bia
Brid
e Pr
ice
Perc
enta
ges,
by
Dis
tric
t
F
LegendPercent Non-Token BridePrice
0.00
0.01 -0.10
0.11 -0.20
0.21 -0.30
0.31 -0.40
0.41 -0.50
0.51 -0.60
0.61 -0.70
0.71 -0.80
0.81 -0.90
0.91 -1.00
0 260 520 780 1,040130Kilometers
Figure 5: Geographic distribution of bride price customs in Zambia
Figure 6: Number of schools constructed each year in Zambia (Ministry of Education, Governmentof Zambia).
47
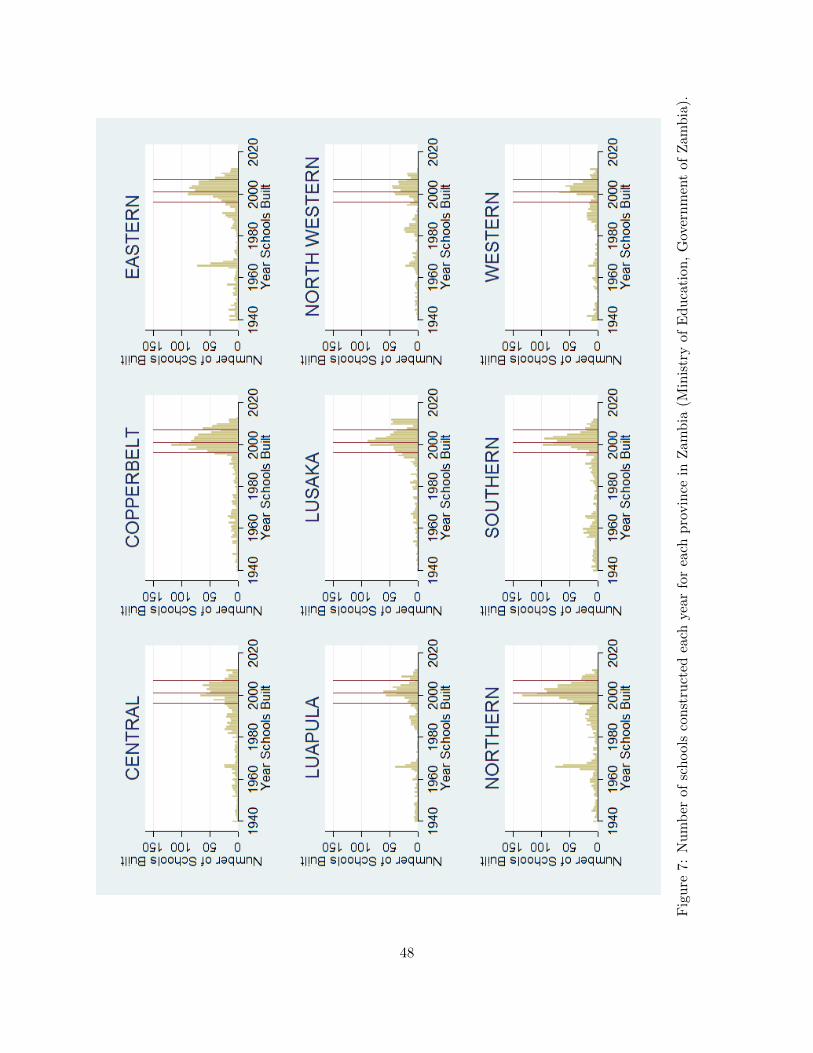
Fig
ure
7:N
um
ber
ofsc
hool
sco
nst
ruct
edea
chye
arfo
rea
chp
rovin
cein
Zam
bia
(Min
istr
yof
Ed
uca
tion
,G
over
nm
ent
of
Zam
bia
).
48

References
Aguero, Jorge M and Prashant Bharadwaj, “Do the more educated know more about health?Evidence from schooling and HIV knowledge in Zimbabwe,” Economic Development and CulturalChange, 2014, 62 (3), 489–517.
Ambrus, Attila, Erica Field, and Maximo Torero, “Muslim family law, prenuptial agree-ments, and the emergence of dowry in Bangladesh,” The Quarterly Journal of Economics, 2010,125 (3), 1349–1397.
Anderson, Siwan, “Why Dowry Payments Declined with Modernization in Europe but Are Risingin India,” Journal of Political Economy, 2003, 111 (2), 269–310.
, “The Economics of Dowry and Brideprice,” Journal of Economic Perspectives, 2007, 21 (4),151–174.
, “Why the Marriage Squeeze Cannot Cause Dowry Inflation,” Journal of Economic Theory,2007, 137, 140–152.
Bau, Natalie, “Cultural Norms, Strategic Behavior, and Human Capital Investment,” 2014.Mimeo, Harvard University.
Becker, Gary S, “Nobel Lecture: The Economic Way of Looking at Behavior,” Journal of PoliticalEconomy, 1993, 101 (3), 385–409.
, William HJ Hubbard, and Kevin M Murphy, “Explaining the Worldwide Boom in HigherEducation of Women,” Journal of Human Capital, 2010, 4 (3), 203–241.
Bishai, David and Shoshana Grossbard, “Far above rubies: Bride price and extramaritalsexual relations in Uganda,” Journal of Population Economics, 2010, 23 (4), 1177–1187.
Boomgaard, Peter, “Bridewealth and Birth Control: Low Fertility in the Indonesian Archipelago,1500–1900,” Population and Development Review, 2003, 29 (2), 197–214.
Boserup, Ester, Woman’s Role in Economic Development, London: George Allen and UnwinLtd., 1970.
Botticini, Maristella, “A Loveless Economy? Intergenerational Altruism and the Marriage Mar-ket in a Tuscan Town, 1415-1436,” Journal of Economic History, 1999, 59 (1), 104–121.
and Aloysius Siow, “Why Dowries?,” American Economic Review, 2003, 93 (4), 1385–1398.
Breierova, Lucia and Esther Duflo, “The Impact of Education on Fertility and Child Mortality:Do Fathers Really Matter Less than Mothers?,” 2002. Mimeo, M.I.T.
Cameron, A Colin and Douglas L Miller, “A Practitioner’s Guide to Cluster-Robust Infer-ence,” Journal of Human Resources, 2015, 50 (2), 317–372.
Cannonier, C and N Mocan, “Empowering Women Through Education: Evidence from SierraLeone,” 2012. NBER Working Paper 18016.
Card, David, “Earnings, Schooling, and Ability Revisited,” 1994. NBER Working Paper 4832.
49

Chondoka, Yizenge A, Traditional Marriages in Zambia: A Study in Cultural History, Cam-bridge: Cambridge University Press, 1988.
Dalton, George, ““Bridewealth” vs.“Brideprice” 1,” American Anthropologist, 1966, 68 (3), 732–738.
Dudley, Ochiel J, “Highlights of the Marriage Act, 2014,” May 2014. [Online; posted 20-April-2014].
Duflo, Esther, “Schooling and Labor Market Consequences of School Construction in Indonesia:Evidence from an Unusual Policy Experiment,” American Economic Review, 2001, 91 (4), 795–813.
Eryenyu, Jeff, “Letters: Payment of Bride Price Turns Women into Commodities,” September2014. [Online; posted 10-September-2014].
Fabinger, Michal and E. Glen Weyl, “Pass-through and Demand Forms,” UnpublishedManuscript 2013.
Fernandez, Raquel, “Women, Work and Culture,” Journal of the European Economic Associa-tion, 2007, 5 (2–3), 305–332.
, “Does Culture Matter?,” in Jess Benhabib, Matthew O. Jackson, and Alberto Bisin, eds.,Handbook of Social Economics, Vol. 1A, Amsterdam: North-Holland, 2011, pp. 481–510.
and Alessandra Fogli, “Culture: An Empirical Investigation of Beliefs, Work, and Fertility,”American Economic Journal: Macroeconomics, 2009, 1 (1), 146–177.
Gale, William G. and John Karl Scholz, “Intergenerational Transfers and the Accumulationof Wealth,” Journal of Economic Perspectives, 1994, 8 (4), 145–160.
Gaspart, Frederic and Jean-Philippe Platteau, “Strategic Behavior and Marriage Payments:Theory and Evidence from Senegal,” Economic Development and Cultural Change, 2010, 59 (1),149–185.
Geertz, Hildred, The Javanese Family: A Study of Kinship and Socialization, Prospect Heights,Illinois: Waveland Press Inc., 1961.
Giuliano, Paola, “The Role of Women in Society: from Pre-Industrial to Modern Times,” CESifoEconomic Studies, 2014, forthcoming.
Goody, Jack and S.J. Tambiah, Bridewealth and Dowry, Cambridge: Cambridge UniversityPress, 1973.
Griliches, Zvi, “Estimating the Returns to Schooling: Some Econometric Problems,” Economet-rica, 1977, 45 (1), 1–22.
Hague, Gill, Ravi. K Thiara, and Atuki Turner, “Bride-price and its links to domesticviolence and poverty in Uganda: A Participatory Action Research Study,” Women’s StudiesInternational Forum, 2011, 34, 550–561.
50
Hayek, Friedrich A., “The Use of Knowledge in Society,” American Economic Review, September1945, 35 (4), 519–30.
Heckman, James J, Lance J Lochner, and Petra E Todd, “Earnings Functions, Rates ofReturn and Treatment Effects: The Mincer Equation and Beyond,” Handbook of the Economicsof Education, 2006, 1, 307–458.
Jacoby, Hanan G., “The Economics of Polygyny in Sub-Saharan Africa: Female Productivity andthe Demand for Wives in Cote d’Ivoire,” Journal of Political Economy, 1995, 103 (5), 938–971.
Krig, Eileen Jensen, “Property, Cross-Cousin Marriage and the Family Cycle among theLobedu,” in Robert F. Gray and P.H. Gulliver, eds., The Family Estate in Africa, London:Routledge, 1964, p. Chapter 6.
Levine, David and Michael Kevane, “Are Investments in Daughters Lower when DaughtersMove Away? Evidence from Indonesia,” World Development, 2003, 31 (6), 1065–1084.
Mangena, Tendai and Sambulo Ndlovu, “Implication and Complications of Bride Price Pay-ment among the Shona and Ndebele of Zimbabwe,” International Journal of Asian Social Science,2013, 3 (2), 472–481.
Moore, Erin, “Translating Girls’ Empowerment: Gender, Adolescence and Transnational NGOsin Urban Uganda,” PhD Dissertation, University of Chicago 2016.
Mugisha, Joseph, “Activists Warn on Bride Price,” July 2008. [Online; posted 14-July-2008].
Mujuzi, Jamil Ddamulira, “Bride Wealth (Price) and Women’s Marriage – Related Rightsin Uganda: A Historical Constitutional Perspective and Current Developments,” InternationalJournal of Law, Policy and the Family, August 2010, 24 (3), 414–430.
Murdock, George Peter, “World Ethnographic Sample,” American Anthropologist, 1957, 59 (4),664–687.
, Ethnographic Atlas, Pittsburgh: University of Pittsburgh Press, 1967.
, Atlas of World Cultures, Pittsburgh: University of Pittsburgh Press, 1981.
Mutebi, Brian, “A Man in the Struggle for Women’s Rights,” January 2014. [Online; posted18-January-2014].
Muthegheki, Saad Baluku, Kule Sausi Crispus, and Naeemah Abrahams, “An Ex-ploratory Study of Bride Price and Domestic Violence in Bundibugyo District, Uganda,” 2012.Working Paper.
News, IRIN, ed., “TANZANIA: Study links payment of bride price to abuse of women,” May2006. [Online; posted 16-May-2006].
Osili, U and B Long, “Does Female Schooling Reduce Fertility? Evidence from Nigeria,” Journalof Development Economics, 2008, 87 (1), 57–75.
RAND, “Family Life Surveys Newsletter,” August 1999.
51

Rao, Vijayendra, “The Rising Price of Husbands: A Hedonic Analysis of Dowry Increases inRural India,” Journal of Political Economy, 1993, 101 (4), 666–677.
Roth, Alvin E., “Repugnance as a Constraint on Markets,” Journal of Economic Perspectives,2007, 21 (3), 37–58.
Sitompul, Lola Utama, “Tata Cara Penetapan Mahar Bagi Perempuan Nias (Studi Kasus PadaPerempuan Nias Yang Bekerja di Sektor Informal di Padang Bulan),” 2009. Working paper.
Tang, Sharon, “What’s Your Bride Price,” March 2014. [Online; posted 17-March-2014].
Tertilt, Michele, “Polygyny, Fertility, and Savings,” Journal of Political Economy, 2005, 113 (6),1341–1371.
, “Polygyny, Women’s Rights, and Development,” Journal of the European Economic Association,2006, 4 (2-3), 523–530.
Voice, Lusaka, ed., “Court Warns against High Bride Prices,” May 2014. [Online; posted 04-May-2014].
Vroklage, Bernh, “Bride Price or Dower,” Anthropos, 1952, Bd. 47, H. 1./2., 133–146.
Wendo, Charles, “African Women Denounce Bride Price,” The Lancet, February 2004, 363(9410), 716.
World Bank, World Development Report 2015: Mind, Society, and Behavior, Washington, D.C.:World Bank Publications, 2015.
52

Appendix for
Bride Price and Female Education
Nava Ashraf
Harvard University, NBER, BREAD
Natalie Bau
University of Toronto
Nathan Nunn
Harvard University, NBER, BREAD
Alessandra Voena
University of Chicago, NBER
15 October 2015
1

Appendix A: Proofs of the propositions in section 3
Proof of proposition 1
Proof (i) By the chain rule
∂P (S = 1|BP ,fS)∂fS
= −G′(∆V ∗(BridePricee,fS))∂∆V ∗(BridePricee,fS)
∂fS= −g(∆V
∗(BridePricee,fS))γ
< 0.
(1)
(ii) Since the cumulative distribution function G( ) is increasing and
∆V ∗(BridePricee = 0,fS)) =fSγ> ∆V ∗(BridePricee = 1,fS)) =
fS − β(1− γ)πγ
, (2)
we have that
P (S = 1|BridePricee = 1,fS)− P (S = 1|BridePricee = 0,fS)
=G(∆V ∗(BridePricee = 0,fS))−G(∆V ∗(BridePricee = 1,fS)) ≥ 0.
Proof of proposition 2
Proof Given the probability density function of ability f(ai), average ability of educated girls is
equal to:
E[ai|S = 1] = E[ai|ai > a∗(BridePricee,fS)] =∫ ∞
a∗(BridePricee,fS)aif(ai|ai > a∗(BridePricee,fS))dai.
By Leibniz integral rule, ∂E[ai|ai>a∗]∂a∗ = f (a∗)
1−F (a∗) E[ai|ai > a∗]− a∗ > 0.
Now, a∗(BridePricee = 0,fS) > a∗(BridePricee = 1,fS) because of equation 2 and the fact
that ∆V ( ) is strictly increasing. This implies that
E[ai|S = 1;BridePricee = 0,fS ] > E[ai|S = 1;BridePricee = 1,fS ].
Proof of proposition 3
Proof Equation 1 implies that
∂P (S = 1|BridePricee = 1,fS)∂fS
<∂P (S = 1|BridePricee = 0,fS)
∂fS
2

if and only if
g(∆V ∗(BridePricee = 1,fS)) > g(∆V ∗(BridePricee = 0,fS)).
Because of the relationship in equation 2, this then implies that the probability density function
g( ) ought to be locally decreasing and hence the cumulative distribution function concave. For
unimodal distributions, the probability density function is decreasing for values of the return to
schooling greater than the modal return.
3

Appendix B: Data description
A. Ethnographic Atlas
Ethnic norm information on bride price, bride service, matrilocality, female dominated agri-
culture, and community size is drawn from Murdock’s (1967) Ethnographic Atlas, which pro-
vides ethnographic information for 1,265 pre-industrial societies. However, survey and census
data often contain ethnicities or languages associated with ethnicities that are not listed in the
Ethnographic Atlas. To match these ethnicities/languages to societies in the Ethnographic Atlas,
each ethnicity/language in the IFLS/Indonesia Intercensal Survey was matched to one of 7,612
language groups in the Ethnologue: Languages of the World (Gordon, 2005). These language groups
were then matched to societies in the Ethnographic Atlas where information on bride price norms
was non-missing.
Despite this matching procedure, the number of missing variables for historical community
size variable in Indonesia is very high, which is why it is not used as a control in the following
regressions. The “mode of marriage (primary)” variable in the Ethnographic Atlas provides
information on whether the primary mode of marriage is: (1) bride price or bride wealth, (2)
bride service, (3) token bride price, (4) gift exchange, (5) sister or female relative exchanged for
bride, (6) absence of consideration, or (7) dowry. The bride price indicator variable was coded 1
only if bride price or bride wealth was listed as the primary mode of marriage and 0 otherwise
for non-missing values. Similarly, the bride service indicator variable was coded 1 if the primary
mode was listed as bride service and 0 otherwise. The “transfer of residence at marriage: after first
years” variable is divided into 3 categories: (1) wife to husband’s group, (2) couple to either group
or neolocal, and (3) husband to wife’s group. The matrilocality indicator variable was only coded
1 in the 3rd case. Finally, the female agriculture variable was coded using the “sex differences:
agriculture” variable from the Ethnographic Atlas. This variable consists of the categories (1) males
only, (2) males appreciably more, (3) differentiated but equal participation, (4) equal participation,
(5) female appreciably more, (6) females only, and (7) absent or unimportant activity. The female
agriculture indicator is coded as 1 for categories 5 and 6 and 0 otherwise.
Table 3 provides a breakdown of the customs surrounding marriage practiced by the different
ethnicities that the languages in the 1995 intercensal survey were matched to in the Ethnographic
Atlas.
4

B. Indonesia
Indonesia Family Life Survey
The Indonesia Family Life Survey (IFLS) is an ongoing longitudinal study of households in
Indonesia covering over 30,000 individuals. Data is gathered from 13 of Indonesia’s 27 provinces
and the study is considered representative of 83 percent of the Indonesian population. This
paper uses data from rounds 3 and 4 of the IFLS (Strauss, Beegle, Sikoki, Dwiyanto, Herawati
and Witoelar, 2004, Strauss, Witoelar, Sikoki and Wattie, 2009), which, unlike previous rounds
of the IFLS, includes questions about individuals’ ethnicities. The first panel of table 9 presents
summary statistics on educational attainment for males and females, as well as household wealth,
for all respondents aged 25-45. The second panel reports summary statistics on female and male
marriage age and ln(bride price) for approximately 2,400 marriages documented in the round 3
IFLS and 3,200 marriages in the round 4 IFLS where bride price was paid. While marriage ages
do not differ by whether the groom or bride belonged to a bride price ethnicity, average bride
prices are significant higher in bride price ethnic groups.
Intercensal Population Survey
The Indonesia Intercensal Survey is a large-scale, nationally representative population survey
of Indonesia carried out between the 1990 and 2000 censuses. It is housed by the Minnesota
Population Center (1995). Importantly, it includes data on primary language spoken which can
be linked to ethnicity and matched to an ethnic group’s bride price norm in The Ethnographic
Atlas. It also contains information on educational attainment, birth year, and birth district which,
following Duflo (2001), can be combined with data on the number of schools built in 1974 as
part of a large-scale school construction program. Table 5 presents summary statistics for the two
sub-samples of this data set that we analyze in this paper. The first sample, which is used to
compare the enrollment patterns of school-aged females and males in bride price and non-bride
price ethnicities, consists of all individuals between the ages of 5 and 22. The second sample is
used to estimate the impact of school construction for bride price and non-bride price females.
This sample is composed of a treated group of individuals who were 2–6 at the time of school
construction (1974) and an un-treated group of individuals who were 12–24 at the time of school
construction.
5
C. Zambia
Data from the Zambia Fertility Preferences Study
Data on bride price amounts and beliefs about bride price and education is drawn from unique
survey data collected in Lusaka in the Fall 2014 as part of an experimental study on family
planning. The study involves 728 couples living in the catchment area of Chipata clinic, a poor
peri-urban segment of Lusaka. Each spouse of these couples was interviewed in private and was
asked a series of questions on the practice of lobola, leading to a total of 1,456 observations.
Table 17 reports summary statistics for the key variables.
Demographic and Health Survey
To study the effect of school construction on the enrollment of bride price and non-bride price
children in Zambia, we pool the 1996, 2001, and 2007 rounds of the Zambia Demographic and
Health Survey. When we analyze whether daughters are more likely to be enrolled relative to
their brothers in bride price versus non-bride price ethnicities, we use a sample of all school-aged
children in the pooled DHS (ages 5-22). Summary statistics for this group are presented in the first
panel of table 14. The summary statistics show that bride price females are more likely on average
to be enrolled in primary school. When we analyze how school construction impacts school
enrollment, we limit the sample to primary-school aged children (5-12), since most new schools
are primary schools. The second panel of table 14 presents summary statistics for enrollment,
wealth, and local female employment rates for these groups. Once we control for district (column
7), the only significant difference between the bride price and non-bride price groups is the female
enrollment rate.
6

Appendix C: Tables
Table A1: Distribution of Customs in the Ethnographic Atlas
Number of ethnic groups Percent of non-missing observations
Marriage CustomsBride Price 646 0.522Bride Service 122 0.099Token Bride Price 67 0.054Gift Exchange 62 0.050Sister Exchange 39 0.032No Custom 269 0.217Dowry 33 0.027
Other CustomsMatrilineal 160 0.127Matrilocal 196 0.159Plow 141 0.112Female Agriculture 259 0.275Polygamy 1032 0.845
Notes: This table counts the number of ethnicities that practice different traditionalcustoms in the Ethnographic Atlas, which lists traditional customs for 1,265 societies.
7
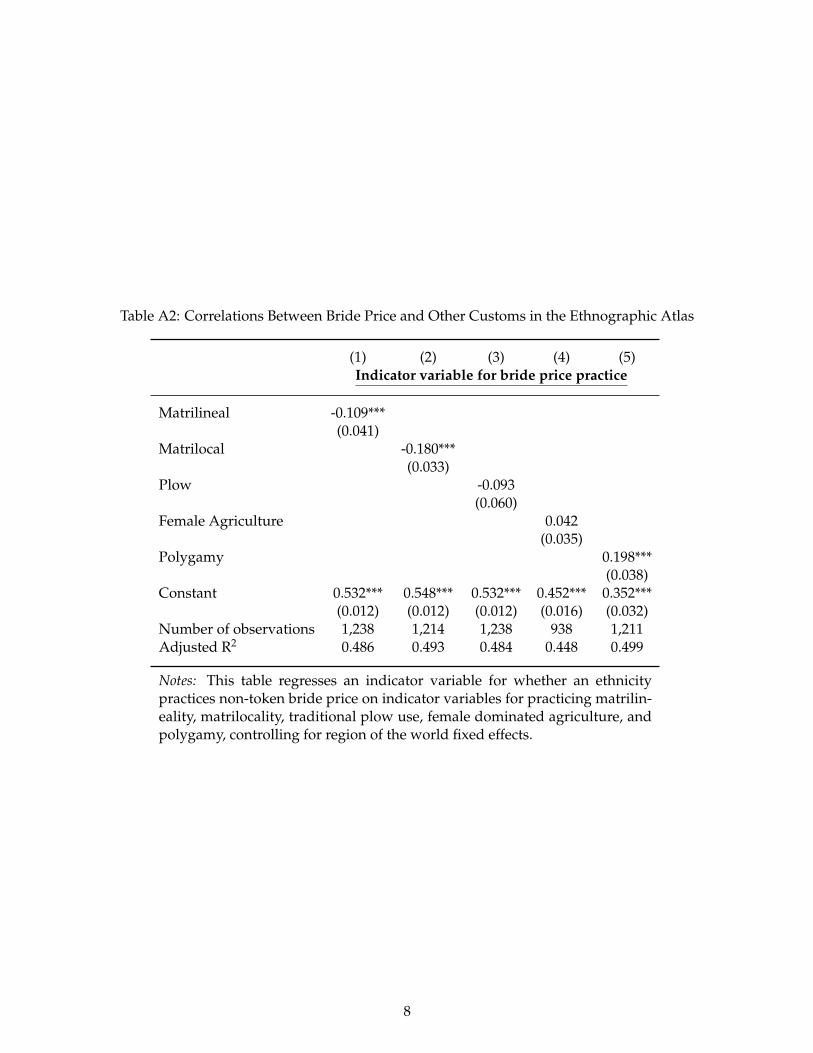
Table A2: Correlations Between Bride Price and Other Customs in the Ethnographic Atlas
(1) (2) (3) (4) (5)Indicator variable for bride price practice
Matrilineal -0.109***(0.041)
Matrilocal -0.180***(0.033)
Plow -0.093(0.060)
Female Agriculture 0.042(0.035)
Polygamy 0.198***(0.038)
Constant 0.532*** 0.548*** 0.532*** 0.452*** 0.352***(0.012) (0.012) (0.012) (0.016) (0.032)
Number of observations 1,238 1,214 1,238 938 1,211Adjusted R2 0.486 0.493 0.484 0.448 0.499
Notes: This table regresses an indicator variable for whether an ethnicitypractices non-token bride price on indicator variables for practicing matrilin-eality, matrilocality, traditional plow use, female dominated agriculture, andpolygamy, controlling for region of the world fixed effects.
8

Tabl
eA
3:Br
ide
Pric
eSt
atus
and
the
INPR
ESSc
hool
Expa
nsio
nin
the
2010
Cen
sus
Dat
a
(1)
(2)
(3)
(4)
(5)
Indi
cato
rva
riab
lefo
rco
mpl
etio
nof
prim
ary
scho
olM
ales
Fem
ales
Fem
ales
B.P.
Fem
ales
Non
B.P.
Fem
ales
IPost
k×Intensity
d0.
016*
0.01
10.
017*
*-0
.015
(0.0
09)
(0.0
10)
(0.0
08)
(0.0
11)
IPost
k×Intensity
d×IBrideP
rice
e0.
017*
*(0
.008
)IPost
k×Intensity
d×INoBrideP
rice
e-0
.015
(0.0
11)
Ethn
icit
yFE
s×IPost
kN
NY
YY
Ethn
icit
yFE
s×Indensity
dN
NY
YY
Dis
tric
tFEs×IBrideP
rice
eN
NY
YY
Dufl
oC
ontr
ols×IBrideP
rice
eN
NY
NN
Dufl
oC
ontr
ols
YY
YY
YD
istr
ictF
EsY
YY
YY
Coh
ortF
EsY
YY
YY
Num
ber
ofob
serv
atio
ns1,
747,
727
1,70
0,85
61,
700,
436
476,
176
1,22
4,26
0A
djus
ted
R2
0.11
60.
176
0.19
40.
196
0.18
3C
lust
ers
263
263
263
263
259
Not
es:
Educ
atio
nat
tain
men
tda
taar
ea
ten
perc
ent
sam
ple
ofth
e20
10In
done
sia
Cen
sus
and
mer
ged
wit
het
hnic
ity
leve
lno
rmda
tafr
omM
urdo
ck’s
(196
7)Et
hnog
raph
icA
tlas.
IPost
kre
fers
toth
etr
eate
dco
hort
,bor
nbe
twee
n19
68an
d19
72.T
heun
trea
ted
coho
rtis
born
betw
een
1950
and
1962
.The
trea
tmen
tle
vel
isth
enu
mbe
rof
scho
ols
built
ina
dist
rict
per
1,00
0pe
ople
inth
esc
hool
-age
dpo
pula
tion
.A
llre
gres
sion
sin
clud
edi
stri
ct-o
f-bi
rth
fixed
effe
cts,
coho
rtfix
edef
fect
s,an
dth
ein
tera
ctio
nof
coho
rtfix
edef
fect
sw
ith
num
ber
ofsc
hool
-age
dch
ildre
nin
the
dist
rict
in19
71,w
ith
the
enro
llmen
trat
ein
1971
and
wit
hth
ere
genc
yle
veli
mpl
emen
tati
onof
aw
ater
and
sani
tati
onpr
ogra
mun
der
INPR
ES.T
hesu
bscr
ipt
din
dexe
sdi
stri
cts,i
indi
vidu
als,k
coho
rts,
ande
ethn
icgr
oups
.St
anda
rder
rors
are
clus
tere
dat
the
birt
h-di
stri
ctle
vel.
9

Tabl
eA
4:Pl
aceb
oTe
stof
Brid
ePr
ice
Stat
usan
dth
eIN
PRES
Scho
olEx
pans
ion
Res
ults
inth
e19
95In
done
sia
Inte
rcen
salD
ata
(1)
(2)
(3)
(4)
(5)
Indi
cato
rva
riab
lefo
rco
mpl
etio
nof
prim
ary
scho
olM
ales
Fem
ales
Fem
ales
B.P.
Fem
ales
Non
B.P.
Fem
ales
IPlaceboPost
k×Intensity
d-0
.004
-0.0
060.
015
-0.0
04(0
.006
)(0
.005
)(0
.014
)(0
.007
)IPlaceboPost
k×Intensity
d×IBrideP
rice
e0.
015
(0.0
14)
IPlaceboPost
k×Intensity
d×INoBrideP
rice
e-0
.005
(0.0
07)
Ethn
icit
yFE
s×IPost
kN
NY
YY
Ethn
icit
yFE
s×Indensity
dN
NY
YY
Dis
tric
tFEs×IBrideP
rice
eN
NY
YY
Dufl
oC
ontr
ols×IBrideP
rice
eN
NY
NN
Dufl
oC
ontr
ols
YY
YY
YD
istr
ictF
EsY
YY
YY
Coh
ortF
EsY
YY
YY
Num
ber
ofob
serv
atio
ns54
,812
53,6
4045
,102
6,83
338
,966
Num
ber
ofcl
uste
rs25
424
723
214
021
0A
djus
ted
R2
0.10
00.
137
0.13
50.
158
0.12
8
Not
es:E
duca
tion
atta
inm
entd
ata
are
take
nfr
omth
e19
95In
done
sia
Inte
rcen
salS
urve
yan
dm
erge
dw
ith
ethn
icit
yle
vel
norm
data
from
Mur
dock
’s(1
967)
Ethn
ogra
phic
Atla
s.IPlaceboPost
kre
fers
toth
epl
aceb
otr
eate
dco
hort
,who
are
aged
12-1
7in
1974
.The
plac
ebo
untr
eate
dco
hort
isag
ed17
-24
in19
74.Intensity
d
isth
enu
mbe
rof
scho
ols
built
ina
dist
rict
per
1,00
0pe
ople
inth
esc
hool
-age
dpo
pula
tion
.All
regr
essi
ons
incl
ude
dist
rict
-of-
birt
hfix
edef
fect
s,co
hort
fixed
effe
cts,
and
the
inte
ract
ion
ofco
hort
fixed
effe
cts
wit
hnu
mbe
rof
scho
ol-
aged
child
ren
inth
edi
stri
ctin
1971
,w
ith
the
enro
llmen
tra
tein
1971
and
wit
hth
ere
genc
yle
veli
mpl
emen
tati
onof
aw
ater
and
sani
tati
onpr
ogra
mun
der
INPR
ES.T
hesu
bscr
iptd
inde
xes
dist
rict
s,i
indi
vidu
als,k
coho
rts,
ande
ethn
icgr
oups
.St
anda
rder
rors
are
clus
tere
dat
the
birt
h-di
stri
ctle
vel.
10

Table A5: Indonesia School Construction Results with Effect of School Construction by Age in 1974
(1) (2) (3)Indicator variable equal to 1 if completed primaryAll Females BP Females Non-BP Females
Intensityd × I(Age1974 = 2)× IBridePricee 0.009 0.009
(0.014) (0.014)Intensityd × I(Age1974 = 3)× IBridePrice
e 0.043* 0.043*(0.024) (0.025)
Intensityd × I(Age1974 = 4)× IBridePricee 0.009 0.009
(0.017) (0.018)Intensityd × I(Age1974 = 5)× IBridePrice
e 0.043*** 0.043***(0.015) (0.015)
Intensityd × I(Age1974 = 6)× IBridePricee 0.018 0.018
(0.013) (0.013)Intensityd × I(Age1974 = 7)× IBridePrice
e -0.017 -0.017(0.021) (0.021)
Intensityd × I(Age1974 = 8)× IBridePricee -0.025** -0.025*
(0.013) (0.013)Intensityd × I(Age1974 = 9)× IBridePrice
e 0.027* 0.027*(0.015) (0.015)
Intensityd × I(Age1974 = 10)× IBridePricee -0.009 -0.009
(0.014) (0.014)Intensityd × I(Age1974 = 11)× IBridePrice
e 0.065*** 0.065***(0.021) (0.021)
Intensityd × I(Age1974 = 12)× IBridePricee 0.015 0.015
(0.025) (0.026)Intensityd × I(Age1974 = 2)× INoBridePrice
e -0.002 -0.002(0.013) (0.013)
Intensityd × I(Age1974 = 3)× INoBridePricee -0.005 -0.005
(0.013) (0.013)Intensityd × I(Age1974 = 4)× INoBridePrice
e 0.009 0.009(0.013) (0.013)
Intensityd × I(Age1974 = 5)× INoBridePricee -0.010 -0.010
(0.013) (0.013)Intensityd × I(Age1974 = 6)× INoBridePrice
e -0.033*** -0.033***(0.011) (0.011)
Intensityd × I(Age1974 = 7)× INoBridePricee -0.014 -0.014
(0.014) (0.014)Intensityd × I(Age1974 = 8)× INoBridePrice
e -0.008 -0.008(0.014) (0.014)
Intensityd × I(Age1974 = 9)× INoBridePricee -0.000 -0.000
(0.012) (0.012)Intensityd × I(Age1974 = 10)× INoBridePrice
e -0.006 -0.006(0.013) (0.013)
Intensityd × I(Age1974 = 11)× INoBridePricee -0.003 -0.003
(0.013) (0.013)Intensityd × I(Age1974 = 12)× INoBridePrice
e -0.001 -0.001(0.014) (0.014)
F-test of BP Coefficients 7.58F-test of non-BP Coefficients 1.84Number of observations 92,325 13,700 78,625Clusters 249 183 222Adjusted R2 0.170 0.167 0.171
Notes: This table estimates the effect of the triple interaction of age in 1974 with number of schools builtper 100,000 school-aged children in a district and whether an ethnicity practices non-token bride price ornot according to the Ethnographic Atlas. The effect of school construction on children aged 12 or greaterin 1974 is restricted to be 0. This specification is similar to one used by Duflo (2001). Standard errors areclustered at the district level.
11

Table A6: Effect of Bride Price by Religious Status in Full Indonesia School Construction Sample
Completed Primary
IPostk × Intensityd × I(Muslim)i × IBridePrice
e 0.019(0.019)
IPostk × Intensityd × I(Muslim)i -0.002
(0.013)IPostk × Intensityd × I(NonMuslim)i × IBridePrice
e 0.041**(0.018)
IPostk × Intensityd × I(NonMuslim)i -0.012
(0.012)Ethnicity FEs ×IPost
k YEthnicity FEs ×Intensityd YDistrict FEs ×IBridePrice
e YDuflo Controls ×IBridePrice
e YMuslim YMuslim ×IBridePrice
k YMuslim ×Intensityd × IPost
k YDuflo Controls YDistrict FEs YCohort FEs YNumber of observations 65,403Adjusted R2 0.187Clusters 240
Notes: This table investigates the effect of the INPRES school constructionprogram on bride price and non-bride females, allowing the effect to varyby self-reported religious status. Standard errors are clustered at the birthdistrict level.
12

Table A7: Instrumented Effect of Primary School Completion on Bride Price Values in Rounds 3and 4 of the IFLS
(1) (2) (3) (4) (5) (6)I(Completed Primary)i BridePricei Ln(BridePrice)i I(Completed Primary)i BridePricei Ln(BridePrice)i
Intensityd × I(Age1974 = 2)i 0.130 0.156(0.427) (0.660)
Intensityd × I(Age1974 = 3)i -0.432 -0.219(0.620) (0.830)
Intensityd × I(Age1974 = 4)i 0.114 0.220(0.450) (0.689)
Intensityd × I(Age1974 = 5)i 0.042 0.017(0.494) (0.638)
Intensityd × I(Age1974 = 6)i 0.598 0.407(0.644) (0.913)
Intensityd × I(Age1974 = 7)i 0.021 0.182(0.442) (0.767)
Intensityd × I(Age1974 = 8)i 0.069 0.126(0.514) (0.830)
Intensityd × I(Age1974 = 9)i 0.755* 1.480(0.439) (0.909)
Intensityd × I(Age1974 = 10)i -0.157 0.526(0.514) (1.494)
Intensityd × I(Age1974 = 11)i 0.900 0.008(0.569) (0.990)
Intensityd × I(Age1974 = 12)i -0.043 0.122(0.474) (0.917)
I(Completed Primary)i 1,307,815.073* 1.817* 3,668,901.258** 0.805(742,468.239) (1.102) (1,430,017.118) (1.071)
Survey Year FE Y Y Y Y Y YDistrict FE Y Y Y Y Y YCohort FE Y Y Y Y Y YDuflo Controls Y Y Y Y Y YMarriage Year FE N N N Y Y YF-stat 5.99 1.72Number of observations 258 258 227 256 256 225Adjusted R2 -0.069 -0.011 0.252 -0.000 -1.184 0.264Clusters 82 82 78 82 82 78
Notes: Following the specification used in Duflo (2001), this table instruments for primary completion in the IFLS with the interactions of treatment intensityand age in 1974 fixed effects. The effect of school construction on cohorts 12 or greater in 1974 is restricted to be 0. The sample consists of couples fromethnicities with non-token bride price who responded to questions about bride price payment values in rounds 3 and 4 of the IFLS. Treatment is assignedbased on district of birth. When district of birth is missing, it is assigned based on current district of residence. Columns 4, 5, and 6 include year of marriagefixed effects. Standard errors are clustered at the district level.
13
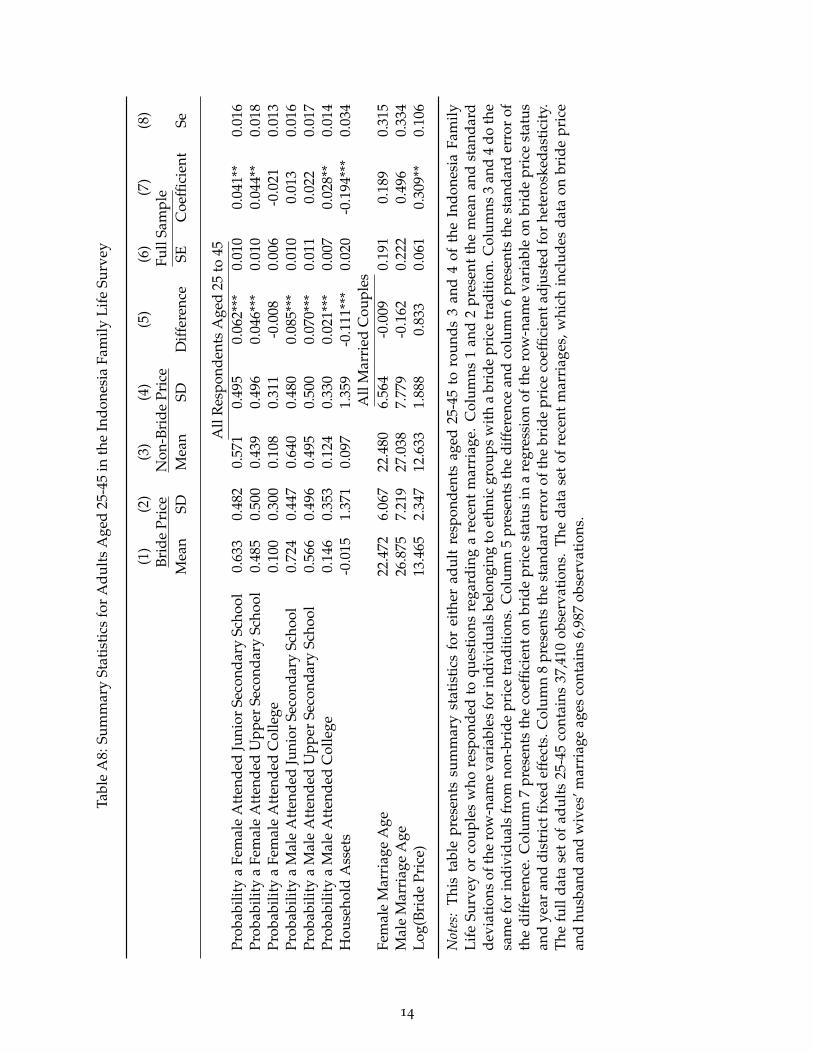
Tabl
eA
8:Su
mm
ary
Stat
isti
csfo
rA
dult
sA
ged
25-4
5in
the
Indo
nesi
aFa
mily
Life
Surv
ey
(1)
(2)
(3)
(4)
(5)
(6)
(7)
(8)
Brid
ePr
ice
Non
-Bri
dePr
ice
Full
Sam
ple
Mea
nSD
Mea
nSD
Diff
eren
ceSE
Coe
ffici
ent
Se
All
Res
pond
ents
Age
d25
to45
Prob
abili
tya
Fem
ale
Att
ende
dJu
nior
Seco
ndar
ySc
hool
0.63
30.
482
0.57
10.
495
0.06
2***
0.01
00.
041*
*0.
016
Prob
abili
tya
Fem
ale
Att
ende
dU
pper
Seco
ndar
ySc
hool
0.48
50.
500
0.43
90.
496
0.04
6***
0.01
00.
044*
*0.
018
Prob
abili
tya
Fem
ale
Att
ende
dC
olle
ge0.
100
0.30
00.
108
0.31
1-0
.008
0.00
6-0
.021
0.01
3Pr
obab
ility
aM
ale
Att
ende
dJu
nior
Seco
ndar
ySc
hool
0.72
40.
447
0.64
00.
480
0.08
5***
0.01
00.
013
0.01
6Pr
obab
ility
aM
ale
Att
ende
dU
pper
Seco
ndar
ySc
hool
0.56
60.
496
0.49
50.
500
0.07
0***
0.01
10.
022
0.01
7Pr
obab
ility
aM
ale
Att
ende
dC
olle
ge0.
146
0.35
30.
124
0.33
00.
021*
**0.
007
0.02
8**
0.01
4H
ouse
hold
Ass
ets
-0.0
151.
371
0.09
71.
359
-0.1
11**
*0.
020
-0.1
94**
*0.
034
All
Mar
ried
Cou
ples
Fem
ale
Mar
riag
eA
ge22
.472
6.06
722
.480
6.56
4-0
.009
0.19
10.
189
0.31
5M
ale
Mar
riag
eA
ge26
.875
7.21
927
.038
7.77
9-0
.162
0.22
20.
496
0.33
4Lo
g(Br
ide
Pric
e)13
.465
2.34
712
.633
1.88
80.
833
0.06
10.
309*
*0.
106
Not
es:
This
tabl
epr
esen
tssu
mm
ary
stat
isti
csfo
rei
ther
adul
tre
spon
dent
sag
ed25
-45
toro
unds
3an
d4
ofth
eIn
done
sia
Fam
ilyLi
feSu
rvey
orco
uple
sw
hore
spon
ded
toqu
esti
ons
rega
rdin
ga
rece
ntm
arri
age.
Col
umns
1an
d2
pres
ent
the
mea
nan
dst
anda
rdde
viat
ions
ofth
ero
w-n
ame
vari
able
sfo
rin
divi
dual
sbe
long
ing
toet
hnic
grou
psw
ith
abr
ide
pric
etr
adit
ion.
Col
umns
3an
d4
doth
esa
me
for
indi
vidu
als
from
non-
brid
epr
ice
trad
itio
ns.
Col
umn
5pr
esen
tsth
edi
ffer
ence
and
colu
mn
6pr
esen
tsth
est
anda
rder
ror
ofth
edi
ffer
ence
.C
olum
n7
pres
ents
the
coef
ficie
nton
brid
epr
ice
stat
usin
are
gres
sion
ofth
ero
w-n
ame
vari
able
onbr
ide
pric
est
atus
and
year
and
dist
rict
fixed
effe
cts.
Col
umn
8pr
esen
tsth
est
anda
rder
ror
ofth
ebr
ide
pric
eco
effic
ient
adju
sted
for
hete
rosk
edas
tici
ty.
The
full
data
set
ofad
ults
25-4
5co
ntai
ns37
,410
obse
rvat
ions
.Th
eda
tase
tof
rece
ntm
arri
ages
,whi
chin
clud
esda
taon
brid
epr
ice
and
husb
and
and
wiv
es’m
arri
age
ages
cont
ains
6,98
7ob
serv
atio
ns.
14

Table A9: Zambia School Construction Regressions with Ethnic Norm Controls
(1) (2)Indicator variable for enrolledBaseline Female Agriculture Matrilineal Both
Schoolsdt/Aread × IBridePricee 0.069** 0.414*** 0.091** 0.488***
(0.032) (0.144) (0.045) (0.150)Schoolsdt/Aread × INoBridePrice
e -0.021 0.308** -0.003 0.373***(0.036) (0.123) (0.038) (0.124)
Age by Round by Bride Price FE Y Y Y YEthnicity by Round FE Y Y Y YEthnicity by District FE Y Y Y YNumber of observations 12,277 12,277 12,277 12,277Clusters 70 70 70 70Adjusted R Squared 0.393 0.394 0.393 0.394
Notes: This table re-estimates the Zambia school construction regression including theinteraction of an indicator variable for female-dominant agriculture and an indicator vari-able for matrilineality with the treatment variable Schoolsdt/Aread. Standard errors areclustered at the district level.
15

Tabl
eA
10:
Brid
ePr
ice
Stat
usan
dth
eIN
PRES
Scho
olEx
pans
ion
inth
e19
95In
done
sia
Inte
rcen
salD
ata,
Allo
win
gfo
rPr
e-Tr
eatm
entF
emal
ePr
imar
yC
ompl
etio
nC
ontr
ols
(1)
(2)
(3)
(4)
(5)
(6)
Indi
cato
rva
riab
lefo
rco
mpl
etio
nof
prim
ary
scho
olM
ales
Fem
ales
Fem
ales
Fem
ales
B.P.
Fem
ales
Non
B.P.
Fem
ales
IPost
k×Intensity
d0.
012*
-0.0
020.
023*
*-0
.001
(0.0
06)
(0.0
07)
(0.0
12)
(0.0
10)
IPost
k×Intensity
d×IBrideP
rice
e0.
024*
*0.
195*
**(0
.012
)(0
.059
)IPost
k×Intensity
d×INoBrideP
rice
e-0
.001
0.13
6***
(0.0
10)
(0.0
45)
Ethn
icit
yFE
s×IPost
kN
NY
YY
YEt
hnic
ity
FEs
NN
YY
YY
Ethn
icit
yFE
s×Intensity
dN
NY
YY
YD
istr
ictF
Es×IBrideP
rice
eN
NY
YN
ND
uflo
Con
trol
s×IBrideP
rice
eN
NY
YN
ND
uflo
Con
trol
sY
YY
YY
YD
istr
ictF
EsY
YY
YY
YC
ohor
tFEs×IBrideP
rice
eN
NY
YN
NC
ohor
tFEs
YY
YY
YY
Init
ialF
emal
ePr
imar
yC
ompl
etio
n×Intensity
d×IPost
kN
NN
YN
NN
umbe
rof
obse
rvat
ions
75,2
8676
,959
65,4
0365
,402
9,70
755
,696
Num
ber
ofcl
uste
rs25
825
524
024
015
521
7A
djus
ted
R2
0.12
40.
179
0.18
50.
184
0.17
40.
185
Not
es:
Educ
atio
nat
tain
men
tdat
aar
eta
ken
from
the
1995
Indo
nesi
aIn
terc
ensa
lSur
vey
and
mer
ged
wit
het
hnic
ity
leve
lnor
mda
tafr
omM
urdo
ck’s
(196
7)Et
hnog
raph
icA
tlas.IPost
kre
fers
toth
etr
eate
dco
hort
,bor
nbe
twee
n19
68an
d19
72.
The
untr
eate
dco
hort
isbo
rnbe
twee
n19
50an
d19
62.Intensity
dis
the
num
ber
ofsc
hool
sbu
iltin
adi
stri
ctpe
r1,
000
peop
lein
the
scho
ol-a
ged
popu
lati
on.
All
regr
essi
ons
incl
ude
dist
rict
-of-
birt
hfix
edef
fect
s,co
hort
fixed
effe
cts,
and
the
inte
ract
ion
ofco
hort
fixed
effe
cts
wit
hnu
mbe
rof
scho
ol-a
ged
child
ren
inth
edi
stri
ctin
1971
,wit
hen
rollm
entr
ate
in19
71an
dw
ith
the
rege
ncy
leve
lim
plem
enta
tion
ofa
wat
eran
dsa
nita
tion
prog
ram
unde
rIN
PRES
.The
subs
crip
tdin
dexe
sdi
stri
cts,i
indi
vidu
als,k
coho
rts,
ande
ethn
icgr
oups
.St
anda
rder
rors
are
clus
tere
dat
the
birt
h-di
stri
ctle
vel.
16

Table A11: Summary Statistics for ZFPS Data
Mean SD N
lnBPie 7.510 1.196 442I(Primary)i 0.943 0.231 442I(JuniorSecondary)i 0.507 0.501 442I(Secondary)i 0.267 0.443 442MarriageAgei 20.446 4.115 442I(HusbandPrimary)i 0.986 0.116 442I(HusbandJuniorSecondary)i 0.731 0.444 442I(HusbandSecondary)i 0.468 0.500 442HusbandMarriageAgei 25.937 6.495 441
Notes: This table contains summary statistics for allcouples in the ZFPS data.
17
References
Duflo, Esther, “Schooling and Labor Market Consequences of School Construction in Indonesia:Evidence from an Unusual Policy Experiment,” American Economic Review, 2001, 91 (4), 795–813.
Gordon, Raymond G., Ethnologue: Languages of the World, 15th Edition, SIL International, 2005.
Minnesota Population Center, “Integrated Public Use Microdata Series, International: Version6.1,” 1995.
Murdock, George Peter, Ethnographic Atlas, Pittsburgh: University of Pittsburgh Press, 1967.
Strauss, J., F. Witoelar, B. Sikoki, and A.M. Wattie, “The Fourth Wave of the Indonesian FamilyLife Survey (IFLS4): Overview and Field Report,” 2009.
, K. Beegle, B. Sikoki, A. Dwiyanto, Y. Herawati, and F. Witoelar, “The Third Wave of theIndonesian Family Life Survey (IFLS): Overview and Field Report,” 2004.
18
Top Related