


Languages
Pages
Legal

REVIEW
Biosorption of Cu(II) and Pb(II) from aqueous solutionsby chemically modified spent coffee grains
F. J. Cerino-Cordova • P. E. Dıaz-Flores • R. B. Garcıa-Reyes •
E. Soto-Regalado • R. Gomez-Gonzalez • M. T. Garza-Gonzalez •
E. Bustamante-Alcantara
Received: 12 March 2012 / Revised: 6 June 2012 / Accepted: 28 January 2013 / Published online: 23 February 2013
� Islamic Azad University (IAU) 2013
Abstract In this research, spent coffee grains were
modified with citric acid solutions (0.1 and 0.6 M) to
increase the quantity of carboxylic groups improving its
metal adsorption capacity. Added functional groups on
modified and non-modified spent coffee grains were iden-
tified and quantified by attenuated total reflection Fourier
transform infrared analyses and potentiometric titrations,
respectively. These adsorbents were used for the removal
of lead (II) and copper (II) from aqueous solutions at 30 �C
and different pH in batch systems. In addition, adsorption–
desorption experiments were conducted to evaluate the
possibility of re-using the modified adsorbent. Potentio-
metric titrations data reveal that the quantity of carboxylic
groups was increased from 0.47 to 2.2 mmol/g when spent
coffee grains were modified with 0.1 and 0.6 M citric acid.
Spent coffee grains treated with 0.6 M citric acid, achieved
a maximum adsorption capacity of 0.77 and 1.53 mmol/g
for lead (II) and copper (II), respectively, whereas non-
modified spent coffee grains only reached 0.24 and
0.19 mmol/g for lead (II) and copper (II), respectively.
Desorption of lead (II) and copper (II) achieved around
70 % using 0.1 N HCl for non-modified and modified spent
coffee grains with 0.6 M citric acid. It is suggested that
lead (II) and copper (II) species were adsorbed mainly on
the carboxylic groups of modified spent coffee grains and
these metals may be exchanged for hydrogen and calcium
(II) ions during adsorption on non-modified spent coffee
grains. Finally, the adsorption equilibrium was reached
after 400 min for modified spent coffee grains with 0.6 M
citric acid. Modified spent coffee grains are a promising
option for removing metal cations from aqueous solutions
due to its low cost and high adsorption capacity (about 10
times higher than the activated carbons).
Keywords Adsorption � Carboxylic groups �Heavy metals � Lignocellulosic biosorbents �Wastewater
Introduction
Industrial activities, such as electroplating, textile dyeing,
storage batteries, ceramic, glass and metal-processing
industries discharge metals-containing wastewater. These
pollutants are dangerous for human health and living
organism due to their high toxicity, non-biodegradability,
and their accumulation in the biosphere (Kaim and
Schwederski 1994).
In some industrial effluents, the concentration of heavy
metals is higher than the safe permissible limits, which
affects the biosphere, and thus, these pollutants must be
removed. Several physicochemical processes have been
studied to remove heavy metals from aqueous solutions
including precipitation, electrochemical treatment, mem-
brane filtration, ion exchange and adsorption (Guillard and
Lewis 2001; Valverde et al. 2001; Matlock et al. 2002; Ng
et al. 2002; Naiya et al. 2009a). Among these treatments,
biosorption can be considered as an eco-friendly and
F. J. Cerino-Cordova (&) � R. B. Garcıa-Reyes �E. Soto-Regalado � R. Gomez-Gonzalez �M. T. Garza-Gonzalez � E. Bustamante-Alcantara
Universidad Autonoma de Nuevo Leon, UANL. Facultad de
Ciencias Quımicas.Av. Universidad S/N, Cd. Universitaria,
66451 San Nicolas de los Garza, NL, Mexico
e-mail: [email protected]
P. E. Dıaz-Flores
Universidad Autonoma de San Luis Potosı. Coordinacion
Academica Region Altiplano. Carretera a Cedral Km 5?600 San
Jose de las Trojes, 78700 Matehuala, SLP, Mexico
123
Int. J. Environ. Sci. Technol. (2013) 10:611–622
DOI 10.1007/s13762-013-0198-z

economical wastewater treatment that has been proven to
be highly efficient to remove low metal concentration, and
in addition, the biosorbent can be easily regenerated
(Chojnacka 2010). Several biosorbents have been tested
such as algae, bacteria, fungi, yeast, and agro-waste
materials (Romera et al. 2006; Ahluwalia and Goyal 2007;
Kumar et al. 2007; Kumar et al. 2008; Sud et al. 2008;
Basha et al. 2009; Garcia-Reyes and Rangel-Mendez 2009;
Garcia-Reyes et al. 2009; Garcia-Reyes and Rangel-Men-
dez 2010; Cerino-Cordova et al. 2011a, b). Agro-waste
materials can be considered as alternative adsorbents due to
their low cost and physicochemical properties (Naiya et al.
2009b), besides these materials are widely available as by-
products from industrial processes such as beverage, wood,
and food industries, among others.
Among agro-waste materials, spent coffee grains (by-
product of brewing coffee) have the potential to be used as
biosorbent for removing heavy metals from aqueous solu-
tions instead of being burned or disposed of. A number of
authors have reported the use of coffee by-products to
remove either organic (Boonamnuayvitaya et al. 2004;
Oliveira et al. 2008) or inorganic (Utomo and Hunter 2006)
pollutants from water.
Several researchers have used lignocellulosic materials
as metal-cation adsorbents (Naiya et al. 2008), however, in
some cases, their adsorption capacities are low in com-
parison with the commercial adsorbents such as activated
carbon and polymeric resins. To overcome these short-
comings, researchers have modified lignocellulosic mate-
rials with numerous chemicals, for example, H2SO4
(Martin-Lara et al. 2010) and citric acid (Wartelle and
Marshall 2000; Marshall and Wartelle 2003; Leyva-Ramos
et al. 2005; Altundogan et al. 2007; Marshall et al. 2007;
Zhu et al. 2008). The main purpose of such chemical
treatments is to increase the quantity of functional groups
on the adsorbent, which are capable of binding heavy
metals from aqueous solutions. For instance, it was
reported that lignocellulosic adsorbents improve its
adsorption capacity when these are modified with citric
acid.
In this research, to the best of our knowledge, citric acid
modification on spent coffee grains have not been reported.
In addition, researchers have reported generally the total
quantity of functional groups incorporated after citric acid
modification but, in this study, functional groups as well as
their equilibrium constants were estimated using potentio-
metric titrations data. These results are helpful for under-
standing the chemical interaction between functional
groups on modified adsorbent and metal cation species in
aqueous solutions. Finally, most lignocellulosic adsorbents
(modified with citric acid) are not regenerated opposite to
this work. This issue is an important step to evaluate the
possibility of re-using the spent adsorbent.
The aim of this research was to study lead and copper
biosorption from aqueous solution by non-modified and
chemically modified SCG. In addition, functional groups
and their equilibrium constants were determined to explain
the increase of metal adsorption capacity. Furthermore,
adsorption mechanisms were proposed based on biosorbent
characterization, adsorption–desorption experiments at
equilibrium, and adsorption kinetics. This research was
conducted at the Facultad de Ciencias Quımicas, Uni-
versidad Autonoma de Nuevo Leon, Mexico during
2010–2011.
Materials and methods
Biosorbent
Spent coffee grains were collected as a by-product of
brewing coffee, and washed with deionized water until
obtaining a non-colored effluent. Subsequently, SCG were
dried at 60 �C for 10 h and stored until chemical
modification.
Chemical modification
The chemical modification of SCG was carried out
according to a similar method described by Zhu et al.
(2008); 30 g of SCG was added to Erlenmeyer flasks
containing 210 mL of 0.1 M or 0.6 M citric acid solutions.
These suspensions were heated at 60 �C for 12 h and,
afterwards, temperature was increased up to 100 �C until
almost complete dryness (around 90 min), and then, solids
were dried at 120 �C for 24 h. Modified spent coffee grains
with 0.1 and 0.6 M citric acid (MSCG-0.1 M and MSCG-
0.6 M, respectively) were washed with deionized water to
eliminate the excess of citric acid not covalently bound to
the biosorbent surface. To verify the complete elimination
of citric acid, 10 mL of 0.1 M Pb(NO)3 solution was added
to 10 mL of the washing water until obtaining a colorless
solution (Zhu et al. 2008). Modified spent coffee grains
were dried at 100 �C for 24 h and stored in desiccators
prior to characterization and adsorption experiments. To
evaluate the effect of thermal treatment upon modification,
a blank of SCG was prepared as previously mentioned
using deionized water instead of citric acid solutions. Blank
is going to be identified throughout the manuscript as non-
modified spent coffee grains (NMSCG).
Biosorbent characterization
Functional groups quantity and their equilibrium constants
of MSCG-0.1 M, MSCG-0.6 M, and NMSCG were esti-
mated by potentiometric titration methodology proposed
612 Int. J. Environ. Sci. Technol. (2013) 10:611–622
123

by Yun et al. (2001) and applied to agro-waste materials
(Pagnanelli et al. 2008; Garcia-Reyes et al. 2009). In
addition, to identify the functional groups on biosorbent
surface (before and after adsorption and desorption
experiments), attenuated total reflection infrared spectra
(ATR-FTIR) were recorded in the range of 4,000–
650 cm-1 (Perkin Elmer, Mod Spectrum One, USA). The
pH at point of zero charge (pHpzc) was determined using
the procedure reported by Babic et al. (1999). In brief,
20 mL of 0.1 N NaCl was placed in volumetric flasks,
different volumes of 0.1 N HCl or 0.1 N NaOH were
added, and flasks were filled to 25 mL with 0.1 N NaCl.
After that, 0.1 g of adsorbent (MSCG-0.1 M, MSCG-
0.6 M or NSCG) was placed into flasks and stirred at
200 min-1 for 2 days at room temperature. A blank was
carried out at the same conditions without adsorbent. Final
pH was measured for samples and blanks and these values
were plotted against the added volume of 0.1 N HCl and
0.1 N NaOH. With aid of that plot, surface charge distri-
bution was obtained as follows:
qHþ¼CNðVb � VsÞ
mð1Þ
where qH? (mmol/g) represents moles of released ions per
mass of adsorbent (m, g), CN is titrant solution concentration
(mmol/L), Vs is titrant added volume at each pH in sample
curve (L), Vb is titrant added volume at each pH in blank curve
(L). Finally, pHpzc was obtained at the point where surface
charge distribution curve intersects with pH axis.
Chemicals
Copper and lead solutions were prepared dissolving
Cu(NO3)2�5H2O (analytical reagent grade JT Baker, Mex-
ico, MX) and Pb(NO3)2 (analytical reagent grade Fermont,
Monterrey, MX) in deionized water at pH 4 to obtain a
stock solution of 1,000 mg/L. Chemicals such as 0.1 N
sodium hydroxide, 0.1 N nitric acid, 0.1 N chloride acid,
and citric acid were obtained from LeMont (Illinois, USA)
and sodium chloride from J.T. Baker (Mexico, MX).
Equilibrium adsorption experiments
Biosorption experiments were carried out in 50-mL conic
flasks containing 40 mL of metal solutions with different
initial concentration [0.01–1.2 mmol/L for Pb(II) and
0.08–4.72 mmol/L for Cu(II)]. The MSCG and NMSCG
were used as biosorbents of Pb(II) and Cu(II) separately as
follows: 50 or 100 mg of biosorbents were added into
40 mL of metal solution of Pb(II) or Cu(II), respectively.
Flasks were stirred at 200 min-1 and kept at 30 �C for
5 days to ensure that adsorption equilibrium was reached.
Metal speciation diagrams (Fig. 1) were used to select the
pH of metal adsorption experiments. For lead adsorption
experiments, the pH solution was maintained at pH 3 and 4,
whereas for copper adsorption experiments, pH 4 and 5
were chosen. During adsorption experiments, pH was kept
constant by addition of 0.1 N HNO3 or 0.1 N NaOH.
Before and after experiments, aliquots were taken from
solution to determine metal concentration by atomic
absorption spectroscopy (Thermoscientific model ICE
3000, USA), at wavelength of 217 and 324.8 nm for Pb(II)
and Cu(II), respectively. Based on these measurements, the
metal biosorption capacity was calculated by Eq. (2).
qe¼VðCo � CeÞ
mð2Þ
where V is volume solution (L), Co and Ce are initial and final
metal concentration (mmol/L), and m is adsorbent mass (g).
Desorption experiments
To verify the possibility of re-using the metal-laden bio-
sorbent, adsorption experiments were conducted as
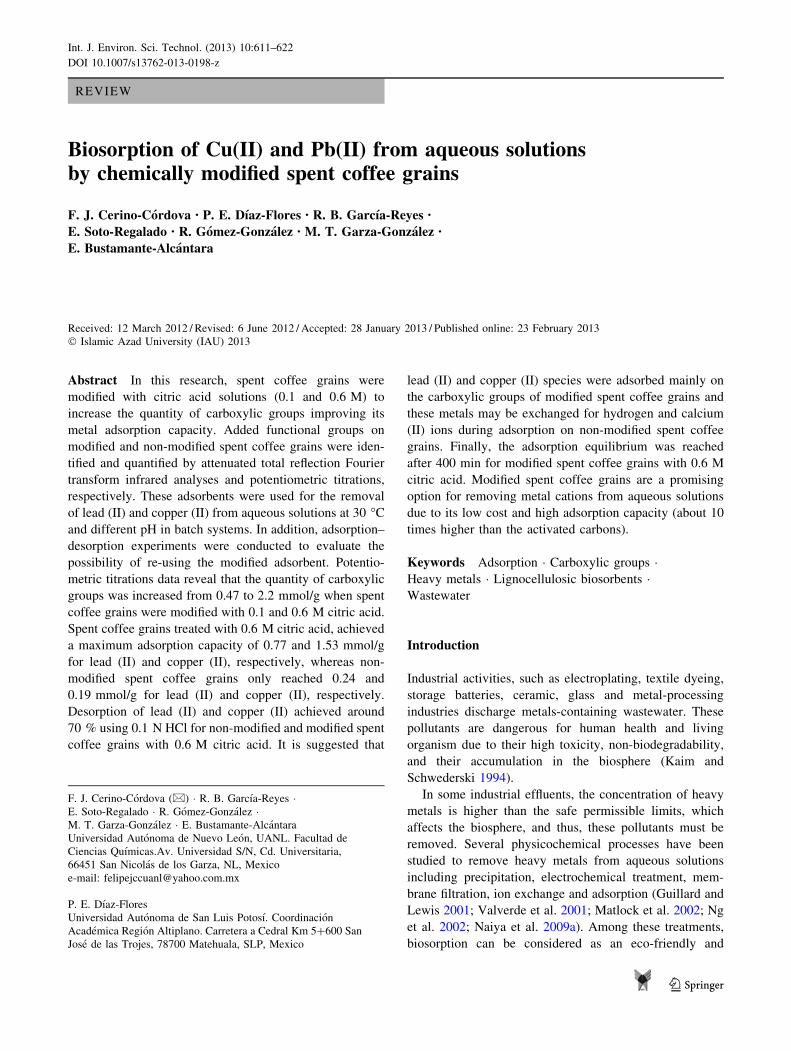
Fig. 1 Speciation diagram of
a Pb(II) and b Cu(II) for a total
concentration of 1.20 and
4.72 mmol/L, respectively
Int. J. Environ. Sci. Technol. (2013) 10:611–622 613
123

described in previous section and the experimental condi-
tions are shown in Table 1. After 5 days, aliquots were
taken to determine the equilibrium adsorption capacity.
Subsequently, the used biosorbent were filtered and rinsed
with 40 mL of deionized water at the same pH of the
adsorption experiment. After that, biosorbent was added to
flasks containing a selected volume of 0.1 M HCl for 48 h
for metal desorption. At the end of the experiments, ali-
quots were taken to determine metal concentration by
atomic absorption spectroscopy. The quantities of desorbed
metal per gram of adsorbent (qd) were calculated with the
following equation:
qd ¼VfCf
mð3Þ
where m is adsorbent mass (g), Vf represents volume
solution (L) and Cf is final concentration (mmol/L).
Adsorption kinetics
Adsorption kinetic experiments were conducted in stirred
batch systems to determine the time required to achieve the
equilibrium. Prior to adsorption kinetic experiments,
100 mg of adsorbent (NMSCG, MSCG-0.1 M or MSCG-
0.6 M) was hydrated during 24 h with deionized water at
pH 4 and 5 for Pb(II) and Cu(II), respectively, and these
were kept constant with 0.1 N HNO3 or NaOH solutions.
The hydration step was performed to minimize pH solution
variation during kinetic experiments and to swell the
biosorbent.
After that, hydrated biosorbent was separated by filtra-
tion from the suspension. Afterwards, 250 mL of metal
solution (around 1 mmol/L) was added to the flask with the
hydrated biosorbent and the stirrer was turned on at
300 min-1. Aliquots were taken at different times to
determine the remaining metal concentration in solution by
atomic absorption spectroscopy. The samples were care-
fully taken to avoid removing the adsorbent, and the
adsorption capacity (qt) was calculated taking into account
the volume variation during the sampling. The pseudo-first-
and pseudo-second-order kinetic models represented by
Eqs. (4) and (5) were used to estimate parameters of kinetic
models by non-lineal fitting of experimental adsorption
data:
qt ¼qe
1þ e�k1tð4Þ
qt ¼k2q2
e t
1þ k2qetð5Þ
where k1 (1/min) and k2 (g/mg.min) are the rate constants
of pseudo-first- and pseudo-second-order adsorptions,
respectively; qt (mg/g) denotes the adsorption capacity at
time t (min), and qe (mg/g) is the adsorption capacity at
equilibrium. For the pseudo-second-order kinetic model,
initial adsorption rate (h = k2qe2) can be estimated using
the parameters of the kinetic model. Initial adsorption rate
refers to the quantity of metal adsorbed per unit mass of
adsorbent and unit time. A high value of h means that metal
ions, are quickly adsorbed in the first minutes of the
adsorption process.
Results and discussion
Metal species in aqueous solutions
Figure 1 shows the speciation diagrams of lead and copper
for a total concentration of 1.20 and 4.72 mmol/L,
respectively. These diagrams were computed using
MEDUSA software (Puigdomenech 2010) that is based on
equilibrium reactions. Speciation diagrams allow selecting
the pH for adsorption experiments to avoid metal precipi-
tation and to identify the metal species in aqueous solution.
According to the speciation diagrams (Fig. 1), adsorption
experiments must be conducted below 5.2 and 5.6 for
Cu(II) and Pb(II) species, respectively.
Chemical characterization
The results given in Table 2 and Fig. 2 showed that the
chemical modification of coffee grains led to an increase in
the quantity of carboxylic groups and a decrease in the
point of zero charge on the biosorbent surface. Marshall
and Wartelle (Marshall et al. 2003) found a similar result,
however, the equilibrium constants were not reported. In
the present research, the quantity of functional groups their
equilibrium constants, and point of zero charge were esti-
mated by potentiometric titrations, and these data are
shown in Table 2 A high quantity of carboxyl groups
(2.2 mmol/g) was determined for MSCG-0.6 M in com-
parison with MSCG-0.1 M (0.47 mmol/g). In addition,
equilibrium constants of functional groups (3.99–4.25 and
7.02–8.36) could be associated with those reported for
carboxylic groups of citric acid (3.13, 4.78, and 6.40)
(Brown et al. 2005). Carboxylic groups were also identified
by means of ATR-FTIR analyses at 1,740 cm-1 as shown
in Fig. 2. This peak was increased when citric acid
Table 1 Experimental conditions for desorption tests
Metal Mass
(mg)
Adsorption Desorption
initial
concentration
(mmol/L)
pH Solution
volume
(mL)
0.1 M HCl
volume (mL)
Pb(II) 50 1.00 4 100 100
Cu(II) 100 2.88 5 40 40
614 Int. J. Environ. Sci. Technol. (2013) 10:611–622
123
concentration rose from 0.1 to 0.6 M, showing greater
transmittance peaks than those of NMSCG. As mentioned
previously, citric acid modification incorporates carboxylic
groups to biosorbent, but these groups were not detected by
potentiometric titrations on non-modified biosorbent,
because calcium is bound to carboxylic groups and its
releasing did not cause a pH changing along potentiometric
titration (Garcia-Reyes et al. 2009).
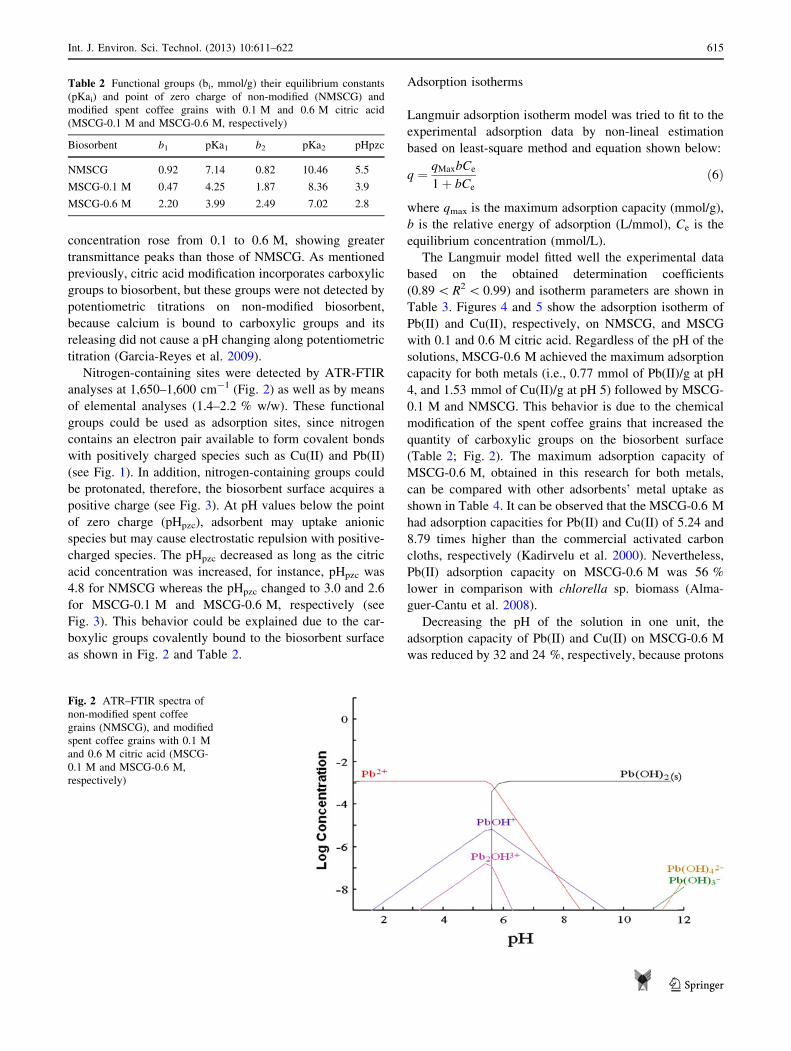
Nitrogen-containing sites were detected by ATR-FTIR
analyses at 1,650–1,600 cm-1 (Fig. 2) as well as by means
of elemental analyses (1.4–2.2 % w/w). These functional
groups could be used as adsorption sites, since nitrogen
contains an electron pair available to form covalent bonds
with positively charged species such as Cu(II) and Pb(II)
(see Fig. 1). In addition, nitrogen-containing groups could
be protonated, therefore, the biosorbent surface acquires a
positive charge (see Fig. 3). At pH values below the point
of zero charge (pHpzc), adsorbent may uptake anionic
species but may cause electrostatic repulsion with positive-
charged species. The pHpzc decreased as long as the citric
acid concentration was increased, for instance, pHpzc was
4.8 for NMSCG whereas the pHpzc changed to 3.0 and 2.6
for MSCG-0.1 M and MSCG-0.6 M, respectively (see
Fig. 3). This behavior could be explained due to the car-
boxylic groups covalently bound to the biosorbent surface
as shown in Fig. 2 and Table 2.
Adsorption isotherms
Langmuir adsorption isotherm model was tried to fit to the
experimental adsorption data by non-lineal estimation
based on least-square method and equation shown below:
q ¼ qMaxbCe
1þ bCe
ð6Þ
where qmax is the maximum adsorption capacity (mmol/g),
b is the relative energy of adsorption (L/mmol), Ce is the
equilibrium concentration (mmol/L).
The Langmuir model fitted well the experimental data
based on the obtained determination coefficients
(0.89 \ R2 \ 0.99) and isotherm parameters are shown in
Table 3. Figures 4 and 5 show the adsorption isotherm of
Pb(II) and Cu(II), respectively, on NMSCG, and MSCG
with 0.1 and 0.6 M citric acid. Regardless of the pH of the
solutions, MSCG-0.6 M achieved the maximum adsorption
capacity for both metals (i.e., 0.77 mmol of Pb(II)/g at pH
4, and 1.53 mmol of Cu(II)/g at pH 5) followed by MSCG-
0.1 M and NMSCG. This behavior is due to the chemical
modification of the spent coffee grains that increased the
quantity of carboxylic groups on the biosorbent surface
(Table 2; Fig. 2). The maximum adsorption capacity of
MSCG-0.6 M, obtained in this research for both metals,
can be compared with other adsorbents’ metal uptake as
shown in Table 4. It can be observed that the MSCG-0.6 M
had adsorption capacities for Pb(II) and Cu(II) of 5.24 and
8.79 times higher than the commercial activated carbon
cloths, respectively (Kadirvelu et al. 2000). Nevertheless,
Pb(II) adsorption capacity on MSCG-0.6 M was 56 %
lower in comparison with chlorella sp. biomass (Alma-
guer-Cantu et al. 2008).
Decreasing the pH of the solution in one unit, the
adsorption capacity of Pb(II) and Cu(II) on MSCG-0.6 M
was reduced by 32 and 24 %, respectively, because protons
Table 2 Functional groups (bi, mmol/g) their equilibrium constants
(pKai) and point of zero charge of non-modified (NMSCG) and
modified spent coffee grains with 0.1 M and 0.6 M citric acid
(MSCG-0.1 M and MSCG-0.6 M, respectively)
Biosorbent b1 pKa1 b2 pKa2 pHpzc
NMSCG 0.92 7.14 0.82 10.46 5.5
MSCG-0.1 M 0.47 4.25 1.87 8.36 3.9
MSCG-0.6 M 2.20 3.99 2.49 7.02 2.8
Fig. 2 ATR–FTIR spectra of
non-modified spent coffee
grains (NMSCG), and modified
spent coffee grains with 0.1 M
and 0.6 M citric acid (MSCG-
0.1 M and MSCG-0.6 M,
respectively)
Int. J. Environ. Sci. Technol. (2013) 10:611–622 615
123
and metal species compete by the same adsorption sites
(i.e., carboxylic groups). Carboxylic groups are partially
protonated at pH 3 and 4 given that their equilibrium
constants are around 3.99–4.25 (see Table 2). A number of
researchers (Wartelle et al. 2000; Altundogan et al. 2007;
Zhu et al. 2008) have reported that the metal-adsorption
capacity, on citric acid modified lignocellulosic materials,
decreased with decreasing the pH of the solution as pre-
sented in this study.
To compare the adsorption capacity of Pb(II) and Cu(II) on
spent coffee grains, the same pH value must be selected, since
the quantity of ionized functional groups depends on the pH
of the solution. For example, at pH 4, the maximum adsorp-
tion capacity of Pb(II) on NMSG and MSCG-0.1 M was 2.18
and 1.4 times higher than Cu(II), respectively. However, the
maximum adsorption capacity of Cu(II) on MSCG-0.6 M
was around 1.5 times higher that the obtained for Pb(II). This
metal-adsorption ratio [Cu(II)/Pb(II) = 1.5] was also
reported for granular-activated carbon (Sulaymon et al.
2009). Similarly, a higher adsorption of Cu(II) than Pb(II)
[Cu(II)/Pb(II) = 1.2] was obtained using activated carbon
cloths as adsorbent (Kadirvelu et al. 2000).
In addition, Dubini-Radushkevich isotherm model (Eq.
7) was tried to fit to the experimental adsorption data by
non-lineal estimation based on least-square method:
q ¼ qme�be2 ð7Þ
where qm is the Dubinin-Radushkevich monolayer capacity
(mmol/g), b is a constant related to adsorption energy (mol2/
J2), and e is the Polanyi potential (J/mol) which is related to
the equilibrium concentration (Ce, mol/L) as follows:
e ¼ RT ln 1þ 1
Ce
� �ð8Þ
where R is the gas constant (8.314 J/mol K) and T is the
absolute temperature.
-3.00
-2.50
-2.00
-1.50
-1.00
-0.50
0.00
0.50
1.00
0 1 2 3 4 5 6 7 8 9 10 11 12
Rel
ease
d io
ns
(mm
ol/g
)
pH
NMSCG
MSCG-0.1M
MSCG-0.6M
Fig. 3 Surface charge
distribution of the tested
biosorbents. Ionic strength was
fixed with 0.1 N NaCl
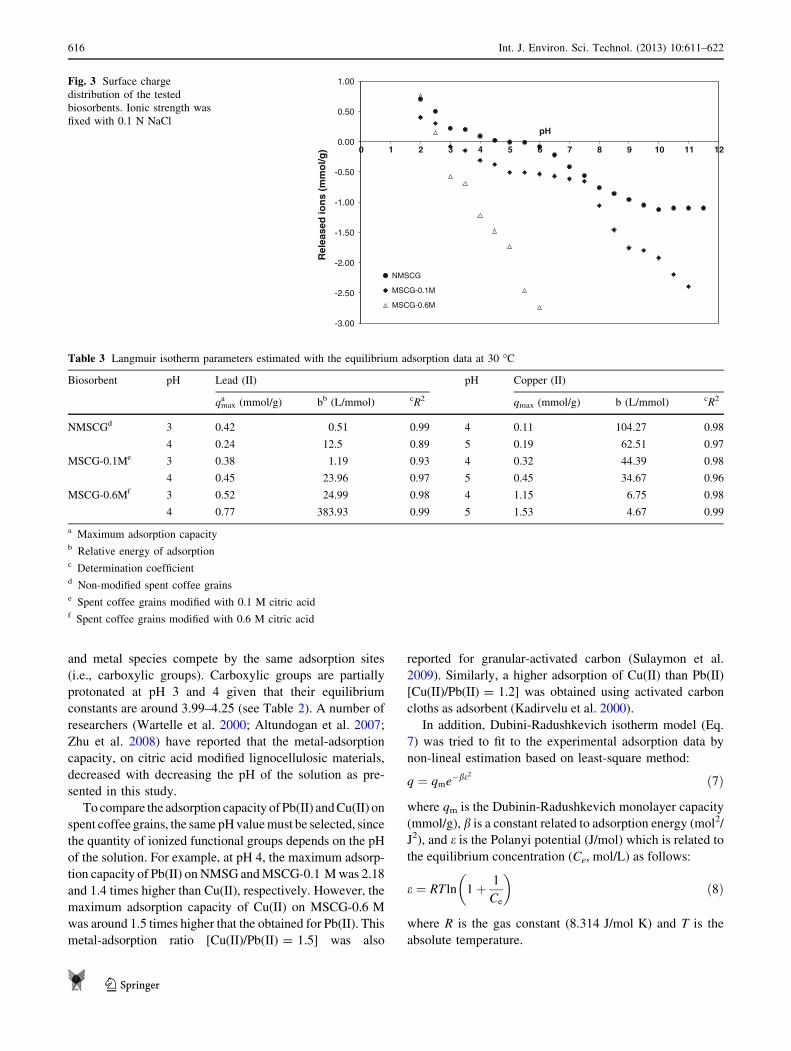
Table 3 Langmuir isotherm parameters estimated with the equilibrium adsorption data at 30 �C
Biosorbent pH Lead (II) pH Copper (II)
qmaxa (mmol/g) bb (L/mmol) cR2 qmax (mmol/g) b (L/mmol) cR2
NMSCGd 3 0.42 0.51 0.99 4 0.11 104.27 0.98
4 0.24 12.5 0.89 5 0.19 62.51 0.97
MSCG-0.1Me 3 0.38 1.19 0.93 4 0.32 44.39 0.98
4 0.45 23.96 0.97 5 0.45 34.67 0.96
MSCG-0.6Mf 3 0.52 24.99 0.98 4 1.15 6.75 0.98
4 0.77 383.93 0.99 5 1.53 4.67 0.99
a Maximum adsorption capacityb Relative energy of adsorptionc Determination coefficientd Non-modified spent coffee grainse Spent coffee grains modified with 0.1 M citric acidf Spent coffee grains modified with 0.6 M citric acid
616 Int. J. Environ. Sci. Technol. (2013) 10:611–622
123

The constant b is related to the mean free energy of
adsorption per mol of the adsorbate (E, kJ/mol) when it is
transferred to the surface of the solid from infinity in the
solution and E can be estimated as follows:
E ¼ 1ffiffiffiffiffiffi2bp ð9Þ
Table 5 shows the Dubini-Radushkevich isotherm
parameters for NMSCG, MSCG-0.1 M and MSCG-0.6 M
at 30 �C. The high values of qm shows high adsorption
capacity in comparison to Langmuir isotherm. Moreover,
the free energy of adsorption values (4–40 kJ/mol)
suggests that physical adsorption process occurs at the
adsorbent surface (MWH 2005).
Desorption experiments
Figure 6 shows the adsorption and desorption capacity of
Pb(II) and Cu(II) on NMSCG and MSCG-0.6 M. Chemical
modification enhanced the metal adsorption capacity (as
previously discussed) and desorption capacity also
increased because the quantity of the adsorbed metal
allows releasing a higher amount of metal with 0.1 N HCl
solutions. For instance, the desorption capacity of Pb(II)
increased from 0.23 to 0.53 mmol/g for non-modified and
modified (with 0.6 M citric acid) spent coffee grains,
respectively.
Nevertheless, if the desorption percentage of Pb(II) and
Cu(II) is compared, there are differences between the tested
biosorbents. Desorption percentage decreased after chemi-
cal modification probably due to a chelation mechanism.
Based on results shown in Fig. 6, desorption percentage of
Pb(II) and Cu(II) for NMSCG was 85 and 93 %, respec-
tively, and these percentages decreased 20 and 29 % when
the biosorbent was modified with 0.6 M citric acid. If Pb(II)
and Cu(II) percentage recovery on MSCG-0.6 M is com-
pared, it is observed that these results are quite similar
(around 64 %), because the stability constants for formation
of bidentate complexes of citrate with Pb2? (13.1) and Cu2?
(13.8) species are similar too (Stumm and Morgan 1995).
0
0.1
0.2
0.3
0.4
0.5
0.6a
b
0 0.1 0.2 0.3 0.4 0.5 0.6 0.7 0.8 0.9 1
Ad
sorp
tio
n c
apac
ity
(mm
ol P
b/g
)Equilibrium concentration (mmol/L)
0
0.1
0.2
0.3
0.4
0.5
0.6
0.7
0.8
0.9
0 0.1 0.2 0.3 0.4 0.5 0.6 0.7 0.8 0.9 1
Ad
sorp
tio
n c
apac
ity
(mm
ol P
b/g
)
Equilibrium concentration (mmol/L)
Fig. 4 Adsorption isotherm of
Pb(II) at a pH 3 and b pH 4 on
non-modified spent coffee
grains (filled circle NMSCG),
and spent coffee grains modified
with 0.1 M and 0.6 M citric
acid (filled diamond MSCG-
0.1 M and opened triangleMSCG-0.6 M, respectively).
Symbols and lines represent the
experimental data and the
predicted adsorption capacity
with the Langmuir model,
respectively
Int. J. Environ. Sci. Technol. (2013) 10:611–622 617
123

Taking into account that a high quantity of adsorbed
metal (35 %) was not released to the solution in the
desorption process, it could reduce the number of adsorp-
tion–desorption cycles in a continuous operation. In addi-
tion a high-concentration solution of HCl as eluent is not
recommended due to the structure damage of biosorbent,
which affect the biosorbent metal adsorption capacity.
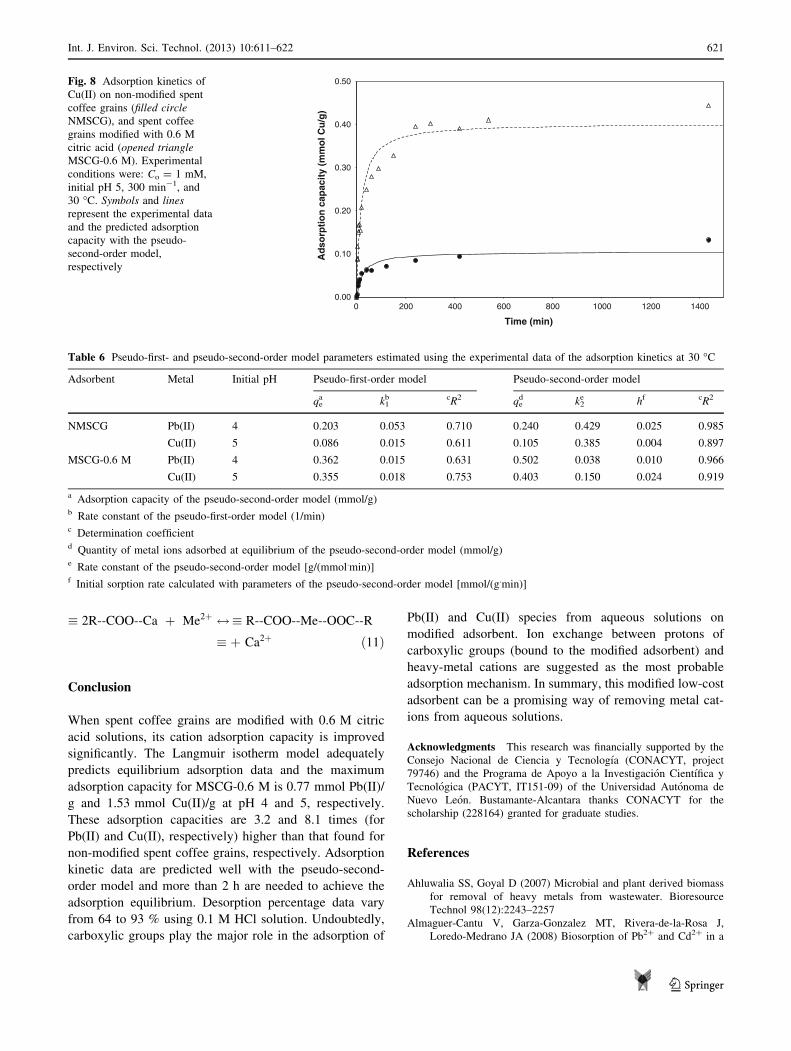
Adsorption kinetics
Figures 7 and 8 show the adsorption kinetics of Pb(II) and
Cu(II) on NMSCG and MSCG-0.6 M. A higher adsorption
rate was observed in the first hour for both adsorbents
but this rate decreased with time. Chemical modification
affected the required time to achieve equilibrium; for
example, MSCG-0.6 M needed more time in comparison
with the NMSPG for both metals, due to the increment
of carboxylic groups on MSCG-0.6 M (see Table 2).
Adsorption equilibrium for NMSCG was approximately
achieved in 120 and 200 min for Pb(II) and Cu(II),
respectively, whereas for MSCG-0.6 M was 400 min for
both Cu(II) and Pb(II). Similar results had been obtained
using other adsorbents (Shin et al. 2007; Ofomaja 2010).
The kinetic models of pseudo-first order and pseudo-sec-
ond order were tested to fit the experimental data. The
pseudo-second-order kinetic model (Eq. 5) was selected to
predict experimental kinetic data for both metals based on its
determination coefficient (0.897 \ R2 \ 0.985), since these
values were higher than those obtained for the pseudo-first-
order model (0.611 \ R2 \ 0.753). Table 6 shows the esti-
mated constants of the pseudo-first- and pseudo-second-order
kinetic models. The rate constant of the pseudo-second-order
model (k2) of Cu(II) at pH 5 for MSCG-0.6 M was about 2.5
times lower than that estimated for NMSCG. Furthermore,
the equilibrium adsorption capacity were almost similar for
MSCG-0.6 M (i.e., 0.403 mmol Cu(II)/g and 0.502 mmol
Pb(II)/g), because the final solution pH in kinetic experiments
was similar for both metals (around 3.3).
It is important to mention that the initial adsorption rate
(h) of Cu(II) was higher than that found for Pb(II) on
MSCG-0.6 M. On the contrary, initial adsorption rate of
Cu(II) was 6.25 times lower that that of Pb(II) on NMSCG.
0
0.2
0.4
0.6
0.8
1
a
b
0 0.5 1 1.5 2 2.5
Ad
sorp
tio
n c
apac
ity
(mm
ol C
u/g
)Equilibrium concentration (mmol/L)
0
0.2
0.4
0.6
0.8
1
1.2
1.4
1.6
0 0.2 0.4 0.6 0.8 1 1.2 1.4 1.6
Ad
sorp
tio
n c
apac
ity
(mm
ol C
u/g
)
Equilibrium concentration (mmol/L)
Fig. 5 Adsorption isotherm of
Cu(II) at a pH 4 and b pH 5 on
non-modified spent coffee
grains (filled circle NMSCG),
and spent coffee grains modified
with 0.1 M and 0.6 M citric
acid (filled diamond MSCG-
0.1 M and opened triangleMSCG-0.6 M, respectively).
Symbols and lines represent the
experimental data and the
predicted adsorption capacity
with the Langmuir model,
respectively
618 Int. J. Environ. Sci. Technol. (2013) 10:611–622
123
When SGC were modified with citric acid 0.6 M, the
equilibrium adsorption capacity of copper and lead
(Table 6) was increased 3.83 and 2.10 times, respectively.
These results can be explained by the augmentation of
carboxylic groups on adsorbent surface (Table 2) after
chemical modification with citric acid.
Adsorption mechanisms
The adsorption mechanism is a difficult task due to the
complex nature of the adsorbent. However, considering the
carboxylic groups covalently bound to the biosorbent sur-
face after citric acid modification (Table 2 and Fig. 2) and,
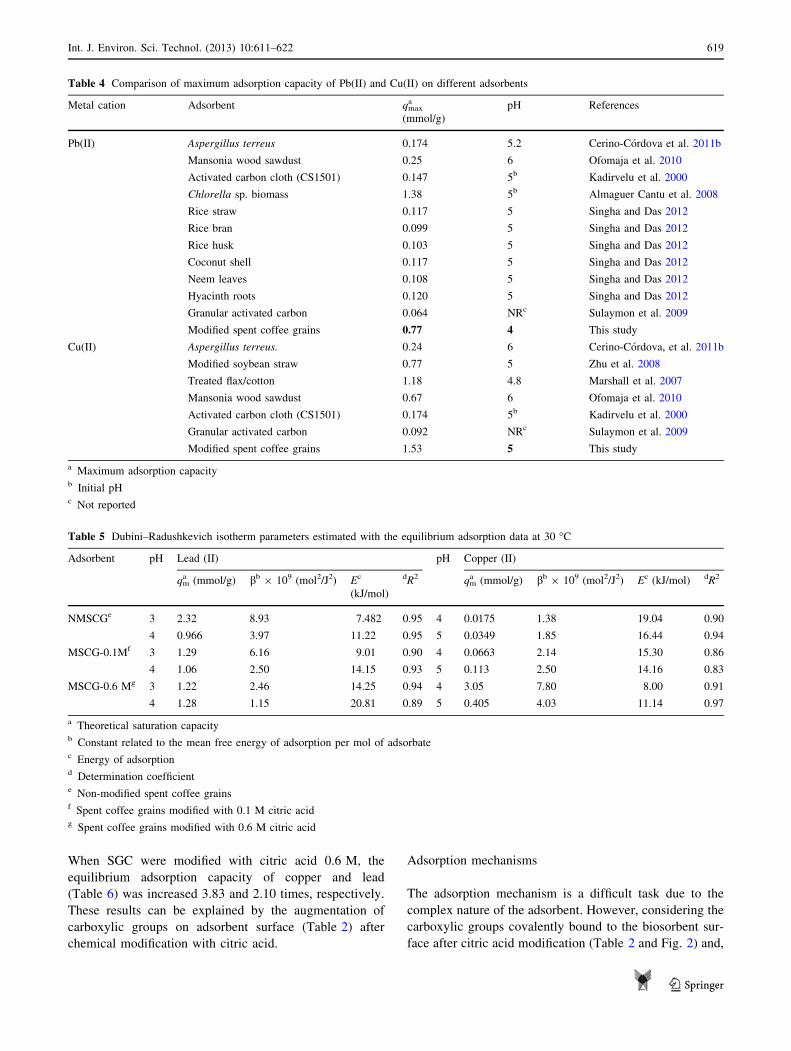
Table 4 Comparison of maximum adsorption capacity of Pb(II) and Cu(II) on different adsorbents
Metal cation Adsorbent qmaxa
(mmol/g)
pH References
Pb(II) Aspergillus terreus 0.174 5.2 Cerino-Cordova et al. 2011b
Mansonia wood sawdust 0.25 6 Ofomaja et al. 2010
Activated carbon cloth (CS1501) 0.147 5b Kadirvelu et al. 2000
Chlorella sp. biomass 1.38 5b Almaguer Cantu et al. 2008
Rice straw 0.117 5 Singha and Das 2012
Rice bran 0.099 5 Singha and Das 2012
Rice husk 0.103 5 Singha and Das 2012
Coconut shell 0.117 5 Singha and Das 2012
Neem leaves 0.108 5 Singha and Das 2012
Hyacinth roots 0.120 5 Singha and Das 2012
Granular activated carbon 0.064 NRc Sulaymon et al. 2009
Modified spent coffee grains 0.77 4 This study
Cu(II) Aspergillus terreus. 0.24 6 Cerino-Cordova, et al. 2011b
Modified soybean straw 0.77 5 Zhu et al. 2008
Treated flax/cotton 1.18 4.8 Marshall et al. 2007
Mansonia wood sawdust 0.67 6 Ofomaja et al. 2010
Activated carbon cloth (CS1501) 0.174 5b Kadirvelu et al. 2000
Granular activated carbon 0.092 NRc Sulaymon et al. 2009
Modified spent coffee grains 1.53 5 This study
a Maximum adsorption capacityb Initial pHc Not reported
Table 5 Dubini–Radushkevich isotherm parameters estimated with the equilibrium adsorption data at 30 �C
Adsorbent pH Lead (II) pH Copper (II)
qma (mmol/g) bb 9 109 (mol2/J2) Ec
(kJ/mol)
dR2 qma (mmol/g) bb 9 109 (mol2/J2) Ec (kJ/mol) dR2
NMSCGe 3 2.32 8.93 7.482 0.95 4 0.0175 1.38 19.04 0.90
4 0.966 3.97 11.22 0.95 5 0.0349 1.85 16.44 0.94
MSCG-0.1Mf 3 1.29 6.16 9.01 0.90 4 0.0663 2.14 15.30 0.86
4 1.06 2.50 14.15 0.93 5 0.113 2.50 14.16 0.83
MSCG-0.6 Mg 3 1.22 2.46 14.25 0.94 4 3.05 7.80 8.00 0.91
4 1.28 1.15 20.81 0.89 5 0.405 4.03 11.14 0.97
a Theoretical saturation capacityb Constant related to the mean free energy of adsorption per mol of adsorbatec Energy of adsorptiond Determination coefficiente Non-modified spent coffee grainsf Spent coffee grains modified with 0.1 M citric acidg Spent coffee grains modified with 0.6 M citric acid
Int. J. Environ. Sci. Technol. (2013) 10:611–622 619
123

also taking into account the Pb(II) and Cu(II) species
present in aqueous solutions (Fig. 1), the following
mechanisms based on exchange of protons (H?) and
divalent metal cations (Me2?) are proposed:
� 2R--COOH þ Me2þ $� R--COO--Me--OOC--R
� þ 2Hþ ð10Þ
This adsorption mechanism was also suggested by other
researchers (Leyva-Ramos et al. 2005), who modified the
corncob with citric acid and adsorbed cadmium from
aqueous solutions. Other authors have reported the same
adsorption mechanism for trivalent chromium on
protonated alginate beads (Ibanez and Umetsu 2004) and
agro-waste biosorbents (Garcia-Reyes et al. 2009). It is
important to mention that this adsorption mechanism seems
to be the most probable, since pH of solution decreases
(i.e., protons were released to the solution due to the ion-
exchange process) during the equilibrium and kinetic
adsorption experiments. In the equilibrium experiments, a
known volume of 0.1 N NaOH was added to the solution to
keep constant the pH value. In addition, equilibrium
constants of carboxylic groups (covalently bound to the
MSCG) allow the interaction between metal cations and
the ionized carboxylic groups.
On the contrary, non-modified spent coffee adsorbed a
considerable quantity of Pb(II) or Cu(II), even higher than
the commercial granular-activated carbon (Sulaymon et al.
2009) and activated carbon cloths (Kadirvelu et al. 2000)
although this adsorption cannot be explained completely by
a proton-exchange mechanism as shown in Eq. 10. Car-
boxylic groups on NMSCG were not detected by potenti-
ometric titrations, because calcium release did not cause a
changing in solution pH that is essential for potentiometric
analyses. Nonetheless, carboxylic groups on NMSCG were
identified in ATR-FTIR spectra (Fig. 2) and metal cations
were adsorbed on NMSCG (Figs. 4 and 5). Therefore, a
calcium-exchange mechanism seems to be feasible as
proposed by other authors (Reddad et al. 2002):
0.27
0.82
0.29
0.95
0.23
0.53
0.27
0.61
0
0.1
0.2
0.3
0.4
0.5
0.6
0.7
0.8
0.9
1
NMSCG MSCG-0.6M NMSCG MSCG-0.6M
Lead (II) Copper (II)A
dso
rpti
on
/des
orp
tio
n c
apac
ity
(mm
ol/g
) Adsorption
Desorption
Fig. 6 Adsorption and
desorption capacities of Pb(II)
and Cu(II) on non-modified
spent coffee grains (NMSCG),
and spent coffee grains modified
with 0.6 M citric acid (MSCG-
0.6 M)
0
0.1
0.2
0.3
0.4
0.5
0.6
0 200 400 600 800 1000 1200 1400
Ad
sorp
tio
n c
apac
ity
(mm
ol P
b/g
)
Time (min)
Fig. 7 Adsorption kinetics of
Pb(II) on non-modified spent
coffee grains (filled circleNMSCG), and modified spent
coffee grains with 0.6 M citric
acid (opened triangle MSCG-
0.6 M). Experimental
conditions were: Co = 1 mM,
initial pH 4, 300 min-1, and
30 �C. Symbols and linesrepresent the experimental data
and the predicted adsorption
capacity with the pseudo-
second-order model,
respectively
620 Int. J. Environ. Sci. Technol. (2013) 10:611–622
123
� 2R--COO--Ca þ Me2þ $� R--COO--Me--OOC--R
� þ Ca2þ ð11Þ
Conclusion
When spent coffee grains are modified with 0.6 M citric
acid solutions, its cation adsorption capacity is improved
significantly. The Langmuir isotherm model adequately
predicts equilibrium adsorption data and the maximum
adsorption capacity for MSCG-0.6 M is 0.77 mmol Pb(II)/
g and 1.53 mmol Cu(II)/g at pH 4 and 5, respectively.
These adsorption capacities are 3.2 and 8.1 times (for
Pb(II) and Cu(II), respectively) higher than that found for
non-modified spent coffee grains, respectively. Adsorption
kinetic data are predicted well with the pseudo-second-
order model and more than 2 h are needed to achieve the
adsorption equilibrium. Desorption percentage data vary
from 64 to 93 % using 0.1 M HCl solution. Undoubtedly,
carboxylic groups play the major role in the adsorption of
Pb(II) and Cu(II) species from aqueous solutions on
modified adsorbent. Ion exchange between protons of
carboxylic groups (bound to the modified adsorbent) and
heavy-metal cations are suggested as the most probable
adsorption mechanism. In summary, this modified low-cost
adsorbent can be a promising way of removing metal cat-
ions from aqueous solutions.
Acknowledgments This research was financially supported by the
Consejo Nacional de Ciencia y Tecnologıa (CONACYT, project
79746) and the Programa de Apoyo a la Investigacion Cientıfica y
Tecnologica (PACYT, IT151-09) of the Universidad Autonoma de
Nuevo Leon. Bustamante-Alcantara thanks CONACYT for the
scholarship (228164) granted for graduate studies.
References
Ahluwalia SS, Goyal D (2007) Microbial and plant derived biomass
for removal of heavy metals from wastewater. Bioresource
Technol 98(12):2243–2257
Almaguer-Cantu V, Garza-Gonzalez MT, Rivera-de-la-Rosa J,
Loredo-Medrano JA (2008) Biosorption of Pb2? and Cd2? in a
0.00
0.10
0.20
0.30
0.40
0.50
0 200 400 600 800 1000 1200 1400
Ad
sorp
tio
n c
apac
ity
(mm
ol C
u/g
)Time (min)
Fig. 8 Adsorption kinetics of
Cu(II) on non-modified spent
coffee grains (filled circleNMSCG), and spent coffee
grains modified with 0.6 M
citric acid (opened triangleMSCG-0.6 M). Experimental
conditions were: Co = 1 mM,
initial pH 5, 300 min-1, and
30 �C. Symbols and linesrepresent the experimental data
and the predicted adsorption
capacity with the pseudo-
second-order model,
respectively
Table 6 Pseudo-first- and pseudo-second-order model parameters estimated using the experimental data of the adsorption kinetics at 30 �C
Adsorbent Metal Initial pH Pseudo-first-order model Pseudo-second-order model
qea k1
b cR2 qed k2
e hf cR2
NMSCG Pb(II) 4 0.203 0.053 0.710 0.240 0.429 0.025 0.985
Cu(II) 5 0.086 0.015 0.611 0.105 0.385 0.004 0.897
MSCG-0.6 M Pb(II) 4 0.362 0.015 0.631 0.502 0.038 0.010 0.966
Cu(II) 5 0.355 0.018 0.753 0.403 0.150 0.024 0.919
a Adsorption capacity of the pseudo-second-order model (mmol/g)b Rate constant of the pseudo-first-order model (1/min)c Determination coefficientd Quantity of metal ions adsorbed at equilibrium of the pseudo-second-order model (mmol/g)e Rate constant of the pseudo-second-order model [g/(mmol.min)]f Initial sorption rate calculated with parameters of the pseudo-second-order model [mmol/(g.min)]
Int. J. Environ. Sci. Technol. (2013) 10:611–622 621
123
Fixed Bed Column with immobilised Chorella sp. Biomass.
Water Sci Technol 58(5):1061–1069
Altundogan HS, Arslan NE, Tumen F (2007) Copper removal from
aqueous solutions by sugar beet pulp treated by NaOH and citric
acid. J Hazard Mater 149(2):432–439
Babic BM, Milonjic SK, Polovina MJ, Kaludierovic BV (1999) Point
of zero charge and intrinsic equilibrium constants of activated
carbon cloth. Carbon 37(3):477–481
Basha S, Murthy ZVP, Jha B (2009) Removal of Cu(II) and Ni(II)
from Industrial Effluents by Brown Seaweed, Cystoseira indica.
Ind Eng Chem Res 48(2):961–975
Boonamnuayvitaya V, Chaiya C, Tanthapanichakoon W, Jarudilokkul
S (2004) Removal of heavy metals by adsorbent prepared from
pyrolyzed coffee residues and clay. Sep Purific Technol
35(1):11–22
Brown TL, LeMay HGJ, Bruce EB, Burdge JR (2005) Chemistry The
central science, 10th edn. Prentice Hall, New Jersey
Cerino-Cordova FJ, Garcia-Leon AM, Soto-Regalado E, Sanchez-
Gonzalez MN, Lozano-Ramirez T, Garcia-Avalos BC, Loredo-
Medrano JA (2011) Experimental design for the optimization of
copper biosorption from aqueous solution by Aspergillus terreus.
J Environ Manage 95:S77–S82
Cerino-Cordova FJ, Garcıa-Leon AM, Garcia-Reyes RB, Garza-
Gonzalez MT, Soto-Regalado E, Sanchez-Gonzalez MN, Quez-
ada-Lopez I (2011) Response surface methodology for lead
biosorption on Aspergillus terreus. Int J Environ Sci Technol
8(4):695–704
Chojnacka K (2010) Biosorption and bioaccumulation—the prospects
for practical applications. Environ Int 36(3):299–307
Garcia-Reyes RB, Rangel-Mendez JR (2009) Contribution of agro-
waste material main components (hemicelluloses, cellulose, and
lignin) to the removal of chromium (III) from aqueous solution.
J Chem Technol Biotechnol 84(10):1533–1538
Garcia-Reyes RB, Rangel-Mendez JR (2010) Adsorption kinetics of
chromium(III) ions on agro-waste materials. Bioresource Tech-
nol 101(21):8099–8108
Garcia-Reyes RB, Rangel-Mendez JR, Alfaro-De la Torre MC (2009)
Chromium (III) uptake by agro-waste biosorbents: Chemical
characterization, sorption-desorption studies, and mechanism.
J Hazard Mater 170(23):845–854
Guillard D, Lewis AE (2001) Nickel carbonate precipitation in a
fluidized-bed reactor. Ind Eng Chem Res 40(2–3):5564–5569
Ibanez JP, Umetsu Y (2004) Uptake of trivalent chromium from
aqueous solutions using protonated dry alginate beads. Hydro-
metallurgy 72(3–4):327–334
Kadirvelu K, Faur-Brasquet C, Le Cloirec P (2000) Removal of
Cu(II), Pb(II), and Ni(II) by adsorption onto activated carbon
cloths. Langmuir 16(22):8404–8409
Kaim W, Schwederski B (1994) Bioinorganic chemistry: inorganic
elements in the chemistry of life: an introduction and guide.
Wiley, New York
Kumar YP, King P, Prasad V (2007) Adsorption of zinc from aqueous
solution using marine green algae—Ulva fasciata sp. Chem Eng
J 129(1–3):161–166
Kumar R, Bishnoi NR, Garima, Garima K (2008) Biosorption of
chromium(VI) from aqueous solution and electroplating waste-
water using fungal biomass. Chem Eng J 135(3):202–208
Leyva-Ramos R, Bernal-Jacome LA, Acosta-Rodriguez I (2005)
Adsorption of cadmium(II) from aqueous solution on natural and
oxidized corncob. Sep Purific Technol 45(1):41–49
Marshall WE, Wartelle LH (2003) Acid recycling to optimize citric
acid-modified soybean hull production. Ind Crop Prod
18(2):177–182
Marshall WE, Akin DE, Wartelle LH, Annis PA (2007) Citric acid
treatment of flax, cotton and blended nonwoven mats for copper
ion absorption. Ind Crop Prod 26(1):8–13
Martin-Lara MA, Rico ILR, Vicente IDA, Garcia GB, de Hoces MC
(2010) Modification of the sorptive characteristics of sugarcane
bagasse for removing lead from aqueous solutions. Desalination
256(1–3):58–63
Matlock MM, Howerton BS, Atwood DA (2002) Chemical precip-
itation of lead from lead battery recycling plant wastewater. Ind
Eng Chem Res 41(6):1579–1582
MWH (2005) Water treatment: principles and design 2nd Ed., Wiley,
New Jersey
Naiya TK, Bhattacharya AK, Das SK (2008) Adsorption of Pb(II) by
sawdust and neem bark from aqueous solutions. Environ Prog
27(3):313–328
Naiya TK, Bhattacharya AK, Das SK (2009a) Adsorption of Cd(II)
and Pb(II) from aqueous solutions on activated alumina. J Colloid
Inter Sci 333(1):14–26
Naiya TK, Bhattacharya AK, Mandal S, Das SK (2009b) The sorption
of lead(II) ions on rice husk ash. J Hazard Mater
163(2–3):1254–1264
Ng JCY, Cheung WH, McKay G (2002) Equilibrium studies of the
sorption of Cu(II) ions onto chitosan. J Colloid Inter Sci
255(1):64–74
Ofomaja AE (2010) Equilibrium studies of copper ion adsorption onto
palm kernel fibre. J Environ Manage 91(7):1491–1499
Oliveira LS, Franca AS, Alves TM, Rocha SDF (2008) Evaluation of
untreated coffee husks as potential biosorbents for treatment of
dye contaminated waters. J Hazard Mater 155(3):507–512
Pagnanelli F, Mainelli S, Toro L (2008) New biosorbent materials for
heavy metal removal: product development guided by active site
characterization. Water Res 42(12):2953–2962
Puigdomenech I. (2010). ‘‘MEDUSA.’’ 2011, from http://www.kemi.
kth.se/medusa
Reddad Z, Gerente C, Andres Y, Le Cloirec P (2002) Adsorption of
several metal ions onto a low-cost biosorbent: kinetic and
equilibrium studies. Environ Sci Technol 36(9):2067–2073
Romera E, Gonzalez F, Ballester A, Blazquez ML, Munoz JA (2006)
Biosorption with algae: a statistical review. Crit Rev Biotechnol
26(4):223–235
Shin EW, Karthikeyan KG, Tshabalala MA (2007) Adsorption
mechanism of cadmium on juniper bark and wood. Bioresource
Technol 98(3):588–594
Singha B, Das SK (2012) Removal of Pb(II) ions from aqueous
solution and industrial effluent using natural biosorbents. Envi-
ron Sci Pollut Res. doi:10.1007/s11356-011-0725-8
Stumm W, Morgan JJ (1995) Aquatic chemistry: chemical equilibria
and rates in natural waters. Wiley, New York
Sud D, Mahajan G, Kaur MP (2008) Agricultural waste material as
potential adsorbent for sequestering heavy metal ions from aqueous
solutions: a review. Bioresource Technol 99(14):6017–6027
Sulaymon AH, Abid BA, Al-Najar JA (2009) Removal of lead copper
chromium and cobalt ions onto granular activated carbon in
batch and fixed-bed adsorbers. Chem Eng J 155(3):647–653
Utomo HD, Hunter KA (2006) Adsorption of divalent copper, zinc,
cadmium and lead ions from aqueous solution by waste tea and
coffee adsorbents. Environ Technol 27(1):25–32
Valverde JL, de Lucas A, Gonzalez M, Rodriguez JF (2001) Ion-
exchange equilibria of Cu2?, Cd2?, Zn2?, and Na? ions on the
cationic exchanger amberlite IR-120. J Chem Eng Data
46(6):1404–1409
Wartelle LH, Marshall WE (2000) Citric acid modified agricultural
by-products as copper ion adsorbents. Adv Environ Res 4(1):1–7
Yun YS, Park D, Park JM, Volesky B (2001) Biosorption of trivalent
chromium on the brown seaweed biomass. Environ Sci Technol
35(21):4353–4358
Zhu B, Fan TX, Zhang D (2008) Adsorption of copper ions from
aqueous solution by citric acid modified soybean straw. J Hazard
Mater 153(1–2):300–308
622 Int. J. Environ. Sci. Technol. (2013) 10:611–622
123
Top Related