


![Review Viral clearance for biopharmaceutical downstream ... · Viral clearance for biopharmaceutical downstream processes ... [13]. Hence a panel of ... Viral clearance for biopharmaceutical](https://static.fdocuments.in/doc/165x107/5ad5f65c7f8b9a5d058dd2b7/review-viral-clearance-for-biopharmaceutical-downstream-clearance-for-biopharmaceutical.jpg)


Languages
Pages
Legal

Case Studies of Established Conditions in Manufacturing Process
Toshiyuki Suzawa, Ph.D.Kyowa Hakko Kirin Co., Ltd.
Biopharmaceutical CommitteeTechnology Working Committee
JPMA06, Dec., 2016
CMC Strategy Forum Japan 2016
1

Contents
• Objectives
• Evaluation Scheme and Terminology
• Anticipated Manufacturing Process and Assumptions for Case Study
• Procedure for Determination of ECs
– Cell Culture Process
– Purification Process
• Summary
2

Objectives
• Investigate “model” Approval Matters (Established Conditions (ECs)) and their determination scheme using a “model” biopharmaceutical manufacturing process.
• Propose an example and identify challenges from industry side (Biopharmaceutical Committee, JPMA) to leverage for establishing regulatory process associated with ECs.
3
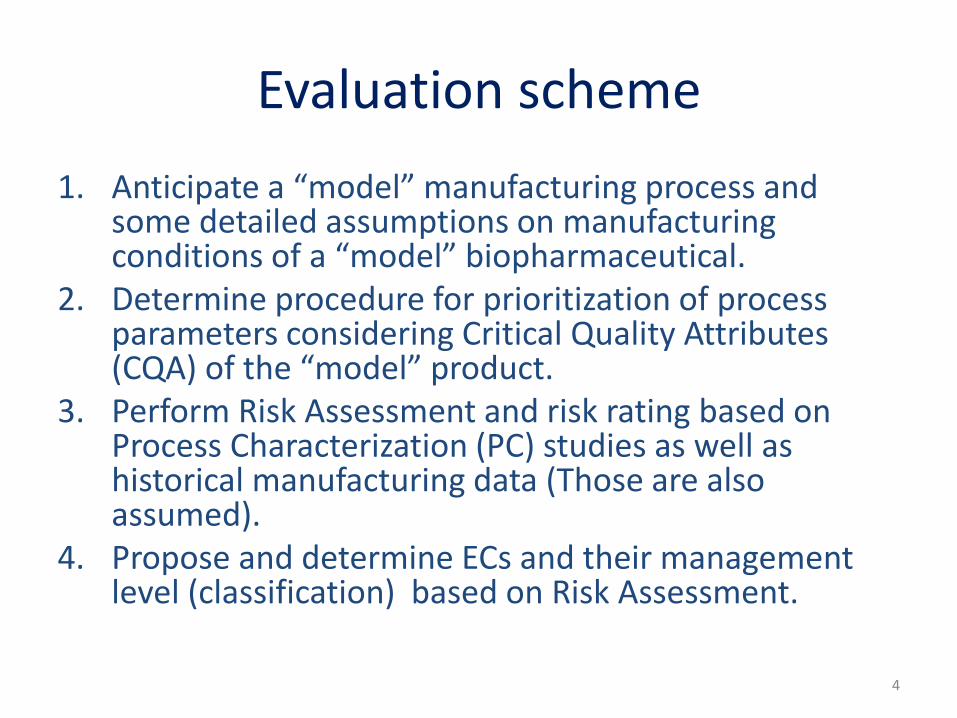
Evaluation scheme
1. Anticipate a “model” manufacturing process and some detailed assumptions on manufacturing conditions of a “model” biopharmaceutical.
2. Determine procedure for prioritization of process parameters considering Critical Quality Attributes (CQA) of the “model” product.
3. Perform Risk Assessment and risk rating based on Process Characterization (PC) studies as well as historical manufacturing data (Those are also assumed).
4. Propose and determine ECs and their management level (classification) based on Risk Assessment.
4
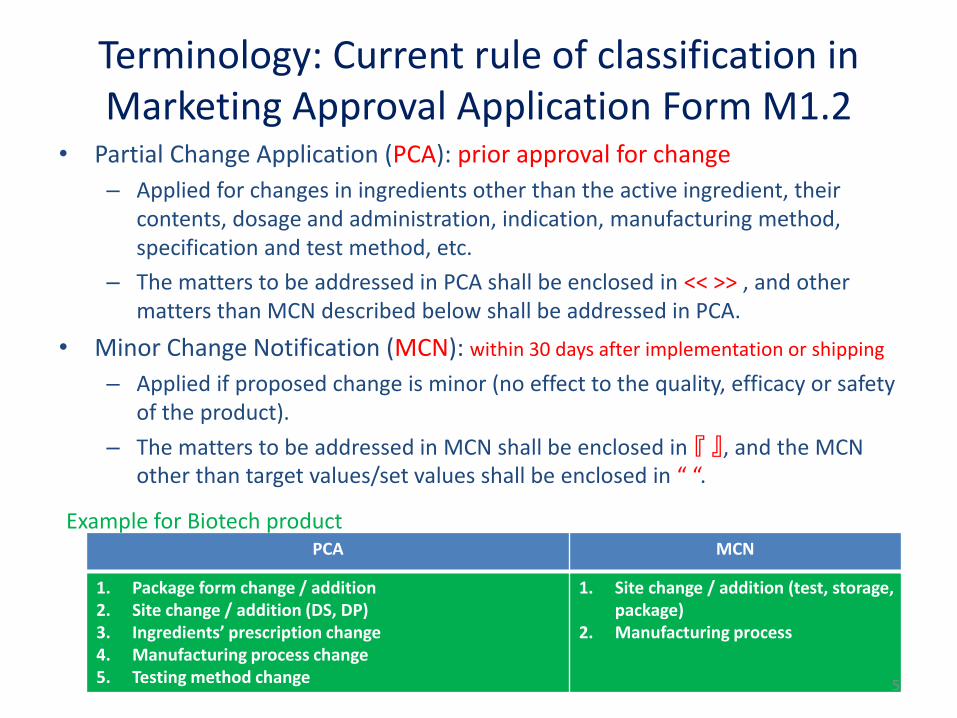
Terminology: Current rule of classification in Marketing Approval Application Form M1.2
• Partial Change Application (PCA): prior approval for change
– Applied for changes in ingredients other than the active ingredient, their contents, dosage and administration, indication, manufacturing method, specification and test method, etc.
– The matters to be addressed in PCA shall be enclosed in << >> , and other matters than MCN described below shall be addressed in PCA.
• Minor Change Notification (MCN): within 30 days after implementation or shipping
– Applied if proposed change is minor (no effect to the quality, efficacy or safety of the product).
– The matters to be addressed in MCN shall be enclosed in 『 』, and the MCN other than target values/set values shall be enclosed in “ “.
PCA MCN
1. Package form change / addition2. Site change / addition (DS, DP)3. Ingredients’ prescription change4. Manufacturing process change5. Testing method change
1. Site change / addition (test, storage, package)
2. Manufacturing process
Example for Biotech product
5

Anticipated Manufacturing Process
Process and Materials Assumption
Cell line CHO/DG44
Product Monoclonal Antibody (IgG)
Medium for storing the drug substanceThe same buffer as the drug product formulation
Distinct culture scale(Volume of the bioreactor)
15,000 L
Medium Serum-free medium
Culture process yield Approx. 3 g/L
Purification process yield Approx. 50%
BioburdenEstablished in the specifications and test methods
Bacterial endotoxinsEstablished in the specifications and test methods
Ingredients Same ingredients as the drug product
6
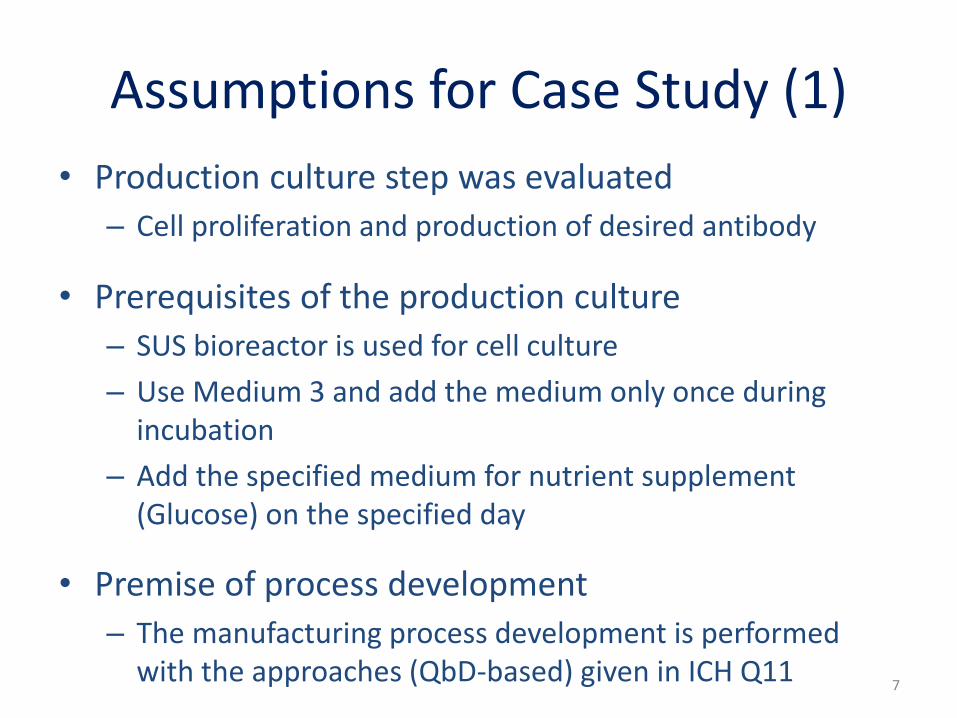
Assumptions for Case Study (1)
• Production culture step was evaluated
– Cell proliferation and production of desired antibody
• Prerequisites of the production culture
– SUS bioreactor is used for cell culture
– Use Medium 3 and add the medium only once during incubation
– Add the specified medium for nutrient supplement (Glucose) on the specified day
• Premise of process development
– The manufacturing process development is performed with the approaches (QbD-based) given in ICH Q11
7

Procedure for Prioritization of Process Parameter
1. Identification of Quality Attributes (QAs) in the production culture process
2. Linkage of the process parameters and the selected QAs
3. Identification of the process parameters having an impact on the selected QAs (based on the prior/existing knowledge and
experience) → Risk Assessment
4. Implementation of the PC studies for the selected process parameters
5. Identification of the process parameters having an impact on the selected QAs (based on the results of PC studies)
6. Determination of ECs based on the Risk Assessment (Risk Mitigation) considering control strategy
8

Approach for Risk Assessment
• With reference to the cases in ICH Q11 and A-Mab study (The CMC Biotech Working Group, 2009), perform risk scoring in accordance with the following scoring method.
• Establish QAs and their weights in reference to A-Mab study.
– the processes for identification of the QAs and weighting are not described but assumed, since it varies depending on products.
• For the rating of each process parameter, the results of the PC studies, i.e., impact to the QAs, are taken into consideration.
• For the determination of ECs, not only actual impact to the QAs but also process control capability (including downstream process) and detectability of the changes have been considered.
9
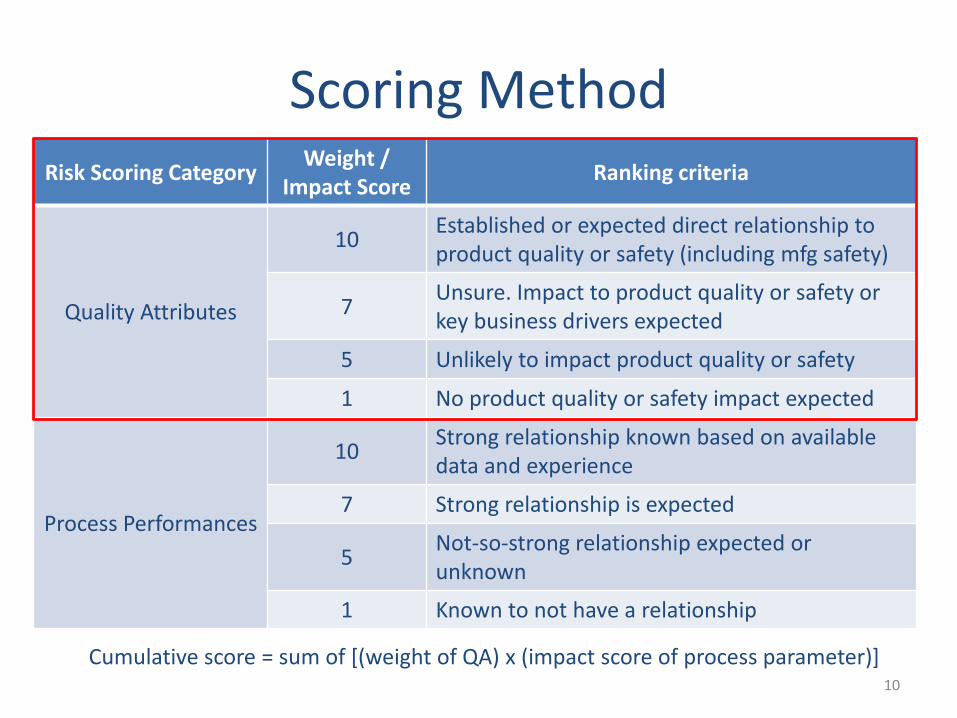
Scoring MethodRisk Scoring Category
Weight / Impact Score
Ranking criteria
Quality Attributes
10Established or expected direct relationship to product quality or safety (including mfg safety)
7Unsure. Impact to product quality or safety or key business drivers expected
5 Unlikely to impact product quality or safety
1 No product quality or safety impact expected
Process Performances
10Strong relationship known based on available data and experience
7 Strong relationship is expected
5Not-so-strong relationship expected or unknown
1 Known to not have a relationship
Cumulative score = sum of [(weight of QA) x (impact score of process parameter)]10

1. Identification of Quality Attributes (QAs) in the production
culture process
Quality Attributes Weight
High Molecular Weight species (HMW) 5
Charge Variant 7
Host Cell Protein (HCP) 7
Host Cell DNA (DNA) 10
Fragment 5
Galactosylated glycans 7
Afucosylated glycans 7
Sialic acid 5
High Mannose species 7
Non-glycosylated Heavy Chain HC (NGHC) 7
WCBExpansion Culture Production Culture Harvest
11
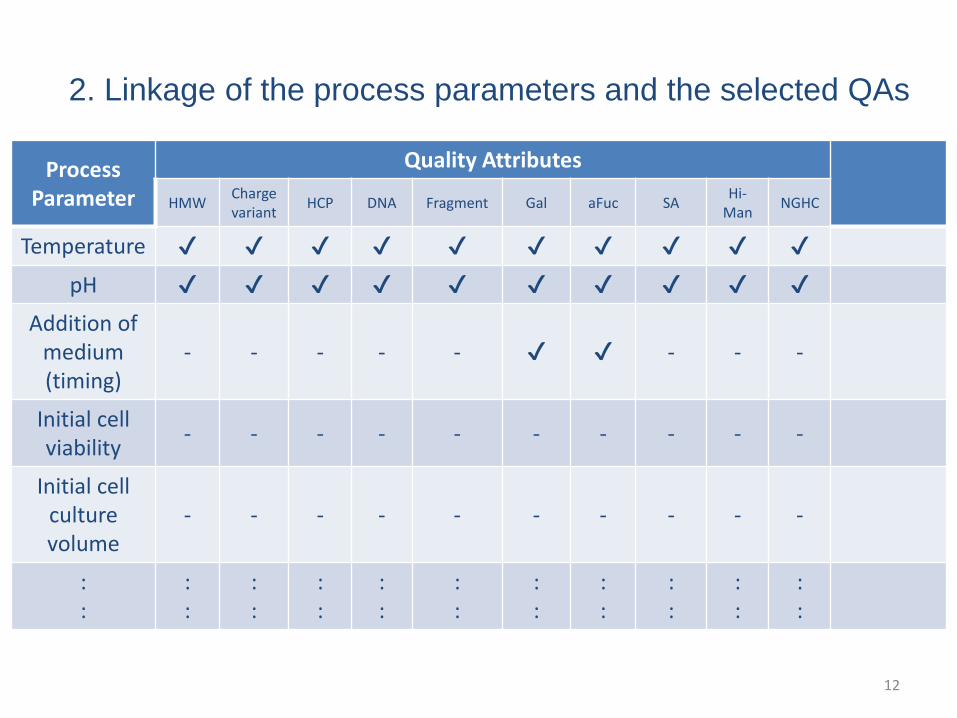
2. Linkage of the process parameters and the selected QAs
Process Parameter
Quality Attributes
HMWCharge variant
HCP DNA Fragment Gal aFuc SAHi-
ManNGHC
Temperature ✔ ✔ ✔ ✔ ✔ ✔ ✔ ✔ ✔ ✔
pH ✔ ✔ ✔ ✔ ✔ ✔ ✔ ✔ ✔ ✔
Addition of medium(timing)
- - - - - ✔ ✔ - - -
Initial cell viability
- - - - - - - - - -
Initial cell culturevolume
- - - - - - - - - -
::
::
::
::
::
::
::
::
::
::
::
12
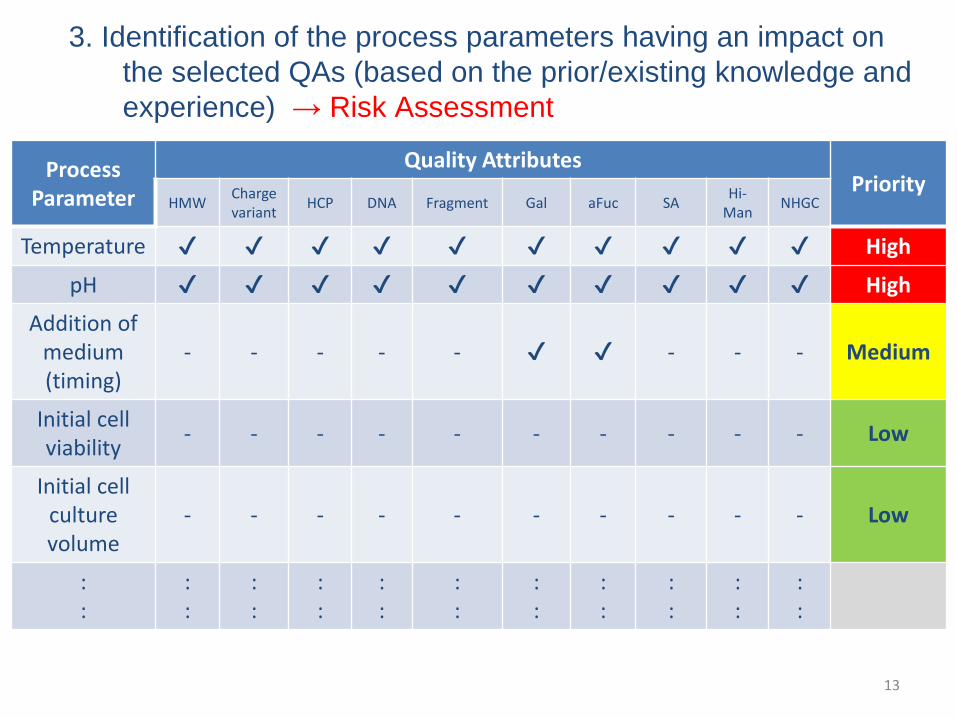
3. Identification of the process parameters having an impact on
the selected QAs (based on the prior/existing knowledge and
experience) → Risk Assessment
Process Parameter
Quality AttributesPriority
HMWCharge variant
HCP DNA Fragment Gal aFuc SAHi-
ManNHGC
Temperature ✔ ✔ ✔ ✔ ✔ ✔ ✔ ✔ ✔ ✔ High
pH ✔ ✔ ✔ ✔ ✔ ✔ ✔ ✔ ✔ ✔ High
Addition of medium(timing)
- - - - - ✔ ✔ - - - Medium
Initial cell viability
- - - - - - - - - - Low
Initial cell culturevolume
- - - - - - - - - - Low
::
::
::
::
::
::
::
::
::
::
::
13
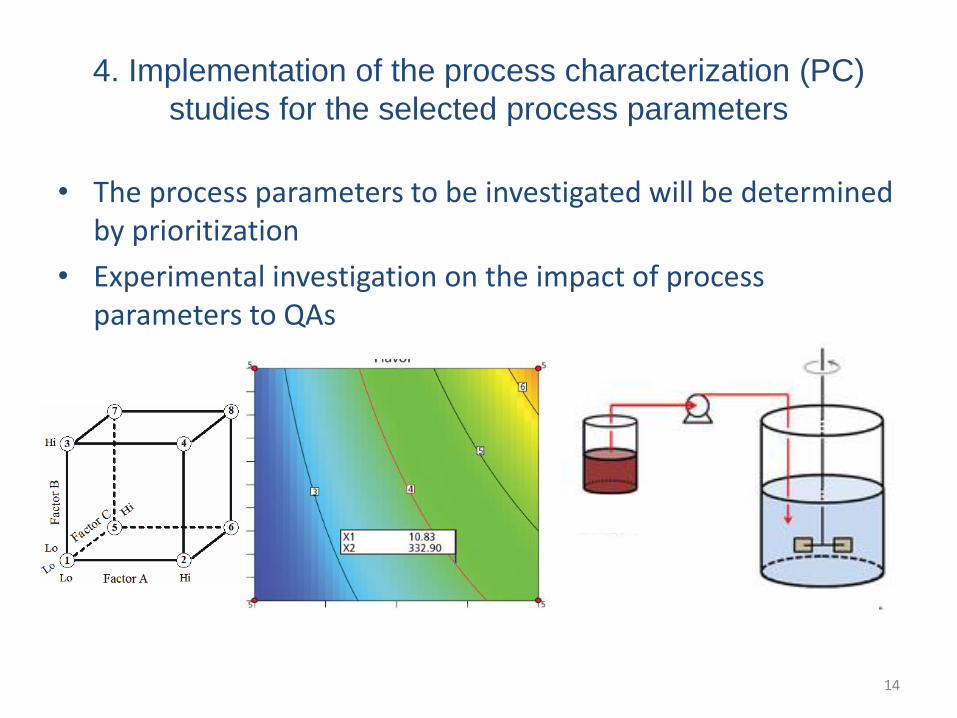
4. Implementation of the process characterization (PC)
studies for the selected process parameters
• The process parameters to be investigated will be determined by prioritization
• Experimental investigation on the impact of process parameters to QAs
Bioreactor
Pump
Feed medium
14

5. Identification of process parameter impacting
on QAs
Process Parameter
Quality Attributes
ScoreHMW Charge variant
HCP DNA Fragment Gal aFuc SA Hi-Man
NGHC
5 7 7 10 5 7 7 5 7 7
Temperature 5 7 1 1 1 7 5 5 1 1 227
pH 7 7 1 1 1 10 7 5 1 5 292
Addition of medium(timing)
1 1 1 1 1 5 5 1 1 1 193
Initial cell viability
1 1 1 1 1 1 1 1 1 1 67
Initial cell culture volume
1 1 1 1 1 1 1 1 1 1 67
: : : : : : : : : : :
• Scoring will be performed based on the PC study data as well as historical manufacturing data
• Critical process parameter (CPP) will be identified using a threshold score of 200 (High) and 150 (Middle)
15
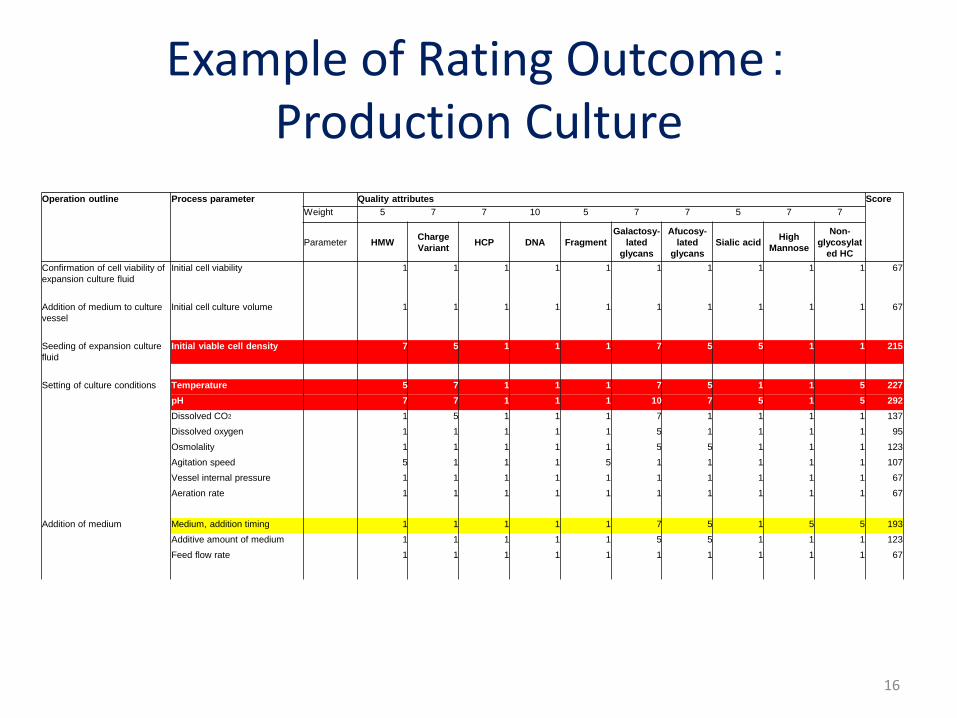
Example of Rating Outcome:Production Culture
Operation outline Process parameter Quality attributes Score
Weight 5 7 7 10 5 7 7 5 7 7
Parameter HMWCharge
VariantHCP DNA Fragment
Galactosy-
lated
glycans
Afucosy-
lated
glycans
Sialic acidHigh
Mannose
Non-
glycosylat
ed HC
Confirmation of cell viability of
expansion culture fluid
Initial cell viability 1 1 1 1 1 1 1 1 1 1 67
Addition of medium to culture
vessel
Initial cell culture volume 1 1 1 1 1 1 1 1 1 1 67
Seeding of expansion culture
fluid
Initial viable cell density 7 5 1 1 1 7 5 5 1 1 215
Setting of culture conditions Temperature 5 7 1 1 1 7 5 1 1 5 227
pH 7 7 1 1 1 10 7 5 1 5 292
Dissolved CO2 1 5 1 1 1 7 1 1 1 1 137
Dissolved oxygen 1 1 1 1 1 5 1 1 1 1 95
Osmolality 1 1 1 1 1 5 5 1 1 1 123
Agitation speed 5 1 1 1 5 1 1 1 1 1 107
Vessel internal pressure 1 1 1 1 1 1 1 1 1 1 67
Aeration rate 1 1 1 1 1 1 1 1 1 1 67
Addition of medium Medium, addition timing 1 1 1 1 1 7 5 1 5 5 193
Additive amount of medium 1 1 1 1 1 5 5 1 1 1 123
Feed flow rate 1 1 1 1 1 1 1 1 1 1 67
16
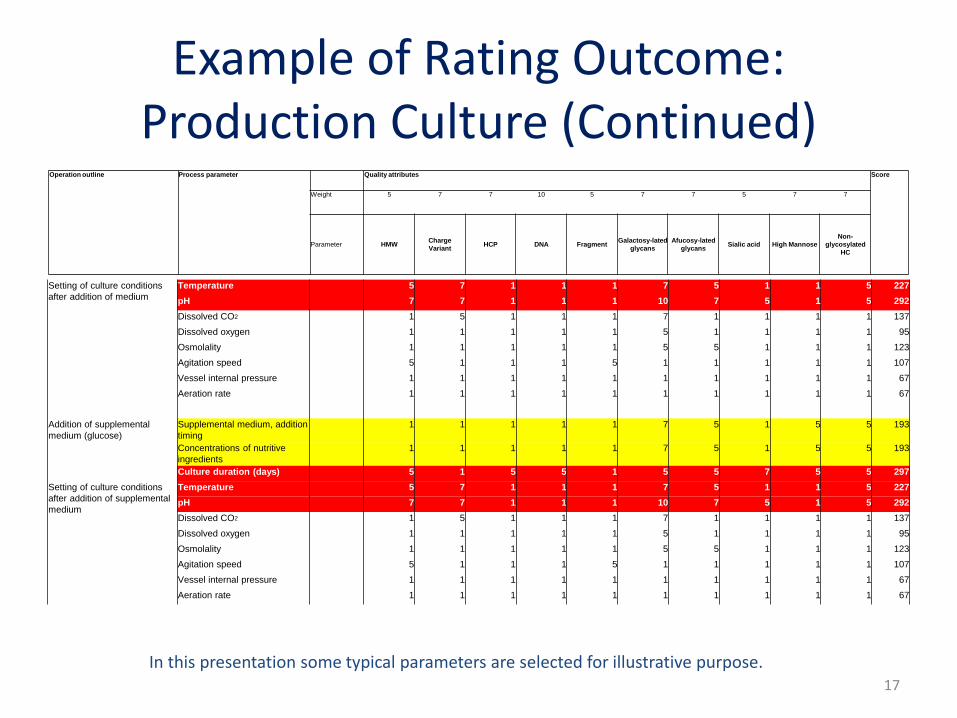
Example of Rating Outcome: Production Culture (Continued)
Setting of culture conditions
after addition of medium
Temperature 5 7 1 1 1 7 5 1 1 5 227
pH 7 7 1 1 1 10 7 5 1 5 292
Dissolved CO2 1 5 1 1 1 7 1 1 1 1 137
Dissolved oxygen 1 1 1 1 1 5 1 1 1 1 95
Osmolality 1 1 1 1 1 5 5 1 1 1 123
Agitation speed 5 1 1 1 5 1 1 1 1 1 107
Vessel internal pressure 1 1 1 1 1 1 1 1 1 1 67
Aeration rate 1 1 1 1 1 1 1 1 1 1 67
Addition of supplemental
medium (glucose)
Supplemental medium, addition
timing
1 1 1 1 1 7 5 1 5 5 193
Concentrations of nutritive
ingredients
1 1 1 1 1 7 5 1 5 5 193
Culture duration (days) 5 1 5 5 1 5 5 7 5 5 297
Setting of culture conditions
after addition of supplemental
medium
Temperature 5 7 1 1 1 7 5 1 1 5 227
pH 7 7 1 1 1 10 7 5 1 5 292
Dissolved CO2 1 5 1 1 1 7 1 1 1 1 137
Dissolved oxygen 1 1 1 1 1 5 1 1 1 1 95
Osmolality 1 1 1 1 1 5 5 1 1 1 123
Agitation speed 5 1 1 1 5 1 1 1 1 1 107
Vessel internal pressure 1 1 1 1 1 1 1 1 1 1 67
Aeration rate 1 1 1 1 1 1 1 1 1 1 67
Operation outline Process parameter Quality attributes Score
Weight 5 7 7 10 5 7 7 5 7 7
Parameter HMWCharge
VariantHCP DNA Fragment
Galactosy-lated
glycans
Afucosy-lated
glycansSialic acid High Mannose
Non-
glycosylated
HC
In this presentation some typical parameters are selected for illustrative purpose. 17
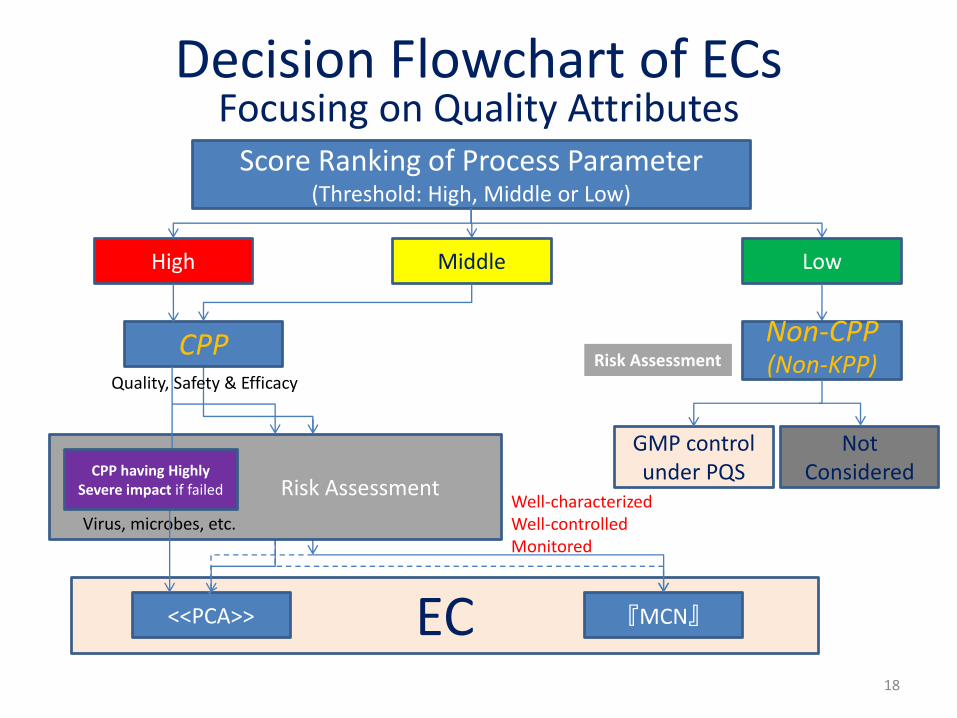
EC
Decision Flowchart of ECsFocusing on Quality Attributes
Score Ranking of Process Parameter(Threshold: High, Middle or Low)
LowMiddleHigh
CPP
『MCN』<<PCA>>
Well-characterizedWell-controlledMonitored
GMP control under PQSRisk Assessment
Risk Assessment
Virus, microbes, etc.
CPP having HighlySevere impact if failed
Non-CPP(Non-KPP)
Not Considered
Quality, Safety & EfficacyRisk Assessment
18
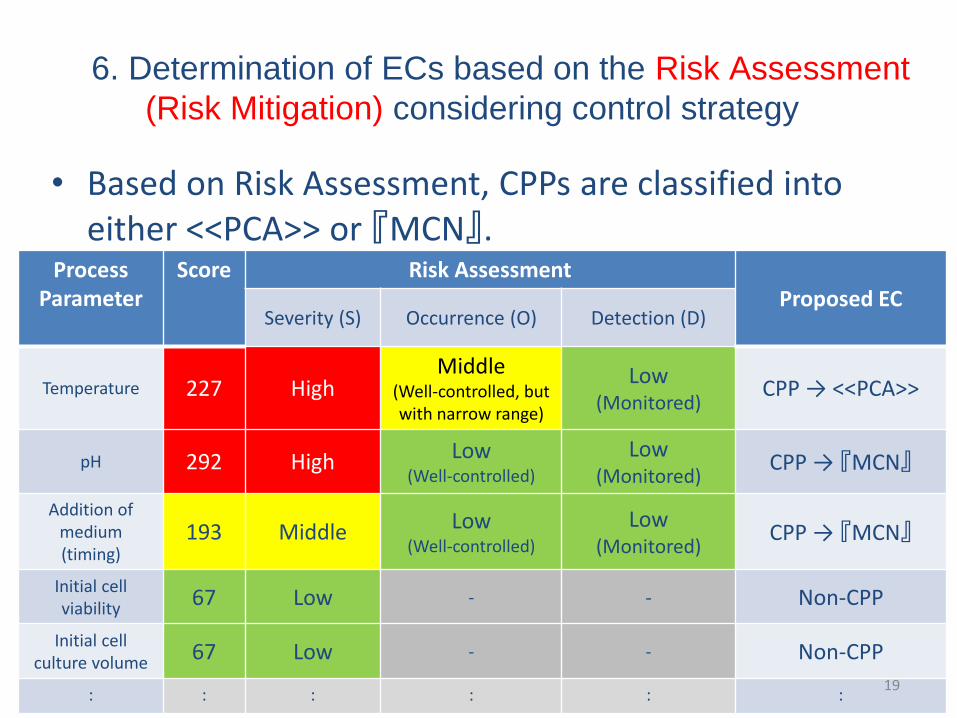
6. Determination of ECs based on the Risk Assessment
(Risk Mitigation) considering control strategy
Process Parameter
Score Risk AssessmentProposed EC
Severity (S) Occurrence (O) Detection (D)
Temperature 227 HighMiddle
(Well-controlled, but with narrow range)
Low(Monitored)
CPP → <<PCA>>
pH 292 High Low(Well-controlled)
Low(Monitored)
CPP → 『MCN』
Addition of medium(timing)
193 Middle Low(Well-controlled)
Low(Monitored)
CPP → 『MCN』
Initial cell viability
67 Low - - Non-CPP
Initial cell culture volume
67 Low - - Non-CPP
: : : : : :
• Based on Risk Assessment, CPPs are classified into either <<PCA>> or 『MCN』.
19

Determination of ECs
• Process parameters that have been judged, through the procedure mentioned above, to have an impact to the selected QAs are defined as CPPs, and shall be controlled ( included in the approval form).
• Temperature, pH and Addition of medium (timing)... have been identified as CPPs in this case study.
• These CPPs will be categorized in either <<PCA>> or 『MCN』 based on risk assessment.
20
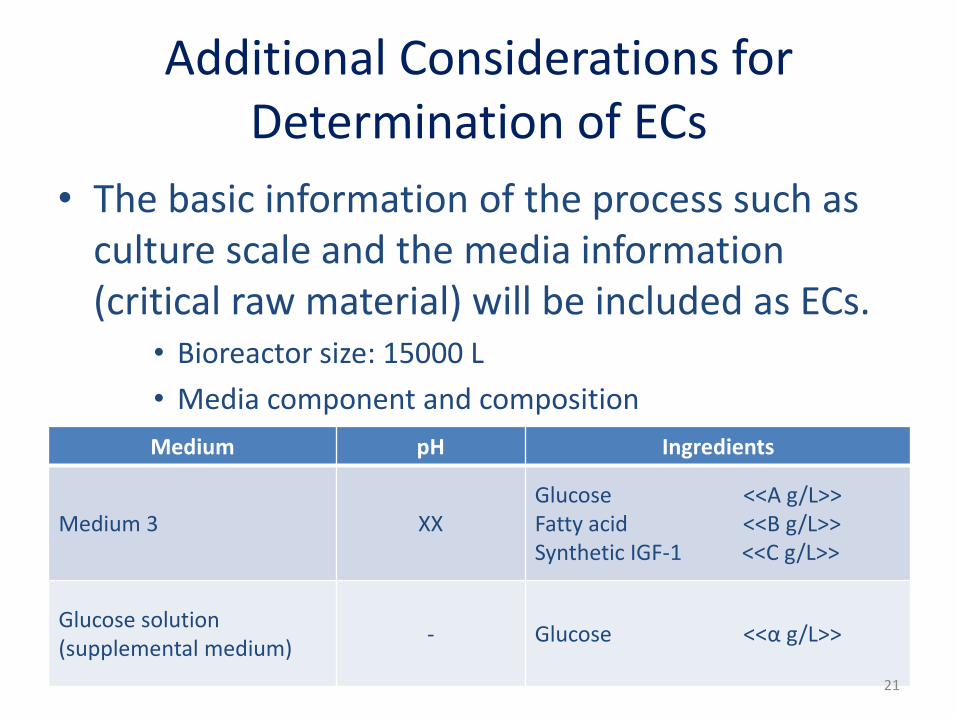
Additional Considerations for Determination of ECs
• The basic information of the process such as culture scale and the media information (critical raw material) will be included as ECs.
• Bioreactor size: 15000 L
• Media component and composition
Medium pH Ingredients
Medium 3 XXGlucose <<A g/L>>Fatty acid <<B g/L>>Synthetic IGF-1 <<C g/L>>
Glucose solution(supplemental medium)
- Glucose <<α g/L>>
21
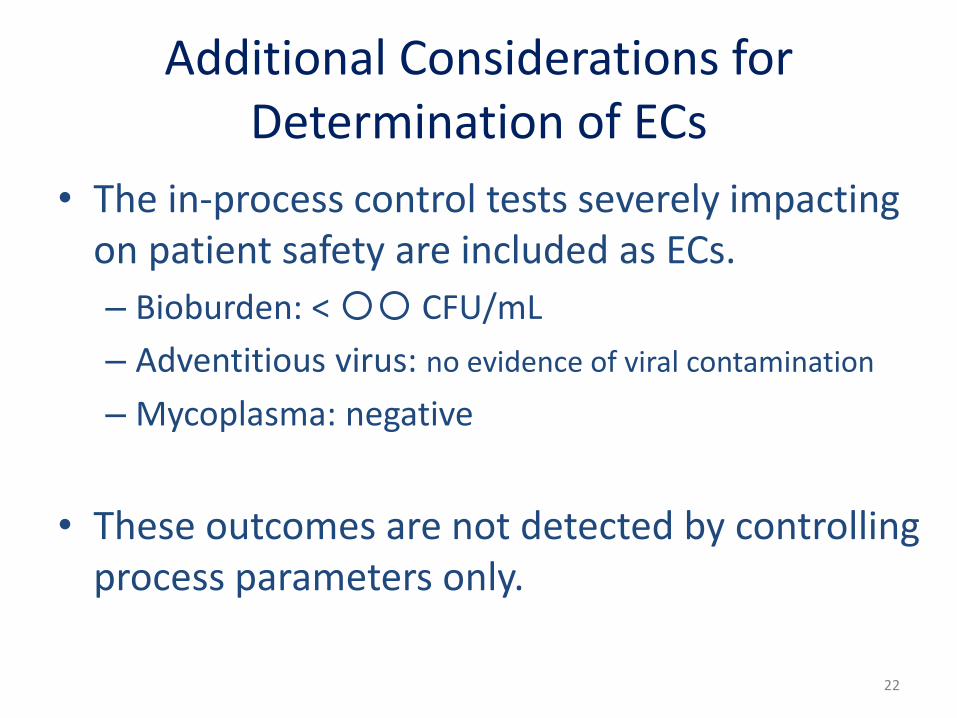
Additional Considerations for Determination of ECs
• The in-process control tests severely impacting on patient safety are included as ECs.
– Bioburden: < 〇〇 CFU/mL
– Adventitious virus: no evidence of viral contamination
– Mycoplasma: negative
• These outcomes are not detected by controlling process parameters only.
22

Example of ECs in M1.2Culture Process: Production Culture
• The expansion culture fluid is used to inoculate a culture vessel (with a capacity of 15000 L) containing Medium 3 to a viable cell density of 『1 × 10⁵ cells/mL』, and cultured at <<37℃>> and 『pH 』. After 『days』 of culture, the culture is fed with Medium 3 and further cultured at <<37℃>> and 『pH 』. After 『▲ days』 of culture, the culture is fed with glucose solution to a final concentration of 『 g/L』 and production culture is continued for a total of 『X days』.
– In-process control tests:• Bioburden: < CFU/mL• Adventitious virus: no evidence of viral contamination• Mycoplasma: negative
23

Assumptions for Case Study (2)
• Anion Exchange Chromatography (AEX) Step was evaluated– Removal of impurities such as DNA, HCP and rProtein (leached ligand)
• Prerequisites of the AEX step– General antibody purification process with 3 chromatography steps
including Affinity capture step
– AEX step is operated by flow-through mode
• Premise of process development– The manufacturing process development is performed with the
approaches (QbD-based) given in ICH Q11.
• Same procedure with Production culture step for prioritization of process parameters
24
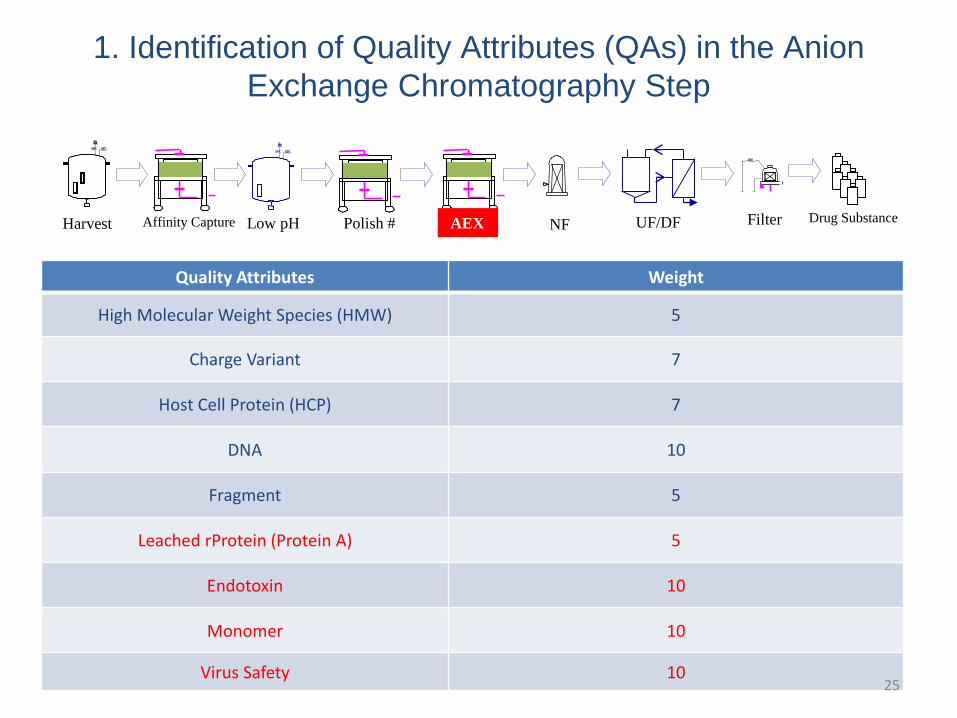
1. Identification of Quality Attributes (QAs) in the Anion
Exchange Chromatography Step
Quality Attributes Weight
High Molecular Weight Species (HMW) 5
Charge Variant 7
Host Cell Protein (HCP) 7
DNA 10
Fragment 5
Leached rProtein (Protein A) 5
Endotoxin 10
Monomer 10
Virus Safety 10
AEXHarvest Affinity Capture Low pH Polish # NF UF/DF Filter Drug Substance
25
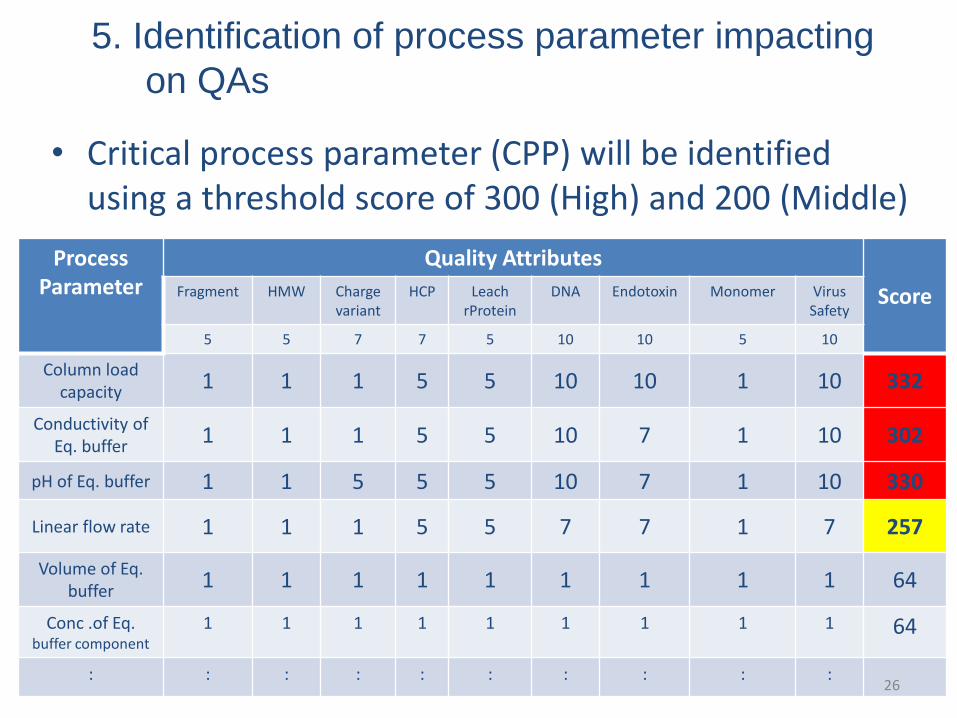
5. Identification of process parameter impacting
on QAs
Process Parameter
Quality Attributes
ScoreFragment HMW Charge variant
HCP Leach rProtein
DNA Endotoxin Monomer Virus Safety
5 5 7 7 5 10 10 5 10
Column load capacity
1 1 1 5 5 10 10 1 10 332
Conductivity of Eq. buffer
1 1 1 5 5 10 7 1 10 302
pH of Eq. buffer 1 1 5 5 5 10 7 1 10 330
Linear flow rate 1 1 1 5 5 7 7 1 7 257
Volume of Eq. buffer
1 1 1 1 1 1 1 1 1 64
Conc .of Eq. buffer component
1 1 1 1 1 1 1 1 1 64
: : : : : : : : : :
• Critical process parameter (CPP) will be identifiedusing a threshold score of 300 (High) and 200 (Middle)
26
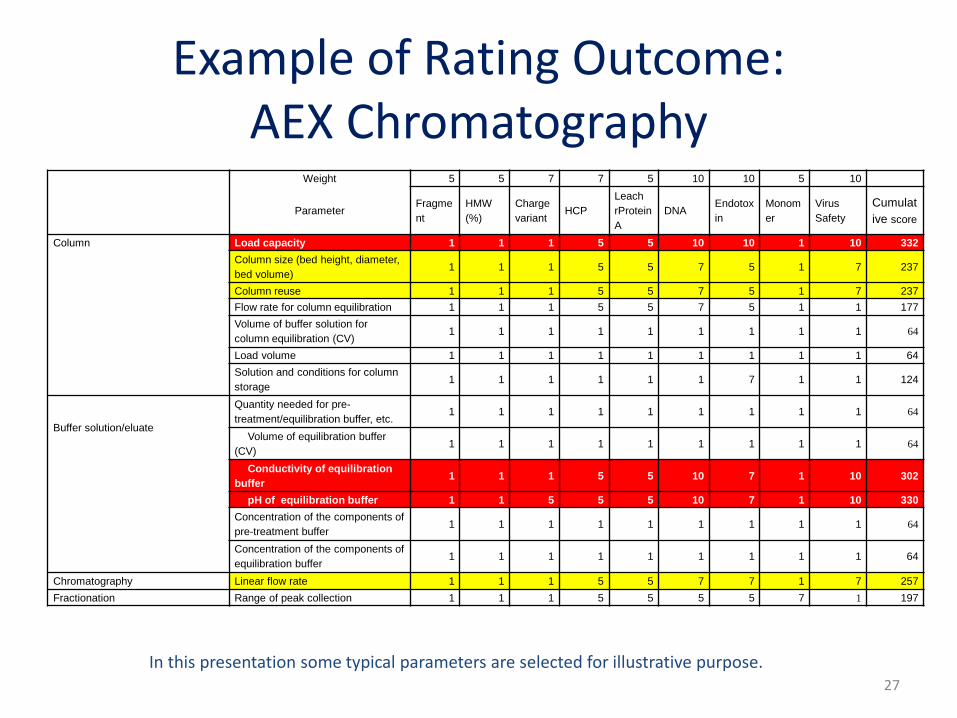
Example of Rating Outcome:AEX Chromatography
Weight 5 5 7 7 5 10 10 5 10
ParameterFragme
nt
HMW
(%)
Charge
variantHCP
Leach
rProtein
A
DNAEndotox
in
Monom
er
Virus
Safety
Cumulat
ive score
Column Load capacity 1 1 1 5 5 10 10 1 10 332
Column size (bed height, diameter,
bed volume)1 1 1 5 5 7 5 1 7 237
Column reuse 1 1 1 5 5 7 5 1 7 237
Flow rate for column equilibration 1 1 1 5 5 7 5 1 1 177
Volume of buffer solution for
column equilibration (CV)1 1 1 1 1 1 1 1 1 64
Load volume 1 1 1 1 1 1 1 1 1 64
Solution and conditions for column
storage1 1 1 1 1 1 7 1 1 124
Buffer solution/eluate
Quantity needed for pre-
treatment/equilibration buffer, etc.1 1 1 1 1 1 1 1 1 64
Volume of equilibration buffer
(CV)1 1 1 1 1 1 1 1 1 64
Conductivity of equilibration
buffer 1 1 1 5 5 10 7 1 10 302
pH of equilibration buffer 1 1 5 5 5 10 7 1 10 330
Concentration of the components of
pre-treatment buffer1 1 1 1 1 1 1 1 1 64
Concentration of the components of
equilibration buffer 1 1 1 1 1 1 1 1 1 64
Chromatography Linear flow rate 1 1 1 5 5 7 7 1 7 257
Fractionation Range of peak collection 1 1 1 5 5 5 5 7 1 197
In this presentation some typical parameters are selected for illustrative purpose. 27
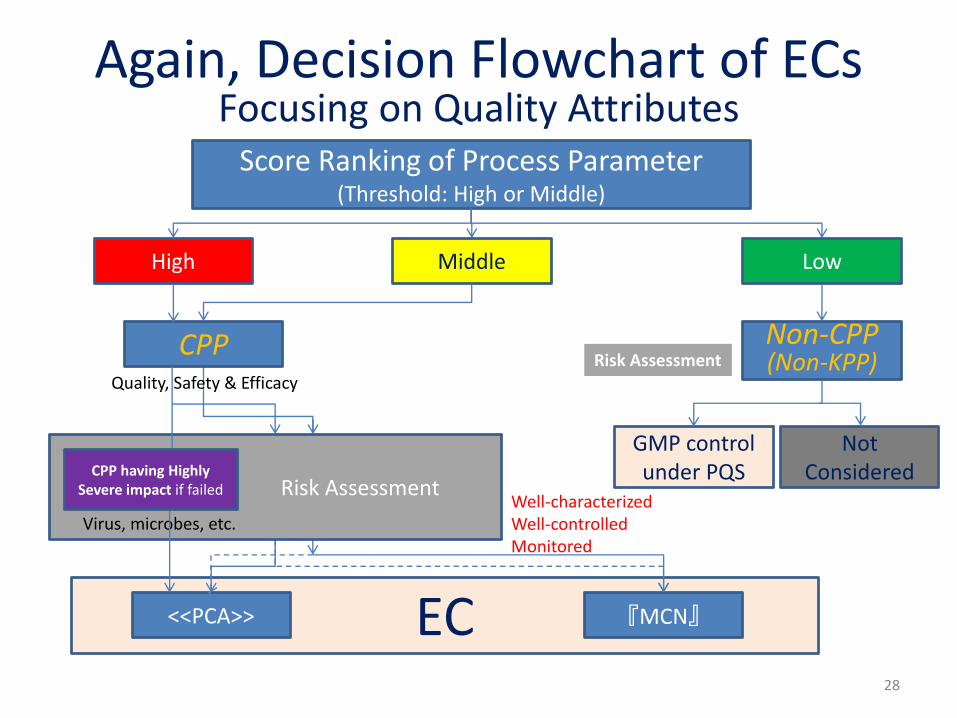
EC
Again, Decision Flowchart of ECsFocusing on Quality Attributes
Score Ranking of Process Parameter(Threshold: High or Middle)
LowMiddleHigh
CPP
『MCN』<<PCA>>
Well-characterizedWell-controlledMonitored
GMP control under PQSRisk Assessment
Risk Assessment
Virus, microbes, etc.
CPP having HighlySevere impact if failed
Non-CPP(Non-KPP)
Not Considered
Quality, Safety & EfficacyRisk Assessment
28

6. Determination of ECs based on the Risk Assessment
(Risk Mitigation) considering control strategy
Process Parameter
ScoreRisk Assessment
Proposed ECSeverity(S) Occurrence (O) Detection (D)
Column load capacity
332 HighHigh
(Changeable)High
(Not confirmed)CPP → <<PCA>>
Conductivity of Eq. buffer
302 High Low(Well-controlled)
Low(Monitored)
CPP → 『MCN』
pH of Eq. buffer 330 High Low(Well-controlled)
Low(Monitored)
CPP → 『MCN』
Linear flow rate 257 Middle Low(Well-controlled)
Middle(Monitored but not
confirmed)CPP → 『MCN』
Volume of Eq. buffer
59 Low - - Non-CPP
Conc .of Eq. buffer component
59 Low - - Non-CPP
: : : : : :
• Based on Risk Assessment, CPPs are classified into <<PCA>> or 『MCN』
29
Determination of ECs
• Process parameters that have been judged, through the procedure mentioned above, to have an impact to the selected QAs are defined as CPPs, and shall be controlled (basically included in the approval form).
• Column load capacity, Conductivity , pH of Eq. buffer and Linear flow rate have been identified as CPPs.
• Column load capacity has been determined as EC, and it is categorized as <<PCA>> according to risk assessment.
• In addition to Linear flow rate, pH and Conductivity of Eq. buffer can be classified as 『MCN』, because they are well controlled and monitored, therefore, not likely to deviate.
30
Additional Considerations for Determination of ECs
• The basic information of the process such as column size and chromatography mode will be included as ECs
– Column size: X L
– Chromatography type: anion exchange (product name or equivalent)
– Chromatography mode: flow-through
31
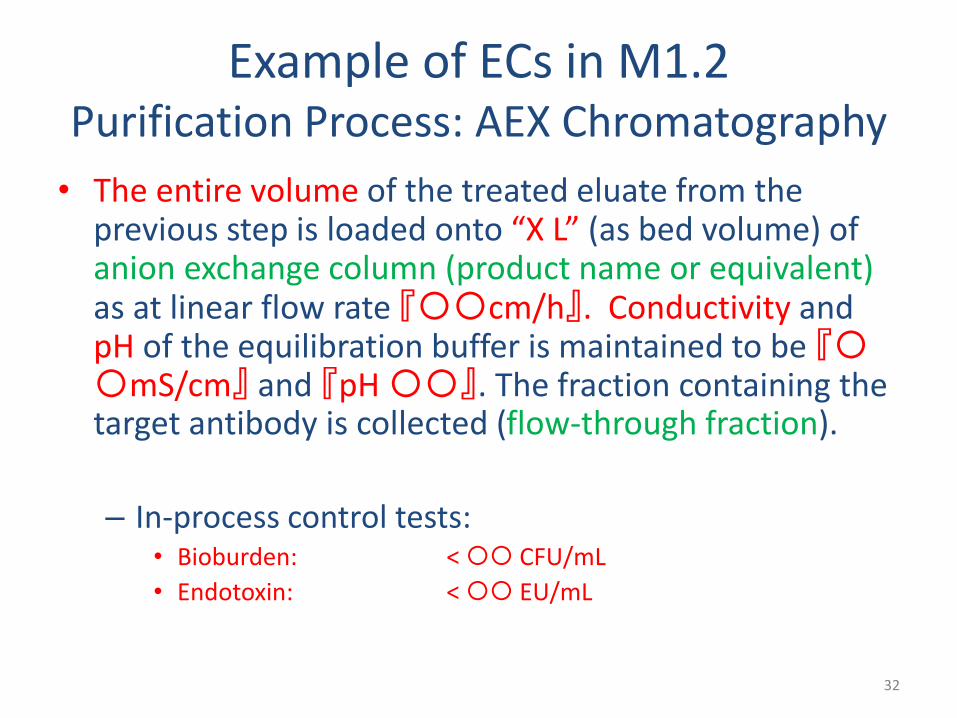
Example of ECs in M1.2Purification Process: AEX Chromatography
• The entire volume of the treated eluate from the previous step is loaded onto “X L” (as bed volume) of anion exchange column (product name or equivalent) as at linear flow rate 『〇〇cm/h』. Conductivity andpH of the equilibration buffer is maintained to be 『〇〇mS/cm』 and 『pH 〇〇』. The fraction containing the target antibody is collected (flow-through fraction).
– In-process control tests:• Bioburden: < CFU/mL
• Endotoxin: < EU/mL
32
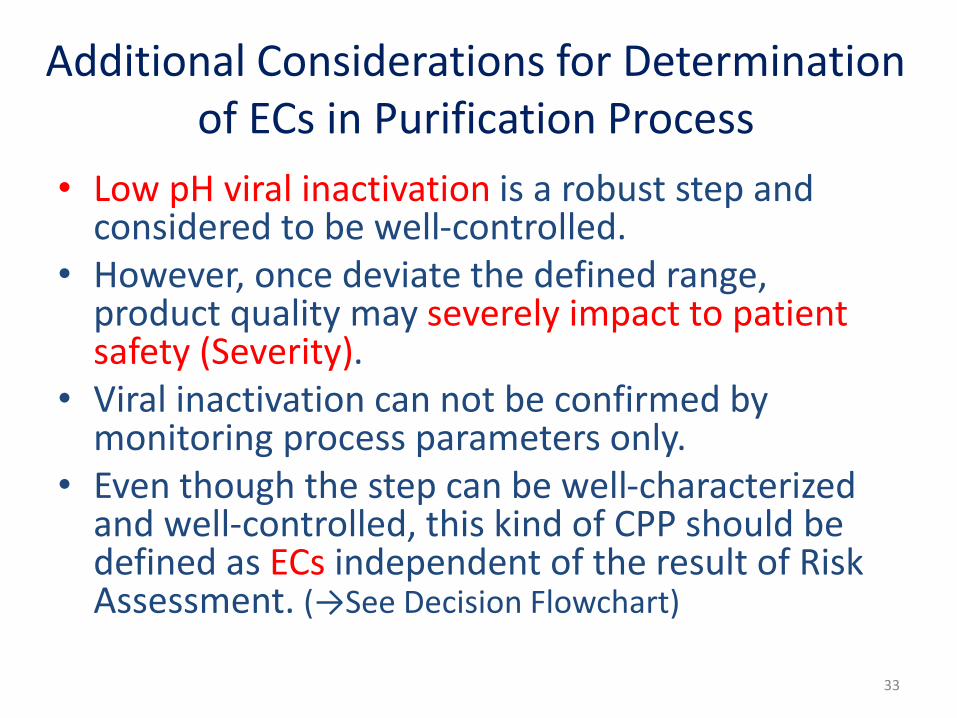
Additional Considerations for Determination of ECs in Purification Process
• Low pH viral inactivation is a robust step and considered to be well-controlled.
• However, once deviate the defined range, product quality may severely impact to patient safety (Severity).
• Viral inactivation can not be confirmed by monitoring process parameters only.
• Even though the step can be well-characterized and well-controlled, this kind of CPP should be defined as ECs independent of the result of Risk Assessment. (→See Decision Flowchart)
33

Summary
• Case study on determination of ECs for a typical manufacturing process of a model monoclonal antibody has been conducted.
• ECs have been determined by science and risk-based approaches, and their classification has also been proposed.
• Further discussions are still underway for this case study at JPMA, but it might be leveraged for establishing framework on determination of ECs.
34
Appendix
• Supporting Slides
35
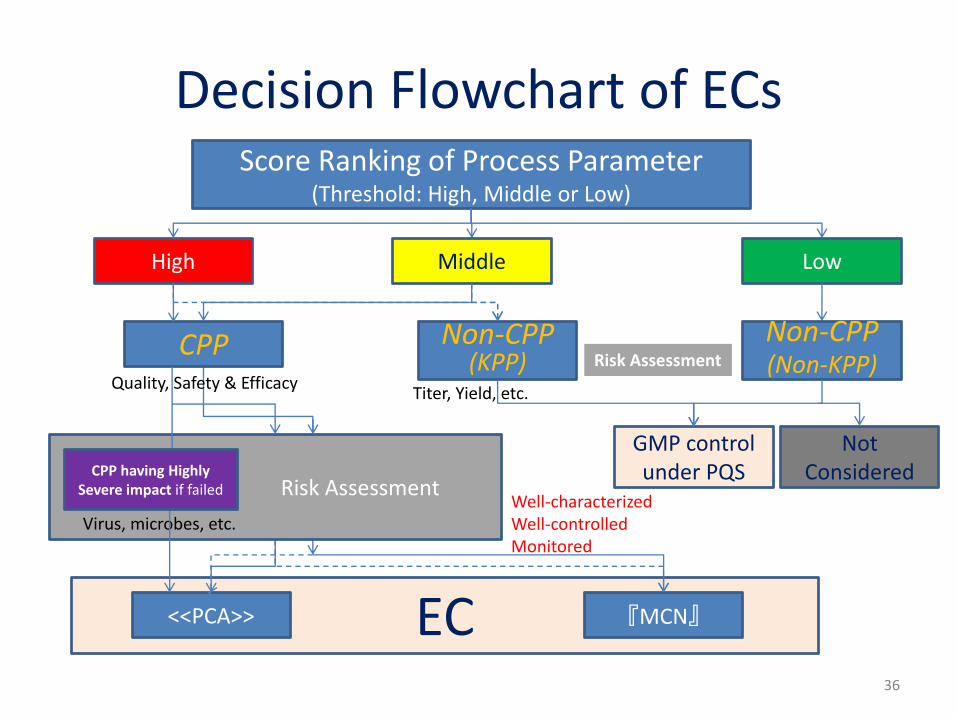
EC
Decision Flowchart of ECsScore Ranking of Process Parameter
(Threshold: High, Middle or Low)
LowMiddleHigh
CPP
『MCN』<<PCA>>
Well-characterizedWell-controlledMonitored
GMP control under PQS
Non-CPP(KPP)
Titer, Yield, etc.
Risk AssessmentRisk Assessment
Virus, microbes, etc.
CPP having HighlySevere impact if failed
Non-CPP(Non-KPP)
Not Considered
Quality, Safety & EfficacyRisk Assessment
36
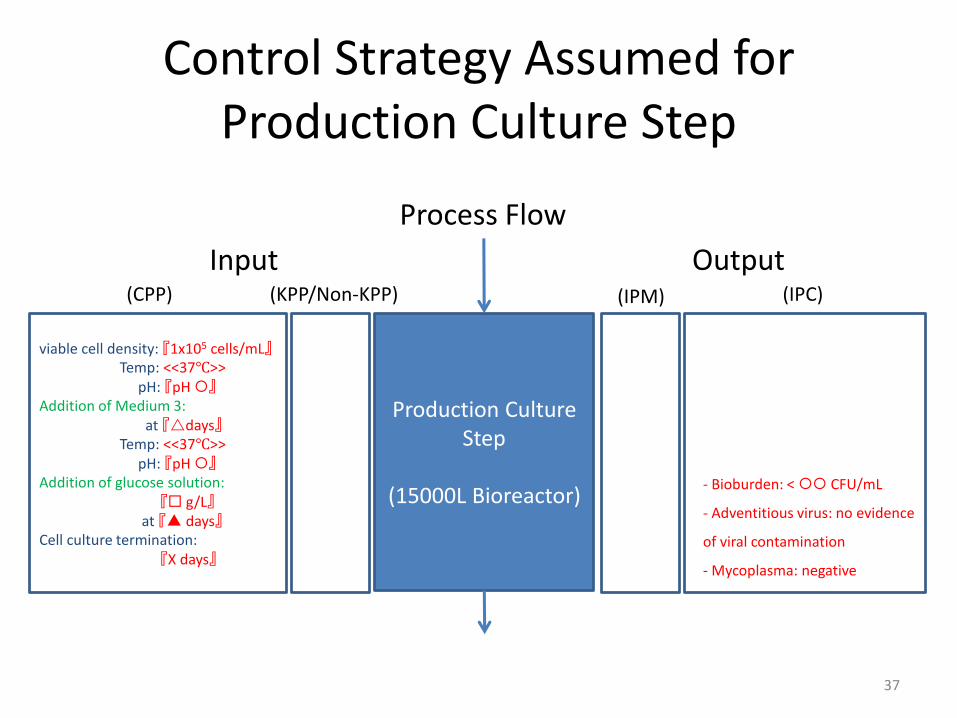
Control Strategy Assumed for Production Culture Step
Production Culture Step
(15000L Bioreactor)- Bioburden: < CFU/mL
- Adventitious virus: no evidence
of viral contamination
- Mycoplasma: negative
viable cell density: 『1x10⁵ cells/mL』Temp: <<37℃>>
pH: 『pH 』Addition of Medium 3:
at 『days』Temp: <<37℃>>
pH: 『pH 』Addition of glucose solution:
『 g/L』at 『▲ days』
Cell culture termination:『X days』
Input Output
Process Flow
(IPC)(CPP) (KPP/Non-KPP) (IPM)
37
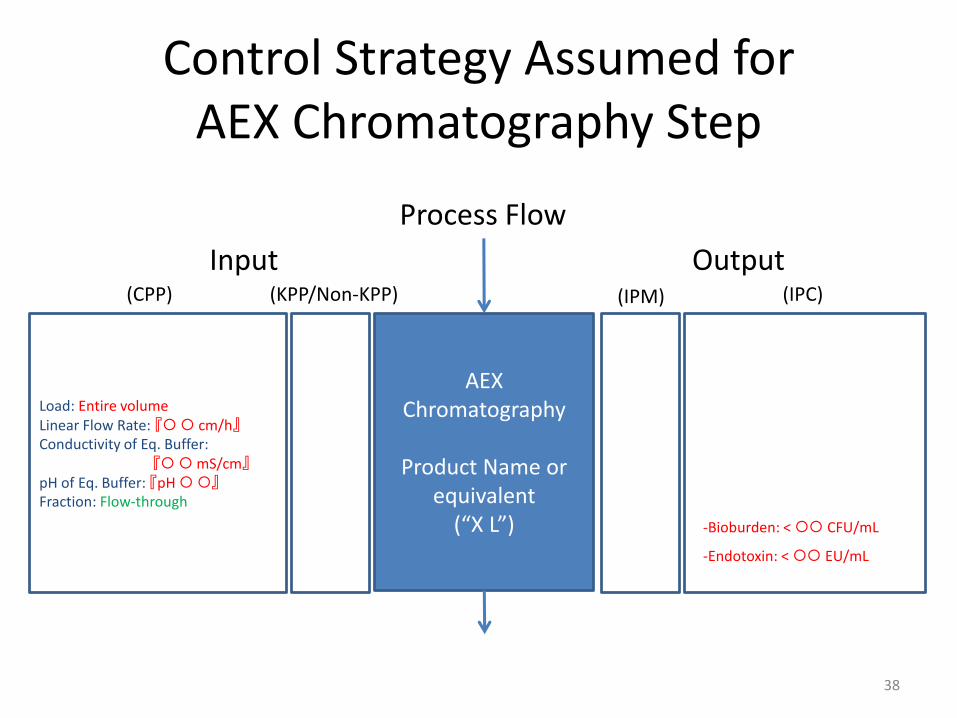
Control Strategy Assumed for AEX Chromatography Step
AEX Chromatography
Product Name or equivalent
(“X L”) -Bioburden: < CFU/mL
-Endotoxin: < EU/mL
Load: Entire volumeLinear Flow Rate: 『 cm/h』Conductivity of Eq. Buffer:
『mS/cm』pH of Eq. Buffer: 『pH 』Fraction: Flow-through
Input Output
Process Flow
(IPC)(CPP) (KPP/Non-KPP) (IPM)
38
Additional considerations for determination of ECs in Manufacturing Process
• Output parameters are not necessarily monitored and should be adequately selected such that the process can be well-controlled, if process consistency has been confirmed through process validation activities (PPQ).
39
Top Related