


Languages
Pages
Legal


©Marian Small, 2011
Big Ideas 4 - 6Session 3

©Marian Small, 2011
Continuing with..
• Tonight we will finish our work with number operations and go on to patterns and relations and statistics and probability.

©Marian Small, 2011
Alternate algorithms
• We ended last time talking about the value of alternate strategies (or algorithms).

©Marian Small, 2011
Would you…
• calculate 532 – 99 the same way you would calculate 532 – 111?
• Use a √ for yes and an x for no.

©Marian Small, 2011
Would you…
• calculate 532 – 99 the same way you would calculate 532 – 111?
• Use a √ for yes and an x for no.
• Should students?

©Marian Small, 2011
22 x 13• Here are two ways to represent 22 x 13.
22
x13
66
+220
286
Which one do you prefer?
Use √ for the left and x for the right.
20 2
10
3
200 20
60 6

©Marian Small, 2011
What about division?
Let’s think about both
• what it means and
• how to calculate

©Marian Small, 2011
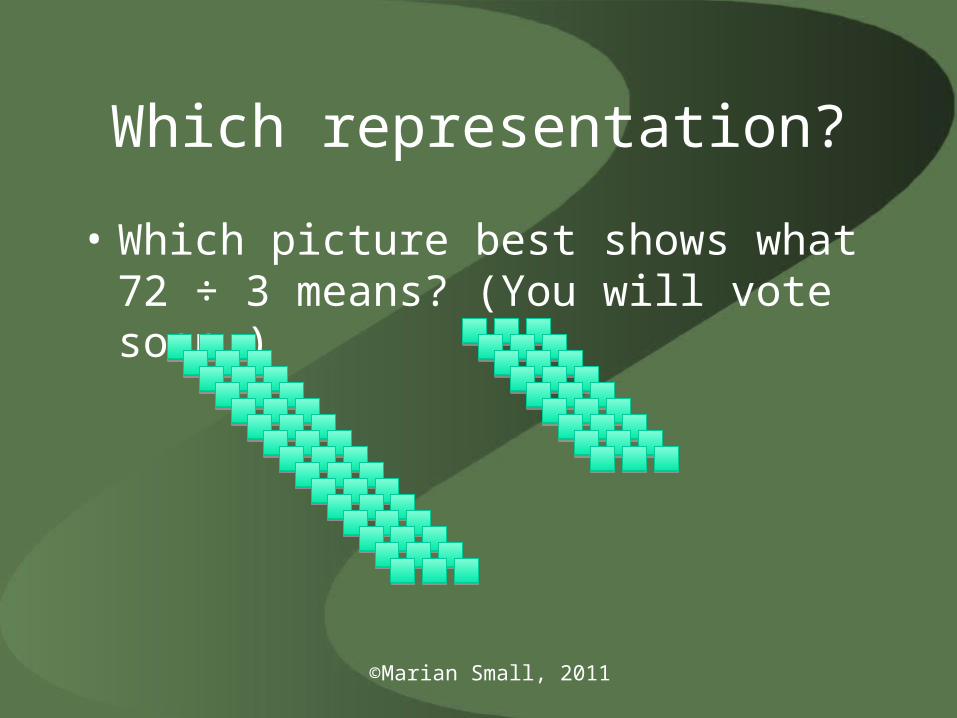
Which representation?
• Which picture best shows what 72 ÷ 3 means? (You will vote soon.)
©Marian Small, 2011
Which representation?
• Which picture best shows what 72 ÷ 3 means? (You will vote soon.)

©Marian Small, 2011
Vote
• A for 1st picture
• B for 2nd picture
• C if you think they’re equally good
• D if you think neither is good
I will ask a few people to explain their thinking.

©Marian Small, 2011
And what procedure?
• What do each of the procedures on the next screen help a student see better than the other ones?
• Vote A,B or C to tell me which you are willing to talk about in terms of what is good about it.
• I will call on people in each category.

©Marian Small, 2011
115 ÷ 5 23 10 + 10 + 3
5 115 5 115 5 50 + 50 + 15
-100 - 50 10
15 65
- 15 - 50 10
0 15
- 15 3
0 23

©Marian Small, 2011
What about estimating?
• Let’s think about estimating questions.
• It’s no longer just about rounding rules.
• Consider these questions.

©Marian Small, 2011
I added….
• 3 numbers.
• One is little.
• One is close to double the other.
• The sum is 5000.
• What could the numbers be?
• Type your numbers on next empty screen.

©Marian Small, 2011

©Marian Small, 2011
I subtracted…
• a number from 3000.
• The result had the digits 3 and 4 in it.
• What could the subtraction have been?
• Write some numbers on next empty screen.

©Marian Small, 2011

©Marian Small, 2011
The product is..
• The product of two numbers is almost 400.
• What might the numbers be?
Raise your hand to respond.

©Marian Small, 2011
I wonder..
• I divided []3[] by 4.
• The answer was a 3 digit number.
• Tell me anything about []3[] that you’re sure of.
Raise your hand to respond.

©Marian Small, 2011

©Marian Small, 2011
Patterns

©Marian Small, 2011
WNCP Pattern Outcomes
• Grade 4- focus on identifying patterns and relationships in tables and charts
• Grade 5- focus on pattern rule to predict
• Grade 6- focus on table of value relationships

©Marian Small, 2011
Here is a multiplication table
X 0 1 2 3 4 5 6 7 8 9
0 0 0 0 0 0 0 0 0 0 0
1 0 1 2 3 4 5 6 7 8 9
2 0 2 4 6 8 10 12 14 16 18
3 0 3 6 9 12 15 18 21 24 27
4 0 4 8 12 16 20 24 28 32 36
5 0 5 10 15 20 25 30 35 40 45
6 0 6 12 18 24 30 36 42 48 54
7 0 7 14 21 28 35 42 49 56 63
8 0 8 16 24 32 40 48 56 64 72
9 0 9 18 27 36 45 54 63 72 81

©Marian Small, 2011
Big Idea

©Marian Small, 2011
Here is a multiplication table
X 0 1 2 3 4 5 6 7 8 9
0 0 0 0 0 0 0 0 0 0 0
1 0 1 2 3 4 5 6 7 8 9
2 0 2 4 6 8 10 12 14 16 18
3 0 3 6 9 12 15 18 21 24 27
4 0 4 8 12 16 20 24 28 32 36
5 0 5 10 15 20 25 30 35 40 45
6 0 6 12 18 24 30 36 42 48 54
7 0 7 14 21 28 35 42 49 56 63
8 0 8 16 24 32 40 48 56 64 72
9 0 9 18 27 36 45 54 63 72 81

©Marian Small, 2011
Big idea

©Marian Small, 2011
Look at this
• To show the final digits of the multiples of 8:
01
2
3
45
6
7
8
9

©Marian Small, 2011
Look at this
• To show the final digits of the multiples of 6. Someone take the pen.
01
2
3
45
6
7
8
9

©Marian Small, 2011
Another big idea

©Marian Small, 2011
Or another pattern
X 0 1 2 3 4 5 6 7 8 9
0 0 0 0 0 0 0 0 0 0 0
1 0 1 2 3 4 5 6 7 8 9
2 0 2 4 6 8 10 12 14 16 18
3 0 3 6 9 12 15 18 21 24 27
4 0 4 8 12 16 20 24 28 32 36
5 0 5 10 15 20 25 30 35 40 45
6 0 6 12 18 24 30 36 42 48 54
7 0 7 14 21 28 35 42 49 56 63
8 0 8 16 24 32 40 48 56 64 72
9 0 9 18 27 36 45 54 63 72 81

©Marian Small, 2011
1 x 2 + 2 x 3 1 x 3 + 2 x 3
3 x 1 + 4 x 2 3 x 2+ 4 x 1

©Marian Small, 2011
Move objects to compare 3 x 3 + 4 x 4 to 3 x 4 + 4 x 3

©Marian Small, 2011
Picture a 100 chart
1 2 3 4 5 6 7 8 9 10
11 12 13 14 15 16 17 18 19 20
21 22 23 24 25 26 27 28 29 30
31 32 33 34 35 36 37 38 39 40
41 42 43 44 45 46 47 48 49 50
51 52 53 54 55 56 57 58 59 60
61 62 63 64 65 66 67 68 69 70
71 72 73 74 75 76 77 78 79 80
81 82 83 84 85 86 87 88 89 90
91 92 93 94 95 96 97 98 99 100

©Marian Small, 2011
Big Idea

©Marian Small, 2011
How else could you…
• represent the pattern 2, 5, 8, 11,….

©Marian Small, 2011
How else could you…
• represent the pattern 2, 5, 8, 11,….

©Marian Small, 2011
How else could you…
• represent the pattern 2, 5, 8, 11,….

©Marian Small, 2011
How else could you…
• What pattern do you see?
Term number Term value
1 2
2 5
3 8
4 11

©Marian Small, 2011
How else could you…
• What pattern do you see?
Term number Term value Related pattern
1 2 3
2 5 6
3 8 9
4 11 12

©Marian Small, 2011
Variables and equations
• Grade 4- problems as equations with unknowns; solve one-step equations
• Grade 5- single-variable, one-step equations
• Grade 6- generalizations written using variables; model equality preservation

©Marian Small, 2011
Algebra big ideas

©Marian Small, 2011
Try this
• What situation might 2w describe?
• Type some possibilities on the next screen.

©Marian Small, 2011

©Marian Small, 2011
Try this
• Jeff got $12 in allowance every week.
• What does 6 x w tell about the situation?
A: his allowance
B: his allowance in w weeks
C: his allowance in 2 xw weeks
D: his allowance in w ÷ 2 weeks

©Marian Small, 2011
Try this
• Jeff got $12 in allowance every week.
• What does 12w tell about the situation?
• What equation would you solve to find out how many weeks until he had $156?

©Marian Small, 2011
The solution is…
• The solution to an equation is x = 2.
• What might the equation have been?
• Type some possibilities on the next screen.

©Marian Small, 2011

©Marian Small, 2011
Respond by raising your hand

©Marian Small, 2011
Data
• Grade 4- many-to-one correspondence for
pictographs and bar graphs
• Grade 5- double bar graphs
• Grade 6- line graphs

©Marian Small, 2011
What’s going on?
• Vote for A or B in terms of which makes it easier for you to tell what’s going on?

©Marian Small, 2011
A
• Kids who like chocolate chip cookies most: Jane, Kyle, Ravi, Shilpa, Elaine, Jar-Ye, Sindy, Amy, Liam
• Kids who like oatmeal cookies most: Aaron, Amanda, Diana, Carolyn, Geoffrey, Suhana, Jeremy, Terry-Lynn

©Marian Small, 2011
B
Chocolate Chip
Oatmeal

©Marian Small, 2011
B
Chocolate Chip
Oatmeal

©Marian Small, 2011
Which graph would you use?
• Vote:
• A for bar graph with scale of 2
• B for bar graph with scale of 5
• C for pictograph with scale of 2
• D for pictograph with scale of 5

©Marian Small, 2011
Let’s compare bar graphs
• Do the two graphs on the next two slides give you the same impression about the following data?
• Use √ for yes and x for no.
Favourite Pets
Dog 20
Cat 15
Rat 2

©Marian Small, 2011
You choose

©Marian Small, 2011
You choose

©Marian Small, 2011
You choose

©Marian Small, 2011
How do these differ in the impression they give? Raise
your hand.

©Marian Small, 2011
What will happen
• I will show you a graph.
• I will mention some things you might think it shows well.
• If you think it is easy to see, click a happy face.
• If not, click a thumbs down.

©Marian Small, 2011
What does this graph about how I divide my day show?

©Marian Small, 2011
The big idea

©Marian Small, 2011
Other important big ideas
• Pictographs and bar graphs are particularly useful for comparing frequency of data in different categories.
• Line graphs are particularly useful for showing relationships between quantities and trends.

©Marian Small, 2011
Probability
• Grade 5- verbal comparisons of likelihood
• Grade 6- experimental/theoretical probability

©Marian Small, 2011
Using probability language
• Choose which is most likely about a new kid joining a Grade 5 class:
• A: It’s a boy.
• B: The student is the same age as lots of other kids in the class.
• C: The student lives in the area.
• D: The student is human.

©Marian Small, 2011
Now…
• You write a phrase that is:
• Almost certain
• Impossible
• Very likely
• Very unlikely

©Marian Small, 2011
A Big Idea

©Marian Small, 2011
You just flipped a coin and…
• You got
• H H H H H H H H H
Vote:
√ if you think a H next time
X if you think a T next time

©Marian Small, 2011
Experimental probability
• You are going to create an experiment using ONE die.
• The result you want should happen about three-fourths of the time.
• What would you choose for your result?
• Some choices are on the next screen.

©Marian Small, 2011
Choices
• A: an even number
• B: a number more than 2
• C: anything but 1
• D: a number less than 5

©Marian Small, 2011
Big Ideas

©Marian Small, 2011
Sharing Time
• I hope some of you have stories to share.

©Marian Small, 2011
I am hoping that :
• you will try out one of the questions we discussed or, even better, your own question to bring out a big idea in number.
• We’ll talk about the results next time.
Top Related