


Languages
Pages
Legal


Beyond volume of patients: Organizational and professional
factors related to hospital outcomes
R. Blais, PhD, R. Pineault, MD, PhD,P. Boyle, PhD, S. Dubé, MD,
D. Larouche, MSc, M. Fournier, MSc
GRIS, University of Montreal, Canada
APHA 129th Annual meeting, Atlanta, Oct. 24, 2001

2
Background
Hospital managers are looking for ways to reduce cost while maintaining or improving quality of care.
One popular hypothesis is that facilities that treat more patients are more performant and have better clinical outcomes. This has led to many mergers and efforts to increase production capacity.
Yet studies on the relationship between volume and outcomes have produced mixed results, indicating that other factors intervene.
These other factors have not been well documented through quantitative analysis of administrative databases.
New insight may be gained through a qualitative approach to the question of the relationship between volume and outcomes.

3
Objective
•The purpose of this study was to identify the organizational and professional variables that come into play in the relationship between hospital patient volume and surgical outcomes for specific procedures.

4
Methods Outcome indicators
Target interventions:Cholecystectomy, hysterectomy, prostatectomy
Outcome indicators:Complications during hospitalization plus readmissions for complications <91 days, adjusted for severity (APR-DRG)
Source of data: Quebec provincial discharge-abstract database
(1997-1998)
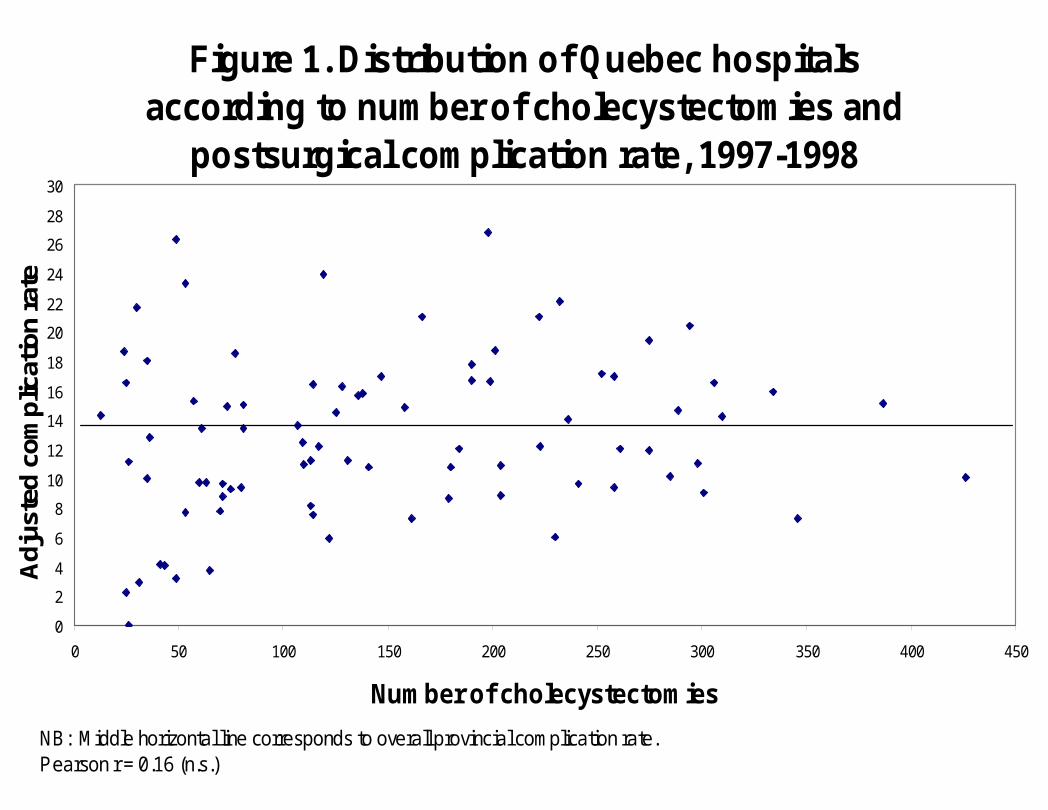
Figure 1. Distribution of Quebec hospitals according to number of cholecystectomies and
postsurgical complication rate, 1997-1998
0
2
4
6
8
10
12
14
16
18
20
22
24
26
28
30
0 50 100 150 200 250 300 350 400 450
Number of cholecystectomies
Adj
uste
d co
mpl
icat
ion
rate
NB: Middle horizontal line corresponds to overall provincial complication rate.Pearson r = 0.16 (n.s.)
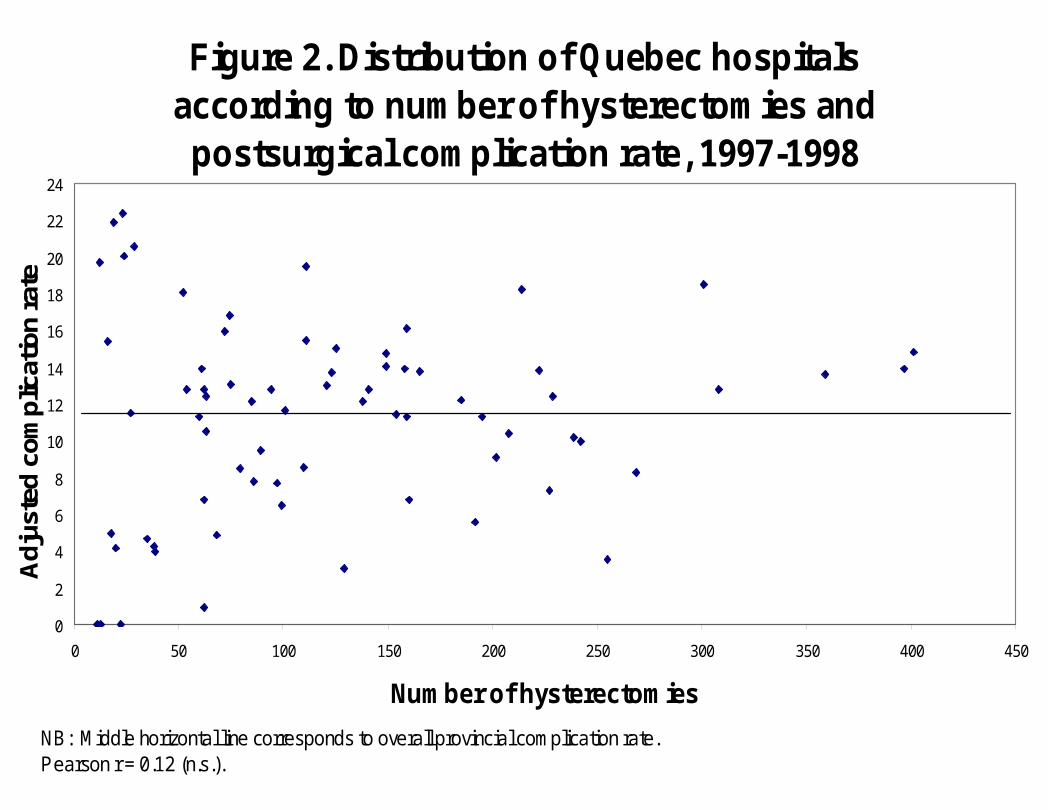
Figure 2. Distribution of Quebec hospitals according to number of hysterectomies and postsurgical complication rate, 1997-1998
0
2
4
6
8
10
12
14
16
18
20
22
24
0 50 100 150 200 250 300 350 400 450
Number of hysterectomies
Adj
uste
d co
mpl
icat
ion
rate
NB: Middle horizontal line corresponds to overall provincial complication rate.Pearson r = 0.12 (n.s.).

Figure 3. Distribution of Quebec hospitals according to number of prostatectomies and
postsurgical complication rate, 1997-1998
0
2
4
6
8
10
12
14
16
18
20
22
24
26
28
30
32
34
0 20 40 60 80 100 120 140 160
Number of prostatectomies
Ad
just
ed c
om
plic
atio
n r
ate
NB: Middle horizontal line corresponds to overall provincial complication rate.Pearson r = -0.32 (p<0.05)
8
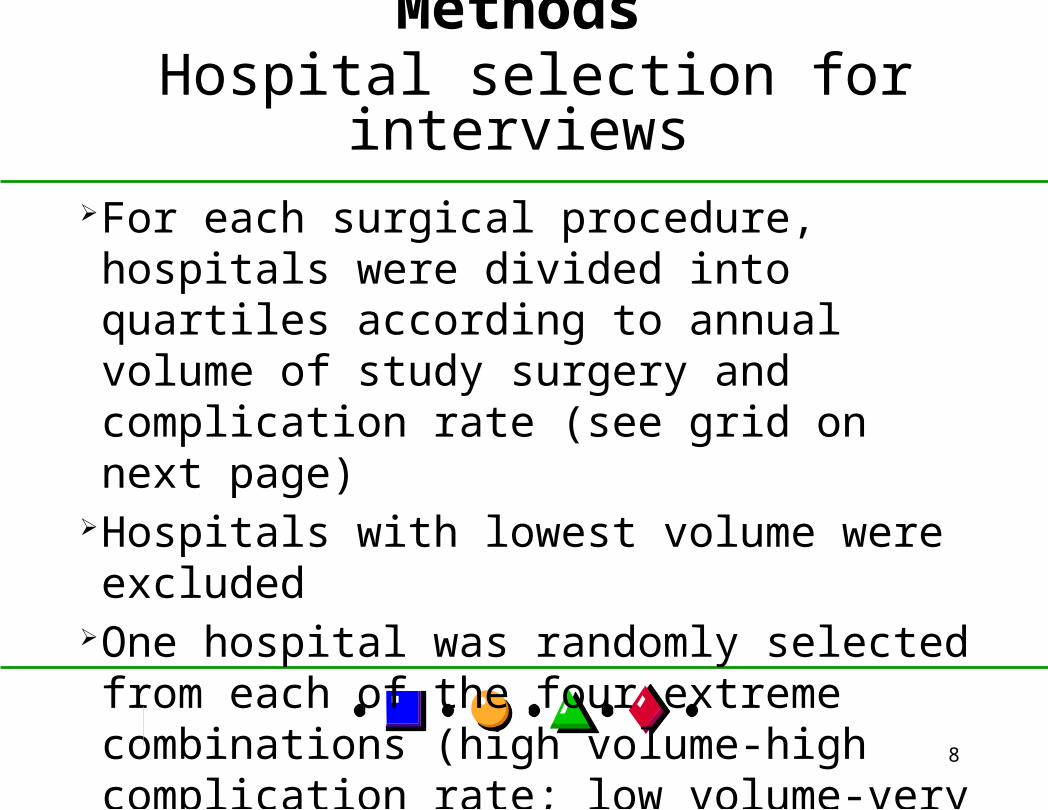
Methods Hospital selection for interviews
For each surgical procedure, hospitals were divided into quartiles according to annual volume of study surgery and complication rate (see grid on next page)
Hospitals with lowest volume were excludedOne hospital was randomly selected from each of the four extreme combinations (high volume-high complication rate; low volume-very low complication rate, etc.)
9
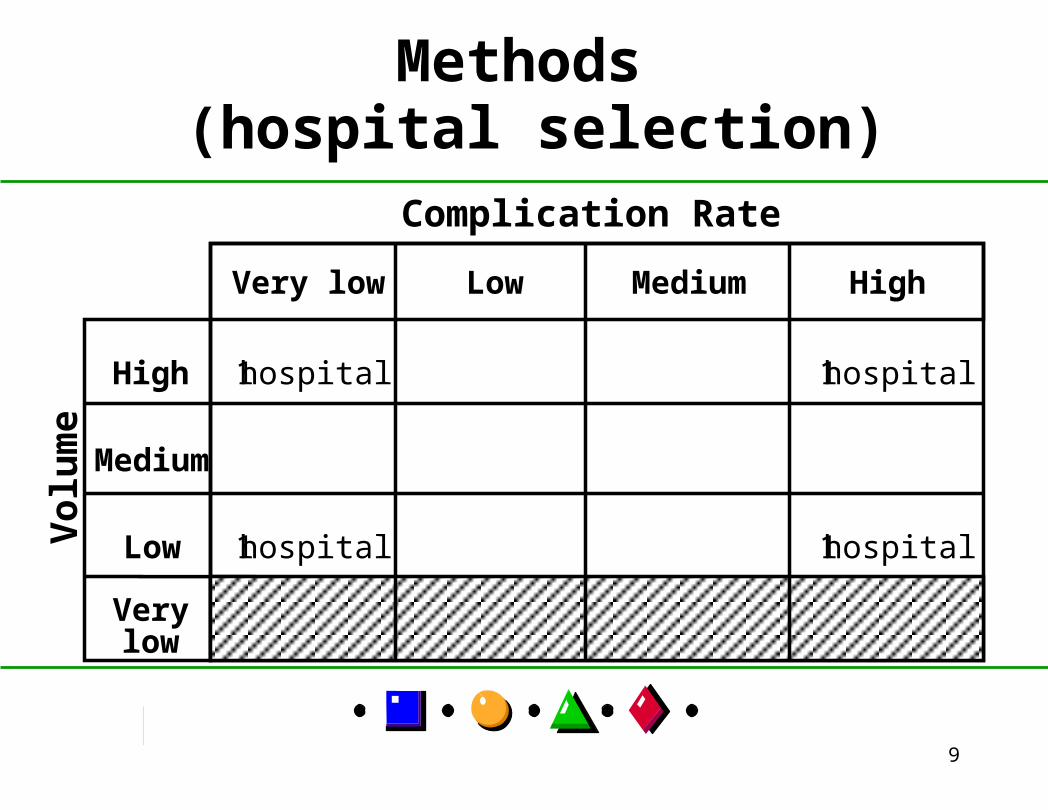
Methods (hospital selection)
Very low Low
Medium
High
High
Low
Verylow
Medium
Complication Rate
1 hospital 1 hospital
1 hospital 1 hospital
Vol
um
e
10
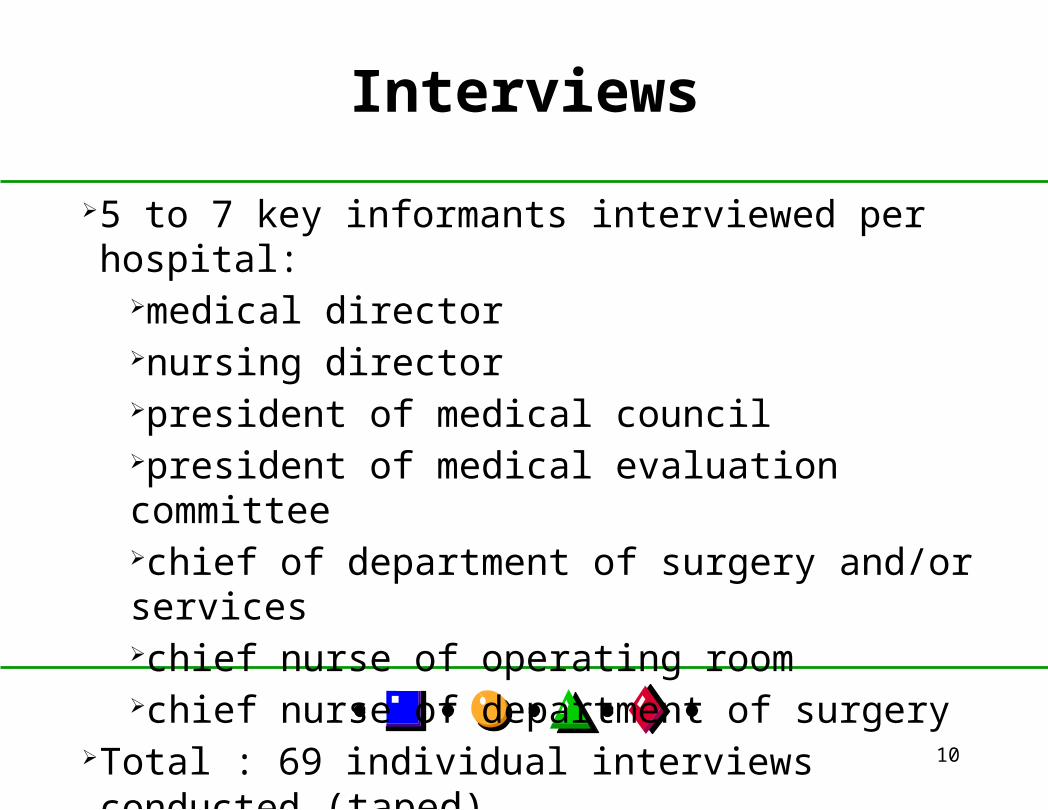
Interviews
5 to 7 key informants interviewed per hospital:medical directornursing directorpresident of medical councilpresident of medical evaluation committeechief of department of surgery and/or serviceschief nurse of operating roomchief nurse of department of surgery
Total : 69 individual interviews conducted (taped)

11
ResultsInterview themes
1. Hospital characteristics 2. Physician characteristics 3. Nurse characteristics 4. Quality monitoring activities 5. Operating room functioning 6. Pre-op and post-op care 7. Hospital discharge34 sub-themes

12
Results
1. Hospital characteristics
Very low complication rate High complication rate
Highvolume
Lowvolume
•Teaching (except 1)
•Agreement with community facilities for post-op care (except 1)
•Teaching (except 1)
•No agreement with community facilities for post-op care
•Non teaching
•No agreement with community facilities for post-op care
•Non teaching (except 1)
•No agreement with community facilities for post-op care (except 1 for day surgery)
13
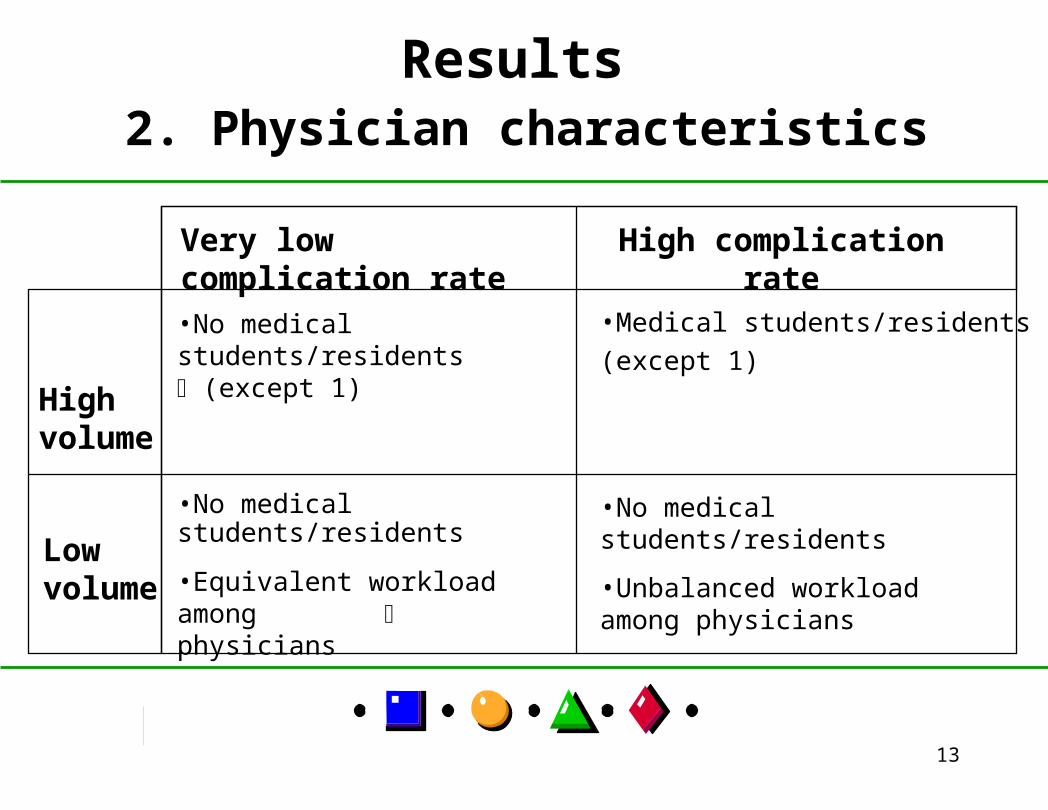
Results
2. Physician characteristics
Very low complication rate High complication rate
Highvolume
Lowvolume
•No medical students/residents (except 1)
•Medical students/residents (except 1)
•No medical students/residents
•Equivalent workload among physicians
•No medical students/residents
•Unbalanced workload among physicians

14
Results
3. Nurse characteristics
Very low complication rate High complication rate
Highvolume
Lowvolume
•More nurses per operating room
•Continuing education for operating room nurses
•Fewer nurses per operating room
•No continuing education for
operating room nurses (except 1)
•More nurses per operating room (except 1)
•Continuing education for operating room nurses (except 1)
•Fewer nurses per operating room
•Continuing education for operating room nurses (except 1)

15
Results
4. Quality monitoring activities
Very low complication rate High complication rate
Highvolume
Lowvolume
•More evaluation studies with objective criteria
•Fewer evaluation studies with
objective criteria
•Few evaluation studies with objective criteria
•Few evaluation studies with objective criteria

16
Results
5. Operating room functioning
Very low complication rate High complication rate
Highvolume
Lowvolume
•Low surgery cancellation rate
•OR time allocated by needs
•Only regular schedule surgery
•Adequate equipment (except 1)
•High surgery cancellation rate (10%)
•OR time unequaly allocated
•Evening, night, weekend surgery (1)
•Lack of or inadequate equipment
•Low surgery cancellation rate
•Only regular schedule surgery
•High surgery cancellation rate (10%)
•Evening, night, weekend surgery (1)
17
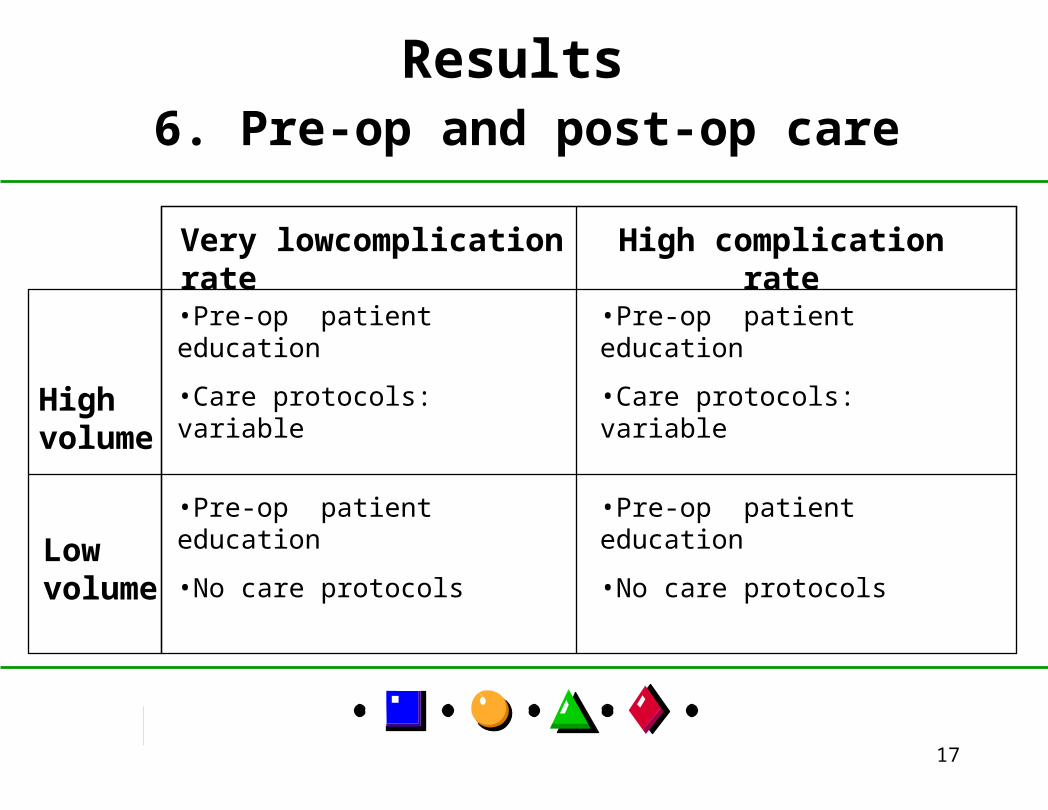
Results
6. Pre-op and post-op care
Very lowcomplication rate High complication rate
Highvolume
Lowvolume
•Pre-op patient education
•Care protocols: variable
•Pre-op patient education
•Care protocols: variable
•Pre-op patient education
•No care protocols
•Pre-op patient education
•No care protocols

18
Results
7. Hospital discharge
Very lowcomplication rate High complication rate
Highvolume
Lowvolume
•Telephone follow-up by nurse after discharge (except 1)
•Visit to surgeon after discharge
•No telephone follow-up by nurses after discharge (except 1)
•Visit to surgeon after discharge
•Telephone follow-up by nurses after discharge (except 1)
•Visit to surgeon after discharge
•Telephone follow-up by nurses after discharge (except 1)
•Visit to surgeon after discharge (except 1: not always)
19
DiscussionFactors affecting outcomes go beyond physician’s ability and include a wide range of organizational and professional characteristics
Factors may be different whether hospital volume is high or low
Hospital teaching status or size does not guarantee better outcomes
Many factors can actually be changed (e.g., develop agreement with community facilities, provide continuing education to nurses)

20
Limitations
Only 12 hospitalsOnly 3 surgical procedures of medium complexity: factors may be different for other types of surgery or non surgical care
Not all variables were documented with the same precision across hospitals
Physician volume not examined

21
Conclusion
Patient outcomes result from the interaction of many factors. Structure variables (e.g. teaching status, number of beds, volume of cases) are insufficient to explain variations in outcomes among hospitals.
Process variables seem to be more important determinant of outcomes.
A more thorough understanding of the process of care is needed to better explain variations in outcomes.

22
For more information
Régis Blais, PhDDepartment of Health AdministrationUniversity of Montreal - GRISPO Box 6128, Station Centre-villeMontreal (Quebec), Canada H3C 3J7
Tel: (514) 343-5907E-mail: [email protected]
Top Related