


Languages
Pages
Legal

Better Buildings Webinar Series
We’ll be starting in just a few minutes….
Tell us…please send your responses to the webinar
organizers via the chat window:
1. What topics are you interested in for future webinars?
2. How are you addressing plug load?
1

Click To Edit Master Title Style
Strategies and Resources for Reducing Plug Load Energy Use in Your Buildings
December 1, 2015 3:00-4:00 PM ET
Plug into Energy Savings:
Overview and Agenda
Welcome & Introductions
Plug load Overview – National Renewable Energy Laboratory
(NREL)
Case Study – Stanford University
Case Study – U.S. General Services Administration (GSA)
Additional Resources
Question & Answer Session
3
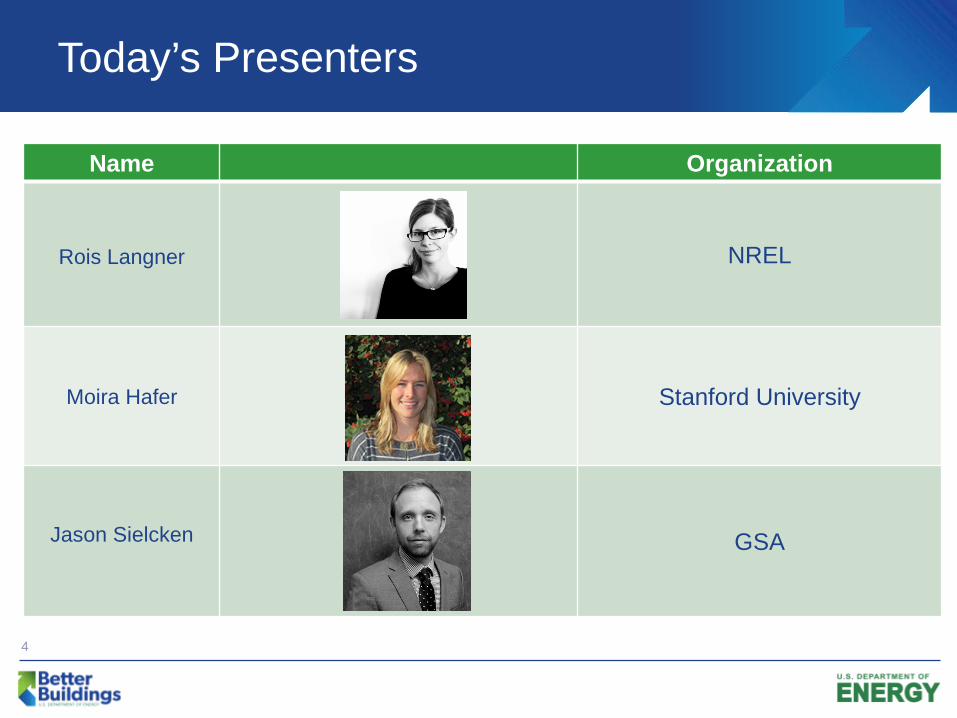
Today’s Presenters
4
Name Organization
Rois Langner NREL
Moira Hafer Stanford University
Jason Sielcken
GSA
Rois Langner
National Renewable Energy Laboratory (NREL)
Program Name or Ancillary Text eere.energy.gov DRAFT – Do Not Cite
BUILDING TECHNOLOGIES PROGRAM Better Buildings Alliance Plug and Process Load (PPL) Technical Solutions Team
December 1, 2015 Technical Lead Lab: The National Renewable Energy Laboratory (NREL)
Building Technologies Office
DRAFT – Do Not Cite
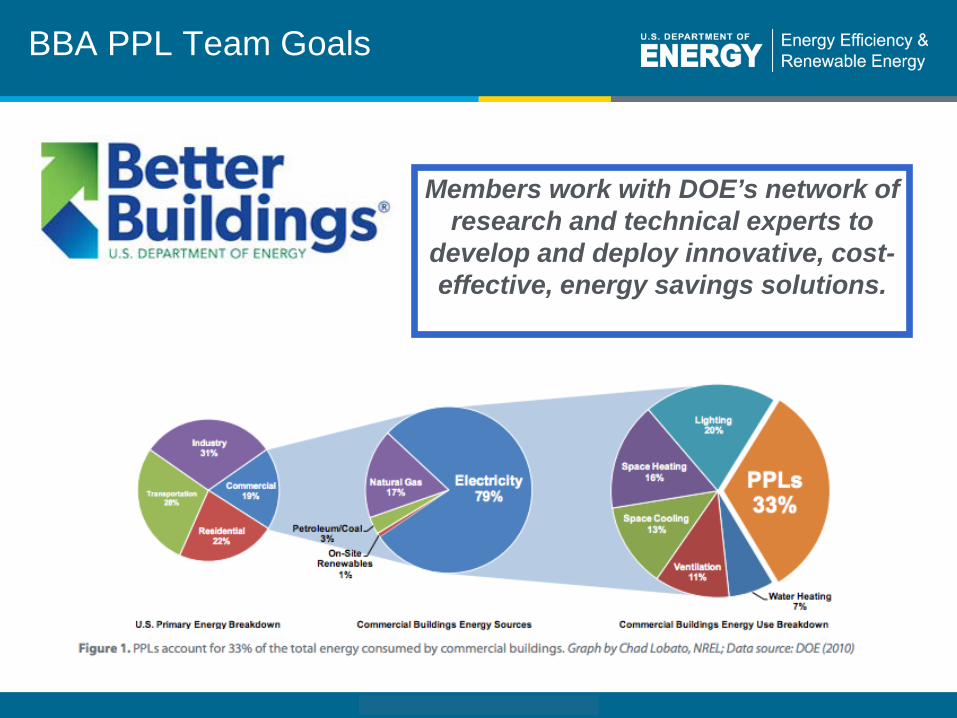
BBA PPL Team Goals
Members work with DOE’s network of research and technical experts to
develop and deploy innovative, cost-effective, energy savings solutions.
DRAFT – Do Not Cite
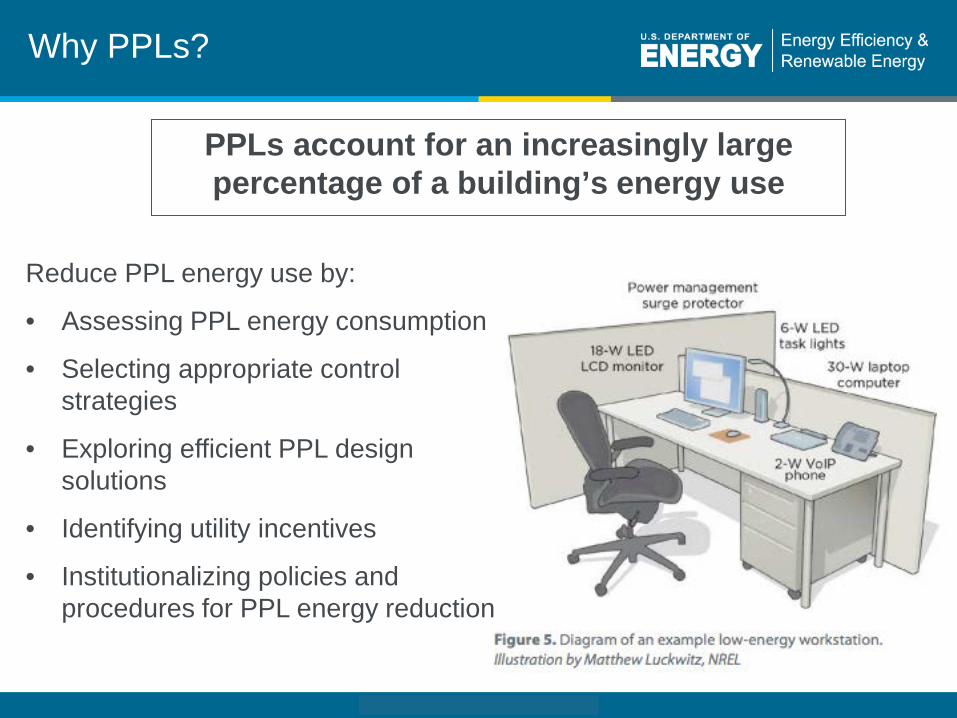
Why PPLs?
PPLs account for an increasingly large percentage of a building’s energy use
Reduce PPL energy use by:
• Assessing PPL energy consumption
• Selecting appropriate control strategies
• Exploring efficient PPL design solutions
• Identifying utility incentives
• Institutionalizing policies and procedures for PPL energy reduction
DRAFT – Do Not Cite
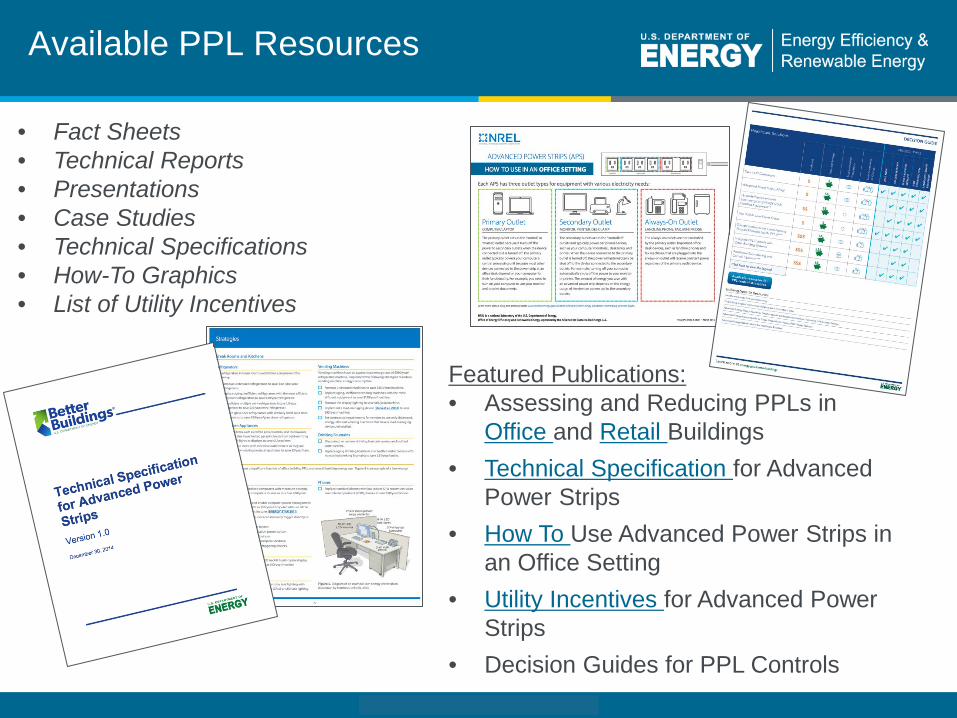
Available PPL Resources
• Fact Sheets • Technical Reports • Presentations • Case Studies • Technical Specifications • How-To Graphics • List of Utility Incentives
Featured Publications: • Assessing and Reducing PPLs in
Office and Retail Buildings • Technical Specification for Advanced
Power Strips • How To Use Advanced Power Strips in
an Office Setting • Utility Incentives for Advanced Power
Strips • Decision Guides for PPL Controls

DRAFT – Do Not Cite
PPL Solutions
• Messaging, or Turn it Off! Campaigns
• Advanced Power Strips
• Upgrade Equipment with Low-Energy or ENERGY STAR ®-Certified Equipment
• Use Built-In Low Power States for Equipment
• Design Strategies for Consolidating PPLs
• Integrated PPL Controls with Other Building Systems
• Submetering and Control Options
Illustration by Marjorie Schott, NREL

DRAFT – Do Not Cite
Upcoming Projects & Events
Upcoming Projects: • Technology & behavioral study comparing
thin-client/server-based computing systems to traditional computing systems
• Technical report
• Case study
NREL PIX #23249
Ongoing PPL Events: • Bi-Annual BBA PPL Technical Team Calls
• 2016 Better Buildings Summit: May 9-11, DC
• Continually update resources on BBA PPL website

DRAFT – Do Not Cite
Join the BBA PPL Tech Team
https://www4.eere.energy.gov/alliance/activities/technology-solutions-teams/plug-process-loads

DRAFT – Do Not Cite
Team Members

DRAFT – Do Not Cite
Thank you!
Rois Langner National Renewable Energy Laboratory
[email protected] Phone: (303) 275-4329

Moira Hafer Stanford University

A Data-Driven Approach to Plug Load Energy Reduction Programs
Moira Hafer
Stanford University Better Buildings Alliance Webinar
December 1, 2015
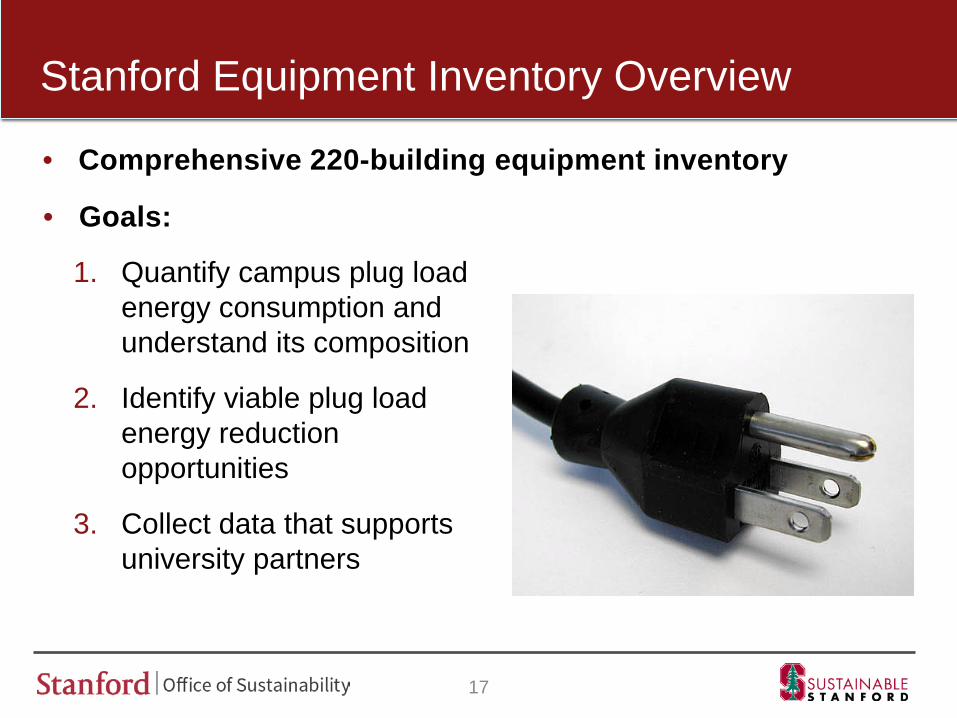
• Goals:
1. Quantify campus plug load energy consumption and understand its composition
2. Identify viable plug load energy reduction opportunities
3. Collect data that supports university partners
Stanford Equipment Inventory Overview
17
• Comprehensive 220-building equipment inventory

• Types of equipment included: • Standard office equipment • Standard lab equipment • Common IT equipment • Kitchen & break room equipment • Gym equipment • Other
• EH&S hazards • Water fixtures • Occupancy data
• Attributes collected for each type of equipment to provide necessary details for estimating energy consumption
Scope
18
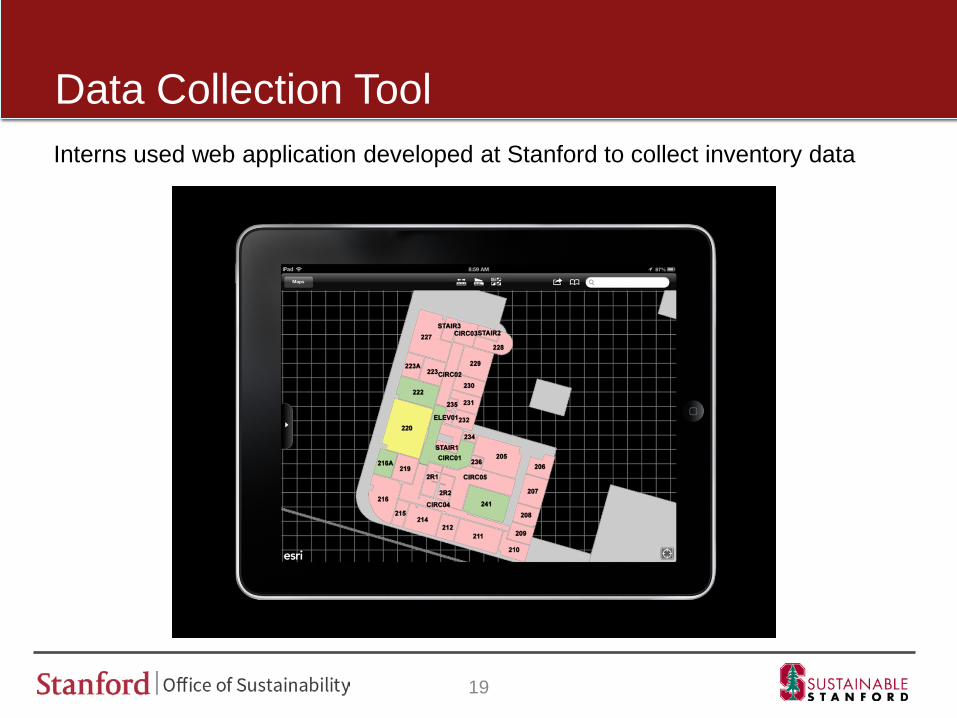
Data Collection Tool
19
Interns used web application developed at Stanford to collect inventory data
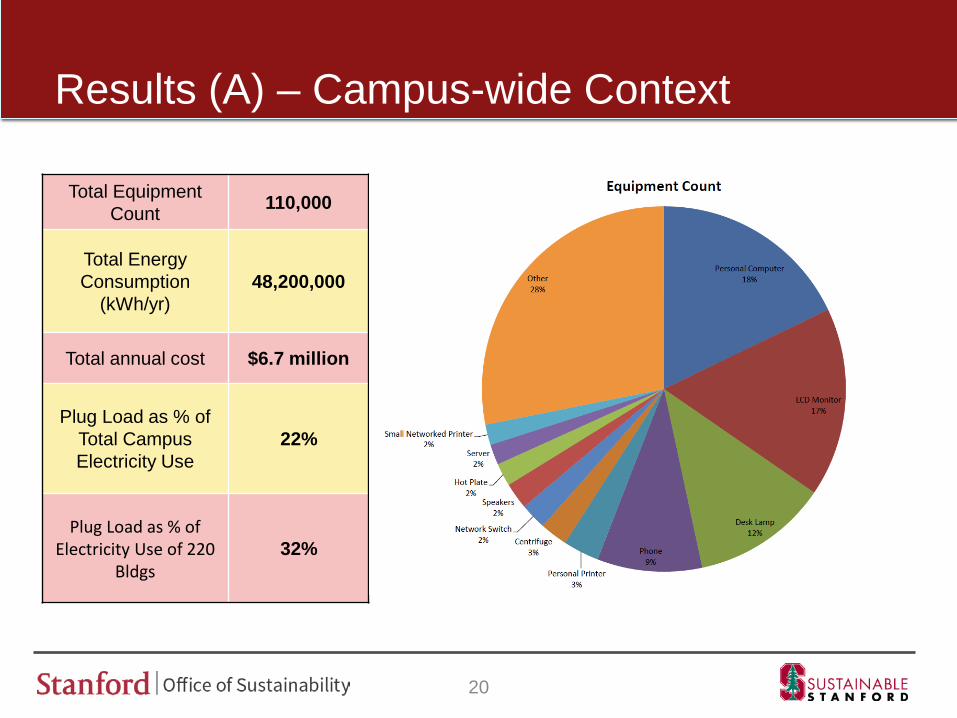
Results (A) – Campus-wide Context
20
Total Equipment Count 110,000
Total Energy Consumption
(kWh/yr) 48,200,000
Total annual cost $6.7 million
Plug Load as % of Total Campus Electricity Use
22%
Plug Load as % of Electricity Use of 220
Bldgs 32%

Results (B) - Energy Consumption by Equipment Type
21

Results (C) – Energy Consumption by Building Type
0.00
1.00
2.00
3.00
4.00
5.00
6.00
7.00
8.00
9.00
10.00
Ener
gy U
se In
tens
ity (k
Wh/
SqFt
/Yr)
Average Plug Load Energy Use Intensity by Building Type
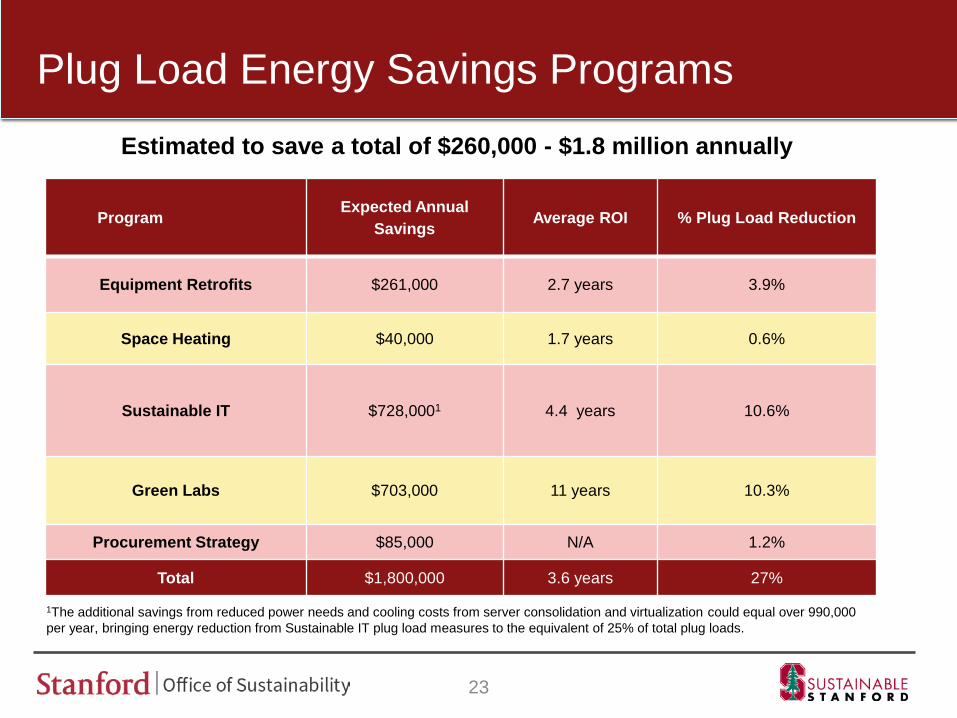
Program Expected Annual
Savings Average ROI % Plug Load Reduction
Equipment Retrofits $261,000 2.7 years 3.9%
Space Heating $40,000 1.7 years 0.6%
Sustainable IT $728,0001 4.4 years 10.6%
Green Labs $703,000 11 years 10.3%
Procurement Strategy $85,000 N/A 1.2%
Total $1,800,000 3.6 years 27%
Plug Load Energy Savings Programs
23
1The additional savings from reduced power needs and cooling costs from server consolidation and virtualization could equal over 990,000 per year, bringing energy reduction from Sustainable IT plug load measures to the equivalent of 25% of total plug loads.
Estimated to save a total of $260,000 - $1.8 million annually

Thank you!
M OIRA HAFER [email protected]
FOR MORE INFORMATION, V IS IT US AT HTTP: / /SUSTAINABLE. STANFORD.EDU
24
Jason Sielcken U.S. General Services Administration (GSA)

December 2015
WAYNE N. ASPINALL FEDERAL BUILDING & US COURTHOUSE PPL ENERGY INCENTIVE DATA REVIEW & LESSONS LEARNED
2015 BETTER BUILDINGS ALLIANCE Page 27
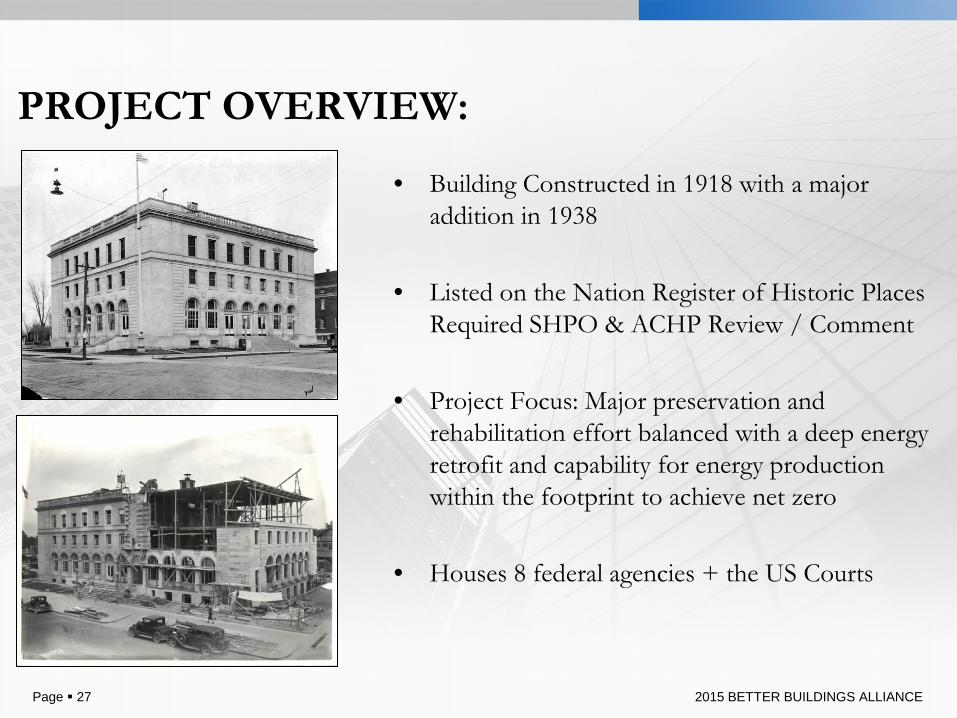
PROJECT OVERVIEW:
• Building Constructed in 1918 with a major
addition in 1938
• Listed on the Nation Register of Historic Places Required SHPO & ACHP Review / Comment
• Project Focus: Major preservation and rehabilitation effort balanced with a deep energy retrofit and capability for energy production within the footprint to achieve net zero
• Houses 8 federal agencies + the US Courts

2015 BETTER BUILDINGS ALLIANCE Page 28
PROJECT OVERVIEW:
• Design Build Procurement
• Target of LEED Platinum & Class A Net Zero
• SHPO & GSA reviews required a substantial
reduction to the visibility of the renewable energy resource post award
• Challenge: Reduce the PV : Maintain ZNE
2015 BETTER BUILDINGS ALLIANCE Page 29
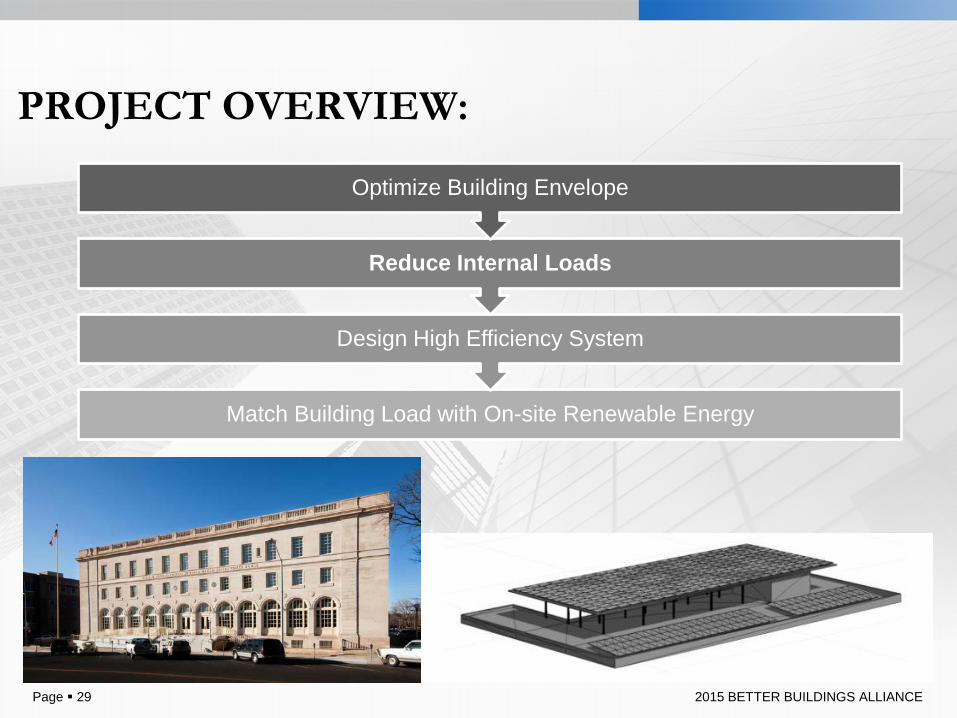
PROJECT OVERVIEW:
Match Building Load with On-site Renewable Energy
Design High Efficiency System
Reduce Internal Loads
Optimize Building Envelope
2015 BETTER BUILDINGS ALLIANCE Page 30
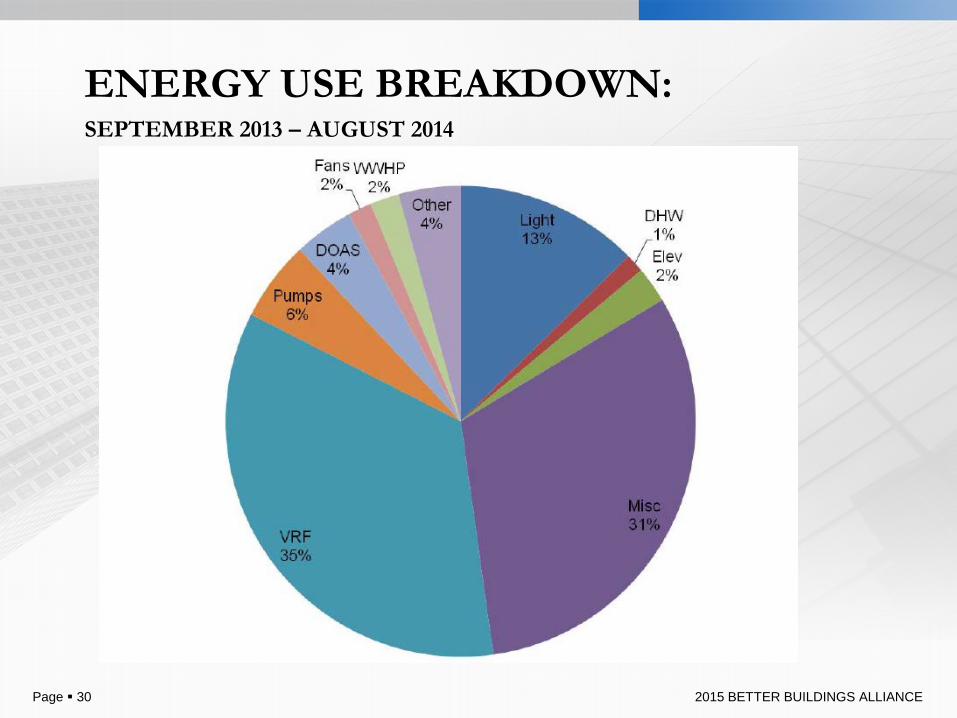
ENERGY USE BREAKDOWN: SEPTEMBER 2013 – AUGUST 2014
2015 BETTER BUILDINGS ALLIANCE Page 31
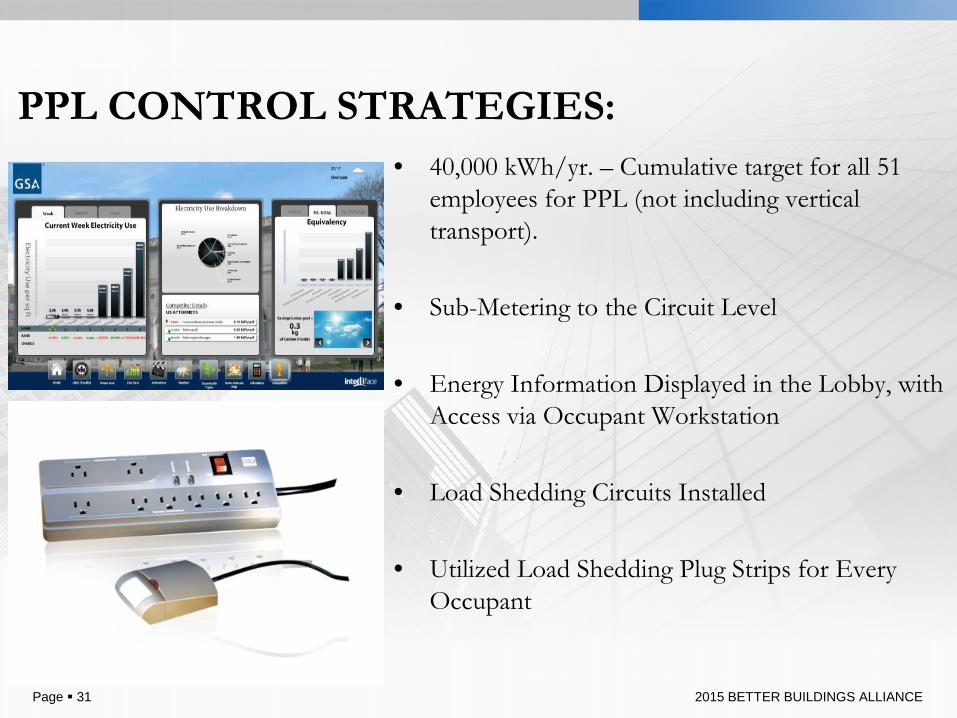
PPL CONTROL STRATEGIES:
• 40,000 kWh/yr. – Cumulative target for all 51 employees for PPL (not including vertical transport).
• Sub-Metering to the Circuit Level
• Energy Information Displayed in the Lobby, with Access via Occupant Workstation
• Load Shedding Circuits Installed
• Utilized Load Shedding Plug Strips for Every Occupant
2015 BETTER BUILDINGS ALLIANCE Page 32
FINANCIAL INCENTIVE:
Take a portion of the RSF fee GSA collects for utilities and offer it back to the agency if
they meet their energy target. Reward Occupant Awareness & Response
Agency target was based on their RSF, FTE Count, and Mission.
2015 BETTER BUILDINGS ALLIANCE Page 33
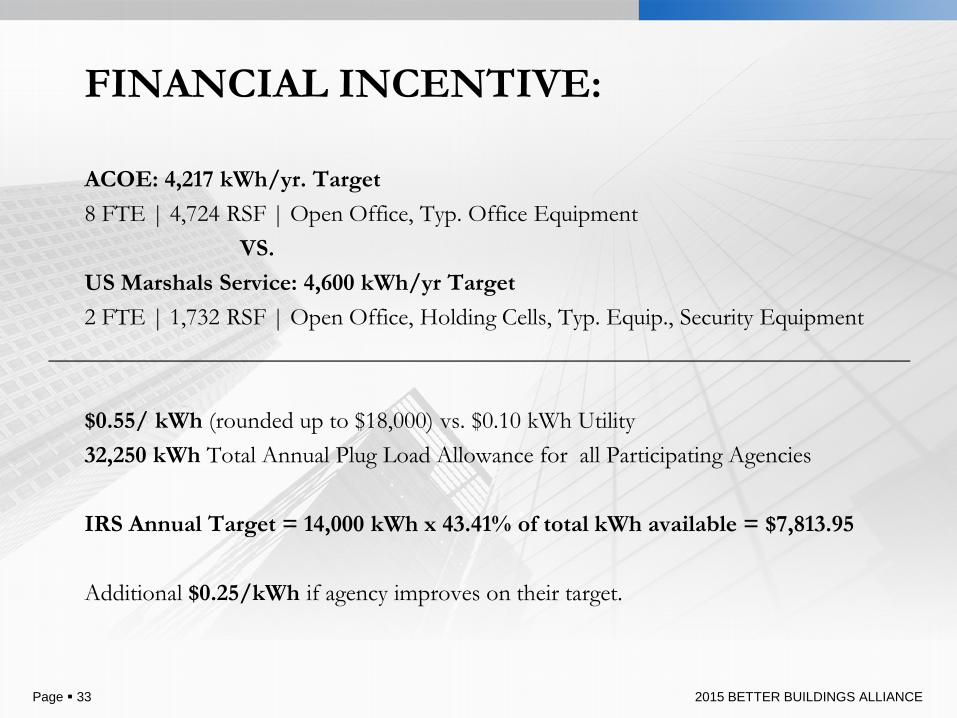
FINANCIAL INCENTIVE:
ACOE: 4,217 kWh/yr. Target 8 FTE | 4,724 RSF | Open Office, Typ. Office Equipment VS. US Marshals Service: 4,600 kWh/yr Target 2 FTE | 1,732 RSF | Open Office, Holding Cells, Typ. Equip., Security Equipment $0.55/ kWh (rounded up to $18,000) vs. $0.10 kWh Utility 32,250 kWh Total Annual Plug Load Allowance for all Participating Agencies IRS Annual Target = 14,000 kWh x 43.41% of total kWh available = $7,813.95 Additional $0.25/kWh if agency improves on their target.

2015 BETTER BUILDINGS ALLIANCE Page 34
US ARMY CORP OF ENGINEERS:
• 8 FTE: 339 kWh/FTE ANNUALLY • 0.6 kWh/RSF ANNUALLY
INTERNAL REVENUE SERVICE: • 23 FTE: 609 kWh/FTE ANNUALLY • 1.4 kWh/RSF ANNUALLY
US SENATE:
• 2 FTE: 628 kWh/FTE ANNUALLY • 1.37 kWh/RSF ANNUALLY
US PROBATION:
• 2 FTE: 1,010 kWh/FTE ANNUALLY • 0.9 kWh/RSF ANNUALLY
FEDERAL BUREAU OF INVESTIGATION:
• 3 FTE: 12,734 kWh/FTE ANNUALLY • 11.49 kWh/RSF ANNUALLY
US DISTRICT COURTS: • 2 PTE: 4,197 kWh/PTE ANNUALLY • 1.34 kWh/RSF ANNUALLY
US MARSHALS SERVICE: • 2 FTE: 3,223 kWh/FTE ANNUALLY • 3.72 kWh/RSF ANNUALLY
US ATTORNEYS: • 0 FTE: 0 kWh/FTE ANNUALLY • 0.0 kWh/RSF ANNUALLY
RESULTS:

2015 BETTER BUILDINGS ALLIANCE Page 35
NEXT STEPS: 1. I.T. SUPPORT & INVOLVEMENT IS CRITICAL
2. INCENTIVIZE MORE THAN JUST PLUG LOAD
3. CONSIDER THE INCENTIVE DURATION
4. CONSIDER WHERE THE INCENTIVE GOES – WHAT IS THE LOCAL
RECOGNITION?
5. IS THE REWARD ENOUGH TO DRIVE CHANGE
2015 BETTER BUILDINGS ALLIANCE Page 36
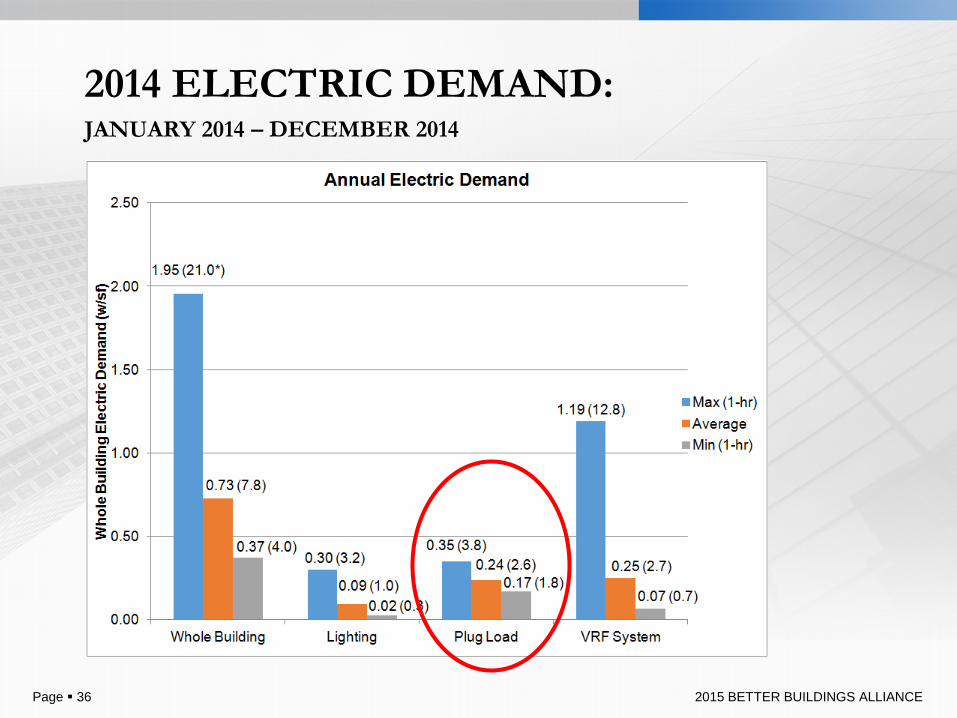
2014 ELECTRIC DEMAND: JANUARY 2014 – DECEMBER 2014
2015 BETTER BUILDINGS ALLIANCE Page 37
NEXT STEPS: 1. I.T. SUPPORT & INVOLVEMENT IS CRITICAL
2. INCENTIVIZE MORE THAN JUST PLUG LOAD
3. CONSIDER THE INCENTIVE DURATION
4. CONSIDER WHERE THE INCENTIVE GOES – WHAT IS THE LOCAL
RECOGNITION?
5. IS THE REWARD ENOUGH TO DRIVE CHANGE
2015 BETTER BUILDINGS ALLIANCE
DISCUSSION CONTACT: JASON S. SIELCKEN, PMP, LEED AP BD+C [email protected] 303.236.2972
Page 38

Additional Resources
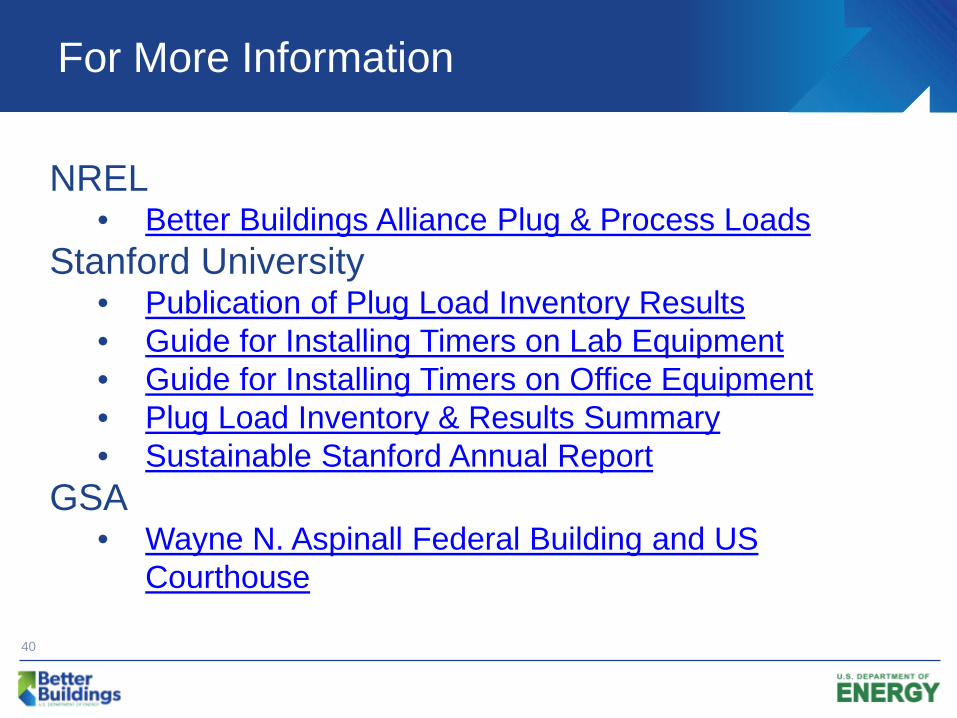
For More Information
40
NREL • Better Buildings Alliance Plug & Process Loads
Stanford University • Publication of Plug Load Inventory Results • Guide for Installing Timers on Lab Equipment • Guide for Installing Timers on Office Equipment • Plug Load Inventory & Results Summary • Sustainable Stanford Annual Report
GSA • Wayne N. Aspinall Federal Building and US
Courthouse

Q & A

Join us for the next Better Buildings Webinar
42
Registration is now open!
Cutting Edge Building Technologies – Join the Fun! January 12, 3:00 – 4:00 PM ET Presenters: U.S. Department of Energy New York Presbyterian Hospital QM Power
Register here.

2016 Better Buildings Summit
43
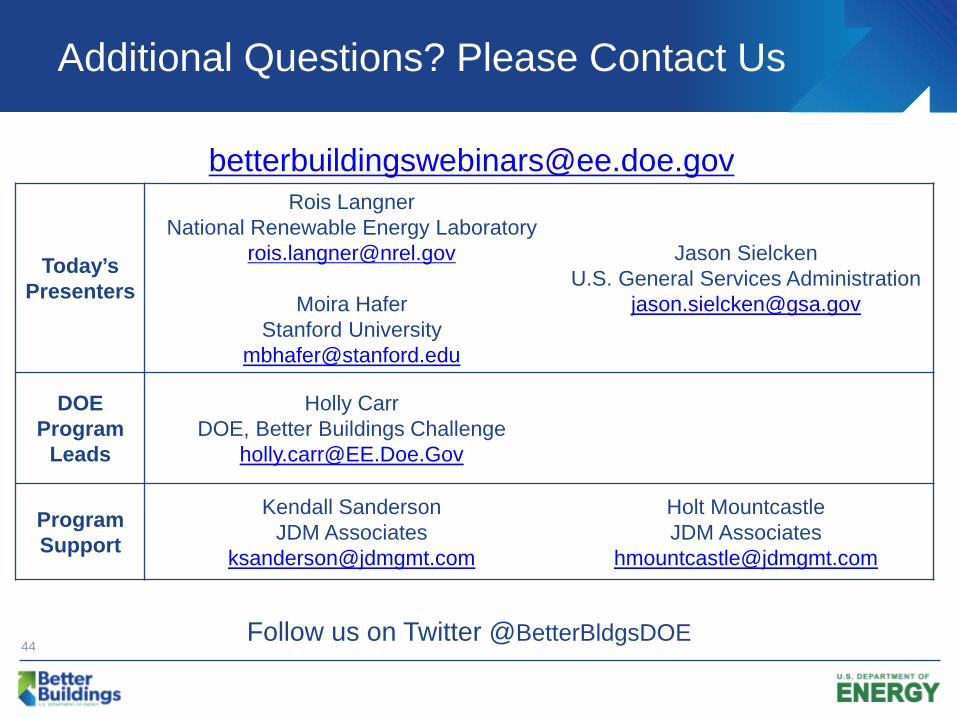
Additional Questions? Please Contact Us
44
Today’s Presenters
Rois Langner National Renewable Energy Laboratory
Moira Hafer Stanford University
Jason Sielcken
U.S. General Services Administration [email protected]
DOE Program
Leads
Holly Carr DOE, Better Buildings Challenge
Program Support
Kendall Sanderson JDM Associates
Holt Mountcastle JDM Associates
Follow us on Twitter @BetterBldgsDOE
Top Related