


Languages
Pages
Legal


Population, international migration Population, international migration and global sustainable developmentand global sustainable development
Perspectives on Global Development: Expert Group Meeting on International Migration and Development
OECD Development CentreParis, 24-25 February 2015
Bela Hovy, ChiefMigration Section, Population Division
Department of Economic and Social AffairsUnited Nations, New York

Global population will continue to growGlobal population will continue to growTotal population size, 1950-2050 Total population size, 1950-2050 (billions)(billions)
8.3
10.9

Fertility moving towards replacementFertility moving towards replacementTotal fertility, 1970 – 2014 (Total fertility, 1970 – 2014 (births per womanbirths per woman))

Life expectancy continues to riseLife expectancy continues to riseLife expectancy at birth,1950-2014 (Life expectancy at birth,1950-2014 (in yearsin years))

Role of migration as a Role of migration as a driver of population driver of population change increaseschange increases
-30
-20
-10
0
10
20
30
40
50
60
70
1950-1960
1960-1970
1970-1980
1980-1990
1990-2000
2000-2010
2010-2020
2020-2030
2030-2040
2040-2050
mil
lio
ns
-10
40
90
140
190
240
290
340
390
1950-1960
1960-1970
1970-1980
1980-1990
1990-2000
2000-2010
2010-2020
2020-2030
2030-2040
2040-2050
mil
lio
ns
Net population change
Immigration minus emigration
Births minus deaths
EuropeSlowing population
decline
AfricaReducing
population growth (but little impact)
5
10
15
20
25
30
35
1950-1960
1960-1970
1970-1980
1980-1990
1990-2000
2000-2010
2010-2020
2020-2030
2030-2040
2040-2050
United StatesContributing to
population growth

Planning for a smaller labour force Planning for a smaller labour force in more developed regionsin more developed regionsProjected population aged 20-64 (medium variant)Projected population aged 20-64 (medium variant)
77 millionWithout migration
With migration
Million

Planning for an ageing populationPlanning for an ageing populationPopulation aged 60 and over (Population aged 60 and over (percentagespercentages))

Young people constitute a major Young people constitute a major proportion of those migratingproportion of those migrating
0
1
2
3
4
5
6
7
0 5 10 15 20 25 30 35 40 45 50 55 60 65 70 75 80 85
Per
cen
tag
e
Age
Distribution of migrant inflows by age to selected countries in Europe, 2008 - 2009
Source: International migration flows to and from selected countries: The 2010 Revision
United Nations, Population Division/DESA

Planning for change in working age population Planning for change in working age population Change in working age (15-59) and youth (15-29), 2015 – 2050 (%)Change in working age (15-59) and youth (15-29), 2015 – 2050 (%)

1990 2000 2010 2013
Planning for more international migrants International migrant stock (millions)
2050
United Nations, Population Division/DESA

Numbers of international migrants by origin and destination, 1990-2013
United Nations, Population Division/DESA

Most international migrants reside Most international migrants reside within their region of birth (2013)within their region of birth (2013)
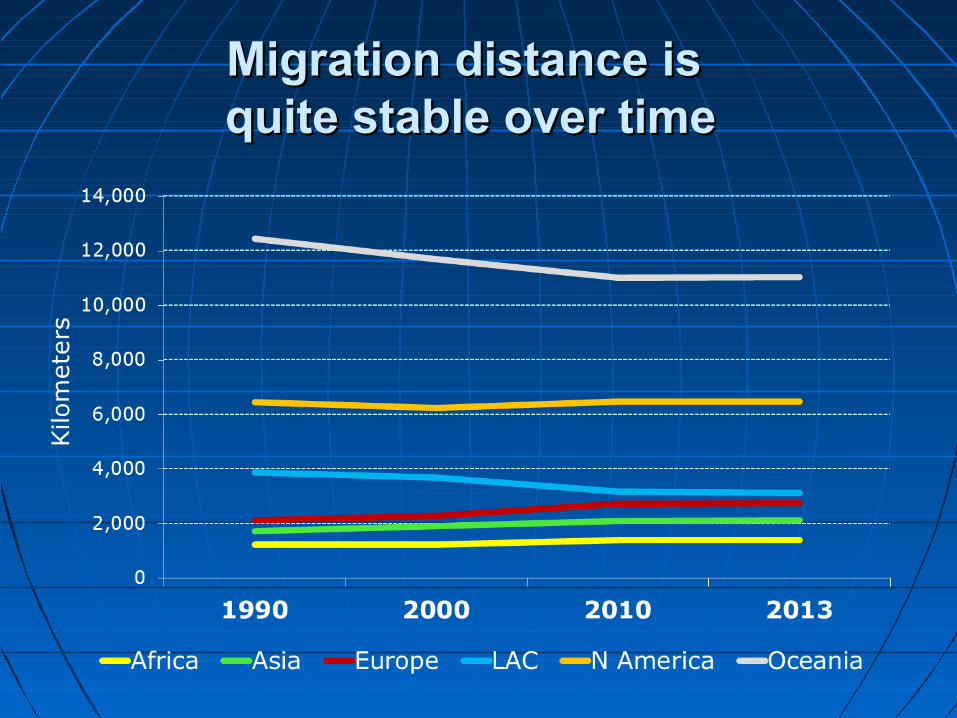
Migration distance is Migration distance is quite stable over timequite stable over time

Proportion of refugees in total migrant stock is Proportion of refugees in total migrant stock is much higher in the South than in the Northmuch higher in the South than in the North
2.4 3.11.9
22.5
16.8 16.2
1990 2000 2010Developed regionsDeveloping regionsUnited Nations, Population Division/DESA
Refugees in total migrant stock by development group, 1990-2010 (percentage)

The international migrant stock: The international migrant stock: Components of changeComponents of change
Estimated inflow of international migrants by source Estimated inflow of international migrants by source from 2005 to 2010 (mln.)from 2005 to 2010 (mln.)

More people will live in citiesMore people will live in citiesUrban and rural population size, 1950 – 2050 (Urban and rural population size, 1950 – 2050 (billionsbillions))

““Shifting demographics”Shifting demographics”
Europe: Ageing, demand for labour migrantsEurope: Ageing, demand for labour migrants
Africa: Youth bulge - demographic dividend, Africa: Youth bulge - demographic dividend, emigration or bothemigration or both
Asia and Latin Am: smaller (increases in) Asia and Latin Am: smaller (increases in) working age population (lower emigration?)working age population (lower emigration?)
North America and Australia/NZ: immigration North America and Australia/NZ: immigration (from where?) and natural increase(from where?) and natural increase

Migration and global development: Migration and global development: policy prioritiespolicy priorities
1.1. Facilitate orderly, regular and safe migrationFacilitate orderly, regular and safe migration2.2. Assess labour market needsAssess labour market needs3.3. Share responsibilities for humanitarian migrationShare responsibilities for humanitarian migration4.4. Leverage opportunities at origin and destination Leverage opportunities at origin and destination
(remittances, diaspora, entrepreneurship, etc.)(remittances, diaspora, entrepreneurship, etc.)5.5. Strengthen integration (non-discrimination) Strengthen integration (non-discrimination) 6.6. Reduce costs (economic, social, human)Reduce costs (economic, social, human)7.7. Enhance cooperation and coherenceEnhance cooperation and coherence
Top Related