


Languages
Pages
Legal


BEFORE THE HEARINGS PANEL FOR THE PROPOSED QUEENSTOWN LAKES DISTRICT PLAN
IN THE MATTER of the Resource
Management Act 1991 AND IN THE MATTER of Hearing Stream 13 –
Queenstown Mapping Annotations and Rezoning Requests
STATEMENT OF EVIDENCE OF TIMOTHY JAMES HEATH
ON BEHALF OF QUEENSTOWN LAKES DISTRICT COUNCIL
COMMERCIAL LAND REQUIREMENTS
24 May 2017
Barristers & Solicitors
S J Scott / H L Baillie Telephone: +64-3-968 4018 Facsimile: +64-3-379 5023 Email: [email protected] PO Box 874 SOLICITORS CHRISTCHURCH 8140

TABLE OF CONTENTS 1. INTRODUCTION ........................................................................................................ 1
2. SCOPE ....................................................................................................................... 3
3. EXECUTIVE SUMMARY ........................................................................................... 3
4. QUEENSTOWN LAKES DISTRICT POPULATION AND OCCUPIED DWELLING GROWTH ................................................................................................................... 4
5. QUEENSTOWN LAKES DISTRICT RETAIL MARKET ........................................... 6
6. QUEENSTOWN LAKES DISTRICT RETAIL AND COMMERCIAL LAND SUPPLY ……………………………………………………………………………………………..12
7. QUEENSTOWN LAKES DISTRICT RETAIL AND COMMERCIAL LAND DEMAND VS SUPPLY ............................................................................................ 14
Appendix 1 - Property Economics Retail Expenditure Model (Rem)
29304044_1.docx 1
1. INTRODUCTION
1.1 My full name is Timothy James Heath.
1.2 I am a Property Consultant, Retail Analyst and Urban
Demographer for Property Economics Limited, based in Auckland. I
hold two degrees from the University of Auckland:
(a) Bachelor of Arts 1991 (Geography); and
(b) Bachelor of Planning 1993.
1.3 I am the proprietor and founding director of Property Economics
Limited, a consultancy providing property research services to both
the private and public sectors throughout New Zealand. I have
undertaken such work for 20 years, with the last 15 years of these as
Managing Director of Property Economics Limited. I regularly appear
before Council, Environment Court and Board of Inquiry hearings on
retail economic and forward land use planning matters.
1.4 I advise district and regional councils throughout New Zealand in
relation to retail, industrial and business sector issues as well as
strategic land use planning. I also provide consultancy services to
a number of private sector clients in respect of a wide range of
property issues, including retail economic impact assessments,
commercial and industrial market assessments, and forecasting
market growth and land requirements across all property sectors.
1.5 I am familiar with the Queenstown, Frankton Flats and wider
Queenstown Lakes District (District) commercial environments
having undertaken detailed retail, commercial and industrial market
assessments across the District over the last 20 years. Much of this
work involved assessing commercial markets, distributional and
economic effects of new development, and longer term strategic
outlooks and implications for the purpose of forward land use
planning and policy development. More recently, I provided retail
economic evidence before the Environment Court in relation to the
Plan Change 19 hearings (relating to Frankton Flats) in Queenstown.
1.6 Further to this, I have recently assisted Christchurch City Council and
Hamilton City Council in the successful development of appropriate
29304044_1.docx 2
policy settings within the Business Chapters of their second
Generation District Plans through independent hearing and
Environment Court processes.
1.7 I have appeared before this Hearing Panel (Panel) four times before
as part of this Proposed District Plan (PDP) process, three times for
Queenstown Lakes District Council (QLDC), specifically Hearing
Stream 8 relating to the extent of retail and commercial office activity
within the Local Shopping Centre Zone and Wanaka Airport, Hearing
Stream 9 relating to Resort Zones (specifically Jacks Point Village),
and Hearing Stream 12 relating to retail and economic matters in the
Cardrona Valley Road Local Shopping Centre Zone. I have also
appeared once for Bunnings Limited in relation to Chapter 2
(Definitions).
1.8 Although this is a Council hearing, I confirm that I have read the Code
of Conduct for Expert Witnesses contained in Environment Court
Practice Note 2014 and that I agree to comply with it. I confirm that I
have considered all the material facts that I am aware of that might
alter or detract from the opinions that I express, and that this
evidence is within my area of expertise, except where I state that I am
relying on the evidence of another person.
1.9 I have now been engaged by QLDC to provide evidence on retail
economic and commercial activities (being professional services and
offices), specifically in relation to future long term (30 year or 2048)
land requirements factoring in National Policy Statement on Urban
Development Capacity (NPS UDC) long term buffer directive of 15%.
1.10 All references to PDP provision numbers, are to the Council's Reply
version of those provisions (unless otherwise stated).
29304044_1.docx 3
2. SCOPE
2.1 In this evidence I set out the key findings from my analysis on
commercial land (retail, service and office activities) needs of
Queenstown, the Wakatipu Basin, and Wanaka (together, the
District), that are relevant to Queenstown.
2.2 This process involved:
(a) reviewing the existing business / commercial zones and the
current supply of business zoned land (in the PDP where
notified in Stage 1, and otherwise under the Operative
District Plan) in the Queenstown, Wakatipu, and Wanaka
areas of the District (i.e. land where retail, service and office
activities are permitted to be established);
(b) estimating vacant commercially zoned land 'available' to
meet future demand (including enabled capacity under the
PDP including the land supplied at Frankton Flats);
(c) comparing projected demand for commercially zoned land
over the 2017-2048 period, using population / household,
business and tourism spending, and adopting the office land
requirements determined by Mr Osborne to determine a total
land requirement for commercial activities in the District; and
(d) interpreting the results of this analysis.
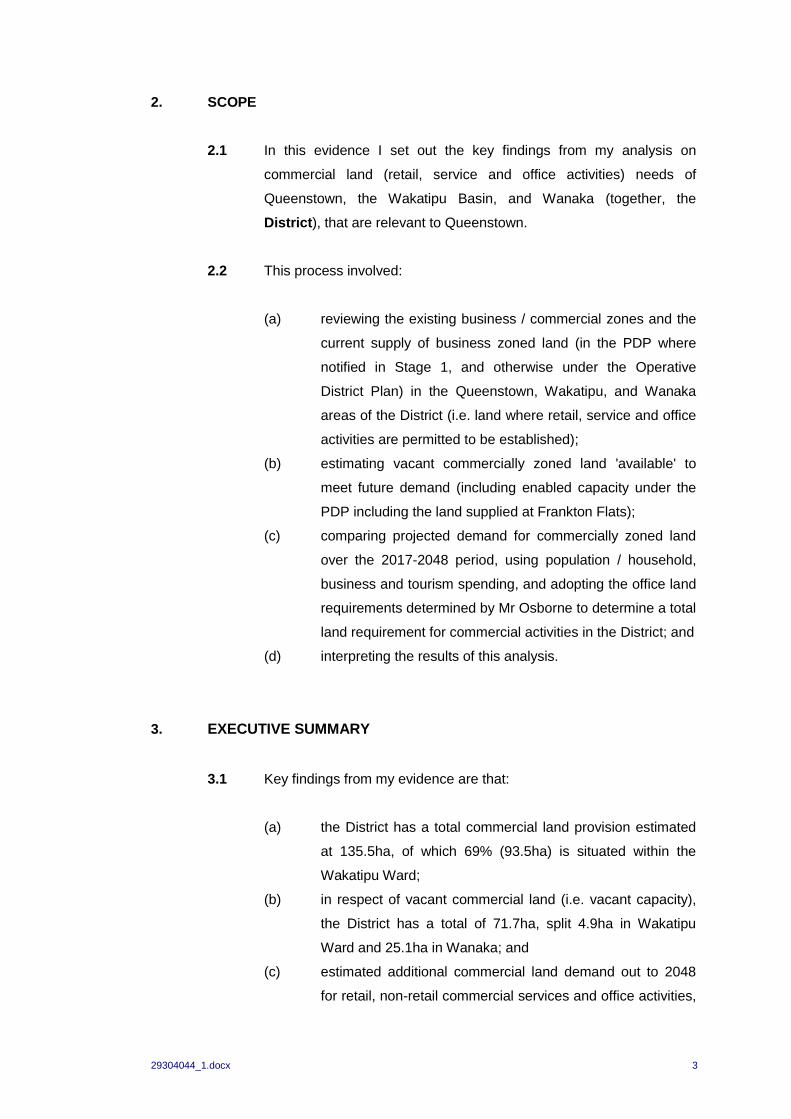
3. EXECUTIVE SUMMARY
3.1 Key findings from my evidence are that:
(a) the District has a total commercial land provision estimated
at 135.5ha, of which 69% (93.5ha) is situated within the
Wakatipu Ward;
(b) in respect of vacant commercial land (i.e. vacant capacity),
the District has a total of 71.7ha, split 4.9ha in Wakatipu
Ward and 25.1ha in Wanaka; and
(c) estimated additional commercial land demand out to 2048
for retail, non-retail commercial services and office activities,

29304044_1.docx 4
is estimated at 89ha, with 63ha in Wakatipu Ward and 26ha
in Wanaka; and
(d) the District commercial land demand / supply differential
indicates no additional commercial land is required to be
zoned in Wanaka to meet commercial growth requirements
to 2048, while the Wakatipu Ward has an estimated
commercial land shortfall of 16.1ha by 2048. However, the
analysis indicates there is sufficient commercial land
provision in the Wakatipu Ward to meet projected
commercial land demand requirements over the next 20
years, and it is not until the longer term 20-30 year
timeframe before additional commercial land might be
required in this ward.
4. QUEENSTOWN LAKES DISTRICT POPULATION AND OCCUPIED
DWELLING GROWTH
4.1 The population and occupied dwelling projections utilised for the retail
and commercial growth modelling in this analysis are the growth
projections completed by Rationale for the QLDC, February 2017
updated version. These projection series have been relied upon by
Council and their experts in other chapters of the PDP as they
represent growth projections specific to the District factoring in the
unique growth drivers of the district.
4.2 The economic catchment utilised for analysis is the Queenstown
Lakes District territorial authority area. This is the area which the
PDP and QLDC has jurisdiction over, and which the PDP policy
framework relates to.
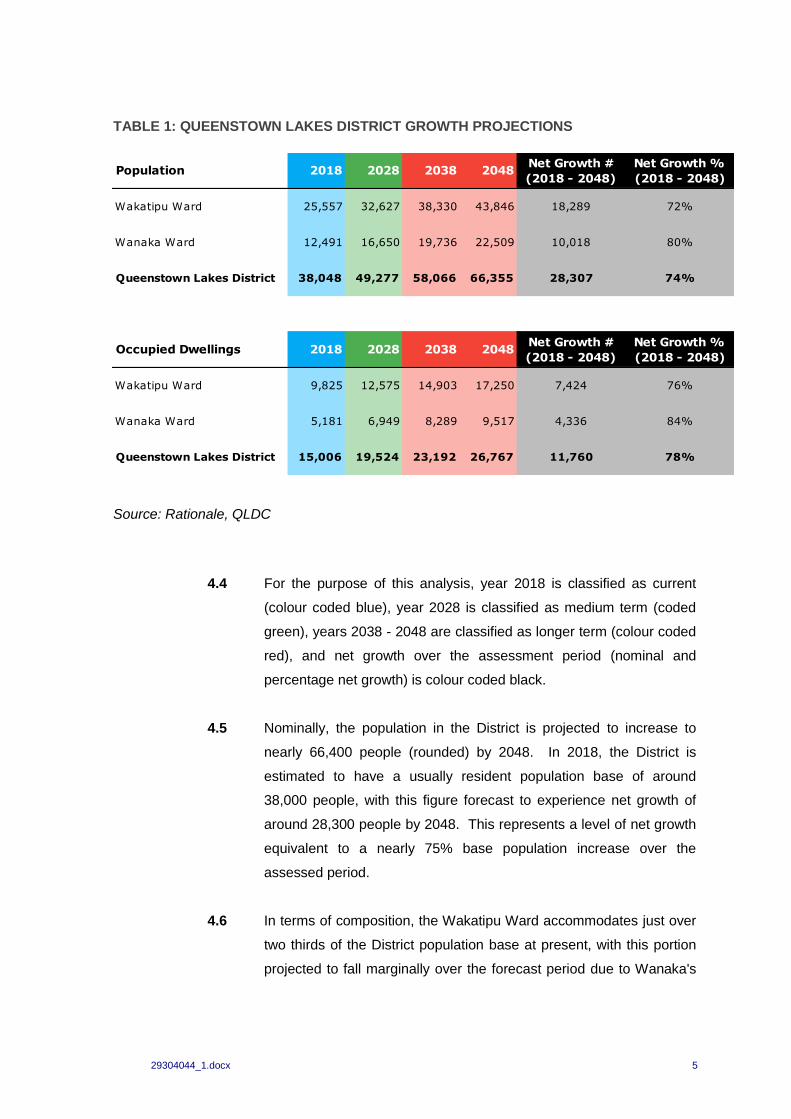
4.3 Table 1 provides a consolidated snapshot of the District population
and occupied dwelling growth projections as determined by Rationale
covering the period 2018-2048.
29304044_1.docx 5
Population 2018 2028 2038 2048Net Growth #
(2018 - 2048)
Net Growth %
(2018 - 2048)
Wakatipu Ward 25,557 32,627 38,330 43,846 18,289 72%
Wanaka Ward 12,491 16,650 19,736 22,509 10,018 80%
Queenstown Lakes District 38,048 49,277 58,066 66,355 28,307 74%
Occupied Dwellings 2018 2028 2038 2048Net Growth #
(2018 - 2048)
Net Growth %
(2018 - 2048)
Wakatipu Ward 9,825 12,575 14,903 17,250 7,424 76%
Wanaka Ward 5,181 6,949 8,289 9,517 4,336 84%
Queenstown Lakes District 15,006 19,524 23,192 26,767 11,760 78%
TABLE 1: QUEENSTOWN LAKES DISTRICT GROWTH PROJECTIONS
Source: Rationale, QLDC
4.4 For the purpose of this analysis, year 2018 is classified as current
(colour coded blue), year 2028 is classified as medium term (coded
green), years 2038 - 2048 are classified as longer term (colour coded
red), and net growth over the assessment period (nominal and
percentage net growth) is colour coded black.
4.5 Nominally, the population in the District is projected to increase to
nearly 66,400 people (rounded) by 2048. In 2018, the District is
estimated to have a usually resident population base of around
38,000 people, with this figure forecast to experience net growth of
around 28,300 people by 2048. This represents a level of net growth
equivalent to a nearly 75% base population increase over the
assessed period.
4.6 In terms of composition, the Wakatipu Ward accommodates just over
two thirds of the District population base at present, with this portion
projected to fall marginally over the forecast period due to Wanaka's

29304044_1.docx 6
population base projected to grow at a slightly faster proportional rate
(albeit from a lower base).
4.7 By 2048, over three in every five people residing in the District will be
based in the Wakatipu Ward (approximately double Wanaka Ward's
2048 population base). This indicates the Wakatipu Ward will remain
the largest and most dominant commercial market within the District
for at least the first half of this century, and is likely to remain the focal
point of the District's commercial offering and land provision.
4.8 Occupied dwellings within the District are projected to experience an
increase of around 11,800 over the forecast period to around 26,800
by 2048. This is equivalent to growth in the District occupied dwelling
base over the period of around 78% net, and equates to an average
rate of growth of 390 occupied dwellings per year over the assessed
period (split 250 per annum in Wakatipu Ward and 140 per annum in
Wanaka Ward rounded).
4.9 The phenomenon of the number of occupied dwellings is increasing
at a faster rate than the population due to a projected fall in the
person per dwelling ratio over the forecast period. This is not isolated
to the study area, but a trend projected to occur across the whole
country due to an aging population, smaller families and a higher
proportion of 'split' or single parent households.
5. QUEENSTOWN LAKES DISTRICT RETAIL MARKET
Retail Expenditure
5.1 This section assesses the current and future retail market within the
District. Annualised retail expenditure forecasts have been based on
the population and occupied dwellings growth projections outlined
above in Table 1 and are in 2018 New Zealand dollars. These retail
expenditure forecasts have been prepared using the Property
Economics Retail Expenditure Model. A more detailed description of
the model methodology and its inputs can be seen in Appendix 1.
29304044_1.docx 7
Total Retail Spending
Household Spending
Business Spending
Physical Retail Stores
Internet Spending
Visitor Spending
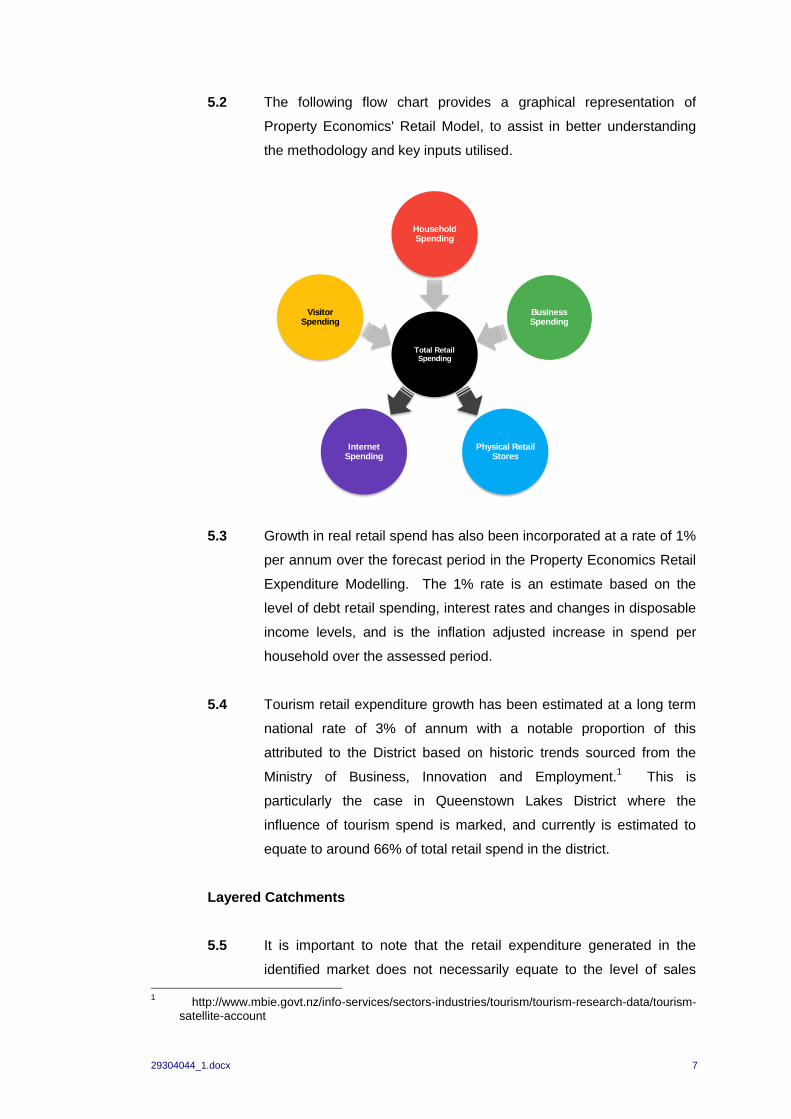
5.2 The following flow chart provides a graphical representation of
Property Economics' Retail Model, to assist in better understanding
the methodology and key inputs utilised.
5.3 Growth in real retail spend has also been incorporated at a rate of 1%
per annum over the forecast period in the Property Economics Retail
Expenditure Modelling. The 1% rate is an estimate based on the
level of debt retail spending, interest rates and changes in disposable
income levels, and is the inflation adjusted increase in spend per
household over the assessed period.
5.4 Tourism retail expenditure growth has been estimated at a long term
national rate of 3% of annum with a notable proportion of this
attributed to the District based on historic trends sourced from the
Ministry of Business, Innovation and Employment.1 This is
particularly the case in Queenstown Lakes District where the
influence of tourism spend is marked, and currently is estimated to
equate to around 66% of total retail spend in the district.
Layered Catchments
5.5 It is important to note that the retail expenditure generated in the
identified market does not necessarily equate to the level of sales
1 http://www.mbie.govt.nz/info-services/sectors-industries/tourism/tourism-research-data/tourism-
satellite-account

29304044_1.docx 8
within the market. Residents can freely travel in and out of their local
area, and they will typically choose the centres with their preferred
range of stores, products, brands, proximity, accessibility and price
points. Accordingly, a good quality centre will attract customers from
beyond its core market, whereas a low quality centre will experience
retail expenditure leakage out of its core market.
5.6 For that reason, it is appropriate for modern retail markets to be
assessed on the basis of 'layered catchments'. This is where
consumers spread their retail spending across a wider spectrum of
centres, with the majority of their 'higher order' spend going to 'higher
order' centres (predominantly large scale regional or main
metropolitan shopping centres). Meanwhile, convenience spend
remains more localised, triggering a layering of centre catchments
across the district. In other words, a consumer could be in the
primary catchment of numerous centres, not just one.
5.7 Therefore, the retail expenditure generated in the Queenstown Lakes
District represents the sales that centres or retail stores within the
District could potentially achieve and the key influence on what the
market can potentially sustain. This should not be interpreted as a
negative for Queenstown, it simply represents normal commercial
market mechanisms, and is a consideration that needs to be
appropriately accounted for in any retail analysis regarding the
District's future, given the existing planning and commercial
framework. It should be noted that given the District’s tourism focus it
has a high degree of retail inflow from both international and domestic
visitors outside of the District, which has been accounted for within
the forecasts.
Excluded Activities
5.8 The retail expenditure figures in Table 2 are in 2018 New Zealand
dollars and exclude the following retail activities, as categorised under
the Australia New Zealand Standard Industrial Classification
(ANZSIC) categorisation system:
(a) accommodation (e.g. hotels, motels, backpackers);
29304044_1.docx 9
(b) vehicle and marine sales and services (e.g. petrol stations,
car yards, boat shops, caravan sales, and stores such as
Repco, Super Cheap Auto, tyre stores, panel beating, auto
electrical and mechanical repairs); and
(c) hardware, home improvement, building and garden supplies
trade suppliers (e.g. Mitre 10, Hammer Hardware, Bunnings,
PlaceMakers, ITM, Kings Plant Barn, Palmers Garden
Centres).
5.9 The above retail sectors have been excluded because they are not
generally considered to be core retail centre expenditure, nor
fundamental retail centre activities in terms of visibility, location,
viability or functionality. Modern retail centres do not rely on these
types of stores to be viable or retain their role and function in the
market as such stores have the potential to generate only non-
consequential trade competition effects rather than flow-on retail
distribution effects. Therefore, the retail centre network's economic
wellbeing and social amenity cannot be unduly compromised.
5.10 Trade oriented activities such as kitchen showrooms, plumbing
stores, electrical stores and paint stores are also excluded from the
model for similar reasons. This is not to imply that these activity
types are not situated in centres, as in many instances some of these
store types remain operating in centres as an historical overhang.
5.11 However, in future, it is increasingly difficult from a retail economic
perspective to see these store types establishing in centres (new or
redeveloped), albeit they likely have equal planning opportunity to do
so. Some of these trade stores may also contain a subservient
proportion of retail sales to the general public. This is considered
unlikely to change in the foreseeable future and therefore they remain
trade stores rather than classified as a retail store. As such demand
for these store types is additional to the retail demand assessed in
this analysis.
29304044_1.docx 10
Sustainable Retail Floorspace within the District
5.12 Finally, it is necessary to separate the Gross Floor Area (GFA) into:
(a) net retail floorspace (Sustainable Floorspace); and
(b) back office floorspace that does not generate any retail
spend (Back Office Floorspace).
5.13 This analysis uses a sustainable footprint approach to assess retail
demand. Sustainable Floorspace in this context refers to the level of
floor space proportionate to an area's retainable retail expenditure
that is likely to result in an appropriate quality and offer in the retail
environment. This does not necessarily represent the 'break even'
point, but a level of sales productivity ($/sqm) that allows retail stores
to trade profitably and provide a good quality retail environment, and
thus economic wellbeing and social amenity.
5.14 The net retail floor area of a store only includes the area that displays
the goods and services sold, and represents the area to which the
general public has access. By contrast, the Gross Floor Area
typically represents the total area leased by the retailer.
5.15 Back Office Floorspace in a retail store is the area used for storage,
warehousing, staff room, office, toilets and other 'back office' uses.
These activities, on average, occupy around 25-30% of a retail store's
Gross Floor Area. It is important to separate out such back office
floorspace from Sustainable Floorspace because Back Office
Floorspace does not generate any retail spend.
5.16 Table 2 below sets out the District’s (and Ward’s) annualised retail
expenditure and sustainable retail floorspace for the assessed period
to 2048 at 10-yearly intervals.
29304044_1.docx 11
Retail Expenditure 2018 2028 2038 2048Net Growth #
(2018 - 2048)
Net Growth %
(2018 - 2048)
Wakatipu Ward $765 $1,009 $1,295 $1,495 $730 95%
Wanaka Ward $303 $403 $516 $594 $291 96%
Queenstown Lakes District $1,069 $1,412 $1,811 $2,089 $1,021 96%
Sustaianable GFA (sqm) 2018 2028 2038 2048Net Growth #
(2018 - 2048)
Net Growth %
(2018 - 2048)
Wakatipu Ward 134,547 177,363 227,497 262,826 128,280 95%
Wanaka Ward 53,377 71,047 90,728 104,572 51,195 96%
Queenstown Lakes District 187,924 248,409 318,225 367,399 179,475 96%
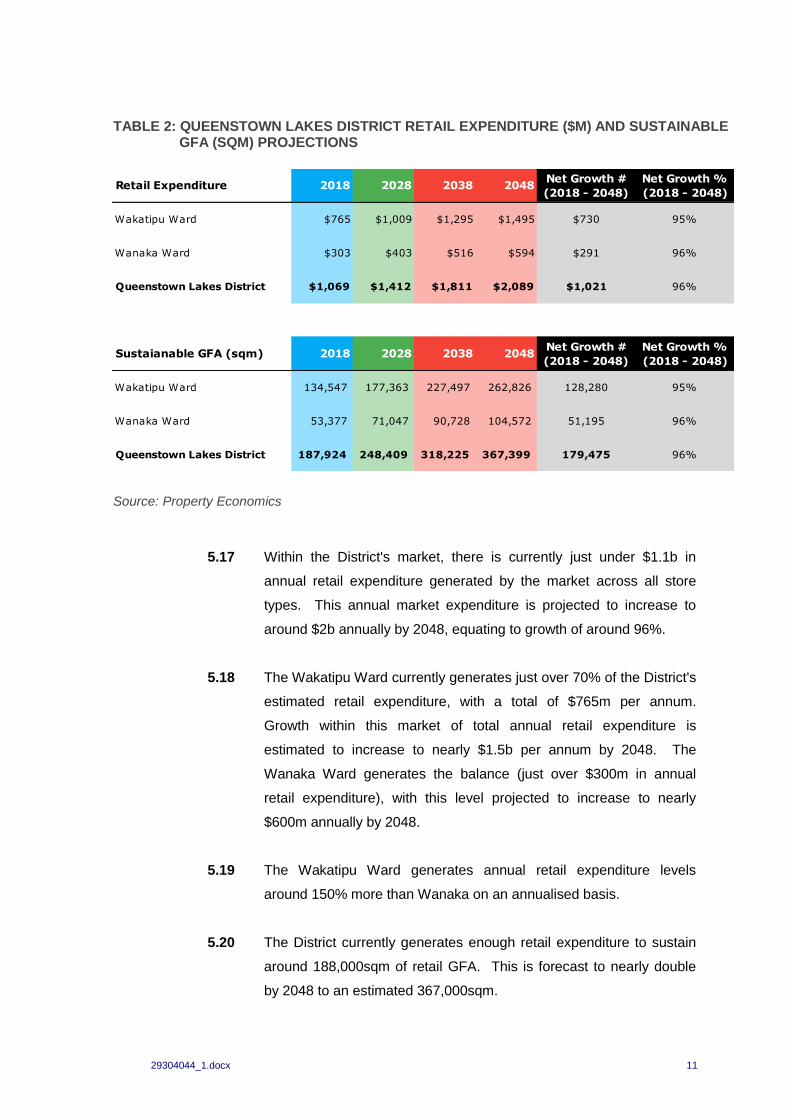
TABLE 2: QUEENSTOWN LAKES DISTRICT RETAIL EXPENDITURE ($M) AND SUSTAINABLE GFA (SQM) PROJECTIONS
Source: Property Economics
5.17 Within the District's market, there is currently just under $1.1b in
annual retail expenditure generated by the market across all store
types. This annual market expenditure is projected to increase to
around $2b annually by 2048, equating to growth of around 96%.
5.18 The Wakatipu Ward currently generates just over 70% of the District's
estimated retail expenditure, with a total of $765m per annum.
Growth within this market of total annual retail expenditure is
estimated to increase to nearly $1.5b per annum by 2048. The
Wanaka Ward generates the balance (just over $300m in annual
retail expenditure), with this level projected to increase to nearly
$600m annually by 2048.
5.19 The Wakatipu Ward generates annual retail expenditure levels
around 150% more than Wanaka on an annualised basis.
5.20 The District currently generates enough retail expenditure to sustain
around 188,000sqm of retail GFA. This is forecast to nearly double
by 2048 to an estimated 367,000sqm.
29304044_1.docx 12
5.21 As identified above, the Wakatipu Ward generates significantly more
retail expenditure (demand) on an annualised basis than the Wanaka
Ward, and as a result can sustain a higher level of retail GFA. The
Wakatipu's retail market currently generates enough retail
expenditure to sustain just under 135,000 sqm, with this forecast to
nearly double over the next three decades to just under 263,000 sqm
by 2048. The Wakatipu Ward is clearly the dominant commercial
destination within the District and for efficiency reasons should have a
commercial land provision commensurate with this demand.
5.22 The Wanaka Ward currently generates enough retail expenditure to
sustain around 53,000 sqm of retail GFA, this is also forecast to
increase to almost 105,000 sqm by 2048.
6. QUEENSTOWN LAKES DISTRICT RETAIL AND COMMERCIAL LAND
SUPPLY
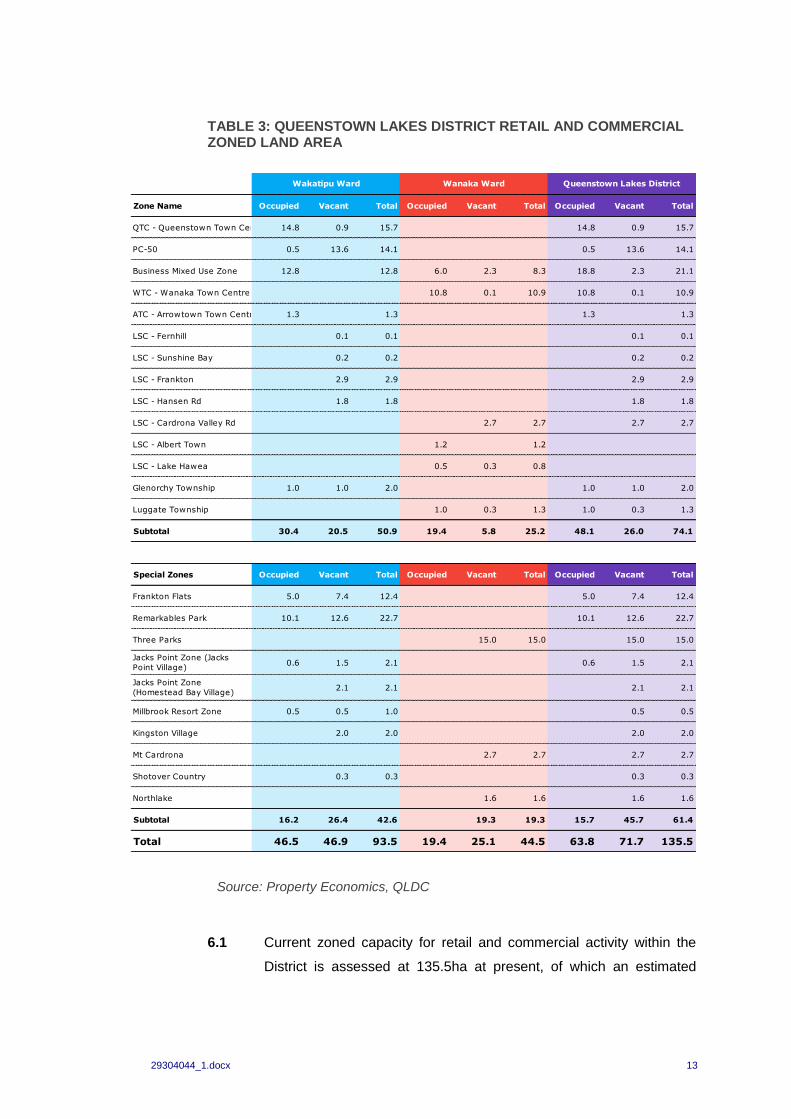
6.1 Table 3 provides a breakdown of the current District commercial land
provision by zone as provided by QLDC. These are based on the
zoned land areas (in the PDP where notified in Stage 1, and
otherwise under the Operative District Plan), ratings database (for
determining vacancy levels) and known development pipelines for
finer grain Special Zone areas where not all of the 'Special Zone' land
area will be utilised for retail and commercial activities.
6.2 Table 3 splits the current commercial land provision within the District
by Ward and zone, and the level of occupied, vacant and total land
provision within each zone. This builds a detailed picture of the
supply of commercial land geospatially to better match current supply
with future commercial land demand requirements as projected.
29304044_1.docx 13
Zone Name Occupied Vacant Total Occupied Vacant Total Occupied Vacant Total
QTC - Queenstown Town Centre 14.8 0.9 15.7 0.0 0.0 0.0 14.8 0.9 15.7
PC-50 0.5 13.6 14.1 0.0 0.5 13.6 14.1
Business Mixed Use Zone 12.8 0.0 12.8 6.0 2.3 8.3 18.8 2.3 21.1
WTC - Wanaka Town Centre 0.0 0.0 0.0 10.8 0.1 10.9 10.8 0.1 10.9
ATC - Arrowtown Town Centre 1.3 0.0 1.3 0.0 0.0 0.0 1.3 0.0 1.3
LSC - Fernhill 0.1 0.1 0.0 0.0 0.1 0.1
LSC - Sunshine Bay 0.2 0.2 0.0 0.0 0.2 0.2
LSC - Frankton 2.9 2.9 0.0 0.0 2.9 2.9
LSC - Hansen Rd 1.8 1.8 0.0 0.0 1.8 1.8
LSC - Cardrona Valley Rd 2.7 2.7 2.7 2.7
LSC - Albert Town 0.0 1.2 1.2 0.0
LSC - Lake Hawea 0.0 0.5 0.3 0.8 0.0
Glenorchy Township 1.0 1.0 2.0 0.0 1.0 1.0 2.0
Luggate Township 0.0 1.0 0.3 1.3 1.0 0.3 1.3
Subtotal 30.4 20.5 50.9 19.4 5.8 25.2 48.1 26.0 74.1
Special Zones Occupied Vacant Total Occupied Vacant Total Occupied Vacant Total
Frankton Flats 5.0 7.4 12.4 0.0 0.0 0.0 5.0 7.4 12.4
Remarkables Park 10.1 12.6 22.7 0.0 0.0 0.0 10.1 12.6 22.7
Three Parks 0.0 0.0 0.0 0.0 15.0 15.0 0.0 15.0 15.0
Jacks Point Zone (Jacks
Point Village)0.6 1.5 2.1 0.0 0.6 1.5 2.1
Jacks Point Zone
(Homestead Bay Village)2.1 2.1 0.0 0.0 2.1 2.1
Millbrook Resort Zone 0.5 0.5 1.0 0.0 0.5 0.5
Kingston Village 2.0 2.0 0.0 2.0 2.0
Mt Cardrona 0.0 2.7 2.7 0.0 2.7 2.7
Shotover Country 0.3 0.3 0.0 0.0 0.3 0.3
Northlake 0.0 1.6 1.6 0.0 1.6 1.6
Subtotal 16.2 26.4 42.6 0.0 19.3 19.3 15.7 45.7 61.4
Total 46.5 46.9 93.5 19.4 25.1 44.5 63.8 71.7 135.5
Queenstown Lakes DistrictWakatipu Ward Wanaka Ward
TABLE 3: QUEENSTOWN LAKES DISTRICT RETAIL AND COMMERCIAL ZONED LAND AREA
Source: Property Economics, QLDC
6.1 Current zoned capacity for retail and commercial activity within the
District is assessed at 135.5ha at present, of which an estimated

29304044_1.docx 14
71.7ha (53%) is vacant or remains available to be utilised for
commercial activities.
6.2 The Wakatipu Ward comprises 93.5ha of commercial land (69%) of
the District total, of which an estimated 46.9ha (50%) is either vacant
or remains to be utilised for commercial activities at present. Large
contributors to vacant supply of commercial land in Wakatipu include
Remarkables Park (estimated 12.6ha vacant) and the PC50 portion of
the Queenstown Town Centre (estimated 13.6ha vacant / available
for commercial use).
6.3 The Wanaka Ward comprises 44.5ha of commercial land with an
estimated 25.1ha (56%) vacant. The largest contributor is Three
Parks with an estimated 15ha vacant for commercial activities.
7. QUEENSTOWN LAKES DISTRICT RETAIL AND COMMERCIAL LAND
DEMAND VS SUPPLY
7.1 Table 4 shows the estimated commercial land requirements for the
District by ward, for the forecast period 2048. The land requirements
determined in this section includes areas such as car parks, outdoor
amenities, landscaping, and walkways, and therefore is a gross land
requirement. An average 45% GFA to land ratio has been assumed
for this estimation.
7.2 Based on experience of auditing hundreds of retail centres and
markets across the country over the last 20 years, it is considered
appropriate to assume that non-retail commercial services (such as
hairdressers, drycleaners, therapists, medical practitioners, banks,
estate agencies, tourism activities, etc.) comprise around half of a
retail centres total floorspace, and only around half of these activities
are estimated to operate 'at grade' / ground level. The other half of
this floorspace is typically accommodated above the ground floor in
multi-level buildings, likely with retail at grade. This in effect halves
the at grade land requirement for these activities.
7.3 Projected demand for commercial office activity is additional to retail
and non-retail commercial service demand and has been derived
29304044_1.docx 15
Additional Land
Requirements (ha)Wakatipu Ward Wanaka Ward
Queenstown
Lakes District
Retail 28.5 11.4 39.9
Non-Retail Commercial
Activities14.3 5.7 20.0
Office Activity 12 5.5 17.5
Subtotal 54.8 22.6 77.4
NPS (15%) 8.2 3.4 11.6
Total Commercial Demand 63.0 26.0 89.0
Vacant Land Supply 46.9 25.1 71.7
Differential -16.1 -0.9 -17.3
from the analysis of Mr Osborne.2 Like non-retail commercial service
activity, the projected commercial office demand has also been
assumed to be accommodated by both at-grade and multi-storey
premises at a 1:1 ratio, i.e. for every 100sqm of commercial office
activity located at-grade, 100sqm is assumed will be accommodated
above the ground floor. This equates to a two storey commercial
office average across the District.3
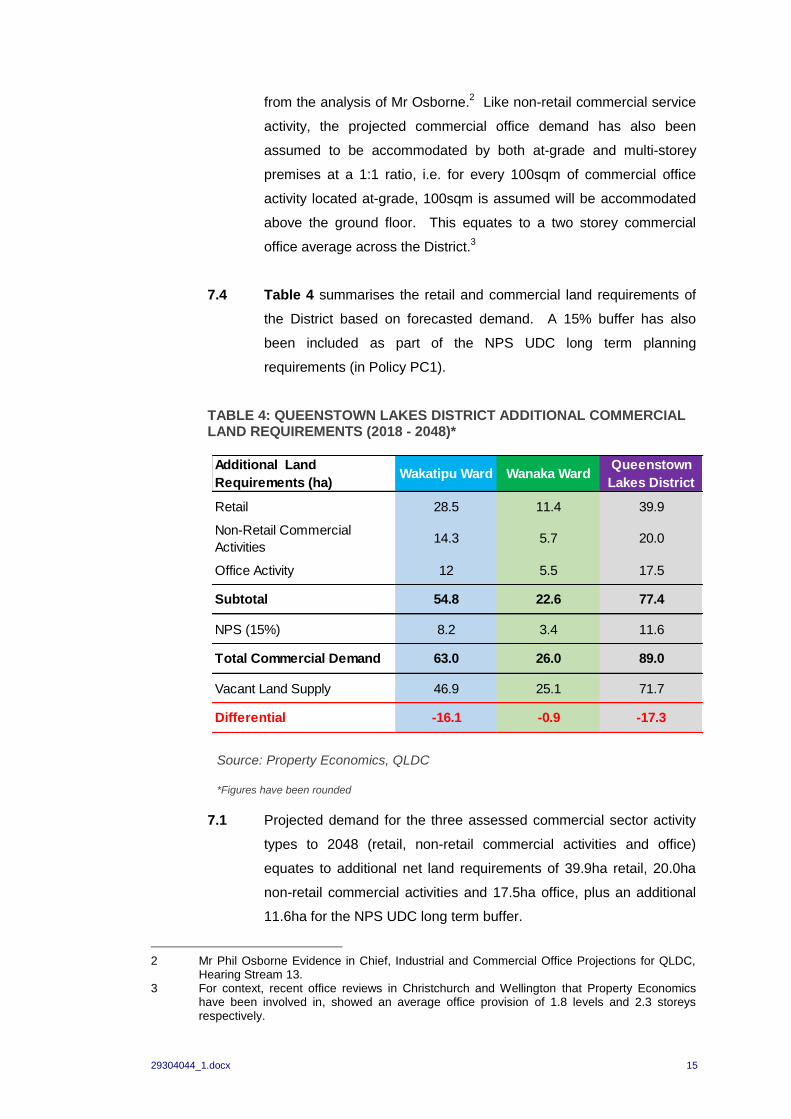
7.4 Table 4 summarises the retail and commercial land requirements of
the District based on forecasted demand. A 15% buffer has also
been included as part of the NPS UDC long term planning
requirements (in Policy PC1).
TABLE 4: QUEENSTOWN LAKES DISTRICT ADDITIONAL COMMERCIAL LAND REQUIREMENTS (2018 - 2048)*
Source: Property Economics, QLDC
*Figures have been rounded
7.1 Projected demand for the three assessed commercial sector activity
types to 2048 (retail, non-retail commercial activities and office)
equates to additional net land requirements of 39.9ha retail, 20.0ha
non-retail commercial activities and 17.5ha office, plus an additional
11.6ha for the NPS UDC long term buffer.
2 Mr Phil Osborne Evidence in Chief, Industrial and Commercial Office Projections for QLDC,
Hearing Stream 13. 3 For context, recent office reviews in Christchurch and Wellington that Property Economics
have been involved in, showed an average office provision of 1.8 levels and 2.3 storeys respectively.

29304044_1.docx 16
7.2 Cumulatively, this equates to an estimated total forecast net
commercial land requirement for the District of 89.0ha. This is split
63.0ha in the Wakatipu Ward and 26.0ha in the Wanaka Ward.
7.3 The Wanaka Ward has an estimated 25.1ha of vacant / available to
be utilised commercial land provision, which when assessed against
the Ward's commercial land demand profile of 26.0ha, indicates a
negligible 0.9ha residual land shortfall. Such a small differential
would not be realised until the end of the 30 year assessment period,
and in practise represents a broad state of equilibrium with
commercial land supply meeting projected commercial land demand
(including the NPS UDC buffer).
7.4 A slightly different situation presents itself in the Wakatipu Ward with
vacant commercial supply (46.9ha) not sufficient to accommodate
estimated commercial land demand by 2048 (63.0ha), resulting in an
estimated shortfall of 16.1ha. This represents 93% of the District's
estimated commercial land shortfall and highlights (geospatially) that
additional commercial land supply is likely to be required by 2048.
This 16.1ha shortfall equates to 17% of current commercial land
supply in Wakatipu Ward.
7.5 This analysis shows the District has sufficient commercial land
capacity enabled within the PDP to meet estimated commercial land
demand over the next 20 years, while the Wanaka Ward supply is
sufficient for 30 years. It is only the Wakatipu Ward that is estimated
to require additional commercial land provision over the long term
(20-30 years' timeframe) including the NPS UDC buffer.
Timothy Heath
24 May 2017

29304044_1.docx 17
APPENDIX 1: PROPERTY ECONOMICS RETAIL EXPENDITURE MODEL (REM)
This overview outlines the methodology that has been used to estimate retail spend
generated at Census Area Unit (CAU) level for the identified catchment out to 2033.
CAU 2013 Boundaries
All analysis has been based on Census Area Unit 2013 boundaries, the most recent
available.
Permanent Private Households (PPH) 2013
These are the total Occupied Households as determined by the Census 2013. PPHs are
the primary basis of retail spend generation and account for approximately 71% of all
retail sales. PPHs have regard for (exclude) the proportion of dwellings that are vacant
at any one time in a locality, which can vary significantly, and in this respect account for
the movement of some domestic tourists.
Permanent Private Occupied Household Forecasts 2006-2048
These are based on Rationale Area Unit (CAU) Medium Series Population Growth
Projections, with this extrapolated to the year of concern.
International Tourist Spend
The total international tourism retail spend has been derived from the Ministry of
Economic Development Tourism Strategy Group (MEDTSG) estimates nationally. This
has been distributed regionally on a 'spend per employee' basis, using regional spend
estimates prepared by the MEDTSG. Domestic and business based tourism spend is
incorporated in the employee and PPH estimates. Employees are the preferred basis
for distributing regional spend geo-spatially as tourists tend to gravitate toward areas of
commercial activity, however they are very mobile.
Total Tourist Spend Forecast
Growth is conservatively forecast in the model at 3% per annum for assessed period.
2016-2048 PPH Average Household Retail Spend
This has been determined by analysing the national relationship between PPH average
household income (by income bracket) as determined by the 2013 Census, and the
average PPH expenditure of retail goods (by income bracket) as determined by the
Household Economic Survey (HES) prepared by Statistics NZ.

29304044_1.docx 18
While there are variables other than household income that will affect retail spending
levels, such as wealth, access to retail, population age, household types and cultural
preferences, the effects of these are not able to be assessed given data limitations, and
have been excluded from these estimates.
Real Retail Spend Growth (excl. trade based retailing)
Real retail spend growth has been factored in at 1% per annum. This accounts for the
increasing wealth of the population and the subsequent increase in retail spend. The
following explanation has been provided.
Retail Spend is an important factor in determining the level of retail activity and hence
the 'sustainable amount 'of retail floorspace for a given catchment. For the purposes of
this outline 'retail' is defined by the following categories:
Food Retailing
Footwear
Clothing and Softgoods
Furniture and Floor coverings
Appliance Retailing
Chemist
Department Stores
Recreational Goods
Cafes, Restaurants and Takeaways
Personal and Household Services
Other Stores.
These are the retail categories as currently defined by the ANZSIC codes (Australia
New Zealand Standard Industry Classification).
Assessing the level and growth of retail spend is fundamental in planning for retail
networking and land use within a regional network.
Internet Retail Spend Growth
Internet retailing within New Zealand has seen significant growth over the last few
decades. This growth has led to an increasing variety of business structures and
29304044_1.docx 19
retailing methods including; internet auctions, just-in-time retailing, online ordering,
virtual stores etc.
As some of internet spend is being made to on-the-ground stores, a proportion of
internet expenditure is being represented in the Statistics NZ Retail Trade Survey (RTS)
while a large majority remains unrecorded. At the same time this expenditure is being
recorded under the Household Economic Survey (HES) as a part of household retail
spending, making the two datasets incompatible. For this reason, Property Economics
has assumed a flat 5% adjustment percentage on HES retail expenditure, representing
internet retailing that was never recorded within the RTS.
Additionally, growth of internet retailing for virtual stores, auctions and overseas stores
is leading to a decrease in on-the-ground spend and floor space demand. In order to
account for this, a non-linear percentage decrease of 5% in 2016 growing to 15% by
2048 has been applied to retail expenditure encompassing all retail categories in our
retail model. These losses represent the retail diversion from on-the-ground stores to
internet based retailing that will no longer contribute to retail floor space demand.
Retail Spend Determinants
Retail Spend for a given area is determined by: the population, number of households,
size and composition of households, income levels, available retail offer and real retail
growth. Changes in any of these factors can have a significant impact on the available
amount of retail spend generated by the area. The coefficient that determines the level
of 'retail spend' that eventuates from these factors is the MPC (Marginal Propensity to
Consume). This is how much people will spend of their income on retail items. The MPC
is influenced by the amount of disposable and discretionary income people are able to
access.
Retail Spend Economic Variables
Income levels and household MPC are directly influenced by several macroeconomic
variables that will alter the amount of spend. Real retail growth does not rely on the
base determinants changing but a change in the financial and economic environment
under which these determinants operate. These variables include:
Interest Rates: Changing interest rates has a direct impact upon households'
discretionary income as a greater proportion of income is needed to finance debt
and typically lowers general domestic business activity. Higher interest rates
typically lower real retail growth.

29304044_1.docx 20
Government Policy (Spending): Both Monetary and Fiscal Policy play a part in
domestic retail spending. Fiscal policy, regarding government spending, has
played a big part recently with government policy being blamed for inflationary
spending. Higher government spending (targeting on consumer goods, direct and
indirectly) typically increases the amount of nominal retail spend. Much of this
spend does not, however, translate into floor space since it is inflationary and only
serves to drive up prices.
Wealth/Equity/Debt: This in the early-mid 2000s had a dramatic impact on the
level of retail spending nationally. The increase in property prices has increased
home owners' unrealised equity in their properties. This has led to a significant
increase in debt funded spending, with residents borrowing against this equity to
fund consumable spending. This debt spending is a growth facet of New Zealand
retail. In 1960 households saved 14.6% of their income, while households
currently spend 14% more than their household income.
Inflation: As discussed above, this factor may increase the amount spent by
consumers but typically does not dramatically influence the level of sustainable
retail floor space. This is the reason that productivity levels are not adjusted but
similarly inflation is factored out of retail spend assessments.
Exchange Rate: Apart from having a general influence over the national balance
of payments accounts, the exchange rate directly influences retail spending. A
change in the $NZ influences the price of imports and therefore their quantity and
the level of spend.
General consumer confidence: This indicator is important as consumers
consider the future and the level of security/finances they will require over the
coming year.
Economic/Income growth: Income growth has a similar impact to confidence.
Although a large proportion of this growth may not impact upon households' MPC
(rather just increasing the income determinant) it does impact upon households'
discretionary spending and therefore likely retail spend.
29304044_1.docx 21
Mandatory Expenses: The cost of goods and services that are necessary has an
impact on the level of discretionary income that is available from a household's
disposal income. Important factors include housing costs and oil prices. As these
increase the level of household discretionary income drops reducing the likely real
retail growth rate.
Current and Future Conditions
Retail spend has experienced a significant real increase in the early-mid 2000s. This
was due in large part to the increasing housing market. Although retail growth is
tempered or crowded out in some part by the increased cost of housing it showed
significant gains as home owners, prematurely, access their potential equity gains. This
resulted in strong growth in debt / equity spending as residents borrow against capital
gains to fund retail spending on consumption goods. A seemingly strong economy also
influenced these recent spending trends, with decreased employment and greater job
security producing an environment where households were more willing to accept debt.
Over the last 8 years this has now reversed with the worldwide GFC recession causing
a significant adjustment in consumer behaviour. As such, the economic environment
has undergone rapid transformation. The national market is currently experiencing low
interest rates (although expected to increase over this coming year) and a highly inflated
$NZ (increasing importing however disproportionately). Now emerging is a rebound in
the property market and an increase in general business confidence as the economy
starts to recover from the post-GFC hangover. These factors will continue to influence
retail spending throughout the next 5 or so years. Given the previous years' (pre-2008)
substantial growth and high levels of debt repayment likely to be experienced by New
Zealand households it is expected that real retail growth rates will continue to be
subdued for the short term.
Impacts of Changing Retail Spend
At this point in time a 1% real retail growth rate is being applied by Property Economics
over the longer term 20-year period. This rate is highly volatile however and is likely to
be in the order of 0.5% to 1% over the next 5 – 10 years rising to 1% - 2% over the
more medium term as the economy stabilises and experiences cyclical growth. This
would mean that it would be prudent in the shorter term to be conservative with regard
to the level of sustainable retail floor space within given centres.

29304044_1.docx 22
Business Spend
This is the total retail spend generated by businesses. This has been determined by
subtracting PPH retail spend and Tourist retail spend from the Total Retail Sales as
determined by the Retail Trade Survey (RTS) which is prepared by Statistics NZ. All
categories are included with the exception of accommodation and automotive related
spend. In total, Business Spend accounts for 26% of all retail sales in NZ. Business
spend is distributed based on the location of employees in each Census Area Unit and
the national average retail spend per employee.
Business Spend Forecast 2013-2048
Business spend has been forecasted at the same rate of growth estimated to be
achieved by PPH retail sales in the absence reliable information on business retail
spend trends. It is noted that while working age population may be decreasing as a
proportion of total population, employees are likely to become more productive over
time and therefore offset the relative decrease in the size of the total workforce.
Top Related