


Languages
Pages
Legal


Bead Pulling MeasurementBead-Pulling Measurement (Multi-cell Cavity Field Flatness)
Prepared bySSung-Woo Lee
Managed by UT-Battellefor the Department of Energy

OutlineOutline
IntroductionIntroductionBead-Pulling MeasurementPerturbation TheoryPerturbation TheoryMethodsTuning MechanismTuning MechanismExamplesConclusionConclusion

IntroductionIntroduction
Accelerating mode of multi-cell cavities is π-Accelerating mode of multi cell cavities is πmode. Cells operate at same frequency with out-of-p q yphase from neighboring cell.Frequency deviation of each cell must be q yquantified.Mechanical tuning required.

Bead-Pulling MeasurementBead Pulling MeasurementIn manufacturing or tuning multi-cell cavities it is required to investigate the field profile inside cavities.The field can be “sampled” by introducing a p y gperturbing object and measuring the change in resonant frequency.The object must be so small that the field do notThe object must be so small that the field do not vary significantly over its largest linear dimension: it is a perturbation method.Phase deviation is much easier to observe thanPhase deviation is much easier to observe than frequency change especially for small perturbation.
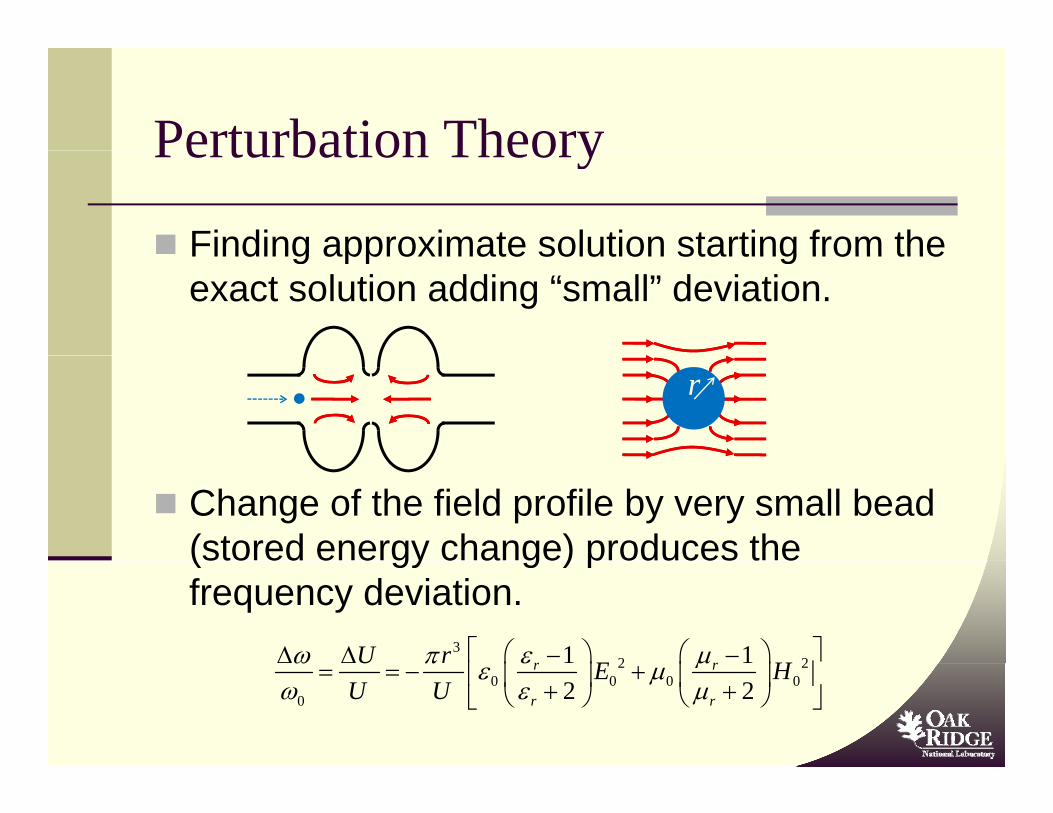
Perturbation TheoryPerturbation Theory
Finding approximate solution starting from theFinding approximate solution starting from the exact solution adding “small” deviation.
r
Change of the field profile by very small bead (stored energy change) produces the (sto ed e e gy c a ge) p oduces t efrequency deviation.
32 21 1U r E Hε μω π ⎡ ⎤⎛ ⎞ ⎛ ⎞− −Δ Δ
⎢ ⎥⎜ ⎟ ⎜ ⎟2 2
0 0 0 00 2 2
r r
r r
U E HU U
ε μω π ε μω ε μ
⎛ ⎞ ⎛ ⎞= = − +⎢ ⎥⎜ ⎟ ⎜ ⎟+ +⎝ ⎠ ⎝ ⎠⎣ ⎦

Bead Pull SetupBead Pull Setup
E H
o
U UU
ωω
Δ −ΔΔ= 3 31
2r
o or
F a aεπ ε π εε
⎛ ⎞−= →⎜ ⎟+⎝ ⎠
The shape of the bead will distort the field in the vicinity of the bead so a geometrical form factor must be used. Due to the H field is zero on the axis of the cavity where the small bead movingmoving, 3
2 2
2o
o b bo
a E HU
μω π εωΔ ⎡ ⎤= − +⎢ ⎥⎣ ⎦

Bead PullsBead PullsFor small perturbations, shifts in the peak of the cavity response is hard to measure.Shifts in the phase at the unperturbed resonant frequency are much easier to measurefrequency are much easier to measure.
1 90
0.5
0.75
peda
nce
0
45
e (d
egre
es)
0.25
Im
45
Pha
s
2 1.5 1 0.5 0 0.5 1 1.5 20
UnperturbedShifted
Frequency2 1.5 1 0.5 0 0.5 1 1.5 290
UnperturbedShifted
Frequency
Measurement Setup
Bead p ll set p for phase shift meas rement
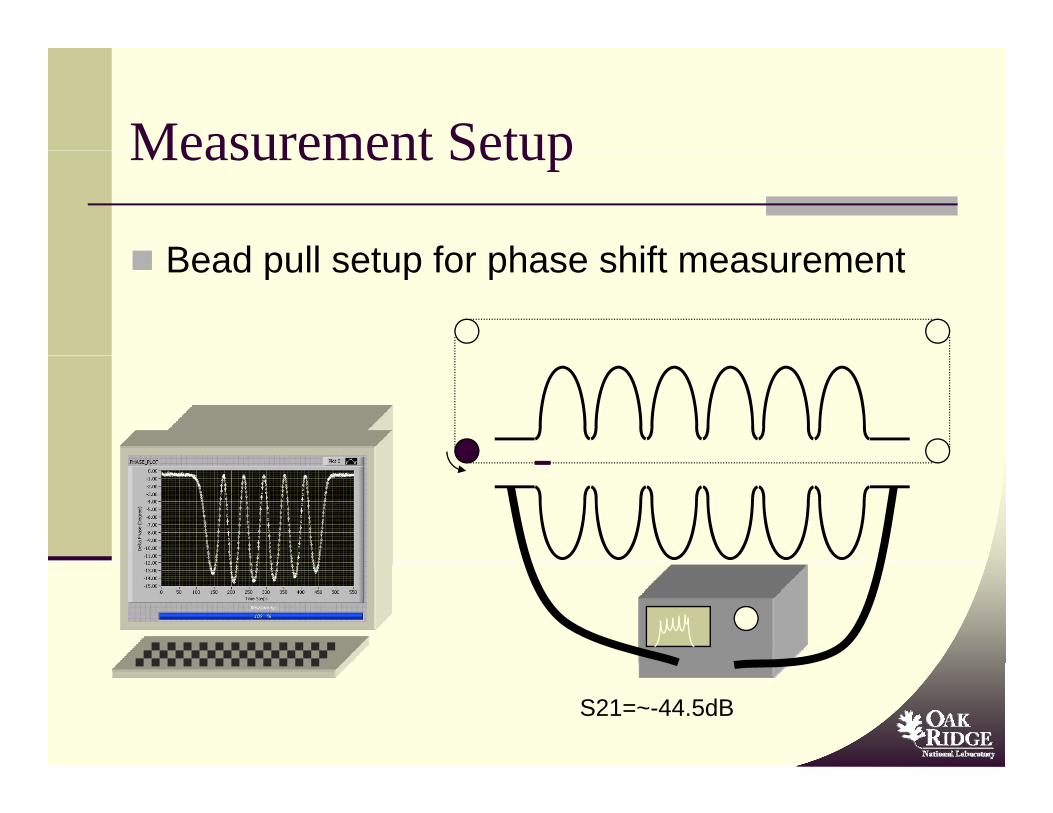
Measurement Setup
Bead pull setup for phase shift measurement
S21=~-44.5dB
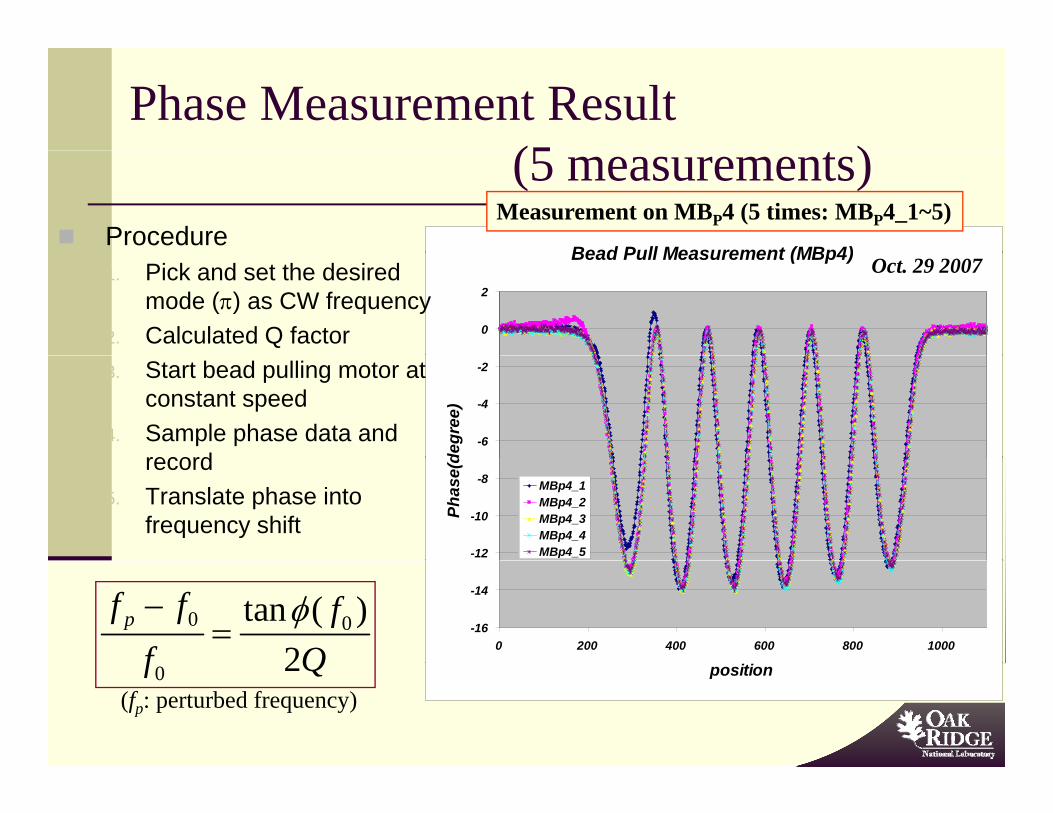
Phase Measurement Result (5 )
Bead Pull Measurement (MBp4)
(5 measurements)Procedure
Measurement on MBP4 (5 times: MBP4_1~5)
Bead Pull Measurement (MBp4)
0
21. Pick and set the desired
mode (π) as CW frequency2. Calculated Q factor
Oct. 29 2007
-6
-4
-2
degr
ee)
3. Start bead pulling motor at constant speed
4. Sample phase data and record
-12
-10
-8
Phas
e(d
MBp4_1MBp4_2MBp4_3MBp4_4MBp4_5
record5. Translate phase into
frequency shift
-16
-14
0 200 400 600 800 1000
0 0tan ( )2
pf f ff Q
φ−=
position0 2f Q(fp: perturbed frequency)

Frequency Shift data (2 measurements)
Bead Pull Measurement (MBp4)
803.942f MB 4 4
(2 measurements)
803.938
803.94
freq_MBp4_4freq_MBp4_5
ff00=803.93875MHz=803.93875MHz
ff00=803.94MHz=803.94MHzQ=7845Q=7845
803.934
803.936
y(M
Hz)
Q=7795Q=7795
803.93
803.932
freq
uenc
y
~12KHz
0 0tan ( )pf f fφ−=
803.926
803.928
0 012f f
0 2f Q=
(fp: perturbed frequency)
803.9240 200 400 600 800 1000
position
0 5
0
0.012 1.49 10803.94
pf ff
−− −= = ×

Direct Frequency Measurement
~12KHz
It is difficult to get frequency shift data directly from frequency sweeping mode in Vector Network Analyzer (VNA) for very smallperturbation. Phase locking (PLL-VCO) is required to track the frequency deviation at π-modefrequency deviation at π-mode.

Direct Frequency Measurement(using PLL system)
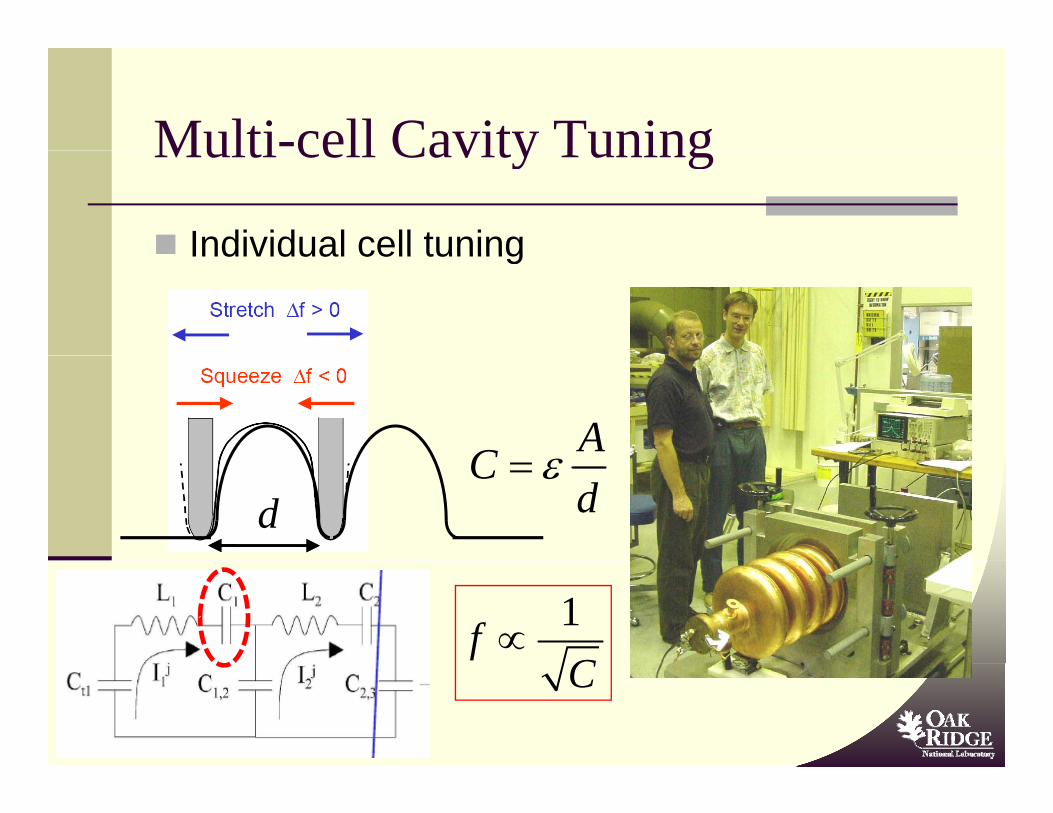
Multi-cell Cavity TuningMulti cell Cavity Tuning
Individual cell tuningIndividual cell tuning
ACCd
ε=d
1fC
∝C

Manual Tuning ExampleManual Tuning Example
Individual cell manual tuning (FermiLab)Individual cell manual tuning (FermiLab)
3rd Harmonic Module mini-Review. T. Khabiboulline. 11.08.2005.

Automatic Tuning Example I(Bead-pull setup integrated)
PC-controlled bead pull measuring device
Photograph of the cavity tuning machine with integrated bead pull measuring device.
3D-CAD-Model of the tuning machineUsed to push and pull each cell to the right frequencies.
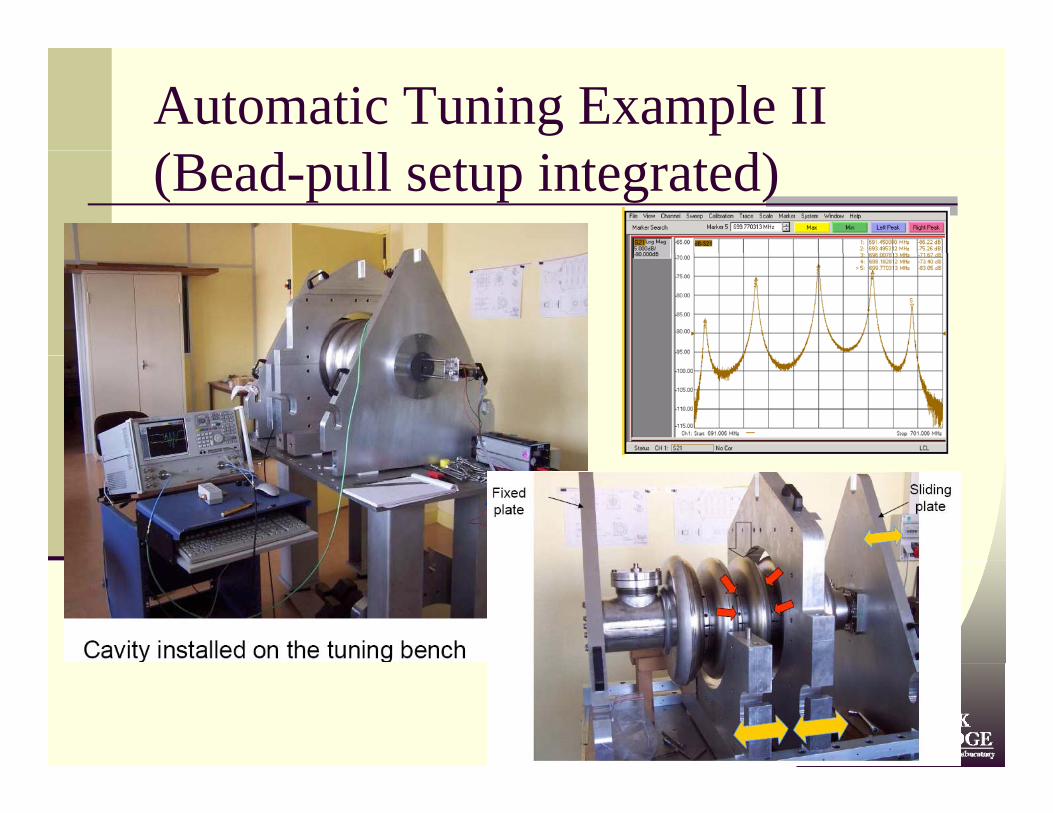
Automatic Tuning Example II(Bead-pull setup integrated)

ConclusionConclusion
Multi-cell(N) accelerating cavities have N ( ) gdegenerated modes. (π−mode is desired)The modes split when the coupling (k) increases
d/ N dand/or N deceases.Each cell has its own resonant frequency. (need to be tuned)be tuned)Frequency deviation can be monitored by bead-pulling based on perturbation theory.Phase measurement can be effectively used under small perturbation.Frequency correction can be done by mechanicalFrequency correction can be done by mechanical tuning(squeezing/extending) procedure.
Top Related