


Languages
Pages
Legal


BASIC ROAD STATISTICS OF INDIA
2015-16
GOVERNMENT OF INDIA
MINISTRY OF ROAD TRANSPORT AND HIGHWAYS
TRANSPORT RESEARCH WING
NEW DELHI
www.morth.nic.in

BASIC ROAD STATISTICS OF INDIA
2015-16
GOVERNMENT OF INDIA
MINISTRY OF ROAD TRANSPORT AND HIGHWAYS
TRANSPORT RESEARCH WING
NEW DELHI
www.morth.nic.in


i
LIST OF CONTENTS
Sl. No. Sections Page No.
1 Executive Summary 1-2
2 Section 1: Overview of Road Network in India 3-7
3 Section 2: National Highways in India 8-11
4 Section 3: State Highways in India 12-13
5 Section 4: District Roads 14-15
6 Section 5: Rural Roads 16-17
7 Section 6: Urban Roads 18-19
8 Section 7: Project Roads 20-21
9 Section 8: International Comparison 22
10 Section 9: Initiatives taken by Ministry of Road
Transport and Highways for improving road network
in the country
23-27

ii
LIST OF TABLES
Sl. No. Tables Page No.
1 Table 1.1: Road Network by Categories (in kilometres) –
1950-51 to 2014-15 and 2015-16
3
2 Table 1.2CAGR (in %) of Road Networks - 1951 to 2016 4
3 Table 1.3 Investment in Highways in both Public and
private 2005-06 to 2016-17(in Crores)
5
4 Table 2.1: Lane-wise Break-up of National Highways -
2014-2015; &2015-16
9
5 Table 2.2: List of State-Wise National Highways in the
country as on 31.03.2016
11
6 Table 8.1: Major Road Indicators across Select Countries
(2014)
22
7 Table 9.1: Central Road Sector Outlay and Expenditure
(including private sector investment) - (At Current Price)
for 12th Plan
25
8 Table 9.2: The State/UT-wise details of funds
allocated/utilized for development of NHs during each of
the last three years
26-27

iii
LIST OF CHARTS
Sl. No. Chart Page No.
1 Chart 1.1: Trend of Growth in Road Length by Categories:
1950-51 to 2015-16 4
2 Chart 1.2: Share of Road length in total length by Categories: 2015-16 6
3 Chart 1.3: Total and Surfaced Road length (in kms) in India:
1950-51 to 2015-16 7
4 Chart 1.4: Total length of Roads (in kms) in India as on 31.03.2016 7
5 Chart 2.1: Total length of National Highways (in kms) in India:1951 to
2016 8
6 Chart 2.2 : State/UT-wise Length of National Highways (in kms): as on
31.03.2016 9
7 Chart 3.1: The length of State Highways (in kms) in India : 1970 to
2016 12
8 Chart 3.2: State/UT-wise Length of State Highway (in kms) as on
31.03.2016 13
9 Chart 4.1: State/UT-wise Length of District Roads (in kms) as on
31.03.2016 15
10 Chart 5.1: Total Length of Rural Roads in India: 1950-51 to 2015-16 16
11 Chart 5.2: State/UT-wise Length of Rural Roads in India (in kms)as on
31.03.2016 17
12 Chart 6.1: Total Length of Urban Roads in India: 1960-61 to 2015-16 18
13 Chart 6.2 State/UT-wise length of Urban Roads (in kms) as on
31.03.2016 19
14 Chart 7.1: Total Length of Project Roads in India: 1970-71 to 2015-16 20
15 Chart 7.2: State/UT-wise Length of Project Roads in India (in kms) as
on 31.03.2016 21

iv
LIST OF ANNEXURE
Annexure No. Annexure Page No.
1.1 Total and Surfaced Road Length by Categories in India as on 31st
March, 2016 29
1.2 Road Length by Categories and by Type of Surface in India as on
31st March, 2016 30
1.3 Total and Surfaced Length of Roads in India as on 31st March, 2016
(State/UT-wise) 31
1.4 Total Road Length and Percentage Share of Each Category of Road
to Total Road Length (1951-2016) 32
2.1 Length of National Highways in India as on 31st March, 2016
(State/UT-wise) 34
2.2 Lane-wise Length of National Highways in India as on 31st March,
2016 (State/UT-wise) 35
3.1 Total and Surfaced Length of State Highways in India as on 31st
March, 2016 (State/UT-wise) 37
3.2 Length of State Highways by Type of Surface in India as on 31st
March, 2016 (State/UT-wise) 38
4.1 Total and Surfaced Length of District Roads as on 31st March, 2016
(State/UT-wise) 40
4.2 Total and Surfaced Length of District Roads as on 31st March, 2016
(State/UT-wise) 41
5.1 Total and Surfaced Length of Rural Roads as on 31st March, 2016
(State/UT-wise) 43
5.2 Length of Pradhan Mantri Gram Sadak Yojana Roads by Type of
Surface as on 31st March, 2016 (State-wise) 44
5.3 Length of Rural Roads built by State PWD/RWD- by Type of
Surface as on 31st March, 2016 (State/UT-wise) 45
5.4 Length of Panchayati Raj Roads by Type of Surface as on 31st
March, 2016 (State-wise) 46
6.1 Total and Surfaced Length of Urban Roads as on 31st March, 2016
(State/UT-wise) 48
6.2 Length of Municipal Roads by Type of Surface as on 31st March,
2016 (State/UT-wise) 49
6.3 Length of Military Engineering Service Roads by Type of Surface as
on 31st March, 2016 (State/UT-wise) 50
6.4 Length of Major Port Roads by Type of Surface as on 31st March,
2016 (State-wise) 51

v
6.5 Length of Minor Port Roads by Type of Surface as on 31st March,
2016 (State/UT-wise) 52-53
6.6 Length of Railway Roads by Type of Surface as on 31st March,
2016 (State/UT-wise) 54
7.1 Total and Surrfaced Length of Project Roads as on 31st March,
2016 (State/UT-wise) 56
7.2 Length of Roads under Forest Department by Type of Surface as on
31st March, 2016 (State/UT-wise) 57
7.3 Length of Roads under Border Roads Organisation- by Type of
Surface in India as on 31st March, 2016 (State/UT-wise) 58
7.4 Length of Roads under Coalfields/Coal units of Coal India Limited
by Type of Surface as on 31st March, 2016 (State-wise) 59-60
7.5 Length of Roads under Electricity Department by Type of Surface as
on 31st March, 2016 (State-wise) 61
7.6 Length of Roads under Irrigation Department by Type of Surface in
India as on 31st March, 2016 (State-wise) 62
7.7 Length of Roads under Sugarcane Authority by Type of Surface as
on 31st March, 2016 (State/UT-wise) 63
7.8 Length of Roads under SAIL & NMDC by Type of Surface in India
as on 31st March, 2016 (State-wise) 64
8.1 Long - Term Trends of Investment in Highways 66
Terms and Definitions 67-68

-1-
EXECUTIVE SUMMARY
A good road network is a critical infrastructure requirement for rapid growth of the economy.
Roads should not be looked at in isolation but as part of an integrated multi-model system of transport.
2. Various construction programmes for different classes of roads over the past two-and-a-half
decades have yielded a significant expansion in network size in India. Efforts are being made for a
balanced development of road network (primary, secondary and tertiary systems). Further, through
recent initiatives, the development of the primary road network is being tied up with the railways’
dedicated freight corridors/other segments of rail network, connectivity with ports, airports, logistic
hubs, major tourist centres and linkage with neighbouring countries.
3. Development & maintenance of roads are undertaken by various agencies of both Central and
State Governments. The main agencies are: State PWDs, National Highways Authority of India,
National Highway Infrastructure Development Corporation, Border Roads Organisation, National
Rural Development Agency of Ministry of Rural Development, State Forest Departments, Railways,
Port Trusts, Municipal Corporations, PSUs etc.
4. The Ministry of Road Transport & Highways is primarily responsible for development and
maintenance of National Highways. It has been making continuous efforts, through a pro-active sector
policy, leveraging both public and private investment, to expand and upgrade the road network
specially that of National Highways, which has increased from a length of 70,934 km in 2010-11 to
1,01,011 km as on 31.03.2016.
5. India’s road network as on 31.03.2016 was 56.03 lakh km. The break-up category-wise is
given below :
Category of Road Length ofRoads (km)
National Highways (NHs) 1,01,011
State Highways (SHs) 1,76,166
District Roads 5,61,940
Rural Roads 39,35,337
Urban Roads 5,09,730
Project Roads 3,19,109
Total 56,03,293

-2-
6. As on 31st March 2016, India’s road density at 170 km of roads per 100 sq km was higher
than that of Japan (0.91 km/ sq km), USA (0.68 km/ sq km), China (0.47 km/ sq. km), Brazil (0.18
km/sq.km) and Russian Federation (0.08 km/ sq km).
7. Adjusted for its large population, India has approximately 4.63 km of roads per 1000 people
(Census 2011).
8. The paved/surfaced road length in India was 62.5 per cent of the total road length which was
lower as compared to United Kingdom (100.00), Korea (84.9) and Russian Federation (70.60). NHs in
India, which accounted for 1.76 % of the total length as on 31st March, 2016 was much lower than that
of some of the developed countries of the world such as Japan, Korea Republic, UK and Brazil.

-3-
Section – 1
Overview of Road Network in India
1.1 As on 31.3.2016 the existing stock of road length in India was 56.03 lakh kms. The road
network of the country consists of National Highways (NH), State Highways (SH) District
Roads, Rural Roads, Urban Roads and Project Roads. The development and maintenance of roads
in India are undertaken by various agencies of both Central and State governments. State PWDs,
National Highways Authority of India Ltd., Border Roads Organisation, National Highway
Infrastructure Development Corporation Ltd. (NHIDCL), National Rural Road Development Agency
(NRRDA) are the main agencies. The Ministry of Road Transport & Highways is primarily
responsible for the development and maintenance of National Highways. All roads other than the
National Highways are with the State Governments.
1.2 Table 1.1 shows the progress of road length under different categories during the period 31st
March, 1951 to 31st March, 2016.
Table 1.1: Road Network by Categories (in kilometres) – 1950-51 to 2015-16
Road
Category 1950-51
1960-
61
1970-
71 1980-81 1990-91 2000-01 2010-11 2013-14 2014-15 2015-16
National
Highways
19811
(4.95)
23798
(4.54)
23838
(2.61)
31671
(2.13)
33650
(1.45)
57737
(1.71)
70934
(1.52)
91287
(1.69)
97991
(1.79)
101011
(1.80)
State
Highways ^ ^
56765
(6.20)
94359
(6.35)
127311
(5.47)
132100
(3.92)
163898
(3.50)
170818
(3.16)
167109
(3.05)
176166
(3.14)
District
Roads
173723
(43.44)
257125
(49.02)
276833
(30.26)
421895
(28.40)
509435
(21.89)
736001
(21.82)
998895
(21.36)
1082267
(20.03)
1101178
(20.12)
561940
(10.03)
Rural
Roads
206408
(51.61)
197194
(37.60)
354530
(38.75)
628865
(42.34)
1260430
(54.16)
1972016
(58.46)
2749804
(58.80)
3304328
(61.16)
3337255
(60.99)
3935337
(70.23)
Urban
Roads 0
46361
(8.84)
72120
(7.88)
123120
(8.29)
186799
(8.03)
252001
(7.47)
411679
(8.80)
457467
(8.47)
467106
(8.54)
509730
(9.10)
Project
Roads 0 0
130893
(14.31)
185511
(12.49)
209737
(9.01)
223665
(6.63)
281628
(6.02)
296319
(5.48)
301505
(5.51)
319109
(5.70)
Total 3,99,942 5,24,478 9,14,979 14,85,421 23,27,362 33,73,520 46,76,838 54,02,486 54,72,144 56,03,293
Note: Total includes 9 lakh Km of Rural roads constructed under JawaharRozgarYojana)
Figures in parenthesis indicate percent to total road length.

-4-
1.3 The total road length of the country increased significantly from 3.99 lakh km in 1951 to
56.03 lakh km in 2016, growing at a Compound Annual Growth Rate (CAGR) of 4.1% during the
year 1951to 2016. The long run trend of growth in road length for the period 1951-2016 is depicted
in Chart 1.1 and CAGR for 1951-2016, along with decadal CAGRs, are given in Table 1.2.
Table 1.2CAGR (in %) of Road Networks -1951 to 2016
Period NHs
SHs &
District
Roads
Rural
Roads
Urban
Roads
Project
Roads Total
2016/1951 2.5 3.2 4.4 4.1
1961/1951 1.9 4 -0.5 2.7
1971/1961 0 2.6 6 4.5 5.7
1981/1971 2.9 4.5 5.9 5.5 2.1 5
1991/1981 0.6 2.1 7.2 4.3 1.2 4.6
2001/1991 5.5 3.1 4.6 3 0.6 3.8
2014/2004 3.4 3.9 4.4 4.3 1.3 4.1
2015/2005 4.1 3.1 3.9 5 1.5 3.7
2016/2006 4.3 * * 5.7 2.0 3.7
* Note: During the year 2015-16 Other PWD Road (OPWD) category has been discontinued and PWD road,
other than SHs, are categorized under District Roads and Rural roads under PWD. Because of this change,
the figures in respect of OPWD, District Road & Rural Roads are not comparable with figures of previous
years
0
5,00,000
10,00,000
15,00,000
20,00,000
25,00,000
30,00,000
35,00,000
40,00,000
45,00,0001
95
0-5
1
196
0-6
1
197
0-7
1
198
0-8
1
199
0-9
1
200
0-0
1
201
0-1
1
201
4-1
5
201
5-1
6
Ro
ad
Len
gth
(in
km
s)
Chart 1.1: Trend of Growth in Road Length by Categories:
1950-51 to 2015-16
Nationa Highways State Highways & District Roads
Rural Roads Urban Roads
Project Roads

-5-
1.4 Decadal analysis
During the decade, 2005-06 to 2015-16, the highest CAGR was that of urban roads (5.7%) followed by
rural roads (5.5%), NH (4.3%) and project roads (2.0%). As seen from Table 1.1 while the length of
national Highways was 70,934 kms in 2010-2011 it increased rapidly to 101011 kms in 2015-16.The
proactive policy steps, leveraging of private and public Investment, innovative financing models, have
resulted in increase in pace of NH development in recent years. The Table 1.3 on Investment in
National Highways shows that the combined public and private investment increased by over 7 times
during the decade 2005-06 to 2015-16.The CAGR of Investment during the period 2005-06 to 2015-16
is 21.52%. The details of allocation of fund and expenditure is at Annexure 8.1
Table 1.3 Investment in Highways in both Public and private 2005-06 to 2016-17 (in Crores)
Source: Calculation based on the Expenditure statement of Roads Wing (Annexure 8.1 at the end of the Report)
Sl. No. Year
Expenditure
Private Sector
Investment
Public Sector
Investment
Total
(1) (2) (3) (4) (9)
1 2005-06 649.08(4.60) 13,446.79(95.40) 14,095.87
2 2006-07 1,578.28(8.92) 16,116.59(91.08) 17,694.87
3 2007-08 7,062.40(30.25) 16,281.22(69.75) 23,343.62
4 2008-09 8,184.73(29.06) 19,983.24(70.94) 28,167.97
5 2009-10 8,572.54(30.36) 19,661.87(69.64) 28,234.41
6 2010-11 15,354.37(36.13) 27,140.50(63.87) 42,494.87
7 2011-12 25,998.56(41.97) 35,951.71(58.03) 61,950.27
8 2012-13 20,304.66(42.70) 27,245.53(57.30) 47,550.19
9 2013-14 22,515.05(38.07) 36,619.48(61.93) 59,134.53
10 2014-15 19,232.44(35.01) 35,702.27(64.99) 54,934.71
11 2015-16 29,770.00(30.07) 69,218.06(69.93) 98,988.06
CAGR(2015-2016) 21.52

-6-
1.5 Along with the increase in the total road length the paved/ surfaced road length too increased. The
latter grew from 1.57 lakh kms as on 31st March 1951 to 35.01 lakh kms as on 31st March 2016.
Surfaced roads formed 39.26% of the total road length as on 31st March, 1951 which increased to
62.5% as on 31st March, 2016
Details of Road Length and Road Categories – 2015-16
1.6As seen from Table 1.1, the share of rural roads was the highest in the total road length
(70.23%) followed by District roads (10.03%) and Urban roads (9.10%). This can be seen
from chart 1.2 below
1.8 3.14
10.03
70.23
9.10
5.69
Chart 1.2: Share of Road length in total length by Categories: 2015-16
National Highways
State Highways
District roads
Rural Roads
Urban Roads
Project Roads

-7-
1.7 The State wise break up shows that Maharashtra (613418 Km) accounted for the largest share
(13.04%) in total network of roads for the year up to the period 31st March 2016 excluding JRY roads,
followed by Uttar Pradesh (8.98%), Karnataka (7.35%), Assam (7.01%) and West Bengal
(6.73%)(Chart 1.4). The State wise details are at Annexure 1.3
1.8 The five states with the largest road networks (excluding Jawahar Rozgar Yojana roads), viz.
Maharashtra, Uttar Pradesh, Karnataka, Assam and West Bengal accounted for about a share of 43.11%
of total road length of the country, as given in Chart 1.4
3.99
9.15
23.27
33.73
54.03 54.72 56.03
1.573.98
10.9
16.01
32.2 33.4135.01
0
10
20
30
40
50
60
1950-51 1970-71 1990-91 2000-01 2013-14 2014-15 2015-16
Chart 1.3: Total and Surfaced Road length (in kms) in India:
1950-51 to 2015-16
Total length of Road (in lakhs Kms) Total length of Surfaced Road (in lakh kms)
17
43
67
30
69
2
32
95
20
20
64
84
95
80
9
16
06
3
17
91
44
48
48
2
55
75
9
49
71
6
66
78
6
34
55
15
20
08
08
28
99
40
61
34
18
24
77
6
21
72
7
81
08
36
11
4
28
80
83
10
83
79
25
42
79
82
43
26
10
35
12
35
72
39
36
5
61
01
8
42
24
12
31
67
30
14
93
28
21
11
34
49
6
17
62
5
20
9
31
74
0
100000
200000
300000
400000
500000
600000
700000
An
dhra
Pra
des
h
Aru
nac
hal
Pra
des
h
Ass
am
Bih
ar
Chh
atti
sgar
h
Go
a
Gu
jara
t
Har
yan
a
Him
ach
al P
rad
esh
Jam
mu
And
Kas
hm
ir
Jhar
khan
d
Kar
nat
aka
Ker
ala
Mad
hy
a P
rad
esh
Mah
aras
htr
a
Man
ipur
Meg
hal
aya
Miz
ora
m
Nag
alan
d
Od
ish
a
Pu
nja
b
Raj
asth
an
Sik
kim
Tam
iln
adu
Tel
angan
a
Tri
pura
Utt
arak
han
d
Utt
ar P
rad
esh
Wes
t B
eng
al
A &
N I
slan
ds
Chan
dig
arh
Dad
ra &
Nag
ar H
avel
i
Dam
an &
Diu
Del
hi
Lak
shad
wee
p
Po
ndic
her
y
To
tal
len
gth
(in
km
s)
State/UTs
Chart 1.4: Total length of Roads (in kms) in India as on 31.03.2016 (State/UT-wise)

-8-
Section – 2
National Highways in India
2.1 National Highways constitute the primary system of road transportation in India. These are the
main highways running through length and breadth of the country connecting capitals of States and UTs,
major ports, rail junctions, industrial and tourist centres and link up with border roads and highways of
neighboring countries. Ministry of Road Transport & Highways, Government of India, is responsible
for the development and maintenance of NHs in India. The list of State-wise National Highways in the
country as on 31.03.2016 is at Table 2.2 at the end of the Chapter.
2.2 The growth of National Highways since 1951 is depicted in Chart 2.1.
2.3 Totalling at 101011 kms. as on 31.03.2016, National Highways comprised of 1.80 % of total road
network in the country. All NHs are surfaced.
2.4 As on 31st March 2016, two-lane NHs constituted the largest share of NHs, i.e. 55.05% in
the total length of NHs. This was followed by four lane & above NHs (comprising of 24.46% of the
total length of NH). The share of less than two lane NHs during 2015-16 was 20.49(Table 2.1).
19811
23798
23838
31671
33650
57737
70934
91287
97991
101011
0 10000 20000 30000 40000 50000 60000 70000 80000 90000 100000 110000
1950-51
1960-61
1970-71
1980-81
1990-91
2000-01
2010-11
2013-14
2014-15
2015-16
Total Length (in kms)
Yea
r
Chart 2.1: Total length of National Highways (in kms) in India:
1951 to 2016

-9-
Table 2.1: Lane-wise Break-up of National Highways - 2014-2015; &2015-16
Number of Lanes As on 31st March, 2015 As on 31st March, 2016 Less than Two Lane 31,089
(31.73)
20,703 (20.49)
Two –Lane 45,701
(46.64)
55,603 (55.05)
Four- Lane & Above 21,201
(21.63)
24,705
(24.46)
Total 97,991
(100)
1,01,011
(100) (Figures in parentheses are proportion of total length of NHs)
2.5 From the Table 2.1, it is seen that the length of NHs was 97991 km as on 31.03.2015. It
increased by 3.08% to 101011 km as on 31.3.2016. Compared to 2014-15 the less than two lane NH
have decreased in 2015-16. However, there has been 21.6% increase in the two lane NH and 16.53%
increase in the four lane above NH over previous year.
2.6 Uttar Pradesh accounted for the largest share (8.4%) in the total length of NHs as on 31st
March 2016, followed by Rajasthan (7.8%), Maharashtra
(7.4%), Karnataka (6.4%) and Andhra Pradesh (5.4%). These five States accounted for about
35.4% of the total road length of NHs. This is illustrated in chart 2.2. [State/UT wise details
are at Annexures 2.1 and 2.2].
54
65
25
13 3
82
1 48
39
30
78
26
2
49
71
26
22
26
42 2
60
1
26
54
65
02
18
12
51
94
74
35
17
46
12
04 1
38
1
11
50
48
38
27
69
79
06
46
3
49
46
26
96
80
5
27
14
84
83
29
56
33
1
15
31
22 80
0 64
0
1000
2000
3000
4000
5000
6000
7000
8000
9000
An
dh
ra P
rades
h
Aru
nac
hal
Pra
des
h
Ass
am
Bih
ar
Ch
hat
tisg
arh
Go
a
Gu
jara
t
Har
yan
a
Him
achal
Pra
des
h
Jam
mu
& K
ash
mir
Jhar
kh
and
Kar
nat
aka
Ker
ala
Mad
hya
Pra
des
h
Mah
aras
htr
a
Man
ipur
Meg
hal
aya
Miz
ora
m
Nag
alan
d
Od
isha
Pun
jab
Raj
asth
an
Sik
kim
Tam
il N
adu
Tel
angan
a
Tri
pu
ra
Utt
arak
han
d
Utt
ar P
rades
h
Wes
t B
engal
An
dam
an &
Nic
ob
ar…
Ch
and
igar
h
Dad
ar &
Nag
ar H
avel
i
Dam
an &
Diu
Del
hi
Lak
shad
wee
p
Pud
uch
erry
To
tal
Len
gth
(in
km
s)
State/UTs
Chart 2.2 : State/UT-wise Length of National Highways (in kms):
as on 31.03.2016

-10-
Table 2.2
LIST OF STATE-WISE NATIONAL HIGHWAYS IN THE COUNTRY AS ON 31.03.2016
Sl.
No.
Name of
State
National Highway No. Total
Length
(in km)
1 Andhra
Pradesh
4, 5, 7, 9, 16, 18, 18A, 42 New, 43, 63, 67Ext. New, 150 New,167 New, 202,
205, 214, 214A, 216, 219, 221, 222, 234, 326, 326A, 67 New,71 New, 161 New,
340 New, 340C New, 353 New, 363 New, 365 New, 544D New, 563 New, 565
New,765 New
5,465
2 Arunachal
Pradesh
52, 52A, 153, 229, 52B Ext, 37 Ext., 315A, 713 New, 513 New, 313 New, 113
New & 713A New 2,513
3 Assam 6 New, 31, 31B, 31C, 36, 37, 37A, 37E, 38, 39, 44, 51, 52, 52A, 52B, 53, 54, 61,
62, 117A New, 127B New, 127E New, 151,152, 153, 154, 315A New, 127C New
& 127D New, 208A New, 329 New, 427 New, 627 New, 702 New, 702B New,
702C New 702D & 715A New
3,821
4 Bihar 2, 2C, 19, 20Ext New 28, 28A, 28B, 30, 30A, 31, 57, 57A, 77, 80, 81, 82, 83, 84,
85, 98, 99, 101, 102, 103, 104, 105, 106, 107, 110, 120 New, 122A New, 131A
New, 133 New, 133B New, 219 New, 227 A New, 327A New, 327 Ext. New,
333 New, 333A New, 333B New, 527A New, 527C New, 727 A New, 766C, &
120 New
4,839
5 Chandigarh 21 15
6 Chhattisgarh 6, 12A, 16, 43, 78, 111, 130A New, 130B New, 130C New, 130D New, 149B
New, 163A New, 200, 202, 216, 217, 221, 343 New, 930New 3,078
7 Delhi 1, 2, 8, 10, 24 & 236 80
8 Goa 4A, 17, 17A & 17B 262
9 Gujarat NE-I, 6, 8, 8A, 8B, 8D, 8E, 14, 15, 56, 58 New, 58 Ext New, 59, 113 228, 251
New, 753B New, 848 & 848A New, 848B New, 341 New, 68Ext. New, 147A
New, 168 New, 168A New, 351 New, 927D New & 953 New
4,971
10 Haryana 1, 2, 8, 10, 11 New, 21A, 22, 54 New, 64, 65, 71, 71A, 72, 73, 73A , 71B,
148BNew, 236, 248 A New, 254 New, 334B New, 352A, 444A New, 703 New,
709 Ext New, 709A New & NE-II
2,622
11 Himachal
Pradesh
1A, 3 New, 20, 20A, 21, 21A, 22, 70, 72, 72B, 88, 73A , 154A New, 305 New,
503 New, 503A New, 503 Ext. New, 505 New, 505A New705 New, 907 A New 2,642
12 Jammu &
Kashmir
1A, 1B, 1C, 1D, 3 New, 144 New, 144A New, 301 New, 444 New, 501 New,
701 New, 244 New 2,601
13 Jharkhand 2, 6, 20 Ext New, 23, 31, 32, 33, 43 New, 75, 78, 80, 98, 99, 100, 114A New, 133
New, 133A New, 133B, 143 New, 143A New, 220 New, 333 New, 333A New ,
343 New & 419 New
2,654
14 Karnataka 4, 4A, 7, 9, 13, 17, 48, 50 New, 63, 67, 67New, 150, 150 Ext. New, 150A New,
167 New, 169A New, 173 New, 206, 207,209, 212, 218, 234, 275 New, 367
New, 766C
6,502
15 Kerala 17, 47, 47A, 47C, 49, 183A New, 185 New, 208, 212, 213, & 220 1,812
16 Madhya
Pradesh
3, 7, 12, 12A, 25, 26, 26A, 26B, 27, 34 New, 56 New, 59, 59A, 69, 69A, 75, 76,
78, 86, 92, 927A New & 339B 5,194
17 Maharashtra 3, 4, 4C, 6, 7, 8, 9, 13, 16, 17, 26B, 50, 50New, 69, 150 Ext. New, 161 New, 204,
211, 222, 348 New, 848 New, 160 New, 166 New, 166A New, 339B New, 348
New, 348A New, 353C New, 353D New, 353E New, 361 New, 363 New, 547E
New, 548 New, 753 New, 753A New, 753B New, 848A, 930 New & 953 New,
965 New
7,435
18 Manipur 39, 53, 102 New, 102A New, 102B New, 102 C New, 129A new, 108A New,
129 New, 137 New, 137A New, 150, 155, 702A New 1,746
19 Meghalaya 40, 44, 51, 62 & 127B New 1,204
20 Mizoram 6 New, 44A, 54, 54A, 54B, 102B New, 150, 154, 302 New, 306 A New & 502A 1,381

-11-
New
21 Nagaland 36, 39, 61, 129 New, 150, 155, 702 New, 702A New & 702B New, 702D 1,150
22 Odisha 5, 5A, 6, 20 Ext, 23, 42, 43, 55 Ext New, 60, 75, 130C New, 153B New, 157
New, 200, 201, 203, 203A, 215, 217, 220 New, 224, 326 New & 326 A New 4,838
23 Puducherry 45A & 66 64
24 Punjab 1, 1A, 10, 15, 20, 21, 22, 64, 70, 71, 72, 95, 103 A New, 154A, 205A New, 254
New, 344A New, 344B New, 503 Ext. New , 503A New, 703 New 703A New,
754 New & 148B New
2,769
25 Rajasthan 3, 11New, 123 New (3A Old), 8, 11, 11A, 11B, 11C, 12, 14, 15, 25 Ext. New, 54
New, 65, 458 New & 65A Old, 71B, 76, 58 Ext New &76A Old, 758 New & 76B
Old, 79, 79A New, 89, 90, 113, 112, 114 , 116,148B New,148D New & 116A
Old, 158 New, 162A New, 162 Ext. New, 168 New, 168A New, 248A New, 325
New, 709 Ext. New, 927A New,
7,906
26 Sikkim 31A, 310, 310A New, 510 New, 563 New, 710 New, 717A New, 717B New 463
27 Tamil Nadu 4, 5, 7, 7A, 45, 45A, 45B, 45C, 46, 47, 47B, 49, 66, 67, 68, 205, 207, 208, 209,
210, 219, 220, 226, 226Ext., 227, 230, 234, 381 New, & 532 New 5,006
28 Tripura 44 , 44A, 108A,208 New, 208A New, & 108B New 805
29 Telangana 7, 9, 16 202, 221, 216A New, 222, 326 New, 167 New, 150 New, 363 New, 365
New, 565 New, 161, 765 New, 50 New, 563 New & 365A New 2,636
30 Uttarakhand 9 new,34 New, '58, 72, 72A, 72B,73, 74, 87, 94,107A New, 108, 109, 123, 119,
121 , 125, 309A New, 309B New, 334A & 707A New 2,714
31 Uttar Pradesh 2, 2A, 3, 123 New (3A Old), 7, 11, 12A, 19, 24, 24A, 24B, 25, 25A, 26, 27, 28,
28B, 28C, 29, 34 New, 56, 56A, 56B, 58, 72A, 73, 74, 75, 76, 86, 87, 91, 91A,
92, 93 ,96, 97 , 119, 219 New, 227 A New, 231, 232, 232A, 233, 235, 330, 330A
New, 330 B New, 334 New, 334B New, 334C New, 709 A, 727 A New, 730
New, 730A New, 731 A New, 931 New, 931A New & NE-II
8,483
32 West Bengal 2, 2B, 6, 10, 31, 31A, 31C, 31D, 32, 34, 35, 41, 55, 60, 60A, 80, 81, 114A New,
116B New, 117, 131A, 133A New, 317A, 327B, 419 New, 512 New & 717. 2,956
33 Andaman &
Nicobar
Islands
4 New 331
34 Dadra &
Nagar Haveli
848A New 31
35 Daman & Diu 848B New & 251 New 22
Total 1,01,010

-12-
Section – 3
State Highways in India
3.1 State Highways together with major district roads constitute the secondary system of
road transportation in the country. These roads are administered and financed by State
Governments. Through the State Public Works Departments (PWDs).The State Highways
provide links with NHs, district headquarters of State, important towns, tourist centres and
minor ports. The growth of SH since 1970-71 is depicted in Chart 3.1
3.2 The total length of State Highways as on 31st March, 2016 increased to 1,76,166 kms as
against 1,67,109 kms as on 31st March, 2015. As on 31st March, 2016, around 96.63% of SH roads
were surfaced out of total length of State Highways. Out of total length of surfaced SHs, Bituminous
Top (BT) and Cement Concrete (CC) roads accounted for about 98.50% and the remaining 1.5% were
Water Bound Macadam (WBM) roads. The detailed break up State/UT wise by type of surface is at
Annexure 3.2
56765
94359
127311
132100
163898
170818
167109
176166
0 20000 40000 60000 80000 100000 120000 140000 160000 180000
1970-71
1980-81
1990-91
2000-01
2010-11
2013-14
2014-15
2015-16
Total Length (in kms)
Yea
r
Chart 3.1: The length of State Highways (in kms) in India : 1970 to 2016

-13-
Note: Arunachal Pradesh has not classified its PWD roads into State Highways and District Roads. The total length
of PWD Roads of 8123 kms. has been reflected under State Highways.
3.3 The State/UT-wise break-up of State Highways as on 31st March, 2016 shows that Maharashtra
accounted for the largest share in the total length of SH roads (22.14%), followed by Karnataka
(11.11%), Gujarat (9.76%), Rajasthan (8.62%) and Tamil Nadu (6.67%) (Chart 3.2). These five
States accounted for about 58.31% of the total length of SHs.
State wise details are at Annexure 3.1 and 3.2.
64
85 8
12
3
25
30 4
25
3
44
62
27
9
17
20
1
18
01 1
46
61
30
12
96
19
57
8
43
42
10
93
4
39
00
0
71
5
77
2
17
0
72
2
41
87 11
33
15
18
8
70
1
11
75
2
27
31
32
9 45
21
71
47
36
12
26
6
20
0
28
22
0 0 89
0
5000
10000
15000
20000
25000
30000
35000
40000
45000A
ndh
ra P
rades
h
Aru
nac
hal
Pra
des
h
Ass
am
Bih
ar
Ch
hat
tisg
arh
Go
a
Gu
jara
t
Har
yan
a
Him
achal
Pra
des
h
Jam
mu
& K
ash
mir
Jhar
kh
and
Kar
nat
aka
Ker
ala
Mad
hya
Pra
des
h
Mah
aras
htr
a
Man
ipur
Meg
hal
aya
Miz
ora
m
Nag
alan
d
Od
isha
Pun
jab
Raj
asth
an
Sik
kim
Tam
il N
adu
Tel
angan
a
Tri
pu
ra
Utt
arak
han
d
Utt
ar P
rades
h
Wes
t B
engal
An
dam
an &
Nic
ob
ar Is
land
Ch
and
igar
h
Dad
ra &
Nag
ar H
avel
i
Dam
an &
Diu
Del
hi
Lak
shad
wee
p
Pud
uch
erry
Ro
ad
Len
gth
(in
km
)
State/UTs
Chart 3.2: State/UT-wise Length of State Highway (in kms) as on 31.03.2016

-14-
Section – 4
District Roads in India
4.1 District Roads constructed & maintained by Public Works Department of States and UTs, together
with the State Highways, account for the secondary system of road transportation in the country. District
Roads comprising of Major District Roads (MDRs), Other District Roads (ODRs) provide connection
between district and taluk headquarters with the State highways and National Highways. These roads
which run within districts contribute significantly to the economy and country’s industrial development
connecting areas of production with markets and enabling movements of raw materials and products. As
per the classification of roads broadly the MDRs are to have a minimum width of 15 metres with traffic
density of less than 10,000 PCUs but more than 5000 PCUs.
4.2 This issue of Basic Roads Statistics attempts to distinguish district roads from all other
categories of roads under PWD. It marks a departure from the previous issues of the publication
which clubbed all PWD roads, other than SHs in a category called OPWD (Other PWD).
4.3 The total length of District Roads as on 31st March, 2016 was approx. 561940 kms. of which
533493 km. of District Roads were surfaced comprising of 94.93 % of the total length (Annexure
4.1). State/UT-wise length of District Roads as on 31.03.2016 can be seen in Chart 4.1.
4.4 Out of the total surfaced length of 533493 km of District roads, Bituminous Top (BT) and
Cement Concrete (CC) roads accounted for about 95.3% and the remaining 4.7% were Water Bound
Macadam (WBM) roads. The detailed break up State/UT wise by type of surface is at Annexure 4.2.

-15-
Note: Arunachal Pradesh has not classified PWD roads into State Highways and District Roads. The length of PWD
roads in the State is reflected under State Highways.
4.5 The State/UT-wise break-up of District Roads as on 31st March, 2016 can be seen in Chart 4.1.
Maharashtra accounted for the largest share in the total length of District roads (19.49%), followed
by U.P (9.50%), Karnataka (8.88%), Tamil Nadu (8.10%) and Andhra Pradesh (6.31%). These five
States accounted for about 52.29% of the total length of District Roads.
35
47
10
57
88 10
63
4
25
30
8
11
73
30
80
9
21
81
72
43
83
91
7
93
10
49
90
9
27
47
0
19
42
9
10
95
31
94
66
50
62
15
80
64
58 14
69
4
69
30 2
25
71
14
15
45
53
8
22
16
01
18
9 47
91
53
37
3
10
44
41
39
83
19
0
89
24
62
0 30
2
0
20000
40000
60000
80000
100000
120000
An
dh
ra P
rades
h
Aru
nac
hal
Pra
des
h
Ass
am
Bih
ar
Ch
hat
tisg
arh
Go
a
Gu
jara
t
Har
yan
a
Him
achal
Pra
des
h
Jam
mu
& K
ash
mir
Jhar
kh
and
Kar
nat
aka
Ker
ala
Mad
hya
Pra
des
h
Mah
aras
htr
a
Man
ipur
Meg
hal
aya
Miz
ora
m
Nag
alan
d
Od
isha
Pun
jab
Raj
asth
an
Sik
kim
Tam
il N
adu
Tel
angan
a
Tri
pu
ra
Utt
arak
han
d
Utt
ar P
rades
h
Wes
t B
engal
An
dam
an &
Nic
ob
ar Is
land
Ch
and
igar
h
Dad
ra &
Nag
ar H
avel
i
Dam
an &
Diu
Del
hi
Lak
shad
wee
p
Pud
uch
erry
Ro
ad
Len
gth
(in
km
s)
State/UTs
Chart 4.1: State/UT-wise Length of District Roads (in kms) as on 31.03.2016

-16-
Section – 5
Rural Roads in India
5.1 Rural Roads connectivity is a key component of rural development, since it promotes access
to economic and social services, thereby generating increased agricultural productivity, non-
agriculture employment as well as non-agricultural productivity, which in turn expands rural growth
opportunities and real income through which poverty can be reduced.
5.2 Rural roads consist of Panchayati Raj roads, (Zilla Parishad, Panchayat Samiti, Gram
Panchayat); roads of the Pradhan Mantri Gram Sadak Yojana (PMGSY) and those constructed by
the State PWDs.
5.3 The total length of Rural Roads as on 31st March, 2016, was 39,35,337 km comprising of
the largest share in the total road network. Out of 39,35,337 km rural roads 18,60,573 kms of
Panchyati Raj Roads were reported by the States/UT Panchayati Raj Departments; 6,26,377.42
kms of PMGSY Roads by the National Rural Road Development Agency (NRRDA) of Ministry of
Rural Development; 5,48,387.01 km by the State PWDs and the remaining 9 lakhs kms (nine lakh
kms) of roads were constructed under the erstwhile Jawahar Rozgar Yojana (JRY) in operation from
1990-1999. The PMGSY of the MoRD is a major scheme for providing all weather rural roads was
launched in 2000. Details in Annexures 5.1 to 5. 4.
5.4 The growth of rural roads since 1950-51 is presented in Chart 5.1
206408
197194
354530
628865
1260430
1972016
2749804
3304328
3337255
3935337
0 500000 1000000 1500000 2000000 2500000 3000000 3500000 4000000 4500000
1950-51
1960-61
1970-71
1980-81
1990-91
2000-01
2010-11
2013-14
2014-15
2015-16
Total Length (in kms)
Yea
r
Chart 5.1: Total Length of Rural Roads in India:
1950-51 to 2015-16

-17-
5.5 As on 31.03.2016, the percentage of surfaced rural roads to the total rural road length
(excluding 9 lakh kms of JRY) was 66.15% (Annexure 5.1).
5.6 The State/UT-wise break-up of Rural Roads (excluding 9 lakh kms of JRY) shows that
Maharashtra accounted for the largest share (13.6%) in 2015-16 followed by Assam (9.6%), Uttar
Pradesh (8.1%), Odisha (7.2%), and Madhya Pradesh (6.7%) (Chart-5.2). These five States accounted
for about 45.1% of the total length of Rural Roads. State-wise details are at Annexures 5.1 to 5.4.
97
66
6
14
50
9
29
19
33
17
53
73
35
04
8
13
30
3
85
98
9
69
74
44
75
5
22
69
8
36
07
6
20
03
89
12
79
85
20
35
42
41
31
46
11
12
1
13
53
4
34
87
26
63
1
21
79
19
70
36
2
17
12
59
47
96
16
52
92
81
64
0
35
04
12
47
55
24
53
96
19
13
54
43
7
0
80
2
21
8
0
20
7
17
02
0
50000
100000
150000
200000
250000
300000
350000
400000
450000
An
dhra
Pra
des
h
Aru
nac
hal
Pra
des
h
Ass
am
Bih
ar
Chh
atti
sgar
h
Go
a
Gu
jara
t
Har
yan
a
Him
ach
al P
rad
esh
Jam
mu
And
Kas
hm
ir
Jhar
khan
d
Kar
nat
aka
Ker
ala
Mad
hy
a P
rad
esh
Mah
aras
htr
a
Man
ipur
Meg
hal
aya
Miz
ora
m
Nag
alan
d
Od
ish
a
Pu
nja
b
Raj
asth
an
Sik
kim
Tam
iln
adu
Tel
angan
a
Tri
pura
Utt
arak
han
d
Utt
ar P
rad
esh
Wes
t B
eng
al
A &
N I
slan
ds
Chan
dig
arh
Dad
ra &
Nag
ar H
avel
i
Dam
an &
Diu
Del
hi
Lak
shad
wee
p
Po
ndic
her
y
Ro
ad
Len
gth
(in
km
s)
State/UTs
Chart 5.2: State/UT-wise Length of Rural Roads in India (in kms)
as on 31.03.2016

-18-
Section – 6
Urban Roads in India
6.1 Urban Roads consist of Municipal Roads under Urban Development Departments of
States and UTs; roads in Railway Zones; MES roads constructed by Military Engineering Services
(MES) and Major and Minor Port Roads. The total length of urban roads increased from 467106 kms
on 31.03.2015 to 509730 kms. on 31.03.2016. Among the category of roads, the share of urban roads
in the total road length has increased from 8.54% in 2014-15 to 9.09% in 2015-16.
6.2 The length of urban roads since 1960-61 is shown in Chart 6.1.
6.3 Within the category of Urban Roads as on 31.03.2016, municipal roads accounted for the
highest share of 94.19%, followed by MES roads (3.35%), railway roads (2.26%) and major and
minor ports roads 0.2%. While comparing the length of minor ports roads as on 31.03.2015 with
that of 31.03.2016, it is seen that the length of minor ports increased by 24.91% from 289 km to
361 km. This is an impetus in the minor ports development. This publication has compiled length
of roads in 70 minor ports (coming under the purview of 10 States/UT). Details of Urban Roads in
Annexures 6.1 to 6.6).
46361
72120
123120
186799
252001
411679
457467
467106
509730
0 100000 200000 300000 400000 500000 600000
1960-61
1970-71
1980-81
1990-91
2000-01
2010-11
2013-14
2014-15
2015-16
Total Length (in kms)
Yea
r
Chart 6.1: Total Length of Urban Roads in India:
1960-61 to 2015-16

-19-
6.4 The length of surfaced urban roads as on 31.03.2016 was 396458 km. which is 77.78% of the
total length of urban roads.
6.5 The State/UT-wise break-up of Urban Roads shows that West Bengal accounted for the largest
share (18.69%) in total length of Urban Roads as on 31st March 2016, followed by U.P. (12.27%),
Karnataka (10.08%), Kerala (6.04%) and Rajasthan (5.40%) (Chart 6.2). These five States accounted
for about 52.48% of the total length of Urban Roads.
24
12
42
66
63
06
88
26
12
24
7
86
5
27
36
0
14
68
0
11
27
16
68 60
03
51
35
7
30
78
8
15
74
1 23
87
0
15
1
17
1
39
5
99
20
84
2
17
53
4
27
54
4
48
24
49
6
10
25
6
60
2
55
73
62
56
5
95
26
7
14
3 25
23
83
14
5
15
08
3
2 98
2
0
20000
40000
60000
80000
100000
120000
An
dh
ra P
rades
h
Aru
nac
hal
Pra
des
h
Ass
am
Bih
ar
Ch
hat
tisg
arh
Go
a
Gu
jara
t
Har
yan
a
Him
achal
Pra
des
h
Jam
mu
And
Kas
hm
ir
Jhar
kh
and
Kar
nat
aka
Ker
ala
Mad
hya
Pra
des
h
Mah
aras
htr
a
Man
ipur
Meg
hal
aya
Miz
ora
m
Nag
alan
d
Od
isha
Pun
jab
Raj
asth
an
Sik
kim
Tam
iln
adu
Tel
angan
a
Tri
pu
ra
Utt
arak
han
d
Utt
ar P
rades
h
Wes
t B
engal
A &
N I
slan
ds
Ch
and
igar
h
Dad
ra
& N
agar
Hav
eli
Dam
an &
Diu
Del
hi
Lak
shad
wee
p
Pon
dic
her
y
Road
Len
gth
(in
km
s)
State/UTs
Chart 6.2 State/UT-wise length of Urban Roads (in kms) as on 31.03.2016
-20-
Section – 7
Project Roads in India
7.1 Project Roads largely include roads built/coming under the purview of Central and
State Government agencies and departments. These include roads of Forest Departments;
Irrigation Departments; Electricity Departments; roads in coal fields and coal mines of Coal
India Ltd., roads under the plant areas of Steel Authority of India Limited (SAIL), National
Mineral Development Corporation (NMDC); Sugarcane Departments of States/UT and Border
Roads Organisation (BRO).
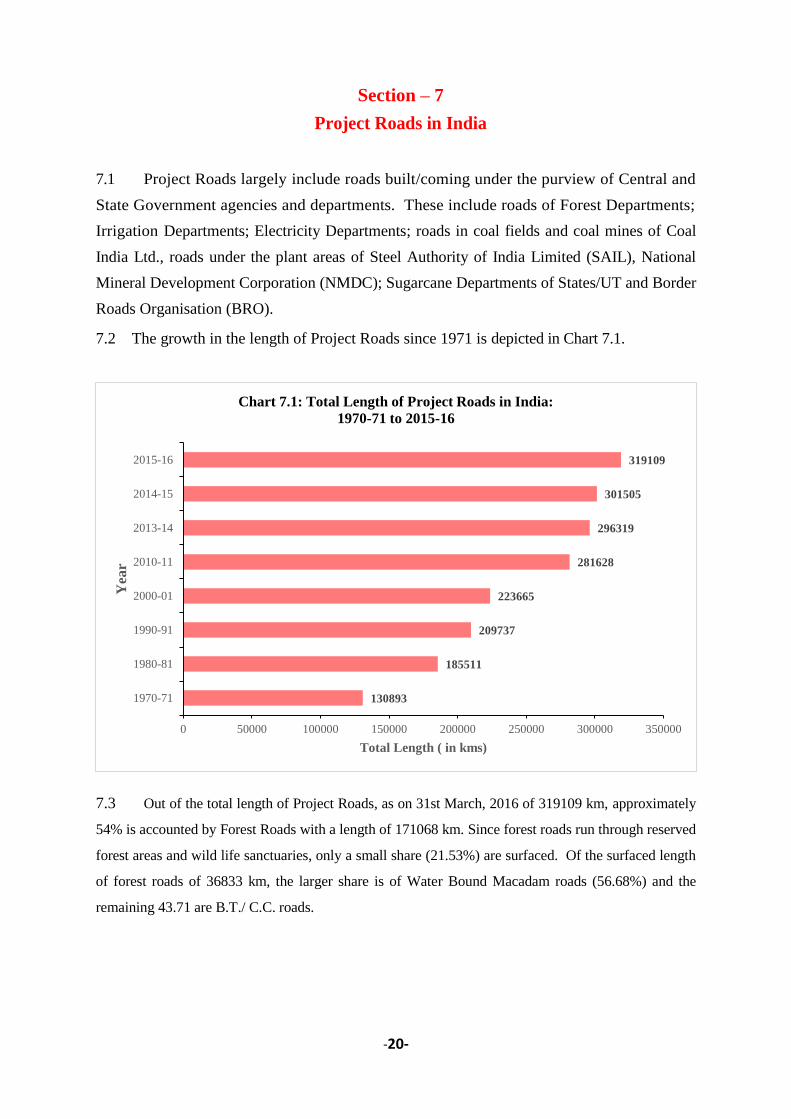
7.2 The growth in the length of Project Roads since 1971 is depicted in Chart 7.1.
7.3 Out of the total length of Project Roads, as on 31st March, 2016 of 319109 km, approximately
54% is accounted by Forest Roads with a length of 171068 km. Since forest roads run through reserved
forest areas and wild life sanctuaries, only a small share (21.53%) are surfaced. Of the surfaced length
of forest roads of 36833 km, the larger share is of Water Bound Macadam roads (56.68%) and the
remaining 43.71 are B.T./ C.C. roads.
130893
185511
209737
223665
281628
296319
301505
319109
0 50000 100000 150000 200000 250000 300000 350000
1970-71
1980-81
1990-91
2000-01
2010-11
2013-14
2014-15
2015-16
Total Length ( in kms)
Yea
r
Chart 7.1: Total Length of Project Roads in India:
1970-71 to 2015-16

-21-
7.4 In terms of total road length of Project Roads, the forest roads were followed by followed by
Irrigation Department Roads (31.31%), BRO Roads (6.69%) and remaining 8% accounted for project
roads under purview of coal fields and mines of Coal India Ltd.; SAIL and NMDC; Sugarcane and
Electricity Departments of States and UTs. Details in Annexures 7.1 to 7.8.
7.5 The State/UT-wise break-up of Project Roads shows that Uttar Pradesh accounted for the
largest share (14.24%) in total length of Project Roads as on 31st March 2016, followed by Madhya
Pradesh (10.10%), Odisha (8.02%), Maharashtra (6.40%) and Assam (5.91%). (Chart7.2). These five
States accounted for about 44.58% of the total length of Project Roads.
51
56
52
82
19
14
2
25
59
15
66
6
18
1
12
81
4
58
9
33
31
18
70
2
11
44
7 17
77
9
84
11
35
10
0
20
43
6
15
77
98
5
10
95
10
54
25
60
3
96
51
98
11
82
0
90
11
40
89
14
00
18
66
4
45
44
8
13
09
6
17
7
0 0 0 0 0 34
0
5000
10000
15000
20000
25000
30000
35000
40000
45000
50000
An
dh
ra P
rades
h
Aru
nac
hal
Pra
des
h
Ass
am
Bih
ar
Ch
hat
tisg
arh
Go
a
Gu
jara
t
Har
yan
a
Him
achal
Pra
des
h
Jam
mu
And
Kas
hm
ir
Jhar
kh
and
Kar
nat
aka
Ker
ala
Mad
hya
Pra
des
h
Mah
aras
htr
a
Man
ipur
Meg
hal
aya
Miz
ora
m
Nag
alan
d
Od
isha
Pun
jab
Raj
asth
an
Sik
kim
Tam
iln
adu
Tel
angan
a
Tri
pu
ra
Utt
arak
han
d
Utt
ar P
rades
h
Wes
t B
engal
A &
N I
slan
ds
Ch
and
igar
h
Dad
ra
& N
agar
Hav
eli
Dam
an &
Diu
Del
hi
Lak
shad
wee
p
Pon
dic
her
y
Ro
ad
Len
gth
in
(k
ms)
State/UTs
Chart 7.2: State/UT-wise Length of Project Roads in India (in kms)
as on 31.03.2016

-22-
Section – 8
International Comparison of Road Network
8.1 As on 31st March 2016, India’s road density at 1.70 kms/sq.km of area was higher
than that of Japan (0.91 km/ sq km), USA (0.68 km/ sq km), China (0.47 km/ sq. km), Brazil (0.18
km/sq.km) and Russian Federation (0.08 km/ sq km) (Table 8.1). The paved/surfaced road length in
India was 61.03 per cent of the total road length which was lower as compared to United Kingdom,
Korea and Russian Federation. National Highways (NHs) in India, accounted for 1.76 % of the total
road network length as on 31st March 2016. Details in Table below.
Table 8.1: Major Road Indicators across Select Countries (2014)
Country
Road
Density
(km/sq km)
Share of
Paved
Road
(%)
Road Length in Kilometer
Total
Highways
Motorways National
Highways
1 2 3 4 5 6
Brazil 0.18 13.6 15,66,415 NA 79,378
(5.08)
China 0.47 NA 44,63,913 1,11,936
(2.51)
85,362
(1.91)
France 1.95 100.0
10,71,176 11,662
(1.09)
8,901
(0.83)
India
(2015-16)
1.70 62.5 56,03,293 NA 1,01,011
(1.80)
Japan 0.91 NA 3,45,828 8,428
(2.44)
51,750
(14.96)
Korea,
Republic
1.06 84.9 1,05,673 4,139
(3.92)
13,950
(13.20)
Russian
Federation
0.08 70.60 14,50,000 NA
NA
United
Kingdom
1.73 100.00 4,21,127 3,760
(0.89)
49,075
(11.65)
United States
of America
0.68 65.90 67,02,178 76,335
(1.13)
27,066
(0.40)
Sources: For India - Transport Research Wing, Ministry of Road Transport & Highways
For all other countries - ‘World Road Statistics 2016’, published by International Road Federation, Geneva.
Figures in columns 2,3 and 4 refer to the calendar year. For India, figures are for financial year. In columns 5
and 6, figures in parentheses indicate the percentage share of the category in total road length.
N.A.: Information not available.

-23-
Section – 9
Initiatives taken by Ministry of Road Transport and Highways for
improving National Highways in the country
National Highways in India
The Ministry of Road Transport and Highways is primarily responsible for development and
maintenance of National Highways through the National Highways Authority of India ltd. and the
National Highways and Infrastructure Development Corporation Ltd.
2. Ministry has been taking efforts to expand and upgrade the network of National Highways.
Through a pro-active sector policy, leveraging both public and private funding; changes of
delegation of authorities for procurement, preparation, review and approval of DPRs; enhanced use
of e-technology; continuous and systematic monitoring, etc., efforts are being made to hasten the
pace of construction of highways.
3. There have been following constraints in the expansion and up gradation of National
Highways:
(i) Availability of land
(ii) Significant increase in land acquisition costs
(iii) Lack of equity with developers
(iv) Too many bottlenecks and checkpoints on NHs- could adversely impact benefits of
GST
(v) Higher cost of financing
(vi) Lesser Traffic growth than expected
(vii) Shortfall in funds for maintenance
4. Sector Policy:
(a) Development and maintenance of road infrastructure is a key Government priority - the
sector has received strong budgetary support over the years.
(b) MoRTH is now empowered to decide on mode of delivery of projects –PPP/EPC. It is
authorized to appraise projects up to Rs. 1,000 crores – both for PPP and EPC mode in
place of earlier Rs. 500 crores.
(c) Enhanced inter-Ministerial coordination: In order to enhance inter-ministerial
coordination, an Infrastructure Group has been created under the Ministry headed by the
Hon’ble Minister (RT&H) to resolve multi-stakeholder issues.

-24-
(d) Due to inadequate project preparation related to land acquisition, utility shifting, obtaining
clearances and approval and shortcomings on part of concessionaires, a number of
projects were languishing in the construction stage. MoRTH and NHAI are regularly
monitoring languishing projects on NHs. Wherever feasible one-time fund infusion by
NHAI is being done to revive languishing projects. For any languishing highway project in
BOT Toll /Annuity mode that has achieved at least 50% physical completion and it is also
established that infusion of moderate funding can quickly bring this project to completion,
NHAI provides financial assistance to such a project. The assistance is on a loan basis at
Bank rate +2%.
(e) To expedite completion of delayed projects various steps have been taken which include
streamlining of land acquisition & environment clearances, exit for equity investors,
premium re-schedulement, close coordination with other Ministries, revamping of dispute
resolution mechanism etc.
5. Details of Central Road Sector Outlay and Expenditure (including private sector investment)
for the 12th Plan is in Table 9.1.
6. Development and maintenance of NHs of 2- lane and below are primarily assigned to State
Governments Viz. State PWDs for which Ministry provide funds from its budget to the
respective States. Table 9.2 gives State-wise allocation and expenditure of funds for the
years from 2013-14 to 2016-17.

-25-
Table 9.1 Central Road Sector Outlay and Expenditure (including private sector investment) - (At Current Price) for 12th Plan
Amount in Rs. Crore
Sl.
No.
Scheme 12th Plan 2014-15 2015-16 2016-17
(2012-17) RE Expd RE Expd RE Expd
1 External Assistance
(a) Externally Aided (RW)
175.00 138.93 250.00 216.42 290.00 289.12
(b) Counterpart Fund (RW)
101.00 101.00 550.00 547.00 820.00 819.76
Total EAP 10,325.00 276.00 239.93 800.00 763.42 1,110.00 1,108.88
2 NH (O) 29,085.00 4,881.59 4,836.10 6,491.06 6,335.44 19,860.00 19,326.46
3 Works under BRDB including
Strategic Roads under BRDB 3,500.00 292.00 268.79 0.00 0.00 0.00 0.00
4 Other Charges & IT 40.00 7.00 3.71 6.50 5.42 8.00 6.93
5 R&D & Training and Quality
Asuurance 100.00 7.00 4.65 68.20 40.90 83.00 16.79
6 Charged Expd. 30.00 6.00 4.93 10.00 6.92 10.00 8.22
7 NHAI (Investment) (Cess) 30,196.00 9,565.81 9,565.42 21,020.09 21,017.77 7,476.60 7,410.47
8 Remittance of toll receipts
(NHDP + non-NHDP) 27,200.00 5,448.00 5,448.00 6,500.00 6,500.00 7,500.00 7,500.00
9 NHAI (ABS for J&K package,
etc.) 8,342.00
10 E&I for States from CRF
1,455.00 150.00 93.11 354.35 267.09 805.00 746.35
E&I for UTs from CRF 0.00 0.00 1.00 0.00 0.00 0.00
11 Rail Cum Road Bridge at Ganga,
Munger (Bihar) 567.00
12 Improvement of Duburi-
Brahmanipal-Harichandanpur-
Naranpur State Road in Odisha
(POSCO)
20.00
13 Special Packages
(i) SARDP-NE 25,400.00 3,000.00 2,843.33 4,900.00 4,803.07 4,520.00 4,460.67
(ii) LWE (including TSP) including
Vijayawada-Ranchi Road 6,509.00 1,174.00 1,164.59 1,121.00 996.11 760.00 739.27
(A) Total (BS) 1,42,769.00 24,807.40 24,472.56 41,272.20 40,736.14 42,132.60 41,324.04
(B) IEBR / Borrowings by NHAI 64,834.00 7,611.11 3,343.40 42,694.50 23,281.00 59,279.00 33,118.00
(C) Grand Total 2,07,603.00 32,418.51 27,815.96 83,966.70 64,017.14 1,01,411.60 74,442.04
Private Sector Investments
(Non-NHDP) 5,765.00
(i) Widening to 2-lanes 5,765.00
(ii) 4-laning of NHs
Private sector Investments
(NHDP) 2,08,421.00
(D) Total Private Sector Investments 2,14,186.00
19,232.44
29,770.00 26,850.00 16,028.64
(E) Grand Total for Central Sector
Roads (incl. Private Sector
Investments) 4,21,789.00 32,418.51 47,048.40 83,966.70 93,787.14 1,28,261.60 90,470.68
Includes Rs. 22,685 crore diverted from NHAI(Investment) to NH(O) & ABS for J&K Package during 2012-17, in view of limited
available resources under NH(O)

-26-
Table 9.2 The State/UT-wise details of funds allocated/utilized for development of NHs during each of the last three years
Sl.
No.
States/UTs/Schemes/Agency
(Sl. 1 to 33 contains
allocation under NH(O),
NHDP-IV through State
PWD, EAP, PBFF)
For Development of NHs
2013-14 2014-15 2015-16 2016-17$
Alloc. Expd. Alloc. Expd. Alloc. Expd. Alloc. Expd.
1 Andhra Pradesh 188.04 187.62 221.45 221.45 1,039.42 1,000.4
3
2,010.3
1 2,014.50
2 Arunachal Pradesh 1.09 1.09 0.50 0.50 2.40 1.83 100.00 90.66
3 Assam 205.10 199.41 141.76 141.76 78.79 78.09 247.44 137.80
4 Bihar 304.57 271.33 276.65 276.65 706.92 707.86 1,395.00 1,331.61
5 Chhattisgarh 43.35 25.29 71.25 71.25 359.94 339.80 1,568.30 1,495.68
6 Goa 20.66 20.66 17.72 17.72 120.00 119.98 700.00 434.51
7 Gujarat 146.54 140.91 206.96 206.96 228.60 225.77 251.87 213.41
8 Haryana 53.51 53.51 60.48 60.48 90.00 89.85 150.00 161.27
9 Himachal Pradesh 100.44 99.74 134.57 134.57 140.00 139.96 250.95 182.14
10 Jammu & Kashmir 0.00 0.00 0.00 0.00 25.00 22.86 50.06 23.16
11 Jharkhand 70.32 70.32 63.83 63.83 35.00 38.08 200.00 212.50
12 Karnataka 165.85 164.55 269.72 269.72 633.43 639.55 833.13 871.96
13 Kerala 272.73 258.84 67.18 67.18 132.24 137.65 279.89 237.80
14 Madhya Pradesh 155.01 150.67 239.23 239.23 937.76 928.29 1,835.00 1,558.90
15 Maharashtra 177.23 177.01 190.04 190.04 431.20 423.28 1,871.92 1,154.00
16 Manipur 54.72 54.39 32.60 32.60 40.00 40.00 30.25 18.65
17 Meghalaya 35.70 33.61 43.30 43.30 15.00 15.00 41.27 28.44
18 Mizoram 22.11 20.57 39.53 39.53 35.00 28.50 30.00 46.13
19 Nagaland 44.65 44.65 46.20 46.20 50.00 46.27 50.00 38.84
20 Odisha 233.22 231.51 322.99 322.99 591.44 592.24 939.96 951.35
21 Punjab 113.78 113.24 2,328.04 2,328.04 1,852.26 1,855.24 2,690.50 2,702.48
22 Rajasthan 215.50 213.85 107.16 107.16 849.95 849.56 991.49 1,012.99
23 Sikkim 0.00 0.00 0.00 0.00 0.00 0.00 0.00 0.00
24 Tamil Nadu 210.24 210.24 167.13 167.13 337.02 336.47 566.00 640.11
25 Telangana 0.00 0.00 210.79 210.79 661.00 657.10 515.00 358.43
26 Tripura 0.00 0.00 0.00 0.00 5.00 0.00 40.00 2.38
27 Uttar Pradesh 289.54 284.35 493.81 493.81 1,530.34 1,527.74 2,584.02 1,820.85
28 Uttarakhand 87.84 85.90 169.51 169.51 245.92 245.69 342.62 314.48
29 West Bengal 134.10 134.10 283.61 283.61 808.95 811.98 1,339.12 1,223.19
30 Andaman & Nicobar Islands 0.00 0.00 14.61 14.61 2.00 1.53 0.13 0.13
31 Chandigarh 0.00 0.00 4.95 4.95 1.00 0.00 2.00 0.69
32 Delhi 0.00 0.00 0.02 0.02 1.00 0.00 2.00 0.62
33 Puducherry 0.00 0.00 12.73 12.73 20.00 18.10 20.00 14.28
34 Other projects under NH(O)* 341.42 341.30 758.05 713.42 511.00 443.44 791.38 787.79
35 National Highways Authority
of India (NHAI)- Cess* 6,857.45 6,857.45 6,885.89 6,885.89 15,420.00
15,420.0
0 2,326.50 2,326.50
36 NHAI- Toll 4,770.00 4,770.00 5,448.00 5,448.00 6,500.00 6,500.00 7,500.00 7,500.00
37 NHAI- NH(O) 944.84 944.82 600.00 600.00 370.27 370.27 5,389.02 5,389.02
38
National Highways &
Infrastructure Development
Corporation Ltd. (NHIDCL)
under NH(O)*
- - - - 1.15 1.15 72.20 72.20
39 Border Roads Organization
(BRO)* 434.00 414.25 292.00 268.79 0.00 0.00 0.00 0.00
40
Special Accelerated Road
Development Programme for
North-East Region (SARDP-
NE) including Arunachal
Package*
2,994.00 3,009.27 3,000.00 2,843.33 4,900.00 4,803.07 4,520.00 4,460.67

-27-
41 Special Programme for
development of Roads In Left
Wing Extremism affected Area
(LWE) including Development
of Vijayawada-Ranchi Road
1,035.00 1,021.02 1,174.00 1,164.59 1,121.00 996.11 760.00 739.27
42 Externally Aided Projects -
Head Quarters# 42.50 0.00 276.00 239.93 22.00 9.25 57.84 56.72
Sub- Total 20,765.05 20,605.47 24,672.26 24,402.27 40,852.00 40,461.99 43,345.16 40,626.11
43 IEBR / Borrowings by NHAI 8,000.00 7,942.13 7,611.11 3,343.40 42,694.50 23,281.00 59,279.00 33,118.00
Grand Total 28,765.05 28,547.60 32,283.37 27,745.67 83,546.50 63,742.99
1,02,624.1
6 73,744.11
*- State/UT wise allocations are not made.
$- Provisional
#-figures for 2013-14 and 2014-15 Include total allocation for NH works also

-28-
ANNEXURE
ROAD LENGTH (TOTAL AND SURFACED)
ALL INDIA AND STATE-WISE

-29-
Annexure 1.1
Total and Surfaced Road Length By Categories in India
As on 31.03.2016 (in km)
Sl.
No. Category Sub Category Total Surfaced (% age)
1 National Highways 101011 101011 (100)
2 State Highways 176166 170237 (96.6)
3 District roads 561940 533493 (94.9)
4 Rural Roads* 3035337 2007777 (66.1)
PMGSY Roads 626377 551132 (88.0)
PWD/RWD Roads 548387 458021 (83.5)
Panchayati Raj Roads 1860573 998624 (53.7)
5 Urban Roads 509730 396458 (77.8)
Municipal Roads 480105 368747 (76.8)
MES Roads 16911 16369 (96.8)
Major Port Roads 836 826 (98.8)
Minor Port Roads 361 340 (94.2)
Railway Roads 11517 10176 (88.4)
6 Project Roads 319109 109727 (34.4)
Forest Department Roads 171068 36833 (21.5)
BRO Roads 21357 18353 (85.9)
Coal Mine Roads 4039 3831 (94.8)
Electricity Department Roads 5137 4766 (92.8)
Irrigation Department Roads 99913 32313 (32.3)
Sugarcane Authorities Roads 14728 10947 (74.3)
SAIL & NMDC Roads 2867 2683 (93.6)
Total* (Excluding JRY Roads) 4703293 3318704 (70.6)
Total** (Including JRY Roads) 5603293 3501906 (62.5)
Note : (1) Totals may not add up due to rounding off of decimals.
(2) * excludes 9 lakh km length of rural roads constructed under Jawahar Rozgar
Yojana (JRY) from 1990-1999.
(3) ** Includes 9 lakh km length of rural roads constructed under Jawahar Rozgar
Yojana (JRY) from 1990-1999.

-30-
Annexure 1.2
Road Length By Categories and By type of Surface in India
As on 31.03.2016 (in km)
Sl.
No. Category
Sub
Category
Total
(6+7)
Surfaced Un-
surfaced WBM/WMM BT/CC Total (4+5)
1 2 3 4 5 6 7
1 National Highways 101011 0 101011 101011 0
2 State Highways 176166 2550 167687 170237 5928
3 District roads 561940 25100 508392 533493 28447
4
Rural Roads (excluding
JRY) 3035337 499438 1508339 2007777 1027560
PMGSY
Roads 626377 78437 472696 551132 75245
PWD/RWD
Roads 548387 64082 393939 458021 90366
Panchayati
Raj Roads 1860573 356920 641704 998624 861949
5 Urban Roads 509730 41706 354752 396458 113272
Municipal
Roads 480105 39979 328768 368747 111358
MES Roads 16911 400 15969 16369 542
Major Port
Roads 836 64 762 826 10
Minor Port
Roads 361 24 316 340 21
Railway
Roads 11517 1239 8937 10176 1341
6 Project Roads 319109 39567 70160 109727 209382
Forest
Department
Roads
171068 20878 15955 36833 134235
BRO Roads 21357 917 17436 18353 3003
Coal Mine
Roads 4039 460 3372 3831 208
Electricity
Department
Roads
5137 1059 3707 4766 371
Irrigation
Department
Roads
99913 16124 16189 32313 67600
Sugarcane
Authorities
Roads
14728 5 10942 10947 3781
SAIL &
NMDC
Roads
2867 124 2559 2683 184
Total (Excluding JRY Roads) 4703293 608362 2710341 3318704 1384590
Total (Including JRY Roads) 5603293 791564 2710341 3501906 2101388
Note: Totals may not add up because of rounding off of decimals.

-31-
Annexure 1.3
Total & Surfaced Length of Roads in India
As on 31.03.2016 (State/UT-wise) (in km)
Sl.No. Name of State/UT Total Surfaced
1 2 3 4
1 Andhra Pradesh 174367 116663
2 Arunachal Pradesh 30692 18348
3 Assam 329520 64572
4 Bihar 206484 123412
5 Chhattisgarh 95809 77069
6 Goa 16063 10990
7 Gujarat 179144 156177
8 Haryana 48482 42399
9 Himachal Pradesh 55759 43680
10 Jammu And Kashmir 49716 34246
11 Jharkhand 66786 58032
12 Karnataka 345515 223050
13 Kerala 200808 142220
14 Madhya Pradesh 289940 240639
15 Maharashtra 613418 478064
16 Manipur 24776 15590
17 Meghalaya 21727 10665
18 Mizoram 8108 7137
19 Nagaland 36114 17138
20 Odisha 288083 264594
21 Punjab 108379 98149
22 Rajasthan 254279 205647
23 Sikkim 8243 6174
24 Tamilnadu 261035 213600
25 Telangana 123572 86166
26 Tripura 39365 20152
27 Uttarakhand 61018 35583
28 Uttar Pradesh 422412 352016
29 West Bengal 316730 130019
30 A & N Islands 1493 1443
31 Chandigarh 2821 2821
32 Dadra & Nagar Haveli 1134 1134
33 Daman & Diu 496 496
34 Delhi 17625 17623
35 Lakshadweep 209 209
36 Pondichery 3174 2789
Total * 4703293 3318704
* Excluding JRY Roads

-32-
Annexure No. 1.4
Total Road Length and Percentage Share of Each Category of Road (1951-2016) (in km)
Year
(as on
31st
March)
National
Highways
State
Highways
Other PWD
Roads
District
Roads
Panchayat
Raj Roads
JRY &
PMGSY
Roads*
Rural
Roads
built by
State PWD
/ RWD
Urban
Roads
Project
Roads
Surfaced Total (Col.
2+3+4+5+6+7
+8+9+10)
1 2 3 4 5 6 7 8 9 10 11 12
1951 19,811 # 1,73,723 2,06,408 0 0 0 1,57,019 3,99,942
4.95 0.00 43.44 51.61 0.00 0.00 0.00 39.26 100
1961 23,798 # 2,57,125 1,97,194 0 46,361 0 2,63,052 5,24,478
4.54 0.00 49.02 37.60 0.00 8.84 0.00 50.16 100
1971 23,838 56,765 2,76,833 3,54,530 0 72,120 1,30,893 3,97,948 9,14,979
2.61 6.20 30.26 38.75 0.00 7.88 14.31 43.49 100
1981 31,671 94,359 4,21,895 6,28,865 0 1,23,120 1,85,511 6,83,676 14,85,421
2.13 6.35 28.40 42.34 0.00 8.29 12.49 46.03 100
1991 33,650 1,27,311 5,09,435 9,31,288 3,29,142 1,86,799 2,09,737 10,90,167 23,27,362
1.45 5.47 21.89 40.01 14.14 8.03 9.01 46.84 100
2001 57,737 1,32,100 7,36,001 10,68,020 9,03,996 2,52,001 2,23,665 16,01,745 33,73,520
1.71 3.92 21.82 31.66 26.80 7.47 6.63 47.48 100
2002 58,112 1,37,711 6,95,335 11,34,326 9,26,697 2,50,295 2,24,124 16,61,555 34,26,600
1.70 4.02 20.29 33.10 27.04 7.30 6.54 48.49 100
2003 58,112 1,34,807 6,96,960 11,55,491 9,26,697 2,97,259 2,59,328 17,01,258 35,28,654
1.65 3.82 19.75 32.75 26.26 8.42 7.35 48.21 100
2004 65,569 1,33,177 7,19,257 11,89,058 9,51,511 3,01,310 2,61,625 17,60,768 36,21,507
1.81 3.68 19.86 32.83 26.27 8.32 7.22 48.62 100
2005 65,569 1,44,396 7,86,230 12,99,463 9,66,976 2,86,707 2,59,815 17,95,298 38,09,156
1.72 3.79 20.64 34.11 25.39 7.53 6.82 47.13 100
2006 66,590 1,48,090 8,03,669 13,18,258 9,89,867 2,91,991 2,62,186 18,58,684 38,80,651
1.72 3.82 20.71 33.97 25.51 7.52 6.76 47.90 100
2007 66,590 1,52,235 8,35,003 13,72,867 10,20,621 3,00,580 2,68,505 19,44,758 40,16,401
1.66 3.79 20.79 34.18 25.41 7.48 6.69 48.42 100
2008 66,754 1,54,522 8,63,241 13,88,750 10,61,809 3,04,327 2,70,189 20,36,063 41,09,592
1.62 3.76 21.01 33.79 25.84 7.41 6.57 49.54 100
2009 70,548 1,58,497 9,62,880 15,14,952 11,14,213 3,73,802 2,76,617 23,24,504 44,71,510
1.58 3.54 21.53 33.88 24.92 8.36 6.19 51.98 100
2010 70,934 1,60,177 9,77,414 15,18,205 11,74,330 4,02,448 2,78,931 24,32,813 45,82,439
1.55 3.50 21.33 33.13 25.63 8.78 6.09 53.09 100
2011 70,934 1,63,898 9,98,895 15,30,366 12,19,438 4,11,679 2,81,628 25,24,682 46,76,838
1.52 3.50 21.36 32.72 26.07 8.80 6.02 53.98 100
2012 76,818 1,64,360 10,22,287 15,87,787 12,50,433 4,64,294 2,99,415 26,98,590 48,65,394
1.58 3.38 21.01 32.63 25.70 9.54 6.15 55.46 100
2013 79,116 1,69,227 10,66,747 17,25,318 14,34,321 4,46,238 3,10,955 31,71,002 52,31,922
1.51 3.23 20.39 32.98 27.41 8.53 5.94 60.61 100
2014 91,287 1,70,818 10,82,267 18,00,747 15,03,581 4,57,467 2,96,319 25,335 54,02,486
1.69 3.16 20.03 33.33 27.83 8.47 5.48 0.47 100
2015 97,991 1,67,109 11,01,178 18,31,043 15,06,212 4,67,106 3,01,505 33,41,008 54,72,144
1.79 3.05 20.25 33.46 27.53 8.54 5.51 61.05 100
2016 (P) 1,01,011 1,76,166 5,61,940 18,60,573 15,26,377 5,48,387 5,09,730 3,19,109 35,01,906 56,03,293
1.80 3.14 10.03 33.20 27.24 9.78 9.10 5.70 62.49 100
# Included in Other PWD Roads. Totals may not add up because of rounding off of decimals.
Note: The second row of each year indicates the percentage share of each category of roads to the total road length.
* Includes roads constructed under PMGSY launched in December 2000 and JRY launched in 1989-90.
JRY road lengths for years since 1996-97 are the same as on 31.3.1996. (P): Provisional

-33-
ANNEXURE
NATIONAL HIGHWAYS
-34-
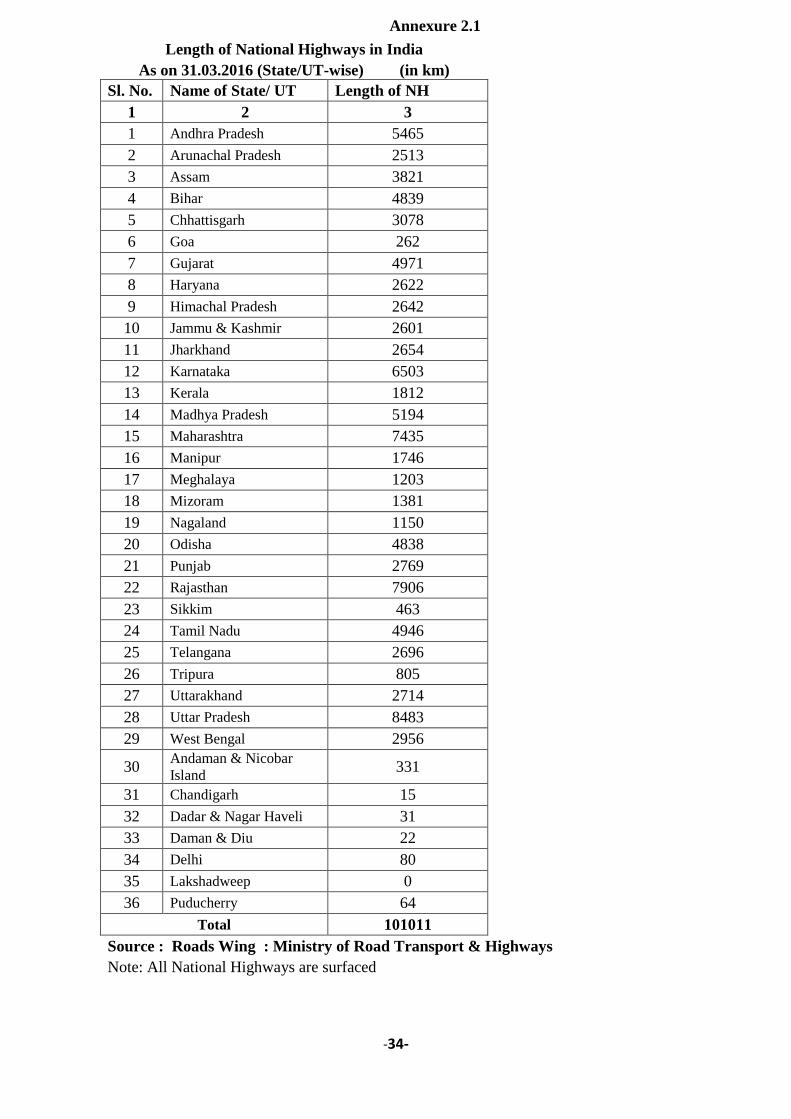
Annexure 2.1
Length of National Highways in India As on 31.03.2016 (State/UT-wise) (in km) Sl. No. Name of State/ UT Length of NH
1 2 3
1 Andhra Pradesh 5465
2 Arunachal Pradesh 2513
3 Assam 3821
4 Bihar 4839
5 Chhattisgarh 3078
6 Goa 262
7 Gujarat 4971
8 Haryana 2622
9 Himachal Pradesh 2642
10 Jammu & Kashmir 2601
11 Jharkhand 2654
12 Karnataka 6503
13 Kerala 1812
14 Madhya Pradesh 5194
15 Maharashtra 7435
16 Manipur 1746
17 Meghalaya 1203
18 Mizoram 1381
19 Nagaland 1150
20 Odisha 4838
21 Punjab 2769
22 Rajasthan 7906
23 Sikkim 463
24 Tamil Nadu 4946
25 Telangana 2696
26 Tripura 805
27 Uttarakhand 2714
28 Uttar Pradesh 8483
29 West Bengal 2956
30
Andaman & Nicobar
Island 331
31 Chandigarh 15
32 Dadar & Nagar Haveli 31
33 Daman & Diu 22
34 Delhi 80
35 Lakshadweep 0
36 Puducherry 64
Total 101011
Source : Roads Wing : Ministry of Road Transport & Highways
Note: All National Highways are surfaced

-35-
Annexure 2.2
Lane wise Length of National Highways in India
As on 31.03.2016 (in km)
Sl. No. Name of State/ UT Total
Length
Less than
Two-Lane
Two-
Lane
Four-Lane
and above
1 2 3 4 5 6
1 Andhra Pradesh 5465 608 2993 1864
2 Arunachal Pradesh 2513 2091 403 19
3 Assam 3821 680 2527 614
4 Bihar 4839 1081 2970 788
5 Chhattisgarh 3078 558 2166 354
6 Goa 262 35 190 37
7 Gujarat 4971 571 2013 2387
8 Haryana 2622 18 1730 874
9 Himachal Pradesh 2642 1101 1524 17
10 Jammu & Kashmir 2601 690 1737 174
11 Jharkhand 2654 357 2022 275
12 Karnataka 6503 1516 3207 1780
13 Kerala 1812 339 1378 95
14 Madhya Pradesh 5194 685 3271 1238
15 Maharashtra 7435 1030 3070 3335
16 Manipur 1746 272 1442 32
17 Meghalaya 1203 666 480 57
18 Mizoram 1381 1161 220 0
19 Nagaland 1150 1062 88 0
20 Odisha 4838 261 3786 791
21 Punjab 2769 174 1859 736
22 Rajasthan 7906 728 4511 2667
23 Sikkim 463 216 247 0
24 Tamil Nadu 4946 125 2766 2055
25 Telangana 2696 319 1458 919
26 Tripura 805 621 184 0
27 Uttarakhand 2714 1983 692 39
28 Uttar Pradesh 8483 844 5224 2415
29 West Bengal 2956 539 1394 1023
30 Andaman & Nicobar Island 331 319 11 1
31 Chandigarh 15 0 0 15
32 Dadar & Nagar Haveli 31 31 0 0
33 Daman & Diu 22 22 0 0
34 Delhi 80 0 0 80
35 Lakshadweep 0 0 0 0
36 Puducherry 64 0 40 24
Total 101011 20703 55603 24705
Source : Roads Wing Ministry of Road Transport & Highways
Note: All National Highways are surfaced.
-36-
ANNEXURE
STATE HIGHWAYS

-37-
Annexure 3.1
Total and Surfaced Length of State Highways in India
As on 31.03.2016 (State/UT-wise) (in km)
Sl.No. Name of State/UT Total Surfaced
1 2 3 4
1 Andhra Pradesh * 6485 6381
2 Arunachal Pradesh $ 8123 4043
3 Assam 2530 2180
4 Bihar 4253 4253
5 Chhattisgarh 4462 4332
6 Goa 279 279
7 Gujarat 17201 16983
8 Haryana 1801 1801
9 Himachal Pradesh 1466 1466
10 Jammu & Kashmir 130 130
11 Jharkhand 1296 1296
12 Karnataka 19578 19554
13 Kerala 4342 4342
14 Madhya Pradesh 10934 10934
15 Maharashtra 39000 38134
16 Manipur 715 715
17 Meghalaya 772 737
18 Mizoram 170 170
19 Nagaland 722 722
20 Odisha 4187 4182
21 Punjab 1133 1133
22 Rajasthan 15188 15108
23 Sikkim 701 701
24 Tamil Nadu 11752 11752
25 Telangana 2731 2731
26 Tripura 329 329
27 Uttarakhand 4521 4484
28 Uttar Pradesh 7147 7147
29 West Bengal 3612 3612
30 Andaman & Nicobar Island 266 266
31 Chandigarh 200 200
32 Dadra & Nagar Haveli 28 28
33 Daman & Diu 22 22
34 Delhi 0 0
35 Lakshadweep 0 0
36 Puducherry 89 89
Total 176166 170237
State Highways are constructed by State PWD/ Roads & Bridges Depts.
Note: $ Figure for Arunachal Pradesh pertain to roads under State PWD. Arunachal Pradesh has not yet made official
classification of State Roads into State Highways, Major District Roads (MDR) and Other District Roads (ODR).
* Figures for Andhra Pradesh are as on 31/03/2015.

-38-
Annexure 3.2
Length of State Highways in India - By Type of Surface
As on 31.03.2016 (State/UT-wise) (in km)
Sl.No. Name of State/UT Total Length
(6+7)
Surfaced Un-surfaced
WBM/WMM BT/CC Total (4+5)
1 2 3 4 5 6 7
1 Andhra Pradesh * 6485 2 6379 6381 104
2 Arunachal Pradesh $ 8123 1286 2757 4043 4080
3 Assam 2530 0 2180 2180 350
4 Bihar 4253 0 4253 4253 0
5 Chhattisgarh 4462 251 4081 4332 130
6 Goa 279 6 274 279 0
7 Gujarat 17201 29 16954 16983 218
8 Haryana 1801 3 1798 1801 0
9 Himachal Pradesh 1466 0 1466 1466 0
10 Jammu & Kashmir 130 0 130 130 0
11 Jharkhand 1296 0 1296 1296 0
12 Karnataka 19578 91 19463 19554 24
13 Kerala 4342 0 4342 4342 0
14 Madhya Pradesh 10934 0 10934 10934 0
15 Maharashtra 39000 517 37617 38134 865
16 Manipur 715 60 655 715 0
17 Meghalaya 772 52 685 737 35
18 Mizoram 170 0 170 170 0
19 Nagaland 722 199 524 722 0
20 Odisha 4187 13 4169 4182 5
21 Punjab 1133 0 1133 1133 0
22 Rajasthan 15188 4 15104 15108 80
23 Sikkim 701 0 701 701 0
24 Tamil Nadu 11752 0 11752 11752 0
25 Telangana 2731 3 2728 2731 0
26 Tripura 329 0 329 329 0
27 Uttarakhand 4521 36 4449 4484 37
28 Uttar Pradesh 7147 0 7147 7147 0
29 West Bengal 3612 0 3612 3612 0
30
Andaman & Nicobar
Island 266 0 266
266 0
31 Chandigarh 200 0 200 200 0
32
Dadra & Nagar
Haveli 28 0 28
28 0
33 Daman & Diu 22 0 22 22 0
34 Delhi 0 0 0 0 0
35 Lakshadweep 0 0 0 0 0
36 Puducherry 89 0 89 89 0
Total 176166 2550 167687 170237 5928
State Highways are constructed by State PWD/ Roads & Bridges Depts.
(2) Note: $ Figure for Arunachal Pradesh pertain to roads under State PWD. Arunachal Pradesh
has not yet made official classification of State Roads into State Highways, Major District Roads
(MDR) and Other District Roads (ODR).
(3) * Figures for Andhra Pradesh are as on 31/03/2015.
(4) Totals may not add up because of rounding off of decimals

-39-
ANNEXURE
DISTRICT ROADS

-40-
Annexure 4.1
Total & Surfaced Length of District Roads
As on 31.03.2016 (State/UT-wise) (in km)
Sl.No. Name of State/UT Total Surfaced
1 2 3 4
1 Andhra Pradesh * 35471 34732
2 Arunachal Pradesh @ 0 0
3 Assam 5788 4376
4 Bihar 10634 10634
5 Chhattisgarh 25308 22458
6 Goa 1173 1172
7 Gujarat 30809 30228
8 Haryana 21817 21739
9 Himachal Pradesh 2438 2438
10 Jammu & Kashmir 3917 3853
11 Jharkhand 9310 9186
12 Karnataka 49909 48853
13 Kerala 27471 27471
14 Madhya Pradesh 19429 19429
15 Maharashtra 109531 99617
16 Manipur 9466 4843
17 Meghalaya 5062 3936
18 Mizoram 1580 1371
19 Nagaland 6458 3682
20 Odisha 14694 14203
21 Punjab 6930 6930
22 Rajasthan 22571 21985
23 Sikkim 1415 660
24 Tamil Nadu 45538 45538
25 Telangana 22160 21562
26 Tripura 1189 1189
27 Uttarakhand 4791 4352
28 Uttar Pradesh 53373 53373
29 West Bengal 10444 10419
30 Andaman & Nicobar Island 139 139
31 Chandigarh 83 83
32 Dadra & Nagar Haveli 190 190
33 Daman & Diu 89 89
34 Delhi 2462 2462
35 Lakshadweep 0 0
36 Puducherry 302 302
Total 561940 533493
Notes: The District Roads comprise Major District Roads & Other District Roads
constructed and maintained by State PWD/ Roads & Bridges Depts.
@ Arunachal Pradesh has not yet made official classification of State Roads into State
Highways, Major District Roads (MDR) and Other District Roads (ODR).
* Figures for Andhra Pradesh are as on 31/03/2015.

-41-
Annexure 4.2
Length of District Roads - By Type of Surface
As on 31.03.2016 (State/UT-wise) (in km)
Sl.No. Name of State/UT Total Length
(6+7)
Surfaced Un-
surfaced
WBM/WMM BT/CC Total
(4+5)
1 2 3 4 5 6 7
1 Andhra Pradesh * 35471 241 34491 34732 739
2 Arunachal Pradesh @ 0 0 0 0 0
3 Assam 5788 0 4376 4376 1412
4 Bihar 10634 0 10634 10634 0
5 Chhattisgarh 25308 2213 20245 22458 2850
6 Goa 1173 1 1172 1172 1
7 Gujarat 30809 293 29935 30228 581
8 Haryana 21817 0 21739 21739 78
9 Himachal Pradesh 2438 215 2223 2438 0
10 Jammu & Kashmir 3917 490 3362 3853 65
11 Jharkhand 9310 170 9016 9186 124
12 Karnataka 49909 1683 47169 48853 1057
13 Kerala 27470 0 27470 27470 0
14 Madhya Pradesh 19429 420 19009 19429 0
15 Maharashtra 109531 15764 83853 99617 9913
16 Manipur 9466 904 3940 4843 4623
17 Meghalaya 5062 196 3740 3936 1126
18 Mizoram 1580 0 1371 1371 209
19 Nagaland 6458 1723 1959 3682 2776
20 Odisha 14694 287 13916 14203 491
21 Punjab 6930 0 6930 6930 0
22 Rajasthan 22571 17 21968 21985 586
23 Sikkim 1415 97 562 660 756
24 Tamil Nadu 45538 0 45538 45538 0
25 Telangana 22160 316 21246 21562 598
26 Tripura 1189 0 1189 1189 0
27 Uttarakhand 4791 64 4287 4352 440
28 Uttar Pradesh 53373 0 53373 53373 0
29 West Bengal 10444 4 10415 10419 25
30 Andaman & Nicobar
Island 139 0 139 139 0
31 Chandigarh 83 0 82 83 0
32 Dadra & Nagar Haveli 190 0 190 190 0
33 Daman & Diu 89 0 89 89 0
34 Delhi 2462 0 2462 2462 0
35 Lakshadweep 0 0 0 0 0
36 Puducherry 302 1 301 302 0
Total 561940 25100 508392 533493 28447
Notes: The District Roads comprise Major District Roads & Other District Roads constructed and maintained by
State PWD/ Roads & Bridges Depts.
Totals may not add up because of rounding off of decimals @ Arunachal Pradesh has not yet made official classification of State Roads into State Highways, Major District Roads
(MDR) and Other District Roads (ODR).
* Figures for Andhra Pradesh are as on 31/03/2015.

-42-
ANNEXURE
RURAL ROADS

-43-
Annexure 5.1
Total & Surfaced Length of Rural Roads
As on 31.03.2016 (State/UT-wise) (in km)
Sl.No. Name of State/UT Total Surfaced
1 2 3 4
1 Andhra Pradesh 97666 48339
2 Arunachal Pradesh 14509 8038
3 Assam 291933 48704
4 Bihar 175373 99476
5 Chhattisgarh 35048 29565
6 Goa 13303 8441
7 Gujarat 85989 76543
8 Haryana 6974 5561
9 Himachal Pradesh 44755 35170
10 Jammu And Kashmir 22698 20328
11 Jharkhand 36076 34158
12 Karnataka 200389 105056
13 Kerala 127985 79090
14 Madhya Pradesh 203542 183817
15 Maharashtra 413146 306755
16 Manipur 11121 6720
17 Meghalaya 13534 4488
18 Mizoram 3487 2995
19 Nagaland 26631 10662
20 Odisha 217919 216259
21 Punjab 70362 69722
22 Rajasthan 171259 131175
23 Sikkim 4796 3562
24 Tamilnadu 165292 123014
25 Telangana 81640 47642
26 Tripura 35041 17351
27 Uttarakhand 24755 18244
28 Uttar Pradesh 245396 222357
29 West Bengal 191354 41505
30 A & N Islands 437 437
31 Chandigarh 0 0
32 Dadra & Nagar Haveli 802 802
33 Daman & Diu 218 218
34 Delhi 0 0
35 Lakshadweep 207 207
36 Pondichery 1702 1375
Total (Excluding JRY Roads) 3035337 2007777
Total (Including JRY Roads) 3935337 2190979
Notes: The Rural Roads comprise of PMGSY, rural roads built by State PWD/RWD & those
constructed by Panchayati Raj Roads

-44-
Annexure 5.2
Length of PMGSY Roads - By type of Surface
As on 31st March 2016 (State/UT-wise) (in km)
S.No Name of State/UT Surfaced Unsurfaced
Total
Length
(6+7)
W.B.M BT/CC Total
(4+5)
1 2 3 4 5 6 7
1 Andhra Pradesh 19384 1597 13119 14715 4669
2 Arunachal Pradesh 6481 1133 5287 6420 61
3 Assam 17628 1597 16000 17598 31
4 Bihar 52775 13392 36644 50036 2739
5 Chhattisgarh 35048 3279 26286 29565 5483
6 Goa 207 24 159 183 24
7 Gujarat 18441 428 12227 12655 5786
8 Haryana 6974 52 5509 5561 1412
9 Himachal Pradesh 14857 1343 11400 12743 2114
10 Jammu And Kashmir 10387 3529 6609 10139 248
11 Jharkhand 21150 6582 12649 19232 1919
12 Karnataka 22847 1025 17597 18623 4224
13 Kerala 6743 859 2499 3358 3385
14 Madhya Pradesh 73661 7420 64839 72260 1401
15 Maharashtra 31012 3215 23838 27054 3959
16 Manipur 7405 1955 4765 6720 685
17 Meghalaya 2203 909 1294 2203 0
18 Mizoram 2852 393 2459 2852 0
19 Nagaland 3638 234 3396 3630 9
20 Odisha 46849 9021 36168 45189 1660
21 Punjab 8926 1514 6773 8286 639
22 Rajasthan 63873 3732 58702 62434 1439
23 Sikkim 4780 539 3015 3553 1226
24 Tamilnadu 17749 1052 12984 14036 3713
25 Telangana 11254 943 9471 10414 840
26 Tripura 6479 1331 3463 4793 1685
27 Uttarakhand 9104 1775 6837 8612 492
28 Uttar Pradesh 74113 4356 48249 52605 21508
29 West Bengal 29270 5005 20390 25395 3875
30 A & N Islands 0 0 0 0 0
31 Chandigarh 0 0 0 0 0
32 Dadra & Nagar Haveli 182 182 0 182 0
33 Daman & Diu 0 0 0 0 0
34 Delhi 0 0 0 0 0
35 Lakshadweep 0 0 0 0 0
36 Pondichery 107 19 69 88 19
Total 626377 78437 472696 551132 75245
Note: Totals may not add up because of rounding off of decimals.

-45-
Annexure 5.3
Length of Rural Roads built by State PWD/RWD - By Type of Surface
As on 31.03.2016 (State/UT-wise) (in km)
Sl.No. Name of State/UT Total
Length
(6+7)
Surfaced Un-surfaced
WBM/WMM BT/CC Total
(4+5)
1 2 3 4 5 6 7
1 Andhra Pradesh
2 Arunachal Pradesh 2783 317 82 399 2383
3 Assam 36544 0 18990 18990 17554
4 Bihar $
5 Chhattisgarh $
6 Goa 3328 34 2625 2659 669
7 Gujarat 23114 499 21622 22121 993
8 Haryana $
9 Himachal Pradesh 28203 5002 17162 22164 6039
10 Jammu & Kashmir 9571 3836 4660 8496 1075
11 Jharkhand 14926 0 14926 14926 0
12 Karnataka $
13 Kerala $
14 Madhya Pradesh 26482 4980 18762 23742 2740
15 Maharashtra 146136 47151 53830 100981 45154
16 Manipur $
17 Meghalaya 2112 70 1073 1142 969
18 Mizoram 635 0 144 144 491
19 Nagaland 3538 431 0 431 3107
20 Odisha $
21 Punjab $
22 Rajasthan 63099 300 60282 60582 2517
23 Sikkim
24 Tamil Nadu $
25 Telangana $
26 Tripura 6037 847 4659 5506 531
27 Uttarakhand 15652 602 9031 9632 6020
28 Uttar Pradesh 163116 0 163035 163035 81
29 West Bengal 1468 0 1426 1426 42
30
Andaman & Nicobar
Island 437 10 427 437 0
31 Chandigarh $
32 Dadra & Nagar Haveli 620 3 617 620 0
33 Daman & Diu 126 0 126 126 0
34 Delhi $
35 Lakshadweep 207 0 207 207 0
36 Puducherry 254 0 254 254 0
Total 548387 64082 393939 458021 90366
Note: This category of roads are built by State PWD/Rural Works Department of States/UTs.
$ This category of Rural Roads built by above agencies does not exist in these States & UTs /alternatively they
have not furnished data.

-46-
Annexure 5.4
Length of Panchayati Raj Roads - By Type of Surface
As on 31.03.2016 (State/UT-wise) (in km)
Sl.
No.
Name of State/UT Total
Length
(6+7)
Surfaced Unsurfaced
W.B.M. BT/CC Total (4+5)
1 2 3 4 5 6 7
1 Andhra Pradesh 78282 10614 23010 33624 44658
2 Arunachal Pradesh 5245 0 1219 1219 4026
3 Assam 237761 8378 3738 12116 225645
4 Bihar 122598 7240 42200 49440 73158
5 Chhatisgarh
6 Goa 9768 1043 4556 5599 4169
7 Gujarat 44434 5640 36127 41767 2667
8 Haryana
9 Himachal Pradesh 1695 72 191 263 1432
10 Jammu & Kashmir 2740 1693 0 1693 1047
11 Jharkhand
12 Karnataka 177542 23059 63374 86433 91109
13 Kerala 121242 15924 59808 75732 45510
14 Madhya Pradesh 103399 0 87815 87815 15584
15 Maharashtra 235998 76527 102193 178720 57278
16 Manipur 3716 0 0 0 3716
17 Meghalaya 9219 460 683 1143 8076
18 Mizoram
19 Nagaland 19455 3141 3461 6602 12853
20 Odisha 171070 171070 0 171070 0
21 Punjab 61436 0 61436 61436 0
22 Rajasthan 44287 3914 4245 8159 36128
23 Sikkim 16 2 7 9 7
24 Tamil Nadu 147543 10155 98823 108978 38565
25 Telangana 70386 13011 24217 37228 33158
26 Tripura 22525 1829 5223 7052 15473
27 Uttarakhand
28 Uttar Pradesh 8167 1020 5697 6717 1450
29 West Bengal 160616 1910 12774 14684 145932
30 A & N Islands
31 Chandigarh
32 Dadra & Nagar Haveli
33 Daman & Diu 92 1 91 92 0
34 Delhi
35 Lakshadweep
36 Puducherry 1341 217 816 1033 308
Total 1860573 356920 641704 998624 861949
Note: Panchayati Raj Roads include Gram Panchayat, Panchayat Samiti & Zilla Parishad Roads

-47-
ANNEXURE
URBAN ROADS
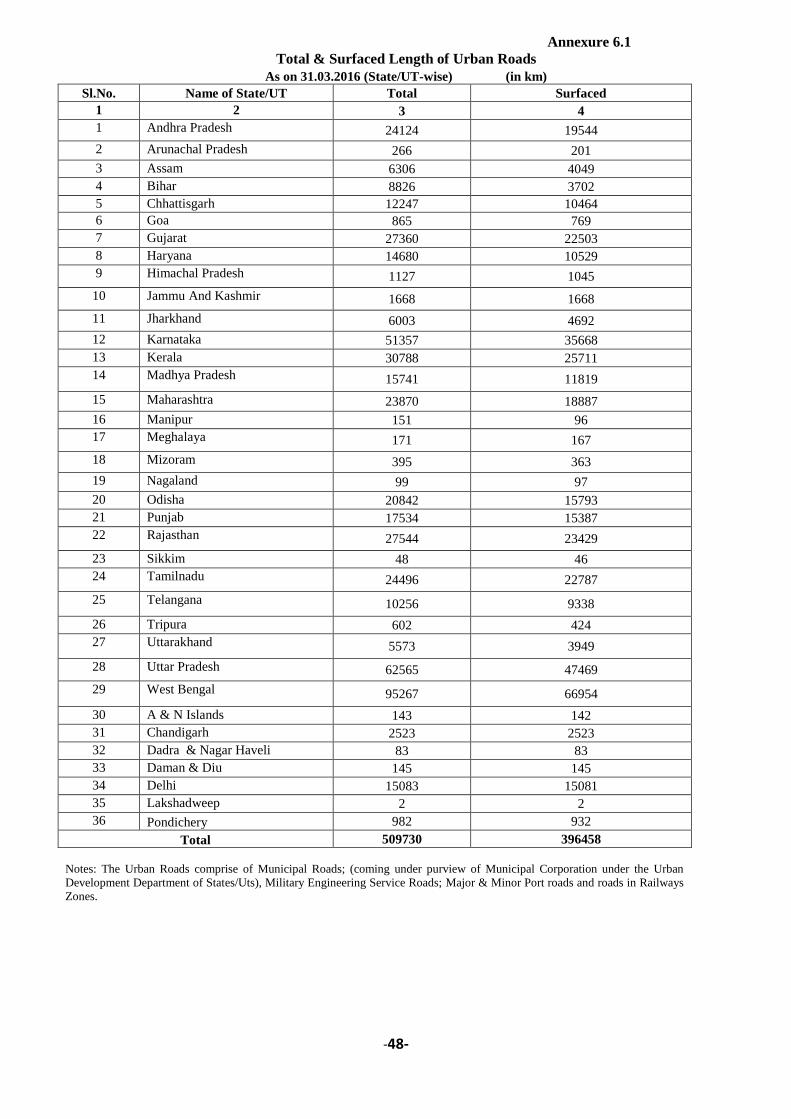
-48-
Annexure 6.1
Total & Surfaced Length of Urban Roads
As on 31.03.2016 (State/UT-wise) (in km)
Sl.No. Name of State/UT Total Surfaced
1 2 3 4
1 Andhra Pradesh 24124 19544
2 Arunachal Pradesh 266 201
3 Assam 6306 4049
4 Bihar 8826 3702
5 Chhattisgarh 12247 10464
6 Goa 865 769
7 Gujarat 27360 22503
8 Haryana 14680 10529
9 Himachal Pradesh 1127 1045
10 Jammu And Kashmir 1668 1668
11 Jharkhand 6003 4692
12 Karnataka 51357 35668
13 Kerala 30788 25711
14 Madhya Pradesh 15741 11819
15 Maharashtra 23870 18887
16 Manipur 151 96
17 Meghalaya 171 167
18 Mizoram 395 363
19 Nagaland 99 97
20 Odisha 20842 15793
21 Punjab 17534 15387
22 Rajasthan 27544 23429
23 Sikkim 48 46
24 Tamilnadu 24496 22787
25 Telangana 10256 9338
26 Tripura 602 424
27 Uttarakhand 5573 3949
28 Uttar Pradesh 62565 47469
29 West Bengal 95267 66954
30 A & N Islands 143 142
31 Chandigarh 2523 2523
32 Dadra & Nagar Haveli 83 83
33 Daman & Diu 145 145
34 Delhi 15083 15081
35 Lakshadweep 2 2
36 Pondichery 982 932
Total 509730 396458
Notes: The Urban Roads comprise of Municipal Roads; (coming under purview of Municipal Corporation under the Urban
Development Department of States/Uts), Military Engineering Service Roads; Major & Minor Port roads and roads in Railways
Zones.

-49-
Annexure 6.2
Length of Municipal Roads – By Type of Surface
As on 31.03.2016 (State/UT-wise) (in km)
Sl.No.
Name of State/UT
Total
Length
(6+7)
Surfaced Unsurfaced
WBM/WMM BT/CC Total
(4+5)
Total
1 2 3 4 5 6 7
1 Andhra Pradesh * 22988 3910 14529 18439 4549
2 Arunachal Pradesh # 168 4 101 105 63
3 Assam 4729 620 1890 2510 2219
4 Bihar @ 8537 1112 2375 3487 5050
5 Chhattisgarh 11846 1000 9092 10092 1754
6 Goa 631 81 454 535 95
7 Gujarat 26111 2939 18315 21254 4857
8 Haryana 13747 594 9114 9708 4039
9 Himachal Pradesh 645 0 645 645 0
10 Jammu & Kashmir @ 441 2 439 441 0
11 Jharkhand $ 5335 346 3717 4063 1271
12 Karnataka 50343 6837 27833 34670 15673
13 Kerala 30332 3394 21937 25331 5001
14 Madhya Pradesh 14175 1896 8417 10313 3862
15 Maharashtra 20958 4095 12382 16477 4481
16 Manipur @ 122 22 46 68 54
17 Meghalaya @ 30 0 26 26 4
18 Mizoram ** 380 2 349 351 29
19 Nagaland 0
20 Odisha 19896 3938 10957 14896 5000
21 Punjab 15183 1023 12055 13078 2105
22 Rajasthan @ 24986 1867 19179 21046 3940
23 Sikkim 48 0 46 46 2
24 Tamil Nadu 23350 773 20939 21712 1638
25 Telangana @@ 9103 82 8105 8187 917
26 Tripura 518 115 257 372 146
27 Uttarakhand ## 4797 363 2815 3178 1618
28 Uttar Pradesh 59960 0 45220 45220 14740
29 West Bengal @ 92963 4831 59928 64759 28204
30 Andaman & Nicobar Islands@ 42 0 42 42 0
31 Chandigarh 2334 0 2334 2334 0
32 Dadra & Nagar Haveli **** 83 0 83 83 0
33 Daman & Diu 45 0 45 45 0
34 Delhi *** 14317 0 14317 14317 0
35 Lakshadweep ^ 0 0 0 0 0
36 Puducherry 964 132 785 917 47
Total 480105 39979 328768 368747 111358
Source: State & UT Urban Departments.
* The total is for all 110 Municipalities of Andhra Pradesh.
** Mizoram has only one Municipal Corporation – Aizwal Municipal Corporation. The road under this Corporation is
under purview of PWD.
*** This data is for North, South & New Delhi Municipal Corporations.
**** D&N Haveli has only one municipality – Silvasa Municipal Council
$ The Jharkhand data covers all 40 Urban local bodies.
^ There are no Municipalities in Lakshadweep. The data is therefore nil.
@Figure is as on 31/03/2015- Data not received.
@@ includes data for only Greater Hyderabad Municipal Corporation.
# The figure for Arunachal Pradesh includes only Itanagar Municipal Council.
### The figure Uttarakhand includes only Municipalities of Nanital,Bageshwar,PauriGarhwal, Chamoli.

-50-
Annexure No. 6.3
Length of Military Engineering Service Roads - By Type of Surface
As on 31.03.2016 (State/UT-wise) (in km)
Sl. No. Name of State/UT Total
Length
(6+7)
Surfaced Unsurfaced
W.B.M. B.T./C.C Total
(4+5)
1 2 3 4 5 6 7
1 Andhra Pradesh 318 0 318 318 0
2 Arunachal Pradesh 94 94 94 0
3 Assam 976 1 969 970 6
4 Bihar 51 0 51 51 0
5 Chhattisgarh 0 0 0 0 0
6 Goa 124 0 124 124 0
7 Gujarat 998 0 998 998 0
8 Haryana 499 0 484 484 15
9 Himachal Pradesh 185 1 180 181 4
10 Jammu & Kashmir 1174 51 1123 1174 0
11 Jharkhand 123 0 123 123 0
12 Karnataka 632 45 585 630 2
13 Kerala 307 0 235 235 72
14 Madhya Pradesh 903 0 903 903 0
15 Maharashtra 1838 0 1500 1500 338
16 Manipur 25 0 25 25 0
17 Meghalaya 139 10 129 139 0
18 Mizoram 7 0 7 7 0
19 Nagaland 87 0 87 87 0
20 Odisha 197 0 197 197 0
21 Punjab 2073 0 2072 2072 1
22 Rajasthan 1703 53 1551 1604 99
23 Sikkim 0 0 0 0 0
24 Tamil Nadu 477 37 440 477 0
25 Telangana 434 62 372 434 0
26 Tripura 21 0 21 21 0
27 Uttarakhand 753 14 736 750 3
28 Uttar Pradesh 859 16 843 859 0
29 West Bengal 970 14 954 968 2
30
Andaman & Nicobar
Islands 90 0 90 90 0
31 Chandigarh 189 0 189 189 0
32 Dadra Nagar Haveli 0 0 0 0 0
33 Daman & Diu 92 0 92 92 0
34 Delhi 571 96 475 571 0
35 Lakshadweep 2 0 2 2 0
36 Pondicherry 0 0 0 0 0
Total 16911 400 15969 16369 542
Source: Directorate of Works, Engineering in Chief's Branch, Integrated HQ of MoD (Army).

-51-
Annexure 6.4
Length of Roads in Major Ports - By Type of Surface
As on 31.03.2016 (State/UT-wise) (in km)
States/UTs Major Port Trusts Total
Length
(6+7)
Surfaced Unsurfaced
W.B.M. B.T./C.C Total
(4+5)
1 2 3 4 5 6 7
Andhra
Pradesh Visakhapatanam 103 3 100 103 0
Goa Mormugoa 25 0 25 25 0
Gujarat Kandla 97 0 97 97 0
Karnataka New Mangalore 47 3 44 47 0
Kerala Cochin 36 5 31 36 0
Maharashtra
Jawaharlal Nehru
Port Trust 64 0 56 56 8
Mumbai Port Trust 67 0 67 67 0
Odisha Paradeep 121 4 115 119 2
Tamil Nadu
Chennai Port 30 2 28 30
Kamrajar Port
(Ennore Port Trust) 14 0 14 14 0
Tuticorin 78 0 78 78 0
West Bengal Kolkata Port 50 47 3 50 0
Haldia Dock 104 0 104 104 0
Total 836 64 762 826 10
Source: Individual Port Trusts

-52-
Annexure 6.5
Length of Minor Ports - By Type of surface
As on 31/03/2016 (State/UT-wise) (in km)
Name of
State/UT
Name of the Ports Total
Length
(6+7)
Surfaced Unsurfaced
W.B.M. B.T./C.C Total
(4+5)
1 2 3 4 5 6 7
Andhra Pradesh
Bhavanapadu
18 0 18 18 0 Kakinada
Machilipatnam
Nizampatnam
Goa
Tiracol
80 0 80 80 0
Chapora
Panajim
Betul
Talpona
Gujarat
Jakhau
154 7 147 154 0
Mandavi
Mundra
Navalakhi
Okha
Bedi
Rozi
Porbandar
Veraval
Jafrabad
Victor
Alang Ship Breaking
Yard
Bhavnagar
Dahej
Surat
Madalla
Dumas
Dholai
Onjal
Kosamba
Kerala
Vizhinjam
12 0 12 12 0
Valiyathura
Kollam
Kochupilamooodu
Neendakara
Sakthikulangara
Pullikkada
Alappuzha
Kodungallur
Kayamkulam
Ponnani
Thalassery
Azhikkal
Kasaragod
Beypore
Kannur

-53-
contd. Annexure 6.5
Name of
State/UT
Name of the Ports Total
Length
(6+7)
Surfaced Unsurfaced
W.B.M. B.T./C.C Total
(4+5)
1 2 3 4 5 6 7
Karnataka
Karwar
15 0 15 15 0
Old Mangalore
Belekeri
Honnavar
Bhatkal
Hangarakatta
Malpe
Tadadi
Padubidri
Kundapura
Odisha
Gopalpur 46 13 16 29 17
Dhamara
A & N Islands
Port Blair
11 3 7 10 1
Campbell Bay
Hut Bay
Rangat Bay
Car nicobar
Daman & Diu
Daman 8 0 8 8 0
Diu
Puducherry
Pondicherry 17 1 13 14 3
Karaikal
Tamil Nadu *
Cuddalore
0 0 0 0 Nagapattinam
Rameswaram
Colachel
Total 361 24 316 340 21
Source: State Maritime Boards incharge of Minor Ports
* The roads under minor ports in Tamil Nadu are not under the purview of the state maritime bords but are under National
Highways and State Highways.

-54-
Annexure No. 6.6
Length of Roads in Railway Zones - By Type of Surface in India
As on 31.03.2016 (State/UT-wise) (in kms)
Sl. No. Name of State/UT Total
Length
(6+7)
Surfaced Unsurfaced
W.B.M. B.T./C.C Total
(4+5)
1 2 3 4 5 6 7
1 Andhra Pradesh 697 53 613 666 31
2 Arunachal Pradesh 4 0 2 2 2
3 Assam 601 37 532 569 32
4 Bihar 238 18 146 164 74
5 Chhattisgarh 401 38 334 372 29
6 Goa 5 0 5 5 0
7 Gujarat 0 0 0 0 0
8 Haryana 434 19 318 337 97
9 Himachal Pradesh 297 3 216 219 78
10 Jammu & Kashmir 53 0 53 53 0
11 Jharkhand 545 97 409 506 39
12 Karnataka 320 48 258 306 14
13 Kerala 101 11 86 97 4
14 Madhya Pradesh 663 111 492 603 60
15 Maharashtra 943 143 644 787 156
16 Manipur 4 2 1 3 1
17 Meghalya 2 0 2 2 0
18 Mizoram 8 2 3 5 3
19 Nagaland 12 1 9 10 2
20 Odisha 582 66 486 552 30
21 Punjab 278 42 195 237 41
22 Rajasthan 855 118 661 779 76
23 Sikkim 0 0 0 0 0
24 Tamil Nadu 547 82 394 476 71
25 Telangana 719 51 666 717 2
26 Tripura 63 14 17 31 32
27 Uttarakhand 23 1 20 21 2
28 Uttar Pradesh 1746 102 1288 1390 356
29 West Bengal 1180 168 905 1073 107
30 Andaman & Nicobar
Islands
0 0 0 0 0
31 UT Chandigarh 0 0 0 0 0
32 Dadra & Nagar
Haveli
0 0 0 0 0
33 Daman & Diu 0 0 0 0 0
34 Delhi 195 12 181 193 2
35 Lakshadweep 0 0 0 0 0
36 Puducherry 1 0 1 1 0
Total 11517 1239 8937 10176 1341
Source : Data based on Railway Zones which had reported.
1: Figures for North Western and North Central Railway are as on 31.3.2012
2: Figures for East Central Railway is as on 31.3.2008
3:Figures for Central Railway is as on 31.3.2006
4: Figures for Northern Railway is as on 31.3.2004
-55-
ANNEXURE
PROJECT ROADS

-56-
Annexure 7.1
Total & Surfaced Length of Project Roads
As on 31.03.2016 (State/UT-wise) (in km)
Sl.No. Name of State/UT Total Surfaced
1 2 3 4
1 Andhra Pradesh 5156 2202
2 Arunachal Pradesh 5282 3553
3 Assam 19142 1442
4 Bihar 2559 508
5 Chhattisgarh 15666 7172
6 Goa 181 66
7 Gujarat 12814 4948
8 Haryana 589 146
9 Himachal Pradesh 3331 919
10 Jammu And Kashmir 18702 5667
11 Jharkhand 11447 6046
12 Karnataka 17779 7417
13 Kerala 8411 3795
14 Madhya Pradesh 35100 9446
15 Maharashtra 20436 7235
16 Manipur 1577 1469
17 Meghalaya 985 134
18 Mizoram 1095 857
19 Nagaland 1054 825
20 Odisha 25603 9319
21 Punjab 9651 2208
22 Rajasthan 9811 6044
23 Sikkim 820 742
24 Tamilnadu 9011 5563
25 Telangana 4089 2197
26 Tripura 1400 53
27 Uttarakhand 18664 1841
28 Uttar Pradesh 45448 13187
29 West Bengal 13096 4572
30 A & N Islands 177 128
31 Chandigarh 0 0
32 Dadra & Nagar Haveli 0 0
33 Daman & Diu 0 0
34 Delhi 0 0
35 Lakshadweep 0 0
36 Pondichery 34 26
Total 319109 109727
Notes: The Project Roads comprise of Forest Roads, roads of Border Roads Organisation,
Coal Departments, Electricity, Irrigation, Sugarcane Department and of Steel Authority of
India Limited and National Mineral Development Corporation.

-57-
Annexure 7.2
Length of Roads under Forest Departments - By Type of Surface in India
As on 31.03.2016 (State/UT-wise) (in km)
Sl.N
o
Name of State/UT Total Length
(6+7)
Surfaced Unsurfaced
W.B.M. B.T./C.C Total (4+5)
1 2 3 4 5 6 7
1 Andhra Pradesh * 4096 1247 63 1311 2785
2 Arunachal Pradesh 1034 7 40 48 987
3 Assam 17307 392 686 1078 16229
4 Bihar * 2030 0 0 0 2030
5 Chhattisgarh 10868 5055 0 5055 5813
6 Goa * 181 17 49 66 115
7 Gujarat 3879 578 2052 2630 1248
8 Haryana * 459 2 14 16 443
9 Himachal Pradesh 2254 0 26 26 2228
10 Jammu & Kashmir 11461 0 76 76 11385
11 Jharkhand 9442 1729 2470 4199 5243
12 Karnataka 7477 477 404 881 6596
13 Kerala 4730 870 471 1341 3389
14 Madhya Pradesh 29798 2208 4946 7154 22644
15 Maharashtra 12664 3585 340 3925 8739
16 Manipur
17 Meghalaya 678 0 4 4 674
18 Mizoram 42 6 12 18 24
19 Nagaland * 289 0 102 102 187
20 Odisha 7575 1074 117 1191 6384
21 Punjab 707 0 0 0 707
22 Rajasthan 5260 341 1578 1919 3340
23 Sikkim 6 0 4 4 2
24 Tamil Nadu 3351 833 799 1632 1719
25 Telangana * 2252 611 160 771 1481
26 Tripura * 1346 11 11 1334
27 Uttarakhand 16993 0 454 454 16539
28 Uttar Pradesh 8510 984 657 1641 6869
29 West Bengal 6203 751 400 1151 5052
30 Andaman &
Nicobar Islands
177 110 18 128 49
31 UT Chandigarh
32 Dadra & Nagar
Haveli
33 Daman & Diu
34 Delhi
35 Lakshadweep
36 Puducherry
Total 171068 20878 15955 36833 134235
Source : State Departments of Forests
* For Andhra Pradesh,Bihar, Goa, Nagaland, Tripura,Haryana and Telangana, the length is as on 31.03.2015
Blank cells refer to States and UTs who have not furnished data or have insignificant or nil forest roads

-58-
Annexure7.3
Length of Roads under Border Roads Organisation - By Type of Surface in India
As on 31.03.2016 (State/UT-wise) (in km)
Sl.No Name of
State/UT
Total
Length
(6+7)
Surfaced Unsurfaced
W.B.M. B.T./C.C Total (4+5)
1 2 3 4 5 6 7
1 Andhra Pradesh
2
Arunachal
Pradesh
4248 129 3377 3505 742
3 Assam 215 0 194 194 21
4 Bihar
5 Chhattisgarh
6 Goa
7 Gujarat
8 Haryana
9
Himachal
Pradesh
985 43 780 822 163
10
Jammu &
Kashmir
6819 438 5020 5458 1362
11 Jharkhand
12 Karnataka
13 Kerala
14 Madhya Pradesh
15 Maharashtra
16 Manipur 1577 27 1442 1469 107
17 Meghalaya
18 Mizoram 1053 22 817 839 215
19 Nagaland 765 36 687 723 42
20 Odisha
21 Punjab 252 4 249 252 0
22 Rajasthan 3312 0 3254 3254 59
23 Sikkim 814 88 650 738 76
24 Tamil Nadu
25 Telangana
26 Tripura 54 21 21 42 12
27 Uttarakhand 1089 111 774 885 205
28 Uttar Pradesh
29 West Bengal 174 0 174 174 0
30
Andaman &
Nicobar Islands
31 UT Chandigarh
32
Dadra & Nagar
Haveli
33 Daman & Diu
34 Delhi
35 Lakshadweep
36 Puducherry
Total 21357 917 17436 18353 3003
Source : DG Border Roads Blank Cells refer to States and UTs who have nil BRO roads
Note: Totals may not add up because of rounding off of decimals.

-59-
Annexure 7.4
Length of Roads under coal fields/ coal units of Coal India Limited - By Type of Surface
on 31.03.2016 (State/UT-wise) ( in km)
Sl.No. Name of States/UTs Total
Length
(6+7)
Surfaced Unsurfaced
(Names of Coal Fields) W.B.M. B.T./C.C Total
(4+5)
1 2 3 4 5 6 7
1 Andhra Pradesh
2 Arunachal Pradesh
3 Assam 51 2 42 44 7
i. North Eastern
Coalfields, Margherita-
Tinsukia
4 Bihar
5 Chhattisgarh
i. South Eastern Coal
Fields, Bilaspur 801 76 692 768 33
6 Goa
7 Gujarat
8 Haryana
9 Himachal Pradesh
10 Jammu & Kashmir
11 Jharkhand
i Bharat Coking Coal
Ltd., Dhanbad 544 46 417 463 82
ii Eastern Coal Fields
Ltd. 52 14 26 40 12
iii Central Coal Fields,
Ranchi 674 41 623 664 10
12 Karnataka
13 Kerala
14 Madhya Pradesh
i Western Coal Fields 207 11 196 207 0
ii Northern Coal fields
Ltd. Singarauli
15 Maharashtra
i . Western Coal Fields
Ltd, Nagpur 520 169 310 478 42
16 Manipur
17 Meghalaya
18 Mizoram
19 Nagaland
20 Odisha
i
Mahanadi Coal Fields.
Sambalpur
21 Punjab
22 Rajasthan
23 Sikkim

-60-
24 Tamil Nadu
25
Telangana
i Singareni Coal field,
Kothagudem, Bhadradri
Dist. 906 70 833 903 3
26 Tripura
27 Uttarakhand
28 Uttar Pradesh
29 West Bengal
i Eastern Coalfields
Limited, Burdwan 284 31 234 265 18
30 Andaman & Nicobar
Islands
31 UT Chandigarh
32 Dadra & Nagar Havelli
33 Daman & Diu
34 Delhi
35 Lakshadweep
36 Puducherry
Total 4039 460 3372 3831 208
Note: Western Coal fields are located in Maharashtra and in Madhya Pradesh.
Eastern Coal Fields are located in Jharkhand & in West Bengal.
Note: Totals may not add up because of rounding off of decimals.

-61-
Annexure 7.5
Length of Roads under Electricity Departments of States/UTs - By Type of Surface in India
As on 31.03.2016 (in km)
Sl.No Name of State/UT Total
Length
(6+7)
Surfaced Unsurfaced
W.B.M. B.T./C.C Total (4+5)
1 2 3 4 5 6 7
1 Andhra Pradesh * 204 52 149 201 3
2 Arunachal Pradesh
3 Assam 113 21 77 98 15
4 Bihar * 529 148 360 508 21
5 Chhattisgarh 169 27 140 167 2
6 Goa
7 Gujarat 167 37 116 153 14
8 Haryana 130 9 121 130 0
9 Himachal Pradesh * 92 29 42 71 21
10 Jammu & Kashmir
11 Jharkhand 174 35 139 174 0
12 Karnataka 169 26 129 155 14
13 Kerala 252 47 186 233 19
14 Madhya Pradesh 756 304 398 702 54
15 Maharashtra
16 Manipur
17 Meghalaya 132 6 111 117 15
18 Mizoram
19 Nagaland
20 Odisha * 70 37 31 68 2
21 Punjab 449 28 393 421 28
22 Rajasthan 388 11 375 386 2
23 Sikkim
24 Tamil Nadu 812 208 528 736 76
25 Telangana 128 22 89 111 17
26 Tripura
27 Uttarakhand * 164 4 143 147 17
28 Uttar Pradesh 23 0 19 19 4
29 West Bengal 216 8 161 169 47
30 Andaman & Nicobar Islands
31 UT Chandigarh
32 Dadra & Nagar Haveli
33 Daman & Diu
34 Delhi
35 Lakshadweep
36 Puducherry
Total 5,137 1,059 3,707 4,766 371
Source : State Departments of Electricity
*Andhra Pradesh, Bihar, Himachal Pradesh, Odisha and Uttarakhand, the length is as on 31.03.2015
Blank cells refer to States and UTs who have not furnished data or have
insigificant or nil electricity roads
.

-62-
Annexure 7.6
Length of Roads under Irrigation Departments of States/Uts - By Type of Surface in India
As on 31.03.2016 (in km)
Sl.No Name of State/UT Total
Length
(6+7)
Surfaced Unsurfaced
W.B.M. B.T./C.C Total (4+5) Total
1 2 3 4 5 6 7
1 Andhra Pradesh * 848 434 249 683 165
2 Arunachal Pradesh
3 Assam 1,456 18 11 29 1,427
4 Bihar
5 Chhattisgarh * 3,023 111 296 407 2,616
6 Goa
7 Gujarat * 8,768 1,340 825 2,165 6,603
8 Haryana
9 Himachal Pradesh
10 Jammu & Kashmir * 422 133 0 133 289
11 Jharkhand
12 Karnataka * 9,731 4,425 1,825 6,250 3,481
13 Kerala 3,429 631 1,590 2,221 1,208
14 Madhya Pradesh * 4,296 753 603 1,356 2,940
15 Maharashtra 7,234 1,804 1,017 2,821 4,413
16 Manipur
17 Meghalaya 175 6 7 13 162
18 Mizoram
19 Nagaland
20 Odisha * 17,387 4,429 3,113 7,542 9,845
21 Punjab 8,243 66 1,469 1,535 6,708
22 Rajasthan 851 131 354 485 366
23 Sikkim
24 Tamil Nadu 3,086 322 1,111 1,433 1,653
25 Telangana 803 109 303 412 391
26 Tripura
27 Uttarakhand 406 18 325 343 63
28 Uttar Pradesh * 24,169 119 2,175 2,294 21,875
29 West Bengal 5,586 1,275 916 2,191 3,395
30
Andaman & Nicobar
Islands
31 UT Chandigarh
32
Dadra & Nagar Haveli
33 Daman & Diu
34 Delhi
35 Lakshadweep
36 Puducherry
Total 99,913 16,124 16,189 32,313 67,600
Source : State Departments of Irrigation
*: For Andhra Pradesh, Chhattisgarh, Gujarat, J&K, Karnataka, M.P, Odisha and U.P the length is as on 31.03.2015
Blank cells refer to States and UTs who have not furnished data or have insigificant or nil irrigation roads

-63-
Annexure 7.7
Length of Roads under Sugarcane Departments of States/UTs
By Type of Surface in India As on 31.03.2016 (in km)
Sl.No Name of State/UT Total
Length
(6+7)
Surfaced Unsurfaced
W.B.M
.
B.T./C.C Total (4+5)
1 2 3 4 5 6 7
1 Andhra Pradesh
2 Arunachal Pradesh
3 Assam
4 Bihar
5 Chhattisgarh
6 Goa
7 Gujarat
8 Haryana
9 Himachal Pradesh
10 Jammu & Kashmir
11 Jharkhand
12 Karnataka 260 0 0 0 260
13 Kerala
14 Madhya Pradesh
15 Maharashtra
16 Manipur
17 Meghalaya
18 Mizoram
19 Nagaland
20 Odisha
21 Punjab
22 Rajasthan
23 Sikkim
24 Tamil Nadu 1,676 0 1,676 1,676 0
25 Telangana
26 Tripura
27 Uttarakhand 12 0 12 12 0
28 Uttar Pradesh 12,746 0 9,233 9,233 3,513
29 West Bengal
30 A & Nicobar Islands
31 UT Chandigarh
32 Dadra & Nagar Haveli
33 Daman & Diu
34 Delhi
35 Lakshadweep
36 Puducherry * 34 5 21 26 8
Total 14,728 5 10,942 10,947 3,781
Source : State Sugarcane Departments
*: For Puducherry the length is as on 31st March 2015
Blank cells refer to States and UTs who have not furnished data or have insignificant or nil Sugarcane
authority roads

-64-
Annexure 7.8
Length of Roads under SAIL & NMDC - By Type of Surface in India
As on 31.03.2016 (in km)
Sl.No Name of State/UT Total
Length
(6+7)
Surfaced Unsurfaced
W.B.M. B.T./C.C Total
(4+5)
1 2 3 4 5 6 7
1 Andhra Pradesh 8 1 6 7 1
2 Arunachal Pradesh
3 Assam
4 Bihar
5 Chhattisgarh 805 10 765 775 30
6 Goa
7 Gujarat
8 Haryana
9 Himachal Pradesh
10 Jammu & Kashmir
11 Jharkhand 560 25 482 507 53
12 Karnataka 142 14 117 131 11
13 Kerala
14 Madhya Pradesh 43 13 14 27 16
15 Maharashtra 18 4 7 11 7
16 Manipur
17 Meghalaya
18 Mizoram
19 Nagaland
20 Odisha 571 13 505 518 53
21 Punjab
22 Rajasthan
23 Sikkim
24 Tamil Nadu 86 0 86 86 0
25 Telangana
26 Tripura
27 Uttarakhand
28 Uttar Pradesh
29 West Bengal 634 44 577 621 13
30 A & Nicobar Islands
31 UT Chandigarh
32 Dadra & Nagar Haveli
33 Daman & Diu
34 Delhi
35 Lakshadweep
36 Puducherry
Total 2,867 124 2,559 2,683 184 Sources: 1. Steel Authority of India Limited
2. National Mineral Development Corporation
Blank cells refer to States and UTs who have not furnished data or have insigificant or nilSAIL/ NMDC roads

-65-
ANNEXURE
MISCELLANEOUS

-66-
Annexure 8.1
Long - Term Trends of Investment in Highways
Amount in Rs. Crore
Sl. No. Year
Allocation Expenditure
Plan
IEBR Non-Plan Total Plan Non-Plan IEBR
raised
Private
Sector
Investment
Total
(1) (2) (3) (4) (5) (6) (7) (8) (9)
1 2004-05 6,856.00 3,300.00 1796.5 11,952.50 5,813.53 1,458.47 0.00 1,462.85 8,734.85
2 2005-06 11,408.00 8,500.00 1,956.75 21,864.75 10,330.80 1,826.50 1,289.49 649.08 14,095.87
3 2006-07 13,158.68 3,500.00 1,984.67 18,643.35 12,758.47 1,859.04 1,499.08 1,578.28 17,694.87
4 2007-08 14,156.68 2,090.00 2,266.50 18,513.18 13,742.18 2,233.86 305.18 7,062.40 23,343.62
5 2008-09 16,211.64 4,100.00 2,714.11 23,025.75 15,653.57 2,699.66 1,630.01 8,184.73 28,167.97
6 2009-10 16,641.31 5,000.00 3,463.00 25,104.31 15,120.60 3,387.64 1,153.63 8,572.54 28,234.41
7 2010-11 21,590.29 7,455.00 4,857.59 33,902.88 20,434.93 4,545.46 2,160.11 15,354.37 42,494.87
8 2011-12 22,966.76 12,500.00 4,283.06 39,749.82 19,489.98 3,950.21 12,511.52 25,998.56 61,950.27
9 2012-13 20,283.56 13,000.00 4,564.72 37,848.28 19,949.82 4,393.64 2,902.07 20,304.66 47,550.19
10 2013-14 26,211.41 8,000.00 4,918.42 39,129.83 23,920.97 4,756.38 7,942.13 22,515.05 59,134.53
11 2014-15 27,880.50 7,611.11 5,596.58 41,088.19 26,728.52 5,630.35 3,343.40 19,232.44 54,934.71
12 2015-16 44,324.00 42,694.50 2,783.71 89,802.21 43,328.36 2,608.70 23,281.00 29,770.00 98,988.06
13 2016-17 49,351.67 59,279.00 3,095.33 1,11,726.00 46,461.97 2,730.71 33,118.00 16,028.64 98,339.32
Source: Roads Wing, MoRTH
Remarks: Allocation and Expenditure upto 2014-15 includes the fund earmarked for Border Road Organisation for
National Highways (Original), Maintainance and Repairs and for General Staff Roads under Separate Heads.

-67-
TERMS AND DEFINITIONS
Sl.
No.
Terms Definitions
A. ROADS
1. Track A path on the land much trodden by persons and animals.
2. Cart Track A land way for use by carts.
3. Road A way on land with a right of way for the public.
4. Urban Road A road within the limits of the area of Municipality, Military Cantonment,
Port or Railway Authority.
5. Project Road A road within the limits of the area of a development project of a public
authority for the exploitation of resources such as forest, irrigation, electricity,
coal, sugarcane, steel, etc.
B. HIGHWAY CLASSES BY FUNCTION
1. Expressways Expressways offer superior highway facility with higher specifications. It
provides for more lanes, better surface, divided carriageway, controlled
access grade separations at cross-roads and fencing etc. Expressways permits
only fast moving vehicles and are meant to carry through traffic. The
Expressway may be owned by the Central Government or State Government
depending upon whether the route is a National Highway or a State Road.
2. National
Highways
The arterial roads of the country for inter-state movements of goods and
passengers. They traverse the length and width of the country connecting the
National and State capitals, major ports and rail junctions and link up with
border roads and foreign highways.
3. State
Highways
The arterial roads in a State for inter-district movements. They traverse the
length and width of a state connecting the state capital, district headquarters
and important towns and cities and link up with the National Highways and
adjacent State Highways.
4. District Roads District Roads comprising of Major District Roads (MDRs), Other District Roads
(ODRs) provide connection between district and taluk headquarters with the State
highways and National Highways. These roads which run within districts.
5. Village Roads These roads serve as the feeder roads as well as the roads for inter village
movements. They pass through rural areas connecting the village to one
another and to the nearest road of higher category viz. District Roads, State
Highways, National Highways, etc.

-68-
C. ROAD SURFACE
1. Bitumen or Tar
Macadam
A type of construction in which the fragments of coarse aggregate are bound
together by bitumen applied either premix or grouting method.
2. Bitumen
Concrete
Surfacing
A type of construction in which coarse and fine mineral aggregates are mixed
with bitumen and laid not to the desired thickness.
3. Black Top
Surface
The surface of roads made with bitumen as a binder.
4. Brick Paving A paving composed of bricks laid in regular courses.
5. Cement Bound
Macadam
A surface in which a matrix of a cement sand mixture is interposed between
two layers of road metal spread on the road and the whole mass watered and
consolidated so that the matter works into the interstices of the road metal to
produce a compact mass.
6. Cement
Concrete
A surface obtained by placing and consolidating cement concrete to required
thickness.
7. Earth Road A road with the carriageway composed of natural soil.
8. Gravel Road A road with the carriageway composed of a consolidated layer of gravel.
9. Water Bound
Macadam
A type of surfacing in which stone fragments are first inter locked by rolling
and then bound with smaller stone gravel etc. which enforced into the
intersection by brimming, watering and rolling.
10. Motorable (i) For Plain Areas: Surfaced or unsurfaced road of minimum 3.0 M
Carriageway width is motorable.
(ii) For Hilly Areas: Surfaced or unsurfaced road of minimum 3.0 M
Carriageway width having no horizontal curve of radii less than 14 M and
grade not steeper than 7% is motorable. A bridle path is non motorable.