


Languages
Pages
Legal


Investor Roundtable Oil & Gas
Rainer Seele CEO Wintershall and
President BASF
Oil & Gas Division
September 18, 2014
Production platform in Norway

BASF Roundtable Oil & Gas, September 18, 2014 2
This presentation may contain forward-looking statements that are subject to risks and
uncertainties, including those pertaining to the anticipated benefits to be realized from the
proposals described herein. Forward-looking statements may include, in particular,
statements about future events, future financial performance, plans, strategies,
expectations, prospects, competitive environment, regulation and supply and demand.
BASF has based these forward-looking statements on its views and assumptions with
respect to future events and financial performance. Actual financial performance could differ
materially from that projected in the forward-looking statements due to the inherent
uncertainty of estimates, forecasts and projections, and financial performance may be better
or worse than anticipated. Given these uncertainties, readers should not put undue reliance
on any forward-looking statements. The information contained in this presentation is subject
to change without notice and BASF does not undertake any duty to update the forward-
looking statements, and the estimates and assumptions associated with them, except to the
extent required by applicable laws and regulations.
Cautionary note regarding
forward-looking statements
BASF Roundtable Oil & Gas, September 18, 2014 3 3
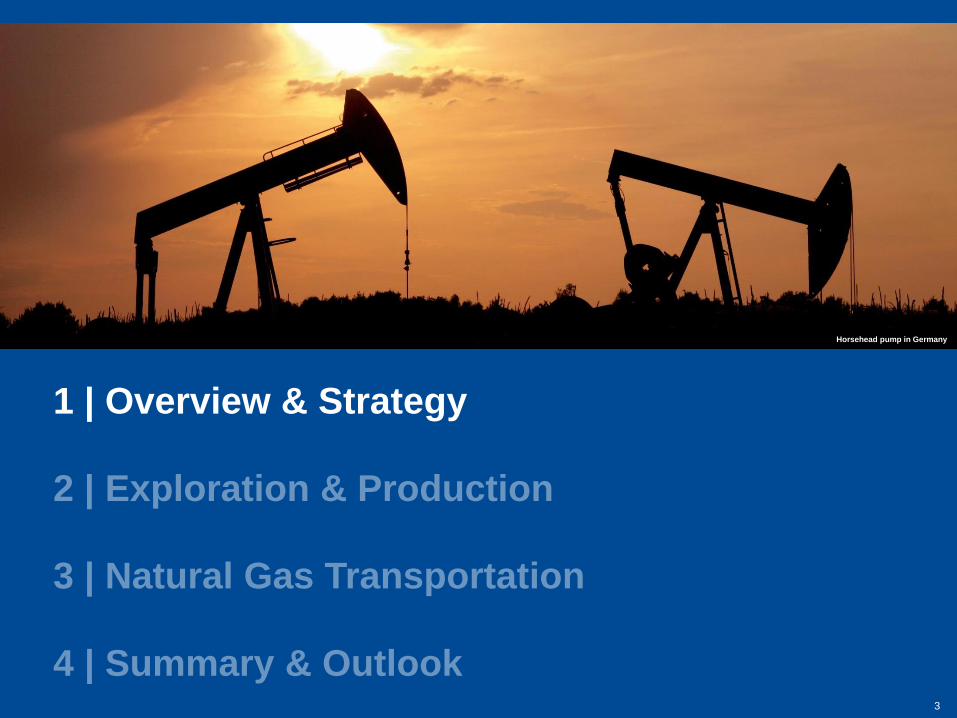
1 | Overview & Strategy
2 | Exploration & Production
3 | Natural Gas Transportation
4 | Summary & Outlook
Horsehead pump in Germany

BASF Roundtable Oil & Gas, September 18, 2014
2009
2013
2009-2013:
– Oil & Gas: Solid profit
contributor to BASF Group
– Oil & Gas accounted for
~30% of BASF Group capex
Oil & Gas will remain a
significant contributor to BASF’s
total EBITDA
Capex share of Oil & Gas
business in BASF’s portfolio will
decline
Key facts
Cumulative capex** 2009-2013 (billion €)
BASF Group
w/o Oil & Gas 7.4 (76%)
BASF Group
w/o Oil & Gas 14.5 (69%)
Oil & Gas 2.3 (24%)
Oil & Gas 6.4 (31%)
2009
2013 -
-
4
* Excluding non-deductible oil taxes; restated figures from 2012 onwards in accordance with changes in IFRS
** Including additions to property, plant, equipment resulting from acquisitions, capitalized exploration, restoration obligations
and IT investments; restated figures from 2012 onwards in accordance with changes in IFRS
Share of Oil & Gas in BASF portfolio
Overview & Strategy
Average EBITDA* 2009-2013 (billion € p.a.)

BASF Roundtable Oil & Gas, September 18, 2014 5
Strong earnings contribution
from Oil & Gas
* Positive impact from special income due to the deconsolidation of Gascade Gastransport GmbH and
the disposal of a share in the Edvard Grieg oilfield (BASF Report 2013, pp. 86-87)
Overview & Strategy
480 601
857 789
951
712
923 1.064
1.201
1,780
835
0
500
1.000
1.500
2.000
2004 2005 2006 2007 2008 2009 2010 2011 2012 2013* 1 HY2014
Net income Oil & Gas (million €)

BASF Roundtable Oil & Gas, September 18, 2014
Oil & Gas – Strong free cash flow
contribution to BASF Group
6
0
500
1.000
1.500
2.000
2004 2005 2006 2007 2008 2009 2010 2011 2012 2013
Cash flow Oil & Gas* (million €)
Operating cash flow Oil & Gas
* Wintershall cash flow ** Free cash flow: Operating cash flow less payments related to property, plant and equipment and intangible assets
Free cash flow** Oil & Gas
40% of operating cash flow to BASF Group (avg. 2004-2013)
Overview & Strategy
BASF Roundtable Oil & Gas, September 18, 2014
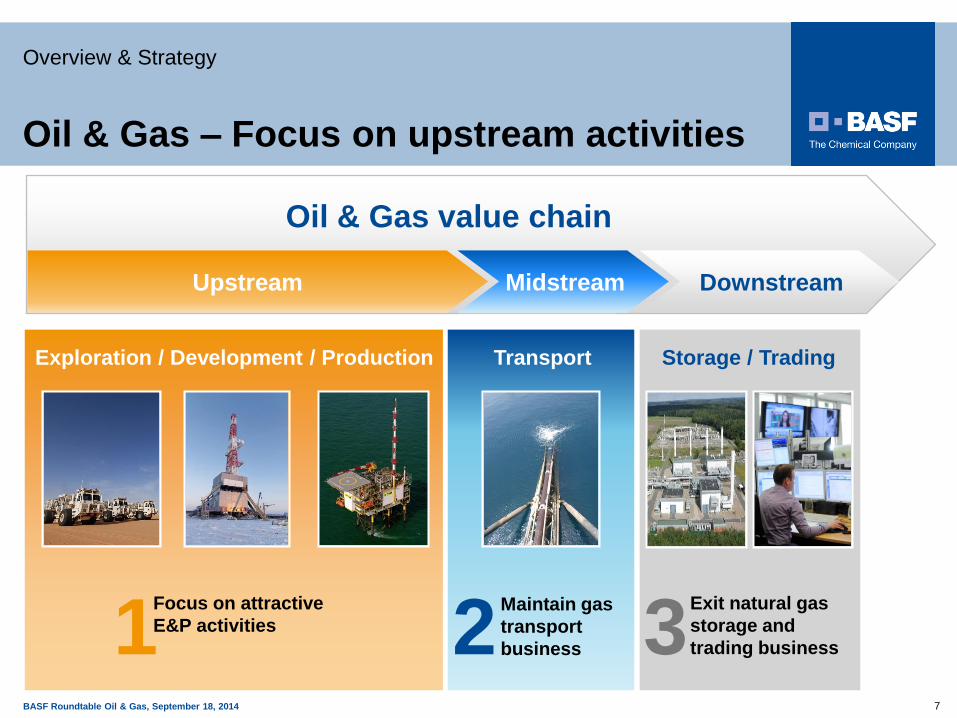
Oil & Gas value chain
Upstream Downstream
Exploration / Development / Production Transport Storage / Trading
Midstream Upstream
Focus on attractive
E&P activities Maintain gas
transport
business
Exit natural gas
storage and
trading business 1 2 3 7
Oil & Gas – Focus on upstream activities
Overview & Strategy

BASF Roundtable Oil & Gas, September 18, 2014 8 8
1 | Overview & Strategy
2 | Exploration & Production
3 | Natural Gas Transportation
4 | Summary & Outlook
Platform in the Dutch sector of the North Sea

BASF Roundtable Oil & Gas, September 18, 2014 9
Oil & Gas – Clear strategy for further
profitable growth
”Growing at the source”
Focus Technology Partnerships
BASF technology
Verbund
Enhanced oil
recovery (EOR)
Strategic partnerships
with regional resource
holders
Long-term profitable growth
E&P
Core regions
Limited exploration
risk
Exploration & Production
BASF Roundtable Oil & Gas, September 18, 2014 10
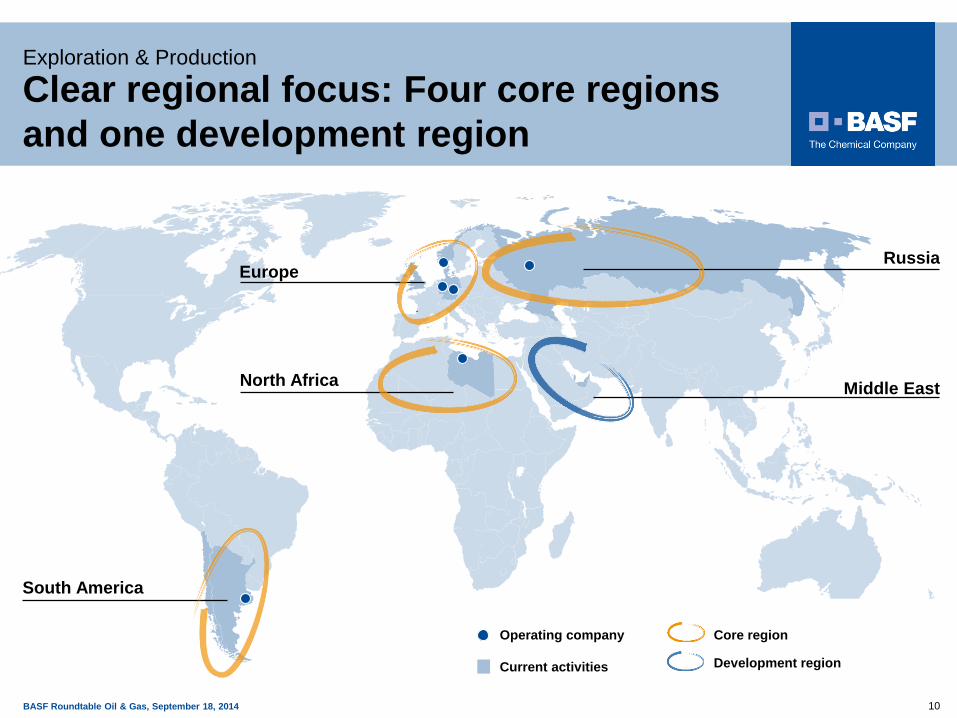
Exploration & Production
Clear regional focus: Four core regions
and one development region
North Africa
Europe Russia
Middle East
South America
Core region
Development region
Operating company
Current activities
.
BASF Roundtable Oil & Gas, September 18, 2014 11
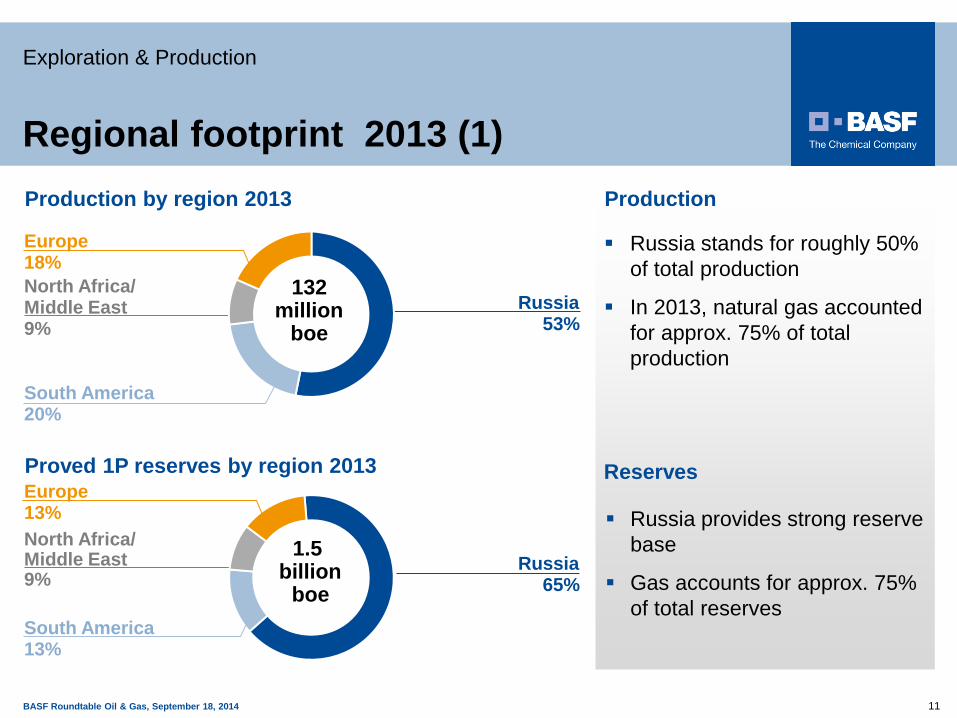
Regional footprint 2013 (1)
Exploration & Production
Russia stands for roughly 50%
of total production
In 2013, natural gas accounted
for approx. 75% of total
production
Production
Russia provides strong reserve
base
Gas accounts for approx. 75%
of total reserves
Reserves
Russia 53%
North Africa/ Middle East 9%
Europe 18%
South America 20%
132 million
boe
North Africa/ Middle East 9%
Europe 13%
South America 13%
Proved 1P reserves by region 2013
1.5 billion
boe
Russia 65%
Production by region 2013
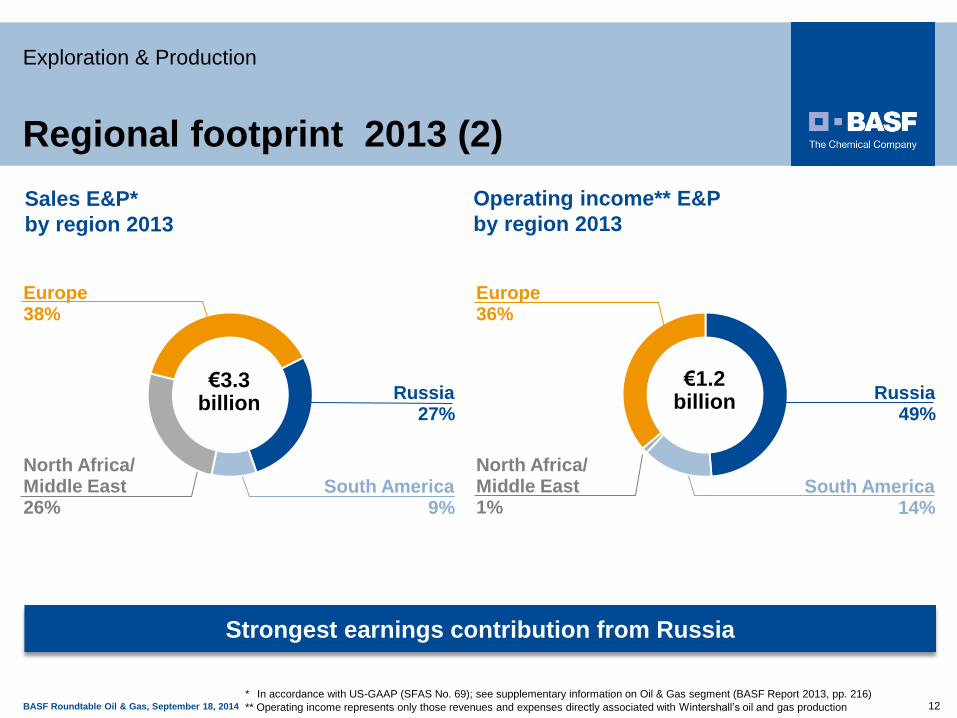
BASF Roundtable Oil & Gas, September 18, 2014 12 ** Operating income represents only those revenues and expenses directly associated with Wintershall’s oil and gas production
Regional footprint 2013 (2)
Exploration & Production
Europe 36%
Operating income** E&P
by region 2013
South America 14%
North Africa/ Middle East 1%
Sales E&P*
by region 2013
North Africa/ Middle East 26%
Europe 38%
South America 9%
€3.3 billion
€1.2 billion Russia
49% Russia
27%
Strongest earnings contribution from Russia
* In accordance with US-GAAP (SFAS No. 69); see supplementary information on Oil & Gas segment (BASF Report 2013, pp. 216)

BASF Roundtable Oil & Gas, September 18, 2014
Continue to significantly invest in
core and development regions
Capex* of ~€4 billion between
2014 and 2018, thereof
– 70% Europe and Russia
– 15% North Africa/Middle East
– 15% South America
13
Production volumes (million boe)
0
50
100
150
200
2013 2015 target 2018 target
~190
132
Russia
South America
North Africa/Middle East
Europe
Key facts
>160
* Without capex in non-consolidated participations
Oil & Gas – Excellent further growth
opportunities
Exploration & Production
BASF Roundtable Oil & Gas, September 18, 2014
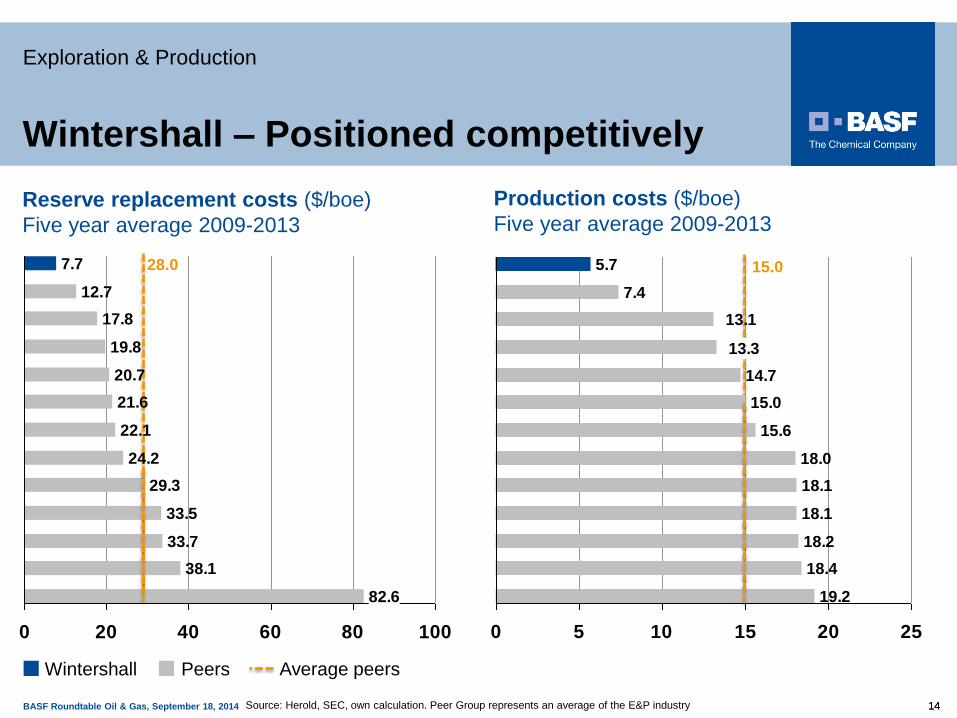
Reserve replacement costs ($/boe)
Five year average 2009-2013
28.0
Wintershall Average peers Peers
Source: Herold, SEC, own calculation. Peer Group represents an average of the E&P industry
Production costs ($/boe)
Five year average 2009-2013
15.0
Wintershall – Positioned competitively
Exploration & Production
14 14
82.6
38.1
33.7
33.5
29.3
24.2
22.1
21.6
20.7
19.8
17.8
12.7
7.7
0 20 40 60 80 100
19.2
18.4
18.2
18.1
18.1
18.0
15.6
15.0
14.7
13.3
13.1
7.4
5.7
0 5 10 15 20 25
BASF Roundtable Oil & Gas, September 18, 2014 15
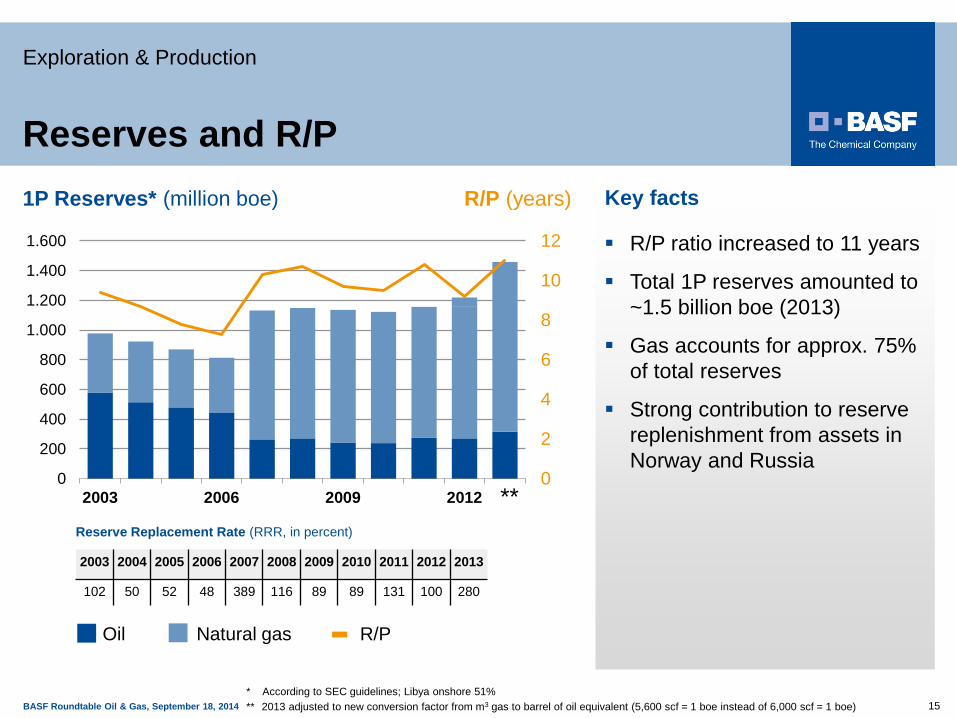
R/P ratio increased to 11 years
Total 1P reserves amounted to
~1.5 billion boe (2013)
Gas accounts for approx. 75%
of total reserves
Strong contribution to reserve
replenishment from assets in
Norway and Russia
Key facts 1P Reserves* (million boe) R/P (years)
Oil Natural gas R/P
* According to SEC guidelines; Libya onshore 51%
Reserve Replacement Rate (RRR, in percent)
2003 2004 2005 2006 2007 2008 2009 2010 2011 2012 2013
102 50 52 48 389 116 89 89 131 100 280
** 2013 adjusted to new conversion factor from m3 gas to barrel of oil equivalent (5,600 scf = 1 boe instead of 6,000 scf = 1 boe)
0
2
4
6
8
10
12
0
200
400
600
800
1.000
1.200
1.400
1.600
2003 2006 2009 2012 **
Reserves and R/P
Exploration & Production
BASF Roundtable Oil & Gas, September 18, 2014 16
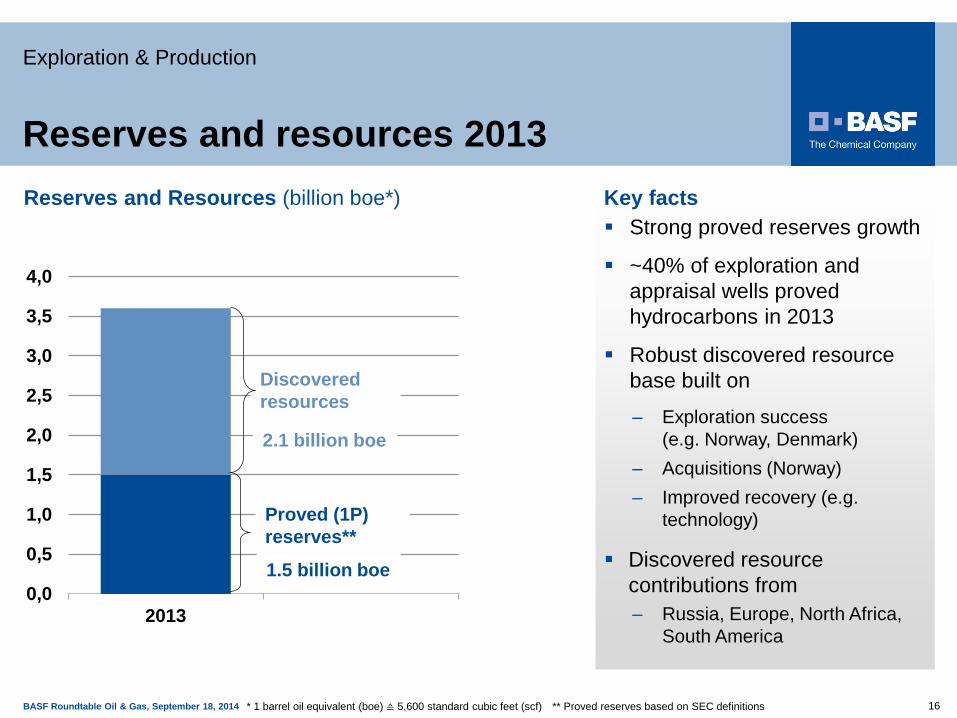
Strong proved reserves growth
~40% of exploration and
appraisal wells proved
hydrocarbons in 2013
Robust discovered resource
base built on
– Exploration success
(e.g. Norway, Denmark)
– Acquisitions (Norway)
– Improved recovery (e.g.
technology)
Discovered resource
contributions from
– Russia, Europe, North Africa,
South America
Key facts Reserves and Resources (billion boe*)
0,0
0,5
1,0
1,5
2,0
2,5
3,0
3,5
4,0
2013
** Proved reserves based on SEC definitions
1.5 billion boe
2.1 billion boe
Discovered
resources
Proved (1P)
reserves**
* 1 barrel oil equivalent (boe) ≙ 5,600 standard cubic feet (scf)
Exploration & Production
Reserves and resources 2013

BASF Roundtable Oil & Gas, September 18, 2014
Strategic focus through active portfolio
management
Exploration & Production
Profitable
upstream
growth
Own and jointly
operated assets
Portfolio
upgrading
Cash flow & capex
optimization
Technology
application
17 17
BASF Roundtable Oil & Gas, September 18, 2014
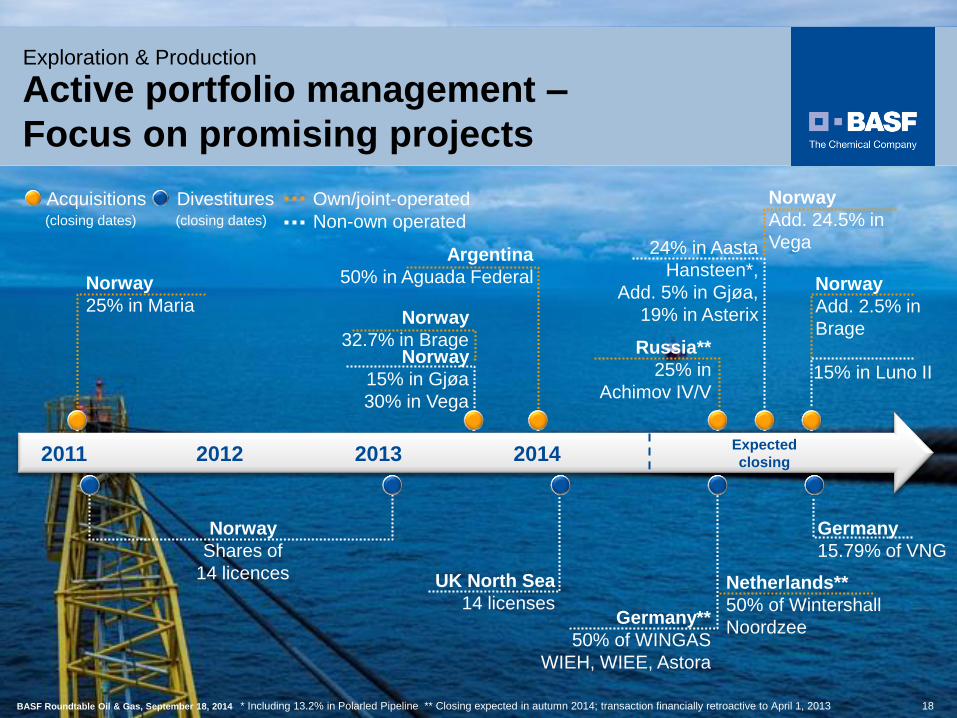
Norway
25% in Maria Norway
32.7% in Brage
Active portfolio management –
Focus on promising projects
UK North Sea
14 licenses
15% in Luno II
Norway
Add. 2.5% in
Brage
Argentina
50% in Aguada Federal
Germany
15.79% of VNG
Acquisitions
Germany**
50% of WINGAS
WIEH, WIEE, Astora
Netherlands**
50% of Wintershall
Noordzee
Exploration & Production
18
Norway
15% in Gjøa
30% in Vega
(closing dates)
Own/joint-operated Divestitures (closing dates)
Norway
Add. 24.5% in
Vega 24% in Aasta
Hansteen*,
Add. 5% in Gjøa,
19% in Asterix
Non-own operated
Russia**
25% in
Achimov IV/V
Norway
Shares of
14 licences
BASF Roundtable Oil & Gas, September 18, 2014 * Including 13.2% in Polarled Pipeline ** Closing expected in autumn 2014; transaction financially retroactive to April 1, 2013
2011 2013 2012 2014 Expected
closing
BASF Roundtable Oil & Gas, September 18, 2014 19
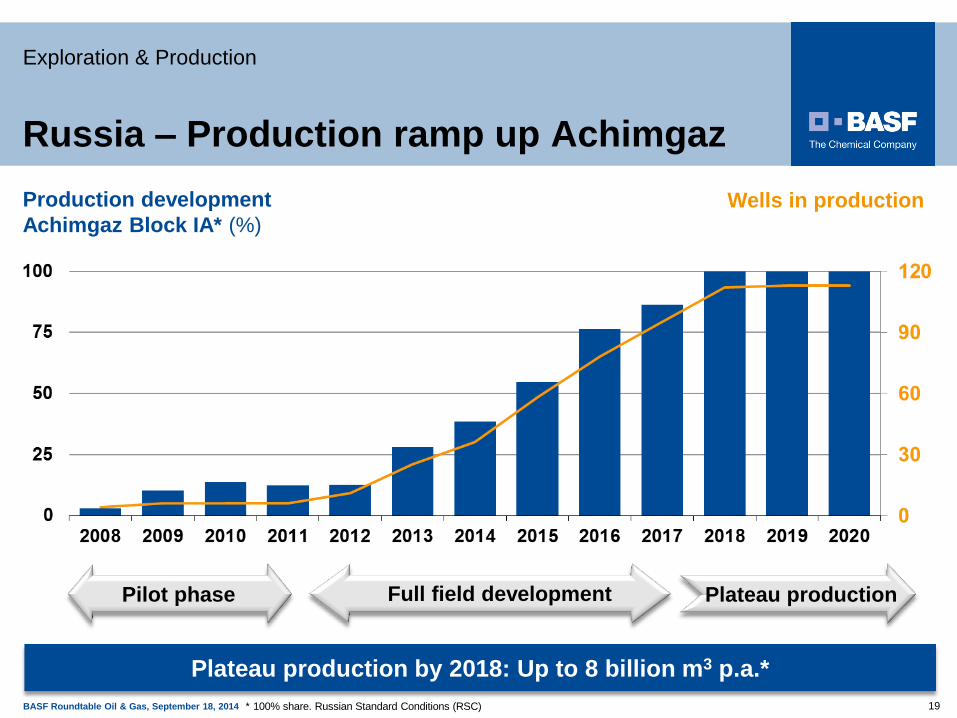
Russia – Production ramp up Achimgaz
Exploration & Production
Production development
Achimgaz Block IA* (%)
* 100% share. Russian Standard Conditions (RSC)
Full field development Pilot phase Plateau production
Wells in production
Plateau production by 2018: Up to 8 billion m3 p.a.*

BASF Roundtable Oil & Gas, September 18, 2014
2011 2012 2014 2013
Nov. signing of
legally binding
basic agreement
Dec. signing of
final agreement
Oct. signing
of framework
agreement
Dec. approval
by EU
Commission
2015 2016
Planned
production
start area IV/V
Effective date:
April 1
Implementation
of the swap
(e.g. developing new
company structure)
Autumn
expected
closing
2017
20
Status of the asset swap with Gazprom –
Timeline
20
Exploration & Production
BASF Roundtable Oil & Gas, September 18, 2014 Activities to be divested contributed in total ~€12 billion to sales and ~€500 million to EBITDA of BASF Group in 2013
BASF Roundtable Oil & Gas, September 18, 2014 21
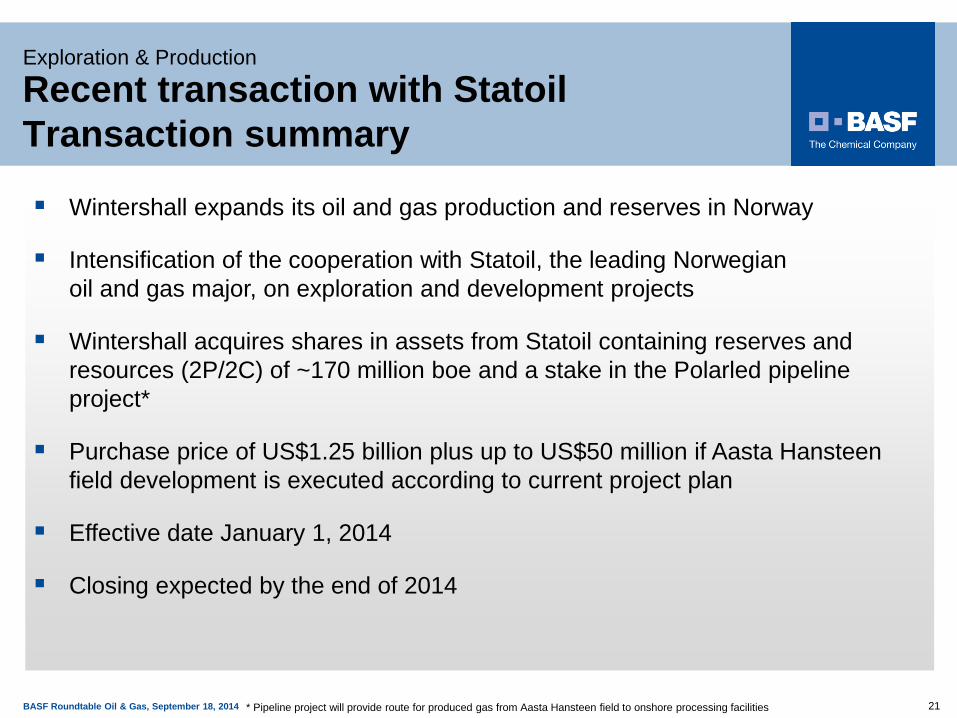
Exploration & Production
Wintershall expands its oil and gas production and reserves in Norway
Intensification of the cooperation with Statoil, the leading Norwegian
oil and gas major, on exploration and development projects
Wintershall acquires shares in assets from Statoil containing reserves and
resources (2P/2C) of ~170 million boe and a stake in the Polarled pipeline
project*
Purchase price of US$1.25 billion plus up to US$50 million if Aasta Hansteen
field development is executed according to current project plan
Effective date January 1, 2014
Closing expected by the end of 2014
Recent transaction with Statoil
Transaction summary
* Pipeline project will provide route for produced gas from Aasta Hansteen field to onshore processing facilities
BASF Roundtable Oil & Gas, September 18, 2014 22
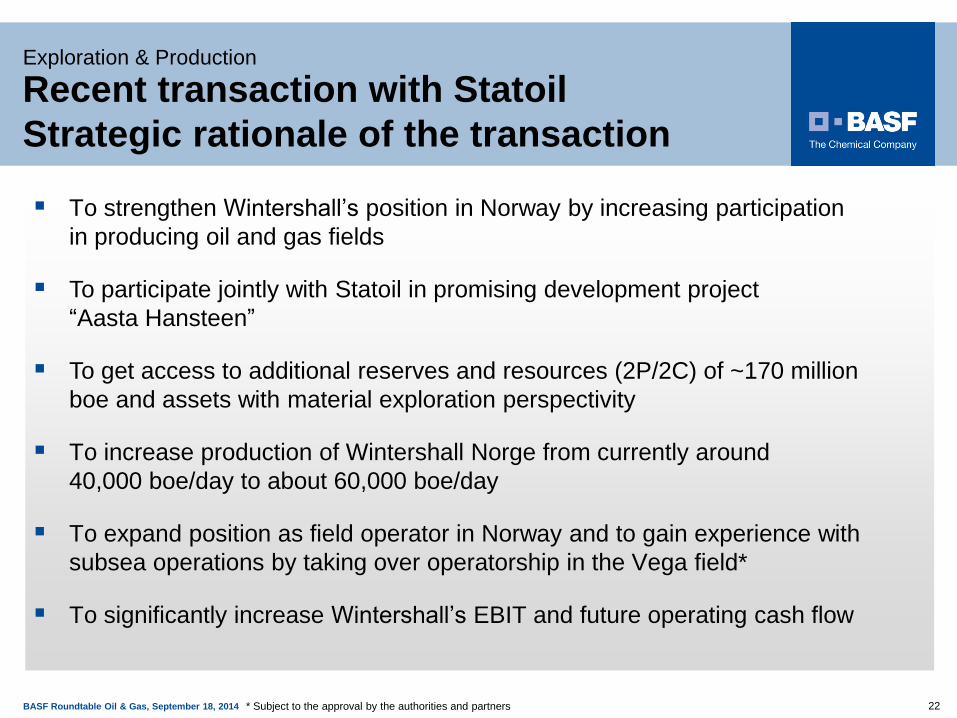
Recent transaction with Statoil
Strategic rationale of the transaction
Exploration & Production
* Subject to the approval by the authorities and partners
To strengthen Wintershall’s position in Norway by increasing participation
in producing oil and gas fields
To participate jointly with Statoil in promising development project
“Aasta Hansteen”
To get access to additional reserves and resources (2P/2C) of ~170 million
boe and assets with material exploration perspectivity
To increase production of Wintershall Norge from currently around
40,000 boe/day to about 60,000 boe/day
To expand position as field operator in Norway and to gain experience with
subsea operations by taking over operatorship in the Vega field*
To significantly increase Wintershall’s EBIT and future operating cash flow
BASF Roundtable Oil & Gas, September 18, 2014
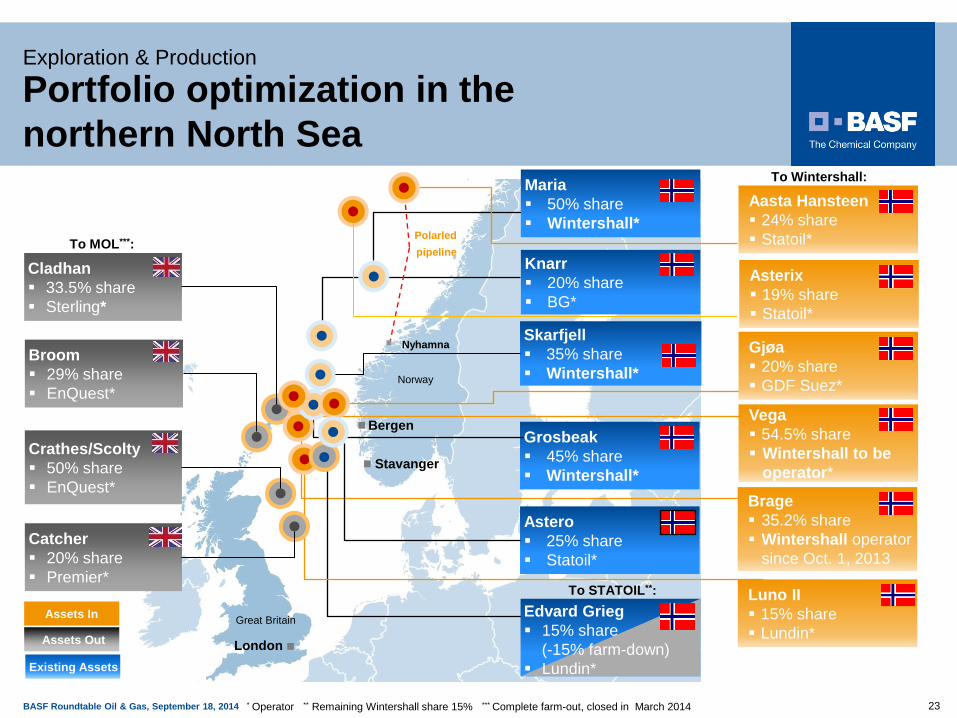
Portfolio optimization in the
northern North Sea
Exploration & Production
23
Brage
35.2% share
Wintershall operator
since Oct. 1, 2013
Bergen
Assets In
Assets Out
Existing Assets
Astero
25% share
Statoil*
Vega
54.5% share
Wintershall to be
operator*
* Operator ** Remaining Wintershall share 15% *** Complete farm-out, closed in March 2014
Broom
29% share
EnQuest*
Knarr
20% share
BG*
Grosbeak
45% share
Wintershall*
Skarfjell
35% share
Wintershall*
Crathes/Scolty
50% share
EnQuest*
Catcher
20% share
Premier*
Cladhan
33.5% share
Sterling*
To STATOIL**:
To MOL***:
To Wintershall:
Edvard Grieg
15% share
(-15% farm-down)
Lundin*
Luno II
15% share
Lundin*
Stavanger
Norway
Great Britain
London
Aasta Hansteen
24% share
Statoil*
Asterix
19% share
Statoil*
Maria
50% share
Wintershall*
Nyhamna Gjøa
20% share
GDF Suez*
Polarled
pipeline
BASF Roundtable Oil & Gas, September 18, 2014 24
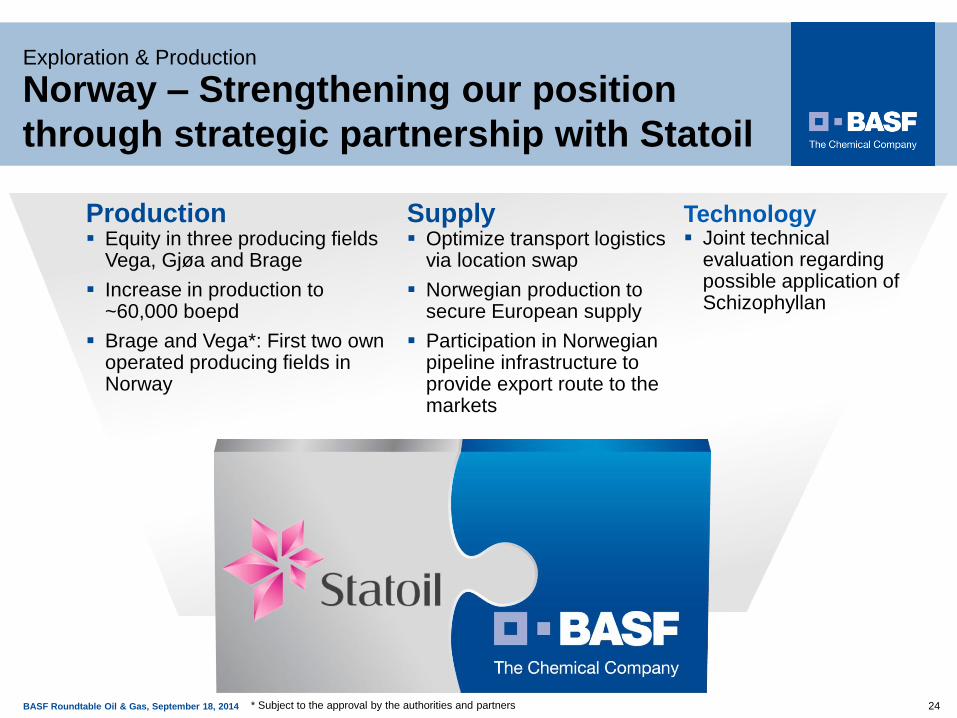
Supply Optimize transport logistics
via location swap
Norwegian production to secure European supply
Participation in Norwegian pipeline infrastructure to provide export route to the markets
Technology Joint technical
evaluation regarding possible application of Schizophyllan
Production Equity in three producing fields
Vega, Gjøa and Brage
Increase in production to ~60,000 boepd
Brage and Vega*: First two own operated producing fields in Norway
Norway – Strengthening our position
through strategic partnership with Statoil
Exploration & Production
* Subject to the approval by the authorities and partners

BASF Roundtable Oil & Gas, September 18, 2014
Enhanced oil recovery – Schizophyllan
BASF/Wintershall’s proprietary technology
Exploration & Production
25
Schizophyllan – biopolymer
to enhance oil recovery
Produced by a fungus in a
pilot scale plant at BASF
Increased incremental oil
recovery of up to 10% points
above that of waterflooding
Unique for oil fields with
viscous oil and harsh
reservoir conditions
First indication for
incremental oil production
shown in field test
Next steps
Additional test planned in
further oil field
Key facts
BASF Roundtable Oil & Gas, September 18, 2014
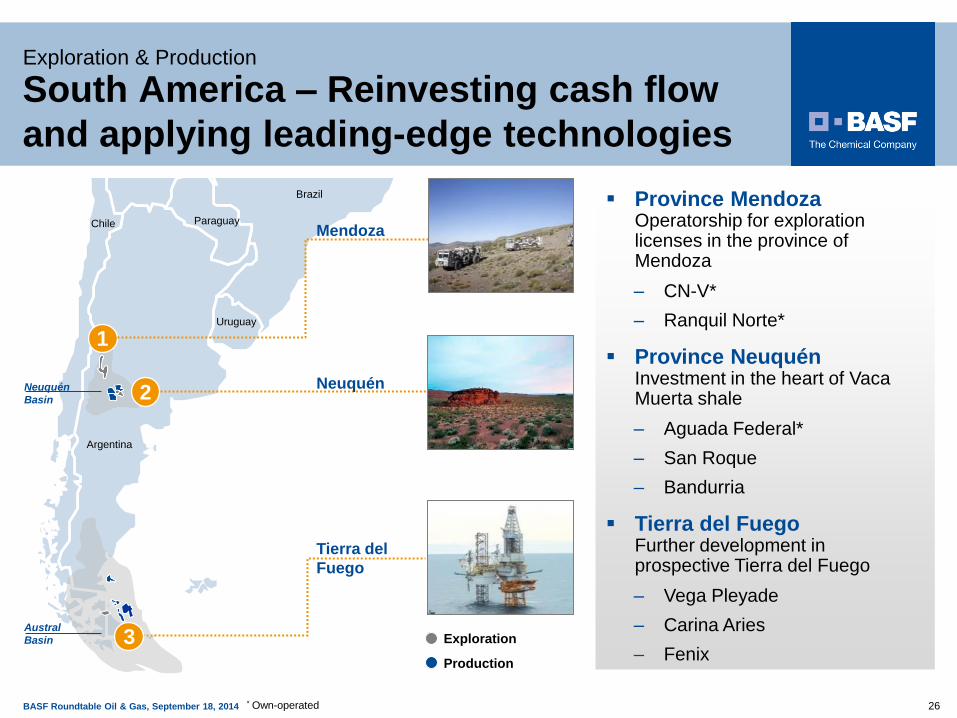
South America – Reinvesting cash flow
and applying leading-edge technologies
Exploration & Production
26
Province Mendoza Operatorship for exploration licenses in the province of Mendoza
– CN-V*
– Ranquil Norte*
Province Neuquén Investment in the heart of Vaca Muerta shale
– Aguada Federal*
– San Roque
– Bandurria
Tierra del Fuego Further development in prospective Tierra del Fuego
– Vega Pleyade
– Carina Aries
– Fenix
Argentina
Chile
Uruguay
Brazil
Paraguay
1
2
Exploration
Production
Tierra del
Fuego
Neuquén
Mendoza
Austral
Basin
Neuquén
Basin
3
* Own-operated

BASF Roundtable Oil & Gas, September 18, 2014 27
Argentina – Realize unconventional
resource potential in Argentina
Key facts Aguada Federal
Farm-in agreement signed in 2014
50% participation interest acquired from Gas y Petroleo de Neuquén (GyP) incl. operatorship
100 km2 of the prospective Vaca Muerta shale formation
Next steps
Evaluation of the potential in a first appraisal phase (2014-2016)
– Investments of ~€80 million (100%)
– Drilling of up to six wells
Exploration & Production
Argentina
Aguada
Federal
Exploration
Production

BASF Roundtable Oil & Gas, September 18, 2014 28
Middle East – Shuwaihat project in Abu
Dhabi: Start of drilling campaign
Exploration & Production
Key facts
Development of Shuwaihat
gas/condensate field (containing
H2S and CO2)
– 200 km west of Abu Dhabi
– Water depth: 0-15 meters
– Targeted field depth: 3,400
meters
Wintershall: Operator in the
appraisal phase
Resources: 50-500 million boe
Production start: ~2022
Next steps
Drilling of up to three appraisal
wells and acquiring 3D-seismic
over the field (since May 2014)
BASF Roundtable Oil & Gas, September 18, 2014 29
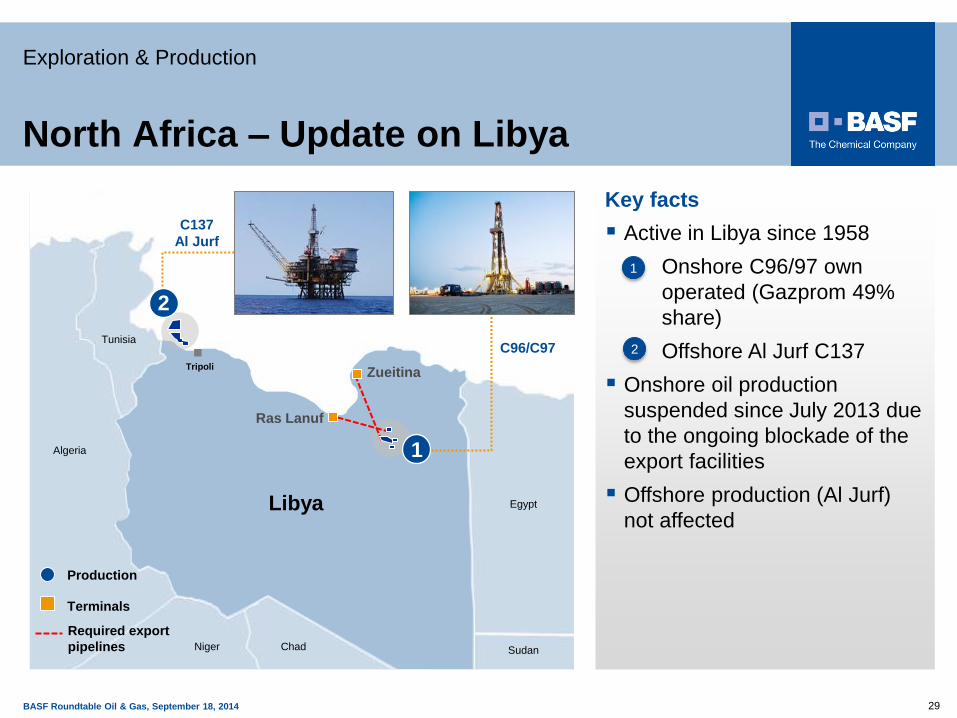
North Africa – Update on Libya
Key facts
Active in Libya since 1958
Onshore C96/97 own
operated (Gazprom 49%
share)
Offshore Al Jurf C137
Onshore oil production
suspended since July 2013 due
to the ongoing blockade of the
export facilities
Offshore production (Al Jurf)
not affected
1
2
Exploration & Production
29
Ras Lanuf
Zueitina
Required export
pipelines
Production
Tunisia
Algeria
Niger Chad Sudan
Libya Egypt
C137
Al Jurf
C96/C97
Tripoli
Terminals
1
2
BASF Roundtable Oil & Gas, September 18, 2014 30
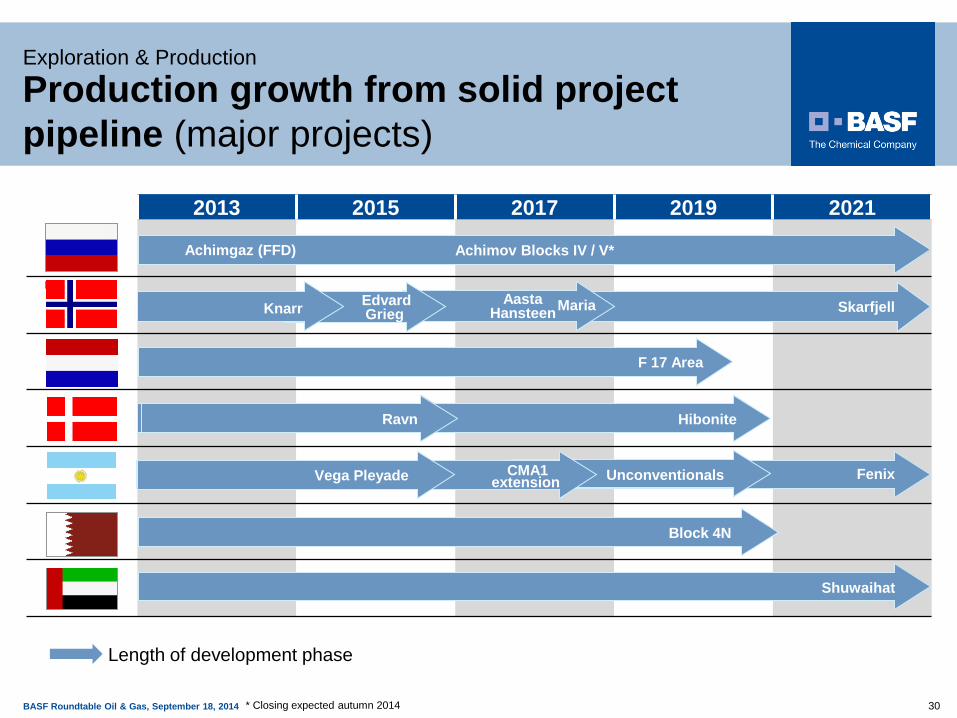
Production growth from solid project
pipeline (major projects)
2013 2015 2017 2019 2021
Norway
Length of development phase
Skarfjell
Achimgaz (FFD) Achimov Blocks IV / V*
Block 4N
Shuwaihat
F 17 Area
* Closing expected autumn 2014
Hibonite
Exploration & Production
Ravn
Fenix Unconventionals CMA1 extension Vega Pleyade
Maria Aasta Hansteen
Edvard Grieg Knarr
BASF Roundtable Oil & Gas, September 18, 2014 31
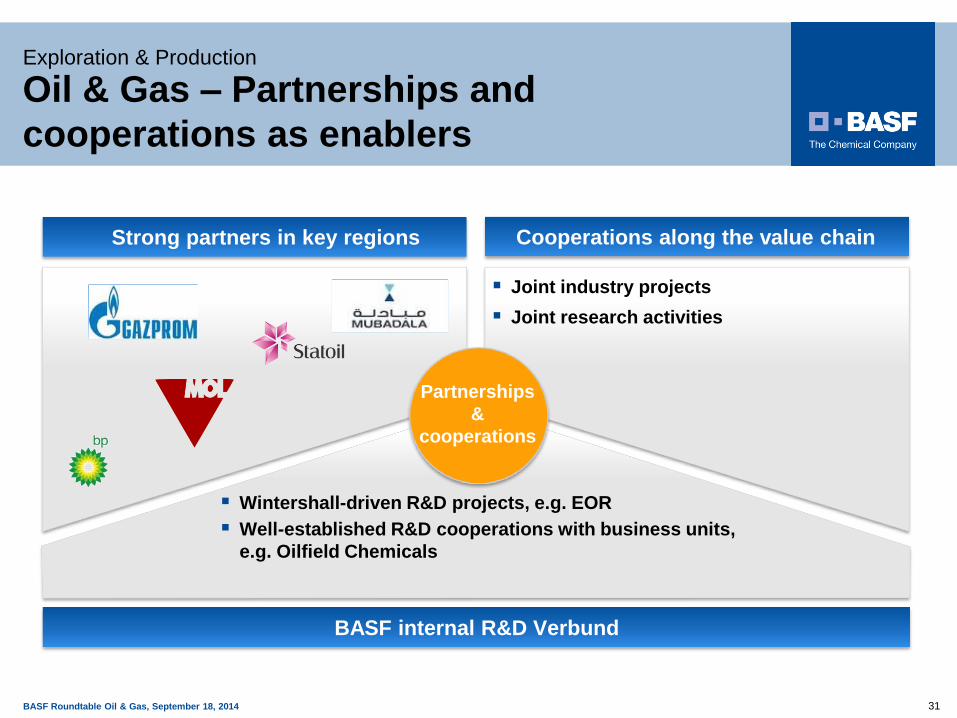
Oil & Gas – Partnerships and
cooperations as enablers
Strong partners in key regions Cooperations along the value chain
BASF internal R&D Verbund
Joint industry projects
Joint research activities
Wintershall-driven R&D projects, e.g. EOR
Well-established R&D cooperations with business units,
e.g. Oilfield Chemicals
Partnerships
&
cooperations
Exploration & Production

BASF Oil & Gas 2014 32 32
1 | Overview & Strategy
2 | Exploration & Production
3 | Natural Gas Transportation
4 | Summary & Outlook
Natural gas pipeline
BASF Roundtable Oil & Gas, September 18, 2014 33
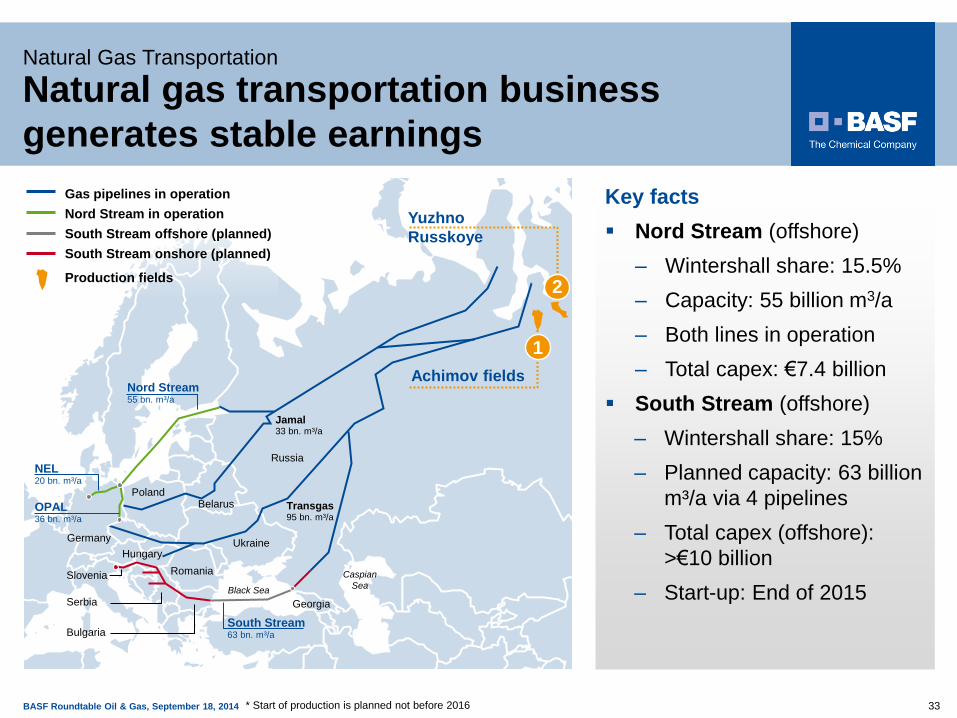
Natural gas transportation business
generates stable earnings
Key facts
Nord Stream (offshore)
– Wintershall share: 15.5%
– Capacity: 55 billion m3/a
– Both lines in operation
– Total capex: €7.4 billion
South Stream (offshore)
– Wintershall share: 15%
– Planned capacity: 63 billion
m³/a via 4 pipelines
– Total capex (offshore):
>€10 billion
– Start-up: End of 2015
Natural Gas Transportation
.
Poland Belarus
Ukraine Hungary
Romania
Russia
Bulgaria
Serbia
Slovenia Caspian
Sea Black Sea
Georgia
Germany
OPAL 36 bn. m³/a
NEL 20 bn. m³/a
Nord Stream 55 bn. m³/a
South Stream 63 bn. m³/a
Yuzhno
Russkoye
Achimov fields
Gas pipelines in operation
Nord Stream in operation
South Stream offshore (planned)
South Stream onshore (planned)
Production fields
1
2
Jamal 33 bn. m³/a
Transgas 95 bn. m³/a
* Start of production is planned not before 2016

BASF Roundtable Oil & Gas, September 18, 2014 34
Pipeline network well connected to major
European distribution hubs
Natural Gas Transportation
Ludwigshafen
Düsseldorf
Krefeld
Aachen
Köln
Kassel
Hameln
Emden
Greifswald
Hamburg Schwerin
Berlin
OP
AL
Brandov
Frankfurt/O.
Erfurt
NEL
STEGAL
Kiel
Netherlands
France
Poland
Czech
Republic
Nürnberg
GASCADE pipelines
Major european
distribution hubs
Brüssel
Zeebrügge
Balgzand
Bunde
NetConnect
Gaspool JAMAL
Burghausen
Prag
Bacton
Belgium
NBP
TTF
ZBH
Key facts
GASCADE
– Wintershall share: 50%
– Length: 2,400 km
– In operation since 1992
OPAL
– Wintershall share: 40%
– Capacity: 36 billion m³/a
– Length: 472 km
– In operation since 2011
NEL
– Wintershall share: 25.6%
– Capacity: 20 billion m³/a
– Length: 441 km
– In operation since 2012/2013

BASF Oil & Gas 2014 35 35
1 | Overview & Strategy
2 | Exploration & Production
3 | Natural Gas Transportation
4 | Summary & Outlook
Drilling rig in Western Siberia (Achimgaz)

BASF Roundtable Oil & Gas, September 18, 2014 36
Oil & Gas – Outlook 2014
2013 2014
Financial
performance
Sales to 3rd parties:
EBIT before special items:
Net income:
€14.776 billion
€1.969 billion
€1.780 billion
Sales expected to be considerably below 2013
due the asset swap with Gazprom.
Slight increase in EBIT before special items due
to the first all-year inclusion of the acquired
activities from Statoil** and the expansion of the
Achimgaz production.
Production
volumes
Total production: 132 mmboe Production expected on similar level despite the
suspension of the onshore production in Libya.
Sales volumes Natural gas sales: 52 billion m³ Divestment of natural gas trading and storage
activities planned for autumn 2014.
Investments/
Expenditures
Investments* 2013:
thereof E&P:
thereof Natural Gas Trading:
~€2.954 billion
~€2.834 billion
~€0.120 billion
Investments*** 2014-2018: ~€4.0 billion (Predominantly in E&P)
Macroeconomic
assumptions
Average oil price (brent):
Average exchange rate:
$109 per barrel
$1.33 per €
Forecast 2014: $110 per barrel
$1.35 per €
* Incl. tangible assets from acquisitions, activated exploration expenditures, without capex in non-consolidated participations
*** Without tangible assets from acquisitions and activated exploration expenditure, without capex in non-consolidated participations
Summary & Outlook
** Former Statoil transaction with closing in 2013
BASF Oil & Gas 2014 37
BASF’s Oil & Gas division –
Summary and roadmap 2018
New ambitious growth target for 2018
Strong portfolio with access to high potential acreage
Solid project pipeline / focus on execution & operational excellence
Strategy with focus on regions of expertise and limited exploration risk
Powerful partnerships in key regions
Exit of natural gas storage and trading business
BASF Roundtable Oil & Gas, September 18, 2014
BASF Oil & Gas 2014 38
Top Related