


Languages
Pages
Legal

1
Bank Lines of Credit in Corporate Finance: An Empirical Analysis
AMIR SUFI*
University of Chicago Graduate School of Business
5807 South Woodlawn Avenue
Chicago, IL 60637 [email protected]
773 702 6148 (P) 773 702 0458 (F)
*I thank Heitor Almeida, Murillo Campello, Douglas Diamond, Michael Faulkender, Mark Flannery, Christopher James, Anil Kashyap, Aziz Lookman, David Matsa, Francisco Perez-Gonzalez, Mitchell Petersen, James Poterba, Joshua Rauh, Antoinette Schoar, Jeremy Stein, Philip Strahan, and Peter Tufano for helpful comments and discussions. I also thank Ali Bajwa and James Wang for helping with computer programs that made this paper possible. This work benefited greatly from seminar participants at the Federal Reserve Bank of New York (Banking Studies), the University of Rochester (Simon), the University of Florida (Warrington), the FDIC Center for Financial Research Workshop, Washington University (Olin), the NBER Corporate Finance meeting, and the Western Finance Association annual meeting. I gratefully acknowledge financial support from the FDIC’s Center for Financial Research.
© The Author 2007. Published by Oxford University Press on behalf of The Society for Financial Studies.All rights reserved. For permissions, please email: [email protected].
RFS Advance Access published January 31, 2007

2
Bank Lines of Credit in Corporate Finance: An Empirical Analysis
Abstract
I empirically examine the factors that determine whether firms use bank lines of credit or cash in corporate liquidity management. I find that bank lines of credit, also known as revolving credit facilities, are a viable liquidity substitute only for firms that maintain high cash flow. In contrast, firms with low cash flow are less likely to obtain a line of credit, and they rely more heavily on cash in their corporate liquidity management. An important channel for this correlation is the use of cash flow-based financial covenants by banks that supply credit lines. I find that firms must maintain high cash flow to remain compliant with covenants, and banks restrict firm access to credit facilities in response to covenant violations. Using the cash flow sensitivity of cash as a measure of financial constraints, I provide evidence that lack of access to a line of credit is a more statistically powerful measure of financial constraints than traditional measures used in the literature.

3
Bank lines of credit, or revolving credit facilities, are an instrumental component of corporate
liquidity management. The “Liquidity and capital resources” sections of firms’ annual reports emphasize
the importance of firms’ access to lines of credit; likewise, research reports by credit rating agencies such
as Moody’s and Standard and Poor’s (S&P) detail information on revolving credit facilities when
discussing a firm’s default risk. Despite the importance of lines of credit in the provision of liquidity in
the economy, the absence of data has limited the existing empirical research on their role in corporate
financing decisions. The analysis presented here represents one of the first empirical studies of lines of
credit in the ongoing liquidity of public corporations.
While there is an extensive theoretical literature on bank lines of credit (Boot, Thakor, and Udell
(1987), Holmstrom and Tirole (1998), Martin and Santomero (1997)), the extant empirical literature on
corporate liquidity focuses mainly on the role of cash (Almeida, Campello, and Weisbach (2004),
Faulkender and Wang (2006), Opler, Pinkowitz, Stulz, and Williamson (1999)). The cash literature finds
that cash plays an important liquidity role given that capital market frictions prevent firms from obtaining
external sources of finance for valuable projects arising in the future.
The empirical finding that firms rely heavily on internal cash for liquidity is somewhat surprising,
given hypotheses developed in the theoretical literature on lines of credit. This literature argues that lines
of credit are motivated primarily by capital market frictions, and a committed line of credit overcomes
these frictions by ensuring that funds are available for valuable projects. In other words, according to the
theoretical literature, lines of credit should resolve precisely the capital market frictions that motivate
firms to hold cash as a liquidity buffer. In addition, Kashyap, Rajan, and Stein (2002) and Gatev and
Strahan (2006) argue that banks are the most efficient liquidity providers in the economy, which also
suggests that firms should rely on lines of credit over internal cash. Despite the similarities in the
literature on cash and lines of credit, there is a lack of interaction between the two areas of research. The
extant literature on cash is largely silent on why firms may use cash in place of lines of credit in corporate
liquidity management.

4
This paper attempts to bridge this gap. The central question of my analysis is: What governs the
use of cash versus bank lines of credit in corporate liquidity management? I attempt to answer this
question using a unique data set with two sets of variables collected directly from annual 10-K SEC
filings. First, for the universe of public firms in S&P’s Compustat from 1996 through 2003, the data set
contains information on whether a firm has access to a line of credit. Second, for a random sample of 300
firms from this universe (1,908 firm-year observations), the data set contains information on the size of
the line of credit, the portion of the line of credit drawn, and the unused availability. In addition, the data
set for the random sample contains information on whether firms are in compliance with or in violation of
financial covenants associated with the line of credit. This data set is one of the first to contain detailed
information on the use of lines of credit by a large sample of public firms.
I use this data set to explore why firms rely on cash versus lines of credit for liquidity. In the first
set of results, I find evidence that maintenance of high cash flow levels is a key characteristic that governs
firms’ use of lines of credit relative to cash. Firms with high levels of cash flow rely on lines of credit,
whereas firms with low levels of cash flow rely on cash. After controlling for firm industry, size, asset
tangibility, seasonal sales patterns, market to book ratio, and age, I find that increasing lagged cash flow
by 2 standard deviations at the mean increases the likelihood of obtaining a line of credit by almost 0.10
at the mean, or about one-quarter standard deviation.
Using the random sample of 300 firms which contains information on line of credit balances, I
focus on the bank liquidity to total liquidity ratio. This ratio is defined as the ratio of lines of credit to the
sum of lines of credit and cash; it represents the fraction of total liquidity available to the firm provided
by bank lines of credit. While some firms may have higher demand for total liquidity due to seasonal
product markets or better investment opportunities, this ratio isolates the relative attractiveness of lines of
credit versus cash in corporate liquidity management. I find a positive effect of cash flow on the bank
liquidity to total liquidity ratio. More specifically, an increase in lagged cash flow by two standard
deviations at the mean increases the bank liquidity to total liquidity ratio by almost 0.08 at the mean, or
about one-quarter standard deviation. This positive relationship is robust when I isolate the intensive

5
margin and examine only firms that have a line of credit, although the magnitudes and statistical
significance are slightly weaker.
This result suggests that maintenance of high cash flows is a critical determinant of whether a
firm uses lines of credit versus cash in corporate liquidity management. When I split the sample into
firms with high and low probabilities of financial distress as measured by Altman’s z-score (1968), I find
that the positive relationship between the use of lines of credit and lagged cash flow is unique among
firms with high financial distress likelihoods. There is no such correlation among firms with low distress
likelihoods. In other words, when a firm has a significant probability of financial distress, it more heavily
uses lines of credit relative to cash only if it maintains high cash flow.
What explains the positive correlation between cash flow and the use of lines of credit? In the
second set of results, I explore the importance of cash-flow based financial covenants on lines of credit.
In particular, I find evidence that maintenance of cash flow is critical to avoiding financial covenant
violations. Reductions in cash flow are a stronger predictor of financial covenant violations than are
changes in a firm’s current ratio, net worth, or market to book ratio. In addition, I find that when a firm
violates a covenant, it loses access to a substantial portion of its line of credit. In terms of magnitudes, a
covenant violation is associated with a 15 to 25% drop in the availability of both total and unused lines of
credit. It is also associated with a 10 to 20% decrease in the bank liquidity to total liquidity ratio.
This result helps explain why cash flow is an important determinant of a firm’s use of lines of
credit versus cash in corporate liquidity management. Given that lines of credit are contingent on
maintenance of cash flow-based covenants, they represent a poor liquidity substitute for firms with low
current or expected cash flows. Firms with low current or expected cash flow maintain cash balances as a
liquidity buffer given that lines of credit may not be available when most needed. This result also shows
that lines of credit are not totally committed liquidity insurance. The contingent lines of credit that exist
in the marketplace are distinct from the committed lines of credit that are described in the theoretical
literature.
6
In the third set of results, I provide evidence that access to lines of credit as a measure of financial
constraints adds valuable information to traditional measures of constraints used in the literature.
Theoretical research suggests that lines of credit are critical in reducing future capital market frictions
facing firms, yet they have not been considered in the extant literature on financial constraints. I follow
Almeida, Campello, and Weisbach (2004), henceforth ACW (2004), and examine the cash flow
sensitivity of cash among firms with and without access to lines of credit. The ACW (2004) theoretical
insight is that firms that face capital market frictions are likely to save cash out of cash flow, whereas
firms that do not face frictions should show no systematic pattern of cash savings out of cash flow. They
empirically explore the cash flow sensitivity of cash for constrained versus unconstrained firms, where
they use four traditional measures of financial constraints: whether a firm is small, whether a firm has a
low payout ratio, whether a firm does not have a corporate credit rating by S&P, and whether a firm does
not have a commercial paper rating by S&P.
Instead of relying on these traditional measures, I explore the cash flow sensitivity of cash using a
measure of constraints that relies on access to lines of credit. Theoretical research on credit lines suggests
that line of credit access as a measure of financial constraints adds valuable information to traditional
measures used in the literature. I define as “unconstrained” firms that have two key characteristics. First,
they have a line of credit in every year in which they are in the sample. Second, they maintain cash flows
scaled by book assets above the median firm throughout the sample. Firms that do not meet this criteria
are designated “constrained.” The empirical results using this definition show that firms without access to
a line of credit save cash out of cash flow, whereas firms with access to a line of credit do not save cash
out of cash flow. In addition, I show evidence that the line of credit measure is more statistically
powerful at explaining the pattern of cash flow sensitivities of cash than the traditional measures used in
the literature. For example, consistent with ACW (2004), firms without an S&P corporate credit rating or
commercial paper rating indeed show a higher sensitivity of cash holdings to cash flow. However, among
firms without access to a rating, it is only the firms without access to a line of credit that show a positive

7
sensitivity. In general, my results show that firms that are small, have low payout ratios, or lack ratings
only show positive cash flow sensitivities of cash if they lack access to a line of credit.
Overall, these results suggest that banks provide credit lines that are contingent on maintenance
of cash flow. Reductions in cash flow lead to covenant violations, which in turn lead to a restriction in
the availability of a line of credit. Lines of credit are therefore a poor liquidity substitute for firms that
have low existing or expected cash flows. For these firms, cash is a more reliable source of liquidity.
These firms rely more heavily on cash and save more cash out of cash flow.
In addition to these results, this paper documents several new facts regarding the use of bank lines
of credit by public firms. For example, I find that lines of credit are a very large and important source of
corporate finance in the economy. Almost 85% of firms in my sample obtained a line of credit between
1996 and 2003, and the line of credit represents an average of 16% of book assets. I also find that lines of
credit are utilized among firms that are completely equity financed; 32% of firm-year observations where
no outstanding debt is recorded on the balance sheet have an available unused line of credit. Firms with
access to public debt do not cease using revolving credit facilities: 95% of firm-year observations that
have corporate credit rating from S&P also have a bank line of credit, and line of credit borrowings
represent 12% of total debt outstanding for these firms.
The rest of this paper proceeds as follows. In Section I, I describe lines of credit, the existing
literature, the data, and summary statistics. In Section II, I describe the theoretical framework that
motivates the paper. Sections III through V present the empirical analysis, and Section VI concludes.
I. Description, Existing Research, Data, and Summary Statistics
A. Description and existing research
A firm that obtains a line of credit receives a nominal amount of debt capacity against which the
firm draws funds. Lines of credit, also referred to as revolving credit facilities or loan commitments, are
almost always provided by banks or financing companies. They can be provided by one bank or multiple
banks through syndication. The used portion of the line of credit is a debt obligation, whereas the unused
portion remains off the balance sheet. In terms of pricing, the firm pays a commitment fee that is a

8
percentage of the unused portion, and a pre-determined interest rate on any drawn amounts. Pricing and
maturity data are not always available directly from annual 10-K SEC filings; in a sample of 11,758 lines
of credit obtained by 4,011 public firms between 1996 and 2003 in Loan Pricing Corporation’s Dealscan,
the median commitment fee is 25 basis points, the median interest rate on drawn funds is 150 basis points
above LIBOR, and the median maturity is 3 years.
Corporations detail lines of credit in their annual 10-K SEC filings. Regulation S-K of the U.S.
Securities and Exchange Commission requires firms to discuss explicitly their liquidity, capital resources,
and result of operations (Kaplan and Zingales, 1997). All firms filing with the SEC therefore provide
information on the used and unused portions of bank lines of credit, and whether they are out of
compliance with financial covenants. For example, Lexent Inc., a broadband technology company,
details their line of credit in their FY 2000 10-K filing as follows:
At December 31, 2000, the Company had notes payable to banks aggregating $2.0 million under a $50 million collateralized revolving credit facility, which expires in November 2003. Borrowings bear interest at the prime rate or at a rate based on LIBOR, at the option of the Company. This credit facility is to be used for general corporate purposes including working capital. As of December 31, 2000, the prime rate was 9.5%.
In the 10-K filing, companies typically detail the existence of a line of credit and its availability in the
liquidity and capital resources section under the management discussion, or in the financial footnotes
explaining debt obligations.
Although information on credit lines is available in annual 10-K SEC filings, the existing
empirical research on bank lines of credit relies on alternative data sources. Ham and Melnik (1987)
collect data from a direct survey of 90 corporate treasurers. They find that draw downs on lines of credit
are inversely related to interest rate cost and positively related to total sales. Agarwal, Chomsisengphet,
and Driscoll (2004) examine the use of lines of credit for 712 privately held firms that obtained loans
from FleetBoston Financial Corporation. They also find that firms with higher profitability obtain larger
credit lines, which is consistent with evidence presented here. Berger and Udell (1995) use data on lines
of credit extended to small private businesses and show that firms with longer banking relationships pay

9
lower interest rates and are less likely to pledge collateral. Petersen and Rajan (1997) find that small
private businesses without access to bank credit lines rely more heavily on trade credit. Shockley and
Thakor (1997) focus on the contract structure of credit lines. While Kaplan and Zingales (1997) and
Houston and James (1996) present data on unused lines of credit, they do not explore the relationship
between lines of credit and firm characteristics. This paper is the first, to my knowledge, to
systematically analyze balances of used and unused bank lines of credit at public corporations.
B. Data
I begin with a Compustat universe that contains non-financial U.S.-based firms with at least 4
consecutive years between 1996 and 2003 of positive data on total assets (item 6), and 4 consecutive years
of non-missing data on total liabilities (item 181), total sales (item 12), a measure of EBITDA (item 13),
share price (item 199), shares outstanding (item 25), preferred stock (item 10), deferred taxes (item 35),
and convertible debt (item 79). These data limitations are governed by the necessity of these variables in
constructing basic financial characteristics of the firm. I also require firms to have 4 consecutive years of
book leverage ratios between 0 and 1. This yields a sample of 4,604 firms, which I follow from 1996
through 2003 (31,533 firm-year observations). I focus on the 1996 to 2003 period because annual 10-K
SEC filings are available electronically for all firms in the years after 1995, which makes the costs of data
collection much lower for this time period. I restrict the sample to firms with at least 4 consecutive years
of data because I am particularly interested in how line of credit use evolves for a given firm over time.
This sample, which I refer to as the “full” sample, forms the basis for the text searching program
described below which provides information on whether firms have a line of credit.
I then form a smaller data set based on a random sample of 300 firms, which I refer to as the
“random” sample. I randomly sample 300 firms from the 4,604 firms in the full sample, and I follow
them from 1996 through 2003, for a total unbalanced panel of 2,180 firm-year observations. The random
sample represents 6.5% of the firms in the full sample. The random sample forms the basis for manual
examination of annual 10-K SEC filings described below.

10
In the rest of this section, I describe the data searching process that produces measures of firms’
utilization of lines of credit. It is important to understand that the process is iterative. I first use the full
sample of annual 10-K SEC filings to search for certain phrases that are indicative of a firm’s having a
line of credit. I then use the random sample and manually read the annual 10-K SEC filings to assess
whether the search terms are providing an accurate or inaccurate portrayal of the firms that have bank
lines of credit. The search procedure described below is the final version of this iterative process
For the full sample, I link each firm-year observation from Compustat to the electronic version of
its annual 10-K SEC filing. I then search each filing for 7 terms: “credit lines,” “credit facility,”
“revolving credit agreement,” “bank credit line,” “working capital facility,” “lines of credit,” and “line of
credit.” In the initial pass through the text filings, I create a variable that is 1 if the annual 10-K SEC
filing has any of the search terms in the document, and 0 if the search terms are not in the 10-K filing.
This search algorithm leads to some errors in classifying whether firms in reality have a bank line
of credit or revolving credit facility. In terms of classifying the errors, the null hypothesis is that the firm-
year observation in question does not have a line of credit. A Type I error occurs when the search
program determines that the firm does have a bank line of credit (rejection of the null hypothesis) when it
in fact does not have a bank line of credit. A Type II error occurs when the search program determines
that the firm does not have a line of credit (acceptance of the null hypothesis) when it in fact does have a
line of credit.
In order to limit Type I errors, the search program produces a document that, for every firm-year
observation, contains the 10 lines of text before and after each occurrence of a search term in the 10-K
filing. Using this document, I manually search for obvious Type I errors. More specifically, I find
occurrences in which one of the search terms is directly proceeded with “no,” “do not have a,” “not have
any,” “retired our,” “terminated our,” and “equity.” I also search for the following phrases that may occur
right after one of the search terms: “expired,” “terminated,”, and “was terminated.” I manually conduct
this search for Type I errors, and make sure that each is in fact a Type I error before reclassifying the

11
firm-year observation as having no line of credit. This collection procedure results in a {0, 1} variable
measuring whether or not every firm in the full sample has access to a line of credit.
For the random sample of 300 firms, I manually collect detailed data on used and unused lines of
credit from annual 10-K SEC filings. It is important to emphasize that there is no search program used to
collect line of credit data for the random sample; they are collected manually. I collect data on whether
the firm has access to a line of credit and the used and unused portion of the line of credit. If a line of
credit backs up a commercial paper program, any outstanding commercial paper is subtracted from the
line of credit, but is not recorded as a used portion of the line of credit. Any balance of the back-up line
of credit that does not support outstanding commercial paper is recorded as an unused part of the line of
credit. This is consistent with the actual reporting done by firms. It is important to note that borrowers
with a commercial paper back up line of credit draw down the portion of the line that does not back up
outstanding commercial paper. Only 5 percent of firms in my sample have a commercial paper program,
and all results are robust to the complete exclusion of these firms.
One advantage of the random sample data collection is that it allows me to assess directly the
errors in the search program used for the full sample. In other words, by comparing the line of credit
collection from manual inspection with the search program in the random sample, I am able to assess the
number of Type I and Type II errors associated with the search program. I find the search program
produces Type I errors in 8.6 percent of all observations in the random sample, and Type II errors in 2.2
percent of all firm-year observations in the random sample.1
For the random sample, I also collect data on whether or not a firm is in violation of a financial
covenant associated with the line of credit; these are covenants that require the maintenance of financial
ratios.2 The SEC requires firms to report when they are in violation of a financial covenant: “companies
that are, or are reasonably likely to be, in breach of such covenants must disclose material information
about that breach and analyze the impact on the company if material (SEC (2003)).”
Core financial variables are calculated from Compustat and are defined as follows. Book debt is
short term debt plus long term debt (item 34 + item 9), all divided by total assets (item 6). Balance sheet

12
cash is measured using item 1. A measure of asset tangibility is tangible assets (item 8) divided by non-
cash total assets. The market to book ratio is defined as total assets less the book value of equity plus the
market value of equity less cash, all divided by non-cash total assets. The book value of equity is defined
as the book value of assets (item 6) less the book value of total liabilities (item 181) and preferred stock
(item 10) plus deferred taxes (item 35). The market value of equity is defined as common shares
outstanding (item 25) multiplied by share price (item 199). The primary measure of cash flow is EBITDA
(item 13) divided by non-cash total assets. Net worth—cash adjusted is defined as non-cash total assets
less total liabilities, divided by non-cash assets.
As further described in Section III, I scale cash flow, asset tangibility, net worth, and the market
to book ratio with non-cash book assets. I do so because firms are likely to jointly determine cash
holdings and line of credit usage. This joint determination leads to a mechanical negative correlation
between any measure scaled by total assets and the use of lines of credit. For example, suppose one
constructs the measure of tangibility as tangible assets scaled by total assets. Given that cash is included
in total assets, and given that firms without access to a line of credit hold higher cash balances, this
classification of asset tangibility leads to a mechanical negative correlation with lines of credit. A
disadvantage of using non-cash assets in place of total assets to scale cash flow and asset tangibility is that
it leads to extreme outliers. In order to reduce the influence of outliers, I Winsorize all financial variables
from Compustat at the 5th and 95th percentile.
I drop any firm-year observation for which any of the variables constructed above are missing.
The final full sample contains 4,503 firms (28,447 firm-year observations) and the final random sample
contains 300 firms (1,908 firm-year observations).
C. Summary statistics
[TABLE 1]
Table 1 contains summary statistics for the full sample (left panel) and the random sample (right
panel). In the full sample, 81.7% of firm-years have a line of credit. As discussed above, this percent is
overstated given the Type I errors associated with the search program. A more reliable estimate is 74.8%,

13
which is the percent of firm-years that have a line of credit in the random sample. Overall, 85% of firms
in the random sample have a line of credit at some point between 1996 and 2003. Using the hand-
collected data on line of credit balances in the random sample, I construct a variety of measures to assess
the magnitude of lines of credit in corporate liquidity management. On average, the total line of credit
represents 16% of book assets; the unused portion represents 10% of book assets and the used portion
represents 6%. Given total debt scaled by book assets is 0.21 in the random sample, this implies that used
lines of credit on average represent more than a quarter of outstanding debt balances among public firms.
These statistics suggests that lines of credit are widely used by public firms, and they represent large
amounts of used debt and unused debt availability.
In order to assess the importance of lines of credit in corporate liquidity management, I create two
measures of the bank liquidity to total liquidity ratio. The first measure is the total line of credit balance
scaled by the sum of total lines of credit and cash. The second measure is the unused line of credit
balance scaled by the sum of unused lines and cash. The second measure captures the fraction of liquidity
available to the firm in the form of lines of credit. The first measure takes into account mechanical
endogeneity concerns that certain types of firms consistently draw down heavily on existing lines of
credit. By either measure, bank liquidity represents about 50% of total liquidity available to firms, which
suggests that credit lines are an instrumental component of corporate liquidity.
[TABLE 2]
Table 2 provides additional evidence of the importance of credit lines. Firms from all major
industries heavily utilize this financial product. The lowest fraction of firms with lines of credit is in the
services industry, where 63% of firm-year observations have a line of credit. The highest use is in both
wholesale and retail trade, with over 90% of firm-year observations maintaining a line of credit. The
industry patterns most likely reflect a seasonal sales component, something I further explore in the results
below. A common measure of whether firms have access to public debt is whether they have a corporate
credit rating by S&P (Faulkender and Petersen (2006)). Table 2 demonstrates that firms with access to
public debt extensively utilize bank lines of credit. Almost 95% of firms with a corporate credit rating
14
have access to a line of credit, and outstanding line of credit balances represent (0.245*0.190*100 =)
4.7% of total assets. Given that total debt is 38% of total assets for these firms, this implies that 12% of
total debt outstanding for firms with a corporate credit rating is in the form of used lines of credit. The
evidence suggests that lines of credit are an important part of debt policy even for firms that have access
to public debt. Finally, the last two rows of Table 2 show that even firms that have no debt outstanding
have access to lines of credit. Conditional on having no debt outstanding, 32% of firm-years have an
unused line of credit available, and the unused line of credit represents 11% of total assets.
II. Theoretical Motivation
In this section, I motivate the empirical analysis by discussing the existing theoretical research in
two areas: cash holdings and bank lines of credit. I focus on how an empirical analysis of lines of credit
can help resolve unanswered questions in both of these areas.
ACW (2004) argue that cash holdings represent a safeguard against the inability to obtain
financing when valuable opportunities arise. They build a three period model in which investment
opportunities arrive in the first and second periods. Firms are either financially constrained or
unconstrained; firms fall into one of these categories based on the level of cash flows and the value of
collateral that the firm can pledge to creditors. In the initial period, unconstrained firms have no reason to
save cash out of initial cash flows; they can reduce dividends or raise more external financing in the
second period to pursue investment opportunities. Constrained firms, on the other hand, retain a portion
of their first-period cash flows to “hedge” against the inability to raise external financing in the second
period. The optimal level of saving out of cash flow weighs the cost of reducing investment in the first
period with the benefit of more investment in the second period. Constrained firms should therefore save
a higher proportion of their initial cash flows relative to unconstrained firms.
Empirical support for this framework is found in ACW (2004); Faulkender and Wang (2006)
(henceforth, FW); and Opler, Pinkowitz, Stulz, and Williamson (1999) (henceforth OPSW). ACW
(2004) sort their sample based on observable measures of financial constraints (payouts, size, and the
existence of third-party credit ratings), and find that more constrained firms save more cash out of cash

15
flow. FW (forthcoming) find that shareholders place higher value on an additional dollar of cash within
financially constrained firms, where the measures of financial constraints used are similar to those in
ACW (2004). OPSW (1999) find that larger firms and those with credit ratings hold less cash.
While the theoretical literature on cash is instructive, there are two shortcomings. First, the cash
literature does not provide direct insight into the precise financing constraint that prevents firms from
accessing external funds. The theoretical frameworks of ACW (2004) and FW (forthcoming) rely only on
a non-specific “limitation in [the] capacity to raise external finance” (ACW, p 1781). They do not take an
empirical stand on what the limitation is. Second, this literature does not discuss the importance of bank
lines of credit. As demonstrated in Tables 1 and 2, bank lines of credit are widely used by public firms,
yet the cash literature does not isolate how lines of credit and cash policy may be jointly determined.
This last shortcoming is especially important given that a large body of theoretical literature on
lines of credit argues that this financial product is designed to overcome precisely the types of capital
market frictions discussed in the cash literature. These papers include Berkovitch and Greenbaum (1991);
Boot, Thakor, and Udell (1987); Duan and Yoon (1993); Holmstrom and Tirole (1998); Morgan (1994);
and Shockley (1995).
I focus here on two of these papers I believe demonstrate the core intuition of these models.
Holmstrom and Tirole (1998) motivate the use of lines of credit by embedding a moral hazard problem
within a three-period model where a liquidity shock is realized in the second period. When the liquidity
shock is realized in the second period, the borrower must retain a large enough portion of the third period
return to motivate her to be diligent; in other words, there a standard moral hazard problem that forces the
borrower to retain a large stake in the project. Given this agency problem, the first best investment level
is unattainable. If the liquidity shock is large enough, the borrower will not be able to obtain funds even
if the project has positive NPV, given that she must retain enough of the project return to maintain
diligence. In the second best solution, the borrower buys liquidity insurance. One mechanism is a line of
credit.3 In the first period, creditors provide a commitment to lend in the second period up to a certain
point. When the liquidity shock is realized, the borrower has access to committed funds. In some states
16
of the world, the creditors end up losing money in the second period, but they break even in expectation.
This is the intuition of the liquidity insurance in the model.
Boot, Thakor, and Udell (1987) also use a basic agency problem to motivate corporate demand
for lines of credit. They employ a three-period model with an agency problem, where borrowers select an
effort level in the first period and choose whether to invest or not in the second period. The moral hazard
problem arises because the effort decision is unobservable to creditors. In the Boot, Thakor, and Udell
(1987) model, there is a stochastic interest rate realized in the second period that serves a role similar to
that of the liquidity shock in Holmstrom and Tirole (1998). If interest rates are too high in the second
period, borrowers anticipate a low expected return from the project and thus choose low effort. In other
words, high interest rates in the second period lower the return to effort, which leads managers at
borrowing firms to shirk. In the second period, banks fully predict such behavior, and thus ration credit.
A line of credit signed in the first period solves this problem by charging an up-front fee and guaranteeing
a low rate of interest in the second period. Thus, the line of credit serves as interest rate protection which
can guarantee that borrowers put in high effort initially.
According to the theoretical literature, lines of credit are committed liquidity insurance that
should protect firms against future capital market frictions. In addition, Kashyap, Rajan, and Stein (2002)
find that banks have natural cost advantages in the provision of liquidity given deposit-based financing.
Likewise, Gatev and Strahan (2006) find that banks are better liquidity providers given that deposits flow
into banks during aggregate financial crises.
The theoretical literatures on lines of credit and banks’ advantages in liquidity provision suggest
that firms should rely fully on bank lines of credit in their liquidity management. This, in some sense, is
the null hypothesis that is rejected by the cash literature. Clearly, lines of credit do not provide sufficient
liquidity insurance for all firms in the economy. The primary goal of this paper is to resolve empirically
these two research areas by exploring what determines whether firms use cash or lines of credit in
corporate liquidity management. More specifically, I examine whether low cash flow, low asset
tangibility, small size, low firm net worth, or low market to book ratios make lines of credit difficult to

17
obtain and maintain. This analysis should provide insight into the precise friction that makes lines of
credit a poor liquidity substitute for cash for some firms.
There are three additional hypotheses from the line of credit theoretical literature that I examine
in the empirical analysis. First, the models assume that basic agency problems due to information
asymmetry motivate the use of lines of credit. In other words, firms where management actions are less
transparent are more likely to use lines of credit. Second, a bank line of credit must provide some degree
of “commitment” if it is to improve on spot market financing. If banks can fully renegotiate the line of
credit in the interim period, the contract will not improve on spot market financing. In the line of credit
models described above, the optimal behavior for the bank in some states of the interim period is to
restrict access to the line of credit. The empirical section of this paper attempts to quantify the extent to
which lines of credit represent unconditional obligations of banks. The third main empirical hypothesis
that comes from these models is that it can be difficult for firms to raise capital in spot markets when
investment opportunities arrive or change. Lines of credit provide a particularly flexible source of debt
financing that can be drawn upon with fewer difficulties. Lines of credit should therefore be used in
industries with higher earnings or sales volatility.
III. Lines of Credit versus Cash
A. Empirical specification
In this section, I conduct estimations to examine which firm characteristics influence the decision
to utilize lines of credit as opposed to cash in corporate liquidity management. There are two sets of
dependent variables. First, I examine a {0,1} indicator variable for whether the firm has a line of credit.
For this dependent variable, I examine the effect of firm characteristics on the probability of having a line
of credit using maximum likelihood probit estimation. Second, I examine the bank liquidity to total
liquidity ratio, which varies from 0 to 1. For this dependent variable, I examine the effect of firm
characteristics on the ratio using linear (OLS) estimation. When I examine the bank liquidity to total
liquidity ratio, I also examine the intensive margin for which I isolate the sample to only firms that have a
line of credit. 4 I examine the intensive margin independently to demonstrate that cash flow is positively

18
correlated with the bank liquidity to total liquidity ratio, even among firms that have a line of credit. In
all regressions, standard errors are clustered at the firm level and all regressions include year and 1-digit
SIC industry indicator variables.5
The variables in the matrix X are motivated by the theoretical framework outlined in Section II.
First, I examine firm characteristics likely to be associated with firms facing a high cost of external
relative to internal finance. In other words, I attempt to explain why firms may be forced to rely on
internal cash as opposed to using a bank line of credit. I use five measures. First, firm cash flow is
measured as EBITDA scaled by non-cash total assets. I employ EBITDA because it is the most common
measure of cash flow used by commercial banks when setting various types of covenants on lines of
credit. All results are robust to a more common measure of cash flow: the sum of EBIAT and
depreciation, all scaled by non-cash total assets. Second, asset tangibility is measured as tangible assets
scaled by non-cash total assets. Third, firm size is measured as the natural logarithm of non-cash total
assets. I also include net worth scaled by non-cash assets and the market to book ratio.
I employ non-cash total assets as opposed to total assets to scale variables. As mentioned in
Section I, I scale by non-cash total assets because firms are likely to jointly determine cash balances and
their utilization of lines of credit when setting corporate financial policy. The use of cash in the
denominator of the variables in the matrix X will therefore lead to a mechanical negative correlation. For
example, a key finding of the paper is that firms with low cash flow scaled by non-cash assets are less
likely to utilize a line of credit. This negative correlation between cash flow and line of credit utilization
is mechanical if cash is included in the assets measure used to scale cash flow, as long as cash flows are
positive on average. For the same nominal cash flow, firms without a line of credit will hold more cash
than firms with a line of credit, which will mechanically lead to a lower level of cash flow scaled by total
assets for the firms that do not have a line of credit. Consistent with this mechanical bias, the negative
correlation between cash flow and the utilization of lines of credit is much stronger if I scale by total
assets as opposed to non-cash assets.
19
In addition to determining what factors force firms to rely on cash instead of lines of credit, the
empirical analysis also attempts to quantify the importance of information asymmetry and business
variability on the use of lines of credit. I construct measures of information asymmetry that are consistent
with measures in Faulkender and Petersen (2006) and Sufi (2006). Firms with equity that is not traded on
a major exchange receive less analyst coverage and media attention. Likewise, firms that are not in one
of the three main S&P indices (the S&P 500, the S&P Midcap 400, and the S&P Smallcap 600) also
receive less attention. I use an indicator variable for whether the firm’s equity trades only over the
counter and I use an indicator for whether the firm is NOT included in one of the main S&P indices to
measure information asymmetry. Older firms are also more likely to be known to capital markets. I
include the natural logarithm of 1 + the years since the firm’s IPO as an additional measure of
information asymmetry. The year of the firm’s IPO is approximated using the first year in Compustat
that the firm’s share price is available.
I use two variables to measure business variability. First, I include the median within-year
standard deviation of sales for all firms in the given firm’s 3-digit SIC code industry.6 I refer to this
variable as seasonality. Firms in 3-digit industries that show a larger degree of seasonality in sales may
desire lines of credit to manage working capital and inventories. I also include a measure of the
variability of cash flow, which is based on the measure used in Mackie-Mason (1990). It represents the
standard deviation of annual changes in the level of EBITDA over a lagged 4 year period, scaled by
average non-cash assets in the lagged period.
B. Results
[TABLE 3]
Columns 1 and 2 of Table 3 report coefficient estimates from maximum likelihood probit
estimation relating the probability of having a line of credit to various firm characteristics. Column 1
shows results from the full sample and column 2 shows results from the random sample. Firm cash flow
has a strong positive effect on the probability a firm utilizes a line of credit. The coefficient estimate in
column 2 suggests that a two standard deviation increase in cash flow (0.7) at the mean leads to an
20
(0.7*0.124*100 =) 9% increase in the probability of obtaining a line of credit, which is almost a one
quarter standard deviation increase. Consistent with evidence that high market-to-book firms use less
debt generally, there is a negative correlation between the market-to-book ratio and the probability of
having a line of credit. Size is also a strong statistical predictor of the use of bank lines of credit. A two
standard deviation increase in the natural logarithm of total assets (4) leads to a (4*0.052*100 =) 21%
increase in the probability of obtaining a line of credit, which is more than one-half standard deviation.
In terms of business variability, the coefficient estimates in columns 1 and 2 suggest that 3-digit
SIC code within-year sales volatility has a positive effect on the use of lines of credit. The effect of the
sales seasonality variable would be even stronger in the absence of the 1-digit SIC industry fixed effects.
There is no statistically strong evidence that information asymmetry has an effect on the probability of
utilizing a line of credit.
[FIGURE 1]
The results in columns 1 and 2 suggest that firms with low levels of cash flow are less likely to
utilize bank lines of credit. Figure 1 shows that they use cash instead. It maps both the fraction of firms
that have a line of credit and the mean cash scaled by total assets across the cash flow distribution. There
is strong evidence of a negative correlation of line of credit use and cash holdings across the cash flow
distribution, especially at the low end. Moving from the lowest decile to the 5th decile of cash flow leads
to a monotonic increase in the probability of obtaining a line of credit from 40% to over 90%.
Alternatively, cash balances decline from over 55% of total assets to less than 10% of total assets.
Interestingly, there is an opposite trend at the very high end of the cash flow distribution in the 9th
and 10th decile, where firms on average become less likely to use a line of credit and more likely to hold
cash balances. This trend is driven by firms like Microsoft. They are much more likely to be in services
industries, much less likely to use debt financing, and have much higher market to book ratios than firms
in the high cash flow deciles that use lines of credit. The opposite pattern at the high end of the cash flow
distribution is captured by the market to book and industry controls in the regression results, which is why
they do not influence the positive effect of cash flow on line of credit utilization.

21
Figure 1 suggests that there is an explicit trade-off across the cash flow distribution in firms’
utilization of bank lines of credit versus cash in corporate liquidity management. Columns 3 through 6 of
Table 3 examine the bank liquidity to total liquidity ratio and present coefficient estimates that are
consistent with this evidence. Columns 3 and 4 examine total lines of credit scaled by the sum of total
lines of credit and cash balances, whereas columns 5 and 6 examine unused lines of credit scaled by the
sum of unused lines of credit and cash balances. Consistent with Figure 1, columns 3 through 6 show a
positive correlation between lagged cash flow and the bank liquidity to total liquidity ratio. The
magnitude of the coefficient in column 3 suggests that moving from the 10th to 90th percentile of the cash
flow distribution leads to a (0.7*0.11*100/0.51 =) 15% increase in the bank liquidity to total liquidity
ratio at the mean. Size also is a strong predictor of the use of lines of credit versus cash by firms. The
coefficient estimate on cash flow volatility is negative and statistically distinct from 0 at the 1 percent
level in column 3, and 5 percent in column 5. This suggests that firms with high cash flow volatility rely
more on cash in their liquidity management. This evidence is consistent with the notion that firms with
high cash flow volatility may prefer to avoid cash-flow based financial covenants associated with lines of
credit, something I explore further in the next section.
The use of the bank liquidity to total liquidity ratio in Table 3 also helps mitigate concerns that
omitted variables correlated with a firm’s demand for overall liquidity are influencing the positive
correlation between line of credit usage and cash flow. The bank liquidity to total liquidity ratio isolates
the relative attractiveness of lines of credit versus cash, while controlling for overall liquidity. Firms with
low cash flow may have higher or lower demand for liquidity, but the important result in Table 3 is that
they prefer to hold cash balances relative to lines of credit.7
One key question is whether the results in columns 3 and 5 are driven uniquely by the extensive
margin. In other words, are these results robust when one examines only firms that have a line of credit?
Columns 4 and 6 suggest that, conditional on having a line of credit, firms with higher cash flow and
larger firms rely more heavily on lines of credit in their liquidity management. The coefficients are
22
weaker, both statistically and in magnitude. However, they suggest that the positive effect of cash flow
on the use of lines of credit is robust when isolating only the intensive margin of use.
[TABLE 4]
There is an economically meaningful and statistically robust correlation between a firm’s lagged
cash flow and its use of a line of credit. Table 4 presents results that help to explain this correlation. In
particular, I examine how the effect of cash flow on line of credit utilization varies across firms with high
and low probabilities of financial distress. I split firms into high and low distress likelihood groups based
on whether they are below or above the sample median z-score.8 I then replicate specifications 1, 2, and 5
from Table 3 with the inclusion of an indicator variable for low distress likelihood and an interaction term
of this variable with cash flow. In all three specifications, there is a positive correlation between having
low distress likelihood and the utilization of a line of credit. In addition, the effect of cash flow on
utilization of a line of credit is statistically significantly more negative for firms with low distress
likelihood. In other words, the positive effect of cash flow on line of credit utilization is unique among
firms with high distress likelihoods, as evidenced by the positive coefficient on non-interacted cash flow.
The evidence in Table 4 suggests that firms with higher distress likelihood prefer cash to lines of credit,
unless they have high cash flow. In the next section, I explore how cash-flow based financial covenants
may help explain this pattern of results.
IV. The Importance of Cash-Flow Based Financial Covenants
There is a robust and economically significant positive correlation between a firm’s cash flow and
its use of lines of credit versus cash. This correlation is particularly strong among firms with high distress
likelihoods. In this section, I explore how cash-flow based financial covenants on lines of credit help
explain these results. Violations of financial covenants are an important part of understanding why firms
may or may not use lines of credit. Overall, of the 255 firms in the random sample that utilize a line of
credit, 90 violate a financial covenant. In other words, 35% of firms that utilize a line of credit commit a
covenant violation.

23
Financial covenants on a line of credit require the maintenance of financial ratios. Financial
ratios are specified in the initial contract, and the borrower is in default of the loan agreement if a ratio is
not satisfied. These violations are referred to as “technical defaults,” and the lender has the legal right to
accelerate the loan in response to the violation. While most covenant violations are renegotiated, the
terms of the loan can change significantly.
[TABLE 5]
Table 5 presents evidence from LPC’s Dealscan on financial covenants. The sample includes
11,758 sole lender and syndicated lines of credit obtained by non-financial public corporations (firms
with a ticker) from 1996 to 2003. Almost 72% of all lines of credit in the sample have information on
financial covenants. Coverage covenants, which are written on a measure of cash flow divided by an
interest, debt service, or fixed charge expense, are the most common type of financial covenant, occurring
on 70% of lines that have financial covenant information. The second most common type of covenant is
a debt to cash flow covenant, which is on 49% of lines that have financial covenant information, followed
by net worth covenants. Current ratio and leverage ratio-based covenants are less common. In fact, only
25% of lines of credit that have financial covenant information do not have a cash-flow based covenant.
The evidence from Table 5 suggests that maintenance of cash flow is critical to avoiding non-compliance
with financial covenants on lines of credit. 9
[TABLE 6]
Why do firms violate covenants? Unfortunately, the SEC does not require firms to disclose why
they are in violation of covenants. Previous studies using data from the 1980s examine SEC filings and
find evidence that net worth and current ratio covenant violations are the most common (Beneish and
Press (1993), Chen and Wei (1993)). However, both of these studies report that large numbers of
violators do not report why the violation occurs (almost 25% in Beneish and Press (1993) and almost 50%
in Chen and Wei (1993)). Consistent with these earlier studies, a large fraction of firms in the random
sample do not report exactly which covenant is violated. Selective reporting by firms may lead to
systematic bias if, for example, firms are less likely to disclose information when cash-flow based
24
covenants are violated as opposed to current-ratio based covenant violations. Instead of relying on self-
reporting, I conduct a statistical analysis to determine what financial factors have the strongest power in
predicting a covenant violation. More specifically, Table 6 reports coefficient estimates from the
following firm fixed effects linear specification:
it i t it itViolation Xα α β ε= + + + (1)
In this specification, Xit is a matrix that includes measures on which banks write covenants: cash flow, the
leverage ratio, net worth, and the current ratio. Given the influence of size on the utilization of lines of
credit, I also include firm size in X. The vector of coefficient estimates of β describes whether reductions
in cash flow, reductions in net worth, increases in leverage, or decreases in current ratios lead to credit
line covenant violations. The sample for the estimation of (2) includes only firm-years where a line of
credit is present, and standard errors are clustered at the firm level.10
Column 1 of Table 6 shows that a drop in cash flow leads to a large increase in the probability of
violating a covenant. The firm fixed effects coefficient estimate has a t-statistic above 5, where standard
errors are clustered at the firm and there are 255 firms in the sample. The magnitude suggests that a firm
that moves from the 90th to the 10th percentile of cash flow scaled by lagged assets has an increase in the
probability of default of (0.32*0.58*100 = ) 19%. Considering that the mean of the left hand side
variable is 11% in this sample, this represents an increase in the probability of default of 160% at the
mean. Drops in cash flow strongly predict financial covenant violations.
In column 2, I include other measures on which banks place covenants. The only other variable
that affects the probability of a covenant violation is the leverage ratio. The magnitude of the coefficient
suggests that going from the 10th to the 90th percentile in leverage has an increase in the probability of
default of (0.47*0.59*100=) 27%, which is stronger than the effect of cash flow. However, the effect of
leverage is not as statistically reliable, given that the effect is only significant at the 5% level with a t-
statistic of 2.41. The t-statistic for the negative coefficient on cash flow in column 2 is -4.35. Other
measures on which covenants are placed, including net worth, the current ratio, the market to book ratio,

25
and total assets, have no statistically significant effect on the probability of a covenant violation when
included with cash flow and the leverage ratio. This evidence is consistent with data from Dealscan in
Table 5: cash flow and leverage ratios are the most common component of financial covenants, and they
are also the most powerful predictors of covenant violations.
[FIGURE 2]
What happens to the availability of the line of credit when a firm defaults on its covenants?
Figure 2 focuses on the 90 firms in the sample that violate a financial covenant during the sample period.
It maps the total, used, and unused lines of credit to lagged total assets ratios relative to the default year.
The data are “default-time scaled” so that t=0 is the year that the firm initially defaults on a financial
covenant in its credit agreement. Figure 2 shows that the used portion of the line of credit increases
directly before the firm defaults on a covenant. When a firm defaults, there is a subsequent reduction in
the availability of the total, used, and unused line of credit at t+1. The unconditional means suggest that
the bank reduces the availability of the total line of credit from 0.259 to 0.197, or about 25 percent, in the
year after a covenant violation. From the year before the violation to the year after the violation, the
unused portion of the line of credit goes from 0.165 to 0.086, a reduction of almost 50%. The results in
Figure 2 suggest that the availability under a line of credit is conditional on the maintenance of covenants.
Columns 3 through 6 of Table 6 present estimates showing the effect of a covenant violation on
the available balances of lines of credit. More specifically, I estimate the fixed effects equation:
, 1 , 1*it i t i t i t itLine X Violationα α β γ ε− −= + + + + (2)
The sample includes only those firm-year observations where a line of credit was present at t-1. Standard
errors are clustered at the firm level. The results in columns 3 and 4 demonstrate that a default at t-1 leads
to a reduction in the total and unused line of credit scaled by lagged assets of 0.041 and 0.036, which is 18
and 26 percent at the mean of the left hand side variable, respectively. The coefficient estimates in
columns 5 and 6 demonstrate a comparable reduction in the bank liquidity to total liquidity ratios of
between 10 and 20%. It is important to note that the regression specification controls for all variables that

26
are shown in columns 1 and 2 of Table 6 to predict covenant violations. In other words, even controlling
for the financial factors leading to covenant violations, a covenant violation has an independently large
and statistically significant effect on the availability of lines of credit.
These findings help explain why firms with low cash flow are less likely to use lines of credit,
and why firms with low cash flow and high cash flow volatility rely more heavily on cash in corporate
liquidity management. Firms with low cash flow are more likely to violate financial covenants, and
violations of covenants lead to a restriction in the availability of the line of credit.
These results also empirically quantify the degree to which lines of credit represent unconditional
liquidity available to the firm in all future states. Lines of credit are not totally unconditional obligations
of banks; banks use covenant violations to restrict the availability of the line of credit. The evidence is
consistent with Rajan and Winton (1995) and Park (2000) who argue that covenants facilitate bank
monitoring. Banks appear to use covenant violations to reassess their lending position with a borrower.
V. Access to a Line of Credit and Financial Constraints
In this section, I examine whether access to a line of credit is a more statistically powerful
measure of financial constraints than measures previously used in the literature. In particular, I relate my
findings with the empirical findings of ACW (2004). Their important theoretical insight, described above
in Section II, is that firms facing capital market frictions are more likely to save cash out of cash flow.
They empirically examine their model by sorting a firm into financially constrained and unconstrained
categories based on four measures: the payout ratio of the firm, the size of the firm, whether the firm has a
bond rating, and whether it has a commercial paper rating.11 In this section, I use access to lines of credit
as a measure of financial constraints: a firm is considered unconstrained if it (a) has access to a line of
credit in every year of the sample, and (b) maintains cash flow above the median in every year of the
sample. The latter part of the definition reflects the fact that firms with low cash flow are at risk of
violating a covenant and losing access to their line of credit; therefore, they are likely to face capital
market frictions and have a reason to save cash out of cash flow. A firm that does not satisfy either part
of the definition is considered constrained. Given that theoretical research emphasizes the importance of

27
bank lines of credit in reducing potential financial constraints and providing liquidity, this categorization
is a natural extension of ACW (2004).
[TABLE 7]
Table 7 presents the unconditional correlations between the measures of financial constraints used
in ACW (2004) and the measure based on access to lines of credit. As the first column demonstrates, the
measures are positively correlated. In terms of magnitudes, the credit line access measure is most
correlated with the commercial paper rating measure of financial constraints. While there is a positive
correlation between having access to a line of credit and other measures of financial constraints, it is
smaller than the correlations of the other measures with each other. This suggests that access to a line of
credit may provide additional statistical power beyond the traditional measures used in the literature.
[TABLE 8]
Table 8 examines the cash flow sensitivity of cash for various sub-samples based on measures of
financial constraints used in ACW (2004). More specifically, the coefficient estimates presented in Table
8 are the outcome of firm fixed effects regressions relating the difference in cash holdings from t-1 to t on
cash flow, a measure of investment opportunities (Q) and the natural logarithm of total assets, all
measured at time t. The estimations replicate the estimations that generate results reported in Table III of
ACW (2004). Each coefficient estimate in Table 8 represents the effect of cash flow on cash holdings
from a separate regression for a different sub-sample.
In Panel A, I focus on the line of credit measure. Column 1 shows that firms that are constrained
according to the line of credit measure save cash out of cash flow, whereas firms that are unconstrained
do not save cash out of cash flow; the difference in the coefficient estimates is statistically distinct from 0
at the 1% level. The evidence is consistent with the intuition in ACW (2004): firms with access to lines
of credit are less likely to face a high external cost of capital and therefore save no cash out of cash flow.
On the other hand, firms without access to a line of credit are likely to face a high external cost of capital,
and therefore save cash out of cash flow.

28
Firms that are constrained according to the line of credit measure can be constrained for one of
three reasons: (a) they do not have a line of credit in every year in which they are in the sample and have
low cash flow, (b) they have a line of credit in every year but have low cash flow, (c) they have high cash
flow but they do not have a line of credit in every year. Columns 2, 3, and 4 report the cash flow
estimates after splitting the constrained group into these 3 respective sub-groups. Firms that have low
cash flow and do not have a line of credit in every year of the sample show the largest cash flow
sensitivity of cash, followed by firms that have a line of credit in every year of the sample but have low
cash flow. The estimate in column 3 of Panel A suggests that firms that have access to a line of credit and
low cash flows continue to save cash out of cash flow despite having access to a line of credit. This is
consistent with evidence presented in the previous section on the importance of cash-flow based
covenants: firms for whom the line of credit is likely to be revoked due to a financial covenant violation
are the same firms that continue to save cash out of cash flow. Firms that have high cash flow but do not
have a line of credit show a positive cash flow sensitivity of cash, but it is not statistically distinct from 0
at a reasonable confidence level.
In column 1 of Panel B, I replicate the procedure using the ACW (2004) measures of financial
constraints. The ordering of the point estimates is consistent with their findings in every category except
the payout ratio categorization. Smaller firms, firms without an S&P corporate credit rating, and firms
without an S&P commercial paper rating save cash out of cash flow. At the same time, large firms and
firms with credit ratings do not save cash out of cash flow. The magnitudes of the coefficients are almost
identical for all financial constraints categorizations except the payout ratio.
In columns 2 and 3 of Panel B, I examine whether the availability of lines of credit adds
statistical power to the measures used in ACW (2004). For each of their measures of financial
constraints, I split the “constrained” sample further based on whether the firm is constrained or
unconstrained by the credit line access measure. As the reported estimates in columns 2 and 3
demonstrate, the positive effect of cash flow on cash holdings among their constrained firms is driven
exclusively by firms that do not have access to lines of credit. In other words, firms that ACW (2004)

29
classify as constrained but have access to a line of credit show no statistically significant positive
relationship between cash flow and cash holdings. The results suggest that firms that have access to a line
of credit are not financially constrained, even if they are classified as constrained by the ACW (2004)
measures. Overall, the results in columns 2 and 3 of Panel B suggest that the measures of financial
constraints used in ACW (2004) are accurate measures of financial constraints on average. However, a
measure of the availability of bank lines of credit adds important information that improves the cash-cash
flow sensitivity estimates.
VI. Conclusion
Bank lines of credit, or revolving credit facilities, are an instrumental component of corporate
liquidity management. Theoretical research on credit lines argues that this financial instrument should
resolve future capital market frictions facing firms. Existing research also suggests that banks can
provide liquidity to firms more efficiently than reliance on internal cash. However, empirical findings
from the cash literature suggest that cash plays an important liquidity role for certain firms in the
economy. While these two areas are related, there has been very little interaction between the two.
Extant research does not discuss why some firms utilize lines of credit while others rely on cash for
liquidity. This paper attempts to bridge the gap between these two areas. In particular, I examine the
factors that lead firms to utilize bank lines of credit instead of cash in corporate liquidity management.
The principal finding of the paper is that firm cash flow is a strong predictor of whether a firm
uses bank lines of credit or cash in corporate liquidity management. Firms with low cash flow or high
cash flow volatility rely more heavily on cash. The positive correlation between lagged cash flow and the
use of lines of credit is robust to both the extensive margin of use (whether a firm obtains a line of credit),
and the intensive margin (conditional on having a line of credit, how large a fraction the credit line is of
firm liquidity). Finally, the positive correlation exists only among firms with a high probability of
financial distress; in other words, if a firm has high distress likelihood, then high cash flow is critical to
obtaining a line of credit.
30
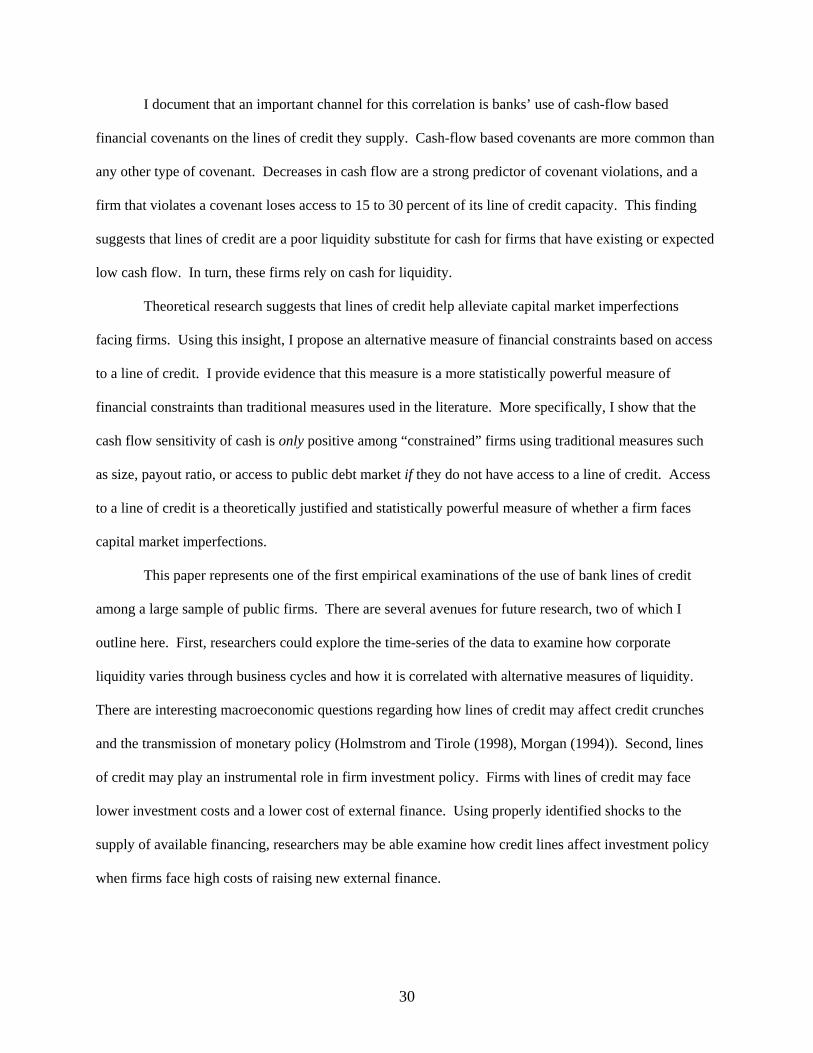
I document that an important channel for this correlation is banks’ use of cash-flow based
financial covenants on the lines of credit they supply. Cash-flow based covenants are more common than
any other type of covenant. Decreases in cash flow are a strong predictor of covenant violations, and a
firm that violates a covenant loses access to 15 to 30 percent of its line of credit capacity. This finding
suggests that lines of credit are a poor liquidity substitute for cash for firms that have existing or expected
low cash flow. In turn, these firms rely on cash for liquidity.
Theoretical research suggests that lines of credit help alleviate capital market imperfections
facing firms. Using this insight, I propose an alternative measure of financial constraints based on access
to a line of credit. I provide evidence that this measure is a more statistically powerful measure of
financial constraints than traditional measures used in the literature. More specifically, I show that the
cash flow sensitivity of cash is only positive among “constrained” firms using traditional measures such
as size, payout ratio, or access to public debt market if they do not have access to a line of credit. Access
to a line of credit is a theoretically justified and statistically powerful measure of whether a firm faces
capital market imperfections.
This paper represents one of the first empirical examinations of the use of bank lines of credit
among a large sample of public firms. There are several avenues for future research, two of which I
outline here. First, researchers could explore the time-series of the data to examine how corporate
liquidity varies through business cycles and how it is correlated with alternative measures of liquidity.
There are interesting macroeconomic questions regarding how lines of credit may affect credit crunches
and the transmission of monetary policy (Holmstrom and Tirole (1998), Morgan (1994)). Second, lines
of credit may play an instrumental role in firm investment policy. Firms with lines of credit may face
lower investment costs and a lower cost of external finance. Using properly identified shocks to the
supply of available financing, researchers may be able examine how credit lines affect investment policy
when firms face high costs of raising new external finance.

31
Figure Legends Figure 1:
Figure 1 maps the mean cash to total assets ratio and the fraction of firms that have a line of
credit by lagged cash flow decile. Going from left to right is going from firms in the lowest cash
flow decile to firms in the highest cash flow decile.
Figure 2:
Figure 2 maps the availability of lines of credit around a covenant violation. Time t = 0 is the
year in which the covenant violation takes place, and the x axis represents the availability of the
line in years before and after the covenant violation.

32
References
Almeida, H., M. Campello, and M. Weisbach, 2004, “The Cash Flow Sensitivity of Cash,” Journal of
Finance, 59, 1777-1804
Altman, E., 1968, “Financial Ratios, Discriminant Analysis and the Prediction of Corporate Bankruptcy,”
Journal of Finance, 23, 589-609
Agarwal, S., S. Chomsisengphet, and J. Driscoll, 2004, “Loan Commitments and Private Firms,” FEDS
Working Paper No. 2004-27, April.
Beneish, M., and E. Press, 1993, “Costs of Technical Violation of Accounting-Based Debt Covenants,”
The Accounting Review, 68, 233-257.
Beneish, M., and E. Press, 1995, “The Resolution of Technical Default,” The Accounting Review, 70,
337-353.
Berger, A. and G. Udell, 1995, “Relationship Lending and Lines of Credit in Small Firm Finance,”
Journal of Business, 68, 351-381.
Berkovitch, E. and S. Greenbaum, 1991, “The Loan Commitment as an Optimal Financing Contract,”
Journal of Financial and Quantitative Analysis, March, 83-95.
Boot, A., A. Thakor, and G. Udell, 1987, “Competition, Risk Neutrality, and Loan Commitments,”
Journal of Banking and Finance, 11, 449-471.
Chen, K. and K.C. Wei, 1993, “Creditors’ Decisions to Waive Violations of Accounting-Based Debt
Covenants,” The Accounting Review, 68, 218-232.
Dichev, I., and D. Skinner, 2001, “Large Sample Evidence on the Debt Covenant Hypothesis,” Working
Paper, University of Chicago.
Duan, J. and S. Yoon, 1993, “Loan Commitments, Investment Decisions, and the Signaling Equilibrium,”
Journal of Banking and Finance, 17, 645-661.
Faulkender, M., and M. Petersen, 2006, “Does the Source of Capital Affect Capital Structure?” The
Review of Financial Studies, 19, 45-79.
Faulkender, M. and R. Wang, 2006, “Corporate Financial Policy and the Value of Cash,” Journal of

33
Finance, 61, 1957-1990.
Gatev, E. and P. Strahan, 2006, “Banks’ Advantage in Hedging Liquidity Risk: Theory and Evidence
from the Commercial Paper Market,” Journal of Finance, 61, 867-892.
Ham, J. and A. Melnik, 1987, “Loan Demand: An Empirical Analysis using Micro Data,” Review of
Economics and Statistics, 69, 704-709.
Holmstrom, B. and J. Tirole, 1998, “Private and Public Supply of Liquidity,” Journal of Political
Economy, 106, 1-40.
Houston, J. and C. James, 1996, “Bank Information Monopolies and the Mix of Private and Public Debt
Claims,” Journal of Finance, 51, 1863-1889.
Kaplan, S. and L. Zingales, 1997, “Do Investment-Cash Flow Sensitivities Provide Useful Measures of
Financing Constraints?” Quarterly Journal of Economics, 112, 169-215.
Kashyap, A., R. Rajan, and J. Stein, 2002, “Banks as Liquidity providers: An Explanation for the Co-
existence of Lending and Deposit-taking,” Journal of Finance, 57, 33-73.
Mackie-Mason, J., 1990, “Do Taxes Affect Corporate Financing Decisions?” Journal of Finance, 45,
1471-1493.
Martin, J. S. and A. Santomero, 1997, “Investment Opportunities and Corporate Demand for Lines of
Credit,” Journal of Banking and Finance, 21, 1331-1350.
Morgan, D., 1994, “Bank Credit Commitments, Credit Rationing, and Monetary Policy,” Journal of
Money, Credit, and Banking, 26, 87-101.
Opler, T., L. Pinkowitz, R. Stulz, and R. Williamson, 1999, “The Determinants and Implications of
Corporate Cash Holdings,” Journal of Financial Economics, 52, 3-46.
Park, C., 2000, “Monitoring and the Structure of Debt Contracts,” Journal of Finance, 55, 2157-2195.
Petersen, M., and R. Rajan, 1997, “Trade Credit: Theories and Evidence,” Review of Financial Studies,
10, 661-692
Rajan, R. and Andrew W., 1995, “Covenants and Collateral as Incentives to Monitor,” Journal of
Finance, 47, 1367-1400.
34
SEC, 2003, Interpretation: Commission guidance regarding management’s discussion and analysis of
financial condition and results of operations, available at: http://www.sec.gov/rules/interp/33-
8350.htm.
Shockley, R., 1995, “Bank Loan Commitments and Corporate Leverage,” Journal of Financial
Intermediation, 4, 272-301.
Shockley, R. and A. Thakor, 1997, “Bank Loan Commitment Contracts: Data Theory and Tests,”
Journal of Money, Credit, and Banking, 29, 517-534.
Sufi, A., 2006, “Information Asymmetry and Financing Arrangements: Evidence from Syndicated
Loans,” Working Paper, University of Chicago GSB; forthcoming in the Journal of Finance.

35
1 The relatively large number of type I errors in the full sample (8.6%) is a disadvantage of the data collection
procedure. However, these errors are likely to be random. They are based only on slight variations in language used
in the annual reports, and are not systematic in any way. Therefore, these errors should bias coefficients toward 0 in
the regression analysis.
2 The material adverse change clause (MAC) is also an important feature in bank loan agreements. However, I find
little evidence from annual 10-K SEC filings that this clause is invoked with frequency.
3 Holmstrom and Tirole (1998) emphasize that the line of credit must be irrevocable, and that the liquidity shock is
verifiable. In other words, there is no possibility that borrowers misallocate the funds available under the line of
credit. In addition, Holmstrom and Tirole (1998) emphasize that other types of financing arrangements may serve
the purpose of a bank line of credit in their model, as long as the arrangement provides unconditional financing.
4 Alternatively, I use a maximum likelihood tobit specification to simultaneously capture the extensive and intensive
margin. Results (unreported) are qualitatively similar.
5 I use 1-digit SIC indicator variables instead of more disaggregated industry indicators because the use of finer
industry controls results in the loss of observations in the random sample when conducting the maximum likelihood
probit estimation (given perfect prediction in more disaggregated industry groups). The core results of the analysis
are either the same or slightly stronger when I use 2-digit SIC indicator variables, but this results in a loss of 262
observations (out of 1,908) in the probit estimation in the random sample.
6 This variable is constructed as follows: I use the entire set of firms with data available in the Compustat quarterly
industrial files. For every firm-year, I calculate the standard deviation of the quarterly differences in sales, scaled by
average assets over the year. I then obtain the median across all 3-digit SIC industries, for every given year. This
variable is then merged onto each firm-year observation with the same 3-digit SIC code. This measure is similar to
the earnings variance measure used in Mackie-Mason (1990).
7 An alternative concern is that the results in Table 3 are consistent with cash balances increasing as cash flow
declines, but line of credit balances remaining unchanged. In unreported results, I show that cash flow has a strong
positive effect on line of credit balances scaled by non-cash assets. The evidence suggests that results in Table 3 are
not solely driven by changes in cash balances.

36
8 I follow Mackie-Mason (1990) and calculate Altman’s z-score (1968) excluding leverage, given that leverage is a
direct function of the proportion of used and unused lines of credit. More specifically, z-score is calculated as:
3.3* 1.0* 1.4* 1.2*EBIT sales retainedearnings workingcapitalZSCOREtotalassets totalassets totalassets totalassets
= + + +
where retained earnings is item 36 and working capital is item 179 from Compustat. ZSCORE has a mean of 1.21
and a standard deviation of 2.80 in the random sample.
9 In Table 5, I report data on covenants from Dealscan because the SEC does not require firms to report their
covenants. The SEC does require firms to report whether they are in violation of a covenant. Dichev and Skinner
(2001) argue that actual covenant violations represent situations in which firms were unable to obtain an amendment
to avoid violation. The violations tracked in my data represent violations that could not be avoided therefore
represent more serious violations than those that can be avoided.
10 I also estimate equation (2) using fixed effects in a maximum likelihood logit specification; these results
(unreported) are qualitatively similar to the linear regression results.
11 For details, see ACW (2004), pages 1789-1790. The only discrepancy in my categorization is to split firms into
size groups based on whether they are above or below the median in every year. ACW (2004) split firms into size
groups based on whether they are in the top 3 deciles or bottom 3 deciles. I change the definition because there are
almost no “unconstrained” firms by the line of credit measure in the smallest 3 size deciles.

Table 1 Summary Statistics
This table presents summary statistics for two samples of non-financial firms from 1996 through 2003. The left panel describes the full sample of 4,503 firms (28,447 firm-year observations), and the right panel describes the random sample of 300 firms (1,908 firm-year observations). Market to book, cash adjusted, is the market value of equity less cash balances divided by the book value of equity less cash balances. Net worth, cash adjusted, is the net worth less cash balances divided by book assets less cash.
Full Sample Random sample Variable Mean Median St. Dev. Variable Mean Median St. Dev.
Line of credit variables Line of credit variables Has line of credit {0,1} 0.817 1.000 0.387 Has line of credit {0,1} 0.748 1.000 0.434 Total line of credit/assets 0.159 0.112 0.169 Unused line of credit/assets 0.102 0.069 0.125 Used line of credit/assets 0.057 0.000 0.097 Total line/(Total line + cash) 0.512 0.569 0.388 Unused line/(Unused line + cash) 0.450 0.455 0.373 Violation of financial covenant {0,1} 0.080 0.000 0.271 Firm characteristics Firm characteristics Book debt/assets 0.204 0.171 0.19 Book debt/assets 0.205 0.169 0.196 EBITDA/(assets – cash) 0.026 0.125 0.358 EBITDA/(assets – cash) 0.034 0.126 0.353 Tangible assets/(assets – cash) 0.340 0.277 0.239 Tangible assets/(assets – cash) 0.331 0.275 0.226 Net worth, cash adjusted 0.436 0.445 0.238 Net worth, cash adjusted 0.451 0.459 0.234 Assets – cash 1,608 102 11,434 Assets – cash 1,441 116 7682 Market to book, cash adjusted 2.944 1.532 3.469 Market to book, cash adjusted 2.790 1.498 3.319 Industry sales volatility 0.043 0.035 0.033 Industry sales volatility 0.045 0.036 0.035 Cash flow volatility 0.091 0.052 0.109 Cash flow volatility 0.091 0.052 0.109 Not in an S&P index {0,1} 0.696 1.000 0.46 Not in an S&P index {0,1} 0.684 1.000 0.465 Traded over the counter {0,1} 0.123 0.000 0.328 Traded over the counter {0,1} 0.142 0.000 0.349 Firm age (years since IPO) 15 10 13 Firm age (years since IPO) 14 9 12
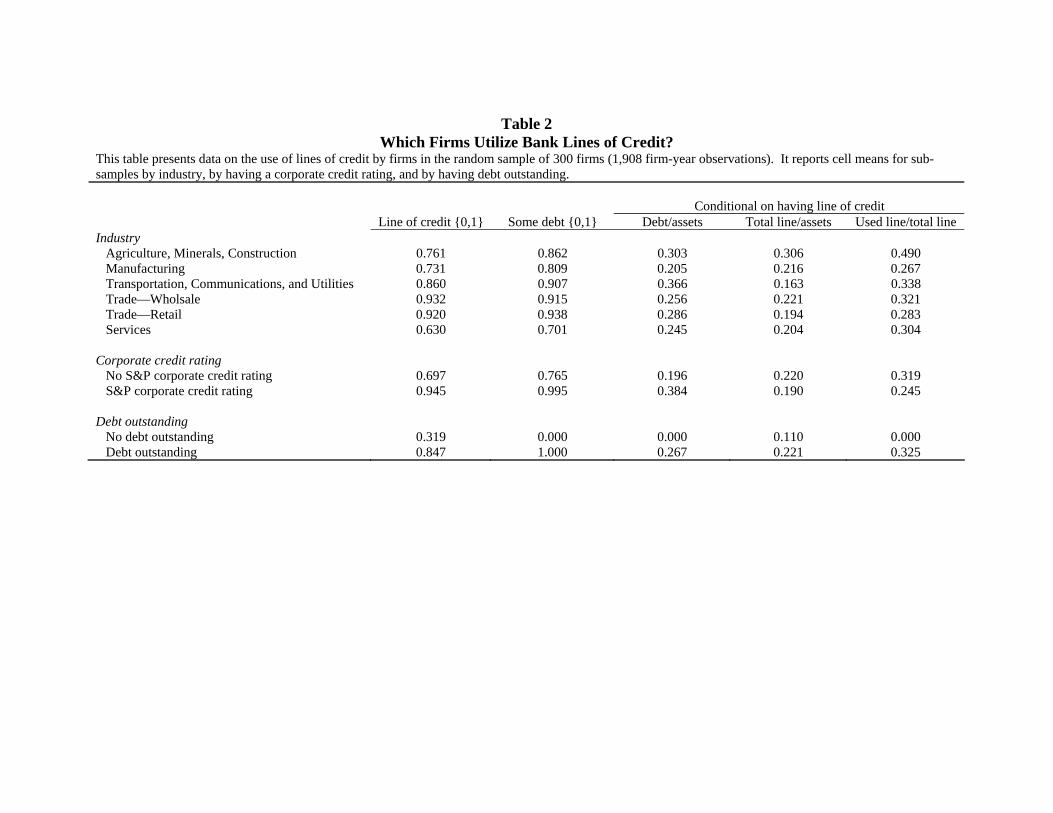
Table 2
Which Firms Utilize Bank Lines of Credit? This table presents data on the use of lines of credit by firms in the random sample of 300 firms (1,908 firm-year observations). It reports cell means for sub-samples by industry, by having a corporate credit rating, and by having debt outstanding.
Conditional on having line of credit Line of credit {0,1} Some debt {0,1} Debt/assets Total line/assets Used line/total line Industry Agriculture, Minerals, Construction 0.761 0.862 0.303 0.306 0.490 Manufacturing 0.731 0.809 0.205 0.216 0.267 Transportation, Communications, and Utilities 0.860 0.907 0.366 0.163 0.338 Trade—Wholsale 0.932 0.915 0.256 0.221 0.321 Trade—Retail 0.920 0.938 0.286 0.194 0.283 Services 0.630 0.701 0.245 0.204 0.304 Corporate credit rating No S&P corporate credit rating 0.697 0.765 0.196 0.220 0.319 S&P corporate credit rating 0.945 0.995 0.384 0.190 0.245 Debt outstanding No debt outstanding 0.319 0.000 0.000 0.110 0.000 Debt outstanding 0.847 1.000 0.267 0.221 0.325

Table 3
Bank Lines of Credit and Firm Characteristics This table presents coefficient estimates from regressions relating the use of a line of credit to various lagged firm characteristics. Columns 1 and 2 report the estimated marginal effects (or effect of going from 0 to 1 for indicator variables) of lagged firm characteristics on the probability of having a line of credit from maximum likelihood probit estimation using the full and random sample, respectively. Columns 3 through 6 report the coefficient estimates from an OLS estimation using the random sample; the estimation relates two different measures of the bank liquidity to total liquidity ratio to lagged firm characteristics. The estimation reported in columns 4 and 6 isolates the intensive margin of the bank liquidity to total liquidity ratio by focusing only on firms that have a line of credit. Regressions include year and 1-digit industry indicator variables; standard errors are clustered at the firm level.
Dependent Variable Firm has line of credit {0,1} Total line/(Total line + cash) Unused line/(Unused line + cash)
Regression type Probit (marginal effects) OLS OLS Sample Full Random Random With line of credit Random With line of credit
(1) (2) (3) (4) (5) (6) [EBITDA/(assets – cash)]t-1 0.107**
(0.011) 0.124* (0.059)
0.109** (0.041)
0.086 (0.056)
0.085* (0.038)
0.120* (0.056)
[Tangible assets/(assets – cash)] t-1 0.015 (0.019)
0.070 (0.084)
0.041 (0.072)
0.014 (0.064)
0.025 (0.068)
-0.006 (0.068)
[Ln(assets – cash)] t-1 0.040** (0.003)
0.052** (0.015)
0.054** (0.010)
0.032** (0.009)
0.054** (0.010)
0.041** (0.009)
[Net worth, cash adjusted] t-1 -0.094** (0.016)
-0.037 (0.075)
-0.106 (0.059)
-0.136** (0.052)
-0.053 (0.054)
-0.040 (0.054)
[Market to book, cash adjusted] t-1 -0.013** (0.001)
-0.022** (0.006)
-0.031** (0.004)
-0.037** (0.005)
-0.025** (0.004)
-0.030** (0.006)
[Industry sales volatility] t-1 0.674** (0.193)
2.571** (0.885)
0.989** (0.382)
0.081 (0.319)
1.069** (0.401)
0.354 (0.366)
[Cash flow volatility] t-1 -0.020 (0.035)
-0.201 (0.146)
-0.383** (0.125)
-0.374* (0.177)
-0.291* (0.118)
-0.271 (0.181)
[Not in an S&P index {0,1}] 0.035* (0.013)
0.046 (0.059)
0.065 (0.039)
0.047 (0.034)
0.034 (0.039)
0.026 (0.035)
[Traded over the counter {0,1}] -0.014 (0.013)
-0.045 (0.061)
0.077 (0.047)
0.129** (0.036)
0.022 (0.043)
0.029 (0.044)
Ln[Firm age (years since IPO)] t-1 -0.003 (0.005)
-0.005 (0.024)
-0.027 (0.018)
-0.034* (0.016)
-0.012 (0.018)
-0.021 (0.016)
Number of observations 28,447 1,908 1,908 1,428 1,908 1,428 Number of firms 4,503 300 300 255 300 255 R2 0.20 0.27 0.39 0.31 0.36 0.24 **,* statistically distinct from 0 at the 1 and 5 percent level, respectively
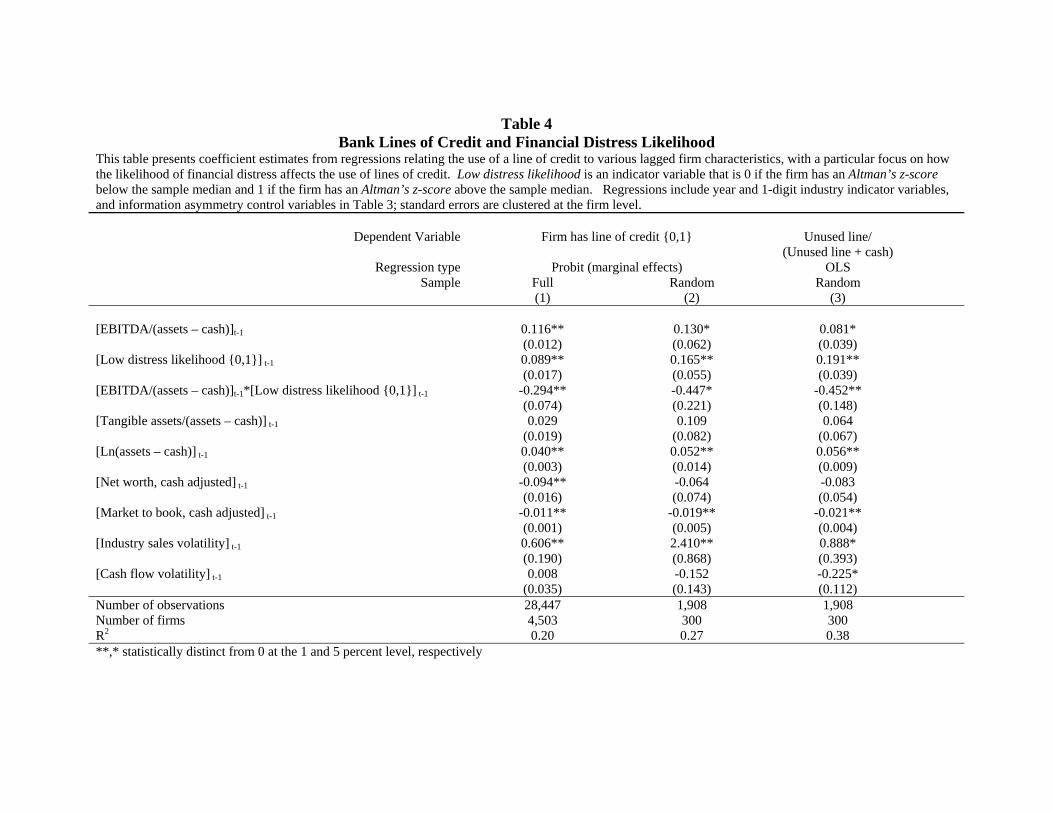
Table 4
Bank Lines of Credit and Financial Distress Likelihood This table presents coefficient estimates from regressions relating the use of a line of credit to various lagged firm characteristics, with a particular focus on how the likelihood of financial distress affects the use of lines of credit. Low distress likelihood is an indicator variable that is 0 if the firm has an Altman’s z-score below the sample median and 1 if the firm has an Altman’s z-score above the sample median. Regressions include year and 1-digit industry indicator variables, and information asymmetry control variables in Table 3; standard errors are clustered at the firm level.
Dependent Variable Firm has line of credit {0,1} Unused line/ (Unused line + cash)
Regression type Probit (marginal effects) OLS Sample Full Random Random
(1) (2) (3) [EBITDA/(assets – cash)]t-1 0.116**
(0.012) 0.130* (0.062)
0.081* (0.039)
[Low distress likelihood {0,1}] t-1 0.089** (0.017)
0.165** (0.055)
0.191** (0.039)
[EBITDA/(assets – cash)]t-1*[Low distress likelihood {0,1}] t-1 -0.294** (0.074)
-0.447* (0.221)
-0.452** (0.148)
[Tangible assets/(assets – cash)] t-1 0.029 (0.019)
0.109 (0.082)
0.064 (0.067)
[Ln(assets – cash)] t-1 0.040** (0.003)
0.052** (0.014)
0.056** (0.009)
[Net worth, cash adjusted] t-1 -0.094** (0.016)
-0.064 (0.074)
-0.083 (0.054)
[Market to book, cash adjusted] t-1 -0.011** (0.001)
-0.019** (0.005)
-0.021** (0.004)
[Industry sales volatility] t-1 0.606** (0.190)
2.410** (0.868)
0.888* (0.393)
[Cash flow volatility] t-1 0.008 (0.035)
-0.152 (0.143)
-0.225* (0.112)
Number of observations 28,447 1,908 1,908 Number of firms 4,503 300 300 R2 0.20 0.27 0.38 **,* statistically distinct from 0 at the 1 and 5 percent level, respectively
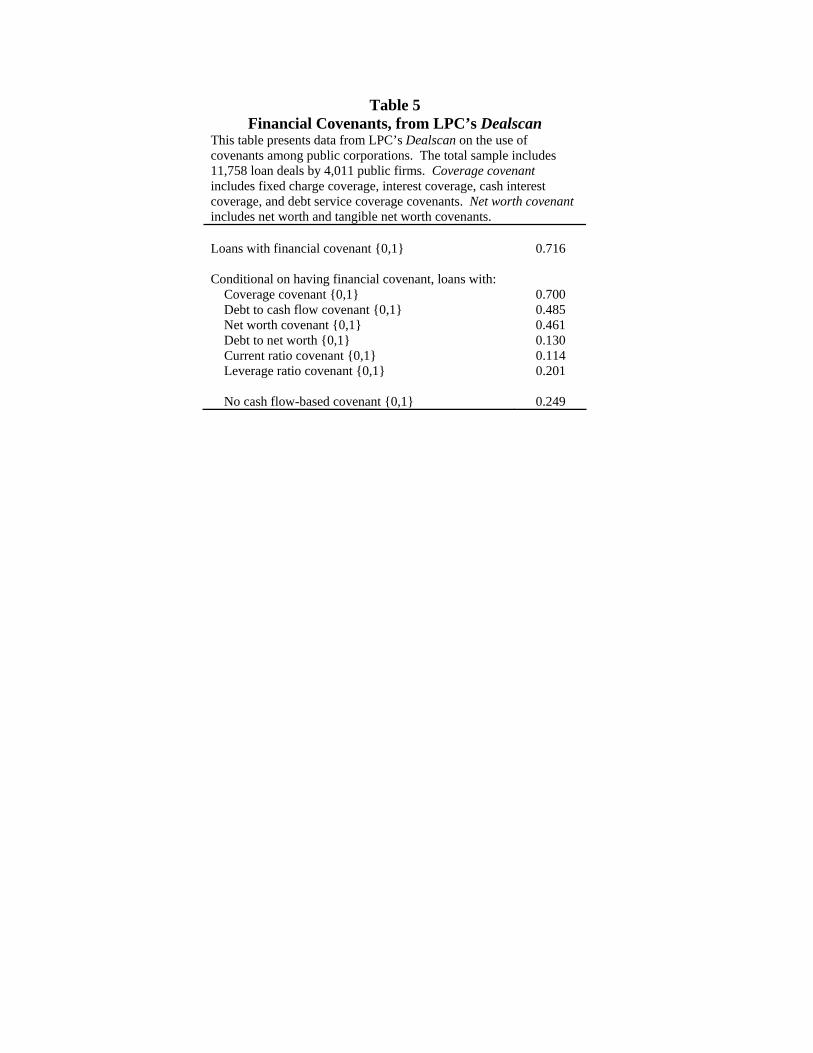
Table 5 Financial Covenants, from LPC’s Dealscan
This table presents data from LPC’s Dealscan on the use of covenants among public corporations. The total sample includes 11,758 loan deals by 4,011 public firms. Coverage covenant includes fixed charge coverage, interest coverage, cash interest coverage, and debt service coverage covenants. Net worth covenant includes net worth and tangible net worth covenants. Loans with financial covenant {0,1} 0.716 Conditional on having financial covenant, loans with: Coverage covenant {0,1} 0.700 Debt to cash flow covenant {0,1} 0.485 Net worth covenant {0,1} 0.461 Debt to net worth {0,1} 0.130 Current ratio covenant {0,1} 0.114 Leverage ratio covenant {0,1} 0.201 No cash flow-based covenant {0,1} 0.249

Table 6
The Causes and Consequences of Financial Covenant Violations Columns 1 and 2 present regression coefficients from firm fixed effects regressions relating the probability of a covenant violation to firm characteristics. Columns 3 through 6 present regression coefficients from firm fixed effects regressions relating line of credit balances to a covenant violation in the previous year. The sample used for columns 1 and 2 includes only firms that have a line of credit. The sample used for columns 3 through 6 includes only firms that have a line of credit in the previous year. Regressions include year indicator variables, and standard errors are clustered at the firm level. Covenant violationt {0,1} Total line t/
assets t-1 Unused line t/
assets t-1 [Total line/
(Total line+cash)] t [Unused line/
(Unused line+cash)] t (1) (2) (3) (4) (5) (6)
EBITDAt/assetst-1 -0.577** (0.105)
-0.487** (0.112)
[Debt/assets]t
0.592* (0.246)
[Net worth/assets]t
-0.007 (0.242)
Current ratiot
-0.007 (0.010)
Market to book ratiot
-0.003 (0.008)
Ln(total assets) t
0.033 (0.029)
Covenant violation t-1 {0,1}
-0.041* (0.018)
-0.036** (0.011)
-0.070** (0.027)
-0.122** (0.038)
EBITDAt-1/assetst-2
0.071 (0.046)
0.062 (0.039)
0.073 (0.054)
0.089 (0.066)
[Debt/assets]t-1
0.005 (0.164)
-0.012 (0.109)
0.381* (0.193)
0.177 (0.213)
[Net worth/assets]t-1
0.014 (0.141)
0.016 (0.095)
0.257 (0.169)
0.152 (0.174)
Current ratiot-1
-0.001 (0.004)
0.002 (0.004)
-0.022** (0.008)
-0.018* (0.008)
Market to book ratiot-1
0.010* (0.005)
0.002 (0.004)
-0.001 (0.005)
-0.010 (0.006)
Ln(total assets) t-1
-0.116** (0.025)
-0.087** (0.018)
0.008 (0.025)
-0.016 (0.030)
Number of observations 1,428 1,387 1,174 1,174 1,174 1,174 Number of firms 255 249 246 246 246 246 R2 0.21 0.24 0.61 0.57 0.73 0.65 **,* statistically distinct from 0 at the 1 and 5 percent level, respectively

Table 7
Correlation with Other Measures of Financial Constraints This table presents correlations between various measures of financial constraints used in the literature. Line of credit takes on the value 1 if the firm (a) has access to a line of credit in every year of the sample, and (b) maintains cash flows above the median firm in every year of the sample. Bond rating and commercial paper rating take on the value 1 if the firm ever has an S&P corporate credit rating and commercial paper rating through the sample, respectively.
Line of credit
Payout decile
Size decile
Bond rating
Payout ratio decile 0.09 Size decile 0.19 0.44 Bond rating 0.18 0.29 0.68 CP rating 0.26 0.32 0.48 0.52 *Note: All correlations are statistically distinct from 0 at the 1 percent level.

Table 8
Availability of Bank Lines of Credit and the Cash Flow Sensitivity of Cash This table presents coefficient estimates from regressions relating the change in cash holdings to cash flow. The estimation follows that of Almeida, Campello, and Weisbach (2004), which they describe in their equation (8) and Table III. Each reported coefficient is the effect of cash flow on cash holdings from a separate regression. Panel A splits the sample based on the line of credit measure of financial constraints in which firms that (a) have access to a line of credit in every year of the sample, and (b) maintain cash flows above the median firm in every year of the sample are considered unconstrained. Panel B examines the measures of financial constraints used in ACW (2004). All estimations include year and firm fixed effects. Standard errors are heteroskesticity-robust, clustered at the firm. Dependent variable Δ Cash Holdings Panel A (1) (2) (3) (4)
Splitting constrained firms by:
1. Lines of credit
Low cash flow, no line of credit
Low cash flow, line of credit
High cash flow, no line of credit
Unconstrained -0.062 (0.045)
Constrained
0.084**,+ (0.010)
0.085** (0.010)
0.063** (0.016)
0.028 (0.097)
Panel B (1) (2) (3) Splitting constrained firms by: Constrained,
by line of credit measure Unconstrained,
by line of credit measure
2. Payout ratio Highest 3 deciles
0.110** (0.025)
Lowest 3 deciles
0.089** (0.014)
0.090** (0.014)
-0.077 (0.121)
3. Firm size (assets) Largest 5 deciles
-0.023 (0.027)
Smallest 5 deciles
0.096**,+ (0.012)
0.096** (0.012)
0.014 (0.083)
4. Bond rating Has a rating
0.016 (0.027)
Does not have a rating
0.086**,+ (0.011)
0.089** (0.011)
-0.042 (0.063)
5. Commercial paper rating Has a rating
-0.047 (0.047)
Does not have a rating
0.082**,+ (0.010)
0.085** (0.010)
-0.050 (0.052)
**,* distinct from 0 at 1 and 5 percent, respectively; + distinct from unconstrained sample at 10 percent or better

Figure 1Use of Lines of Credit versus Cash Holdings across Cash Flow Distribution
0
0.1
0.2
0.3
0.4
0.5
0.6
1 2 3 4 5 6 7 8 9 10
Deciles of EBITDA/(assets-cash)
Cas
h/as
sets
0
0.1
0.2
0.3
0.4
0.5
0.6
0.7
0.8
0.9
1
Frac
tion
with
line
of c
redi
t
Average cash/assets (left axis) Fraction with line of credit (right axis)

Figure 2The Effect of a Covenant Violation on Availability of Line of Credit
0.05
0.1
0.15
0.2
0.25
0.3
-3 -2 -1 0 1 2 3
Default at t = 0
Scal
ed b
y la
gged
tota
l ass
ets
Total line of credit/lagged assets Used line of credit/lagged assets Unused line of credit/lagged assets
Top Related