


Languages
Pages
Legal


AN
NU
AL R
EPO
RT 2
01
8
Hong Leong Bank Berhad (97141-X)
Level 19, Menara Hong Leong6, Jalan Damanlela, Bukit Damansara50490 Kuala LumpurTel : 03-2081 8888Fax : 03-2081 7801
w w w. h l b . c o m . m y
As part of Hong Leong Bank’s support for environmental sustainability, this Annual Report is printed on Forest Stewardship Council (FSC) certified paper and recycled paper.
Bank Berhad
Bank Berhad
ANNUAL REPORT 2018
corporate02 Vision
04 TheBusiness
06 Awards&Accolades
08 HongLeongBankStory
10 CorporateMilestones
12 Chairman’sStatement
18 FiveYearGroupFinancialHighlights
20 GroupManagingDirector/ChiefExecutiveOfficer’sReview
30 ManagementDiscussion&Analysis
67 SustainabilityStatement
83 CorporateInformation
84 NoticeofAnnualGeneralMeeting
87 StatementAccompanyingNoticeofAnnualGeneralMeeting
88 BoardofDirectors’Profile
92 KeySeniorManagement
96 BoardAuditCommitteeReport
99 BoardRiskManagementCommittee(BRMC)Report
102 CorporateGovernanceOverview,RiskManagement&InternalControlStatement
ScantheQRCodebyfollowingthesesimplesteps:
Get itDownloadthe“QRCodeReader”appfromGooglePlay(AndroidMarket),BlackBerryAppWorld,AppStore(iOS/iPhone)orWindowsPhoneStore
run itRuntheQRCodeReaderappandpointyourcameraattheQRCode
access itGetaccesstoHongLeongBankBerhad’swebsite
Scan the Qr code to visit our website.

FINaNcIaLS118 Directors’Report
128 StatementsofFinancialPosition
129 StatementsofIncome
130 StatementsofComprehensiveIncome
131 StatementsofChangesinEquity
135 StatementsofCashFlows
139 NotestotheFinancialStatements
275 StatementbyDirectors
275 StatutoryDeclaration
276 IndependentAuditors’Report
281 BaselIIPillar3Disclosures
aDDItIoNaL INForMatIoN
327 OtherInformation
338 Local&OverseasBranches
•FormofProxy
WHAT’S INSIDe

Highly digital and innovative aSeaN financial services company
VISION
THebuSINeSS
Digital and innovation is part of the Hong Leong bank culture, in line with our vision to be a highly digital and innovative financial service provider guided by its ethos of being digital-at-the-core, centred around customer experiences and the growing demand and expectation for digital based services, products and solutions.
HongLeongBank(“HLB”)standsproudlyasaleadingfinancial-servicesinstitutionbasedinMalaysia,providingregionalservicesof a wide range of comprehensive and innovative financialsolutions.Theseservicesaredeliveredthroughbothdigitalandtraditionalmeans,viaonlineandmobilebanking,aswellasitsdigital branch concept designed to provide customerswith anefficientandseamlessexperienceaidedbytechnology.
HLB’s extensive branch network extends beyond Malaysianborders with one branch each in Singapore and Hong Kongrespectively, four branches in Vietnam, five branches inCambodia,andarepresentativeofficeinNanjing,China,aswellas a full-service call centre and more than 1,100 self-serviceterminals. Wealth Management services are offered throughbranchesinMalaysia,SingaporeandHongKong,inadditiontovariousPriorityBankingcentreslocatedthroughoutMalaysiaandoneinSingapore.
Astheserviceandfinanciallandscapechangesrapidlywiththeever-increasinguseoftechnology,stayingattunedtocustomers’
needs and desires becomes even more critical to HLB’soperations.Tostayaheadofthesedynamicchanges,theBankhasadoptedtheapproachofreimaginingbankingbyembeddingdigitalconsiderationsandcustomercentricityineveryaspectofouroperations,fromproductsandservicesaswellascustomercareandengagement.
HLB’s ethos of being Digital-At-The-Core that is powered bycustomers-at-the-forefront has led and will continue to leadus to innovateofferings in linewithour aspirationofbeingahighly digital and innovative financial services organization.The Bank constantly looks at ways to leverage on technologyto increase efficiency and productivity towards improving theoverall customer experience, as well as to upskill employees’competencies and skill sets in this ever-changing financialindustry landscape, so that we have a “fit for the future”workforce.
ThedigitalambitionofHLBistoenablethecustomerstolivelifeuninterrupted,abletoperformtheirbankingandfinancialneeds–simpler,better,intuitivelyandtailoredtotheirpreferences.
HoNG LeoNG baNK’S KeY buSINeSS pILLarS are:
personal Financial Services
business and corporate banking
Global Markets Islamic Financial Services
Providingfinancialproducts,wealthmanagement,andprioritybankingservicestoindividualsincludingproperty,autoandpersonalloans,paymentproducts,sharefinancing,investmentandinsurance,aswellasdepositandremittanceservices.
Principalbusinessactivitiesincludetheprovisionofbankingsolutionssuchasdepositandloanservicescoveringbusinesscurrentaccount,interest-bearingauto-sweepaswellasfixeddeposit,andfinancingoptionsrangingfromassetacquisition,workingcapital,anddebtcapitalmarketstructures,forourcorporate,commercialandSMEclientbase.HLBalsospecializesintheprovisionoftransactionbankingsolutionsviacashmanagement,tradefinancingandservices.
Principalactivitiesincludeassistingcustomerstomeettheirinvestmentandhedgingneedsthroughvarioustreasuryproducts,rangingfromforeignexchange,moneymarket,derivativesincludinginterestrateswapsandinterestrateswapoptions,tostructuredinvestmentproducts.
IslamicFinancialServicesareofferedbyHongLeongIslamicBank,awholly-ownedsubsidiaryofHLBwhichisfocusedonprovidingShariah-compliantPersonalFinancialServices,BusinessandCorporateBanking,andGlobalMarketsproductsandservices.
04ANNUALRePORT2018
HoNG LeoNG baNK berHaD

THebuSINeSS
reGIoNaL FootprINt
Inlinewithourgrowthstrategy,HLBhasbeenexpandingitsfootprintintheAsianregion.
Singapore operations
HLBank,Singaporeisafullbankinglicensebranch offering wealth management,treasury services, deposit products andauto loan services. We have embarkedon a transformational journey towardsanintegratedbusinessmodel,expandinginto health banking, corporate bankingfor commercial clients and expandedconsumerlendingpropositions.
Hong Kong operations
The Bank’s branch in Hong Kong offersTreasury and Wealth Managementproducts and services. It is also thefirst
bank inHongKong to launchan Islamicbankingwindow.
Vietnam operations
Hong Leong Bank Vietnam Limited(“HLBVN”), a subsidiary of the Bank,commencedoperations inOctober2009.HLBVNisafull-fledgedcommercialbankin Vietnam whose principal activitiesinclude provision of retail loans, depositproducts, wealth management, andpriority banking services to individuals.Whereas business banking solutionsinclude working capital and term loans,deposit and liability managementproducts and trade finance services aswell as foreign exchange (“forex”) andmoney market services. To date HLBVNhas a branch and transaction officelocatedinHoChiMinhCity,andabrancheachinBinDuongandHanoi.
cambodia operations
InJuly2013,HongLeongBank(Cambodia)PLC (“HLBCAM”) commenced operationsas a 100% wholly owned subsidiaryproviding comprehensive financialservices covering consumer banking,business banking, global markets andtransaction banking services. With fivefull-fledged branches located in PhnomPenh,HLBCAM’sprimarycustomerfocusistowardsestablishedSMEandCommercialcorporate customers, high net worthindividuals, affluent and emergingaffluent as well as tech savvy youngprofessionals.
Investment in china
HLBwasthefirstMalaysianbanktoentertheChinesebankingsectorin2008withastrategicinvestmentinBankofChengduCo., Ltd (“Bank of Chengdu”) and hasan 18% stake in the company. Bank ofChengdu is a leading city commercialbank in Western and Central ChinabasedinChengdu,thecapitalofSichuanProvince.InMarch2010,thejointventurecompanybetweenHLBand theBankofChengduobtainedregulatoryapprovaltoestablishaconsumerfinancebusinessinChengdu. InNovember2013,HLBhadsetuparepresentativeofficeinNanjingwhichcommencedoperationsinFebruarythefollowingyear.
“Tostayaheadofthesedynamicchanges,theBankhasadoptedtheapproachofreimaginingbankingbyembeddingdigitalconsiderationsandcustomercentricityineveryaspectofour
operations,fromproductsandservicesaswellascustomercareandengagement.”
corporate
05ANNUALRePORT
2018

AWARdS &accoLaDeS
1. MaLaYSIa’S beSt baNK aWarDS For eXceLLeNce 2017 EuroMoney
2. beSt baNK IN MaLaYSIa caSH MaNaGeMeNt cuStoMer SatISFactIoN aWarD, 2017 AsiaMoney
3. beSt INNoVatIoN IN retaIL baNKING MaLaYSIa, 2017TheInternationalBanker
4. HIGHeSt returNS to SHareHoLDerS oVer 3 YearS – GoLD aWarD, 2017TheEdge–BillionRinggitClub
5. HIGHeSt returN oN eQuItY oVer 3 YearS – SILVer aWarD, 2017TheEdge–BillionRinggitClub
6. MoSt INNoVatIVe tecHNoLoGY aDoptIoN – GoLD aWarD MaLaYSIaN coNtact ceNtre aWarDS 2017 ContactCentreAssociationofMalaysia
7. beSt SocIaL MeDIa oF a coNtact ceNtre – GoLD aWarD MaLaYSIaN coNtact ceNtre aWarDS 2017 ContactCentreAssociationofMalaysia
8. beSt NeW coNtact ceNtre – GoLD aWarD MaLaYSIaN coNtact ceNtre aWarDS 2017 ContactCentreAssociationofMalaysia
9. beSt INbouND coNtact ceNtre aboVe 100 SeatS – MerIt aWarD MaLaYSIaN coNtact ceNtre aWarDS 2017 ContactCentreAssociationofMalaysia
10. beSt uSe oF ceM tecHNoLoGY – GoLD aWarD, 2017InternationalQualityandProductivityCentre
2
45
10
7
3
8
9
1
6
06ANNUALRePORT2018
HoNG LeoNG baNK berHaD
AWARdS &accoLaDeS
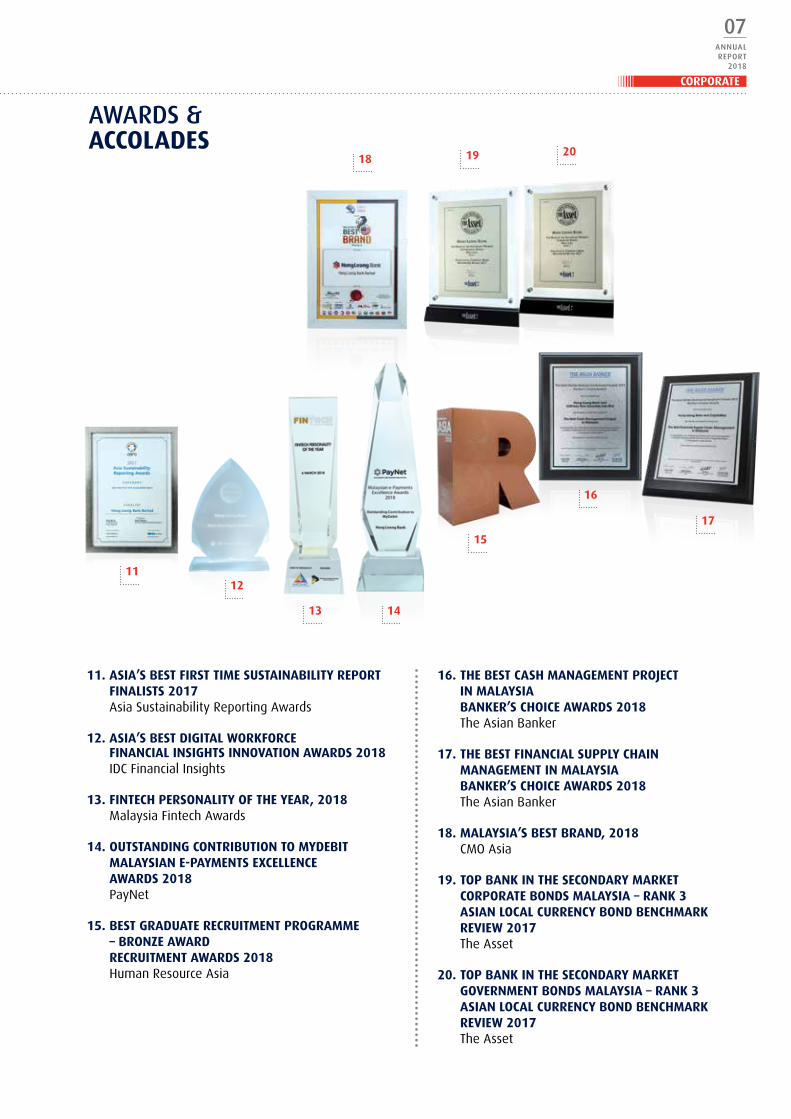
11. aSIa’S beSt FIrSt tIMe SuStaINabILItY report FINaLIStS 2017AsiaSustainabilityReportingAwards
12. aSIa’S beSt DIGItaL WorKForce FINaNcIaL INSIGHtS INNoVatIoN aWarDS 2018 IDCFinancialInsights
13. FINtecH perSoNaLItY oF tHe Year, 2018 MalaysiaFintechAwards
14. outStaNDING coNtrIbutIoN to MYDebIt MaLaYSIaN e-paYMeNtS eXceLLeNce aWarDS 2018 PayNet
15. beSt GraDuate recruItMeNt proGraMMe – broNze aWarD recruItMeNt aWarDS 2018 HumanResourceAsia
16. tHe beSt caSH MaNaGeMeNt proJect IN MaLaYSIa baNKer’S cHoIce aWarDS 2018 TheAsianBanker
17. tHe beSt FINaNcIaL SuppLY cHaIN MaNaGeMeNt IN MaLaYSIa baNKer’S cHoIce aWarDS 2018 TheAsianBanker
18. MaLaYSIa’S beSt braND, 2018CMOAsia
19. top baNK IN tHe SecoNDarY MarKet corporate boNDS MaLaYSIa – raNK 3 aSIaN LocaL curreNcY boND beNcHMarK reVIeW 2017 TheAsset
20. top baNK IN tHe SecoNDarY MarKet GoVerNMeNt boNDS MaLaYSIa – raNK 3 aSIaN LocaL curreNcY boND beNcHMarK reVIeW 2017 TheAsset
1112
13 14
15
16
17
201918
corporate
07ANNUALRePORT
2018

HONg LeONg bANk StorY
PERSONALFINANCIALSERVICES
BuSINESS&CORPORATEBANKING
GLOBAL MARKETS
ISLAMIC BANKING
HongLeongBankBerhad(“HLB”or“theBank”) islistedonBursaMalaysiaBerhadandformspartoftheHongLeongGroup.HeadquarteredinKualaLumpur,theBankhasa strongMalaysianentrepreneurshipheritage.
HLB was originally incorporated as Kwong LeeMortgage and Remittance Company in 1905 inKuching, Sarawak and later as Kwong Lee BankLimited in 1934, bearing heritage of the oldestlocal financial institution in Malaysia. Kwong LeeBankBerhadwasacquiredbytheMuIGroupinMay1982andrenamedMalayanunitedBankBerhadon2 February1983. In1989, itwas renamedasMuI
Bank.undertheMuIBankbanner,itgrewfrom11to35branchesnationwide.On3January1994,HongLeong Group acquired MuI Bank Berhad throughHong Leong Credit Berhad (now known as HongLeongFinancialGroupBerhad)andrenameditHongLeongBankBerhad.TheBankwaslistedontheKualaLumpurStockExchange(nowunderMainMarketofBursaMalaysia)on17October1994andsincethenhasgrownbyleapsandbounds,organicallyaswellasthroughmergersandacquisitions.ItsmergerwithEONBankGroup in 2011placedHLBasMalaysia’sfifthlargestbankinggroup;withoverRM200billioninassetsasat30June2018.
08ANNUALRePORT2018
HONG LEONG BANK BERHAD

BranchesInternetBanking
CallCentreMobileBanking
SelfServiceTerminals
STRONGENTREPRENEuRIALHERITAGE
EntrepreneurshipCommunityCustomersTalent
KEYFOCuSAREAS
CHANNELS
TECHNOLOGICALLYFOCuSED:DigitalattheCore,PeopleattheForefront
COREVALuES
Hereforthelongterm
Innovation Collaboratetowin
Decisiveness Havefun
INCORPORATEDIN1905:KwongLeeMortgageandRemittanceCompanyinKuching,Sarawak
LOCATIONS:• Malaysia(HQ) (Listed on Bursa Malaysia)
• Singapore• HongKong• Vietnam• Cambodia• China
CORPORATE
09ANNUALRePORT
2018

2013• HongLeong
BankCambodiacommenceditsoperations
• SetuprepresentativeofficeinNanjing,China
1905StartedinKuching,Sarawak,Malaysia,underthenameofKwongLeeMortgageandRemittanceCompany
1989RenamedasMuIBank,operatingwith35branches
2008EnteredChinaBankingSectorwitha20%strategicstakeinBankofChengduCo.,Ltd.
2011HongLeongBankcompletedmergerwithEONBankGroup
1934IncorporatedasKwongLeeBankLimited
1994• AcquiredMuIBank
throughHongLeongCreditBerhad(NowknownasHongLeongFinancialGroupBerhad)
• RenamedasHongLeongBankBerhad
2012LaunchedMachbyHongLeongBank,anextgenerationBankingsub-brand
2009HongLeongBankVietnamopeneditsdoorsinHoChiMinhCity
2014LaunchednewInternetBankingplatform,PExpayment,tabletappandcardlesswithdrawal
Intensified digitization of Hong Leong Bank’s products and services
cORPORATeMILeStoNeS
10ANNUALRePORT2018
HONG LEONG BANK BERHAD

2015• Launchednew
platformforbusinessinternetbankingtoreplaceHLOB(HongLeongOnlineBusiness),Applewatchapp,e-FD&e-TDI,e-Will/WasiatandBiometricauthentication
• IntroducedphysicalPEx+MerchantPayment
2017•Pilotedin-branch
mobileservicingsolutionfeaturingiPad-equippedserviceambassadorstogreetandservicecustomers
•LaunchedHLBLaunchPadtonurtureMalaysiantechnologyandFinTechstart-ups
•IntroducedeFDviaFPX
2016•FirstdomesticbanktoenableFPXpayment
allowingcustomerstoconducttransactions24/7viaHongLeongConnectBIZ
•LaunchedArtificialIntelligenceChatServiceusingIBMWatson,E-TTandonlinestatement
•SuperchargedinnovationthroughthesettingupofaCustomerExperienceandInnovationLab
•Movedtoonlineplatformsforautoandpersonalloans,creditcard&CASA(CurrentAccount&SavingsAccount)openingapplications
•PEx+MerchantPaymentwentonline
2018• RolledoutRoboticProcess
Automationprojects.
• Launchedcomprehensiveonlinebankingplatformsforcorporate,commercialandSMEbanking(HongLeongConnectFirst).
• Introduced,forthebenefitofeLearningforallemployees,apeer-to-peer,knowledgesharingmobileplatformapplicationwhichincorporatesfunelementsofgamificationinthelearningjourney(Smartup).
• EstablishedthefirstHongLeongBankDigitalConceptflagshipbranchinDamansaraCity,featuringPersonalizedTellertablets,TellerAssistedunitsandaDiscoveryZoneinteractivedigitalplatform.
• PilotedMulti-lingualRobotConciergeservicesatDamansaraCityPriorityBankingBranch
• IntroducedavirtualassistantArtificialIntelligencechatboxonouremployees’digitaldevices(HALI)toprovideanswersonHumanResourcesandBranchOperationsSupportpoliciesandprocedurequeries.
• RolledoutDigitalBusinessSolutionsandSMEliteFinancingfacilitiesforSMEs.
cORPORATeMILeStoNeS
CORPORATE
11ANNUALRePORT
2018
cHAIRmAN’SStateMeNt
Hong Leong bank (“HLb” or “bank”) made important strides both financially and digitally in the 2018 Financial Year (“FY2018”). During the year, we achieved new milestones in profits and total assets. the bank made rM2,638 million in net profit in FY2018, our highest ever and 23% better than the previous year.
This was largely due to our robust growth in non-interestincome and prudent loan pricing coupled with improved costmanagement. Total assets stood at RM202.9 billion, crossingthe RM200 billion mark for the first time. The Bank’s carefuland responsible stewardship continues to deliver sustainablegrowth with steady top-line performance and effective costcontrol. This includes intensifying our income diversificationandimplementingoursustainabilityanddigitizationinitiatives,whichimprovedourcost-to-incomeratio.
We expect that the group’s performance during FY2019 willbenefit from steady growth in both the global and Malaysianeconomies. The Malaysian economy remained healthy andexpanded at a good pace of 5% in the first half of 2018,underpinned by continued expansion in private consumptionand exports. The global economy is expected to continue togrow in 2018 and support demand for Malaysian exports.This export demand should have spill-over benefits to otherdomesticsectors.
The Malaysian economy is expected to continue its growthmomentum,albeitatamoremoderatelevelinthesecondhalfof2018despitepotentially challengingdomesticandexternalconditions. However we expect policy reforms and prudentfiscalmanagementtostrengthentheMalaysianeconomywhichaugurswell for thefuture.Wearealsomindfulofgeopoliticalandotherrisks,chieflythedevelopmentofnewuStradepolicieswhichcouldpossiblyprecipitateatradewarbetweentheuSandChinaand/orothereconomiesaroundtheworld.
ecoNoMIc coNDItIoNS
TheglobalandMalaysianeconomyremainedingoodshapeinFY2018.TheMalaysianeconomyremainedfundamentallysound,supported by domestic demand and continuous expansion inexports. Inflation also stayed benign and the nation’s currentaccount surplus and ample foreign reserves should help thenation weather any unforeseen external shocks. The country’sfinancial markets also demonstrated resilience in the faceof volatilities such as the sell-down that rocked global equitymarkets in March. The Malaysian banking sector remainedhealthy and well capitalized. This allowed the banking sectortoplayavitalroleinsupportingnationaleconomicgrowthoverthepastyear.
There were however also significant political and economicdevelopments in Malaysia and across the world in FY2018.MalaysiaexperiencedanunprecedentedchangeingovernmentinMay2018,itsfirstsincegainingindependencein1957.Somemajor European countries such as France also experienced achangeofguard.Globallyinfluentialcentralbanks–namelytheuSFederalReserveandBankofEngland–opted tonormalizetheirverylowinterestrates,impactingcapitalflowstoemergingmarkets.During theyear,Malaysiaalsoadjusted itsOvernightPolicyRate(“OPR”)upwardsby25bpsto3.25%inJanuary2018.
FBMKLCIIndexby
40.1%
rM18.20forFY2018
FBMKLFinIndexby
36.9%
OuTPERFORMED
SHare prIce
35.5%over
5 years
12ANNUALRePORT2018
HONG LEONG BANK BERHAD
buILDING LoNG-terM VaLue
Theyearwasnotwithout its challengesas an array of regulatory and economicfactorscameintoplay.Asabank,wewereready to meet higher capital adequacyrequirements on top of increasinglystringent compliance standards. Ourcompetitive landscape too has shifted.No longer are we competing only withconventional financial institutions, butnowhavetoincreasinglyrespondtothedisruptionposedbyFinTechstart-ups.
TheGroupishoweverwellpositionedtonotonlyovercome thesechallengesbutgrowstrongerfromit.Forexample,ratherthanviewingFinTechasathreat,wearelearning,andinsomecases,collaboratingwith FinTech, becoming even moreentrepreneurial and competitivein the process. Our underlying keyoperatingmetrics remainsolid.Theyareunderpinnedbyacombinationofprudentloan pricing and judicious funding costmanagement.Ourresultsalsoshowedahealthynon-interest incomecontributionandbenefitedstronglyfromourcarefullyembedded culture of uncompromisingdiscipline with regards to operatingefficiencies.
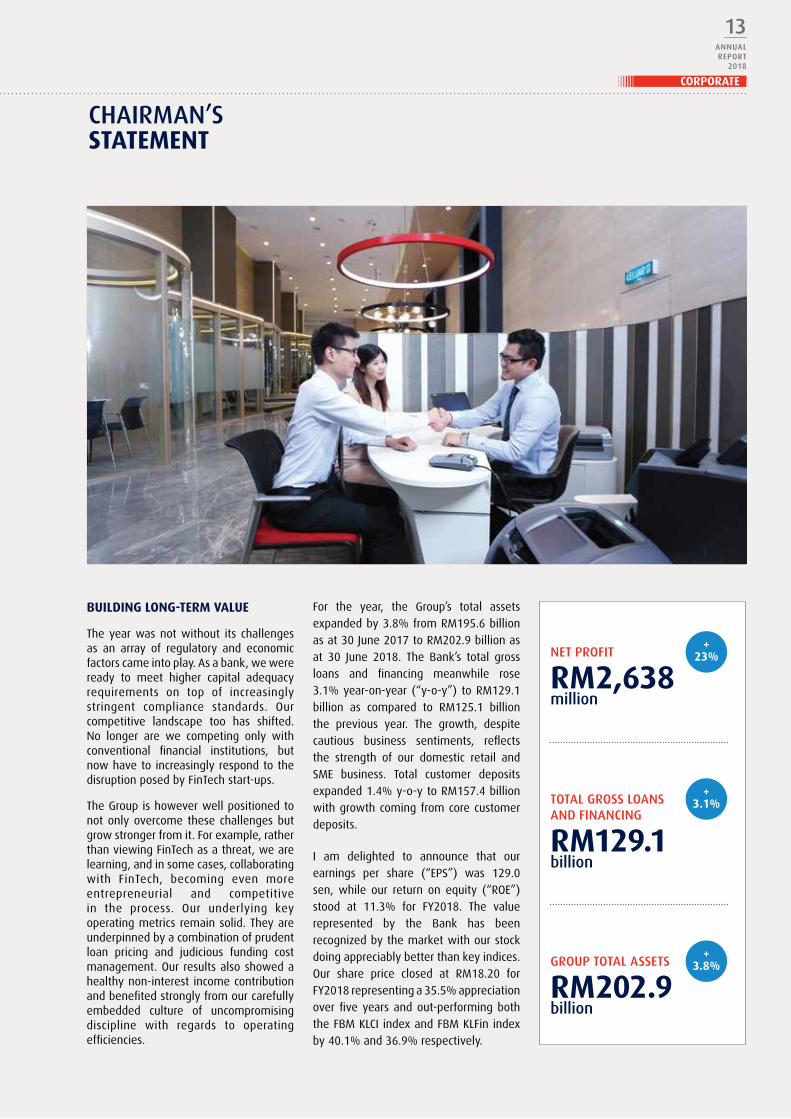
For the year, the Group’s total assetsexpandedby3.8%fromRM195.6billionasat30June2017toRM202.9billionasat 30 June 2018. The Bank’s total grossloans and financing meanwhile rose3.1%year-on-year (“y-o-y”) toRM129.1billion as compared to RM125.1 billionthe previous year. The growth, despitecautious business sentiments, reflectsthe strength of our domestic retail andSME business. Total customer depositsexpanded1.4%y-o-ytoRM157.4billionwithgrowthcomingfromcorecustomerdeposits.
I am delighted to announce that ourearnings per share (“EPS”) was 129.0sen, while our return on equity (“ROE”)stood at 11.3% for FY2018. The valuerepresented by the Bank has beenrecognizedbythemarketwithourstockdoingappreciablybetterthankeyindices.Our share price closed at RM18.20 forFY2018representinga35.5%appreciationoverfiveyearsandout-performingboththeFBMKLCIindexandFBMKLFinindexby40.1%and36.9%respectively.
NeT PROfIT
rM2,638million
+23%
TOTAL gROSS LOANS ANd fINANcINg
rM129.1billion
+3.1%
gROUP TOTAL ASSeTS
rM202.9billion
+3.8%
cHAIRmAN’SStateMeNt
CORPORATE
13ANNUALRePORT
2018
ForFY2018,theBoardhasproposedafinaldividendof32.0senper share subject to the approval of shareholders during theforthcomingAnnualGeneralMeetingon29October2018.ThisbringsthetotaldividendforFY18to48.0senpershare,3.0senpersharehigherthanlastyear.
In another noteworthy development during the year, RAMRatings upgraded the long-term financial institution ratings ofHongLeongBankBerhadfromAA1toAAAinrecognitionofoursuperiorassetquality.ItalsoreflectedtheBank’ssustainedtrackrecordofhavingrobustfundingandliquiditypositions,aswellasourrespectabledomesticretailandSMEfranchises.
ISLaMIc baNKING
MalaysiaranksasagloballeaderinIslamicBankingandIslamicFinance is a keyelementof its economicgrowth. Thegrowthof Islamic banking in Malaysia continues to be encouraging,registering a steady 10% growth in financing assets in 2017.ThemarketshareofIslamicbankingassetsofthetotalbankingassetsaccountedfor26%ofthetotalbankingassetsinMalaysiaasat30June2018.
As one of the country’s Islamic Financing institutions, HongLeong Islamic Bank Berhad (“HLISB”) is committed to deliversustainablegrowthofitsbusinessandparticipatewiththeotherIslamicfinanceprovidersintheindustrytohelpMalaysiaremainattheforefrontofIslamicFinance.
HLISBperformedwell in FY2018. Theexpansion inProfitafterTaxandZakatwasmore than commendable,growing27% toRM282 million over the previous year. Gross Islamic financingassetsalsoexpandedby10%toRM22.9billion,makingup18%ofHongLeongBankGroup’stotalfinancing.
AstheIslamicbankingarmoftheHongLeongGroup,HLISBwillcontinuetocontributesignificantlybyprovidingholisticIslamicfinancial solutions to theGroup’s customer base.HLISB is alsoundergoingadigitaltransformationofitsbusinessandShariahgovernancetodrivegrowthwhilstatthesametimeaddressingcompetitivethreatsfromFinTechplayers.
HLISBwillcontinuetoadoptValueBasedIntermediation(“VBI”)principles in our business. This is to realize the full potentialofVBIand theway it can strengthen thebeneficial impactofIslamicBankinginthenation’seconomyandsociety.
“Inanothernoteworthydevelopmentduringtheyear,RAMRatings
upgradedthelong-termfinancialinstitutionratingsofHongLeongBankBerhadfromAA1toAAAinrecognition
ofoursuperiorassetquality.”
cHAIRmAN’SStateMeNt
14ANNUALRePORT2018
HONG LEONG BANK BERHAD

proGreSS acroSS tHe reGIoN
The Group views our regional footprintas integral to our expansion strategy.Our regional presence will also supportour commitment to deliver long-termgrowth and returns to our shareholdersinasustainablemanner.Tothisend,ourefforts have shown itself in our resultsas the total profit contribution frominternational operations accounted for18.2% of the Group’s pre-tax profit inFY2018, up from 14.6% in the previousfinancialyear.
Our Singapore operation, through HLBank Singapore (“HLBS”) represents animportant franchise for the Group as itis located in a leading global financialhub. The branch has transformed froma pure Private Banking proposition to amore comprehensive business. It nowencompassesothernichesegmentssuch
as Health Banking, Auto Financing andSME Banking. In the coming year, HLBSwill look to progress its business evenfurther to stay relevant to the youngergeneration of wealth builders and SMEbusinesses. This includes using digitaltechnology and leveraging on the HeadOffice’s (“HO”) digital transformationroadmap.
For the fifth year in a row, Hong LeongBank (Cambodia) PLC (“HLBCAM”) hadanother outstanding performance inFY2018. Our Cambodian operation’snet profit grew an impressive 130%y-o-y to RM14.2 million. Its total assets
meanwhile grew by 37% y-o-y toRM1.7billion.Tomeettheminimumnetworth requirement set by the NationalBankofCambodiaaswellas to supportour own growth agenda, Hong LeongBankBerhadinjectedRM16millioninsubdebtintoHLBCAMinJune2018.
Ourassociate inChina,BankofChengdu(“BOCD”)becamethefirstcitycommercialbank in Sichuan Province to be listedon the Shanghai Stock Exchange on 31January2018.WelookforwardtoBOCD’scontinued growth despite the uncertainimplications of trade tensions betweenuSandChina.
“OurassociateinChina,BankofChengdu(“BOCD”)becamethefirstcitycommercialbankinSichuanProvincetobelistedonthe
ShanghaiStockExchangeon31January2018.”
PROfIT AfTeR TAx ANd zAkAT
rM282million
HLb gROUP gROSS ISLAmIc fINANcINg ASSeTS
+27%
18%
cHAIRmAN’SStateMeNt
CORPORATE
15ANNUALRePORT
2018

coMMItteD to SuStaINabLe perForMaNce
The Group has crafted a vision of going beyond the balancesheet to play a role to help our stakeholders, customersand the communities we operate in to benefit economically,environmentallyandsociallyfromourinvestments.Weareheretobearesponsiblebankerandhelpourcustomerssucceedinasustainableway.
Toachievethis,weoperateourbusinesssoastobemorethana banker but to actually be a valued partner to our clients.This means that we help our customers adopt practices thatstrengthentheirbusinesswhileatthesametimeachievetwoothersustainabilitygoals:enhancingthedevelopmentalimpactofinvestmentsandinfluencingnationbuildingforthebetter.
HLBGroupundertookabroadspectrumof initiativesdesignedtocatalyzeandbringaboutthedesiredsustainabilityoutcomes.
Werampedupthetechnicalassistanceandadvisoryresourceswe make available to clients. We provided tailored guidancetocompaniesthroughourcorporategovernanceprograms.Ourdigitizationstrategyhelpedtoreimaginethebankingexperiencewhilereducingenvironmentalimpact.Wepromotedsustainablebusinessdevelopmentthroughinnovationsinourproductsandservicesprovided toSMEs.We launched initiatives toenhanceenergy efficiency in our operations. We also implementedprudentandstringentpoliciestoensurecleanandresponsiblefinancingofferingstocustomers.
We publish a sustainability report to better communicateour strategies and progress. This report details our effortsand initiatives across the group to promote environmentallysustainableandinclusivegrowthaswellastoreduceourcarbonfootprint.Inthisregard,wearepleasedtohavemetthegloballyrecognized standards for inclusion in the FTSE4Good BursaMalaysiaIndex.
cHAIRmAN’SStateMeNt
16ANNUALRePORT2018
HONG LEONG BANK BERHAD

LooKING aHeaD
We expect major centralbanks to maintain theirgradual monetary policynormalization in thecoming year. This is dueto sustained growth inthe global economy,underpinnedbycontinuousexpansion in bothadvanced and emergingmarketeconomies.
IntheuS,weseeanyfiscalboostsarisingfrom theuS taxplansas likely towanemoving forward.Ongoing trade tensionsbetweentheuSandChinameanwhileisexpectedtocastashadowonthegrowthoutlookoftheworld’slargesteconomy.
Withthisinmind,wewillcontinuetostayvigilantandexercisecautioninexecuting
our strategy of prudent and responsiblegrowth.
WeexpectMalaysiatostayonamoderategrowthpaththankstoitsdiverseeconomicstructure,soundmacrofundamentalsandpolicy flexibility. These features suggestthecountryiswell-positionedtoweatheranyundesirableshocks.
Goingforward,theGroupiscommittedtodeliverlong-termsustainablegrowthandshareholdervaluebycontinuingtoexecuteourbusinessanddigitalstrategies.Wearehowever,cognizantofthechallengesandpotential economic headwinds that lieahead.Toensuresustainablesuccess,wewill focus on improving our operationalefficiency with innovation and increaseour capacity through strategic costand portfolio management. We willalso strengthen our digital offerings totransform our customer engagementprocess and reimagine banking throughcustomer journeys. We will also growour customer base both through ourcommunity focusedbranchnetworkandthroughdigitalchannels.
acKNoWLeDGeMeNtS
Lastbutnotleast,Iwouldliketoexpressmy heartfelt appreciation to my fellowBoard members for their support,guidance andwisdom. Iwould also liketothankourcustomers,businesspartnersandshareholdersforplacingtheirtrustinusaswellasfortheirloyaltyandsupportovertheyears.WealsowouldnotbewherewearetodaywithoutthetirelesseffortsofourpeopleandIwouldliketoexpressmy appreciation to senior managementandallouremployeesforembodyingthetwin idealsof theBankofbeingethicalandentrepreneurial incarryingout theirduties. My deepest appreciation alsogoes out to Bank Negara Malaysia, theMinistryofFinance,governmentagenciesandotherregulatoryauthoritiesfortheirassistance,guidanceandsupport.
QueK LeNG cHaNChairman
19September2018
cHAIRmAN’SStateMeNt
CORPORATE
17ANNUALRePORT
2018

fIVe yeAR gROUPFINaNcIaL HIGHLIGHtS
FY14 FY15 FY16 FY17 FY18Group rM’Million rM’Million rM’Million rM’Million rM’Million
TotalAssets 170,351 184,020 189,828 195,553 202,891
GrossLoans 104,169 113,418 120,605 125,147 129,069
CustomerDeposits 130,252 140,276 148,524 155,233 157,414
Shareholders’Fund 14,530 16,790 21,117 22,685 23,892
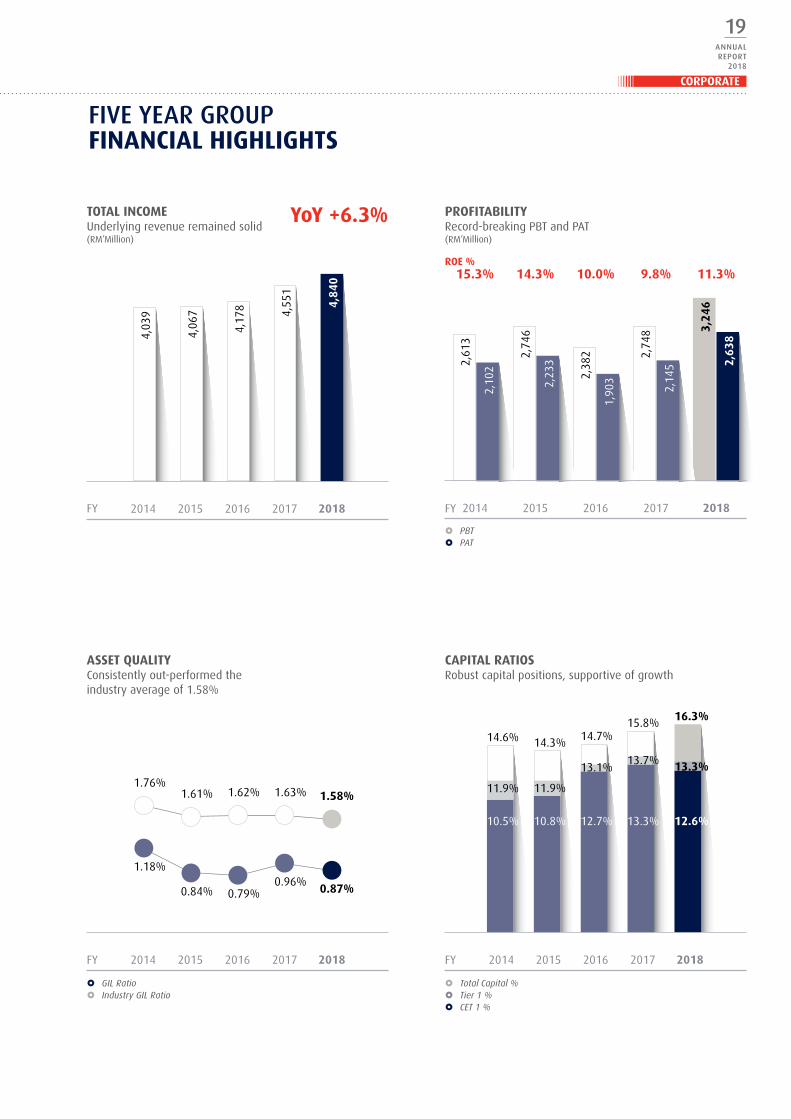
ProfitBeforeTax 2,613 2,746 2,382 2,748 3,246
ProfitAfterTax 2,102 2,233 1,903 2,145 2,638
Earningspershare(sen) 119 126 100 105 129
Netdividendpershare(sen) 41.0 41.0 41.0 45.0 48.0
Dividendpayoutratio(%) 34.4% 32.4% 44.1% 42.9% 37.2%
FY14 FY15 FY16 FY17 FY18bank rM’Million rM’Million rM’Million rM’Million rM’Million
TotalAssets 148,822 160,681 162,238 164,817 169,111
GrossLoans 89,225 96,691 101,054 103,516 105,079
CustomerDeposits 114,099 122,337 126,241 129,859 129,583
Shareholders’Fund 12,330 13,428 17,431 18,442 19,263
ProfitBeforeTax 2,058 2,279 2,025 2,347 2,518
ProfitAfterTax 1,591 1,776 1,605 1,744 1,972
GroSS LoaNS, aDVaNceS aND FINaNcING GrowthledpredominantlybymortgagesandSME(RM’Million)
DepoSItS FroM cuStoMerS Healthygrowthwithindividualsdepositmixof56%
YoY +3.1% YoY +1.4%
£ Individuals Deposits Mix %£ Total Deposits (RM‘Million)
125,
147
155,
233
120,
605
148,
524
113,
418
140,
276
104,
169
130,
25212
9,06
9
157,
414
2014 2015 2016 2017 2018 2014 2015 2016 2017 2018
51.2
%
50.0
% 54.8
%
55.5
%
56.0
%
FY FY
18ANNUALRePORT2018
HONG LEONG BANK BERHAD
15.8%14.7%14.3%14.6%
16.3%
fIVe yeAR gROUPFINaNcIaL HIGHLIGHtS
totaL INcoMe underlyingrevenueremainedsolid(RM’Million)
aSSet QuaLItY Consistentlyout-performedtheindustryaverageof1.58%
proFItabILItY Record-breakingPBTandPAT(RM’Million)
roe % 15.3% 14.3% 10.0% 9.8% 11.3%
capItaL ratIoS Robustcapitalpositions,supportiveofgrowth
YoY +6.3%
2014 2015 2016 2017 2018 2014 2015 2016 2017 2018
£ GIL Ratio£ Industry GIL Ratio
£ PBT£ PAT
£ Total Capital %£ Tier 1 %£ CET 1 %
1.76%
1.18%
1.61%
0.84%
1.62%
0.79%
1.63%
0.96%
1.58%
0.87%
4,55
1
2,74
84,17
8
2,38
2
4,06
7
2,74
64,03
9
2,61
3
4,84
0
3,24
6
2014 2015 2016 2017 2018
2,14
5
1,90
32,23
3
2,10
2 2,63
8
2014 2015 2016 2017 2018
13.7%13.1%
11.9%
13.3%
13.3%12.7%10.5% 12.6%
FY
FY
FY
FY
11.9%
10.8%
CORPORATE
19ANNUALRePORT
2018

rM4,840million
rM1,344million
rM3,495million
totaL INcoMe
NoN-INtereSt INcoMe
Net INtereSt INcoMe
+6.3%
+12.5%
+4.2%
gROUP mANAgINg dIRecTOR/cHIeF eXecutIVe oFFIcer’S reVIeW
Our successextendedbeyonddomestic shoresasour regionalentitiesandassociateschalkedupimpressivegrowthnumbers.Wealsobrokenewgroundinourjourneytoreimagineourbankasadigitalenterprise.Wearethefirstbankincountrytoofferchat-basedbanking–utilizingtheubiquitousandpopularchattechnology to allow customers to now also perform bankingtransactions. We also embarked on artificial intelligence andautomationtorampupourproductivityandspeedofexecution.
The weaving of digital into our DNA has yielded valuableoutcomesrangingfrommonetarybenefitssuchascostsavingstomoreintangibleonessuchassuperiorcustomerexperiences.But while a superior customer experience may at first glancebeintangible,webelieveitcontributestocustomerloyaltyandgoodwill that in the long runwill translate to better businessoutcomes.
A deeper look at our numbers shows that the Bank hascontinuedtodowellthankstoitsprudentpoliciesanddiverseandstablefundingprofile.Apart fromourrecordnetprofitforthe year, total income also grew by 6.3% to RM4,840 millionfrom RM4,551 million the prior year. Our regional operationswereakeycontributorwith significantprofitgrowth fromourassociate company in China. Our sustainability initiatives alsohelpedimproveourbottomlinewithcostandefficiencygainsrealizedfromourongoingdigitaltransformation.
The overall macro environment remains favourable due tocontinuous moderate growth in the advanced economies andfasterexpansioninemergingmarket(“EM”)economies.TheuSeconomycontinuedtoholdupwell.Theothermajoreconomieshowever, notably the Eurozone and Japan are seeing softermomentum.
AsaresultoftheuSeconomy’sstrength,theFedremainsontheforefrontofmonetarypolicynormalization, triggering shifts inportfolioflowsoutoftheEMsbacktotheuS.ThispromptedsomeEMcentralbankstoraiseinterestratestoreducevolatilityandensurestability inthedomesticfinancialmarkets. InMalaysia,BankNegaramadethepre-emptivemovetoraisetheOvernightPolicyRate(“OPR”)by25bpsinJanuary2018.ThishikewasinanticipationoffurtherinterestrateincreasesintheuSamidthesteadygrowthandinflationoutlooklocally.
Onthelocalfront,weexpectgrowthprospectstoremainintact,albeitataslowerpace,on thebackofdomesticandexternaldemand.ThenewgovernmentinstalledinMay2018isreviewingspending on mega-projects that could cause some transitorysetback in investments. We expect however that the shortfallcouldbecushionedbyapotentialboostinprivateconsumptionandinvestments.
I am delighted with the Group’s performance and the manyachievements our people accomplished over the year. It ismy pleasure therefore, to present to you the Annual Reportand Financial Statements of Hong Leong Bank Berhad for thefinancialyearended30June2018.
Dear Shareholders, customers and business partners,
the bank turned in another strong performance across key fronts in FY2018. our profits were record breaking, our asset quality remained superior and our financial ratios were strong.
20ANNUALRePORT2018
HONG LEONG BANK BERHAD

gROUP mANAgINg dIRecTOR/cHIeF eXecutIVe oFFIcer’S reVIeW
operatING perForMaNce
Total income for theGroup for FY2018 stoodat a record RM4,840million, which is a 6.3%increasefromthepreviousyear. This achievementwas driven by prudentloan pricing, effectivefundingcostmanagementand good growth innon-interestincome.
Non-interestincomerosesignificantlyby12.5% to RM1,344 million as the Bankredoubledefforts todiversify its incomesources.Thekeycontributorstothehighernon-interest income were increases inwealthmanagement incomeandhighergains from treasury operations. This ledto an improvement in our non-interestincomeratioto27.8%.
Contributions from net interest incomealsoexpandedsteadilyby4.2%y-o-ytoRM3,495 million. For the financial year,ournetinterestmargin(“NIM”)increasedto2.10%comparedto2.09%thepreviousyear.
International operations were alsokey, contributing 18.2% of the Group’spre-tax profit in FY2018, versus 14.6%thepreviousyear.RegionalcontributionswereledbyBOCDwhichwerehigherby50.5% y-o-y at RM516 million. ProfitsfromBOCDmadeup15.9%oftheBank’spre-taxprofit.
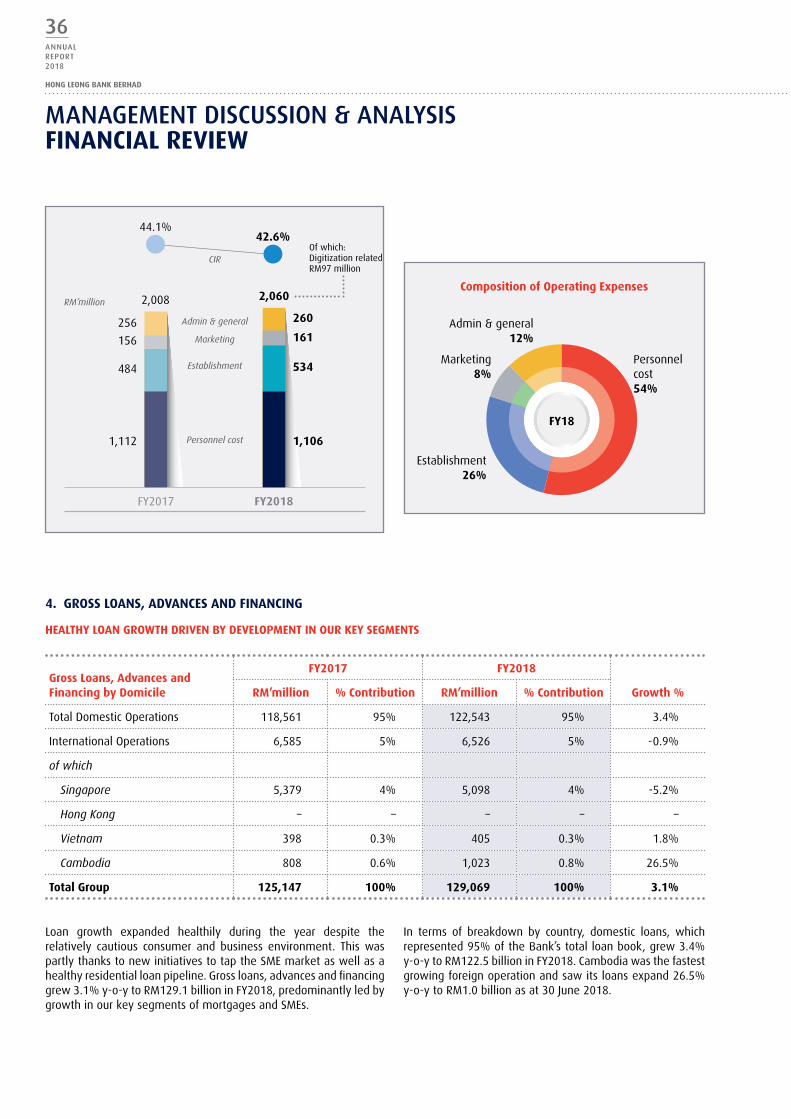
Operating expenses improved over theyear, reflecting the gains realized fromourefficiencyandproductivitymeasures.Our cost-to-income ratio (“CIR”) dippedto a six-year low of 42.6%, betteringlastyear’smarkof44.1%.ThelowerCIRhelpedboostoperatingprofitforFY2018by 9.3% y-o-y to RM2,779 million fromRM2,543 million the previous year. Wealso saw positive JAWS (income growthrateexceedingexpensesgrowthrate)foreight consecutive quarters as costs andproductivityimprovedduetoefficienciesderivedfromourdigitizationandstrategiccostmanagementinitiatives.
In FY2018, gross loans and financinggrew 3.1% y-o-y to RM129.1 billiondespite a relatively cautious consumerand business environment. The increasewas predominantly due to contributionsfromourkeysegmentsofmortgagesandSmallandMediumEnterprises(“SMEs”).
Domesticloanstotheretailsegmentrosesteadilyby3.3%y-o-ytoRM91.0billion.Thefastestgrowthinloansandfinancingwasseeninresidentialmortgages,whichexpanded7.9%y-o-y to RM61.4 billion.The robust increasewas supportedby ahealthy home loan pipeline. Transportvehicle loans however, were lower atRM16.9 billion, reflecting softer industrygrowth.
“Oursuccessextendedbeyonddomesticshoresasourregionalentitiesandassociateschalkedupimpressivegrowthnumbers.Wealsobrokenewgroundinourjourneytoreimagineourbankasadigitalenterprise.Wearethefirstbankincountrytoofferchat-basedbanking–utilizingtheubiquitousandpopularchat
technologytoallowcustomerstonowalsoperformbankingtransactions.Wealsoembarkedonartificialintelligenceandautomationtorampupour
productivityandspeedofexecution.”
CORPORATE
21ANNUALRePORT
2018

SMEs are a key market for the Bank and loans and financingtoSMEswashigheratRM20.5billion,comprising15.9%oftheBank’sloanbase.Thiswasmainlydrivenbya22.4%growthintheBank’sGroupSMEBanking(“GSME”)portfolio.GSMEisanewcommunitybankinginitiativefocusingsolelyontheSMEmarketsegment.
The Bank maintained its strong position in terms of fundingandliquiditywhichremainedhealthyandprudentwithaloans-to-deposit ratio of 82.0%. Liquidity coverage ratio meanwhilecameinat126%,whichputsusaheadofscheduleaswellasfarexceedingregulatoryrequirementsof100%by2019.
TheBankcontinuedtoenjoyastablefundingbasebackedbyastrongindividualdepositbasewhichtopstheindustryat56.0%.
Customer deposits for FY2018 increased by 1.4% y-o-y toRM157.4 billion supported by strong CASA expansion of 6.3%y-o-y to RM41.2 billion. As a result, CASA ratio improved to26.2%ascomparedto25.0%lastyear.
TheBankhasalwaysbeenuncompromisingaboutmaintainingstrong asset quality. FY2018 was no different as the grossimpaired loan ratio and the loan impairment coverage ratioremainedsolidat0.87%and89%respectively.Iftheregulatoryreserve set aside as at 30 June 2018 is included, the Bank’scoverageratiowouldbeevenhigherat155%.
TheBank’scapitalpositionremainsrobustwithCommonEquityTier1,Tier1andTotalCapitalRatiosat12.6%,13.3%and16.3%respectively.
Strategic Workforce planning
Strong employee-employer proposition
Focus on employee potential
Leverage on technology
1
2
3
4
Cost-to-IncomeRatio
42.6%OperatingProfit
+9.3% yoy
Loans-to-DepositRatio
82.0%LiquidityCoverageRatio
126.0%
Four KeY pILLarS
HuMaN reSourceS
We at Hong Leong believe our people are our most valuableasset.OurambitiontobeahighlydigitalandinnovativeASEANfinancial services enterprise puts us in a unique position toattract, develop and retain a diverse pool of talented people.Tobuild thisfit for future talentpool,wehaveput inplaceastrategicroadmaptodrivethepeopleagenda.
GuidedbythefourkeypillarsofStrategicWorkforcePlanning,Strong Employee-Employer Proposition, Focus on EmployeePotentialandLeverageonTechnology,wehavemadesignificantprogressover thepast12months in advancingeachof thesefourpillars.
This year’s annual report present stories that reflect on theinitiatives we carried out based on the four guiding pillars.Thesestoriesillustrateourcommitmenttocreatingaconducivework environment, one that genuinely takes into account ouremployees’ needs and ambitions. We do this by giving ouremployees the best possible opportunities for learning andpersonal growth and equipping them to face the new andevolvingchallengesoftoday’sdynamicenvironment.
gROUP mANAgINg dIRecTOR/cHIeF eXecutIVe oFFIcer’S reVIeW
22ANNUALRePORT2018
HONG LEONG BANK BERHAD
SuStaINabILItY
We have a proud heritage of creatingvalue for our stakeholders, customersand communities in which we operate.Tomaintain thisover the longterm,wehave integrated sustainability practicesin our business to become stronger andmore resilient as well as to deliver onour social, economic and environmentalobligations.
In this report we will show how oursustainability practices have enhancedefficiency and supported SMEs – thebackbone of our economy. We will alsoshow how our compliance efforts andcorporate governance enhance andprotect stakeholder value. And last butnotleast,ourreportwillpresenthowour
Corporate Social Responsibility (“CSR”)efforts reach beyond our Group to helpourcustomerssucceed.
Digitalinnovationisakeycomponenttoour sustainability as an enterprise as ithelpsusremainrelevantandcompetitivein an era of increasing technologicalsophistication.Ourdigitalizationexercisehasreapedpositivereturnsandsignificantsavings for thegroupsince its launch in2016.Inthisreport,youwillseethatthelaunch of “Digital at the Core” in bothbusinessandhumanresourceoperationshasincreasedefficiencysignificantlyandenhanced effectiveness in our businessfacilities.
We also showcase how our corporatebankingproductsandservicesfacilitated
SME development by providing value-added services and programs that gobeyond financial services. SMEs accountfor over 98% of enterprises in Malaysiaandcontributesignificantly toMalaysia’sGDP. Similar to other emerging marketshowever, Malaysian SMEs commonlyfacebarriers tofinance.Or theymaybeheldbackbyabusinessenvironmentdueto the challenges that come with sizelimitations.
Supporting small business growthis essential for long term economicgrowth.Wewant to help small firms tothriveandbecome largerfirms.Thisnotonly increases market competition andinnovation but most importantly createssustainablejobopportunities.
gROUP mANAgINg dIRecTOR/cHIeF eXecutIVe oFFIcer’S reVIeW
CORPORATE
23ANNUALRePORT
2018

In line with this view and given thatSME development is a core componentof the Bank’s corporate strategy, wehavehelpedmanyofourSMEcustomersovercome their limitations with ourvaluepropositions.Thismeansthattheirlimitations in termsofHumanResource,Administrative,SupplyChainandLogisticswere all addressed with our innovativeproducts and services. This serves asmeans of operationalizing our end goaltopromotesustainableSMEdevelopmentlocallyandintheSouthEastAsianregion.
In this report, we also present in atransparentway, thestringentprocessesimplemented internally to ensure ourproducts and services are customers’needs focused and adhere to stringentethics and professional norms. Thisincludes our corporate governanceprocessesandthenecessaryduediligencereviews that ensure HLB is compliantto the codeand conduct of thebankingindustry and operates as a responsiblefinancialinstitution.
Webelieveverymuch inpromotingCSRin client companies as well as our ownorganization. Our CSR focuses on threeareas. The first is helping the Group’sclientsandcommunitiesbetterrecognizeand seize opportunities. The second ishelpingthemavoidanyrisksarisingfromenvironmental and social areas relevanttotheirbusiness.Andthethirdishelpingthem to engage more effectively withlocalstakeholders.
recognition of our digital efforts
Anumber of theBank’s initiativeswereselected for prestigious awards andaccoladesoverthepastyear.TheseawardsarearecognitionfortheBank’sresiliencyin a challenging operating environmentand also a spotlight on our ongoingdigital transformation and commitmenttowards the provisioning of innovativedigital financial services solutions. Wealso emerged winners in competitionsthathighlightourexcellenceinattractingandgroomingtop-flighttalent.
Theawardsarealsoatestamenttohowour investments have enhanced thecustomer experience. The benefits wereespeciallyapparentfromourinvestmentsinourmulti-platformbankingchannels,inparticularourpushtoincreaseourreachthrough digital and mobile banking, aswell as through our community focusedbranchnetwork.
One of the highlights of the year waswhen we were selected as one ofAsia’s best employers for graduatesby Human Resources Asia RecruitmentAwards 2018. The award was for BestGraduate Recruitment Programme andis a recognition of our commitmentto developing the next generation ofexceptional bankers for the Group. TheBankoutshonemanystrongcompetitorsfromacrossAsiatobeselected.Theawardis a clear recognition of our program’scomprehensive approach to recruitinggraduatetalentanddevelopingthemintofirst-classbankingprofessionals.
AnotherawardtheBankclinchedwasforBestInnovationinRetailBankingMalaysia2017 by International Banker 2017BankingAwards. Thiswas in recognitionofourconstantdrivetoimproveproductsand services and make them customerfocusedthroughstate-of-the-artbankingsolutions.
TheGroup’sintensiveeffortstotransformcustomer experience as a digital bankwas recognized by Asiamoney whenit gave us the Best Bank in Malaysia –CashManagementCustomerSatisfactionAward 2017. In winning the award,Asiamoney noted our unmatchedcustomercentricapproachwhichincludedseveral first-in-Malaysia innovationsfocused on improving overall customerexperience. These included the use ofArtificialIntelligencetosupportcustomerservicethroughchatsoftwareandarobotconcierge to help guide customers atbranches, and the launch of “Loan2Go”being a straight-through-processingmobileautoloanapplicationplatform.
“TheseawardsarearecognitionfortheBank’sresiliencyinachallengingoperatingenvironment
andalsoaspotlightonourongoingdigitaltransformationandcommitmenttowardsthe
provisioningofinnovativedigitalfinancialservicessolutions.Wealsoemergedwinnersincompetitions
thathighlightourexcellenceinattractingandgroomingtop-flighttalent.“
gROUP mANAgINg dIRecTOR/cHIeF eXecutIVe oFFIcer’S reVIeW
24ANNUALRePORT2018
HONG LEONG BANK BERHAD

TheBankalsoclinchedtheGoldAwardforHighest Returns to Shareholders Over 3YearsandSilverAwardforHighestReturnonEquityOver3YearsasawardedinTheEdge–BillionRinggitClub2017edition.Thesetwoawardsarearecognitionoftheoutstanding returns that we generatedfor our shareholders. Our shareholdersenjoyed commendable capital gainswhen our stock appreciated by 25.4%,from RM12.49 to RM15.66, betweenApril1,2014,and June30,2017,whichwas the period of review for The EdgeBillion Ringgit Club (“EBRC”). The returnwas the highest among all our bankingpeersintheEBRC.
StrateGIc prIorItIeS
We are transforming to be a highly digital andinnovative ASEAN financial services enterpriseand executing our digital strategy is a top priority.Whendiscussingourstrategicpriorities,itisimportanttokeepinmindthatweholdourwellembeddedvaluesastheguidingprinciplesthathaveledustowherewearetoday–standingtallasoneofMalaysia’sleadingbanks.We,therefore, remainsteadfast inourcommitmenttobuild momentum with carefully developed initiativesthatarebasedonourstrategicpriorities.
In formulating our strategic priorities, we will focus on: ever expanding digitalcapabilities,increasecustomerengagementandtransformationoftheentirecustomerexperiencewhenevertheyinteractwithus,capabilitiesenhancementinthesegmentsweserve;culturetransformationtoensureourworkenvironmentremainsconduciveto business growth in a highly evolving competitive landscape and finally, physicallocationsanddistributionnetworktransformationtoensurethatweareabletoengagecustomerswithvalueaddconversationsratherthansimpletransactionalinteractions.Iwillgointogreaterdetailabouteachofourstrategictenetsonthefollowingpage.
“Ourshareholdersenjoyedcommendablecapitalgainswhenourstockappreciatedby25.4%,whichwastheperiodofreviewforTheEdgeBillionRinggitClub.”
gROUP mANAgINg dIRecTOR/cHIeF eXecutIVe oFFIcer’S reVIeW
CORPORATE
25ANNUALRePORT
2018

Wehavealsolaunchedagame-changingnewmobilebankingapp with an enhanced interface and innovative ‘3-word-banking’functions.Thelatterisasmartfeaturewhichmakesbankingsimplerandevenmoreconvenientforourcustomers.Itallowsthemtotypeinjustthreewordstocompleteanentirebankingtransaction,anytimeandanywhere.ThethreewordsjustneedtostatethedesiredAction,NameandAmountandthetransactionwillbecompletedinstantlyanddigitally.Theappisalsobuilttogivecustomersamoresecureandseamlessmobilebankingexperience.
To improve the experience for our corporate, commercialandSMEcustomers,we launchedHongLeongConnectFirstinNovember2017.HongLeongConnectFirstoffersasinglesign-onaccesstoacomprehensivesuiteofadvancedcash,tradeandforeignexchangesolutions.Itisacomprehensiveplatformthatalsoprovidesforhighlevelsofcustomization.Thisallowsustoserveourcustomersbetterbycateringtoindividual needs across the entire range of our businessclients,eachofwhommayhavedifferentrequirements.
To strengthen our position as society goes increasinglycashless, we partnered with China’s mobile ecommercegiantTenCent.ThispartnershipinvolvesusingWeChatpaytoenableonlineandoffline(O2O)digitalpaymentsfromretailmerchantsinMalaysiawithaneasy-to-adopt,fullyintegratedcross-borderpayment solution. This is ourfirst forayas anacquirer of the very popular Chinese digital wallet-basedpaymentmethodology.BypartneringwithTenCent,wecanrideontheWeChatPayplatformwhichhasover600millionmonthlyactiveusersinChina.
Our goal to utilize technology to raise levels of customersatisfaction extends to the frontier of using Big Data.To deliver products and services that enhance customerexperience, we need meaningful insights to help usimprove our offerings. The Bank is increasingly leveragingon a combination of structured and unstructured data toderive the required insights. Our teams are at the sametimeimprovingourservicequalitybyconstantlymonitoringcustomer interactions through real-time analytics. We arealso enhancing our cross selling and customer acquisitioneffectiveness by the strategic use of data analytics togeneratetargetedleads.
In short,over the long term,wewant customers toenjoysimplicity, speed and control by offering a digital journeylikenoother.Onethatiscompletelyon-line,paperlessandhassle-freewithreal-timeapprovals.Andthiswillbedoneby effectively harnessing the power of digital capabilitiesandbigdataanalytics.
As part of our bank-wide strategic initiative ofembracingamindsetofbeingDigitalattheCore,wehave committed todo the following. Firstly,wewilldigitizetheBanksothatwecanacquirenew customers seamlessly. Secondly, we willtransform our customer engagement process toensure that we get to know customers better,anticipating their needs and providing solutionsthatcorrespondtothoseneeds.Wearespendingtimeandresourcestoreimagininghowbankingcanbethroughoutcustomerjourneysandhencedriving new experiences centred on making itsimple for customers when they deal with us.We are streamlining customer interactions overmultiple channels to provide a seamless andpersonalized customer experience across all thevarioustouch-points.
Tomaketheabovehappen,itiscrucialthatwesharpenourfocuson thedigitalbusinessmodelbyenhancingfivekeycapabilities:
ü Leverage on digital technologies to broaden our reachandacquirenewcustomers.
ü Enable customers to transact anytime and anywhereinstantlyanddigitally.
ü Engagewithourcustomersthroughcontextualmarketing.
ü Re-platform our technology stack and build inhousedigitalexpertise.
ü Step up utilization of data to create insights and driveaction.
Our people are exploring impactful new ideas aroundcustomerinteractionandengagement.Oneoftheoutcomesofthisistheimprovementoftheoverallcustomerexperiencethroughtheuseofinnovativeandcutting-edgetechnologies.For example, we introduced online application capabilitiesfora rangeofproducts. These include currentand savingsaccounts, personal loans, credit cards and mortgages. Byofferingthisonlineapplicationfunctionality,wemakethingseasierandsimplerforourcustomersastheycannowsubmitapplicationsattheirconvenience.
1. eXpaNDING DIGItaL capabILItIeS, INcreaSe cuStoMer eNGaGeMeNt aND traNSForMatIoN oF tHe eNtIre cuStoMer eXperIeNce
gROUP mANAgINg dIRecTOR/cHIeF eXecutIVe oFFIcer’S reVIeW
26ANNUALRePORT2018
HONG LEONG BANK BERHAD

We are cognizant of the evolving digital trendsthat shape consumer behaviour and businessmodels that are transforming the financialservices industry. Rather than trying to resistthe tide, we are utilizing these latest digitaltechnologies and emerging business models tobemorecompetitivebydesigningproductsandservicesthatcancatertotheneedsofevenourmostdiscerningcustomers.
Tobuildtherequisitecapabilities,wehavestrengthenedourtechnologicalreadinessandinvestedinin-houseproprietarydigital capabilities. Our technology team reconfigured oursystemstooptimizeourtechnologyinfrastructure.Wemadethestrategicdecisiontomovefromproprietarytechnologytoopensourceplatforms.TheBankalsoadoptedtheagiledevelopment cycle. These last two initiatives paved theway for us to build internal digital capabilities that candevelop solutions in significantly shorter time frames andat lower cost levels than was previously possible throughthe outsource model. As a result, we have become morecompetitiveagainstaggressiveandinnovativenon-financialserviceplayerssuchasFinTechstart-ups.
Now that we are armed with better in-house technicalcapabilities,enhancedfront-enddigitaltoolsandimprovedspeedtomarket,wecancollaboratebetterwithourbusinesspartners.Ourcollaborations, intheformofsharedbankingservices capabilities, help us build an edge against futurecompetition.
Our belief in the power of collaboration also led us toinitiate a mentorship and developmental program namedHLBLaunchPad.ThisstrategicprogramisaimedatnurturingyoungMalaysianentrepreneursand fosteringcollaborationwith theemerginggenerationof FinTechpractitioners andothertech-savvystart-ups.Theprogramhasbeenasuccessandisatestamenttoourbeliefthatworkingwithstart-upsisthewayforward.WorkingwithFinTechplayerstaughtustobemoreagile,nimbleandadaptivetocurrentmarketneeds.
Italsoinspiredustoacceleratethepaceofimprovementinourproductsandservices.
In order to remain relevant for the future and achievelong term sustainability, we continue to invest and buildcapabilities that take advantage of new and emergingtechnologies such as digitization and software robotics oralsoknownasroboticsprocessautomation(“RPA”).Throughdigitization of our products and services we are able toachieve operational excellence and transform the cost ofacquiringandservicingcustomers.Thisinturnallowsustodirect savings from the existing cost base into investmentin digital initiatives. A key example of this would be theintroduction of RPA. Development work on this excitinginnovation is currently underway at our processing centerandoperationsunit.WeforeseethattheuseofroboticswilldriveproductivityandefficiencyintheRetailandWholesaleBank Operations divisions. It is also expected to improvecycletimesandlowererrorrates.
We also worked on making banking a more pleasurableexperienceforbothourcustomersandemployees.Wedidthisby seamlessly integratingour services intoonlineandmobileplatforms.Weinspireouremployeestobeagileandadopt a start-upmentality byempoweringour employeeswiththefollowingdigitaltools:
ü Smartup:Ourknowledgesharingplatformthatprovidesbite sized learning programs to our employees tofacilitatecontinuousacquisitionofnewknowledgeanddevelopmentoftheirskillsbase.
ü HaLI:OurAIchatbotthatanswersquestionsrelatingtoHumanResources(“HR”)andbranchoperationssupport.ThechatbotisalsoaccessiblethroughthemobilephoneforquestionspertainingtoHRpolicies.
ü big Data dashboard: Our platform that provides realtime information to channel owners and otherstakeholders. It is a single data source for us to viewoperational performance, service levels and customersatisfactionlevels.
2. cuLture traNSForMatIoN to eNSure our WorK eNVIroNMeNt reMaINS coNDucIVe to buSINeSS GroWtH IN a HIGHLY eVoLVING coMpetItIVe LaNDScape
gROUP mANAgINg dIRecTOR/cHIeF eXecutIVe oFFIcer’S reVIeW
CORPORATE
27ANNUALRePORT
2018

We believe mobile and Internet banking willaccount for more than 75% of the Bank’s totaltransactions over the next couple of years. Thisis in line with evolving customer preferencesand hence our initiatives to transfer bankingtransactionstoonlineplatforms.
Infact,wesawtremendousgrowthininternetandmobilebankingcustomersovertheyear.Wearethereforeactivelyre-platforming our branches to ensure relevancy andefficiencyaswe continue toembedourbranches into thecommunitiestheyserve.
We are confident that robust digital capabilities will helpusacceleratebranch transformationbymovingaway fromlow-valuetransactionstomorecomplexproductssalesthatrequire human assistance. Our branches will complementtheir service offerings with our digital platforms. Towardsthisend,wearereconfiguringbankinghallsandequippingbrancheswithdigitaldevicesforbettercustomercentricity.
Themostexcitingdevelopmentinourjourneytorecastandreshapeourpremisesforthedigitalerawastheopeningofour flagship branch inDamansara City inNovember 2017.StrategicallylocatedinthedynamicandupscaleDamansaraHeightsbusinessdistrict, theflagshipbranch ispartofournewgreencertifiedcorporateheadquarters–MenaraHongLeong,whichweofficiallymovedintoinOctober2017.
As befitting a flagship experience that will serve as atemplateforourotherbranches,theDamansaraCitylocationfeaturesoptimaldeploymentofdigitaltechnologiesthatwillshift our customer experience to make it more rewardingandengaging.Tominimizequeuelines,weinstalledwirelessterminalsandapplications.Thesefacilitiesallowcustomerstheflexibilityofperformingspeedyandpersonalizedbankingtransactionsanywherewithinthepremises.AnewDiscoveryZone was also introduced in Damansara City. In the zone,visitorscaninteractwithourdigitalplatformstocustomizesolutionsfortheirfinancialplanningneeds.DamansaraCityisalsothefirstbranchtoofferadozenmeetingroomsforusebyourentrepreneurandbusinessassociates.OurPriorityBankingcustomerswillalsoenjoyanupgradedexperiencewithcomplimentaryvaletparking,state-of-the-artfacilitiesaswellasexclusiveartandfurnishings.Dodrop-intohaveacoffeeonus!
TheBankhasallocatedRM30millionofourcapextoconvert50outof250existingbranches to thenewdigital formatover the next couple of years. This initiative will lead tooperationalcostsavings.Forinstance,inourBurmahHousebranchinPenang,thenewdigitalformatreducedspacethat
waspreviouslydedicated forbackroomoperations suchasdepositmachinesto25%oftheoriginalarea.ThisopenedupadditionalspaceforcustomerservicingaswellasattheDiscoveryZone,whichisaimedatenhancingthecustomerexperience; whilst reducing overall space, hence, reducingrunningcosts.
Ourin-branchsalesandservicetabletdeviceswillalsoassistourbranchrelationshipofficersinservicingtheircustomersmore effectively. The devices have enabled our officers tooffercustomerspersonalizedsales,after-salesandcustomerservice. Ithelps themperformdigitalbanking transactionsand at the same time offer new products that meetcustomers’specificneeds.
Thisenhancedproductivitymeansthatwecanrepositionourbranchestoperformmorehighervalueactivities.WecannowdeployfocusedresourcesforWealthManagement,Insuranceandhighvaluesecuredlendingandofferadvisoryservicesto our customers. The branch will also focus on buildingdeeper relationships with the business community aroundthe catchmentareaof thebranch. This communitybasedapproachwillanchorourSMEofferinggoingforward.WearealsoinstallingTellerAssistunitstofacilitatethehandlingofcashanywhereinthebranch.Theunitssignificantlyincreasethesecurityofholdingcashinbranches,aswellas,enhancetheemployeeexperienceastheycomewithauditabletrailstoshortenreconciliationtimes.
We are building a best-in-class SME business to moreeffectively engage and serve SMEs. We are doing this byleveraging dedicated SME coverage teams. These teamsincludespeciallytrainedseniorexecutivesandarestationedatourtopbranchesandbusinesscentres.Thisallowsustogrow our presence in the SME segment and increase ourmarketsharebyembeddingourselvesinthecommunitytoimprove engagement and service delivery, as mentionedabove.
ThankstoourunderstandingofthesmallbusinesscommunityandthechallengesthatSMEsfaceoperatinginacompetitivemarket, the Bank is playing a role to help them be moreagileandnimble.TocatertotheneedsoftheSMEmarket,we launched an innovative and comprehensive suite ofdigitalbusinessandfinancingsolutions tailoredspecificallyto serve the needs of SMEs. The suite encompasseseverything from cash management to advertising andpromotion(A&P)solutionsaswellaspropertyfinancingandworking capital schemes to support day-to-day businessoperations;employeeandtaxmanagementdigitaltoolsandan innovative invoice financing offering through a FinTechpartner.
3. pHYSIcaL LocatIoNS aND DIStrIbutIoN NetWorK traNSForMatIoN to eNSure tHat We are abLe to eNGaGe cuStoMerS WItH VaLue aDD coNVerSatIoNS ratHer tHaN SIMpLe traNSactIoNaL INteractIoNS
gROUP mANAgINg dIRecTOR/cHIeF eXecutIVe oFFIcer’S reVIeW
28ANNUALRePORT2018
HONG LEONG BANK BERHAD

outLooK
The global economy isexpected togrowsteadilyin 2019, underpinned bycontinuous but slowergrowth in advancedeconomies and fastergrowth in the emergingmarketeconomies.While global demand is expected toremain healthy, there are potentiallydisruptive risks in the coming year thatwewillkeepaclosewatchon.ThefirstisanyescalationintradetensionsbetweentheuSanditsmajortradingpartners.Thesecondismonetarypolicyshiftsbyglobalcentral banks. The third are geopoliticalrisks, especially in Europe with Brexitexpected tohappen inMarch2019,andlastbutnotleast,thelatestTurkishcrisisthat raised fearofaspill-over toEuropeand other emerging markets. Each ofthese developments could have majorrepercussionsontheglobaleconomyandfinancialmarkets.
Major central bankers, including theuS Federal Reserve and the Bank ofEngland,havewarnedofdownsiderisksto global growth prospects should tradeprotectionism and geopolitical riskscontinue to manifest. This is in additionto policy normalization that is moreaggressive than expected, which couldstymiegrowthandliquidity.
In the local context, the Malaysianeconomy is expected to track theoutlook of the global economy. Growth
will continuetobesupportedbyprivateconsumptionandexternaldemand.Thesetwoeconomicdriversmighthavetopickuptheslack fromanytransitorysetbackin investmentdue to thepostponementandreviewofnumerousmegadomesticprojects as the new governmentreprioritizes and streamlines its fiscalagenda. That said, overall growth isexpectedtoremainonasteadytrajectory,barringoutbreakofanyglobalcrisis.
acKNoWLeDGeMeNtS
Many parties have played a part in oursuccess. I want to thank our customersfirstandforemostfortheirtrustinusandfor their loyal patronage. I also want tothank our shareholders for their strongsupport and belief in us and what wearedoing.Mydeepestappreciationalsogoes to the Board of Directors for theirinvaluablewisdomandguidance.
The Hong Leong Group family – all theemployeesandmymanagementteam–havegivenselflesslyoftheirenergyandtalentstoensuretheBank’sprogressandsustainability. I want to thank them fortheir dedication, commitment and hardworkintheexecutionoftheirduties.
IalsowanttoextendmyappreciationtoBank Negara Malaysia, the Ministry ofFinance, related government agenciesandotherregulatoryauthoritiesfortheirguidanceandassistanceduringtheyear.
For a deeper look at the Bank’sperformance in FY2018, please refer totheManagementDiscussionandAnalysis(“MD&A”)section.
DoMeNIc FuDaGroupManagingDirector/ChiefExecutiveOfficer
19September2018
Whiledigitizationisourprincipalpriority,weremaincognizantofthecyber-securityrisksinvolved.Toaddressthis,wehavestrengthenedourcyber-securitycapabilitiestocreateahighlysecured digital environment. We did this through activemonitoringandethicalhackingtoidentifyanyweaknessinourtechnologycapabilitiesandorganizationset-up.Wealsocreatedawareness through threat intelligenceand internal
training. We made sure that our robust and automatedprocesses are backed by comprehensive security controlsthatenablereal-timeservicedeliverywhilemanagingfuturethreats.Wecontinuetoruneducationalcampaignstoensurethatcustomersareawareofcybersecurityrisksandplayapartinsafeguardingdigitalofferingsandcapabilities.
gROUP mANAgINg dIRecTOR/cHIeF eXecutIVe oFFIcer’S reVIeW
CORPORATE
29ANNUALRePORT
2018
mANAgemeNT dIScUSSION & ANALySISFINaNcIaL reVIeW
FY2017 FY2018 Growth %
profitability & efficiency (rM’million)
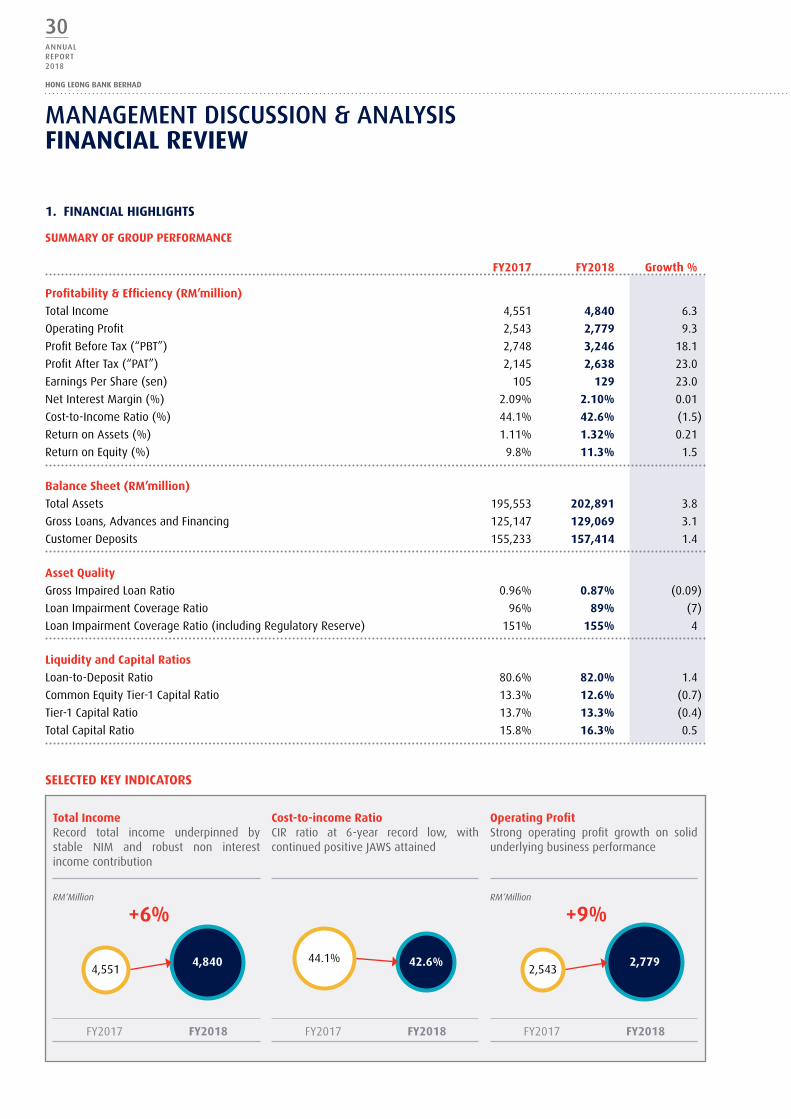
TotalIncome 4,551 4,840 6.3
OperatingProfit 2,543 2,779 9.3
ProfitBeforeTax(“PBT”) 2,748 3,246 18.1
ProfitAfterTax(“PAT”) 2,145 2,638 23.0
EarningsPerShare(sen) 105 129 23.0
NetInterestMargin(%) 2.09% 2.10% 0.01
Cost-to-IncomeRatio(%) 44.1% 42.6% (1.5)
ReturnonAssets(%) 1.11% 1.32% 0.21
ReturnonEquity(%) 9.8% 11.3% 1.5
balance Sheet (rM’million)
TotalAssets 195,553 202,891 3.8
GrossLoans,AdvancesandFinancing 125,147 129,069 3.1
CustomerDeposits 155,233 157,414 1.4
asset Quality
GrossImpairedLoanRatio 0.96% 0.87% (0.09)
LoanImpairmentCoverageRatio 96% 89% (7)
LoanImpairmentCoverageRatio(includingRegulatoryReserve) 151% 155% 4
Liquidity and capital ratios
Loan-to-DepositRatio 80.6% 82.0% 1.4
CommonEquityTier-1CapitalRatio 13.3% 12.6% (0.7)
Tier-1CapitalRatio 13.7% 13.3% (0.4)
TotalCapitalRatio 15.8% 16.3% 0.5
SeLecteD KeY INDIcatorS
1. FINaNcIaL HIGHLIGHtS
SuMMarY oF Group perForMaNce
total Income Record total income underpinned bystable NIM and robust non interestincomecontribution
operating profit Strong operating profit growth on solidunderlyingbusinessperformance
cost-to-income ratio CIR ratio at 6-year record low, withcontinuedpositiveJAWSattained
FY2017 FY2018 FY2017 FY2018FY2017 FY2018
RM‘Million RM‘Million
+6% +9%
4,840 2,77942.6%4,551 2,543
44.1%
30ANNUALRePORT2018
HONG LEONG BANK BERHAD

mANAgemeNT dIScUSSION & ANALySISFINaNcIaL reVIeW
outStaNDING operatING MetrIcS & proFItabILItY
Allofourkeyfinancialindicatorshaveshownimprovementsfromthepreviousyeardespitea challengingbusinessenvironmentthathasaffectedthebankingindustry.
Total income for FY2018 sustained its growth momentum,improvingby6.3%y-o-y toRM4,840million.Thegrowthwassupportedbyacombinationofprudentloanpricingandfundingcost management coupled with strong growth in non-interestincomecontribution.
Operating expenses for FY2018 remained well managed, atRM2,060million.ThissetsanewmilestonefortheBankascost-to-incomeratio(“CIR”)dippedto42.6%,thelowestinsixyears,withpositiveJAWsaffirmedforeightconsecutivequarters.Thisisaresultofourcontinuingdrivetorealizeefficienciesfromourdigitizationandstrategiccostmanagementinitiatives.
Operating profit for FY2018 expanded 9.3% y-o-y to RM2,779million versus RM2,543 million in the same period last yearon the back of solid top-line growth coupled with improvedefficiencies. Correspondingly, PBT and PAT accelerated 18.1%and 23.0% to a record RM3,246 million and RM2,638 millionrespectively.
Earningspershare(“EPS”)hasimprovedto129sencomparedto105senthelastfinancialyear.Returnonequity(“ROE”)wasalsofurtherenhancedto11.3%forFY2018ascomparedto9.8%thepreviousyear.
StroNG baLaNce SHeet
Althoughoperatinginarelativelycautiousconsumerandbusinessenvironment, our gross loans, advances and financing grewcommendablyby3.1%y-o-ytoRM129.1billion,predominantlyledbygrowthinourkeysegmentsofmortgagesandSME.Atthesametime,ourcustomerdepositsforFY2018increasedby1.4%y-o-ytoRM157.4billion.Ourcustomerdepositshadanindustryhighest individual deposit mix of 56.0% - a testament to ourstrongretaildepositfranchise.Asaresult,theBank’sloans-to-depositsratio(“LDratio”)wasaprudent82.0%andsupportiveofgrowthgoingforward.Asat30June2018,theBank’sLiquidityCoverage Ratio (“LCR”) position was at 126%, surpassing theminimumregulatoryrequirementof90%foryear2018.
INDuStrY LeaDING aSSet QuaLItY MetrIcS
The Bank’s asset quality metrics has remained solid with anindustryleadinggrossimpairedloan(“GIL”)ratioof0.87%whileloanimpairmentcoverage(“LIC”)stoodat89%.Whenincludingtheregulatoryreservesetasideasat30June2018,theBank’sloanimpairmentcoverageratiostandsataveryrobustlevelof155%. TheadoptionofMFRS9on1 July2018 is expected toincreaseprovisioningrequirements.Nevertheless,theBankhassufficientbuffertoalleviateanyincreaseinprovisioningduetoMFRS9.
HeaLtHY capItaL poSItIoN
TheBank’scapitalpositionremainsrobustwithCommonEquityTier1,Tier1andTotalCapitalRatiosat12.6%,13.3%and16.3%respectively.
Gross Loans Growth was led by key segments ofmortgagesandSME
Deposits Deposit growth driven by healthy CASAexpansion
Gross Impaired Loan ratio Solidassetqualitywithnomajorstressonanyportfolio
FY2017 FY2018 FY2017 FY2018FY2017 FY2018
RM‘Billion RM‘Billion
+3% +1%
129.1 157.40.87%125.1 155.2
0.96%
CORPORATE
31ANNUALRePORT
2018

2. KeY perForMaNce INDIcatorS (KpIs)
FY2018 KpI acHIeVeMeNt
TheBank’sachievementsfortheyearisatestamentofitsstrongunderlyingoperatingperformanceasalltargetssetforFY2018were met. We are encouraged by these solid achievementsand expect that this will set the pace for a continued strongperformanceinthenewfinancialyear.
• Loansgrowthof3.1%was ledpredominantlybygrowth inkeysegmentsofmortgagesandSME,albeitstilloperatinginarelativelycautiousconsumerandbusinessenvironment.
• LiquidityremainshealthywithaLDratioof82.0%andLCRof126%,inlinewithourviewthatmaintainingampleliquidityremains a top priority, especially in a dynamic operatingenvironmentinfluencedbymacroglobaluncertainties.
• Netinterestmargin(“NIM”)forFY2018improvedto2.1%onprudentfundingcostsmanagementandloanpricing.
• Non-interest income (“NII”) expanded 12.5% y-o-y whichwascomplementedmainlybystrongerwealthmanagementincomeandhighergains fromtreasuryoperations.ThishasledtoastrongNIIratioof27.8%forFY2018.
• For FY2018,CIR improved further toa6-year record lowof42.6%,aswecontinuetoplaceemphasisonefficiencyandproductivitygains.
• AssetqualityindicatorsremainssolidwithGIL<1%asperourguidance.
• Our continued strong performance further underlines thestrengthoftheBankandreinforcesourcommitmenttowardsdelivering consistent results and sustainable profits as weachievedaROEof11.3%forFY2018.
GrossLoanGrowth
LDRatio
NetInterestMargin
Non-InterestIncomeRatio
Cost-to-incomeRatio
GrossImpairedLoanRatio
ReturnonEquity
3.1%
82.0%
2.1%
27.8%
42.6%
0.87%
11.3%
3%–4%(revised)
~82%
>2.1%
~26%
<44%
<1%
10%–11%
target FY18 achieved FY18
mANAgemeNT dIScUSSION & ANALySISFINaNcIaL reVIeW
32ANNUALRePORT2018
HONG LEONG BANK BERHAD
3. INcoMe StateMeNt aNaLYSIS
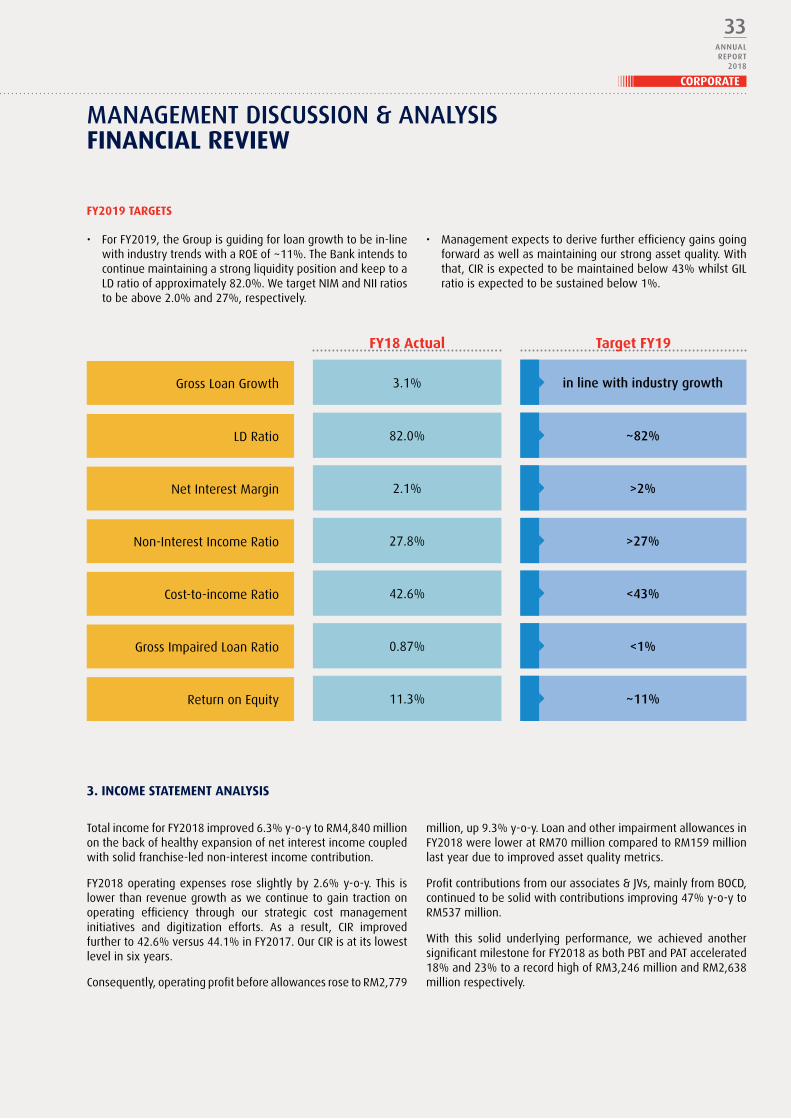
FY2019 tarGetS
TotalincomeforFY2018improved6.3%y-o-ytoRM4,840milliononthebackofhealthyexpansionofnetinterestincomecoupledwithsolidfranchise-lednon-interestincomecontribution.
FY2018operatingexpensesroseslightlyby2.6%y-o-y.This islowerthanrevenuegrowthaswecontinuetogaintractiononoperating efficiency through our strategic cost managementinitiatives and digitization efforts. As a result, CIR improvedfurtherto42.6%versus44.1%inFY2017.OurCIRisatitslowestlevelinsixyears.
Consequently,operatingprofitbeforeallowancesrosetoRM2,779
• ForFY2019,theGroupisguidingforloangrowthtobein-linewithindustrytrendswithaROEof~11%.TheBankintendstocontinuemaintainingastrongliquiditypositionandkeeptoaLDratioofapproximately82.0%.WetargetNIMandNIIratiostobeabove2.0%and27%,respectively.
million,up9.3%y-o-y.LoanandotherimpairmentallowancesinFY2018wereloweratRM70millioncomparedtoRM159millionlastyearduetoimprovedassetqualitymetrics.
Profitcontributionsfromourassociates&JVs,mainlyfromBOCD,continuedtobesolidwithcontributionsimproving47%y-o-ytoRM537million.
With this solid underlying performance, we achieved anothersignificantmilestoneforFY2018asbothPBTandPATaccelerated18%and23%toarecordhighofRM3,246millionandRM2,638millionrespectively.
• Managementexpectstoderivefurtherefficiencygainsgoingforwardaswellasmaintainingourstrongassetquality.Withthat,CIRisexpectedtobemaintainedbelow43%whilstGILratioisexpectedtobesustainedbelow1%.
GrossLoanGrowth
LDRatio
NetInterestMargin
Non-InterestIncomeRatio
Cost-to-incomeRatio
GrossImpairedLoanRatio
ReturnonEquity
3.1%
82.0%
2.1%
27.8%
42.6%
0.87%
11.3%
in line with industry growth
~82%
>2%
>27%
<43%
<1%
~11%
FY18 actual target FY19
mANAgemeNT dIScUSSION & ANALySISFINaNcIaL reVIeW
CORPORATE
33ANNUALRePORT
2018
change % rM’million FY2017 FY2018 (YoY)
Netinterestincome 3,355 3,495 4.2%
Noninterestincome 1,196 1,344 12.5%
Totalincome 4,551 4,840 6.3%
Operatingexpenses (2,008) (2,060) 2.6%
Operatingprofitbeforeallowances 2,543 2,779 9.3%
Allowancesforloansandotherimpairments (159) (70) (56.3%)
Shareofprofitsfromassociate&JV 364 537 47.4%
profit before tax 2,748 3,246 18.1%
profit after tax 2,145 2,638 23.0%
profit after tax (underlying)* 2,247 2,638 17.4%
Note:• Excluding one-off tax impact of RM102 million in FY17
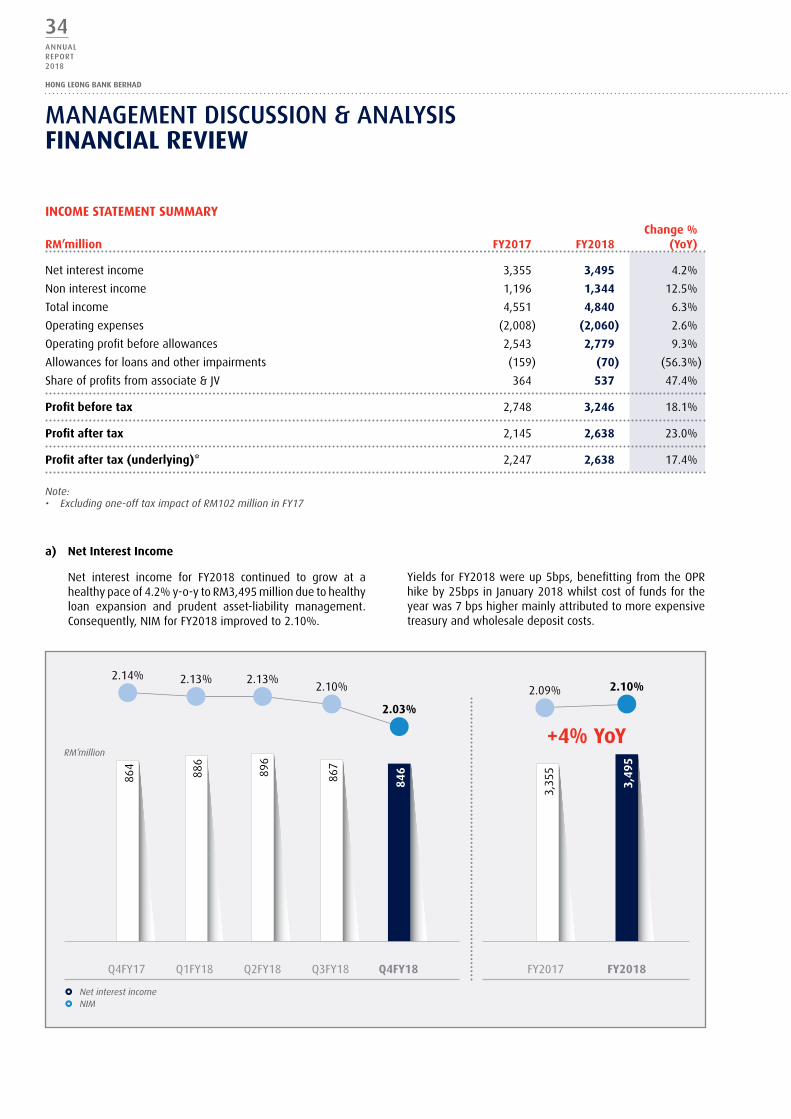
a) Net Interest Income
Net interest income for FY2018 continued to grow at ahealthypaceof4.2%y-o-ytoRM3,495millionduetohealthyloan expansion and prudent asset-liability management.Consequently,NIMforFY2018improvedto2.10%.
YieldsforFY2018wereup5bps,benefittingfromtheOPRhikeby25bpsinJanuary2018whilstcostoffundsfortheyearwas7bpshighermainlyattributedtomoreexpensivetreasuryandwholesaledepositcosts.
+4% YoY
2.14% 2.13% 2.13%2.10% 2.09%
2.03%
2.10%
867
3,35
5896
886
864
846
3,49
5
Q4FY17 Q1FY18 Q2FY18 Q3FY18 Q4FY18 FY2017 FY2018
£ Net interest income£ NIM
RM’million
INcoMe StateMeNt SuMMarY
mANAgemeNT dIScUSSION & ANALySISFINaNcIaL reVIeW
34ANNUALRePORT2018
HONG LEONG BANK BERHAD

b) Non-interest Income
Non-interest income for FY2018 saw a 12.5% y-o-yimprovementtoRM1,344million.Thisgaveusahighernon-interest income ratio of 27.8%. The growth in non-interestincome follows stronger wealth management income,dividend income from investments as well as robust gainsfromtreasuryoperations.
Wealth management income for Malaysia grew 24% y-o-ydriven mainly by growth in unit Trust and Banca whilststructured product contribution remained relatively stable.Fee incomecame in loweratRM574millionmainlyduetolowercreditcardfeesandloansyndicationfees.
c) operating expenses
Operating expenses for FY2018 remained well managed.Operatingexpenses rose2.6%y-o-y toRM2,060millionasrevenuecontinued tooutpaceexpensesgrowth for the8thconsecutivequarter.Thefavorabledifferential ingrowthledtoanimprovedCIRof42.6%asourdigitalizationeffortsandstrategic cost management initiatives continue to improveefficiencyandproductivity.
Personnelcostsaccountedfor54%oftotaloperatingexpensesandwasmarginally loweratRM1,106millioninFY2018. Inlinewithourcommitmenttotalentmanagement,personnelexpenditurecontinuedtobefocusedoninvestmentintalentacquisition.
Establishment costs rose 10.3% y-o-y to RM534 million,representing26%oftotaloperatingexpenses.The increasewas primarily due to higher investment in informationtechnologytosupporttheBank’sdigitizationtransformationinitiatives. More specifically, expenses for digitization
Trading and Investment income grew 45.9% to RM623million. This growth was driven mainly by higher dividendincome received from our investments in wholesale fundscoupledwithhighergainsfromsaleofsecurities.
Foreignexchange(“FX”)incomewashigheratRM105millioncompared to the previous financial year due mainly to thereduction in FX swapactivities that resulted in lower swapcosts. FX income also benefited from higher FX franchiseincomefromincreasedclienthedgingvolumesarisingfromtheincreaseinRM/uSDFXvolatilitymoretowardsthesecondhalfofthefinancialyear.
initiativesaccounted forRM97millionorapproximately5%of the total cost base. The on-going digitization exercisehowever,isexpectedtoyieldnumerousmedium-to-longtermbenefits.Theseincludeincostsavingsduetobetterefficiencyand productivity. The benefits of the digitization initiativesrangefromprocesssimplification,redundancyreductionandturn-aroundtime(“TAT”)reduction,allofwhichwillincreaseefficiencylevelsacrosstheGroup.Digitizationwillalsoallowustoreachcustomersegments,bothinMalaysiaandintheother markets we operate, that the usual physical branchpresence would not, increasing the prospects for futurebusinessgrowth.
Marketing expenses in FY2018 rose 3.2% y-o-y toRM161million,makingup8%oftotaloperatingexpenses.Administration and general expenses for FY2018 wererelatively stable at RM260 million and accounted for theremaining12%oftheBank’stotaloperatingexpenses.
Feeincome:ofwhich
Wealth Management Income (Malaysia)
FY2017 FY2018
+24%
rM105millionRM85
million
26.3%27.8%
FY2017 FY2018
RM’million
69
1,196
1,344
91
427
609
10542
623
574
£ Non-interest income ratio£ Islamic and others£ Forex
£ Trading & investment£ Fee income
mANAgemeNT dIScUSSION & ANALySISFINaNcIaL reVIeW
CORPORATE
35ANNUALRePORT
2018
4. GroSS LoaNS, aDVaNceS aND FINaNcING
HeaLtHY LoaN GroWtH DrIVeN bY DeVeLopMeNt IN our KeY SeGMeNtS
Loan growth expanded healthily during the year despite therelatively cautious consumer and business environment. This waspartlythankstonewinitiativestotaptheSMEmarketaswellasahealthyresidentialloanpipeline.Grossloans,advancesandfinancinggrew3.1%y-o-ytoRM129.1billioninFY2018,predominantlyledbygrowthinourkeysegmentsofmortgagesandSMEs.
In terms of breakdown by country, domestic loans, whichrepresented95%oftheBank’stotalloanbook,grew3.4%y-o-ytoRM122.5billioninFY2018.Cambodiawasthefastestgrowingforeignoperationandsawitsloansexpand26.5%y-o-ytoRM1.0billionasat30June2018.
Gross Loans, advances and Financing by Domicile
FY2017 FY2018
Growth %rM’million % contribution rM’million % contribution
TotalDomesticOperations 118,561 95% 122,543 95% 3.4%
InternationalOperations 6,585 5% 6,526 5% -0.9%
of which
Singapore 5,379 4% 5,098 4% -5.2%
Hong Kong – – – – –
Vietnam 398 0.3% 405 0.3% 1.8%
Cambodia 808 0.6% 1,023 0.8% 26.5%
total Group 125,147 100% 129,069 100% 3.1%
composition of operating expenses
Personnelcost54%
Admin&general12%
Marketing8%
Establishment26%
FY18
44.1%42.6%
FY2017 FY2018
RM’million
256
2,008 2,060
156
484
1,112
161
260
534
1,106
Ofwhich:DigitizationrelatedRM97million
Personnel cost
Establishment
Marketing
Admin & general
CIR
mANAgemeNT dIScUSSION & ANALySISFINaNcIaL reVIeW
36ANNUALRePORT2018
HONG LEONG BANK BERHAD

5. aSSet QuaLItY
SoLID aSSet QuaLItY MetrIcS WItH No MaJor StreSS IN aNY portFoLIo
Residentialmortgagescontributed48%oftheBank’stotalloanportfolioandgrew7.9%y-o-ytoRM61.4billion.Thegrowthwasunderpinnedbyahealthyhomeloanpipeline.Italsoperformedbetterthantheindustryaveragedespitethesofteningpropertymarket.TheBankcurrentlyhasadomesticmarketshareof11%.
Transportvehicleloansrepresented13%oftotalloansandwereloweratRM16.9billionasaresultofsofterindustrygrowthduringthefinancialyear.TheBankhasadomesticmarketshareof9%.
Loans and financing to SMEs was higher at RM20.5 billion,representing 16% of the Bank’s loan base. This was mainlydriven by a 22.4% growth in the Bank’s Group SME Banking(“GSME”)portfolio,anewcommunitybankinginitiativefocusingsolelyontheSMEmarketsegment.It isworthnotingthattheoverallSMEbasewasaffectedbythere-taggingofSMEaccountsin accordance with BNM’s new guidelines on SME definition.Beforethisre-tagging,SMEloanswouldhavegrown5.1%y-o-y.
TheBank’sassetqualityremainedbroadlystablewithnoparticularstressinanyportfoliosegments.TheBank’ssolidGILratioof0.87%hasconsistentlyout-performedtheindustryaverageof1.58%.MaintainingtheBank’sstrongassetqualityremainsakeyemphasisastheBankstrivestokeepitsGILratiobelow1%inthenewfinancialyear.
Gross Loans, advances and Financing by Key Segments
FY2017 FY2018
Growth %
Domestic Market Share %rM’million
% contribution to Group rM’million
% contribution to Group
ResidentialProperties(Group) 56,861 45% 61,370 48% 7.9% 11%
TransportVehicles(Group) 17,584 14% 16,894 13% -3.9% 9%
SME(Group) 20,377 16% 20,480 16% 0.5% 7%
asset Quality by Key Segments FY2017 FY2018Industry average as at June 2018
ResidentialProperties(Group) 0.54% 0.58% 1.10%
TransportVehicles(Group) 0.81% 0.79% 1.02%
SME(Group) 1.49% 1.72% 2.79%*
Note: * Industry average as at latest available (March 18)
1.76%
1.18%
1.61%
0.84%
1.62%
0.79%
1.63%
0.96%
1.58%
FY14 FY15 FY16 FY17 FY18£ Industry GIL ratio£ GIL ratio
0.87%
mANAgemeNT dIScUSSION & ANALySISFINaNcIaL reVIeW
CORPORATE
37ANNUALRePORT
2018
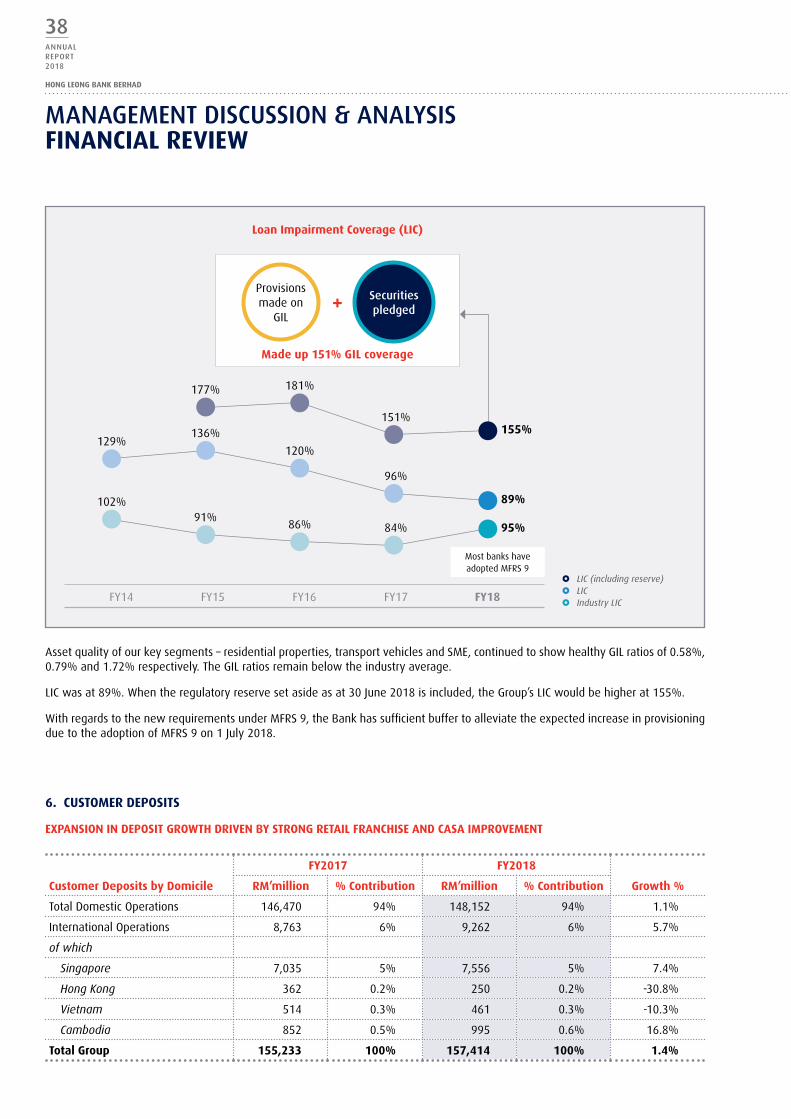
Assetqualityofourkeysegments–residentialproperties,transportvehiclesandSME,continuedtoshowhealthyGILratiosof0.58%,0.79%and1.72%respectively.TheGILratiosremainbelowtheindustryaverage.
LICwasat89%.Whentheregulatoryreservesetasideasat30June2018isincluded,theGroup’sLICwouldbehigherat155%.
WithregardstothenewrequirementsunderMFRS9,theBankhassufficientbuffertoalleviatetheexpectedincreaseinprovisioningduetotheadoptionofMFRS9on1July2018.
6. cuStoMer DepoSItS
eXpaNSIoN IN DepoSIt GroWtH DrIVeN bY StroNG retaIL FraNcHISe aND caSa IMproVeMeNt
customer Deposits by Domicile
FY2017 FY2018
Growth %rM’million % contribution rM’million % contribution
TotalDomesticOperations 146,470 94% 148,152 94% 1.1%
InternationalOperations 8,763 6% 9,262 6% 5.7%
of which
Singapore 7,035 5% 7,556 5% 7.4%
Hong Kong 362 0.2% 250 0.2% -30.8%
Vietnam 514 0.3% 461 0.3% -10.3%
Cambodia 852 0.5% 995 0.6% 16.8%
total Group 155,233 100% 157,414 100% 1.4%
Loan Impairment coverage (LIc)
Made up 151% GIL coverage
MostbankshaveadoptedMFRS9
+
FY14 FY15 FY16 FY17 FY18
£ LIC (including reserve) £ LIC £ Industry LIC
Securities pledged
Provisionsmadeon
GIL
129%
102%
177%
136%
91%
181%
120%
86%
151%
96%
84%
155%
89%
95%
mANAgemeNT dIScUSSION & ANALySISFINaNcIaL reVIeW
38ANNUALRePORT2018
HONG LEONG BANK BERHAD

7. LIQuIDItY
aStute LIQuIDItY MaNaGeMeNt proVIDeS buFFer aND SupportS Future GroWtH
Deposits fromcustomersgrew1.4%y-o-y toRM157.4billion.Thisgrowthwasdrivenmainlybycorecustomerdepositsgrowthboth domestically and regionally. The improved deposits wasalsospurredinpartbytheBank’sdepositinitiativescarriedoutviadigitalchannels.
Core customer deposits comprising demand deposits, savings deposits and fixed deposits made up 82% of our total customerdepositsbase.Ourcoredepositsexpanded2.1%y-o-yforan8%marketshare.CASA,whicharelowcostdeposits,grewat6.3%y-o-ytoRM41.2billion,whichputsitaheadoftheindustrygrowth.CASAnowcomprisesanimproved26%ofourtotalcustomerdeposits.
TheBank’sstablefundingbasecontinuedtobesupportedbyitsstrongretaildepositfranchise,withindividualdepositsexpanding2.3%y-o-ytoRM88.2billion.Thisrepresentsanindividualdepositmixof56%,whichisthehighestinthecountry.
Domesticcustomerdepositsrepresented94%oftheBank’stotaldepositsandgrew1.1%y-o-ytoRM148.2billion.Internationaloperationcustomerdepositsexpandedbyarobust5.7%y-o-y.ThisgrowthwasdrivenmainlybySingaporeat7.4%y-o-yandCambodiaat16.8%y-o-y.
TheBankcontinuestoadoptaprudentLDratioof82.0%whichprovidesabalancebetweenliquidityneedsandatthesametimeremainssupportiveoffuturebusinessgrowth.
customer Deposits by Key product and customer type
FY2017 FY2018
Growth %
Domestic Market Share %rM’million
% contribution to Group rM’million
% contribution to Group
By key product type of deposits
DemandandSavingsDeposits(CASA) 38,765 25% 41,203 26% 6.3% 8%
FixedDeposits 87,976 57% 88,222 56% 0.3% 8%
total core Deposits (Group) 126,741 82% 129,425 82% 2.1% 8%
By customer type of deposits
Individual 86,176 56% 88,159 56% 2.3% 12%
Businessenterprises 63,340 41% 62,745 40% -0.9% 7%
total customer Deposits (Group) 155,233 100% 157,414 100% 1.4% 8%
82.3%
80.0%
84.0%
80.9%
89.3%
81.2%
91.3%
80.6%
91.3%
FY14 FY15 FY16 FY17 FY18£ Industry LD ratio£ HLB LD ratio
82.0%
mANAgemeNT dIScUSSION & ANALySISFINaNcIaL reVIeW
CORPORATE
39ANNUALRePORT
2018
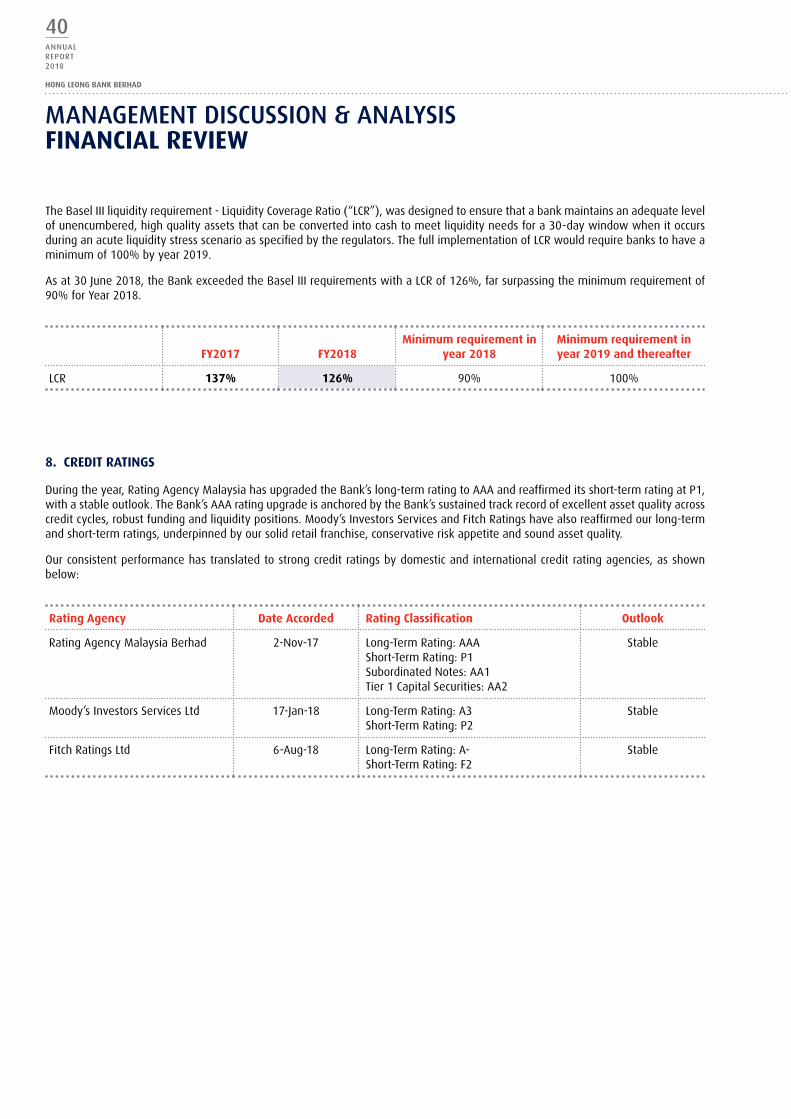
FY2017 FY2018Minimum requirement in
year 2018Minimum requirement in year 2019 and thereafter
LCR 137% 126% 90% 100%
rating agency Date accorded rating classification outlook
RatingAgencyMalaysiaBerhad 2-Nov-17 Long-TermRating:AAAShort-TermRating:P1SubordinatedNotes:AA1Tier1CapitalSecurities:AA2
Stable
Moody’sInvestorsServicesLtd 17-Jan-18 Long-TermRating:A3Short-TermRating:P2
Stable
FitchRatingsLtd 6-Aug-18 Long-TermRating:A-Short-TermRating:F2
Stable
8. creDIt ratINGS
Duringtheyear,RatingAgencyMalaysiahasupgradedtheBank’slong-termratingtoAAAandreaffirmeditsshort-termratingatP1,withastableoutlook.TheBank’sAAAratingupgradeisanchoredbytheBank’ssustainedtrackrecordofexcellentassetqualityacrosscreditcycles,robustfundingandliquiditypositions.Moody’sInvestorsServicesandFitchRatingshavealsoreaffirmedourlong-termandshort-termratings,underpinnedbyoursolidretailfranchise,conservativeriskappetiteandsoundassetquality.
Ourconsistentperformancehastranslatedtostrongcreditratingsbydomesticandinternationalcreditratingagencies,asshownbelow:
TheBaselIIIliquidityrequirement-LiquidityCoverageRatio(“LCR”),wasdesignedtoensurethatabankmaintainsanadequatelevelofunencumbered,highqualityassetsthatcanbeconvertedintocashtomeetliquidityneedsfora30-daywindowwhenitoccursduringanacuteliquiditystressscenarioasspecifiedbytheregulators.ThefullimplementationofLCRwouldrequirebankstohaveaminimumof100%byyear2019.
Asat30June2018,theBankexceededtheBaselIIIrequirementswithaLCRof126%,farsurpassingtheminimumrequirementof90%forYear2018.
mANAgemeNT dIScUSSION & ANALySISFINaNcIaL reVIeW
40ANNUALRePORT2018
HONG LEONG BANK BERHAD

first is toensure that capital levels aremaintainedaboveregulatory requirements. And the second reason is forcapitallevelstobesufficientlyrobustfortheBanktoremainresilientwhenfacedwithstressedeconomicconditions.
ii) bi-annual capital plan
TheBi-AnnualCapitalPlaninvolvesdetailedplanningoftheGroup’s strategic capital plan over a minimum three-yearhorizon.Theplanhighlightsthecapitalprojections,capitalrequirements,levelsofcapitalandcapitalcompositionthatalignstotheGroup’sbusinessplanandstrategicobjectives.In addition, it also covers regulatory considerationsincludingcapitalbuffers,newaccountingstandardsaswellas expectations of key stakeholders such as regulators,investors,analystsandratingagencies,businessgrowthandstresstestresults.
capItaL INItIatIVeS
TheGroupexercisespro-activemanagementofitscapitalpositiontoaddressstringentBaselIIIcapitalrequirements,expectationsfromstakeholdersandtoalignwithstrategicbusinessobjectives.
Majorinitiativesundertakenovertheyearsinclude:
i) equity capital
InDecember2015,HongLeongBankcompleted its rightsissue exercise amounting to RM2.99 billion which hadfurtherstrengthenedtheBank’sCommonEquityTier1(“CET1”) to support continuous business growth with strongcapitalbufferundertheBaselIIIcapitalframework.
Asat June2018,theBankheld41milliontreasurysharesthathadbeenboughtbackpreviously.TheseshareswhichareavailableforsalecanfurtherstrengthentheGroup’sandtheBank’sCET1.
ii) Debt capital
The Group had established a RM10 billion Multi-CurrencyAdditionalTier1CapitalSecurities(“AT1”)andaRM10billionMulti-CurrencyTier2SubordinatedNotes(“SubNotes”).
IssuanceofRM500millionofSubNotesinJune2014,RM500millionofSubNotesinJune2018andRM400millionofAT1inNovember2017strengthenstheBankcapitalpositions.
iii) Healthy Dividend payout
The Group does not have a fixed dividend pay-out policybut takes into consideration a balance between growthandproactivecapitalmanagementtoensurethelong-termsustainabilityofdividendstoitsshareholders.TheBoardhasproposedafinaldividendof32senpershare,bringingthetotal dividend to 48 sen for the FY2018, 3 sen higher ascomparedto45seninFY2017.
9. capItaL MaNaGeMeNt
INtroDuctIoN
TheHongLeongBankingGroupcapitalmanagementframeworkwas designed to ensure that the Group and its principalsubsidiaries maintain sufficient capital consistent with eachentity’s respective risk profile, management targets and allapplicableregulatorystandardsaswellasguidelines.
TheGroupispro-activeintheassessmentandmanagementofitscapitaladequacyagainstaseriesofinternalquantitativecapitalgoals. The goals are designed to evaluate the Group’s capitallevels inexpectedandstressedeconomicenvironmentsundertheInternalCapitalAdequacyAssessmentFramework(“ICAAP”).
Thecapitalmanagementframeworkaimsto:
£ Maintaincapitalratiosatlevelsabovetheregulatoryminimumor internal capital threshold,whichever ishigher.
£ SupporttheGroup’sstrongcreditratings.
£ Beflexibletowardsfuturestrategicopportunities.
£ Deploy capital efficiently to business and optimizereturnoncapital.
£ Be resilient during stressful economic and financialconditions.
capItaL MaNaGeMeNt FraMeWorK
TheGroup’scapitalmanagementisguidedbyrobustpoliciesandproceduresacrossthegroup.TheGroup’sapproachtomanagingcapital isdetailedoutintheICAAPwhichareapprovedbytheSeniorManagement,RiskManagementCommittee(“RMC”)andtheBoard.
i) comprehensive risk assessment under Icaap
The Group achieves its capital management objectivesthrough the ICAAP. ICAAP involves a comprehensiveassessmentofallmaterialrisksthattheGroupisexposed.ItalsoevaluateswhethertheGroup’scapitalisadequatetosupportitsbusinessactivitiesinrelationtothoserisks.
As part of ICAAP, a range of stress scenarios are appliedonto the Group’s base case derived from annual budgetbusiness growth. The stress test will assess the level ofcapitalrequiredtoweatherstressfuleconomicsituationsoraneconomicdownturn.
Basedontheseassessmentsandformulationofcapitalplans,theGroupwillcalibrateandsetitsinternalcapitaltargets.These targetsare reviewedannually for two reasons. The
mANAgemeNT dIScUSSION & ANALySISFINaNcIaL reVIeW
CORPORATE
41ANNUALRePORT
2018

HeaLtHY capItaL aDeQuacY ratIoS
ThetablebelowshowsthecapitaladequacyratiosoftheGroupandtheBank,presentingfiguresforfinancialyears2017and2018.
after proposed dividend
HLb Group HLb entity regulatory Min with ccb
FY2017 FY2018 FY2017 FY2018 2018 2019
CET1 13.3% 12.6% 12.5% 11.9% 6.38% 7.00%
Tier1 13.7% 13.3% 13.0% 12.4% 7.88% 8.50%
TotalCapital 15.8% 16.3% 15.4% 15.7% 9.88% 10.50%
capItaL aDeQuacY ratIo
i) Minimum capital adequacy requirements
under Bank Negara Malaysia’s (“BNM”) Capital AdequacyFramework,banksarerequiredtomaintainaminimumCET1ratioof4.5%,Tier1CapitalRatioof6.0%andTotalCapitalRatioof8.0%.
ii) capital buffer requirements
Banksarealsorequiredtoholdthefollowingcapitalbuffersoverandabovetheminimumcapitalrequirements:
• Capital Conservation Buffer (“CCB”) of up to 2.5% toensure banks build up capital buffers during normaltimesthatcanbedrawndownduringstressperiods. Itisphasedinfrom1January2016at0.625%peryear,toreach2.5%on1January2019.
• Counter-cyclicalCapitalBufferrangingbetween0%and2.5%of total risk-weightedassets (excludesexposuresto Sovereigns, Central Banks and Banking Institutions),which is intended to protect the banking sector as awhole from the build-up of systemic risk during aneconomic upswing when aggregate credit growthtendstobeexcessive.Thiscapitalbufferiscurrentlynotrequired for credit exposures in Malaysia but may beenforcedbyBNMinthefuture.
• Supplementary loss absorbency requirements forDomestic Systemically Important Banking Institutions(“D-SIBs”)whichmaybeimposedbyBNMinthefuture.On10October2016,BNMinitiatedasurveytodevelopa framework on Domestically Systemically ImportantBanks (“D-SIB”) with the view to implement it in thenearfuture.
regulatory Minimum capital requirements and ccb (%)
2015 2016 2017 2018 2019
2.0002.000
2.0002.000
2.0001.500
1.5001.500
1.5001.500
2.5001.875
1.2500.625
£ Tier 2 £ Additional Tier 1£ Capital Conservation
Buffer (CCB)£ CET 1
4.5004.5004.5004.5004.500
mANAgemeNT dIScUSSION & ANALySISFINaNcIaL reVIeW
42ANNUALRePORT2018
HONG LEONG BANK BERHAD

perSoNaL FINaNcIaL SerVIceS (“pFS”)
mANAgemeNT dIScUSSION & ANALySISbuSINeSS operatIoNS reVIeW
PFSremainedthe largestcontributor to theGroupmakingup53%and34%of itsrevenue and pre-tax profits, respectively. Retail loans and deposits grew 3% and2%respectively,inlinewiththesofterdomesticretailmarketgrowth.AssetqualitymeanwhileremainedsolidasreflectedbyitslowGILratioof0.62%.ThelowGILratiowasachievedonthebackofdisciplinedlendingandprudentriskmanagement.
Someof the keyhighlights for the yearinclude:
pFS Digital
The Bank is undergoing a digitaltransformationtobeaBankthatisDigitalat the Core. This initiative will makecustomer interactions with the Bankeasier, simpler and more convenientusing ground breaking new approacheslike chat-based banking and byrevolutionizingtheentirebranchbankingexperience. Itwill also set the stage forusingdatadriven insights todrivemoretargetedsales.
As part of this transformation, welaunched a new digitally-enhancedbranch banking experience in our firstflagship branch at Menara Hong Leongin Damansara City Kuala Lumpur. As aflagshipbranch,wewant to set thebarhighforcustomerexperience,takingittothe next level with sophisticated digitalinnovations.
A big part of the upgraded experiencewasthe introductionofmobileservicingtablets. These tablets serve to facilitatea one-stop service and sales experienceforthecustomer.Wewantedtoenhancethebranchexperiencesothatcustomersare served with minimal waiting time.Withthetabletcustomerscanbeservedimmediately upon walking into thebranch enabling the Bank to reducecustomerwaitingtimesignificantly.
Wealsowantedcustomers tobeservedby the same officer rather than beinghandedofftodifferentofficersforvarioustransactions. Themobile servicing tabletallowsoneofficertoservethecustomerinbothcapacities,whether inserviceorsales.
Thebankinghalllayoutwasalsospecificallydesignedtoprovidemorespacededicatedtoservingcustomers,whilebackroomspacewasreducedsignificantly.Theadditionalspace allowed for the introduction of a Discovery Zone which further enhances thecustomers’ branch banking experience. The flagship branch is only the first of ourbranches to be transformed. The latest branch to roll out the digital transformationinitiativeisthenewlylaunchedBurmahRoadbranchinPenang.
TheBankalsorevamped itsmobilebankingappConnectandenhanced itwithnewand improved features. The enhanced and upgraded Connect App was launched inJuly2017.
CORPORATE
43ANNUALRePORT
2018
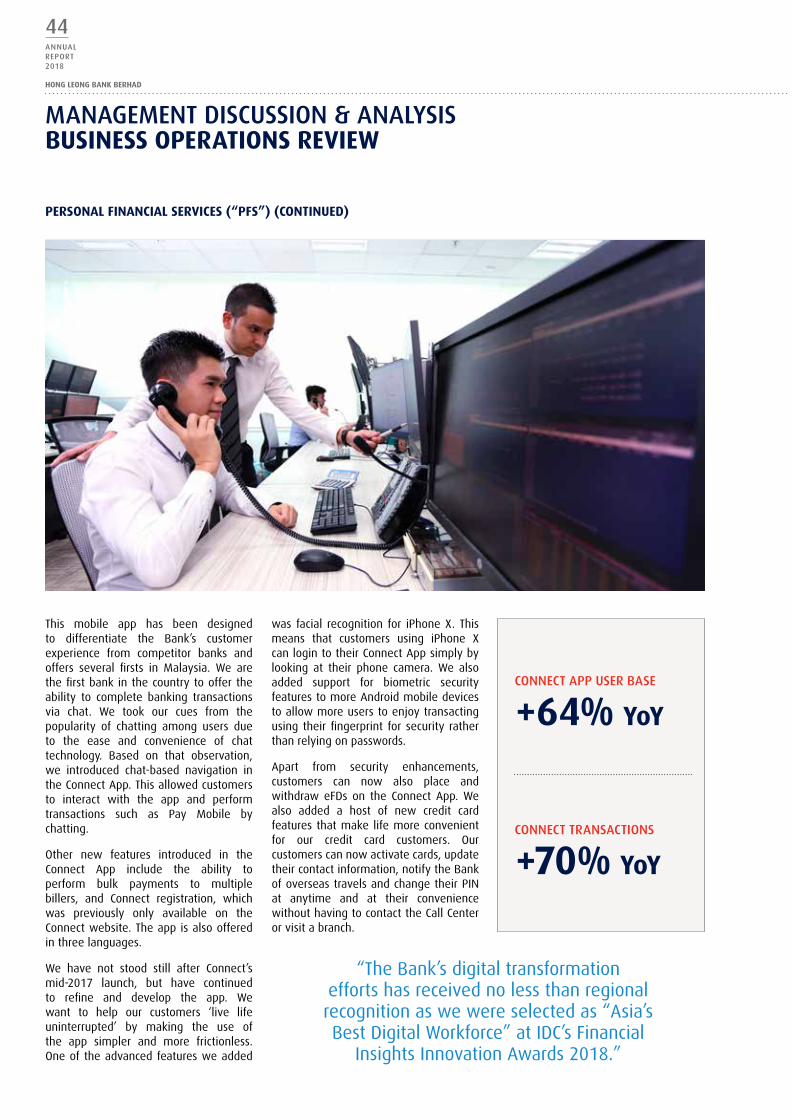
“TheBank’sdigitaltransformationeffortshasreceivednolessthanregionalrecognitionaswewereselectedas“Asia’sBestDigitalWorkforce”atIDC’sFinancial
InsightsInnovationAwards2018.”
perSoNaL FINaNcIaL SerVIceS (“pFS”) (coNtINueD)
This mobile app has been designedto differentiate the Bank’s customerexperience from competitor banks andoffers several firsts in Malaysia. We arethefirstbankinthecountrytooffertheability to complete banking transactionsvia chat. We took our cues from thepopularity of chatting among users dueto the ease and convenience of chattechnology. Based on that observation,we introduced chat-based navigation intheConnectApp.Thisallowedcustomersto interact with the app and performtransactions such as Pay Mobile bychatting.
Other new features introduced in theConnect App include the ability toperform bulk payments to multiplebillers, and Connect registration, whichwas previously only available on theConnectwebsite.Theappisalsoofferedinthreelanguages.
We have not stood still after Connect’smid-2017 launch, but have continuedto refine and develop the app. Wewant to help our customers ‘live lifeuninterrupted’ by making the use ofthe app simpler and more frictionless.Oneoftheadvancedfeaturesweadded
was facial recognition for iPhoneX. Thismeans that customers using iPhone XcanlogintotheirConnectAppsimplybylooking at their phone camera. We alsoadded support for biometric securityfeaturestomoreAndroidmobiledevicestoallowmoreuserstoenjoytransactingusing theirfingerprint forsecurity ratherthanrelyingonpasswords.
Apart from security enhancements,customers can now also place andwithdraw eFDs on the Connect App. Wealso added a host of new credit cardfeaturesthatmake lifemoreconvenientfor our credit card customers. Ourcustomerscannowactivatecards,updatetheircontactinformation,notifytheBankofoverseastravelsandchangetheirPINat anytime and at their conveniencewithouthavingtocontacttheCallCenterorvisitabranch.
cONNecT APP USeR bASe
+64% YoY
cONNecT TRANSAcTIONS
+70% YoY
mANAgemeNT dIScUSSION & ANALySISbuSINeSS operatIoNS reVIeW
44ANNUALRePORT2018
HONG LEONG BANK BERHAD
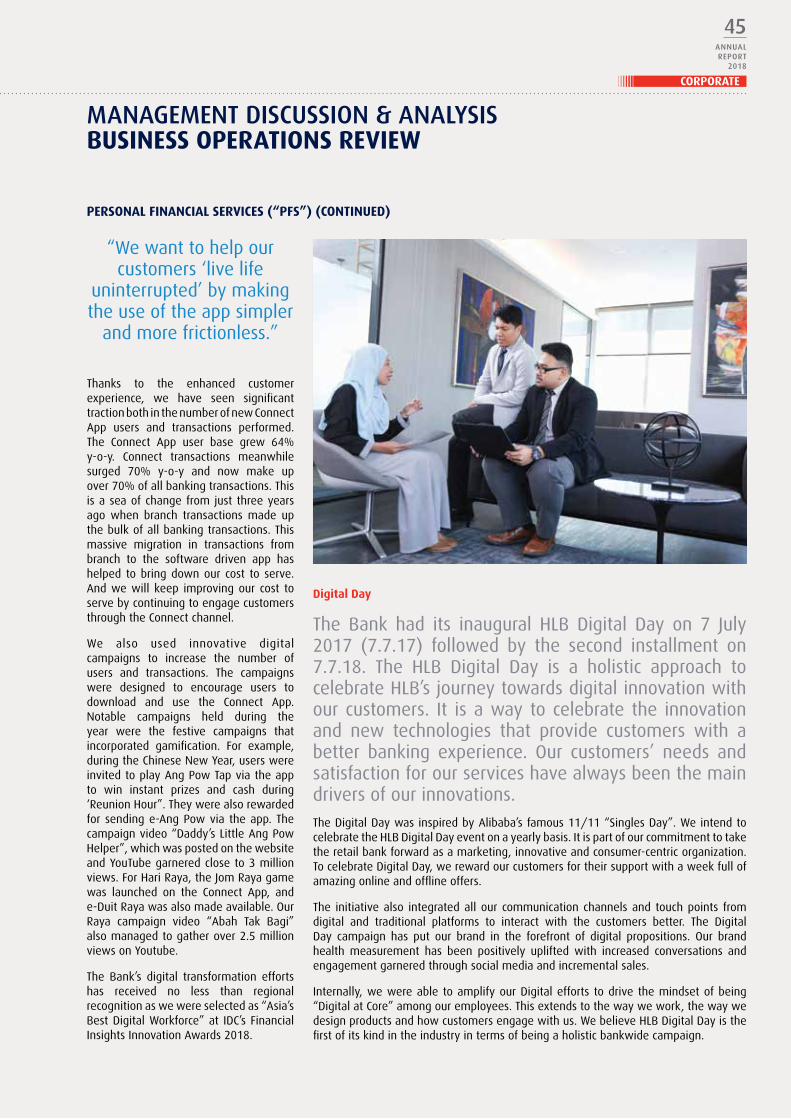
“Wewanttohelpourcustomers‘livelife
uninterrupted’bymakingtheuseoftheappsimpler
andmorefrictionless.”
Digital Day
The Bank had its inaugural HLB Digital Day on 7 July2017 (7.7.17) followed by the second installment on7.7.18. The HLB Digital Day is a holistic approach tocelebrateHLB’sjourneytowardsdigitalinnovationwithour customers. It isaway to celebrate the innovationand new technologies that provide customers with abetter banking experience. Our customers’ needs andsatisfactionforourserviceshavealwaysbeenthemaindriversofourinnovations.TheDigitalDaywasinspiredbyAlibaba’sfamous11/11“SinglesDay”.WeintendtocelebratetheHLBDigitalDayeventonayearlybasis.Itispartofourcommitmenttotaketheretailbankforwardasamarketing,innovativeandconsumer-centricorganization.TocelebrateDigitalDay,werewardourcustomersfortheirsupportwithaweekfullofamazingonlineandofflineoffers.
The initiativealso integratedallour communication channelsand touchpoints fromdigital and traditional platforms to interact with the customers better. The DigitalDay campaign has put our brand in the forefront of digital propositions. Our brandhealth measurement has been positively uplifted with increased conversations andengagementgarneredthroughsocialmediaandincrementalsales.
Internally,wewereable toamplifyourDigitalefforts todrive themindsetofbeing“DigitalatCore”amongouremployees.Thisextendstothewaywework,thewaywedesignproductsandhowcustomersengagewithus.WebelieveHLBDigitalDayisthefirstofitskindintheindustryintermsofbeingaholisticbankwidecampaign.
Thanks to the enhanced customerexperience, we have seen significanttractionbothinthenumberofnewConnectApp users and transactions performed.The Connect App user base grew 64%y-o-y. Connect transactions meanwhilesurged 70% y-o-y and now make upover70%ofallbankingtransactions.Thisisaseaofchangefromjust threeyearsago when branch transactions made upthebulkofallbankingtransactions.Thismassive migration in transactions frombranch to the software driven app hashelped tobringdownour cost to serve.Andwewill keep improvingour cost toservebycontinuingtoengagecustomersthroughtheConnectchannel.
We also used innovative digitalcampaigns to increase the number ofusers and transactions. The campaignswere designed to encourage users todownload and use the Connect App.Notable campaigns held during theyear were the festive campaigns thatincorporated gamification. For example,duringtheChineseNewYear,userswereinvitedtoplayAngPowTapviatheappto win instant prizes and cash during‘ReunionHour”.Theywerealsorewardedfor sendinge-AngPowvia theapp. Thecampaignvideo“Daddy’sLittleAngPowHelper”,whichwaspostedonthewebsiteandYouTubegarneredcloseto3millionviews.ForHariRaya,theJomRayagamewas launched on the Connect App, ande-DuitRayawasalsomadeavailable.OurRaya campaign video “Abah Tak Bagi”alsomanagedtogatherover2.5millionviewsonYoutube.
The Bank’s digital transformation effortshas received no less than regionalrecognitionaswewereselectedas“Asia’sBestDigitalWorkforce”at IDC’sFinancialInsightsInnovationAwards2018.
perSoNaL FINaNcIaL SerVIceS (“pFS”) (coNtINueD)
mANAgemeNT dIScUSSION & ANALySISbuSINeSS operatIoNS reVIeW
CORPORATE
45ANNUALRePORT
2018

of processes and improvement of turn-around times via deployment of ourdigitalinitiatives.
We maintained our Credit Card balancemarket share at above 10% in FY2018.Themaintenanceofourmarketsharewasdrivenbyportfoliomanagementactivitieswhich also boosted our e-commercespendwhichwasup14%y-o-y.
AspartofourDigitalattheCorestrategy,we introduced three new credit cardservices in our Connect app. Customerscan now apply for balance transfer,installment plans and cash term loanswith real time approvals anytime attheirconvenienceviatheapp.Aspartofour continuing efforts to give customersa better and more convenient cardexperience,wehavealsorolledoutnewcard related features in Connect suchasoverseas notifications, card block andincreaseincreditlimits.
payments businesses
Hong Leong Bank became the pioneeracquirer for WeChat Pay Cross Borderin Malaysia in February 2018. Wewere able to secure new key accountrelationships with partners largely duetothisnewmastermerchantrelationshipwith WeChat. Our new partners includekey players across various industriessuch as retail, groceries, food andbeverages, convenience stores, tourism,entertainment and others. The PaymentBusiness also recently received approvalfrom Tencent in June 2018 to be theirlocal Master Merchant Acquirer for localsettlementinRM.ThismakesHLBthefirstbank in Malaysia, and only the secondbank globally to offer local currencymerchant services. As Master MerchantAcquirer,HLBwillbeabletoconvertPOSterminals to accept both Cross Border &LocalWeChatPay.
branch amalgamation
Weamalgamated24branchesandrelocatedonebranchduringtheyear.Thiswaspartofourbranchamalgamationstrategytostreamlineourbranchnetwork.Thegoaloftheamalgamation istoenhanceourstrategicbrancheswithbiggerandbetterretailpresence.Wedidthisbymergingourbranchesthatarewithin2kmofeachotherandrenovatedsomeofthebranchesforbettercustomerexperience.
pFS Loans
Our mortgage businesses sustained growth inoriginations with loan acceptances growing 11%y-o-y despite the property market remaining soft.To further improve our position, we strengthened ourcapabilities to serve developers and property marketintermediariesduringtheyear.Thisallowedustodrivewidermarketcoverageanddeliverhighersalesandservicestandards.Wecontinuedtoinnovatethecustomerexperienceandpurchasingjourneybyintroducingafastandsecureonlineapproval-in-principleserviceinFebruary2018.Wealsointroducedtieredinterestratestobetteralignourselveswiththeneedsofourcustomersandassistthemwiththeirhomeownershipcashflow.
The auto financing business remains one of the Bank’s key retail lending segmentdespite a subdued market driven by weaker vehicle sales due to softer consumersentiment.PFSembarkedonseveral initiativesduring theyear tobetterpositionusin the market. These were the strengthening of relationships with established keydealers,collaborationwithkeymanufacturersonmarketingcampaigns,simplification
perSoNaL FINaNcIaL SerVIceS (“pFS”) (coNtINueD)
mANAgemeNT dIScUSSION & ANALySISbuSINeSS operatIoNS reVIeW
46ANNUALRePORT2018
HONG LEONG BANK BERHAD
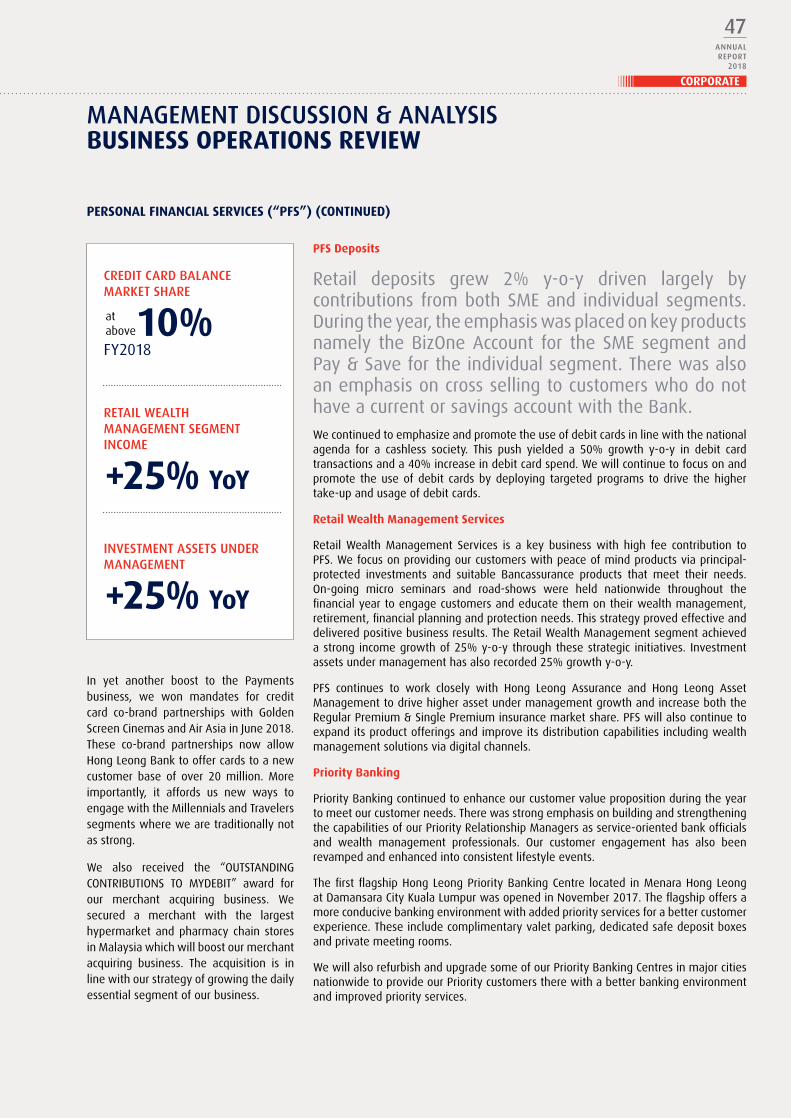
In yet another boost to the Paymentsbusiness, we won mandates for creditcard co-brand partnerships with GoldenScreenCinemasandAirAsiainJune2018.These co-brand partnerships now allowHongLeongBanktooffercardstoanewcustomer base of over 20 million. Moreimportantly, it affords us new ways toengagewiththeMillennialsandTravelerssegmentswherewearetraditionallynotasstrong.
We also received the “OuTSTANDINGCONTRIBuTIONS TO MYDEBIT” award forour merchant acquiring business. Wesecured a merchant with the largesthypermarket andpharmacy chain storesinMalaysiawhichwillboostourmerchantacquiring business. The acquisition is inlinewithourstrategyofgrowingthedailyessentialsegmentofourbusiness.
pFS Deposits
Retail deposits grew 2% y-o-y driven largely bycontributions frombothSMEand individual segments.Duringtheyear,theemphasiswasplacedonkeyproductsnamely theBizOneAccount for theSME segmentandPay&Savefortheindividualsegment.TherewasalsoanemphasisoncrosssellingtocustomerswhodonothaveacurrentorsavingsaccountwiththeBank.Wecontinuedtoemphasizeandpromotetheuseofdebitcardsinlinewiththenationalagenda for a cashless society. This push yielded a 50% growth y-o-y in debit cardtransactionsanda40%increaseindebitcardspend.Wewillcontinuetofocusonandpromote theuseofdebit cardsbydeploying targetedprograms todrive thehighertake-upandusageofdebitcards.
retail Wealth Management Services
Retail Wealth Management Services is a key business with high fee contribution toPFS.Wefocusonprovidingourcustomerswithpeaceofmindproductsviaprincipal-protected investments and suitable Bancassurance products that meet their needs.On-going micro seminars and road-shows were held nationwide throughout thefinancialyeartoengagecustomersandeducatethemontheirwealthmanagement,retirement,financialplanningandprotectionneeds.Thisstrategyprovedeffectiveanddeliveredpositivebusinessresults.TheRetailWealthManagementsegmentachievedastrong incomegrowthof25%y-o-ythroughthesestrategic initiatives. Investmentassetsundermanagementhasalsorecorded25%growthy-o-y.
PFS continues to work closely with Hong Leong Assurance and Hong Leong AssetManagementtodrivehigherassetundermanagementgrowthandincreaseboththeRegularPremium&SinglePremiuminsurancemarketshare.PFSwillalsocontinuetoexpanditsproductofferingsandimproveitsdistributioncapabilitiesincludingwealthmanagementsolutionsviadigitalchannels.
priority banking
PriorityBankingcontinuedtoenhanceourcustomervaluepropositionduringtheyeartomeetourcustomerneeds.TherewasstrongemphasisonbuildingandstrengtheningthecapabilitiesofourPriorityRelationshipManagersasservice-orientedbankofficialsand wealth management professionals. Our customer engagement has also beenrevampedandenhancedintoconsistentlifestyleevents.
ThefirstflagshipHongLeongPriorityBankingCentre located inMenaraHongLeongatDamansaraCityKualaLumpurwasopenedinNovember2017.Theflagshipoffersamoreconducivebankingenvironmentwithaddedpriorityservicesforabettercustomerexperience.Theseincludecomplimentaryvaletparking,dedicatedsafedepositboxesandprivatemeetingrooms.
WewillalsorefurbishandupgradesomeofourPriorityBankingCentresinmajorcitiesnationwidetoprovideourPrioritycustomerstherewithabetterbankingenvironmentandimprovedpriorityservices.
perSoNaL FINaNcIaL SerVIceS (“pFS”) (coNtINueD)
cRedIT cARd bALANce mARkeT SHARe
10%FY2018
ReTAIL WeALTH mANAgemeNT SegmeNT INcOme
+25% YoY
INVeSTmeNT ASSeTS UNdeR mANAgemeNT
+25% YoY
atabove
mANAgemeNT dIScUSSION & ANALySISbuSINeSS operatIoNS reVIeW
CORPORATE
47ANNUALRePORT
2018

merchant facilities, Bancassurance, cashmanagement&payroll,onlinebanking&digitalsolutions,andforex.
This drive for continuous focus on clientneedshas ledto theestablishmentofaproductdevelopmentandinnovationlabwithintheBusiness&CorporateBankingdivision during the FY2018. The lab willcontinue to design, test and implementproducts and financing programs whichwillcatertotheevolvingneedsofexistingandnewclients.
InlinewithourambitionstogrowintheSME space,wehavedeployedover 100relationship managers throughout thecountry during the course of the year.Theserelationshipmanagerswillbebasedat branches across local communitiesin every state in Malaysia and will befocused on acquiring new SME bankingclientswithintheirareasofcoverage.Weexpecttodeployapproximately50more
business performance
Itwas a solid year for BCBwith revenues andPBT atRM1.1billionandRM831million,agrowthof4%and16%respectivelycomparedtolastyear.Thisrepresentsa24%and26%contributiontotheBank’stotalincomeandPBT.
such relationship managers during thecourseofFY2019.
We are very excited about the growthpotentialfortheSMEsegmentandwewillcontinue to develop products targetingspecificSMEsegments.Ourdevelopmentplansinthepipeline,otherthaninhousedevelopment of product, includecollaborationwithFinTechsinareassuchasPeer-to-Peer(“P2P”)lending,e-walletand e-payment providers, supply chainfinancing and providers of new creditscoringtechnologies.
on the Digital Front
BCB’s Transaction Banking businesscontinuedtomakeheadwaysindeliveringinnovative digital solutions with thesuccessful launch of our new corporateinternet banking platform, Hong Leong(HL) ConnectFirst inNovember 2017.HLConnectFirstoffersamorecomprehensivesuite of transaction banking solutionswhichenablesourcorporate,commercialand SME clients to effectively managetheir working capital requirements fromany geographical location, anytime attheir convenience. HLB’s aspiration isto be the transaction banker of choiceamongstourfocusclientsegments–themiddlemarketandSMEdomesticbasedclients.
BCB’s loans growth performance of4% y-o-y was mainly anchored by ourcommercial / mid-sized corporate andSMEclientsegments,whichgrewat10%y-o-yand22%y-o-yrespectively.
We are also pleased to report healthygrowth as exhibited in our CurrentAccountsbalanceswhereweregisteredagrowthof4%y-o-y,whichoutperformedtheindustrydemanddepositgrowth.
Focus on the Middle market and SMes
The middle market and SME clientsegments continue to be the mainfocus segments forHLBwhich theBankseesasanexistingand futuresourceofbusinessgrowth.Assuch,moreresourceswere put into product developmentduring the year to create and launchfinancing products suitable for theseclientsegments–particularlySMEclients.Examples include our newly launchedSMELite financing program which offerour clients a holistic financing solutionfortheirneedsencompassingtermloansfor property acquisition to short termtrade and working capital facilities andeven forex hedging. The client segmentfocus is further sharpened by providingtailored financing programs, designedfor the needs of specific industries likemotorcycledealersandbuildingmaterialsdistributors.
AtHLB, our client first approachhas ledto a holistic review in terms of productofferings. Bearing in mind client’sneeds, this has already resulted in acomprehensive suite of services such as
buSINeSS & corporate baNKING (“bcb”)
mANAgemeNT dIScUSSION & ANALySISbuSINeSS operatIoNS reVIeW
48ANNUALRePORT2018
HONG LEONG BANK BERHAD

We have started seeing the results from the launch of
ConnectFirst, with 20% growth in the total number of clients
usingthisnewplatformwhilstcorrespondingtransactionvolume
andvaluegrewby22%and45%y-o-yrespectively.
We are also pleased that we have started to receive industry
recognitionforourefforts.Amongawardsthatwereceivedwas
the‘BestBankinMalaysia’fortheCashManagementCustomer
SatisfactionSurvey2017byAsiamoney.Wewerealsoawarded
the“BestFinancialSupplyChainManagementinMalaysia2017”
byTheAsianBankerforourworkwithalocalFinTechspecializing
asatradeoptimizationsolutionprovidertoSMEsuppliers.HLB
alsoreceivedanAsianBankerawardforourworkwithaleading
Asianbrokeragefirm,pickingup the “Best CashManagement
ProjectinMalaysia2017”awardforourcashmanagementand
liquiditymanagementserviceswhichhelpedourclientautomate
payment processes, maximize returns on cash balances and
outsourcecollections.Theawardswereceivedareatestamentof
ourfocusedcommitmentindeliveringbest-in-classtransaction
bankingsolutionstomeetourclients’financialneeds.
ForFY2019,TransactionBankingwillcontinuetostrengthenourproduct offerings and channel capabilities to capture a largermarketshareinthetransactionbankingspace.
Inlinewithourstrategicambitions,weareinvestingsignificanteffort and resources into redesigning and digitalizing theentire account opening and customer on-boarding journey.TheobjectiveistosignificantlyreducetheturnaroundtimeforonboardingofBCBclientsandimproveandstreamlinetheentireonboardingexperience.Wehopethatbythebeginningof2019,HLBclientswillbeabletoopenabusinesscurrentaccountandapply for amerchant facility, including submittingall requireddocumentation via HLB’s online banking platform without theneedtovisitourbranch.
BCBisalsoembarkingonaninitiativetore-designanddigitalizethecreditapplicationandapprovalprocesswhichwillresultinfasterandmoreaccurateprocessingofourclient’screditrequests.Thisinitiativecoversallstagesofthecreditprocessfrompointofapplication,to loanapplication,toapprovals,toacceptance,toloandocumentationandfinallydisbursement.Onceagain, theobjectiveofthisistoimproveourclient’sexperiencewithHLB.
1 2 3buSINeSS obJectIVeS For tHe NeW FINaNcIaL Year
Focusondisciplinedandsustainableloansgrowth
withoutcompromisingassetqualityandreturns.Weexpect
toseecontinuedaboveindustrygrowthratesinourfocus
middlemarketandSMEclientsegments.
Wewillmaintaindisciplineintermsofreturnsandpricing.
Thismeansmaintainingyield,NIMandportfolioReturnonAssets(“ROA”)atorslightly
abovecurrentlevels.
WewillcontinuetoinvestinourConnectFirstplatformto
achieveouraspirationtobethepreferredtransactionbankingpartnerforourmiddlemarketandSMEclientbase.ThecashmanagementservicesofferedthroughConnectFirstunderpins
ourliabilitystrategyandwehopetoleveragethistogrowourCASAbalancesatabove
industrylevel.
buSINeSS & corporate baNKING (“bcb”) (coNtINueD)
mANAgemeNT dIScUSSION & ANALySISbuSINeSS operatIoNS reVIeW
CORPORATE
49ANNUALRePORT
2018
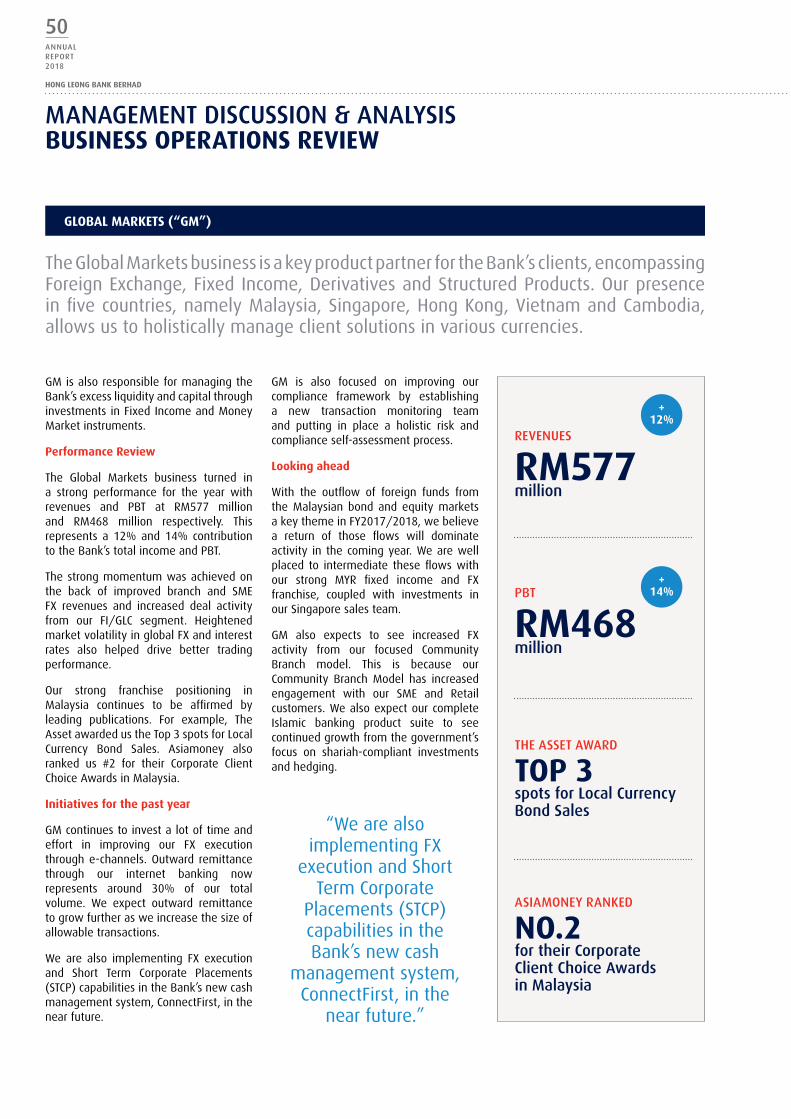
TheGlobalMarketsbusinessisakeyproductpartnerfortheBank’sclients,encompassingForeignExchange,Fixed Income,DerivativesandStructuredProducts.Ourpresenceinfivecountries,namelyMalaysia,Singapore,HongKong,VietnamandCambodia,allowsustoholisticallymanageclientsolutionsinvariouscurrencies.
GMisalsoresponsibleformanagingtheBank’sexcessliquidityandcapitalthroughinvestmentsinFixedIncomeandMoneyMarketinstruments.
performance review
The Global Markets business turned ina strong performance for the year withrevenues and PBT at RM577 millionand RM468 million respectively. Thisrepresents a 12% and 14% contributiontotheBank’stotalincomeandPBT.
Thestrongmomentumwasachievedonthe back of improved branch and SMEFX revenues and increased deal activityfrom our FI/GLC segment. HeightenedmarketvolatilityinglobalFXandinterestrates also helped drive better tradingperformance.
Our strong franchise positioning inMalaysia continues to be affirmed byleading publications. For example, TheAssetawardedustheTop3spotsforLocalCurrency Bond Sales. Asiamoney alsoranked us #2 for their Corporate ClientChoiceAwardsinMalaysia.
Initiatives for the past year
GMcontinuestoinvestalotoftimeandeffort in improving our FX executionthroughe-channels.Outward remittancethrough our internet banking nowrepresents around 30% of our totalvolume. We expect outward remittancetogrowfurtherasweincreasethesizeofallowabletransactions.
We are also implementing FX executionand Short Term Corporate Placements(STCP)capabilitiesintheBank’snewcashmanagementsystem,ConnectFirst,inthenearfuture.
GM is also focused on improving ourcompliance framework by establishinga new transaction monitoring teamand putting in place a holistic risk andcomplianceself-assessmentprocess.
Looking ahead
With the outflow of foreign funds fromthe Malaysian bond and equity marketsakeythemeinFY2017/2018,webelievea return of those flows will dominateactivity in thecomingyear.Wearewellplaced to intermediate theseflowswithour strong MYR fixed income and FXfranchise, coupled with investments inourSingaporesalesteam.
GM also expects to see increased FXactivity from our focused CommunityBranch model. This is because ourCommunity Branch Model has increasedengagement with our SME and Retailcustomers.WealsoexpectourcompleteIslamic banking product suite to seecontinuedgrowthfromthegovernment’sfocus on shariah-compliant investmentsandhedging.
GLobaL MarKetS (“GM”)
ReVeNUeS
rM577 million
THe ASSeT AWARd
top 3 spots for Local currency bond Sales
PbT
rM468 million
ASIAmONey RANked
No.2 for their corporate client choice Awards in malaysia
“WearealsoimplementingFX
executionandShortTermCorporate
Placements(STCP)capabilitiesintheBank’snewcash
managementsystem,ConnectFirst,inthe
nearfuture.”
+12%
+14%
mANAgemeNT dIScUSSION & ANALySISbuSINeSS operatIoNS reVIeW
50ANNUALRePORT2018
HONG LEONG BANK BERHAD
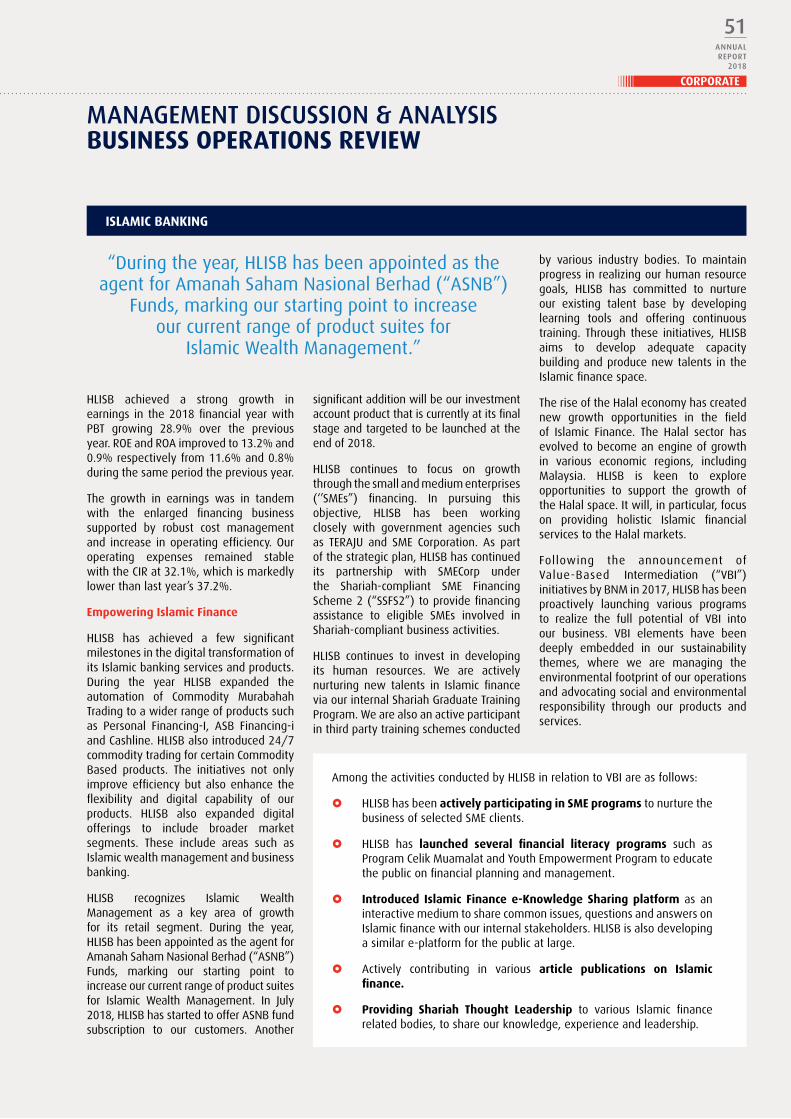
ISLaMIc baNKING
HLISB achieved a strong growth inearnings in the2018financialyearwithPBT growing 28.9% over the previousyear.ROEandROAimprovedto13.2%and0.9%respectivelyfrom11.6%and0.8%duringthesameperiodthepreviousyear.
The growth in earnings was in tandemwith the enlarged financing businesssupported by robust cost managementand increase inoperatingefficiency.Ouroperating expenses remained stablewiththeCIRat32.1%,whichismarkedlylowerthanlastyear’s37.2%.
empowering Islamic Finance
HLISB has achieved a few significantmilestonesinthedigitaltransformationofitsIslamicbankingservicesandproducts.During the year HLISB expanded theautomation of Commodity MurabahahTradingtoawiderrangeofproductssuchas Personal Financing-I, ASB Financing-iandCashline.HLISBalsointroduced24/7commoditytradingforcertainCommodityBased products. The initiatives not onlyimproveefficiencybutalsoenhance theflexibility and digital capability of ourproducts. HLISB also expanded digitalofferings to include broader marketsegments. These include areas such asIslamicwealthmanagementandbusinessbanking.
HLISB recognizes Islamic WealthManagement as a key area of growthfor its retail segment. During the year,HLISBhasbeenappointedastheagentforAmanahSahamNasionalBerhad(“ASNB”)Funds, marking our starting point toincreaseourcurrentrangeofproductsuitesfor Islamic Wealth Management. In July2018,HLISBhasstartedtoofferASNBfundsubscription to our customers. Another
significantadditionwillbeourinvestmentaccountproductthatiscurrentlyatitsfinalstageandtargetedtobelaunchedattheendof2018.
HLISB continues to focus on growththroughthesmallandmediumenterprises(‘’SMEs”) financing. In pursuing thisobjective, HLISB has been workingclosely with government agencies suchas TERAJu and SME Corporation. As partofthestrategicplan,HLISBhascontinuedits partnership with SMECorp underthe Shariah-compliant SME FinancingScheme2(“SSFS2”)toprovidefinancingassistance to eligible SMEs involved inShariah-compliantbusinessactivities.
HLISB continues to invest in developingits human resources. We are activelynurturing new talents in Islamic financeviaourinternalShariahGraduateTrainingProgram.Wearealsoanactiveparticipantinthirdpartytrainingschemesconducted
by various industry bodies. To maintainprogressinrealizingourhumanresourcegoals, HLISB has committed to nurtureour existing talent base by developinglearning tools and offering continuoustraining. Through these initiatives,HLISBaims to develop adequate capacitybuildingandproducenewtalents in theIslamicfinancespace.
TheriseoftheHalaleconomyhascreatednew growth opportunities in the fieldof Islamic Finance. The Halal sector hasevolvedtobecomeanengineofgrowthin various economic regions, includingMalaysia. HLISB is keen to exploreopportunities to support the growth oftheHalalspace.Itwill,inparticular,focuson providing holistic Islamic financialservicestotheHalalmarkets.
Following the announcement ofValue-Based Intermediation (“VBI”)initiativesbyBNMin2017,HLISBhasbeenproactively launching various programsto realize the full potential of VBI intoour business. VBI elements have beendeeply embedded in our sustainabilitythemes, where we are managing theenvironmentalfootprintofouroperationsandadvocatingsocialandenvironmentalresponsibility through our products andservices.
AmongtheactivitiesconductedbyHLISBinrelationtoVBIareasfollows:
£ HLISBhasbeenactively participating in SMe programstonurturethebusinessofselectedSMEclients.
£ HLISB has launched several financial literacy programs such asProgramCelikMuamalatandYouthEmpowermentProgramtoeducatethepubliconfinancialplanningandmanagement.
£ Introduced Islamic Finance e-Knowledge Sharing platform as aninteractivemediumtosharecommonissues,questionsandanswersonIslamicfinancewithourinternalstakeholders.HLISBisalsodevelopingasimilare-platformforthepublicatlarge.
£ Actively contributing in various article publications on Islamic finance.
£ providing Shariah thought Leadership to various Islamic financerelatedbodies,toshareourknowledge,experienceandleadership.
“Duringtheyear,HLISBhasbeenappointedastheagentforAmanahSahamNasionalBerhad(“ASNB”)
Funds,markingourstartingpointtoincreaseourcurrentrangeofproductsuitesfor
IslamicWealthManagement.”
mANAgemeNT dIScUSSION & ANALySISbuSINeSS operatIoNS reVIeW
CORPORATE
51ANNUALRePORT
2018
i) bank of chengdu (“bocD”)
Profit contribution from BOCD improved 50.5% y-o-y toRM516millioninFY2018ascomparedtoRM343millioninthepreviousyear,representing15.9%oftheGroup’spre-taxprofitasrevenuegrowthandlowercreditcostsimprovedits profitability. Going forward, BOCD’s management iscautiously optimistic of continued growth in selectedbusinesssegmentsamidstrecentsignsofstabilisationandimprovementsintheChineseeconomy.BOCDalsobecamethefirstcitycommercialbankfromSichuanProvincetobelistedontheShanghaiStockExchangeon31January2018.
ii) HL bank Singapore (“HLbS”)
HLBS made an operating profit ofRM58 million in FY2018 againsttotal income of RM141 million.Its loan book meanwhile stood atRM5.2billion.Asitisasinglebranchoperation,HLBS’sstrategicfocusisto identify andbuildnichebusiness segments.Over thepast threeyears,HLBShasgrown from its corebusinessof private wealth management to now include WealthManagement, Commercial banking, Health banking andAutofinance.
HLBSPrivateWealthManagementisundergoingabusinesstransformation to capture the new wealth builders. Thebusiness is also rebuilding with a regional strategy andaimstoexpandtootherAsianmarkets.IttargetstogrowPrivate Wealth Management AuM from RM7.5 billion toRM30billionincomingyears.
InHealthBanking,HLBShasbuilta loanbookofRM650millioninfinancingpropertiesfordoctors’medicalpractice.For FY2019, HLBS will restructure the Health Bankingbusiness to leverage on Private Wealth Managementinfrastructuretocrossselltohighnetworthdoctors.
HLBS’s Auto Finance is one of the leaders of this nichemarket segment with a loan book of RM2 billion. ForFY2019, the Bank will conduct more marketing eventswithdealersanddistributorsandworkonimprovingtheturn-aroundtimeforloanapplications.
Corporate Banking is another growth area for HLBS. WearetargetingCommercialandSMEsinkeygrowthsectorsoftheSingaporeeconomy.ThebranchwillalsoleverageHO’sBCBtosupportCorporatesandSME’sgrowingneedsastheyexpandregionally.
To improve customerexperience in thedigitaleconomy,thebranchhas linedup several digital initiatives. Theseinclude non face-to-face account opening and mobilebanking. The branch has also gotten Singapore GovTechapproval to tap into Singapore’s central database forcustomer information to fulfil loan applications. AllemployeesoftheBankarealsogivenaccesstoLearn@IBF,amobilelearningappwheretheycan“learnonthego”therelevantdigitalbankingknowledge.
HLBS was awarded the Human Capital Partner (HCP)Certificate on 27 April 2018, an award given by theTripartite Alliance for Fair & Progressive EmploymentPractices in recognition of the Bank’s effort to invest inhumancapitalandadopt fairandprogressiveworkplacepractices.
ForFY2019,HLBSwillfocusonseveralareas.Thefirstistorejuvenatestaffbenchstrength.Thesecondistoincreasethesuiteofproductsandservicesavailableinbothofflineandonlinechannels.Thethirdistoinstallanewsystemplatformwithdigitalcapabilitiestoenableclients’onlineaccesstoinvestmentwealthmanagementaccounts.
INterNatIoNaL
rM516million
proFIt coNtrIbutIoN FroM bocD+
50.5%
“BOCDalsobecamethefirstcitycommercialbankfromSichuanProvince
tobelistedontheShanghaiStockExchangeon31January2018.”
mANAgemeNT dIScUSSION & ANALySISbuSINeSS operatIoNS reVIeW
52ANNUALRePORT2018
HONG LEONG BANK BERHAD
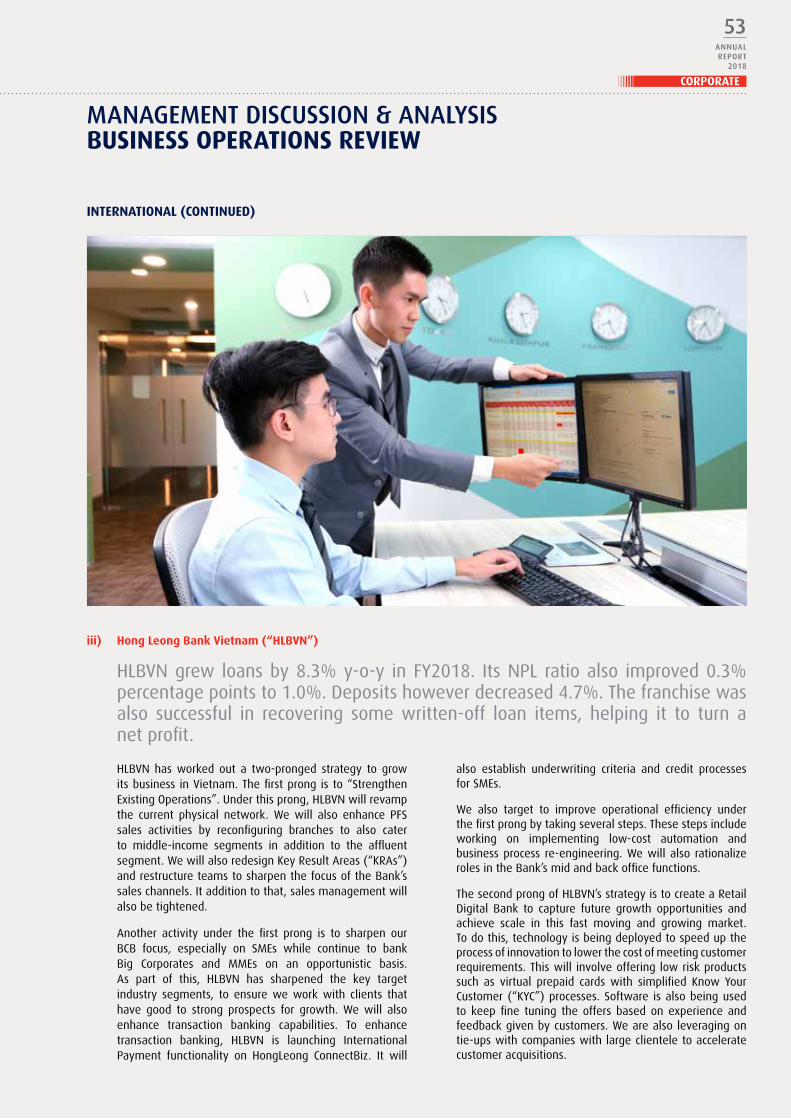
iii) Hong Leong bank Vietnam (“HLbVN”)
HLBVNgrew loansby8.3%y-o-y in FY2018. ItsNPL ratioalso improved0.3%percentagepointsto1.0%.Depositshoweverdecreased4.7%.Thefranchisewasalso successful in recovering some written-off loan items, helping it to turn anetprofit.
HLBVN has worked out a two-pronged strategy to growitsbusiness inVietnam.Thefirstprongisto“StrengthenExistingOperations”.underthisprong,HLBVNwillrevampthe current physical network. We will also enhance PFSsales activities by reconfiguring branches to also caterto middle-income segments in addition to the affluentsegment.WewillalsoredesignKeyResultAreas(“KRAs”)andrestructureteamstosharpenthefocusoftheBank’ssaleschannels.Itadditiontothat,salesmanagementwillalsobetightened.
Another activity under the first prong is to sharpen ourBCB focus, especially on SMEs while continue to bankBig Corporates and MMEs on an opportunistic basis.As part of this, HLBVN has sharpened the key targetindustry segments, to ensure we work with clients thathave good to strong prospects for growth. We will alsoenhance transaction banking capabilities. To enhancetransaction banking, HLBVN is launching InternationalPayment functionality on HongLeong ConnectBiz. It will
also establish underwriting criteria and credit processesforSMEs.
We also target to improve operational efficiency underthefirstprongbytakingseveralsteps.Thesestepsincludeworking on implementing low-cost automation andbusinessprocess re-engineering.Wewill also rationalizerolesintheBank’smidandbackofficefunctions.
ThesecondprongofHLBVN’sstrategyistocreateaRetailDigital Bank to capture future growth opportunities andachieve scale in this fast moving and growing market.Todothis,technologyisbeingdeployedtospeeduptheprocessofinnovationtolowerthecostofmeetingcustomerrequirements.Thiswill involveofferinglowriskproductssuch as virtual prepaid cards with simplified Know YourCustomer (“KYC”)processes.Software isalsobeingusedto keepfine tuning the offers based on experience andfeedbackgivenbycustomers.Wearealsoleveragingontie-upswithcompanieswithlargeclienteletoacceleratecustomeracquisitions.
INterNatIoNaL (coNtINueD)
mANAgemeNT dIScUSSION & ANALySISbuSINeSS operatIoNS reVIeW
CORPORATE
53ANNUALRePORT
2018

iv) Hong Leong bank cambodia (“HLbcaM”)
Now in its5th yearofbusinessoperation,HLBCAMcontinues to perform impressively, recordingRM15.9 million in PBT while growing revenue by25% y-o-y to RM48 million. The growth in profitsand revenue significantly outpaced its increase inexpensesof1%.HLBCAM now serves over 7,000 customers. Our deposit book grew byRM143millionor17%toRM995million.Loangrowthmeanwhilewasup27%orRM214milliontoRM1.02billion.Ourdepositandloangrowthfaroutperformedindustrygrowth.HLBCAMalsoimproveditsdepositproductmixduringtheyearwithCASArisingfrom32%to35%oftotaldeposits.
Overthepastyear,HLBCAMhasembarkedonits“DigitalattheCore”journeytostrengthentheBank’sdigitalofferingsandcapabilitiesbyrollingoutthefollowinginitiatives:
£ FASTdomesticremittancetofacilitaterealtimedomesticremittancesinlocalcurrency.
£ Retailmobilitybanking(HongLeongConnectApp)toenablecustomerstocheckdepositandloanaccountbalancesaswellasperformlocalandoverseastransferswhereverandwhenevertheyneedto.Workis also underway with 3rd party partnerships to introduce extrafunctionalityandtobuildanonlinepaymentecosystem.
£ Commencement of work to integrate our ATM network to theCambodiaCentralSharedSwitch(CSS)allowinginterbankATMandPOStransactionsacrossthecountry.It’sexpectedthatthisCSSprojectwillgoliveinDecember2018.
Onthebusinessfront,HLBCAMsuccessfullyimplementedthefollowing:
£ Rolloutofanautoloanproduct.
£ ContinuedpartnershipwithMajorCineplexatAEONMall.AEONMallisthelargestshoppingmallinCambodiaandthepartnershipallowsustopromoteHLBCAM’spresenceandproductofferings,launchnewproducts,performsalesactivationsandonlineaccountopeningonweekends.
£ Strengtheningandbroadeningourmortgageloanofferingsthroughour partnership with Phnom Penh’s leading developer to bettermeetourcustomers’needs.
INterNatIoNaL (coNtINueD)
Looking ahead, HLBCAM willfocus on implementing initiativesthat delight our customers andstaff through our digital bankingexperience. For example, we willfully integrateourbanking systemto the Cambodia’s Central SharedSwitch. We will also introduceadditional functionality in theHongLeong Connect App such ascorporate internet banking andadditional payment functionality.Wewillalsodigitalizekey internalprocesses and requirements forgreaterefficiencyandeffectiveness.
Whileourstrategy largely remainsunchangedintermsofgeographicalcoverageandtargetmarket,wewillexplore the business opportunitythat comes by broadening ourindustry segment coverage. Thisis to sustain our growth and takeour business to the next level ofsuccess.
v) Hong Kong operations (“HLbHK”)
In FY2018, HLBHK has beenimplementing a new system toalign with the group and otheroverseas branches. The alignmentof the system will enable theexpansion of HLBHK’s customersegmentandproductmixand thesystemisexpectedtogoliveinthenewfinancial year. In June,HLBHKhasalsoreceivedapprovalfromtheTrade and Industry Department ofthe Hong Kong Government (TID)to join their SME Loan GuaranteeScheme (SGS). The Bank is alsoplanning to introduce internetandmobilebanking toHongKongwhich will enable the branch toembarkonanewchapterofdigitaljourneysandcustomeracquisition.
mANAgemeNT dIScUSSION & ANALySISbuSINeSS operatIoNS reVIeW
54ANNUALRePORT2018
HONG LEONG BANK BERHAD

TheTechnologyunitcontinuedexecutingandimplementingouraggressivetechnologytransformationroadmap.Thetransformationwasdrivenbysevenguidingprinciples.Theprinciplesare:obtainingusabledata,reusableandeasilyconnectedcomponents;intellectual property ownership; in-house development capabilities; migration toenterprise open source; reduced vendor dependence; reduced use of proprietaryhardware. Work teams and physical office facilities were set up to facilitate agiledevelopmentandcustomercentricjourneyswhendevelopingproductsandserviceswhetherondigitalfront-endsystemsormiddleandback-endbankingsystems.
mANAgemeNT dIScUSSION & ANALySISINForMatIoN tecHNoLoGY
There has been significant progress ofthe Group’s digital transformation overthelastfinancialyear.Forone,therewasan increase in our Intellectual Propertyfootprint.Therewasalsoan increase inthe size and capability of our internallyself-sufficient development team. Wealso migrated our legacy systems to aninternalcloudinfrastructure.
Wealsoincreasedouruseofcommercialopen source software, decreasing ourdependenceonproprietarysoftware.Ouropen source software adoption includedtools for development, application runtime, monitoring, and scheduling. Ourapproach has enabled us to reduce thetime required for in-house softwaredevelopment and go-to-market overvendortimesby40%to60%dependingon complexity. We also significantlyreduced the cost to market by 40% to60%.
With our emphasis on in-housedevelopmentandopensourceplatforms,we have managed to ensure that theintellectual property rights for eightmajor customer facing systems are nowcontrolled by the Bank. The systemsinclude all retail internet bankingchannels across the Hong Leong Bankgeographicpresencesandmobilebranchassistedservices.WealsoowntheretailmobilebankingsystemintheHongLeongBank Cambodian operations with plansfordeploymenttoallothergeographies.
CORPORATE
55ANNUALRePORT
2018
Alongside growing the Bank’s in-housecapability, we also maintained a strongfocus on running the Bank’s systems asflawlesslyaspossible.Ourteamsworkedceaselessly during the year to drivedownincidentsthatcouldimpactserviceavailability. We achieved a further 30%reduction innon-scheduleddown times.We also achieved a highly consistentoverall uptime of 99.95% across all theBank’s channels. These achievementsare a result of our strategy of not onlyutilizinglesscostly,butalsomorestabletechnology ecosystems for our digitalinfrastructure.
Theteamhasmanagedtodecreasecoresystembatch timesbynearly40%withthe use of new technologies and coresystemhardware refreshes. Thesebeingbut not limited to the introduction ofnewstoragetechnologiesandenhancedinternal capabilities. We also createdan internal bank file share capability(internal drop box) to increase networkefficiencyaswellasastrongerdatalossprotectionposture.
The Bank also initiated an entiretechnology SOP and policy review tobe in alignment with the IT governanceframeworks of ITIL and COBIT. Weincreased the overall productivity of theteam by applying agile managementand delivery techniques. These changesresulted in a 30% y-o-y increase in theoutput of the teams. It also increasedtheavailabilityof functionsandfeaturesavailableviatheonlinebankingchannelsby50%betweenthehoursof12amand7am.
Our team’s open sourcedeploymentandmonitoringcapabilitiesalsoledtolesshuman error. Monitoringmeasures include theimplementationofsyntheticand passive monitoringsystemsacross22internetchannels as well as thenetwork and serverinfrastructure.We also reviewed and revamped thenetwork infrastructure and architectureleading to greater stability and costefficiencies.Weimplementedautomateddeployment tooling systems, and cleancoding practices to increase operationalefficiencies within newly formed in-housecodingteams.Wealso introducedredundancy across key channels. Forexample, we introduced redundancy intheSMSgatewaysforTACandregulatorynotifications.
“Ourteamsworkedceaselesslyduringtheyeartodrive
downincidentsthatcouldimpactservice
availability.Weachievedafurther30%reductioninnon-scheduleddowntimes.”
“Comparedtothelastfinancialyear,Internetbankingusersgrewby
22%,andmobilebankingusersjumpedby64%.”
baNK’S SYSteM oVeraLL uptIMe
99.95%
mANAgemeNT dIScUSSION & ANALySISINForMatIoN tecHNoLoGY
56ANNUALRePORT2018
HONG LEONG BANK BERHAD

We also commenced and completedtwo core banking implementations inLabuan and Hong Kong. We assistedand guided the operations teams onthe implementation of Robotic ProcessAutomation across call centre and backoffice operations. During the project,we also successfully revamped andredesigned the middle ware layer. TherevampwillenabletheBanktobemoreagileinthedeliveryofnewproductsandservicesgoingforward.
In addition, we also embarked onnew initiatives in technology serviceavailability.This involvedconceptualizingandnegotiatingafour-yearIBMOIO(OpenInfrastructureOffering).TheOIOdealwillhelp the Bank to offset approximatelyRM80 million in costs incurred over thenextfouryears.
In line with our vision to be Digital atthe Core, the Information Technologydivisioncontinues togrowtheoverall ITEcosystem at a sustainable price point.By offering new products and servicesinfrontlinedigitalchannels,theBankisseeing continued and increasing growthintransactionvolumesandcustomersignupsviadigitalchannels.Comparedtothelastfinancialyear,Internetbankingusersgrewby22%,andmobilebankingusersjumpedby64%.
The Bank’s IT team continued to pushthe boundaries during the year with alistofnewinitiativesandendeavourstofurtherenhancethedigitalecosystemoftheBank.Oneof the initiativeswas thedevelopmentofa2-3yearroadmap.Theroad map will realign the way we usedata. Inotherwords, itwill reinventtheway the Bank ingests, stores, consumesandexposesitsdata.Wewillalsomigratethewebenabledfrontendsystemstoanewarchitecture.TheultimateaimofthiswebmigrationistohaveanActive–Activeconfiguration. This type of configurationwillhelpfurtherreducescheduleddowntimesfortheBank’ssystems.Wewillalsocontinue our drive to migrate systemsfrom the old code base to newer moreagile coding practices that will lead tofasterandbetterITsystemdevelopment.
cYber SecurItY aND Data prIVacY
Cyber securityanddataprivacy remainsa toppriorityfortheBankandthesafetyandsecurityofourdataandsystemsareofaparamountconcern.Thethreatofdataleakages,ransomware,advancedpersistentthreats(APT)andthreatsthroughothermeansremainarelevantandpresentchallenge.AccordingtotheWorldEconomicForumreportfor2018,cybersecurityremainsatopinternationalpriorityforprotectingtheglobaleconomy.
Compromisesincybersecuritycanposeissuesatmanylevelsincludingtrusttowardsthebrand.Forone,thereistheriskofcommerciallossesandpublicrelationsproblems,aswellasdisruptionofoperationsandthepossibilityofextortionanddataransom.Cyber-attackscouldalso lead to regulatoryactionandnegligenceclaimsagainst theorganization.Itcouldalsocauseaninabilitytomeetcontractualobligationsandcausealossoftrustamongcustomersandsuppliers.WerecognizethisthreatandhaveinvestedandimplementedvariousmeasurestosafeguardtheBank’saswellasourcustomers’data.
mANAgemeNT dIScUSSION & ANALySISINForMatIoN tecHNoLoGY
CORPORATE
57ANNUALRePORT
2018

With cyber threats becoming prevalentacrossborders,theBankhasnowshiftedits focus towards a more informed andproactivestance.Tothisend,theBankisbuildingadiversecybersecurityteamand infrastructure stack. It is also identifying partners whoregularlycarryoutredteamexerciseswhichhashelpedusgainvaluableinsightsandraiseourreadinesslevel.
Cyber threat intelligence has been mooted as a key factor incombating global cybercrime. It mitigates the threat risk bycombining intelligence of data sources around the world andintegrating it with machine learning to provide meaningfulinsights tosecurityanalysts.Securityanalysts inturncanthenproactivelytakemeasurestoprotecttheorganization,hence,weareinvestinginthesetypesofcapabilities.
Havingmulti-levelcontrolsiscrucialintheBank’soperationstoensure cyber security readiness. These administrative controlsincludesetsofapprovedpoliciesandprocedureswhichgovernthe Bank’s day-to-day operations. This is coupled with seniormanagement and BRMC oversight, for example, through theestablishmentof the Information SecurityGovernanceCouncil,whichischairedbyourGroupManagingDirector.
We currently utilize a 24x7 Security Operations Centre. Ourexistingsecurityinfrastructurelooksatperimeterdefense.Italsodefends against inbound type attacks and mitigates them byusinganantispamgatewayand theAPT (AdvancedPersistentThreat)mitigationplatform.Ourround-the-clockvigilancehelpsthe organization prevent attacks which can be launched fromanywhereandatanytime.
Data privacy and protection of personal data continues to bea focus as required under the Personal Data Protection Act2010(“PDPA”),FinancialServicesAct2013(“FSA”)andIslamicFinancial Services Act 2013 (“IFSA”). We are committed toensuring the confidentiality and security of personal data andmaintain a Privacy Policy on our website so that employees,customers and partners understand how we collect, use andmanagepersonaldata.
We make continuous efforts to enhance our complianceprogram on protecting customer and employee data.Initiativesinclude:
i. upon joining the Bank, new employees attendingthe manager’s induction are given an introductorysessiononPDPAandsecrecylawsunderFSA/IFSA.
ii. Allexistingemployeeshavetoundergomandatorye-learningon thePDPAand IFSA/FSA. Inaddition,theyhavetoviewtheCustomerDataSecrecyVideo.Wedevelopedthevideousinganimatedstimulationsto demonstrate the different instances of possiblebreaches and the importance of protecting theconfidentialityandsecurityofpersonaldata.
iii. StaffareregularlyremindedthroughourinternalITsystemstobeonthelookoutforpossiblethreatsbyprovidingexamplesofwhattodoandwhatnottodo.
iv. We have embarked on a year-long awarenesscampaign to ensure that our customers gainknowledgeofactivitiesaroundcybersecurity,datalossmethodsandcompromisedsituationsandhenceprovidesuggestionsonhowtoavoidthem.
v. WehaveenhancedphysicalsecurityaroundaccesstoourpremisesandITsystemstoensurethatonlyauthorizedpersonnelhaveaccess.
vi. Wehaveinvestedintoolsthatwillallowustomonitorwhoisaccessingoursystemsandhencedetectandreport unauthorized access. This is an evolvingarea, and will require consistent investments andcapabilitiesenhancementstoensurethatweremainwellprotected.
We are committed to developing our capabilities and ourcompliancecultureandstrengtheningoureffortsinthisarea.
cYber SecurItY aND Data prIVacY (coNtINueD)
mANAgemeNT dIScUSSION & ANALySISINForMatIoN tecHNoLoGY
58ANNUALRePORT2018
HONG LEONG BANK BERHAD
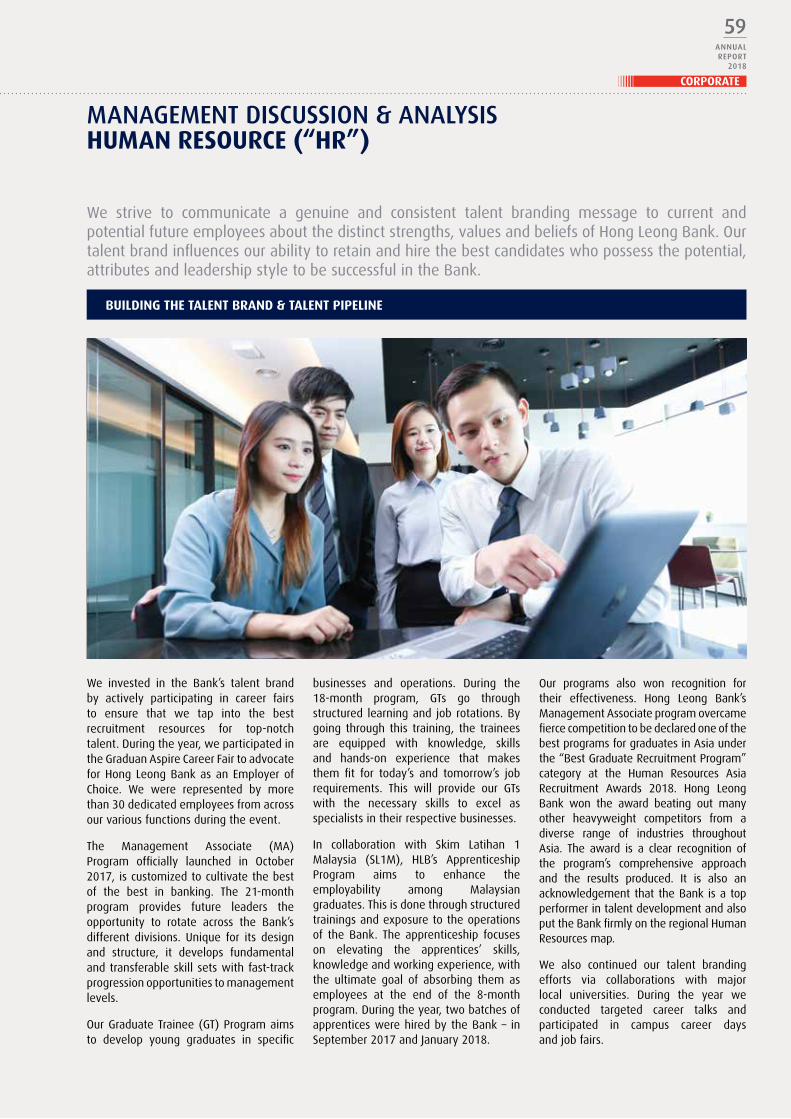
mANAgemeNT dIScUSSION & ANALySISHuMaN reSource (“Hr”)
We invested in the Bank’s talent brandby actively participating in career fairsto ensure that we tap into the bestrecruitment resources for top-notchtalent.Duringtheyear,weparticipatedintheGraduanAspireCareerFairtoadvocateforHongLeongBankasanEmployerofChoice. We were represented by morethan30dedicatedemployeesfromacrossourvariousfunctionsduringtheevent.
The Management Associate (MA)Program officially launched in October2017,iscustomizedtocultivatethebestof the best in banking. The 21-monthprogram provides future leaders theopportunity to rotate across the Bank’sdifferent divisions. unique for its designand structure, it develops fundamentalandtransferableskillsetswithfast-trackprogressionopportunitiestomanagementlevels.
OurGraduateTrainee(GT)Programaimsto develop young graduates in specific
businesses and operations. During the18-month program, GTs go throughstructured learningand job rotations.Bygoing through this training, the traineesare equipped with knowledge, skillsand hands-on experience that makesthem fit for today’s and tomorrow’s jobrequirements. This will provide our GTswith the necessary skills to excel asspecialistsintheirrespectivebusinesses.
In collaboration with Skim Latihan 1Malaysia (SL1M), HLB’s ApprenticeshipProgram aims to enhance theemployability among Malaysiangraduates.Thisisdonethroughstructuredtrainingsandexposuretotheoperationsof the Bank. The apprenticeship focuseson elevating the apprentices’ skills,knowledgeandworkingexperience,withthe ultimate goal of absorbing them asemployees at the end of the 8-monthprogram.Duringtheyear,twobatchesofapprenticeswerehiredbytheBank– inSeptember2017andJanuary2018.
Our programs also won recognition fortheir effectiveness. Hong Leong Bank’sManagementAssociateprogramovercamefiercecompetitiontobedeclaredoneofthebestprogramsforgraduatesinAsiaunderthe“BestGraduateRecruitmentProgram”category at the Human Resources AsiaRecruitment Awards 2018. Hong LeongBank won the award beating out manyother heavyweight competitors from adiverse range of industries throughoutAsia. The award is a clear recognition ofthe program’s comprehensive approachand the results produced. It is also anacknowledgementthat theBank isa topperformerintalentdevelopmentandalsoputtheBankfirmlyontheregionalHumanResourcesmap.
We also continued our talent brandingefforts via collaborations with majorlocal universities. During the year weconducted targeted career talks andparticipated in campus career daysandjobfairs.
We strive to communicate a genuine and consistent talent branding message to current andpotentialfutureemployeesaboutthedistinctstrengths,valuesandbeliefsofHongLeongBank.Ourtalentbrandinfluencesourabilitytoretainandhirethebestcandidateswhopossessthepotential,attributesandleadershipstyletobesuccessfulintheBank.
buILDING tHe taLeNt braND & taLeNt pIpeLINe
CORPORATE
59ANNUALRePORT
2018

Thebestdevelopmenthappenswhenlearningfromnewexperiences(70%)–ithas3timesmore impactonperformance than formal trainingwhen theappropriate level ofmanagersupport,developmentplanningandlearningfromothersisinplace.
• eLearningonMyLearning• Structuredtrainingprograms• Certification• Literaturefrominternalandexternalsites• Smartup
• Feedbackfrommanagers,colleaguesandcustomers/clients
• Mentorforcareeradvice• Mentormorejunior/seniorwithspecialist/
leadershipskills• Networking
• Stretchedassignment• Doublehattinginanadditionalrole• Jobrotation• Deputising• Strategicprojectexperience• Intentionalpracticeandreflection
ofaskill
HongLeongBankemployeesareencouragedtotakeownershipoftheirprofessionaland personal development. The Bank supports our employee development withvariousprograms.HongLeongBankpracticesthe70:20:10model,asitisaflexibleandeffectivewayoflearning,anytime,anywhere.Italsoencouragesinitiativeandaccountabilityfortheemployee’sowndevelopment.
10%FORMAL
TRAINING
20%LEARNING
FROMOTHERS
70%ON-THE-JOBLEARNING
The shift in the market towards Industry 4.0 is reshaping thesupply and demand for workforce across the globe due toa rapidly evolving technology landscape and the differentexpectations of the next generation of the workforce. Theneed to undertake reskilling to meet the new demands of ahighlydigitizedenvironmentisforcingtheBanktorethinkourtechniquesfordevelopingtalent.By making talent management a priority today and not the
future,wearedevelopingatalentpoolwhichisabletosustaintheBankamidthevolatile,uncertain,complexandambiguousbusinessenvironment.ThisrequirestheBanktobuildaculturewhereitencouragesourtalenttohaveaflexiblemindset.Themindset thatwework to cultivate in our talent is one that isopenandreceptiveto learningandadaptingtonewtrends inemergingtechnology,andtodeveloptheabilitytodrivechangeasakeydifferentiator.
INVeStING IN taLeNt
mANAgemeNT dIScUSSION & ANALySISHuMaN reSource (“Hr”)
60ANNUALRePORT2018
HONG LEONG BANK BERHAD

To ensure we have the right leaders toachieve the above strategy, all of ourC-Suiteexecutivesmeetanddecideasacohortonseniormanagementpromotion.Led by ourGroupManagingDirector, allpromotion nominees are deliberatedextensively by the cohort before adecision on that individual is made.Emphasisisplacedonhowtheemployeeconsideredforpromotionhasembeddedthe Bank’s values and change mindsetintheirdailywork lives,aswellashowtheyarecontributingtodrivingtheBank’sDigitalattheCoreethos,customercentricandinnovationdrive.
Ourentireworkforceandtalentcohortarealso undergoing a digital transformationto support the Bank’s strategy to beDigital at the Core. We are doing thiswith the introduction of the Bank’s Fit-For-Future digital capabilities program.The Fit-For-Future modules are availableon our mobile learning app, HLBSmartup. The modules are designed tobe accessible by employees to learn attheirownpace,helpingtobuildpersonalandorganizationalcapabilitiesinrelevantareas.Theprogramiscategorizedintosixmainpillars:
£ DigitalAwareness
£ DataDrivenDecisionMaking
£ DesignThinking/Human-CenteredDesign
£ Agile
£ FutureCommunication
£ RiskandGovernance
Building on our Fit-For-Future program,HLB also launched its structured talentidentificationprocess.We recognize thatthe traditional way of identifying talentbasedontheircurrentperformancedoesnot provide the Bank a holistic viewof the talent’s leadership potential. Toaddressthis,weintroduceda3-attributemeasurement (Ability, Aspiration,Engagement), and a Talent BehaviourChecklisttohelpmanagersbetterpickoutleadershippotential.Thevariousinitiativesmean that we now have a structured,scalable and practical framework toidentifytalent.
We rolled out a structured onboarding program in April 2018 aimed at embeddingnewemployees intoourcultureandstrategicdirection.Theprogramintegratesnewemployeesintotheirrolesandsubsequentlyincreasestheirengagementwithwhatwearetryingtodoandourtransformationagenda.Atotalof298newemployeesattendedthe4-dayprogramwhichisscheduledonamonthlybasis.
Pursuanttothe industry-widecommitmenttoprofessionalizetheMalaysianBankingIndustry, we partnered with the Asian Banking School (ABS) to ensure all our newemployeeswhoaregraduatesandhavelessthantwoyearsworkingexperience,attendtheIntroductiontoEthicsinBankingprogramaspartoftheironboardingjourney.Theprogramcoversthefollowingtopics:
Day 1:HongLeongBankOrientation
Day 2:OverviewofHLBDivisionsandBusiness
Day 3:IntroductiontoEthicsinBanking
Day 4:ShariahAwarenessprogram
Wework constantly to support the industry-wide commitment to createaworkforcecharacterizedbyhighstandardsofprofessionalconduct,knowledgeandcompetence.OneofourinitiativesistheCharteredBankerprogram.Some258HLB&HLISBemployeesfromcorebankingfunctionsregisteredfortheCharteredBankersprogram.Twofromthis group of employees successfully obtained their Chartered Banker’s qualificationduringtheyear.InadditiontotheCharteredBanker’spathwaycommitment,243ofourkeypersonnelincriticaljobfunctions(AML/CFT,InternalAudit,Compliance,CreditandRiskManagement)registeredforSpecializedFunctionenhancement,with75ofthesekeypersonnelcompletingtheirrespectivecertifications.
StreNGtHeNING GoVerNaNce tHrouGH LearNING aND DeVeLopMeNt
6 pILLarS oF Future-eNabLeD SKILLS
Source: Institute of Banking & Finance Singapore
1Digital
awareness
understandapplication
ofnewtechnologiestobusiness
Artificialintelligence/
MachineLearning
Blockchain/Distributed
LedgerTechnology
Cloud
InternetofThings
API
DevOps
2Data Driven
Decision Making
understandhowtoapplydataanalytics
todecisionmaking,
insightsandproblemsolving
DataManagement
DataEngineering
DataProjectLifecycle
3Human
centered Design
understandhowtodesignproductsandservicesfromacustomerperspective
Human-centereddesign
4agile
Applyagileprinciplestoallaspectsof
business
Agile
Experimentalmindset
Businessmodelcanvas
5Future
communication
Engage
customereffectively
inthedigitalera
Digitalmarketingframework
Communicationplatforms
Contentgenerationstrategies
6risk &
Governance
understandandmanagerisks
inadigitalizedworldoffinancialservices
Risk&compliance
Financialcrime
Cybersecurity
Digitalgovernance
mANAgemeNT dIScUSSION & ANALySISHuMaN reSource (“Hr”)
CORPORATE
61ANNUALRePORT
2018
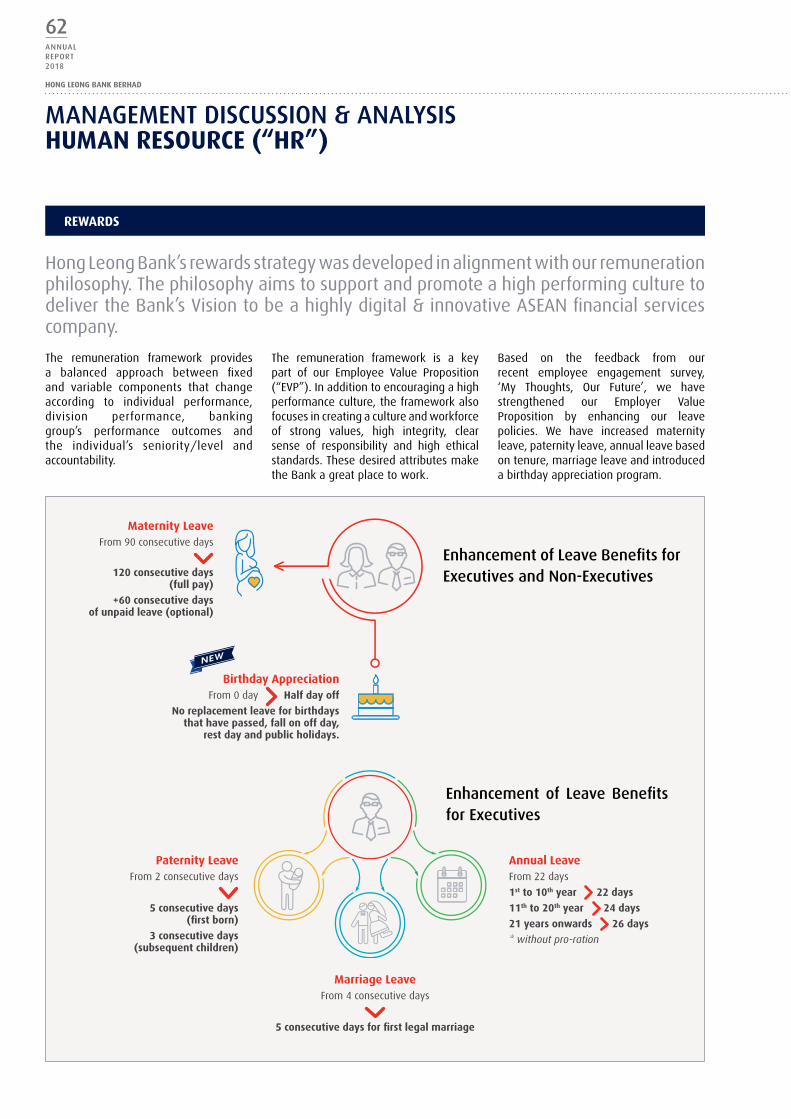
HongLeongBank’srewardsstrategywasdevelopedinalignmentwithourremunerationphilosophy.ThephilosophyaimstosupportandpromoteahighperformingculturetodelivertheBank’sVisiontobeahighlydigital&innovativeASEANfinancialservicescompany.
The remuneration framework is a keypart of our Employee Value Proposition(“EVP”).Inadditiontoencouragingahighperformanceculture,theframeworkalsofocusesincreatingacultureandworkforceof strong values, high integrity, clearsense of responsibility and high ethicalstandards.ThesedesiredattributesmaketheBankagreatplacetowork.
Based on the feedback from ourrecent employee engagement survey,‘My Thoughts, Our Future’, we havestrengthened our Employer ValueProposition by enhancing our leavepolicies. We have increased maternityleave,paternityleave,annualleavebasedontenure,marriageleaveandintroducedabirthdayappreciationprogram.
enhancement of Leave benefits for executives and Non-executives
enhancement of Leave benefits for executives
Maternity LeaveFrom90consecutivedays
120 consecutive days (full pay)
+60 consecutive days of unpaid leave (optional)
birthday appreciationFrom0day Half day off
No replacement leave for birthdays that have passed, fall on off day,
rest day and public holidays.
annual LeaveFrom22days
1st to 10th year 22 days
11th to 20th year 24 days
21 years onwards 26 days
* without pro-ration
paternity LeaveFrom2consecutivedays
5 consecutive days (first born)
3 consecutive days (subsequent children)
Marriage LeaveFrom4consecutivedays
5 consecutive days for first legal marriage
reWarDS
The remuneration framework providesa balanced approach between fixedand variable components that changeaccording to individual performance,division performance, bankinggroup’s performance outcomes andthe individual’s seniority/level andaccountability.
mANAgemeNT dIScUSSION & ANALySISHuMaN reSource (“Hr”)
62ANNUALRePORT2018
HONG LEONG BANK BERHAD

LeVeraGe oN tecHNoLoGY
Theall-digitalworldischanginghowwelive,howwework,andhowbusinessisorganizedandconducted.Aswe embarked on our transformation journey towardsbeing“DigitalattheCore”,weconstantlylooktowardsdigital technologies and innovation that can improvethe Bank’s internal and external customer experienceby incorporating smart technologies into what weretraditionallyhumandrivenprocesses.In2017,HongLeongBankcollaboratedwithHyperlab,aleadingConversationalArtificialIntelligence (A.I.) company tocreatea reliableautomatedplatformthrough theuseof the artificial intelligence system HALI. HALI aims to improve internal operationsefficiencythroughautomatingthousandsofqueriesfromtheemployeesinrelationtohumanresourcessuchasmedicalbenefits,staffloans,leavepolicy,payroll,generatingconfirmationlettersandmore.HALIhassuccessfullycutdownman-hourswhereatotalof34,152humanresourcesrelatedquestionswereansweredbyHALIonemonthafterthelaunchingofHALI.
HALImarksanothermilestonefortheHumanResourcesDivisioninprovidingspeedyandconvenientaccesstoaccurateinformationforourinternalcustomers.ItalsokeepsabreastwiththeBank’svisionandmissiontobeadigitalbank.
To capture the benefits of mobile learning, we collaborated with Smartup Inc. tointroduceourveryownmobilelearningapptoouremployees.Officially launchedinOctober2017,HLBSmartup isapowerfulpeer-to-peer, knowledge sharingplatformapplication which also incorporates a degree of fun through gamification. As it is amobileapp,allemployeesofHLB,regardlessofwheretheyarebased,haveaccesstothelearningcontentson-the-go.
TodriveSmartup,internalcontentcreatorswereidentifiedandnominatedbyrespectivedivisions within the Bank to create content related to their respective sphere ofexpertise. These creators contributed content which was subsequently published onSmartup.Todate,wehavemorethan400piecesofcontentonSmartup.WealsohaveagrowingpoolofinternalcontentcreatorspavingthewayforasustainableknowledgesharingenvironmentintheBank.
“HALImarksanothermilestonefortheHuman
ResourcesDivisioninprovidingspeedyandconvenientaccessto
accurateinformationforourinternalcustomers.Italsokeepsabreast
withtheBank’svisionandmissionto
beadigitalbank.”
to Date
400 pieces of contents on SmartUp
GroWING pooL oF
internalcontentcreators
mANAgemeNT dIScUSSION & ANALySISHuMaN reSource (“Hr”)
CORPORATE
63ANNUALRePORT
2018
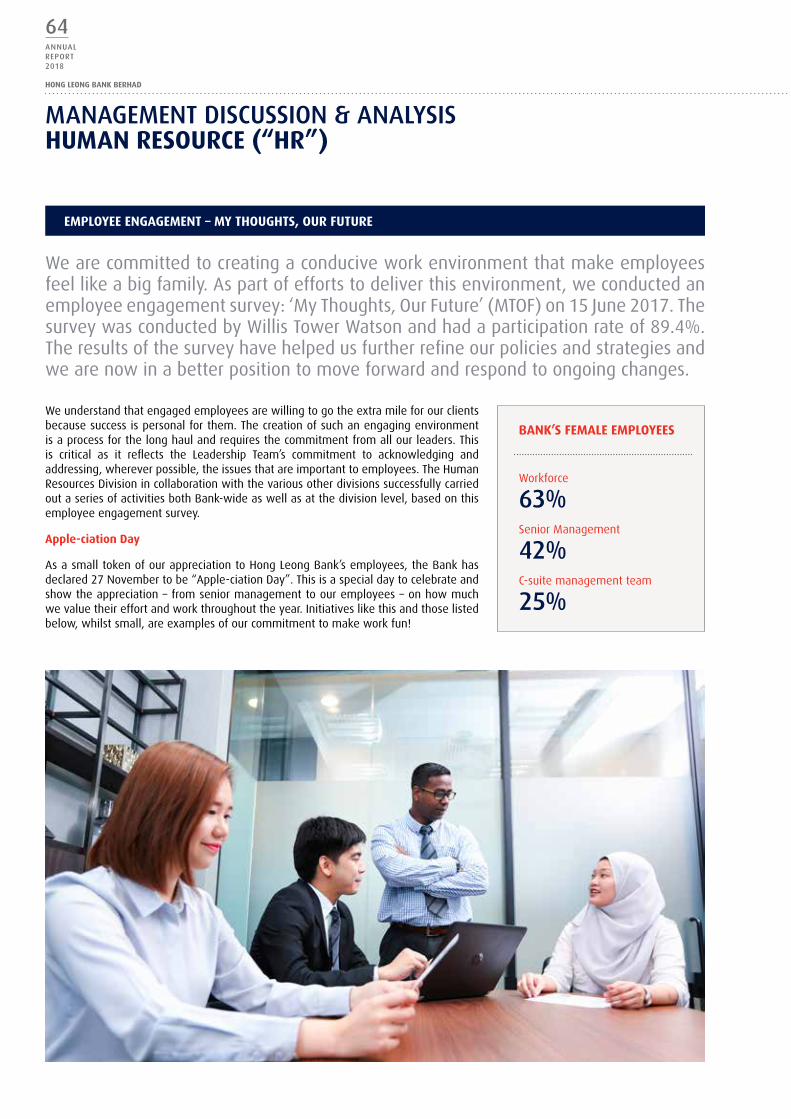
Weunderstandthatengagedemployeesarewillingtogotheextramileforourclientsbecausesuccessispersonalforthem.Thecreationofsuchanengagingenvironmentisaprocessforthelonghaulandrequiresthecommitmentfromallourleaders.Thisis critical as it reflects the Leadership Team’s commitment to acknowledging andaddressing,whereverpossible,theissuesthatareimportanttoemployees.TheHumanResourcesDivisionincollaborationwiththevariousotherdivisionssuccessfullycarriedoutaseriesofactivitiesbothBank-wideaswellasatthedivisionlevel,basedonthisemployeeengagementsurvey.
apple-ciation Day
AsasmalltokenofourappreciationtoHongLeongBank’semployees,theBankhasdeclared27Novembertobe“Apple-ciationDay”.Thisisaspecialdaytocelebrateandshowtheappreciation–fromseniormanagementtoouremployees–onhowmuchwevaluetheireffortandworkthroughouttheyear.Initiativeslikethisandthoselistedbelow,whilstsmall,areexamplesofourcommitmenttomakeworkfun!
baNK’S FeMaLe eMpLoYeeS
Workforce
63%SeniorManagement
42%C-suitemanagementteam
25%
Wearecommittedtocreatingaconduciveworkenvironmentthatmakeemployeesfeellikeabigfamily.Aspartofeffortstodeliverthisenvironment,weconductedanemployeeengagementsurvey:‘MyThoughts,OurFuture’(MTOF)on15June2017.ThesurveywasconductedbyWillisTowerWatsonandhadaparticipationrateof89.4%.Theresultsofthesurveyhavehelpedusfurtherrefineourpoliciesandstrategiesandwearenowinabetterpositiontomoveforwardandrespondtoongoingchanges.
eMpLoYee eNGaGeMeNt – MY tHouGHtS, our Future
mANAgemeNT dIScUSSION & ANALySISHuMaN reSource (“Hr”)
64ANNUALRePORT2018
HONG LEONG BANK BERHAD
eMpLoYee eNGaGeMeNt – MY tHouGHtS, our Future (coNtINueD)
brown bag Series
Brown Bag – Lunch and Learn aims toprovide informal learning sessions forallemployeesatworkeverymonth.Wetry to choose engaging and interestingtopicsthatareassociatedtothemonthlysustainability theme in the 2018Sustainability Calendar. These sessionsare easily accessible and conducted byexpertsintheirrespectivefields.Theyarealso conducted in an engaging and lessformalstructurewiththegoalofprovidinganexcellentlearningexperience.
International Women Day
“The story of women’sstruggle for equalitybelongs to no singlefeminist nor to any oneorganization but to thecollectiveeffortsofallwhocareabouthumanrights.”
– Gloria Steinem, world-renowned feminist
HongLeongBankisanorganizationthatembracesdiversity,inclusivityandgenderequality. The Bank’s female employeesrepresent 63% of our workforce, 42%of senior management and 25% of theC-suite management team. To celebrateandappreciatethecontributionofwomenglobally and to recognize their social,economic and cultural achievements,HongLeongBankorganizeditsfirsteverInternational Women’s Day on 8 March2018. As part of the festivities, a panelforumwasheldwiththetheme“PressforProgress” tomotivate andunite friends,colleagues and the entire Hong LeongBank community to think, act and begenderinclusive.
Stairathon challenge
Ahealthyemployeeisaproductiveemployee.TheStairathonChallengeisadivisionalfitnesschallengewherebyateamoffourparticipantsraceup20floors inarelayatMenaraHongLeonginKualaLumpur.Thetopthreefasteststairclimberswalkawaywith a prize of RM2,400. The Stairathon Challenge was held on 20 April 2018 toencourageouremployeestoliveahealthylifestylewiththeeventualgoalofincreasingengagementandproductivity.
career Day
OneofthequotesfromourGroupManagingDirectorDomenicFudathatwetaketoheart is this: “50 years ofwork does not equal 50 years ofwork experience if youkeeprepeatinganddoingthesameworkyearlyfor50years”.Withthatinmind,theHuman Resources Division successfully organized the Bank’s inaugural Career Dayon3rd July2018. Theeventmarksour commitment tohelpouremployeesexplorecareer development opportunities and possibilities available to them within theBank;encouragetransferswithindivisions,takeadvantageofself-learningtoolsandopportunities,exploreparticipatinginspecificprojectsthatstretchonesknowledgeandexperiences,sothatworkexperiencebecomesanevolvingaccumulationofdifferenceexperiencesandactivities,increasingone’sskillsetandhencemakeonebetterpreparedtotackleworkrequirementsinafastchangingworld.
TheconceptofCareerDaywasdevelopedfromtheunderstandingthatouremployeesareconstantlylookingforopportunitiesforcareergrowth.Theone-dayeventalsoprovidedaplatformforemployeestonetworkandacquireinformationabouttheoperationsofvarious department within the Bank. It also encourages inter-departmental synergywhenemployeesbetterunderstandthefunctionofotherbusinessunits.Werecognizethatcommunicationandtheabilitytoadaptarekey.ultimately,ourgoalofhavingthecareerdayistocreateaninspiringandfunworkingenvironmentforall.
As the industry continues to undergo significant change, propelled by the evolvingfinanciallandscapeandtheconstantthreatofdisruption,ideassuchasCareerDaythatoriginatedfromthe‘MyThoughts,OurFuture’surveycontinuestobethekeythatwillenableustomaximizetheenergy,creativityandproductivityofouremployees.
e-toucH
The“MyThoughts,OurFuture”surveyhasgivenusdeeperinsightsandunderstandingonwhatkeepsouremployeesmotivatedandtogotheextramile.MotivationdependedonwhetheroneisTypeX(Extrinsic)orTypeI(Intrinsic)behaviour.
FortheTypeX’s,moneyisthemotivationfordoingwork.ForTypeI’sontheotherhand,compensationisperceivedtobefairness,withmoneyasecondaryfactor.Moreoftenthannot,TypeIbehavioursleadtostrongerperformance,greaterhealth,andhigheroverallwell-being.Armedwiththeinsightthatembeddingrecognitionaspartofourdailylifecanmakeabigdifference,welaunchedourownappreciationplatformcallede-TOuCHtoenableouremployeestoprovideinstantaneousandpersonalrecognitiontoourcolleagueswhohavegonetheextramileincustomerserviceintheirjobs.Ourapproachof“Appreciate,CelebrateandCongratulate”isagoodwaytoprovidevisibilityforsuccess,drivecontinuousimprovementandoperationalexcellence.
mANAgemeNT dIScUSSION & ANALySISHuMaN reSource (“Hr”)
CORPORATE
65ANNUALRePORT
2018
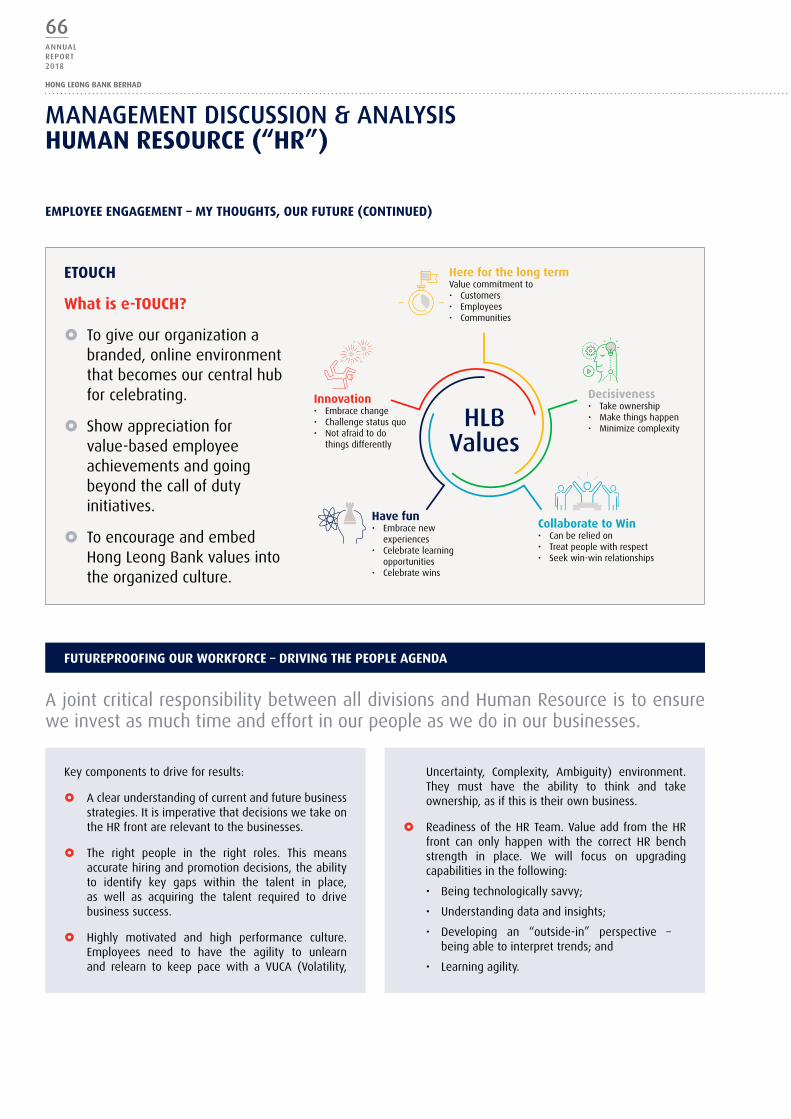
etoucH
What is e-toucH?
£ Togiveourorganizationabranded,onlineenvironmentthatbecomesourcentralhubforcelebrating.
£ Showappreciationforvalue-basedemployeeachievementsandgoingbeyondthecallofdutyinitiatives.
£ ToencourageandembedHongLeongBankvaluesintotheorganizedculture.
Here for the long termValuecommitmentto• Customers• Employees• Communities
HLb Values
Decisiveness• Takeownership• Makethingshappen• Minimizecomplexity
collaborate to Win• Canbereliedon• Treatpeoplewithrespect• Seekwin-winrelationships
Have fun• Embracenew
experiences• Celebratelearning
opportunities• Celebratewins
Innovation• Embracechange• Challengestatusquo• Notafraidtodo
thingsdifferently
FutureprooFING our WorKForce – DrIVING tHe peopLe aGeNDa
AjointcriticalresponsibilitybetweenalldivisionsandHumanResourceistoensureweinvestasmuchtimeandeffortinourpeopleaswedoinourbusinesses.
eMpLoYee eNGaGeMeNt – MY tHouGHtS, our Future (coNtINueD)
Keycomponentstodriveforresults:
£ Aclearunderstandingofcurrentandfuturebusinessstrategies.ItisimperativethatdecisionswetakeontheHRfrontarerelevanttothebusinesses.
£ The right people in the right roles. This meansaccuratehiringandpromotiondecisions,theabilityto identify key gaps within the talent in place,as well as acquiring the talent required to drivebusinesssuccess.
£ Highly motivated and high performance culture.Employees need to have the agility to unlearnand relearn to keep pace with a VuCA (Volatility,
uncertainty, Complexity, Ambiguity) environment.They must have the ability to think and takeownership,asifthisistheirownbusiness.
£ Readinessof theHRTeam.Valueadd fromtheHRfront can only happen with the correct HR benchstrength in place. We will focus on upgradingcapabilitiesinthefollowing:
• Beingtechnologicallysavvy;
• understandingdataandinsights;
• Developing an “outside-in” perspective –beingabletointerprettrends;and
• Learningagility.
mANAgemeNT dIScUSSION & ANALySISHuMaN reSource (“Hr”)
66ANNUALRePORT2018
HONG LEONG BANK BERHAD
For more information on this report, or to provide your feedback, please contact: Head, Sustainability, Hong Leong Bank Berhad 03-2081 8888
“Highly digital and innovative ASEAN financial services company“
HLB Corporate Vision
To help clients succeed through simple, relevant, personal and fair banking; To provide our people with the best opportunities to realise their potential;
To create stakeholder value.HLB Mission
HLB Sustainability Themes
Digital at the core Fit for future workforce Environmentally and socially responsible SME growth
HLB Sustainability Themes Description
Digital at the coreEmbracing digital transformation and building internal capability for greater customer experience, accessibility and efficiency.
Fit for future workforce
Acquiring strategic skills to enhance critical and core capabilities. Hiring and retaining a high performing inclusive workforce fit for the digital era training.
Environmentally and socially responsible
Managing the environmental footprint of our operations. Advocating social and environmental responsibility through our products and services.
SME growth
Support the growth and capability development of SMEs through the provision of relevant tools, knowledge, and banking products and services. Facilitate access to financing for underserved SMEs. Support the entrepreneurial spirit of start-ups and FinTechs to build a vibrant future business community.
Sustainability Risk Management
Our MaterialityTopics
• Digital Innovation• Customer Experience• Cyber Security and
Data Privacy• Ethics, Integrity and
Compliance
• Employee Experience
• Ethics, Integrity and Compliance
• Managing Our Environmental Footprint
• Supplier Assessment• Responsible Lending• Fair Banking• Community Banking
• Community Banking
To view our full sustainability report, please scan the QR code or link to www.hlb.com.my/sustainability
Sustainability Themes FY2018Our Sustainability Report was prepared in accordance with the Global Reporting Initiative Standards (“GRI Standards”): Core option, through which we have sought to communicate the impact of our economic, environmental and social (”EES“) performance.
The production of our report was also guided by local and international standards such as Bursa Malaysia’s Sustainability Reporting Guidelines and the United Nations Sustainable Development Goals (“SDGs“). We mapped our sustainability actions against those SDGs in which we are able to have the most impact.
The data provided in our report relates to issues determined as important to both the Bank and our stakeholders via a materiality analysis. Ten topics are presented under Four Strategic Themes that reflect key priorities targeting our most important stakeholders, namely our customers, employees, regulators, shareholders and investors. These themes clearly outline our strategies: Digital at the Core; Fit for Future Workforce; Environmentally and Socially Responsible; and Small and Medium Enterprises (”SME“) Growth.
For each topic, we have provided an overview of the Bank’s current position and laid out our initiatives under each strategic theme. We also provide information about quantitative data and targets to be met; and systems that will allow us to monitor and measure our performance. In this report, we present up to date quantitative data that will enable our stakeholders to understand how we are progressing in areas that are of particular interest to them.
We recognize that many stakeholders are no longer interested only in the financial performance of companies, and our Sustainability Report provides the information they desire on our overall EES scorecard.
The contents of our Sustainability Report are governed by a Sustainability Committee that reviewed all material topics to ensure they aligned with the organisation’s strategies. The report was recommended to the Board Risk Management Committee (“BRMC”) of the Board of Directors for their endorsement on 12 September 2018. The Board approved the contents of our Sustainability Report on 19 September 2018.
As an assurance of the reliability of the data provided in our report, we sought the verification of an independent body, Malaysia’s leading certification, inspection and testing body, SIRIM.
Reporting scope: All data in our report relates to the operations of Hong Leong Bank (“HLB“) and Hong Leong Islamic Bank (”HLISB“) in Malaysia as they represent our most material businesses.
SUSTAINAbILITyStateMeNt
CORPORATE
67ANNUALRePORT
2018

For more information on this report, or to provide your feedback, please contact: Head, Sustainability, Hong Leong Bank Berhad 03-2081 8888
“Highly digital and innovative ASEAN financial services company“
HLB Corporate Vision
To help clients succeed through simple, relevant, personal and fair banking; To provide our people with the best opportunities to realise their potential;
To create stakeholder value.HLB Mission
HLB Sustainability Themes
Digital at the core Fit for future workforce Environmentally and socially responsible SME growth
HLB Sustainability Themes Description
Digital at the coreEmbracing digital transformation and building internal capability for greater customer experience, accessibility and efficiency.
Fit for future workforce
Acquiring strategic skills to enhance critical and core capabilities. Hiring and retaining a high performing inclusive workforce fit for the digital era training.
Environmentally and socially responsible
Managing the environmental footprint of our operations. Advocating social and environmental responsibility through our products and services.
SME growth
Support the growth and capability development of SMEs through the provision of relevant tools, knowledge, and banking products and services. Facilitate access to financing for underserved SMEs. Support the entrepreneurial spirit of start-ups and FinTechs to build a vibrant future business community.
Sustainability Risk Management
Our MaterialityTopics
• Digital Innovation• Customer Experience• Cyber Security and
Data Privacy• Ethics, Integrity and
Compliance
• Employee Experience
• Ethics, Integrity and Compliance
• Managing Our Environmental Footprint
• Supplier Assessment• Responsible Lending• Fair Banking• Community Banking
• Community Banking
To view our full sustainability report, please scan the QR code or link to www.hlb.com.my/sustainability
Sustainability Themes FY2018Our Sustainability Report was prepared in accordance with the Global Reporting Initiative Standards (“GRI Standards”): Core option, through which we have sought to communicate the impact of our economic, environmental and social (”EES“) performance.
The production of our report was also guided by local and international standards such as Bursa Malaysia’s Sustainability Reporting Guidelines and the United Nations Sustainable Development Goals (“SDGs“). We mapped our sustainability actions against those SDGs in which we are able to have the most impact.
The data provided in our report relates to issues determined as important to both the Bank and our stakeholders via a materiality analysis. Ten topics are presented under Four Strategic Themes that reflect key priorities targeting our most important stakeholders, namely our customers, employees, regulators, shareholders and investors. These themes clearly outline our strategies: Digital at the Core; Fit for Future Workforce; Environmentally and Socially Responsible; and Small and Medium Enterprises (”SME“) Growth.
For each topic, we have provided an overview of the Bank’s current position and laid out our initiatives under each strategic theme. We also provide information about quantitative data and targets to be met; and systems that will allow us to monitor and measure our performance. In this report, we present up to date quantitative data that will enable our stakeholders to understand how we are progressing in areas that are of particular interest to them.
We recognize that many stakeholders are no longer interested only in the financial performance of companies, and our Sustainability Report provides the information they desire on our overall EES scorecard.
The contents of our Sustainability Report are governed by a Sustainability Committee that reviewed all material topics to ensure they aligned with the organisation’s strategies. The report was recommended to the Board Risk Management Committee (“BRMC”) of the Board of Directors for their endorsement on 12 September 2018. The Board approved the contents of our Sustainability Report on 19 September 2018.
As an assurance of the reliability of the data provided in our report, we sought the verification of an independent body, Malaysia’s leading certification, inspection and testing body, SIRIM.
Reporting scope: All data in our report relates to the operations of Hong Leong Bank (“HLB“) and Hong Leong Islamic Bank (”HLISB“) in Malaysia as they represent our most material businesses.
SUSTAINAbILITyStateMeNt
68ANNUALRePORT2018
HONG LEONG BANK BERHAD
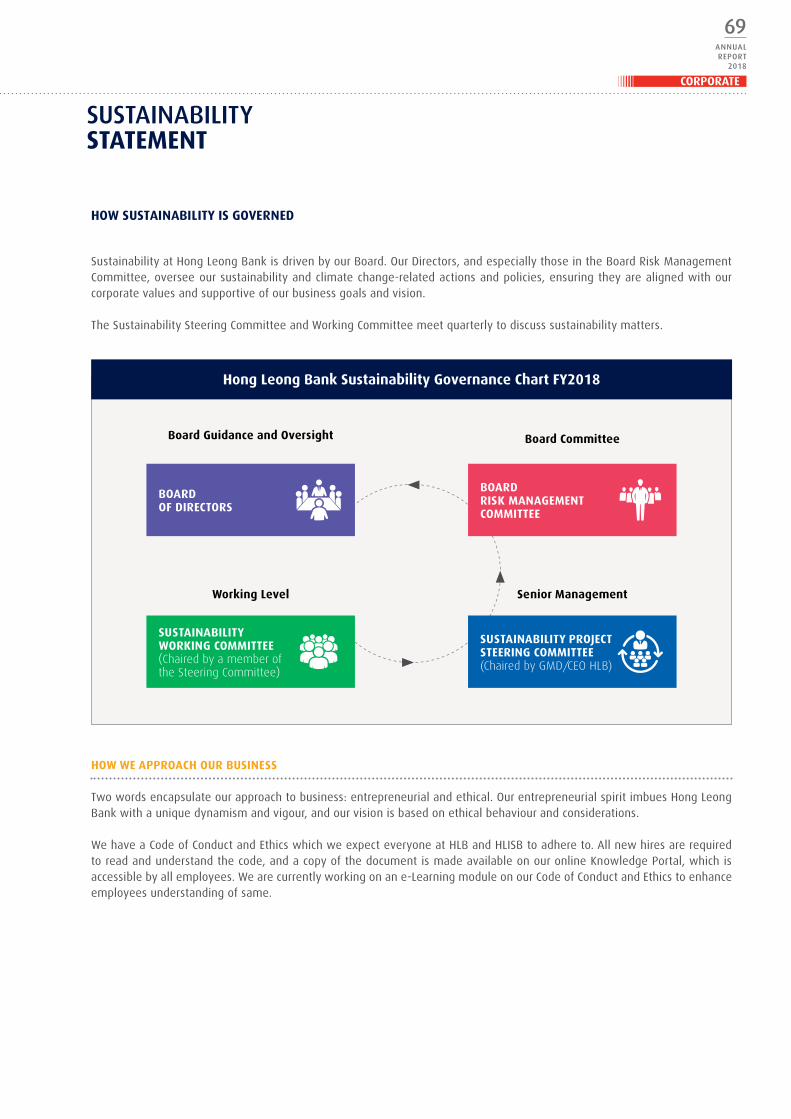
Sustainability at Hong Leong Bank is driven by our Board. Our Directors, and especially those in the Board Risk Management Committee, oversee our sustainability and climate change-related actions and policies, ensuring they are aligned with our corporate values and supportive of our business goals and vision.
The Sustainability Steering Committee and Working Committee meet quarterly to discuss sustainability matters.
Board Guidance and Oversight Board Committee
Senior Management
BOARD OF DIRECTORS
SUSTAINABILITY PROJECTSTEERING COMMITTEE (Chaired by GMD/CEO HLB)
Working Level
SUSTAINABILITYWORKING COMMITTEE Chaired by a member of
the Steering Committee
BOARD RISK MANAGEMENT COMMITTEE
HOW WE APPROACH OUR BUSINESS
Two words encapsulate our approach to business: entrepreneurial and ethical. Our entrepreneurial spirit imbues Hong Leong Bank with a unique dynamism and vigour, and our vision is based on ethical behaviour and considerations.
We have a Code of Conduct and Ethics which we expect everyone at HLB and HLISB to adhere to. All new hires are required to read and understand the code, and a copy of the document is made available on our online Knowledge Portal, which is accessible by all employees. We are currently working on an e-Learning module on our Code of Conduct and Ethics to enhance employees understanding of same.
• Digital Innovation• Customer Experience• Employee Experience • Ethics, Integrity and Compliance• Community Banking
Legend:
Most Important
Very Important
Important
• Fair Banking• Cyber Security and Data Privacy• Responsible Lending• Managing Our Environmental Footprint• Supplier Assessment
Cyber Security and Data Privacy
DigitalInnovation
Customer Experience
Ethics, Integrity and Compliance
Employee Experience
Community Banking
Fair Banking
Responsible LendingSupplier Assessment
Managing Our Environmental
Footprint
Very ImportantImportant Most Important
Significance of EES Impacts
Very
Impo
rtan
tIm
port
ant
Mos
t Im
port
ant
Infl
uen
ce o
n s
take
hol
der
ass
essm
ents
an
d d
ecis
ion
s
SUSTAINABILITY TOPICS IDENTIFIED
OUR MATERIALITY MATRIX
In FY2018, we reviewed our sustainability materiality matrix and the 11 material topics that were identified in FY2017. The committee proposed to consolidate Compliance, Ethics, and Integrity into one topic, "Ethics, Integrity and Compliance" of FY2018 reporting. The recommendation was accepted by project steering committees. The committee then presented the sustainability targets and initiatives to management for further deliberation against the challenges and opportunities facing the Bank.REVIEW
Hong Leong Bank Sustainability Governance Chart FY2018
HOW SUSTAINABILITY IS GOVERNED OUR SUSTAINABILITY APPROACH
SUSTAINAbILITyStateMeNt
CORPORATE
69ANNUALRePORT
2018

Sustainability at Hong Leong Bank is driven by our Board. Our Directors, and especially those in the Board Risk Management Committee, oversee our sustainability and climate change-related actions and policies, ensuring they are aligned with our corporate values and supportive of our business goals and vision.
The Sustainability Steering Committee and Working Committee meet quarterly to discuss sustainability matters.
Board Guidance and Oversight Board Committee
Senior Management
BOARD OF DIRECTORS
SUSTAINABILITY PROJECTSTEERING COMMITTEE (Chaired by GMD/CEO HLB)
Working Level
SUSTAINABILITYWORKING COMMITTEE Chaired by a member of
the Steering Committee
BOARD RISK MANAGEMENT COMMITTEE
HOW WE APPROACH OUR BUSINESS
Two words encapsulate our approach to business: entrepreneurial and ethical. Our entrepreneurial spirit imbues Hong Leong Bank with a unique dynamism and vigour, and our vision is based on ethical behaviour and considerations.
We have a Code of Conduct and Ethics which we expect everyone at HLB and HLISB to adhere to. All new hires are required to read and understand the code, and a copy of the document is made available on our online Knowledge Portal, which is accessible by all employees. We are currently working on an e-Learning module on our Code of Conduct and Ethics to enhance employees understanding of same.
• Digital Innovation• Customer Experience• Employee Experience • Ethics, Integrity and Compliance• Community Banking
Legend:
Most Important
Very Important
Important
• Fair Banking• Cyber Security and Data Privacy• Responsible Lending• Managing Our Environmental Footprint• Supplier Assessment
Cyber Security and Data Privacy
DigitalInnovation
Customer Experience
Ethics, Integrity and Compliance
Employee Experience
Community Banking
Fair Banking
Responsible LendingSupplier Assessment
Managing Our Environmental
Footprint
Very ImportantImportant Most Important
Significance of EES Impacts
Very
Impo
rtan
tIm
port
ant
Mos
t Im
port
ant
Infl
uen
ce o
n s
take
hol
der
ass
essm
ents
an
d d
ecis
ion
s
SUSTAINABILITY TOPICS IDENTIFIED
OUR MATERIALITY MATRIX
In FY2018, we reviewed our sustainability materiality matrix and the 11 material topics that were identified in FY2017. The committee proposed to consolidate Compliance, Ethics, and Integrity into one topic, "Ethics, Integrity and Compliance" of FY2018 reporting. The recommendation was accepted by project steering committees. The committee then presented the sustainability targets and initiatives to management for further deliberation against the challenges and opportunities facing the Bank.REVIEW
Hong Leong Bank Sustainability Governance Chart FY2018
HOW SUSTAINABILITY IS GOVERNED OUR SUSTAINABILITY APPROACH
SUSTAINAbILITyStateMeNt
70ANNUALRePORT2018
HONG LEONG BANK BERHAD
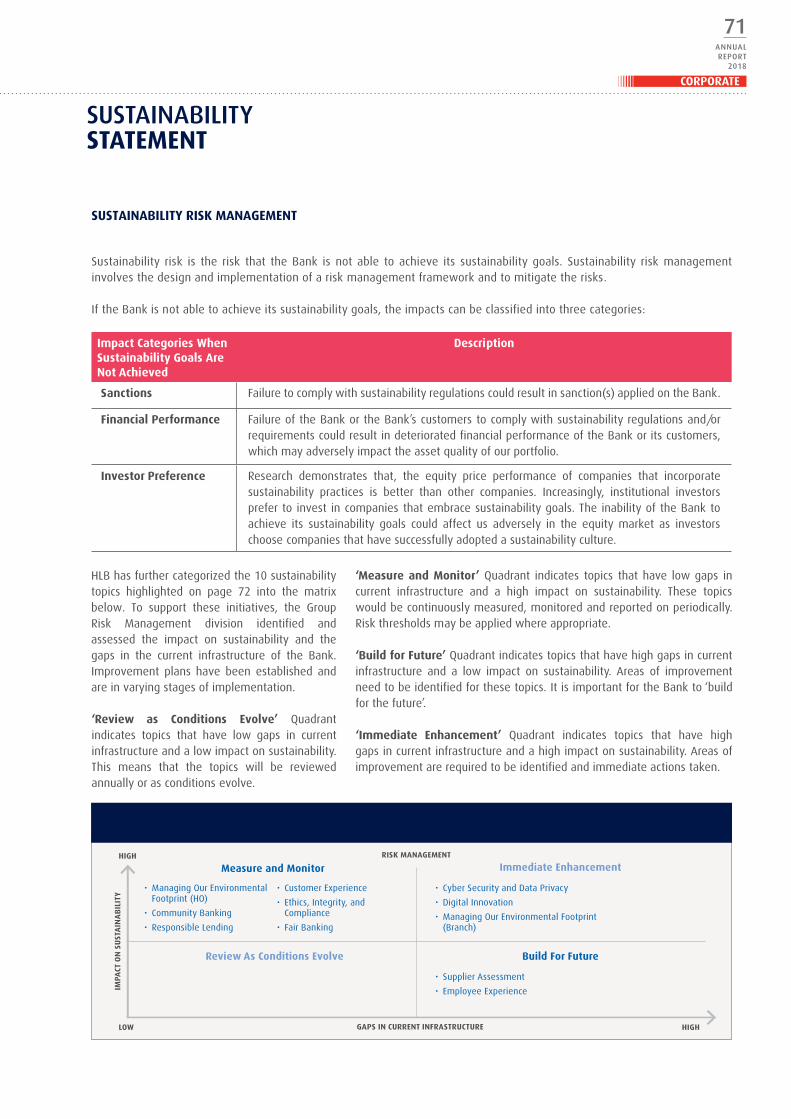
Sustainability risk is the risk that the Bank is not able to achieve its sustainability goals. Sustainability risk management involves the design and implementation of a risk management framework and to mitigate the risks.
If the Bank is not able to achieve its sustainability goals, the impacts can be classified into three categories:
‘Review as Conditions Evolve’ Quadrant indicates topics that have low gaps in current infrastructure and a low impact on sustainability. This means that the topics will be reviewed annually or as conditions evolve.
Impact Categories When Sustainability Goals Are Not Achieved
Description
Sanctions Failure to comply with sustainability regulations could result in sanction(s) applied on the Bank.
Financial Performance Failure of the Bank or the Bank’s customers to comply with sustainability regulations and/or requirements could result in deteriorated financial performance of the Bank or its customers, which may adversely impact the asset quality of our portfolio.
Investor Preference Research demonstrates that, the equity price performance of companies that incorporate sustainability practices is better than other companies. Increasingly, institutional investors prefer to invest in companies that embrace sustainability goals. The inability of the Bank to achieve its sustainability goals could affect us adversely in the equity market as investors choose companies that have successfully adopted a sustainability culture.
‘Measure and Monitor’ Quadrant indicates topics that have low gaps in current infrastructure and a high impact on sustainability. These topics would be continuously measured, monitored and reported on periodically. Risk thresholds may be applied where appropriate.
‘Build for Future’ Quadrant indicates topics that have high gaps in current infrastructure and a low impact on sustainability. Areas of improvement need to be identified for these topics. It is important for the Bank to ‘build for the future’.
‘Immediate Enhancement’ Quadrant indicates topics that have high gaps in current infrastructure and a high impact on sustainability. Areas of improvement are required to be identified and immediate actions taken.
• Managing Our Environmental Footprint (HO)
• Community Banking
• Responsible Lending
• Customer Experience
• Ethics, Integrity, and Compliance
• Fair Banking
• Cyber Security and Data Privacy
• Digital Innovation
• Managing Our Environmental Footprint (Branch)
• Supplier Assessment
• Employee ExperienceIMPA
CT O
N S
UST
AIN
AB
ILIT
Y
LOW HIGH
HIGH
GAPS IN CURRENT INFRASTRUCTURE
RISK MANAGEMENT
Measure and Monitor
Build For FutureReview As Conditions Evolve
Immediate Enhancement
Actionable AreasMeasure, monitor and review
Risk Dashboard
Sustainability TopicsHLB Sustainability Themes
Digital at the core • Customer Experience• Ethics, Integrity and Compliance
Digital at the core • Digital Innovation• Cyber Security and Data Privacy
Fit for future workforce • Employee Experience
Environmentally and socially responsible
• Managing Our Environmental Footprint (Branch)• Supplier Assessment
Fit for future workforce • Ethics, Integrity and Compliance
SME Growth • Community Banking
Environmentally and socially responsible
• Managing Our Environmental Footprint (Head Office)• Responsible lending• Fair Banking• Community Banking
The Bank has allocated resources in these areas and will regularly measure and monitor outcomes. Outcomes will be incorporated into the Risk Dashboard and presented to Management and the Board Risk Management Committee throughout the year.
The Bank acknowledges that these are the areas we need to improve. We have identified and included these in the FY2019 AAM Plan to close the gaps. All actions will be tracked and reported to the Board Risk Management Committee annually.
BOARD RISK MANAGEMENT COMMITTEE
SUSTAINABILITY COMMITTEE*
SUSTAINABILITY WORKING GROUP GROUP RISK MANAGEMENT
BOARD OF DIRECTORS
Monitoring
*The Sustainability Committee meets four times a year to consider sustainability issues.
Top Down
Bottom UpPolicies and Directions
Monitoring and Reporting
Sustainability TopicsHLB Sustainability Themes
HLB has further categorized the 10 sustainability topics highlighted on page 72 into the matrix below. To support these initiatives, the Group Risk Management division identified and assessed the impact on sustainability and the gaps in the current infrastructure of the Bank. Improvement plans have been established and are in varying stages of implementation.
SUSTAINABILITY RISK MANAGEMENT SUSTAINABILITY RISK MANAGEMENT (CONTINUED)
Hong Leong Bank Sustainability Governance Chart FY2019
Affirmative Action Management(“AAM“) Plan
SUSTAINAbILITyStateMeNt
CORPORATE
71ANNUALRePORT
2018

Sustainability risk is the risk that the Bank is not able to achieve its sustainability goals. Sustainability risk management involves the design and implementation of a risk management framework and to mitigate the risks.
If the Bank is not able to achieve its sustainability goals, the impacts can be classified into three categories:
‘Review as Conditions Evolve’ Quadrant indicates topics that have low gaps in current infrastructure and a low impact on sustainability. This means that the topics will be reviewed annually or as conditions evolve.
Impact Categories When Sustainability Goals Are Not Achieved
Description
Sanctions Failure to comply with sustainability regulations could result in sanction(s) applied on the Bank.
Financial Performance Failure of the Bank or the Bank’s customers to comply with sustainability regulations and/or requirements could result in deteriorated financial performance of the Bank or its customers, which may adversely impact the asset quality of our portfolio.
Investor Preference Research demonstrates that, the equity price performance of companies that incorporate sustainability practices is better than other companies. Increasingly, institutional investors prefer to invest in companies that embrace sustainability goals. The inability of the Bank to achieve its sustainability goals could affect us adversely in the equity market as investors choose companies that have successfully adopted a sustainability culture.
‘Measure and Monitor’ Quadrant indicates topics that have low gaps in current infrastructure and a high impact on sustainability. These topics would be continuously measured, monitored and reported on periodically. Risk thresholds may be applied where appropriate.
‘Build for Future’ Quadrant indicates topics that have high gaps in current infrastructure and a low impact on sustainability. Areas of improvement need to be identified for these topics. It is important for the Bank to ‘build for the future’.
‘Immediate Enhancement’ Quadrant indicates topics that have high gaps in current infrastructure and a high impact on sustainability. Areas of improvement are required to be identified and immediate actions taken.
• Managing Our Environmental Footprint (HO)
• Community Banking
• Responsible Lending
• Customer Experience
• Ethics, Integrity, and Compliance
• Fair Banking
• Cyber Security and Data Privacy
• Digital Innovation
• Managing Our Environmental Footprint (Branch)
• Supplier Assessment
• Employee ExperienceIMPA
CT O
N S
UST
AIN
AB
ILIT
Y
LOW HIGH
HIGH
GAPS IN CURRENT INFRASTRUCTURE
RISK MANAGEMENT
Measure and Monitor
Build For FutureReview As Conditions Evolve
Immediate Enhancement
Actionable AreasMeasure, monitor and review
Risk Dashboard
Sustainability TopicsHLB Sustainability Themes
Digital at the core • Customer Experience• Ethics, Integrity and Compliance
Digital at the core • Digital Innovation• Cyber Security and Data Privacy
Fit for future workforce • Employee Experience
Environmentally and socially responsible
• Managing Our Environmental Footprint (Branch)• Supplier Assessment
Fit for future workforce • Ethics, Integrity and Compliance
SME Growth • Community Banking
Environmentally and socially responsible
• Managing Our Environmental Footprint (Head Office)• Responsible lending• Fair Banking• Community Banking
The Bank has allocated resources in these areas and will regularly measure and monitor outcomes. Outcomes will be incorporated into the Risk Dashboard and presented to Management and the Board Risk Management Committee throughout the year.
The Bank acknowledges that these are the areas we need to improve. We have identified and included these in the FY2019 AAM Plan to close the gaps. All actions will be tracked and reported to the Board Risk Management Committee annually.
BOARD RISK MANAGEMENT COMMITTEE
SUSTAINABILITY COMMITTEE*
SUSTAINABILITY WORKING GROUP GROUP RISK MANAGEMENT
BOARD OF DIRECTORS
Monitoring
*The Sustainability Committee meets four times a year to consider sustainability issues.
Top Down
Bottom UpPolicies and Directions
Monitoring and Reporting
Sustainability TopicsHLB Sustainability Themes
HLB has further categorized the 10 sustainability topics highlighted on page 72 into the matrix below. To support these initiatives, the Group Risk Management division identified and assessed the impact on sustainability and the gaps in the current infrastructure of the Bank. Improvement plans have been established and are in varying stages of implementation.
SUSTAINABILITY RISK MANAGEMENT SUSTAINABILITY RISK MANAGEMENT (CONTINUED)
Hong Leong Bank Sustainability Governance Chart FY2019
Affirmative Action Management(“AAM“) Plan
SUSTAINAbILITyStateMeNt
72ANNUALRePORT2018
HONG LEONG BANK BERHAD
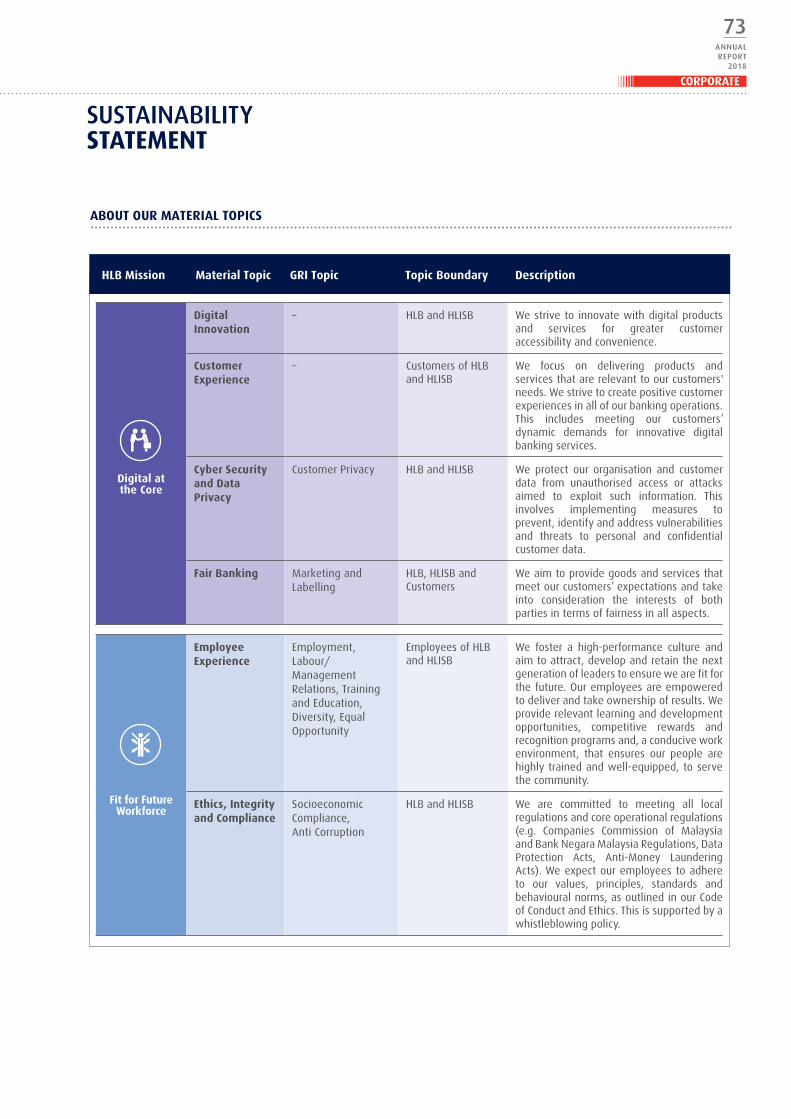
Digital at the Core
Digital Innovation
– HLB and HLISB We strive to innovate with digital products and services for greater customer accessibility and convenience.
Customer Experience
– Customers of HLB and HLISB
We focus on delivering products and services that are relevant to our customers' needs. We strive to create positive customer experiences in all of our banking operations. This includes meeting our customers’ dynamic demands for innovative digital banking services.
Cyber Security and Data Privacy
Customer Privacy HLB and HLISB We protect our organisation and customer data from unauthorised access or attacks aimed to exploit such information. This involves implementing measures to prevent, identify and address vulnerabilities and threats to personal and confidential customer data.
Fair Banking Marketing andLabelling
HLB, HLISB and Customers
We aim to provide goods and services that meet our customers’ expectations and take into consideration the interests of both parties in terms of fairness in all aspects.
Fit for Future Workforce
Employee Experience
Employment, Labour/Management Relations, Training and Education, Diversity, Equal Opportunity
Employees of HLB and HLISB
We foster a high-performance culture and aim to attract, develop and retain the next generation of leaders to ensure we are fit for the future. Our employees are empowered to deliver and take ownership of results. We provide relevant learning and development opportunities, competitive rewards and recognition programs and, a conducive work environment, that ensures our people are highly trained and well-equipped, to serve the community.
Ethics, Integrity and Compliance
Socioeconomic Compliance,Anti Corruption
HLB and HLISB We are committed to meeting all local regulations and core operational regulations (e.g. Companies Commission of Malaysia and Bank Negara Malaysia Regulations, Data Protection Acts, Anti-Money Laundering Acts). We expect our employees to adhere to our values, principles, standards and behavioural norms, as outlined in our Code of Conduct and Ethics. This is supported by a whistleblowing policy.
Environmentally and Socially Responsible
Responsible Lending/Financing
Product Portfolio HLB, HLISB and Customers
We have policies, principles and codes of conduct to ensure the interests of HLB are aligned with the interests of existing and potential customers. These include audits to assess and screen for environmental and social risks, financial health assessments of existing and potential customers, and the provision of basic banking products to those who cannot afford to pay for fees so that they can participate in the financial system.
Managing Our Environmental Footprint
Materials, Energy, Emissions
HLB and HLISB We endeavour to reduce waste (such as paper and water) and use energy efficiently to reduce our greenhouse gas (“GHG”) emissions and carbon footprint at all levels of our operations.
Supplier Assessment
Procurement Practices
HLB, HLISB and Suppliers
SME Growth
Community Banking
Local Communities HLB, HLISB andHong Leong Foundation
We seek to engage and to help local communities develop via programs that have been designed to meet their specific needs.
We have an Independent Tender Review Committee assesses and approves proposals above a certain threshold. This is supported by due diligence reviews of suppliers’ financial strength and performance as well as disaster recovery, business continuity plans and cyber security capabilities. Suppliers have to satisfy our zero tolerance for corruption and unfair practices.
ABOUT OUR MATERIAL TOPICS ABOUT OUR MATERIAL TOPICS (CONTINUED)
Description Topic BoundaryGRI TopicMaterial TopicHLB Mission Description Topic BoundaryGRI TopicMaterial TopicHLB Mission
SUSTAINAbILITyStateMeNt
CORPORATE
73ANNUALRePORT
2018

Digital at the Core
Digital Innovation
– HLB and HLISB We strive to innovate with digital products and services for greater customer accessibility and convenience.
Customer Experience
– Customers of HLB and HLISB
We focus on delivering products and services that are relevant to our customers' needs. We strive to create positive customer experiences in all of our banking operations. This includes meeting our customers’ dynamic demands for innovative digital banking services.
Cyber Security and Data Privacy
Customer Privacy HLB and HLISB We protect our organisation and customer data from unauthorised access or attacks aimed to exploit such information. This involves implementing measures to prevent, identify and address vulnerabilities and threats to personal and confidential customer data.
Fair Banking Marketing andLabelling
HLB, HLISB and Customers
We aim to provide goods and services that meet our customers’ expectations and take into consideration the interests of both parties in terms of fairness in all aspects.
Fit for Future Workforce
Employee Experience
Employment, Labour/Management Relations, Training and Education, Diversity, Equal Opportunity
Employees of HLB and HLISB
We foster a high-performance culture and aim to attract, develop and retain the next generation of leaders to ensure we are fit for the future. Our employees are empowered to deliver and take ownership of results. We provide relevant learning and development opportunities, competitive rewards and recognition programs and, a conducive work environment, that ensures our people are highly trained and well-equipped, to serve the community.
Ethics, Integrity and Compliance
Socioeconomic Compliance,Anti Corruption
HLB and HLISB We are committed to meeting all local regulations and core operational regulations (e.g. Companies Commission of Malaysia and Bank Negara Malaysia Regulations, Data Protection Acts, Anti-Money Laundering Acts). We expect our employees to adhere to our values, principles, standards and behavioural norms, as outlined in our Code of Conduct and Ethics. This is supported by a whistleblowing policy.
Environmentally and Socially Responsible
Responsible Lending/Financing
Product Portfolio HLB, HLISB and Customers
We have policies, principles and codes of conduct to ensure the interests of HLB are aligned with the interests of existing and potential customers. These include audits to assess and screen for environmental and social risks, financial health assessments of existing and potential customers, and the provision of basic banking products to those who cannot afford to pay for fees so that they can participate in the financial system.
Managing Our Environmental Footprint
Materials, Energy, Emissions
HLB and HLISB We endeavour to reduce waste (such as paper and water) and use energy efficiently to reduce our greenhouse gas (“GHG”) emissions and carbon footprint at all levels of our operations.
Supplier Assessment
Procurement Practices
HLB, HLISB and Suppliers
SME Growth
Community Banking
Local Communities HLB, HLISB andHong Leong Foundation
We seek to engage and to help local communities develop via programs that have been designed to meet their specific needs.
We have an Independent Tender Review Committee assesses and approves proposals above a certain threshold. This is supported by due diligence reviews of suppliers’ financial strength and performance as well as disaster recovery, business continuity plans and cyber security capabilities. Suppliers have to satisfy our zero tolerance for corruption and unfair practices.
ABOUT OUR MATERIAL TOPICS ABOUT OUR MATERIAL TOPICS (CONTINUED)
Description Topic BoundaryGRI TopicMaterial TopicHLB Mission Description Topic BoundaryGRI TopicMaterial TopicHLB Mission
SUSTAINAbILITyStateMeNt
74ANNUALRePORT2018
HONG LEONG BANK BERHAD

SDGs relevant to Malaysia and the Financial Services sector1
SDGs relevant to our material topics
Economic
Environmental
Social
Source: PwC SDG Selector Tool
The data analyzed for FY2018 includes information from customers, employees, suppliers, and community development partners collected through various platforms monthly, quarterly, and annually. We analyzed stakeholder feedback and information and identified 10 material topics of interest. Based on our materiality assessment, we then identified the key issues that were of most significance to
HLB stakeholders to prioritize in 2018. Our materiality process takes a long-term approach to aligning the interests of internal and external stakeholders by analyzing factors that contribute to value creation. In the next fiscal year, we will take a step further and consider various sectoral approaches and partnership strategies.
Stakeholder Inclusiveness:
HOW OUR MATERIAL TOPICS RELATE TO THE UN SDGS HOW OUR MATERIAL TOPICS RELATE TO THE UN SDGS
• Goal 10 : Reduced Inequalities• Goal 12 : Responsible Consumption and Production• Goal 13 : Climate Action• Goal 16 : Peace, Justice and Strong Institutions
• Goal 4 : Quality Education• Goal 5 : Gender Equality• Goal 8 : Decent Work and Economic Growth• Goal 9 : Industry, Innovation and Infrastructure
Of the 17 SDGs, we believe we are in a position to make a positive impact on the following eight, and have mapped our performance in the relevant SDGs to Malaysia and the financial services sector.
We recognize it is important to engage regularly with our stakeholders to understand their needs and expectations of us, creating an environment of openness and trust.
102-42
SUSTAINAbILITyStateMeNt
CORPORATE
75ANNUALRePORT
2018

SDGs relevant to Malaysia and the Financial Services sector1
SDGs relevant to our material topics
Economic
Environmental
Social
Source: PwC SDG Selector Tool
The data analyzed for FY2018 includes information from customers, employees, suppliers, and community development partners collected through various platforms monthly, quarterly, and annually. We analyzed stakeholder feedback and information and identified 10 material topics of interest. Based on our materiality assessment, we then identified the key issues that were of most significance to
HLB stakeholders to prioritize in 2018. Our materiality process takes a long-term approach to aligning the interests of internal and external stakeholders by analyzing factors that contribute to value creation. In the next fiscal year, we will take a step further and consider various sectoral approaches and partnership strategies.
Stakeholder Inclusiveness:
HOW OUR MATERIAL TOPICS RELATE TO THE UN SDGS HOW OUR MATERIAL TOPICS RELATE TO THE UN SDGS
• Goal 10 : Reduced Inequalities• Goal 12 : Responsible Consumption and Production• Goal 13 : Climate Action• Goal 16 : Peace, Justice and Strong Institutions
• Goal 4 : Quality Education• Goal 5 : Gender Equality• Goal 8 : Decent Work and Economic Growth• Goal 9 : Industry, Innovation and Infrastructure
Of the 17 SDGs, we believe we are in a position to make a positive impact on the following eight, and have mapped our performance in the relevant SDGs to Malaysia and the financial services sector.
We recognize it is important to engage regularly with our stakeholders to understand their needs and expectations of us, creating an environment of openness and trust.
102-42
SUSTAINAbILITyStateMeNt
76ANNUALRePORT2018
HONG LEONG BANK BERHAD

• Bank-wide Town Hall sessions • Minimum twice yearly
• Social media and career fairs • Minimum twice yearly
•
• Learning and Development discussions • Ongoing
• Scholarship program • Ongoing as per request
• • Based on business unit requirements
• SmartUp • 24/7
• HALI HR Portal • 24/7
Suppliers
• Supplier engagement rating process • Minimum once yearly
• e-Bidding (live auction) • Monthly
• Tender process • Monthly
• Proof of Concept engagements • Based on project. Ongoing
• Annual supplier due diligence review • Annually
• Supplier on-boarding program • Ongoing
• At our branches • Daily
• Self-Service Terminals • 24/7
• Internet and mobile banking • 24/7
• Customer surveys • Daily
• Telephone and email • 24/7
• Social media e.g. HLB Facebook, Twitter, LinkedIn, YouTube
• 24/7
Investors
• Annual General Meetings ("AGMs") • Annually
• Investor roadshows • At least 2 conferences a year
• Meetings with investors and analysts • At least 120 investors and analysts in a year
Community
• SME segment engagement programs• As and when required, according to BNM's
available SME programs
• Corporate Social Responsibility events • Monthly
• Hong Leong Foundation’s programs • Monthly
Regulators
• Bank Negara Malaysia ("BNM") • As and when required
• Bursa Malaysia • As and when required
• Perbadanan Insurans Deposit Malaysia ("PIDM")
• Yearly engagement
• Securities Commission ("SC") • As and when required
• Federation of Investment Managers Malaysia ("FIMM")
• As and when required
• Personal Data Protection Act ("PDPA") Commissioner
• As and when required
• Ombudsman for Financial Services ("OFS") • As and when required
• Media get-togethers • Minimum 2 engagements a year
• Media announcements • Ongoing basis
• Social media
HOW WE ENGAGE WITH OUR STAKEHOLDERS HOW WE ENGAGE WITH OUR STAKEHOLDERS (CONTINUED)
Engagement Channel Frequency of Engagement Engagement Channel Frequency of Engagement
Graduate programs
Goal setting, mid year review and finalyear appraisal supported by IndividualDevelopment Plan discussion
Employees
• Performance appraisal process
• Daily communication
• Financial results: 2 times a year• Products/Services: As and when required• CSR: Min 2 times a year
Media
• Press confrerences
Customers
SUSTAINAbILITyStateMeNt
CORPORATE
77ANNUALRePORT
2018
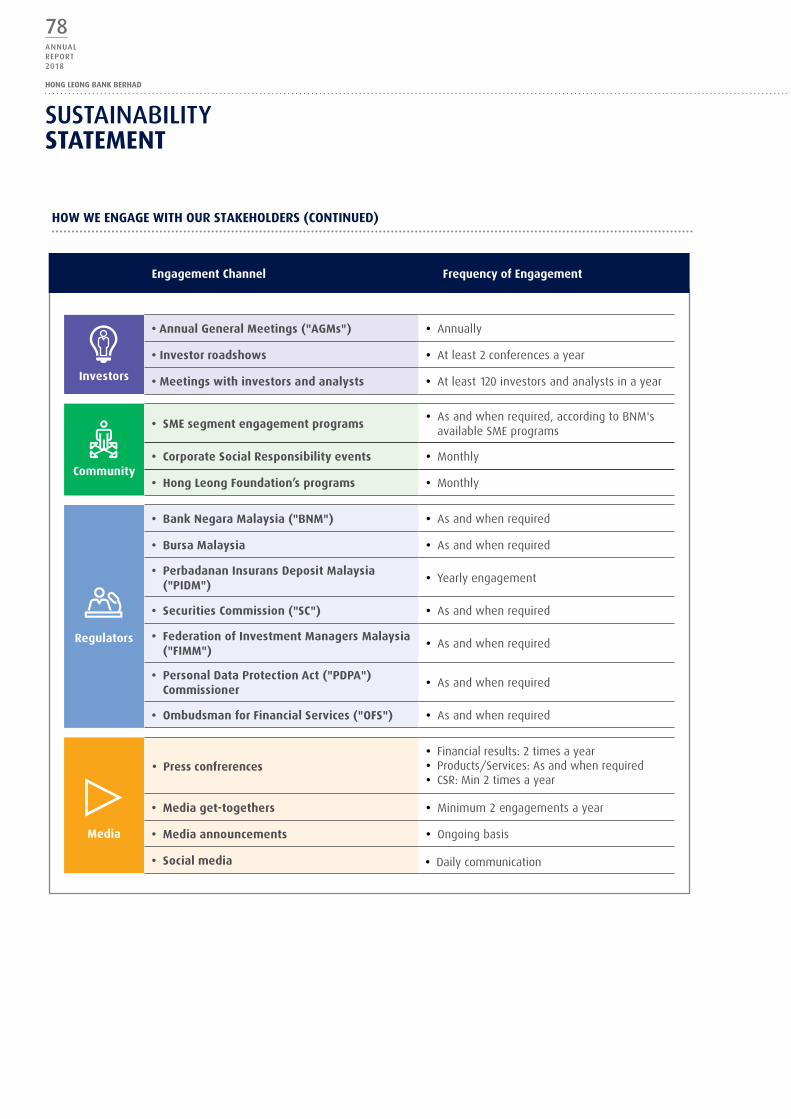
• Bank-wide Town Hall sessions • Minimum twice yearly
• Social media and career fairs • Minimum twice yearly
•
• Learning and Development discussions • Ongoing
• Scholarship program • Ongoing as per request
• • Based on business unit requirements
• SmartUp • 24/7
• HALI HR Portal • 24/7
Suppliers
• Supplier engagement rating process • Minimum once yearly
• e-Bidding (live auction) • Monthly
• Tender process • Monthly
• Proof of Concept engagements • Based on project. Ongoing
• Annual supplier due diligence review • Annually
• Supplier on-boarding program • Ongoing
• At our branches • Daily
• Self-Service Terminals • 24/7
• Internet and mobile banking • 24/7
• Customer surveys • Daily
• Telephone and email • 24/7
• Social media e.g. HLB Facebook, Twitter, LinkedIn, YouTube
• 24/7
Investors
• Annual General Meetings ("AGMs") • Annually
• Investor roadshows • At least 2 conferences a year
• Meetings with investors and analysts • At least 120 investors and analysts in a year
Community
• SME segment engagement programs• As and when required, according to BNM's
available SME programs
• Corporate Social Responsibility events • Monthly
• Hong Leong Foundation’s programs • Monthly
Regulators
• Bank Negara Malaysia ("BNM") • As and when required
• Bursa Malaysia • As and when required
• Perbadanan Insurans Deposit Malaysia ("PIDM")
• Yearly engagement
• Securities Commission ("SC") • As and when required
• Federation of Investment Managers Malaysia ("FIMM")
• As and when required
• Personal Data Protection Act ("PDPA") Commissioner
• As and when required
• Ombudsman for Financial Services ("OFS") • As and when required
• Media get-togethers • Minimum 2 engagements a year
• Media announcements • Ongoing basis
• Social media
HOW WE ENGAGE WITH OUR STAKEHOLDERS HOW WE ENGAGE WITH OUR STAKEHOLDERS (CONTINUED)
Engagement Channel Frequency of Engagement Engagement Channel Frequency of Engagement
Graduate programs
Goal setting, mid year review and finalyear appraisal supported by IndividualDevelopment Plan discussion
Employees
• Performance appraisal process
• Daily communication
• Financial results: 2 times a year• Products/Services: As and when required• CSR: Min 2 times a year
Media
• Press confrerences
Customers
SUSTAINAbILITyStateMeNt
78ANNUALRePORT2018
HONG LEONG BANK BERHAD
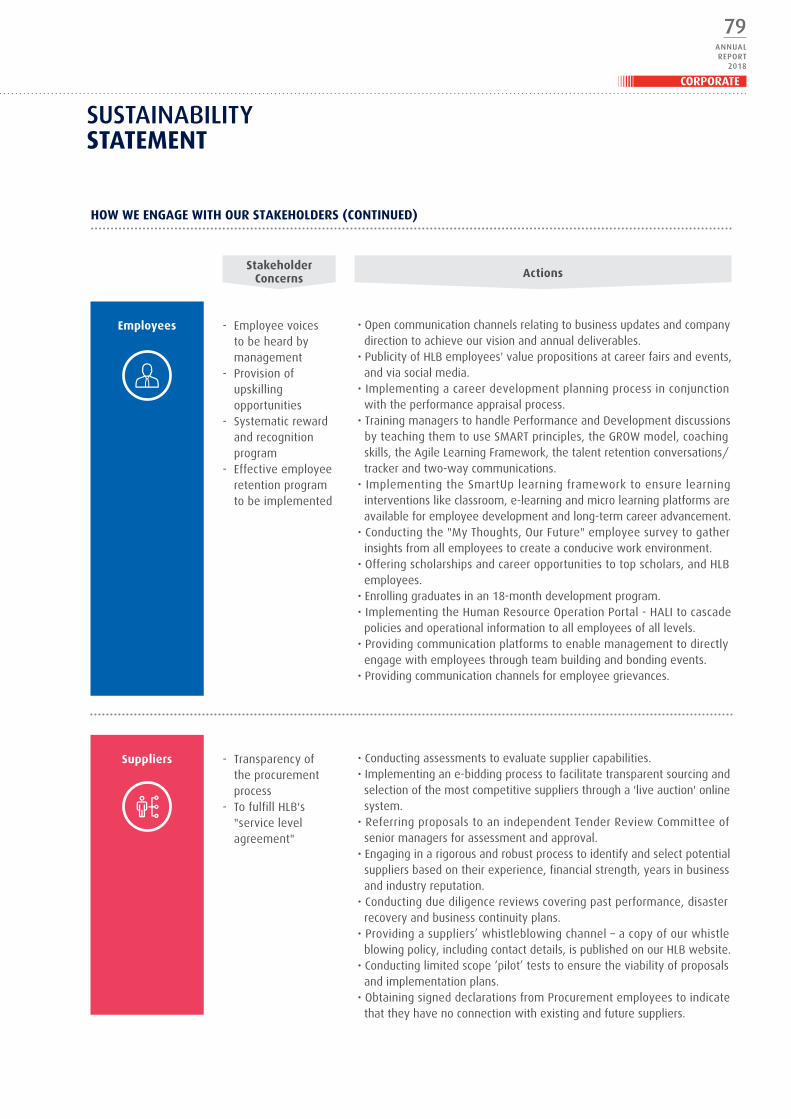
Employees
Suppliers
ActionsStakeholder
Concerns
- Employee voices to be heard by management
- Provision of upskilling opportunities
- Systematic reward and recognition program
- Effective employee retention program to be implemented
- Transparency of the procurement process
- To fulfill HLB's "service level agreement"
Customers
Community
Investors - Enhancement of stakeholders' value
- The stability of the Bank
- The security of savings and deposits
- Accessibility of funds for underserved communities and disaster stricken victims
- Provision of scholarships for underprivileged students
- Personal data protection
- User-friendly systems and easily accessible remote transactions.
ActionsStakeholder
Concerns
• Open communication channels relating to business updates and company direction to achieve our vision and annual deliverables.• Publicity of HLB employees' value propositions at career fairs and events, and via social media.• Implementing a career development planning process in conjunction with the performance appraisal process.• Training managers to handle Performance and Development discussions by teaching them to use SMART principles, the GROW model, coaching skills, the Agile Learning Framework, the talent retention conversations/ tracker and two-way communications. • Implementing the SmartUp learning framework to ensure learning interventions like classroom, e-learning and micro learning platforms are available for employee development and long-term career advancement.• Conducting the "My Thoughts, Our Future" employee survey to gather insights from all employees to create a conducive work environment.• Offering scholarships and career opportunities to top scholars, and HLB employees.• Enrolling graduates in an 18-month development program.• Implementing the Human Resource Operation Portal - HALI to cascade policies and operational information to all employees of all levels. • Providing communication platforms to enable management to directly engage with employees through team building and bonding events. • Providing communication channels for employee grievances.
• Digital (online) initiatives that reduce queueing time.• Surveying cash recycling terminals and relationship managers, to enhance service.• Term loans/financings with a multilevel matrix of interest/profit rates to suit: incomes from RM2k/month; tenures of 2-5 years; and loan/financing amounts from RM5k.• Anti-persistent threat mitigation applied to cyber threats.• Engagement of experts in the Security Operations Center to help protect data security.• Enforcing Personal Data Protection and the Secrecy Policy by imposing severe fines and penalties for employee non-compliance.
• Compliance officers and representatives support a comprehensive assurance and review program.• Constant upgrading of our compliance and cyber security policy to ensure zero customer information leak/theft/loss.• Maintaining an independent Group Compliance function.• Group Internal Audit to conduct independent reviews and assurance.
• Deploying of 150 community banking managers at branches nationwide to serve the SME segment, and increasing the Bank’s coverage five-fold.• Supporting the Shariah-compliant SME Financing Scheme (”SSFS”) by SME Corporation Berhad.• Supporting BNM schemes e.g. Fund for Small and Medium Industries 2 (”FSMI2”) and New Entrepreneurs Fund 2 (”NEF2”).• Supporting CGC schemes e.g. BizJamin and the Green Technology Financing Scheme (”GTFS”).• Educational initiatives such as the scholarship program, after school program, and German Dual Vocational Training.• Community initiatives such as food for the homeless, youth skills training, donations and other forms of aid.• Initiating financial planning and education workshops targeting teenagers and school children.
• Conducting assessments to evaluate supplier capabilities.• Implementing an e-bidding process to facilitate transparent sourcing and selection of the most competitive suppliers through a 'live auction' online system.• Referring proposals to an independent Tender Review Committee of senior managers for assessment and approval.• Engaging in a rigorous and robust process to identify and select potential suppliers based on their experience, financial strength, years in business and industry reputation.• Conducting due diligence reviews covering past performance, disaster recovery and business continuity plans.• Providing a suppliers’ whistleblowing channel – a copy of our whistle blowing policy, including contact details, is published on our HLB website.• Conducting limited scope ‘pilot’ tests to ensure the viability of proposals and implementation plans.• Obtaining signed declarations from Procurement employees to indicate that they have no connection with existing and future suppliers.
HOW WE ENGAGE WITH OUR STAKEHOLDERS (CONTINUED)HOW WE ENGAGE WITH OUR STAKEHOLDERS (CONTINUED)
SUSTAINAbILITyStateMeNt
CORPORATE
79ANNUALRePORT
2018

Employees
Suppliers
ActionsStakeholder
Concerns
- Employee voices to be heard by management
- Provision of upskilling opportunities
- Systematic reward and recognition program
- Effective employee retention program to be implemented
- Transparency of the procurement process
- To fulfill HLB's "service level agreement"
Customers
Community
Investors - Enhancement of stakeholders' value
- The stability of the Bank
- The security of savings and deposits
- Accessibility of funds for underserved communities and disaster stricken victims
- Provision of scholarships for underprivileged students
- Personal data protection
- User-friendly systems and easily accessible remote transactions.
ActionsStakeholder
Concerns
• Open communication channels relating to business updates and company direction to achieve our vision and annual deliverables.• Publicity of HLB employees' value propositions at career fairs and events, and via social media.• Implementing a career development planning process in conjunction with the performance appraisal process.• Training managers to handle Performance and Development discussions by teaching them to use SMART principles, the GROW model, coaching skills, the Agile Learning Framework, the talent retention conversations/ tracker and two-way communications. • Implementing the SmartUp learning framework to ensure learning interventions like classroom, e-learning and micro learning platforms are available for employee development and long-term career advancement.• Conducting the "My Thoughts, Our Future" employee survey to gather insights from all employees to create a conducive work environment.• Offering scholarships and career opportunities to top scholars, and HLB employees.• Enrolling graduates in an 18-month development program.• Implementing the Human Resource Operation Portal - HALI to cascade policies and operational information to all employees of all levels. • Providing communication platforms to enable management to directly engage with employees through team building and bonding events. • Providing communication channels for employee grievances.
• Digital (online) initiatives that reduce queueing time.• Surveying cash recycling terminals and relationship managers, to enhance service.• Term loans/financings with a multilevel matrix of interest/profit rates to suit: incomes from RM2k/month; tenures of 2-5 years; and loan/financing amounts from RM5k.• Anti-persistent threat mitigation applied to cyber threats.• Engagement of experts in the Security Operations Center to help protect data security.• Enforcing Personal Data Protection and the Secrecy Policy by imposing severe fines and penalties for employee non-compliance.
• Compliance officers and representatives support a comprehensive assurance and review program.• Constant upgrading of our compliance and cyber security policy to ensure zero customer information leak/theft/loss.• Maintaining an independent Group Compliance function.• Group Internal Audit to conduct independent reviews and assurance.
• Deploying of 150 community banking managers at branches nationwide to serve the SME segment, and increasing the Bank’s coverage five-fold.• Supporting the Shariah-compliant SME Financing Scheme (”SSFS”) by SME Corporation Berhad.• Supporting BNM schemes e.g. Fund for Small and Medium Industries 2 (”FSMI2”) and New Entrepreneurs Fund 2 (”NEF2”).• Supporting CGC schemes e.g. BizJamin and the Green Technology Financing Scheme (”GTFS”).• Educational initiatives such as the scholarship program, after school program, and German Dual Vocational Training.• Community initiatives such as food for the homeless, youth skills training, donations and other forms of aid.• Initiating financial planning and education workshops targeting teenagers and school children.
• Conducting assessments to evaluate supplier capabilities.• Implementing an e-bidding process to facilitate transparent sourcing and selection of the most competitive suppliers through a 'live auction' online system.• Referring proposals to an independent Tender Review Committee of senior managers for assessment and approval.• Engaging in a rigorous and robust process to identify and select potential suppliers based on their experience, financial strength, years in business and industry reputation.• Conducting due diligence reviews covering past performance, disaster recovery and business continuity plans.• Providing a suppliers’ whistleblowing channel – a copy of our whistle blowing policy, including contact details, is published on our HLB website.• Conducting limited scope ‘pilot’ tests to ensure the viability of proposals and implementation plans.• Obtaining signed declarations from Procurement employees to indicate that they have no connection with existing and future suppliers.
HOW WE ENGAGE WITH OUR STAKEHOLDERS (CONTINUED)HOW WE ENGAGE WITH OUR STAKEHOLDERS (CONTINUED)
SUSTAINAbILITyStateMeNt
80ANNUALRePORT2018
HONG LEONG BANK BERHAD
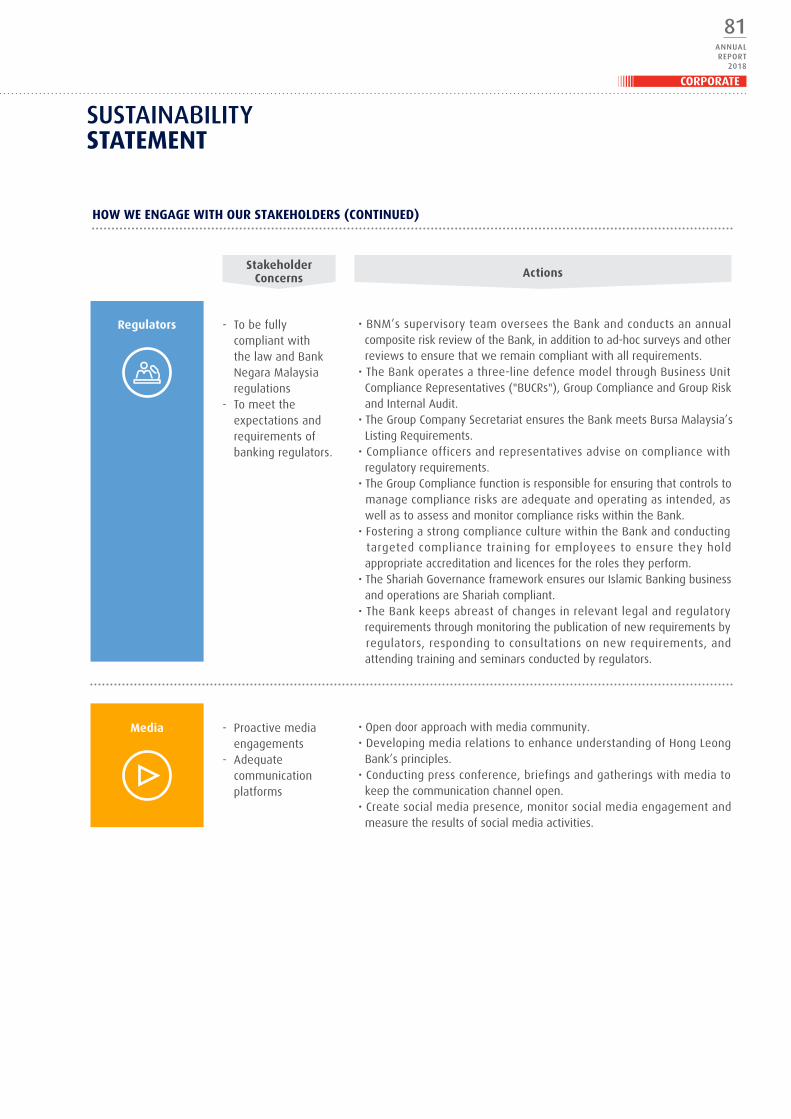
Regulators
Media
- To be fully compliant with the law and Bank Negara Malaysia regulations
- To meet the expectations and requirements of banking regulators.
- Proactive media engagements
- Adequate communication platforms
ActionsStakeholder
Concerns
HOW WE ENGAGE WITH OUR STAKEHOLDERS (CONTINUED)
• BNM’s supervisory team oversees the Bank and conducts an annual composite risk review of the Bank, in addition to ad-hoc surveys and other reviews to ensure that we remain compliant with all requirements.• The Bank operates a three-line defence model through Business Unit Compliance Representatives ("BUCRs"), Group Compliance and Group Risk and Internal Audit.• The Group Company Secretariat ensures the Bank meets Bursa Malaysia’s Listing Requirements.• Compliance officers and representatives advise on compliance with regulatory requirements.• The Group Compliance function is responsible for ensuring that controls to manage compliance risks are adequate and operating as intended, as well as to assess and monitor compliance risks within the Bank.• Fostering a strong compliance culture within the Bank and conducting targeted compliance training for employees to ensure they hold appropriate accreditation and licences for the roles they perform.• The Shariah Governance framework ensures our Islamic Banking business and operations are Shariah compliant. • The Bank keeps abreast of changes in relevant legal and regulatory requirements through monitoring the publication of new requirements by regulators, responding to consultations on new requirements, and attending training and seminars conducted by regulators.
• Open door approach with media community.• Developing media relations to enhance understanding of Hong Leong Bank’s principles.• Conducting press conference, briefings and gatherings with media to keep the communication channel open.• Create social media presence, monitor social media engagement and measure the results of social media activities.
SUSTAINAbILITyStateMeNt
CORPORATE
81ANNUALRePORT
2018

82ANNUALRePORT2018
HONG LEONG BANK BERHAD

cORPORATeINForMatIoN
dIRecTORS
Ybhg tan Sri Quek Leng chan (Chairman)
Mr tan Kong Khoon
Mr Kwek Leng Hai
Ms Lim Lean See
Ms chok Kwee bee
Ybhg Dato’ Nicholas John Lough @ Sharif Lough bin abdullah
Ybhg Datuk Dr Md Hamzah bin Md Kassim
gROUP mANAgINg dIRecTOR/ cHIef execUTIVe OffIceR
Mr Domenic Fuda
gROUP cOmPANy SecReTARy
Ms christine Moh Suat MoiMAICSA7005095
RegISTeRed OffIce
Level30,MenaraHongLeongNo.6,JalanDamanlelaBukitDamansara50490KualaLumpurTel :03-20809888Fax :03-20809801
WebSITe
www.hlb.com.my
AUdITORS
PricewaterhouseCoopersPLT(LLP0014401-LCA&AF1146)CharteredAccountantsLevel10,1SentralJalanRakyatKualaLumpurSentral50706KualaLumpurTel :03-21731188Fax :03-21731288
RegISTRAR
HongLeongShareRegistrationServicesSdnBhdLevel5,WismaHongLeong18JalanPerak50450KualaLumpurTel :03-21641818Fax :03-21643703
CORPORATE
83ANNUALRePORT
2018

1. TolaybeforethemeetingtheauditedfinancialstatementstogetherwiththereportsoftheDirectorsandAuditorsthereonforthefinancialyearended30June2018.
2. Todeclareafinalsingle-tierdividendof32senpershareforthefinancialyearended30June2018tobepaidon22November2018tomembersregisteredintheRecordofDepositorson5November2018.
3. ToapprovethepaymentofDirectors’FeesofRM1,183,959forthefinancialyearended30June2018tobedividedamongsttheDirectorsinsuchmannerastheDirectorsmaydetermineandDirectors’OtherBenefitsofuptoanamountofRM400,000fromthe77thAGMtothe78thAGMoftheBank.
4. Tore-electthefollowingDirectorswhoretirebyrotationpursuanttoClause113oftheBank’sConstitution:
(a) MrKwekLengHai
(b) MsLimLeanSee
5. Tore-appointPricewaterhouseCoopersPLTasAuditorsoftheBankandtoauthorisetheDirectorstofixtheirremuneration.
SpecIaL buSINeSS
Asspecialbusiness,topassthefollowingmotionsasordinaryresolutions:
6. ordinary resolutionauthority to Directors to allot Shares
“tHat subject to theCompaniesAct2016, theMainMarket ListingRequirementsofBursaMalaysiaSecuritiesBerhad(“BursaSecurities”),theBank’sConstitutionandapprovaloftherelevantgovernmentalregulatoryauthorities,ifrequired,theDirectorsbeandareherebyempoweredpursuanttoSections75and76oftheCompaniesAct2016toallotsharesintheBank,grantrightstosubscribeforsharesintheBank,convertanysecurityintosharesintheBank,orallotsharesunderanagreementoroptionorofferatanytimeandfromtimetotime,anduponsuchtermsandconditionsandforsuchpurposesastheDirectorsmay,intheirabsolutediscretion,deemfit,providedthattheaggregatenumberofsharesissuedandallotted, tobesubscribedunderany rightsgranted, tobe issued fromconversionofanysecurity,ortobeissuedandallottedunderanagreementoroptionofoffer,pursuanttothisresolutiondoesnotexceed10%ofthetotalnumberofissuedshares(excludingtreasuryshares)oftheBankforthetimebeingandthattheDirectorsbeandarealsoempoweredtoobtainapprovalforthelistingofandquotationfortheadditionalsharessoallottedonBursaSecuritiesandthatsuchauthorityshallcontinueinforceuntiltheconclusionofthenextAnnualGeneralMeetingoftheBank.”
NotIce IS HerebY GIVeNthattheSeventy-SeventhAnnualGeneralMeeting(“AGM”)ofHongLeongBankBerhad(“Bank”)willbeheldat theAuditorium,GroundFloor,MenaraHongLeong,No.6,JalanDamanlela,BukitDamansara,50490KualaLumpuronMonday,29October2018at10:30a.m.inorder:
(resolution 1)
(resolution 2)
(resolution 3)
(resolution 4)
(resolution 5)
(resolution 6)
NOTIce OfaNNuaL GeNeraL MeetING
84ANNUALRePORT2018
HONG LEONG BANK BERHAD

7. ordinary resolutionproposed renewal of Shareholders’ Mandate for recurrent related party transactions of a revenue or trading Nature with Hong Leong company (Malaysia) berhad (“HLcM”) and persons connected with HLcM
“tHatapprovalbeand isherebygivenfor theBankand/or itssubsidiariestoenter intoanyof thetransactions falling within the types of recurrent related party transactions of a revenue or tradingnatureasdisclosedinSection2.3(A)and(B)oftheBank’sCirculartoShareholdersdated28September2018(“theCircular”)withHLCMandpersonsconnectedwithHLCM(“HongLeongGroup”),assetoutinAppendixIIoftheCircularprovidedthatsuchtransactionsareundertakenintheordinarycourseofbusiness,onarm’slengthbasisandoncommercialtermswhicharenotmorefavourabletotheHongLeongGroupthanthosegenerallyavailabletoand/orfromthepublicandarenot,intheBank’sopinion,detrimentaltotheminorityshareholders;
aND tHatsuchapprovalshallcontinuetobeinforceuntil:
(a) theconclusionofthenextAnnualGeneralMeeting(“AGM”)oftheBankatwhichtimeitwilllapse,unlessbyaresolutionpassedatthemeeting,theauthorityisrenewed;or
(b) theexpirationoftheperiodwithinwhichthenextAGMoftheBankafterthatdateisrequiredtobeheldpursuanttoSection340(2)oftheCompaniesAct2016(butshallnotextendtosuchextensionasmaybeallowedpursuanttoSection340(4)oftheCompaniesAct2016);or
(c) revokedorvariedbyresolutionpassedbytheshareholdersingeneralmeeting,
whicheveristheearlier;
aND tHattheDirectorsoftheBankbeandareherebyauthorisedtocompleteandtodoallsuchactsandthings(includingexecutingallsuchdocumentsasmayberequired)astheymayconsiderexpedientornecessarytogiveeffecttothetransactionscontemplatedand/orauthorisedbythisordinaryresolution.”
8. Toconsideranyotherbusinessofwhichduenoticeshallhavebeengiven.
FurtHer NotIce IS HerebY GIVeNthatadepositorshallqualifyforentitlementtothefinaldividendonlyinrespectof:
(a) shares transferred into the depositor’s securities account before 4:00 p.m. on 5 November 2018 inrespectofordinarytransfers;and
(b) shares bought on Bursa Securities on a cum entitlement basis according to the Rules of the BursaSecurities.
ByOrderoftheBoard
cHrIStINe MoH Suat MoI(MAICSA7005095)GroupCompanySecretary
KualaLumpur28September2018
(resolution 7)
NOTIce OfaNNuaL GeNeraL MeetING
CORPORATE
85ANNUALRePORT
2018
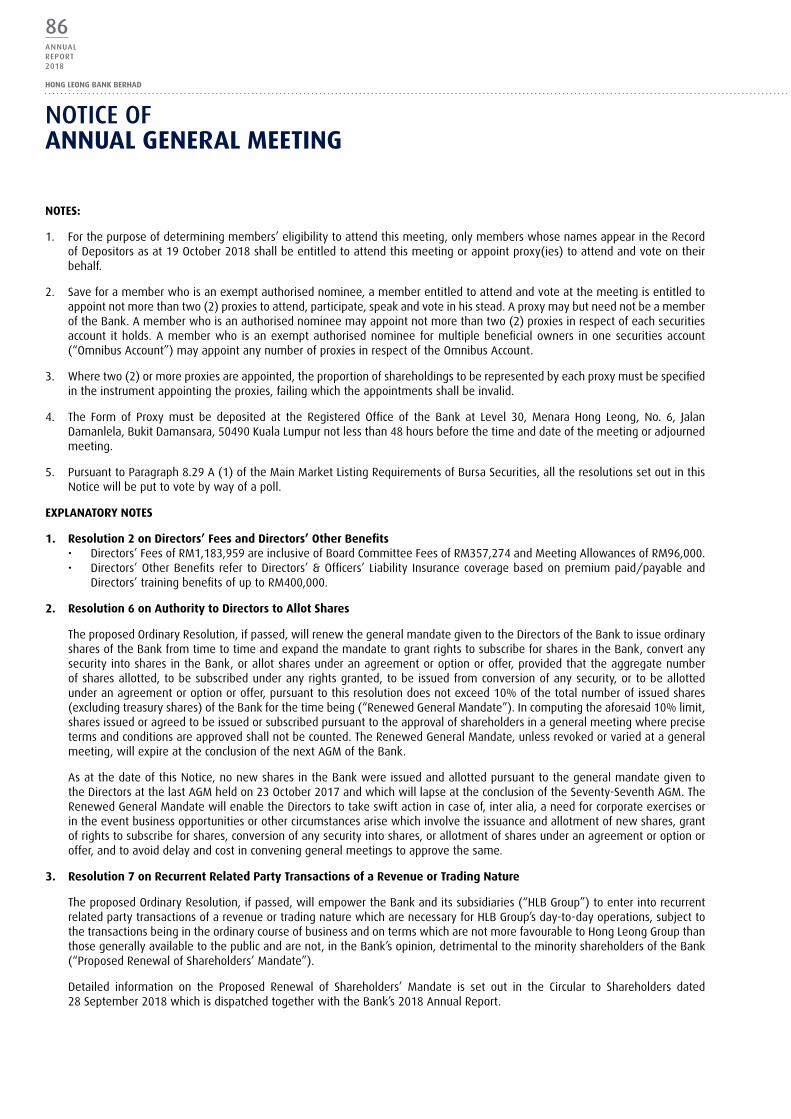
NoteS:
1. Forthepurposeofdeterminingmembers’eligibilitytoattendthismeeting,onlymemberswhosenamesappearintheRecordofDepositorsasat19October2018shallbeentitledtoattendthismeetingorappointproxy(ies)toattendandvoteontheirbehalf.
2. Saveforamemberwhoisanexemptauthorisednominee,amemberentitledtoattendandvoteatthemeetingisentitledtoappointnotmorethantwo(2)proxiestoattend,participate,speakandvoteinhisstead.AproxymaybutneednotbeamemberoftheBank.Amemberwhoisanauthorisednomineemayappointnotmorethantwo(2)proxiesinrespectofeachsecuritiesaccount itholds.Amemberwho isanexemptauthorisednominee formultiplebeneficialowners inonesecuritiesaccount(“OmnibusAccount”)mayappointanynumberofproxiesinrespectoftheOmnibusAccount.
3. Wheretwo(2)ormoreproxiesareappointed,theproportionofshareholdingstoberepresentedbyeachproxymustbespecifiedintheinstrumentappointingtheproxies,failingwhichtheappointmentsshallbeinvalid.
4. The Form of Proxy must be deposited at the Registered Office of the Bank at Level 30, Menara Hong Leong, No. 6, JalanDamanlela,BukitDamansara,50490KualaLumpurnotlessthan48hoursbeforethetimeanddateofthemeetingoradjournedmeeting.
5. PursuanttoParagraph8.29A(1)oftheMainMarketListingRequirementsofBursaSecurities,alltheresolutionssetoutinthisNoticewillbeputtovotebywayofapoll.
eXpLaNatorY NoteS
1. resolution 2 on Directors’ Fees and Directors’ other benefits• Directors’FeesofRM1,183,959areinclusiveofBoardCommitteeFeesofRM357,274andMeetingAllowancesofRM96,000.• Directors’OtherBenefits refer toDirectors’&Officers’Liability Insurancecoveragebasedonpremiumpaid/payableand
Directors’trainingbenefitsofuptoRM400,000.
2. resolution 6 on authority to Directors to allot Shares
TheproposedOrdinaryResolution,ifpassed,willrenewthegeneralmandategiventotheDirectorsoftheBanktoissueordinarysharesoftheBankfromtimetotimeandexpandthemandatetograntrightstosubscribeforsharesintheBank,convertanysecurityintosharesintheBank,orallotsharesunderanagreementoroptionoroffer,providedthattheaggregatenumberofsharesallotted,tobesubscribedunderanyrightsgranted,tobeissuedfromconversionofanysecurity,ortobeallottedunderanagreementoroptionoroffer,pursuanttothisresolutiondoesnotexceed10%ofthetotalnumberofissuedshares(excludingtreasuryshares)oftheBankforthetimebeing(“RenewedGeneralMandate”).Incomputingtheaforesaid10%limit,sharesissuedoragreedtobeissuedorsubscribedpursuanttotheapprovalofshareholdersinageneralmeetingwhereprecisetermsandconditionsareapprovedshallnotbecounted.TheRenewedGeneralMandate,unlessrevokedorvariedatageneralmeeting,willexpireattheconclusionofthenextAGMoftheBank.
AsatthedateofthisNotice,nonewsharesintheBankwereissuedandallottedpursuanttothegeneralmandategiventotheDirectorsatthelastAGMheldon23October2017andwhichwilllapseattheconclusionoftheSeventy-SeventhAGM.TheRenewedGeneralMandatewillenabletheDirectorstotakeswiftactionincaseof,interalia,aneedforcorporateexercisesorintheeventbusinessopportunitiesorothercircumstancesarisewhichinvolvetheissuanceandallotmentofnewshares,grantofrightstosubscribeforshares,conversionofanysecurityintoshares,orallotmentofsharesunderanagreementoroptionoroffer,andtoavoiddelayandcostinconveninggeneralmeetingstoapprovethesame.
3. resolution 7 on recurrent related party transactions of a revenue or trading Nature
TheproposedOrdinaryResolution,ifpassed,willempowertheBankanditssubsidiaries(“HLBGroup”)toenterintorecurrentrelatedpartytransactionsofarevenueortradingnaturewhicharenecessaryforHLBGroup’sday-to-dayoperations,subjecttothetransactionsbeingintheordinarycourseofbusinessandontermswhicharenotmorefavourabletoHongLeongGroupthanthosegenerallyavailabletothepublicandarenot,intheBank’sopinion,detrimentaltotheminorityshareholdersoftheBank(“ProposedRenewalofShareholders’Mandate”).
Detailed information on the Proposed Renewal of Shareholders’ Mandate is set out in the Circular to Shareholders dated28September2018whichisdispatchedtogetherwiththeBank’s2018AnnualReport.
NOTIce OfaNNuaL GeNeraL MeetING
86ANNUALRePORT2018
HoNG LeoNG baNK berHaD
• Details of individuals who are standing for election as Directors
NoindividualisseekingelectionasaDirectorattheforthcomingSeventy-SeventhAnnualGeneralMeetingoftheBank.
• Statement relating to general mandate for issue of securities in accordance with paragraph 6.03(3) of the Main Market Listing requirements of bursa Securities
DetailsofthegeneralmandatetoissuesecuritiesintheBankpursuanttoSections75and76oftheCompaniesAct2016aresetoutinExplanatoryNote2oftheNoticeofSeventy-SeventhAnnualGeneralMeeting.
STATemeNT AccOmPANyINgNotIce oF aNNuaL GeNeraL MeetING(PURSUANT TO PARAgRAPH 8.27(2) Of THe mAIN mARkeT LISTINg ReqUIRemeNTS Of bURSA SecURITIeS)
corporate
87ANNUALRePORT
2018
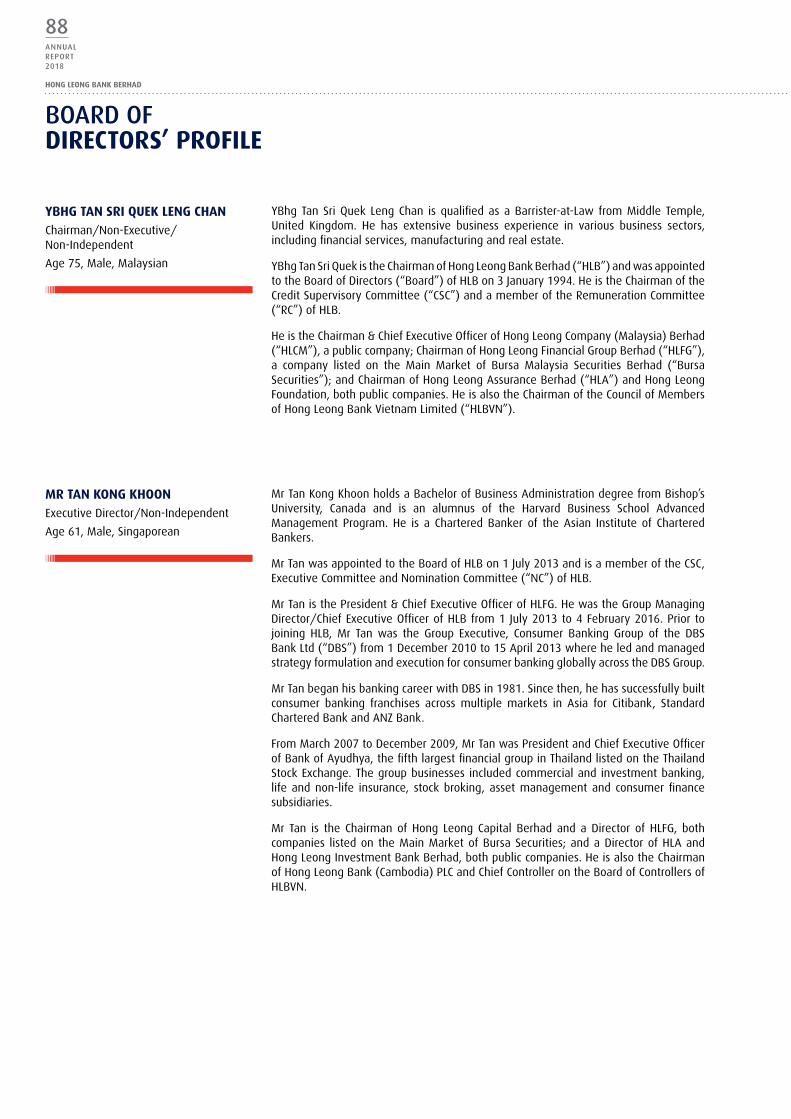
bOARd OfDIrectorS’ proFILe
YbHG taN SrI QueK LeNG cHaNChairman/Non-Executive/Non-Independent
Age75,Male,Malaysian
Mr taN KoNG KHooNExecutiveDirector/Non-Independent
Age61,Male,Singaporean
YBhgTanSriQuek LengChan isqualifiedasaBarrister-at-Law fromMiddle Temple,united Kingdom. He has extensive business experience in various business sectors,includingfinancialservices,manufacturingandrealestate.
YBhgTanSriQuekistheChairmanofHongLeongBankBerhad(“HLB”)andwasappointedtotheBoardofDirectors(“Board”)ofHLBon3January1994.HeistheChairmanoftheCreditSupervisoryCommittee(“CSC”)andamemberoftheRemunerationCommittee(“RC”)ofHLB.
HeistheChairman&ChiefExecutiveOfficerofHongLeongCompany(Malaysia)Berhad(“HLCM”),apubliccompany;ChairmanofHongLeongFinancialGroupBerhad(“HLFG”),a company listed on the Main Market of Bursa Malaysia Securities Berhad (“BursaSecurities”);andChairmanofHongLeongAssuranceBerhad(“HLA”)andHongLeongFoundation,bothpubliccompanies.HeisalsotheChairmanoftheCouncilofMembersofHongLeongBankVietnamLimited(“HLBVN”).
MrTanKongKhoonholdsaBachelorofBusinessAdministrationdegreefromBishop’suniversity, Canada and is an alumnus of the Harvard Business School AdvancedManagement Program.He is a CharteredBanker of theAsian Institute of CharteredBankers.
MrTanwasappointedtotheBoardofHLBon1July2013andisamemberoftheCSC,ExecutiveCommitteeandNominationCommittee(“NC”)ofHLB.
MrTanisthePresident&ChiefExecutiveOfficerofHLFG.HewastheGroupManagingDirector/ChiefExecutiveOfficerofHLBfrom1July2013to4February2016.Priortojoining HLB, Mr Tan was the Group Executive, Consumer Banking Group of the DBSBankLtd(“DBS”)from1December2010to15April2013whereheledandmanagedstrategyformulationandexecutionforconsumerbankinggloballyacrosstheDBSGroup.
MrTanbeganhisbankingcareerwithDBSin1981.Sincethen,hehassuccessfullybuiltconsumer banking franchises across multiple markets in Asia for Citibank, StandardCharteredBankandANZBank.
FromMarch2007toDecember2009,MrTanwasPresidentandChiefExecutiveOfficerofBankofAyudhya,thefifthlargestfinancialgroupinThailandlistedontheThailandStockExchange.Thegroupbusinesses includedcommercialandinvestmentbanking,lifeandnon-life insurance, stockbroking, assetmanagementand consumerfinancesubsidiaries.
Mr Tan is the ChairmanofHong Leong Capital Berhad and aDirector ofHLFG, bothcompanies listedon theMainMarketofBursaSecurities;andaDirectorofHLAandHongLeongInvestmentBankBerhad,bothpubliccompanies.HeisalsotheChairmanofHongLeongBank(Cambodia)PLCandChiefControllerontheBoardofControllersofHLBVN.
88ANNUALRePORT2018
HONG LEONG BANK BERHAD
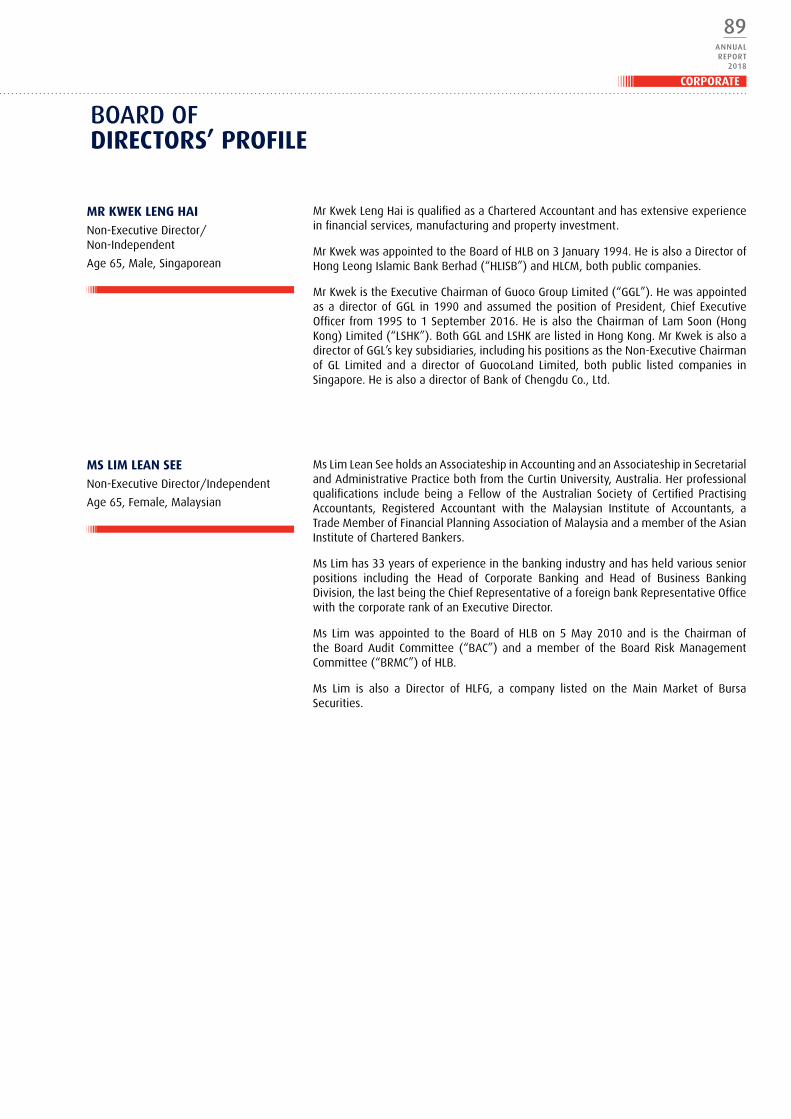
bOARd OfDIrectorS’ proFILe
Mr KWeK LeNG HaINon-ExecutiveDirector/Non-Independent
Age65,Male,Singaporean
MS LIM LeaN See Non-ExecutiveDirector/Independent
Age65,Female,Malaysian
MrKwekLengHaiisqualifiedasaCharteredAccountantandhasextensiveexperienceinfinancialservices,manufacturingandpropertyinvestment.
MrKwekwasappointedtotheBoardofHLBon3January1994.HeisalsoaDirectorofHongLeongIslamicBankBerhad(“HLISB”)andHLCM,bothpubliccompanies.
MrKwekistheExecutiveChairmanofGuocoGroupLimited(“GGL”).HewasappointedasadirectorofGGL in1990andassumed thepositionofPresident,ChiefExecutiveOfficerfrom1995to1September2016.HeisalsotheChairmanofLamSoon(HongKong)Limited(“LSHK”).BothGGLandLSHKarelistedinHongKong.MrKwekisalsoadirectorofGGL’skeysubsidiaries,includinghispositionsastheNon-ExecutiveChairmanof GL Limited and a director of GuocoLand Limited, both public listed companies inSingapore.HeisalsoadirectorofBankofChengduCo.,Ltd.
MsLimLeanSeeholdsanAssociateshipinAccountingandanAssociateshipinSecretarialandAdministrativePracticebothfromtheCurtinuniversity,Australia.Herprofessionalqualifications include being a Fellow of the Australian Society of Certified PractisingAccountants, Registered Accountant with the Malaysian Institute of Accountants, aTradeMemberofFinancialPlanningAssociationofMalaysiaandamemberoftheAsianInstituteofCharteredBankers.
MsLimhas33yearsofexperienceinthebankingindustryandhasheldvariousseniorpositions including the Head of Corporate Banking and Head of Business BankingDivision,thelastbeingtheChiefRepresentativeofaforeignbankRepresentativeOfficewiththecorporaterankofanExecutiveDirector.
Ms Limwasappointed to theBoardofHLBon5May2010and is theChairmanoftheBoardAudit Committee (“BAC”) and amember of theBoard RiskManagementCommittee(“BRMC”)ofHLB.
Ms Lim is also a Director of HLFG, a company listed on the Main Market of BursaSecurities.
CORPORATE
89ANNUALRePORT
2018

YbHG Dato’ NIcHoLaS JoHN LouGH @ SHarIF LouGH bIN abDuLLaHNon-ExecutiveDirector/Independent
Age66,Male,BritishandMalaysianPermanentResident
YBhg Dato’ Nicholas John Lough @ Sharif Lough bin Abdullah holds a GemmologyDiplomafromTheNationalAssociationofGoldsmiths,London,GreatBritainand isaFellowmemberofTheGemmologicalAssociationofGreatBritain.
YBhgDato’NicholasLoughhasextensiveexperience in thecorporatesector,servingin various capacities, includingGroup ExecutiveDirector of TheMelewar CorporationBerhadfrom1987to1995.
YBhgDato’NicholasLoughiscurrentlyaDirectorofGLMREITManagementSdnBhd,theManagerofTowerRealEstateInvestmentTrustandScicom(MSC)Berhad,bothlistedontheMainMarketofBursaSecurities.
YBhgDato’NicholasLoughwasappointedtotheBoardofHLBon23June2014andistheChairmanoftheBRMCandRC,andamemberoftheBACandNCofHLB.
MS cHoK KWee bee Non-ExecutiveDirector/Independent
Age66,Female,Malaysian
MsChokKweeBeeholdsaBachelorofArts(Honours)degreeinBusinessStudiesfromKingston university, united Kingdom and is also a member of the Associate of theCharteredInstituteofBankers,unitedKingdom.
MsChokispresentlytheManagingDirectorofTeakCapitalSdnBhd,aventurecapitalmanagement company and a Principal of Intres Capital Partners Sdn Bhd. Prior tothat, shewaswithWalden International,aSiliconValleybasedventurecapitalfirm,overseeingtheoperationsandinvestmentsofWaldenInternationalandBIWaldeninMalaysia.MsChokwasalsopreviouslyHeadoftheCorporateFinanceatAmInvestmentBank Berhad. She previously held posts as a member of the Securities CommissionCapitalMarketAdvisory Council, theChairmanof theMalaysianVentureCapital andPrivate Equity Association, a Non-Executive Board Member of the Audit OversightBoardandalsoamemberoftheMalaysianVentureCapitalDevelopmentCounciloftheSecuritiesCommission.
Ms Chok is currently the Chairman of Aemulus Holdings Berhad, a public company.She isalsoaNon-ExecutiveBoardMemberofMIMOSTechnologySolutionsSdnBhd,a wholly-owned subsidiary of MIMOS Berhad. She also sits on the board of severalportfoliocompanies.
MsChokwasappointedtotheBoardofHLBon2December2013andistheChairmanoftheNCandamemberoftheBACandBRMCofHLB.
bOARd OfDIrectorS’ proFILe
90ANNUALRePORT2018
HONG LEONG BANK BERHAD

YbHG DatuK Dr MD HaMzaH bIN MD KaSSIMNon-ExecutiveDirector/Independent
Age69,Male,Malaysian
YBhgDatukDrMdHamzahbinMdKassimholdsaPhDinBusinessfromAstonuniversity,unitedKingdomandaMasterinBusinessAdministration.Hewasinductedin2012intotheAlumniHallofAchievementofMonmouthCollegeinIllinois.
YBhg Datuk Dr Md Hamzah specialises in large scale institutional and businesstransformation, working across several sectors with established organisationsranging frombanks to telecommunicationcompanies,public institutionsand foreigngovernments.HeistheCo-founder/GroupManagingDirectorofiAGroupestablishedin2002,specialisinginbusinessandpublicsectortransformation,technologyandhumancapitalwithofficesinMalaysiaandJakarta.
PriortotheiAGroup,hewastheExecutiveDirector/Partneroftheinternationalfirm,Ernst&Young,VicePresidentandCountryHeadoftheglobalconsultingfirm,CapGeminiandmemberoftheglobalmanagementteamandCountryHeadofPAConsultingGroup.
Priortojoiningtheconsultingindustryin1995,YBhgDatukDrMdHamzahheldvariousseniorpositionsinthegovernment.Forover18years,heservedinthefieldofindustrialR&Dmanagementandpublicpolicyon technologydevelopmentand innovation.Healsoservedasamemberofexpert/advisorygroupsinvariousnationalandinternationalorganisationssuchasunitedNationsConferenceonTradeandDevelopmentandIslamicDevelopmentBank,Jeddah.HewastheProjectDirectorfortheIndustrialTechnologyMaster Plan for Malaysia in the Institute of Strategic and International Studies andsubsequentlytookupthepositionasDirectorofScienceandTechnology,MinistryofScience,TechnologyandEnvironmenttospearheadtheimplementationoftheplanaspartofthenationalstrategiestoaccelerategrowthandtechnologydevelopment.
In2006,YBhgDatukDrMdHamzahwasappointedas theconsultingadvisor to theNational Implementation Task Force to oversee the 9th Malaysia Development Planandin2009,hewasappointedasmemberoftheNationalEconomicAdvisoryCouncil.YBhgDatukDrMdHamzahwasamemberoftheReviewandOperationalPaneltotheMalaysianAnti-CorruptionCommissionfrom2013toFebruary2015.In2015,hewasappointedasmemberoftheAnti-CorruptionAdvisoryBoard.
YBhg Datuk Dr Md Hamzah is currently a board member of university KebangsaanMalaysiaandChairmanofHeriotWattuniversityMalaysia.
YBhgDatukDrMdHamzahwasappointedtotheBoardofHLBon19May2016andisamemberoftheRCofHLB.
YBhgDatukDrMdHamzahisalsotheBoardChairmanofHLISB,apubliccompany.
Notes:
1. FamilyRelationshipwithDirectorand/orMajorShareholderYBhg Tan Sri Quek Leng Chan and Mr Kwek Leng Hai are brothers. Save as disclosed herein, none of the Directors has any family relationship with any other Director and/or major shareholder of HLB.
2. ConflictofInterestNone of the Directors has any conflict of interest with HLB.
3. ConvictionofOffencesNone of the Directors has been convicted of any offences (excluding traffic offences) in the past 5 years and there were no public sanctions or penalties imposed by the relevant regulatory bodies during the financial year ended 30 June 2018.
4. AttendanceofDirectorsDetails of Board meeting attendance of each Director are disclosed in the Statement on Corporate Governance Overview, Risk Management and Internal Control in the Annual Report.
bOARd OfDIrectorS’ proFILe
CORPORATE
91ANNUALRePORT
2018
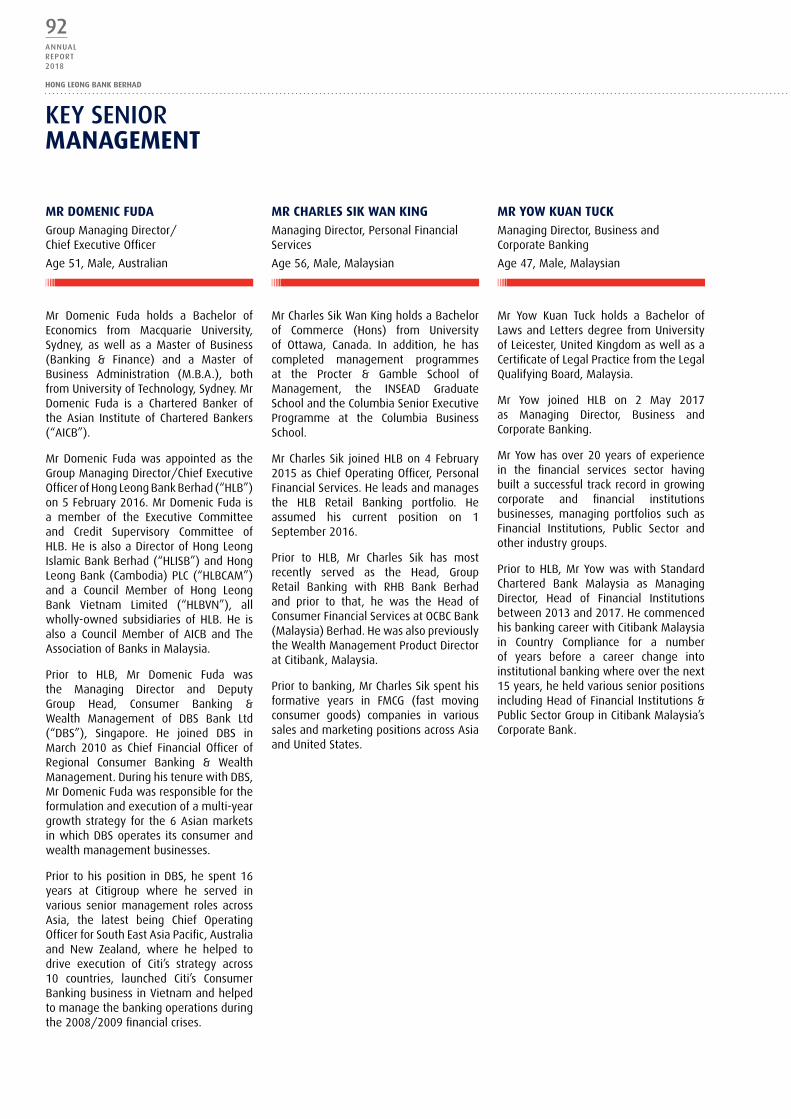
key SeNIOR MaNaGeMeNt
Mr DoMeNIc FuDaGroupManagingDirector/ChiefExecutiveOfficer
Age51,Male,Australian
Mr Domenic Fuda holds a Bachelor ofEconomics from Macquarie university,Sydney, aswell as aMaster ofBusiness(Banking & Finance) and a Master ofBusiness Administration (M.B.A.), bothfromuniversityofTechnology,Sydney.MrDomenic Fuda is a Chartered Banker ofthe Asian Institute of Chartered Bankers(“AICB”).
MrDomenic Fudawas appointedas theGroupManagingDirector/ChiefExecutiveOfficerofHongLeongBankBerhad(“HLB”)on5February2016.MrDomenicFudaisa member of the Executive Committeeand Credit Supervisory Committee ofHLB.HeisalsoaDirectorofHongLeongIslamicBankBerhad(“HLISB”)andHongLeongBank(Cambodia)PLC(“HLBCAM”)and a Council Member of Hong LeongBank Vietnam Limited (“HLBVN”), allwholly-owned subsidiaries ofHLB.He isalso a Council Member of AICB and TheAssociationofBanksinMalaysia.
Prior to HLB, Mr Domenic Fuda wasthe Managing Director and DeputyGroup Head, Consumer Banking &Wealth Management of DBS Bank Ltd(“DBS”), Singapore. He joined DBS inMarch 2010 as Chief Financial Officer ofRegional Consumer Banking & WealthManagement.DuringhistenurewithDBS,MrDomenicFudawasresponsiblefortheformulationandexecutionofamulti-yeargrowthstrategy for the6AsianmarketsinwhichDBSoperates itsconsumerandwealthmanagementbusinesses.
Prior tohisposition inDBS,hespent16years at Citigroup where he served invarious seniormanagement roles acrossAsia, the latest being Chief OperatingOfficerforSouthEastAsiaPacific,Australiaand New Zealand, where he helped todrive execution of Citi’s strategy across10 countries, launched Citi’s ConsumerBankingbusinessinVietnamandhelpedtomanagethebankingoperationsduringthe2008/2009financialcrises.
Mr cHarLeS SIK WaN KING ManagingDirector,PersonalFinancialServices
Age56,Male,Malaysian
MrCharlesSikWanKingholdsaBachelorof Commerce (Hons) from universityof Ottawa, Canada. In addition, he hascompleted management programmesat the Procter & Gamble School ofManagement, the INSEAD GraduateSchoolandtheColumbiaSeniorExecutiveProgramme at the Columbia BusinessSchool.
MrCharlesSik joinedHLBon4February2015asChiefOperatingOfficer,PersonalFinancialServices.Heleadsandmanagesthe HLB Retail Banking portfolio. Heassumed his current position on 1September2016.
Prior to HLB, Mr Charles Sik has mostrecently served as the Head, GroupRetail Banking with RHB Bank Berhadand prior to that, he was the Head ofConsumerFinancialServicesatOCBCBank(Malaysia)Berhad.HewasalsopreviouslytheWealthManagementProductDirectoratCitibank,Malaysia.
Priortobanking,MrCharlesSikspenthisformative years in FMCG (fast movingconsumer goods) companies in varioussalesandmarketingpositionsacrossAsiaandunitedStates.
Mr YoW KuaN tucK ManagingDirector,BusinessandCorporateBanking
Age47,Male,Malaysian
Mr Yow Kuan Tuck holds a Bachelor ofLawsandLettersdegreefromuniversityofLeicester,unitedKingdomaswellasaCertificateofLegalPracticefromtheLegalQualifyingBoard,Malaysia.
Mr Yow joined HLB on 2 May 2017as Managing Director, Business andCorporateBanking.
MrYowhasover20yearsofexperiencein the financial services sector havingbuiltasuccessfultrackrecordingrowingcorporate and financial institutionsbusinesses, managing portfolios such asFinancial Institutions, Public Sector andotherindustrygroups.
Prior toHLB,MrYowwaswithStandardChartered Bank Malaysia as ManagingDirector, Head of Financial Institutionsbetween2013and2017.HecommencedhisbankingcareerwithCitibankMalaysiain Country Compliance for a numberof years before a career change intoinstitutionalbankingwhereoverthenext15years,heheldvariousseniorpositionsincludingHeadofFinancialInstitutions&PublicSectorGroupinCitibankMalaysia’sCorporateBank.
92ANNUALRePORT2018
HONG LEONG BANK BERHAD

key SeNIOR MaNaGeMeNt
eNcIK JaSaNI bIN abDuLLaH ChiefExecutiveOfficer,HLISB,awholly-ownedsubsidiaryofHLB
Age58,Male,Malaysian
Encik Jasani bin Abdullah holds a PostGraduate Diploma in Islamic Banking& Finance from International Islamicuniversity, Malaysia; a Bachelor degreein Business Administration from Ohiouniversity,uSA;andaDiploma inPublicAdministration from MARA Institute ofTechnology.
Encik Jasani joined HLISB in June 2007as Assistant General Manager and waspromoted to Chief Operating Officer ofHLISBinJune2010.HewasappointedtheChiefExecutiveOfficerofHLISBon17July2017.
Encik Jasani has more than 30 years’working experience in the bankingindustrywiththelast18yearsinIslamicfinance.
Prior to HLISB, Encik Jasani spent morethan20yearsinvariousseniorpositionsinRHBBankBerhadandRHBIslamicBankBerhad, his last position being the VicePresident, Head-Product DevelopmentDivision.
Mr Hor KWoK WaI ManagingDirector,GlobalMarkets
Age44,Male,Malaysian
Mr Hor Kwok Wai holds a Bachelor ofScience in Actuarial Mathematics andStatistics from Heriot-Watt university,unitedKingdom.
He joined HLB in January 2011 as ChiefOperating Officer of Global Markets.He assumed his current position on 1September2016.
PriortoHLB,MrHorwasHeadofGlobalMarkets for The Royal Bank of ScotlandMalaysia where he spent seven yearsworking in various roles. Prior to that,hehadworkedforseveralmajorforeignbanksinMalaysiasuchasJPMorganChaseBank,StandardCharteredBankandOCBCBankinvariousroles.
MS FooNG pIK Yee ChiefFinancialOfficer
Age59,Female,Malaysian
MsFoongPikYeeisaqualifiedcharteredaccountantfromtheInstituteofCharteredAccountantsinAustraliaandNewZealand.SheholdsaBachelorofCommercefromuniversity of Melbourne and a MasterofBusinessAdministration fromMonashuniversity,Australia.
MsFoongjoinedHLBon18January2013asChiefFinancialOfficerofHLB.
She has over 30 years of experience atstrategicandtacticallevelsinthebankingsector across Asia and Middle Eastmarkets, includingMalaysia,HongKong,Singapore,AustraliaandtheMiddleEast.She brings a distinctive mix of financialmanagement, corporate finance andinvestor relations, strategy and servicequality skills in delivering strategicgrowthambitionsandestablishingrobustgovernance frameworks for financialinstitutions.
Prior to joining HLB, Ms Foong waswith Standard Chartered Bank (“SCB”)whereherrolesincludedbeingtheChiefExecutive Officer and Managing DirectorofSCBLebanon,a subsidiaryofSCBPlc,ChiefFinancialOfficerofSCBMalaysiaaswellasChiefOperatingOfficer,WholesaleBank at SCB Malaysia. She has alsoworkedinANZBank,HSBCandJPMorganinAustralia.
SheisamemberoftheBusinessAdvisoryCouncilattheBusinessSchoolofMonashuniversity Malaysia and a member ofthe Women In Leadership group, a jointcollaboration between Talentcorp andICAEW.
Ms Foong is a director of HLF Credit(Perak) Bhd and Promilia Berhad, bothwholly-ownedsubsidiariesofHLB.
CORPORATE
93ANNUALRePORT
2018

Mr JaSoN WoNG HoN LurNManagingDirector&ChiefExecutive,HLBSingaporeBranch
Age55,Male,Malaysian
MrJasonWongHonLurnholdsanExecutiveMaster of Business Administration fromHelsinkiSchoolofEconomicsandBusinessAdministration and possesses graduatediplomasinTechno-EntrepreneurshipandElectronicBusinessprograms.HeobtainedhisfirstdegreeinEconomics.
MrJasonWongjoinedHLBon1November2016 as Chief Executive, HLB SingaporeBranch.
Prior to HLB, Mr Jason Wong was theformer Chief Executive of RHB BankSingapore for the past 7 years. He hasmorethan28yearsofhands-onbankingexperience in running key businessoperations in treasury, corporate andcommercial banking and consumerbankingbusinessesinSingapore.Hehasvery good knowledge of both Malaysiaand Singapore banking markets, havingspent his first 12 years working withdifferentfinancialinstitutionsinMalaysiaand subsequently 16 years with RHBBankSingapore.
Mr aaroN Ho WaI cHooNGManagingDirector,ChinaOperations
Age63,Male,Malaysian
MrAaronHoWaiChoongholdsaBachelorof Engineering (Hons) from universityof Malaya and a Master of BusinessAdministration from university ofRochester,uSA.
MrAaronHojoinedHLBon7April2008asChiefOperatingOfficerofInternationalBanking of HLB China. He assumed hiscurrentpositionon1September2016.HewasappointedViceChairmanofBankofChengduCo., Ltd (anassociate companyofHLB)sinceJuly2008.HeisalsotheViceChairmanof Sichuan JinChengConsumerFinance Company (a joint venturecompanyofHLB),apositionheassumedsinceFebruary2010.
Mr Aaron Ho has more than 30 years’experience in the banking and financialservices industry. Prior to HLB, he hadheld various managerial positions suchas Manager of Operations/Credit ofAmerican Express (Malaysia), GeneralManagerofMBfCardServices(Malaysia),Senior Manager/Head of RHB BankCard Center (Malaysia), Vice President,OperationsandTechnologyofMasterCardInternational(Singapore),VicePresident/SeniorCountryOperationsOfficer,CitibankMalaysiaandCitibankTaiwanaswellasGeneral Manager/Director of CiticorpSoftware and Technology Services(Shanghai)LtdunderCitiGroupChina.
Mr JoSepH FarruGIaManagingDirector&ChiefExecutiveOfficer,HLBCAM,awholly-ownedsubsidiaryofHLB
Age55,Male,Australian
Mr Joseph Farrugia undertook andcompletedacourseinMarketingStrategyat the Melbourne Business School,Australia.
Mr Joseph Farrugia joined HLB on 30July 2012 as Chief Executive Officer ofHLBCAM.
Prior to HLB, he was the Head of RetailBanking and Wealth Management, ANZBankVietnam&GreaterMekongRegion,whichincorporatesCambodiaandLaos.
key SeNIOR MaNaGeMeNt
94ANNUALRePORT2018
HONG LEONG BANK BERHAD

Mr DuoNG Duc HuNGManagingDirector&GeneralDirector,HLBVN,awholly-ownedsubsidiaryofHLB
Age42,Male,Vietnamese
Mr Duong Duc Hung holds a Master ofBusiness Administration from Katholiekeuniversiteit Leuven, Belgium and aBachelorofArtsinInternationalEconomicsatForeignTradeuniversity.
Mr Duong joined HLBVN on 2 January2018 as Managing Director & GeneralDirectorofHLBVN.
PriortoHLBVN,MrDuongbringsmorethan20yearsofbankingandfinancialservicesexperience,withhismostrecentroleasamemberofTechcombank’sManagementCommittee as Transformation Director.Prior to that, he has been with ANZVietnamformorethan10years,holdingvarious key portfolios in Product,Performance Management, WealthManagement,Sales&Servicesbeforehewasappointed tohead theentireRetailBankingandOperations.
He is well versed in regional andinternational business practices, havingserved in world class organisationssuchasJPMorganChaseastheHeadofFinancialInstitutionssegmentforVietnamand Cambodia. He was also with HSBCheading the CashManagement division.He also was the Financial Controller inBaxter Healthcare and Auditor in KPMG,bothinVietnamandabroad.
MS MarGaret LeuNG ManagingDirector&ChiefExecutive,HLBHongKongBranch
Age57,Female,HongKong,SAR
Ms Margaret Leung is a CharteredAccountantofTheCharteredProfessionalAccountantsofOntario,CanadaandalsoafellowmemberoftheHongKongInstituteof Certified Public Accountants. Shegraduated from theuniversityofMcGill,Canada with Bachelor of Commercedegree.
Ms Margaret Leung joined HLB in 2016andwasappointedastheChiefExecutivefor HLB Hong Kong Branch since 1 June2016.
Ms Margaret Leung has over 20 yearsof Corporate and Institutional bankingexperience across Asia and differentsegments. Prior to joining HLB, MsMargaret Leung has held various seniorregional positions at international bankssuch as JPMorgan, Standard CharteredBankandANZBank.
Notes:
1. FamilyRelationshipwithDirectorand/orMajorShareholderNone of the Key Senior Management has any family relationship with any Director and/or major shareholder of HLB.
2. ConflictofInterestNone of the Key Senior Management has any conflict of interest with HLB.
3. ConvictionofOffencesNone of the Key Senior Management has been convicted of any offences (excluding traffic offences) in the past 5 years and there were no public sanctions or penalties imposed by the relevant regulatory bodies during the financial year ended 30 June 2018.
key SeNIOR MaNaGeMeNt
CORPORATE
95ANNUALRePORT
2018

bOARd AUdITcoMMIttee report
coNStItutIoN
TheBoardAuditCommitteeofHongLeongBankBerhad(“HLB”or“theBank”)hasbeenestablishedsince18August1994andwas re-designated as the Board Audit & Risk ManagementCommittee (“BARMC”) on 10 January 2002. Subsequently, on2October2006, theBoardofDirectorsdecidedtoreconstitutetheBoardAuditCommittee(“BAC”)separatelyfromtheBoardRiskManagementCommittee(“BRMC”).
coMpoSItIoN
Ms Lim Lean See(Chairman, Independent Non-Executive Director)
Ybhg Dato’ Nicholas John Lough @ Sharif Lough bin abdullah(Independent Non-Executive Director)
Ms chok Kwee bee(Independent Non-Executive Director)(Appointed with effect from 14 August 2018)
Ybhg Datuk Wira azhar bin abdul Hamid(Independent Non-Executive Director)(Retired on 14 May 2018)
SecretarY
TheSecretary(ies)totheBACis/aretheCompanySecretary(ies)oftheBank.
terMS oF reFereNce
ThetermsofreferenceoftheBACarepublishedontheBank’swebsite(‘www.hlb.com.my’)
autHorItY
The BAC is authorised by the Board to review any activity oftheGroupwithinitsTermsofReference.Itisauthorisedtoseekany information it requires from any Director or member ofmanagementandallemployeesaredirectedtoco-operatewithanyrequestmadebytheBAC.
TheBACisauthorisedbytheBoardtoobtainindependentlegalorotherprofessionaladviceifitconsidersnecessary.
MeetINGS
The BAC meets at least eight (8) times a year and additionalmeetingsmaybecalledatanytimeasandwhennecessary.Allmeetings to review thequarterly reports and annual financialstatementsareheldpriortosuchquarterlyreportsandannualfinancialstatementsbeingpresentedtotheBoardforapproval.
The Group Managing Director/Chief Executive Officer, ChiefFinancialOfficer,ChiefRiskOfficer,Chief InternalAuditor,ChiefCompliance Officer, other senior management and externalauditorsmaybeinvitedtoattendtheBACmeetingswheneverrequired. At least twice a year, the BAC will have separatesessions with the external auditors without the presence ofExecutiveDirectorsandmanagement.
TheBACwillalsoengageprivatelywiththeChiefInternalAuditoronaregularbasistoprovidetheopportunityfortheChiefInternalAuditortodiscussissuesfacedbytheinternalauditfunction.
Issuesraised,discussions,deliberations,decisionsandconclusionsmadeattheBACmeetingsarerecordedintheminutesoftheBAC meetings. A BAC member who has, directly or indirectly,an interest in a material transaction or material arrangementshall not be present at the BAC meeting where the materialtransactionormaterialarrangementisbeingdeliberatedbytheBAC.
Two(2)membersoftheBAC,whoshallbeindependent,shallconstituteaquorumandthemajorityofmemberspresentmustbeindependentdirectors.
After each meeting, the BAC shall report and update theBoard on significant issues and concerns discussed during theBAC meetings and where appropriate, make the necessaryrecommendationstotheBoard.
actIVItIeS
TheBAC carriedout its duties in accordancewith its TermsofReference.
During the financial year ended 30 June 2018, nine (9) BACmeetingswereheldand theattendanceof theBACmemberswasasfollows:
Members attendance
MsLimLeanSee 9/9
YBhgDato’NicholasJohnLough@SharifLoughbinAbdullah 9/9
YBhgDatukWiraAzharbinAbdulHamid(1) 8/8
Note:(1) Ceased as BAC member with effect from 14 May 2018.
MsChokKweeBeewasappointedtotheBACafterthefinancialyearended30June2018.
96ANNUALRePORT2018
HONG LEONG BANK BERHAD

bOARd AUdITcoMMIttee report
HoW tHe bac DIScHarGeS ItS reSpoNSIbILItIeS
Financial reporting
TheBACreviewedthequarterlyreportsandfinancialstatementsoftheCompanyandoftheGroupfocusingparticularlyon:
(i) anychangesinaccountingpoliciesandpractices;
(ii) significantadjustmentsarisingfromtheaudit;
(iii) thegoingconcernassumptions;and
(iv) compliance with accounting standards and other legalrequirements.
BAC also reviewed with Management the progress updatereports, replies to the surveys conducted by Bank NegaraMalaysiaandtheMFRS9ModelvalidationreportinrelationtotheGroup’simpendingadoptionofMFRS9inFY2019.
The legal and regulatory environment was monitored andconsideration given to changes in law, regulation, accountingpolicies and practices including financial reporting standardsin thepipelineaswell as the reviseddisclosure requirementspursuant to the amendments to the Main Market ListingRequirementsofBursaMalaysiaSecuritiesBerhad.
external audit
TheexternalauditorsoftheGroupforthefinancialyearended30 June2018 is PricewaterhouseCoopers PLT (“PwCPLT”). TheBACdiscussedandreviewedwiththeexternalauditors,beforetheauditcommencesforthefinancialyear:
(i) the audit plan and timetable for the financial audit oftheGroupincludingthefocusareasandapproachtothecurrent financial year’s audit and any significant issuesthatcanbeforeseen,eitherasaresultofthepastyear’sexperienceordue tonewaccountingstandardsorotherchangesinstatutoryorlistingrequirements;and
(ii) the methodology and timetable of the Statement onInternalControlandRiskManagement.
TheBACreviewedthereportandauditfindingsoftheexternalauditors and considered management’s responses to theexternal auditors’ audit findings and investigations. The BACalsohadthree(3)separatesessionswiththeexternalauditorswithout the presence of ExecutiveDirectors and managementwhereby matters discussed include key reservations noted bytheexternalauditorsduringthecourseoftheiraudit;whilsttheBACChairmanmaintainedregularcontactwiththeauditpartnerthroughouttheyear.
The BAC reviewed the external auditors’ fees and their scopeof services. The approved and incurred fees for the financialyearended30 June2018amountedtoRM4,109,791ofwhichRM602,928 was payable in respect of non-audit services.Non-auditservicesaccountedfor25%ofthetotalfeespayable.The BAC assessed the objectivity and independence of theexternal auditors prior to the appointment of the externalauditorsforad-hocnon-auditservices.
The BAC also evaluated the performance of PwC PLT in thefollowingareasinrelationtoitsre-appointmentasauditorsforthefinancialyearended30June2018andconsideredPwCPLTtobeindependent.
(a) levelofknowledge,capabilities,experienceandqualityofpreviouswork;
(b) levelofengagementwithBAC;
(c) ability to provide constructive observations, implicationsand recommendations in areas which requireimprovements;
(d) adequacyinauditcoverage,effectivenessinplanningandconductofaudit;
(e) ability to perform the audit work within the agreedtimeframe;
(f) non-auditservicesrenderedbyPwCPLTdoesnotimpedeindependence;
(g) abilitytodemonstrateunbiasedstancewheninterpretingthestandards/policiesadoptedbyHLB;and
(h) riskoffamiliarityinrespectofPwCPLT’sappointmentasexternalauditors.
PwCPLT,inaccordancewithprofessionalethicalstandards,hasprovided theBACwith confirmationof their independence forthedurationofthefinancialyearended30June2018andthemeasuresusedtocontrolthequalityoftheirwork.
The BAC has therefore recommended to the Board that PwCPLTbere-appointedastheauditors.ResolutionconcerningthereappointmentofPwCPLTwillbeproposedtoshareholdersatthe2018AnnualGeneralMeeting.
CORPORATE
97ANNUALRePORT
2018

related parties transactions
The BAC conducted quarterly review of the recurrent relatedpartytransactions(“RRPT”)enteredintobytheGrouptoensurethatsuchtransactionsareundertakenoncommercialtermsandontermsnotmorefavourabletotherelatedpartiesthanthosegenerallyavailabletoand/orfromthepublic.
The Group had put in place the procedures and processes tothe RRPT are conducted on commercial terms consistent withtheGroup’susualbusinesspracticesandpoliciesandontermsnotmorefavourabletotherelatedpartiesthanthosegenerallyavailabletoand/orfromthepublic,whereapplicable.
The BAC reviewed the said procedures and processes on anannualbasisandasandwhenrequired,toensurethatthesaidproceduresareadequatetomonitor,trackandidentifyRRPTinatimelyandorderlymanner,andaresufficienttoensurethattheRRPTwill be carriedout on commercial terms consistentwiththeGroup’susualbusinesspracticesandpoliciesandontermsnotmorefavourabletotherelatedpartiesthanthosegenerallyavailabletoand/orfromthepublic.
credit transactions and exposure with connected parties
The Group is guided by the Guidelines on Credit Transactionsand Exposures with Connected Parties to ensure that credittransactionswithconnectedpartiesarecarriedoutonanarm’slength basis on terms and conditions not more favourablethanthoseentered intowithothercounterpartieswithsimilarcircumstancesandcreditworthiness.
TheBAChadconductedquarterlyreviewofcredittransactionsoftheGroupwithconnectedpartiestoensurecompliancewiththesaidGuidelines.
Internal audit
TheBACreviewedtheadequacyofinternalauditscope,internalauditplanandresourcesofthevariousinternalauditfunctionswithinGroupInternalAuditDivision(“GIAD”).
During thefinancial year,BACnoted thatGIADhadeffectivelycarriedoutinternalauditstoallbusinessentitiesoftheGroup,andreviewedtheGIAD’sreportsontheauditsperformedontheGroupassetoutintheInternalAuditFunctionsectionbelow.
TheBAChasreviewedtheauditfindingsandrecommendationsof the GIAD, including any findings of internal investigations,and has ensured that management has taken the necessarycorrective actions in a timely manner to address controlweaknesses,non-compliancewithlaws,regulatoryrequirementsandpolicies.TheBACalsoreviewedateveryBACmeetingthestatusupdateofmanagement’scorrectiveactionplans for theresolution of internal audit’s findings and recommendations.RecommendationsweremadebyBAC toensure that the rootcauses raised by GIAD in their audit reports were effectivelyresolvedandthatanyoutstandingauditfindingsbetrackedfortimelyresolution.
Group INterNaL auDIt DIVISIoN (“GIaD”)
TheGIADofHLBassiststheBACinthedischargeofitsdutiesandresponsibilities.GIADemploysarisk-basedassessmentapproachinauditingtheBank’sGroupbusinessandoperationalactivities.Thehighriskactivitiesaregivendueattentionandauditedonamoreregularbasiswhiletherestareprioritizedtopotentialriskexposureandimpact.
Duringthefinancialyearended30June2018,GIADcarriedoutitsdutiescoveringauditonoperations,informationtechnologysystem,credit,headoffice,branches,businesscentre,mortgagesales centre, loan centre, investigation andother assignmentsasdirected. Theseaudits areperformed in linewith theBNMGuidelinesonInternalAuditFunction.
BesidesperforminginternalauditfunctionstotheBankGroup,it also through a service agreement, provides internal auditservices toHongLeongCapitalBerhad,HongLeongAssuranceBerhad, Hong Leong MSIG Takaful Berhad and HL FundManagementSdn.Bhd.ThecostincurredfortheInternalAuditfunction of the Bank in respect of the financial year ended30June2018wasRM12.721million.
ThisBACReportismadeinaccordancewiththeresolutionoftheBoardofDirectors.
bOARd AUdITcoMMIttee report
98ANNUALRePORT2018
HONG LEONG BANK BERHAD
bOARd RISk mANAgemeNTcoMMIttee (brMc) report
coNStItutIoN
TheBoardRiskManagementCommittee(“BRMC”)isestablishedtosupporttheBoardindischargingthefollowingresponsibilities:
1. Oversee management’s implementation of theCompany’s governance framework and internal controlframework/policies.
2. Overseethatmanagementmeetstheexpectationsonriskmanagementas set out in thepolicydocumentonRiskGovernance.
3. Oversee management’s implementation of complianceriskmanagement.
4. Promotetheadoptionofthesoundcorporategovernanceprinciples set out in the Policy Document on CorporateGovernance within the Bank and its subsidiaries(“theGroup”).
composition
TheBRMCshouldcompriseofonlynon-executivedirectorswithatleastthree(3)members.TheBRMCshouldbechairedbyanindependentdirector.
SecretarY
The Secretariat to the BRMC is the Group Risk Management(“GRM”)oftheBank.
terMS oF reFereNce
risk Management
1. Toreviewmanagement’sactivitiesinmanagingprincipalrisks such as credit, market, liquidity, operational,compliance,ITrisks,cyberriskandtheriskmanagementprocess.
2. To review management’s reporting to the Board onmeasurestakento:
a) Identify and examine principal risks faced by theCompany.
b) Implementappropriatesystemsandinternalcontrolstomanagetheserisks.
3. To review management’s major risk managementstrategies, policies and risk tolerance for Board’sapproval.
4. To review management’s overall framework on theInternalCapitalAdequacyAssessmentProcess(“ICAAP”),annual risk appetite and Capital Management Plan forBoard’sapproval.
5. To review management’s development and effectiveimplementationoftheICAAP.
6. To review management’s stress testing governanceincludingtheevaluationonthecapitalstresstestscenarios,parameters,keyassumptionsandresults.
7. Toreviewmanagement’speriodicreportsonriskappetite,riskexposure,riskportfoliocomposition,stresstestingandriskmanagementactivities.
8. Toreviewtheadequacyandeffectivenessofmanagement’sinternalcontrolsandriskmanagementprocess.
9. Toreviewtheadequacyofriskmanagementpoliciesandframeworks in identifying, measuring, monitoring andcontrollingriskandtheextenttowhichtheseareoperatingeffectively.
10. To review risk management function’s infrastructure,resourcesandsystemsand that thestaff responsible forimplementing risk management systems perform thosedutiesindependentlyoftheGroup’srisktakingactivities.
11. To receive reports from pertinent managementcommittees.
12. To review management’s implementation of riskmanagementassetoutinBNM’spolicydocumentsonRiskGovernance, Approaches to Regulating and SupervisingFinancialGroupandCorporateGovernance.
13. Toreviewandadviseontheappointment,remuneration,removalandredeploymentoftheChiefRiskOfficer.
14. To engage privately with Chief Risk Officer on a regularbasis(andinanycaseatleasttwiceannually)toprovideopportunityfortheChiefRiskOfficertodiscussissuesfacedbytheriskmanagementfunction.
15. To review management’s implementation of theremunerationsystemonwhether incentivesprovidedbythe remuneration system take into consideration risks,capital,liquidityandthelikelihoodandtimingofearnings,withoutprejudicetothetasksoftheBoardRemunerationCommittee.
16. OtherriskmanagementfunctionsasmaybeagreedbytheBRMCandtheBoard.
CORPORATE
99ANNUALRePORT
2018

compliance
1. ToassisttheBoardintheoversightofthemanagementofcomplianceriskby:
a) reviewing compliance policies and overseeingmanagement’simplementationofthesame;
b) reviewing the establishment of the compliancefunction and the position of the Chief ComplianceOfficer to ensure the compliance function andChief Compliance Officer has appropriate standing,authorityandindependence;
c) discussing and deliberating compliance issuesregularly and ensuring such issues are resolvedeffectivelyandexpeditiously;
d) reviewing annually the effectiveness of theCompany’s overall management of compliancerisk, having regard to the assessments of seniormanagement and internal audit and interactionswiththeChiefComplianceOfficer;
e) updating the Board on all compliance matters,includingprovidingitsviewson(a)to(d)above.
2. In relation to the role of the Chief Compliance Officer,support the Board in meeting the expectations oncompliance management as set out in BNM’s policydocumentonComplianceby:
a) reviewing and advising on the appointment,remuneration, removal and redeployment of theChiefComplianceOfficer;
b) ensuringthatChiefComplianceOfficerhassufficientstaturetoallowforeffectiveengagementwiththeChiefExecutiveOfficerandothermembersofseniormanagement;
c) engagingprivatelywiththeChiefComplianceOfficeron a regular basis (and in any case at least twiceannually) to provide the opportunity for the ChiefCompliance Officer to discuss issues faced by thecompliancefunction;
d) ensuring that the Chief Compliance Officer issupported with sufficient resources to perform hisdutieseffectively;
e) where Chief Compliance Officer also carries outresponsibilitiesinrespectofothercontrolfunctions,the BRMC shall be satisfied that a sound overallcontrol environment will not be compromised bythecombinationofresponsibilitiesperformedbytheChiefComplianceOfficer.
3. Other compliance functionsasmaybeagreed toby theBRMCandtheBoard.
Group Governance
1. Notedthat:
(a) The Bank, as a company with licensed subsidiarycompanieshasoverallresponsibilityforensuringtheestablishmentandoperationofacleargovernancestructurewithinitssubsidiaries(“BankGroup”).
(b) TheBoard’sresponsibilityistopromotetheadoptionofsoundcorporategovernanceprinciplesthroughouttheBankGroup.
(c) TheBank’sriskandcompliancefunctionsmayproposeobjectives,strategies,plans,governanceframeworkandpoliciesforadoptionandimplementationwithintheBankGroup.
(d) The respective subsidiaries’ board and seniormanagement must validate that the objectives,strategies, plans, governance framework andpolicies set at the Bank level are fully consistentwith the regulatory obligations and the prudentialmanagement of the subsidiary and ensure thatentityspecificrisksareadequatelyaddressedintheimplementationofBankGrouppolicies.
autHorItY
The BRMC is authorized by the Board to review any activitiesof the Group within its terms of reference. It is authorized toseekanyinformationitrequiresfromanyDirectorormemberofmanagementandallemployeesaredirectedtoco-operatewithanyrequestmadebytheBRMC.
TheBRMCisauthorizedbytheBoardtoobtainindependentlegalorotherprofessionaladviceifitconsidersnecessary.
bOARd RISk mANAgemeNTcoMMIttee (brMc) report
100ANNUALRePORT2018
HONG LEONG BANK BERHAD
MeetINGS
TheBRMCmeetsatleasteight(8)timesayearandadditionalmeetingsmaybecalledatanytimeasandwhennecessary.
The Group Managing Director/Chief Executive Officer, ChiefFinancial Officer, Chief Risk Officer, Chief Internal Audit, ChiefCompliance Officer, other senior management and externalauditorsmaybeinvitedtoattendtheBRMCmeetings,wheneverrequired.
Issuesraised,discussions,deliberations,decisionsandconclusionsmade at the BRMC meetings are recorded in the minutes ofthe BRMC meetings. Where the BRMC is considering a matterinwhichaBRMCmemberhasan interest, suchmembershallabstainfromreviewinganddeliberatingonthesubjectmatter.
Two(2)membersoftheBRMC,whoshallbeindependentandnon-executive,shallconstituteaquorum.
After each BRMC meeting, the BRMC shall report and updatethe Board on significant issues and concerns discussed duringtheBRMCmeetingsandwhereappropriate,makethenecessaryrecommendationstotheBoard.
revision of the terms of reference
Any revision or amendment to the Terms of Reference, asproposed by the BRMC, shall first be presented to the Boardforitsapproval.upontheBoard’sapproval,thesaidrevisionoramendment shall form part of this Terms of Reference whichshallbeconsidereddulyrevisedoramended.
activities
TheBRMCcarriedoutitsdutiesinaccordancewithitsTermsofReferencesupportedbytheGroupRiskManagementandGroupCompliancefunctions.
For the financial year ended 30 June 2018, eight (8) BRMCmeetingsandone(1)specialBRMCmeetingswereheldandtheattendanceoftheBRMCmembersisrecordedasfollows:
Member attendance
YBhgDato’NicholasJohnLough@SharifLoughbinAbdullah 9/9
MsLimLeanSee 9/9
MsChokKweeBee 9/9
The BRMC also reviewed major risk management strategies,policies and risk tolerance levels for Board’s approval. WherethesignificantriskpoliciesandframeworksrelatetotheGroup’smajorityownedsubsidiaries,theBRMCensuresalignmenttotheGroup’sriskmanagementappetite,frameworksandpolicies.
Inaddition,theBRMChasreviewedperiodicriskmanagementreports, i.e. Risk Management Dashboards covering amongothersCreditRisk,MarketRisk,LiquidityRisk,OperationalRisk,andITRisk.TheBRMCalsoreviewedperiodicgroupcompliancereports, i.e. Regulatory Compliance Highlights and NewRegulationsupdate.
Bank-widecompliancemattersarealsodeliberatedbytheBRMC,andthisincludestheBank’ssubsidiariesandoverseasbranches.The BRMC continuously provides oversight of the Group’scomplianceactivitiestoensurethattheGroupisincompliancetoallestablishedpolicies,guidelinesandexternalregulations.
bOARd RISk mANAgemeNTcoMMIttee (brMc) report
CORPORATE
101ANNUALRePORT
2018

cORPORATe gOVeRNANce OVeRVIeW,rISK MaNaGeMeNt & INterNaL coNtroL StateMeNt
The Board of Directors (“Board”) is pleased to present thisstatementwithanoverviewofthecorporategovernance(“CG”)practicesof theGroupwhichsupports the threekeyprinciplesof the Malaysian Code on Corporate Governance (“MCCG”)namely board leadership and effectiveness; effective auditandriskmanagement;andintegrityincorporatereportingandmeaningfulrelationshipwithstakeholders.
TheCGReport2018oftheBankinrelationtothisstatementispublishedontheBank’swebsite,www.hlb.com.my(“theBank’sWebsite”).
TheBoardalsoreviewedthemannerinwhichtheBankNegaraMalaysia’s (“BNM”)policydocumentonCorporateGovernance(“BNMCGPolicy”)isappliedintheGroup,whereapplicable,assetoutbelow.
a. roLeS aND reSpoNSIbILItIeS oF tHe boarD
TheBoardassumesresponsibilityforeffectivestewardshipand control of the Bank and has established termsof reference (“TOR”) to assist in the discharge of thisresponsibility.
In discharging its responsibilities, the Board hasestablished functions which are reserved for the Boardand those which are delegated to management. ThekeyrolesandresponsibilitiesoftheBoardaresetout intheBoardCharter,whichwaslastreviewedbytheBoardin September 2017, and will be periodically reviewed.The Board Charter is published on the Bank’s Website.The key roles and responsibilities of the Board broadlycover formulation of corporate policies and strategies;overseeing and evaluating the conduct of the Group’sbusinesses; identifying principal risks and ensuring theimplementationofappropriatesystemstomanagethoserisks; and reviewing and approving keymatters such as
“corporate Governance is the process and structure used to direct and manage the business and affairs of the company towards enhancing business prosperity and corporate accountability with the ultimate objective of realising long term shareholder value, whilst taking into account the interest of other stakeholders.”
~ Finance Committee on Corporate Governance
financialresults,investmentsanddivestments,acquisitionsand disposals, and major capital expenditure and suchotherresponsibilitiesthatarerequiredasspecifiedintheguidelinesandcircularsissuedbyBNMfromtimetotime.
Theday-to-daybusinessof theBank ismanagedby theGroupManagingDirector/ChiefExecutiveOfficer(“GMD/CEO”) who is assisted by the management team. TheGMD/CEOandhismanagementteamareaccountabletotheBoardfortheperformanceoftheBank.Inaddition,theBoard has established Board Committees which operatewithinclearlydefinedTORprimarilytosupporttheBoardintheexecutionofitsdutiesandresponsibilities.
Todischarge itsoversightrolesandresponsibilitiesmoreeffectively, the Board has delegated the independentoversight over, inter alia, internal and external auditfunctions and internal controls to the Board AuditCommittee (“BAC”); and risk management to the BoardRiskManagementCommittee(“BRMC”).TheNominationCommittee(“NC”)isdelegatedtheauthorityto,interalia,assess and review Board, Board Committees and GMD/CEO appointments and re-appointments and overseemanagementsuccessionplanning.AlthoughtheBoardhasgrantedsuchauthoritytoBoardCommittees,theultimateresponsibilityand thefinaldecision restwith theBoard.The chairmen of Board Committees report to the BoardonmattersdealtwithattheirrespectiveBoardCommitteemeetings.MinutesofBoardCommitteemeetingsarealsotabledatBoardmeetings.
There is a clear division of responsibilities between theChairmanoftheBoardandtheGMD/CEO.ThisdivisionofresponsibilitiesbetweentheChairmanandtheGMD/CEOensures an appropriate balance of roles, responsibilitiesandaccountability.
102ANNUALRePORT2018
HONG LEONG BANK BERHAD

cORPORATe gOVeRNANce OVeRVIeW,rISK MaNaGeMeNt & INterNaL coNtroL StateMeNt
TheChairmanleadstheBoardandensuresitssmoothandeffectivefunctioning.
The GMD/CEO is responsible for formulating the visionand recommending policies and the strategic directionof the Bank for approval by the Board, implementingthedecisionsof theBoard, initiatingbusiness ideasandcorporate strategies to create competitive edge andenhancing shareholder wealth, providing managementof the day-to-day operations of the Bank and trackingcomplianceandbusinessprogress.
Independent Non-Executive Directors (“INEDs”) areresponsible for providing insights, unbiased andindependent views, advice and judgment to the BoardandbringimpartialitytoBoarddeliberationsanddecision-making.TheyalsoensureeffectivechecksandbalancesontheBoard.TherearenorelationshipsorcircumstancesthatcouldinterferewithorarelikelytoaffecttheexerciseofINEDs’independentjudgmentortheirabilitytoactinthebestinterestoftheBankanditsshareholders.
TheGroupcontinues tooperate inasustainablemannerand seeks to contribute positively to the well-being ofstakeholders. TheGroup takesaprogressiveapproach inintegratingsustainability intoitsbusinessesassetout intheSustainabilityReportwhichformspartoftheAnnualReport.
The Board observes the Code of Ethics for CompanyDirectors established by the Companies Commission ofMalaysia(“CCM”),whichhasbeenadoptedbytheBoardandpublishedontheBank’sWebsite.
b. boarD coMpoSItIoN
The Board currently comprises seven (7) Directors. Theseven(7)Directorsaremadeupofsix(6)Non-ExecutiveDirectors,ofwhomfour(4)areindependent.Theprofilesof themembersof theBoardare set out in theAnnualReport.
TheBankisguidedbyBNMCGPolicyandtheMainMarketListingRequirements(“MMLR”)ofBursaMalaysiaSecuritiesBerhad (“Bursa”) in determining its board composition.The Board shall determine the appropriate size of theBoardtoenableanefficientandeffectiveconductofBoarddeliberation.TheBoardshallhaveabalanceofskillsandexperience to commensurate with the complexity, size,scopeandoperationsoftheBank.Boardmembersshouldhave the ability to commit time and effort to carry outtheirdutiesandresponsibilitieseffectively.
TheBankhasinplaceaBoardDiversityPolicy.TheBoardrecognisesthemeritsofBoarddiversityinaddingvalueto
collectiveskills,perspectivesandstrengthstotheBoard.The Board will consider appropriate targets in BoarddiversityincludinggenderbalanceontheBoardandwilltakethenecessarymeasurestomeetthesetargetsfromtimetotimeasappropriate.TheBoardwillworktowardsincreasingwomenparticipationontheBoardinlinewiththeMCCG.
Based on the review of the Board composition in July2018, theBoard isof theviewthat thecurrentsizeandcomposition of the Board are appropriate and effectivefor the control anddirectionof theGroup’s strategyandbusiness.ThecompositionoftheBoardalsofairlyreflectstheinvestmentofshareholdersintheBank.
c. boarD coMMItteeS
BoardCommitteeshavebeenestablishedbytheBoardtoassistinthedischargeofitsduties.
(a) bac
The compositionof theBACanda summaryof itsactivitiesinthedischargeofitsfunctionsanddutiesfor thefinancial year andexplanationonhow theBAChadmet its responsibilities are set out in theBACReportinthisAnnualReport.
TheBAC’sfunctionsandresponsibilitiesaresetoutintheTORwhichispublishedontheBank’sWebsite.
(b) brMc
ThecompositionoftheBRMCandasummaryofitsactivitiesinthedischargeofitsfunctionsanddutiesfor thefinancial year andexplanationonhow theBRMChadmetitsresponsibilitiesaresetoutintheBRMCReportofthisAnnualReport.
TheBRMC’sfunctionsandresponsibilitiesaresetoutintheTORwhichispublishedontheBank’sWebsite.
(c) Nc
The NC was established on 17 June 2003. ThecompositionoftheNCisasfollows:
• Ms chok Kwee bee (Chairman)
• Mr tan Kong Khoon
• Ybhg Dato’ Nicholas John Lough @ Sharif Lough bin abdullah
TheNC’sfunctionsandresponsibilitiesaresetoutintheTORwhichispublishedontheBank’sWebsite.
CORPORATE
103ANNUALRePORT
2018

c. boarD coMMItteeS (coNtINueD)
(c) Nc (continued)
TheBankhasinplaceFitandProper(“F&P”)Policyasaguideforthefollowingprocessandprocedureforassessmentof(i)newappointmentsandre-appointmentsofChairman,DirectorsandGMD/CEO,(ii)appointmentofBoardCommitteemembers,and(iii)annualF&PassessmentofChairman,DirectorsandGMD/CEO,andthecriteriaandguidelinesusedforsuchassessments.upontheapprovaloftheBoard,anapplicationontheprescribedformswillbesubmittedtoBNMforapprovalinrespectofnewappointmentsandre-appointments.
(i) New appointments
Thenomination,assessmentandapprovalprocessfornewappointmentsisasfollows:
Inassessingthecandidates forBoardappointments, theNCwill take intoaccount, interalia, thestrategicandeffectivefitofthecandidatesfortheBoard,theoveralldesiredcompositionandthemixofexpertiseandexperienceoftheBoardasawholeandhavingregardtothecandidates’attributes,qualifications,management,leadership,business experience and their F&P Declarations in respect of their probity, competence, personal integrity,reputation,qualifications,skills,experienceandfinancial integrityinlinewiththestandardsrequiredundertherelevantBNMGuidelines.TheBankhastakenstepstobuildandmaintainapoolofpotentialBoardcandidatesfrominternalandexternalintroductions,recommendationsandindependentsourceswithdirectordatabasesinitssearchforsuitableBoardcandidates.
InthecaseofGMD/CEO,theNCwilltakeintoaccountthecandidate’sknowledgeandexperienceintheindustry,marketandsegment.TheNCwillalsoconsiderthecandidate’sF&PDeclarationinlinewiththestandardsrequiredundertherelevantBNMGuidelines.
(ii) re-appointments
Theassessmentandapprovalprocessforre-appointmentsisasfollows:
For re-appointments, the Chairman, Directors and GMD/CEO will be evaluated on their performance in thedischargeofdutiesandresponsibilitieseffectively,including,interalia,contributiontoBoarddeliberations,timecommitmentaswellastheAnnualBoardAssessment(asdefinedbelow)results,contributionsduringthetermofoffice,attendanceatBoardmeetings,F&PDeclarationsinrespectoftheirprobity,competence,personalintegrity,reputation,qualifications,skills,experienceandfinancial integrityinlinewiththestandardsrequiredundertherelevantBNMGuidelinesandforIndependentDirectors,theircontinuedindependence.
Identificationofcandidates
Meetingwithcandidates
DeliberationbytheBoardanddecisionthereof
•AssessmentagainstAssessmentCriteriaandBNMGuidelines
•F&PDeclarationbycandidates•RelevantCreditBureauChecks•CTOS(Bankruptcy)search•RecommendationbytheNC
CTOS(Bankruptcy)search
•AssessmentagainstAssessmentCriteriaandBNMGuidelines
•F&PDeclaration•RelevantCreditBureauChecks•RecommendationbytheNC
DeliberationbytheBoardanddecisionthereof
cORPORATe gOVeRNANce OVeRVIeW,rISK MaNaGeMeNt & INterNaL coNtroL StateMeNt
104ANNUALRePORT2018
HONG LEONG BANK BERHAD

c. boarD coMMItteeS (coNtINueD)
(c) Nc (continued)
(iii) board committee appointments
The nomination, assessment and approval process for appointments to Board Committees (“Board CommitteeAppointments”)isasfollows:
IdentificationofDirectorsforBoardCommitteesmembership
•AssessmentagainstAssessmentCriteriaandBNMGuidelines
•RecommendationbytheNC
DeliberationbytheBoardanddecisionthereof
TheassessmentforBoardCommitteeAppointmentswillbebasedontheDirectors’potentialcontributionsandvalue-addtotheBoardCommitteeswithregardtoBoardCommittees’rolesandresponsibilities.
In addition, a formal evaluation process has been put in place to assess the effectiveness of the Board as awhole, theBoard Committees and the contribution andperformance of each individualDirector on an annualbasis(“AnnualBoardAssessment”)inconjunctionwiththeannualF&PassessmentoftheChairman,DirectorsandGMD/CEOperBNMGuidelines.TheNCwilldeliberateontheresultsoftheAnnualBoardAssessmentandsubmitits recommendation to theBoard forconsiderationandapproval.FornewlyappointedChairman,DirectorsandGMD/CEO,theAnnualBoardAssessmentwillbeconductedatthenextannualassessmentexercisefollowingthecompletionofoneyearservice.
AssessmentcriteriaforBoardasawholeinclude,interalia,theeffectivenessoftheBoardcompositionintermsofsizeandstructurevis-à-visthecomplexity,size,scopeandoperationsoftheBank;thecoreskills,competenciesandexperienceoftheDirectors;andtheBoard’sintegrity,competency,responsibilitiesandperformance.TheassessmentcriteriaforBoardCommitteesincludetheeffectivenessoftherespectiveBoardCommittees’compositionintermsofmixofskills,knowledgeandexperiencetocarryouttheirrespectiverolesandresponsibilitiespertheBoardCommittees’TORandthecontributionofBoardCommitteesmembers.EachindividualDirectorisassessedon,interalia, theeffectivenessofhis/hercompetency,expertiseandcontributions.Theskills,experience, soundnessofjudgmentaswellascontributionstowardsthedevelopmentofbusinessstrategiesanddirectionoftheBankandanalyticalskillstothedecision-makingprocessarealsotakenintoconsideration.
Formanagementsuccessionplanning,ithasbeenembeddedintheGroup’sprocessovertheyearstocontinuouslyidentify,groomanddevelopkeytalentsfromwithintheGroup.TheGroupalsohasatalentdevelopmentprogrammetoidentify,retainanddevelopyounghighpotentialtalents.
TheNCmeetsatleastonceineachfinancialyearandadditionalmeetingsmaybecalledatanytimeasandwhennecessary.
Duringthefinancialyearended30June(“FYE”)2018,two(2)NCmeetingswereheldandtheattendancesoftheNCmemberswereasfollows:
Member attendance
MsChokKweeBee 2/2
MrTanKongKhoon 2/2
YBhgDato’NicholasJohnLough@SharifLoughbinAbdullah 2/2
cORPORATe gOVeRNANce OVeRVIeW,rISK MaNaGeMeNt & INterNaL coNtroL StateMeNt
CORPORATE
105ANNUALRePORT
2018

c. boarD coMMItteeS (coNtINueD)
(c) Nc (continued)
The NC carried out the following activities in thedischarge of its duties in accordance with its TORduringtheFYE2018:
• Carried out the Annual Board Assessment andwas satisfied that theBoardas awhole,BoardCommittees and individual Directors havecontinued to effectively discharge their dutiesand responsibilities in accordance with theirrespective TORs, and that the current BoardcompositionintermsofBoardbalance,sizeandmixofskills isappropriateandeffectiveforthedischargeofitsfunctions.TheNCtookcognisanceofthemeritsofBoarddiversityincludingwomenparticipation on the Board, in adding value tothe Bank. The NC will work towards increasingwomen participation on the Board in line withtheMCCG;
• Considered and assessed the position ofIndependent Directors of the Bank and wassatisfied that the Independent Directors metthe regulatory requirements for IndependentDirectors;
• ReviewedtheF&PDeclarationsbyDirectorsandGMD/CEOinlinewiththeBNMpolicydocumentonF&PCriteriaandwassatisfiedthattheDirectorsandGMD/CEOmettherequirementsassetoutinBNMpolicydocumentonF&PCriteria;
• ReviewedthetermofofficeandperformanceoftheBACandeachofitsmembersinaccordancewith the TOR of BAC and was of the view thattheBACandeachofitsmembershadcarriedouttheirduties inaccordancewith theBACTOR fortheperiodsunderreview;
• Reviewed the re-appointments of Directorsin accordance with the F&P Policy, BNM CGand MMLR and recommended to the Board forconsiderationandapproval;and
• Reviewed and recommended to the Board foradoption the revisions to the F&P Policy of theBank on tenure of Independent Directors, andcriteriaofIndependentDirectors.
(d) remuneration committee (“rc”)
The RC was established on 17 June 2003. ThecompositionoftheRCisasfollows:
• Ybhg Dato’ Nicholas John Lough @ Sharif Lough bin abdullah (Chairman)
• Ybhg tan Sri Quek Leng chan
• Ybhg Datuk Dr Md Hamzah bin Md Kassim
TheRC’sfunctionsandresponsibilitiesaresetoutintheTORwhichispublishedontheBank’sWebsite.
During the FYE 2018, three (3) RC meetings wereheldandtheattendancesoftheRCmemberswereasfollows:
Member attendance
YBhgDato’NicholasJohnLough@SharifLoughbinAbdullah 3/3
YBhgTanSriQuekLengChan 2/3
YBhgDatukDrMdHamzahbinMdKassim 3/3
The Group’s remuneration scheme for ExecutiveDirectorsislinkedtoperformance,serviceseniority,experience and scope of responsibility and isperiodically benchmarked to market/industrysurveys conductedbyhuman resource consultants.PerformanceismeasuredagainstprofitsandtargetssetintheGroup’sannualplanandbudget.
ThelevelofremunerationofNon-ExecutiveDirectorsreflectsthescopeofresponsibilitiesandcommitmentundertakenbythem.
TheRC,inassessingandreviewingtheremunerationpackages of Executive Directors, ensures that astrong link is maintained between their rewardsandindividualperformance,basedontheprovisionsin the Group’s Human Resources Manual, whichare reviewed from time to time to align withmarket/industry practices. The fees of Directorsare recommended and endorsed by the Board forapproval by the shareholders of the Bank at itsAnnualGeneralMeeting(“AGM”).
The detailed remuneration of each Director duringtheFYE2018isassetoutinNote37oftheAuditedFinancialStatementsinthisAnnualReport.
cORPORATe gOVeRNANce OVeRVIeW,rISK MaNaGeMeNt & INterNaL coNtroL StateMeNt
106ANNUALRePORT2018
HONG LEONG BANK BERHAD
c. boarD coMMItteeS (coNtINueD)
(d) remuneration committee (“rc”) (continued)
remuneration
The Bank’s remuneration framework provides abalanced approach between fixed and variablecomponents that change according to individualperformance, division performance, and theBank’s performance outcomes and individualseniority/level and accountability. Such frameworkis in alignment with Hong Leong Group’s totalcompensation philosophy which promotes highperforming culture to deliver the Bank’s businessobjectives, and this is applicable to all employeesofHongLeongBank(inclusiveofoverseas/offshoreofficeswhereapplicable).
Theframeworkincludesacombinationofcashandnon-cash elements such as shares or share-linkedinstruments which is aimed toward achievingthe desired long term business performance. It issupported by a rigorous and robust performancemanagement process that promotes pay-for-performance and also incorporates risk andcompliance management (to fulfil risk controlobjectives)aspartofthekeyperformanceindicatorsforremunerationdecisionstoensureexcessiverisk-takingbehavioursofstaffisminimisedandsufficientcontrolmechanismsareinplace.ThisisinalignmentwithHongLeongGroup’sphilosophyindrivinglong-term sustainable performance of the company, inorder to create sustainable financial performanceandvalueforthecompanyandshareholders.
InordertoreinforcestronginternalgovernanceontheperformanceandremunerationofControlfunctions(i.e.Risk,AuditandCompliance),theremunerationof these officers in Control functions are assessedindependently from business units/functions theysupport to avoid conflict of interests. The Boardalso plays an active oversight where the overallperformanceandremunerationoftheseofficers(inaddition to theGMD/CEOandSeniorManagementteam) are to be reviewed and approved by theBoard Audit and Risk Management Committee(BRMC)annuallytoensurethe incentivesprovidedbytheremunerationsystemtakesintoconsiderationrisks,capital,liquidity,andthelikelihoodandtimingof earnings, without prejudice to the tasks of theRemunerationCommittee.
pay Mix Delivery and its purpose
The overall Total Compensation for the GMD/CEOand members of the Senior Management teamgenerallyincludesbasepay,fixedcashallowances,performance-based variable pay, long termincentives,benefitsandotheremployeeprograms.
1.FixedPay(basepayandfixedcashallowances)
Fixedpayisdeliveredatanappropriateleveltakinginto account skills, experience, responsibilities,competencies and performance; ensuring itscompetitivenessvis-à-viscomparableinstitutionsforattractionandretentionpurposes.
2.Performance-basedvariablepay
Performance-linked variable pay in the form ofbonusesispaidoutattheendoftheFinancialYearsubjecttotheBank’sperformanceandinrecognitionof individual performance and key achievementsduring the year. It focuses on the achievement ofkeyobjectiveswhicharealigned tovaluecreationfor our shareholders and multiple stakeholders. Arobust key performance indicators (“KPIs”) settingprocessthatincorporatesriskmanagementaspartofthescorecardsarealsoinplacetoensureexcessiverisk taking behaviours of staff is minimised andsufficientcontrolmechanismareinplace.
3.Longtermincentives
In addition, the Bank also recognises and rewardsindividuals for their contributions towards theBank’s long-term business achievements (both inqualitative and quantitative measures) through acombination of cash and non-cash (i.e. shares orshare-linkedinstruments)elementsthataresubjecttopartialdefermentoveraperiodoftime(typicallyoverafewyears)withbuilt-inclawbackmechanism.
The clawback mechanism can be triggered whenthere are non-compliances to regulations andpoliciesandwhereManagementdeemednecessarydue to achievements of performance targets thatarenotsustainable.Clawbacksaretypically(andnotlimitedto)appliedinthecaseofGrossMisconduct,Financial Misstatements, Material Risks and/orMalfeasanceofFraud.
The variable portion of remuneration (bothPerformance-based variable pay and Long termincentives)increasesalongwiththeindividual’slevelofaccountability.Bysubjectinganadequateportionofthevariableremunerationpackagetoforfeiture,it takes into account potential financial risks thatmaycrystaliseoveraperiodoftime,reinforcesHLB’scorporateandriskcultureinpromotingprudentrisk-takingbehaviours.
4.EmployeeBenefitsandprogrammes
Employee benefits (e.g. screening, health andmedical, leave passage) are used to fosteremployeevaluepropositionandwellnesstoensuretheoverallwell-beingofouremployees.Thesearebeing reviewed annually to ensure HLB remainscompetitiveintheindustryandthattheemployeesarewelltakencareof.
cORPORATe gOVeRNANce OVeRVIeW,rISK MaNaGeMeNt & INterNaL coNtroL StateMeNt
CORPORATE
107ANNUALRePORT
2018

D. INDepeNDeNce
TheBoardtakescognisanceoftheprovisionsoftheMCCG,which states that the tenureofan IndependentDirectorshouldnotexceedacumulativetermof9yearsanduponcompletionof the9years,an IndependentDirectormaycontinue to serve on the Board subject to the Director’sre-designation as a Non-Independent Director. It furtherstates that in the event the Board wishes to retain anIndependentDirectorwhohasservedacumulativetermof 9 years and above, shareholders’ approval shall beannuallysoughtwithjustification.IntheeventtheBoardwishestoretainanIndependentDirectorwhohasserveda cumulative termof12yearsandabove, shareholders’approval shall be annually sought through a two-tiervotingprocess.
ThetenureofalltheIndependentDirectorsontheBoardof the Bank does not exceed 9 years. The IndependentDirectors have declared their independence, and theNCandtheBoardhavedetermined,attheannualassessmentcarriedout,thattheIndependentDirectorshavecontinuedto bring independent and objective judgment to Boarddeliberationsanddecisionmaking.
TheBankhas in place apolicy in relation to the tenurefor Independent Directors of the Bank (“Tenure Policy”)
undertheF&PPolicyoftheBank.PursuanttotheTenurePolicy, an Independent Director who has served on theBoard of the Bank for a period of 9 years cumulativelyshallsubmitaLetterofIntenttotheNCinformingofhisintentiontocontinueinofficeortoretirefromtheBoardasanIndependentDirector,upon:
(a) theexpiryofhistermofofficeapprovedbyBNM;or
(b) theduedateforhisretirementbyrotationpursuanttotheConstitutionoftheBank.
If the intention is to continue in office, the NC shallconsiderbasedontheassessmentcriteriaandguidelinesset out in the F&P Policy and make the appropriaterecommendationtotheBoard.Iftheintentionistoretirefromoffice,anapplicationshallbemadetoBNMtoseekclearance inaccordancewithBNMGuidelines. Forpubliclisted bank/companies under the Hong Leong FinancialGroup, shareholders’ approval at AGMs shall be soughtin accordancewith the relevant requirements under theMCCGandtheMMLRsubjecttofavourableassessmentoftheNCandtheBoard.
TheBoardseekstostrikeanappropriatebalancebetweentenureofservice,continuityofexperienceandrefreshmentof the Board. Although a longer tenure of directorship
cORPORATe gOVeRNANce OVeRVIeW,rISK MaNaGeMeNt & INterNaL coNtroL StateMeNt
c. boarD coMMItteeS (coNtINueD)
(d) remuneration committee (“rc”) (continued)
remuneration Disclosure
ThefollowingdepictsthetotalvalueofremunerationawardedtotheGMD/CEO,SeniorManagementteamandMaterialRiskTakersfortheFYE2018:
GMD/ceo, Senior Management and Material risk takers
No. of officers received
unrestricted (rM)
Deferred (rM)
total amount of outstanding
deferred remuneration
as at 30.6.2018
(rM)
total amount of outstanding
deferred remuneration
paid out (vested) in
FYe2018 (rM)
Fixed remuneration
Cash-based 31 28,142,373 – – –
Sharesandshare-linkedinstruments – – – – –
Other – – – – –
Variable remuneration
Cash-based 31 21,715,230 – – –
Sharesandshare-linkedinstruments 12 – 83,132,249 83,132,249 –
Other – – – – –
Note: The value of share is based on the valuation used for MFRS 2 Accounting.
108ANNUALRePORT2018
HoNG LeoNG baNK berHaD

maybeperceivedas relevant to thedeterminationof aDirector’s independence, the Board recognises that anindividual’sindependenceshouldnotbedeterminedsolelybasedontenureofservice.Further,thecontinuedtenureofdirectorshipbringsconsiderablestabilitytotheBoard,andtheBankbenefitsfromDirectorswhohave,overtime,gainedvaluableinsightintotheGroup,itsmarketandtheindustry.
e. coMMItMeNt
TheDirectorsareawareoftheirresponsibilitiesanddevotesufficient time to carry out such responsibilities. In linewiththeMMLR,Directorsarerequiredtocomplywiththerestrictionsonthenumberofdirectorshipsinpubliclistedcompanies.DirectorsprovidenotificationstotheBoardforacceptanceofanynewBoardappointments.Thisensuresthat their commitment, resources and time are focusedon the affairs of the Bank to enable them to dischargetheir duties effectively. Board meetings are scheduled ayear ahead in order to enable full attendance at Boardmeetings. Additional meetings may be convened on anad-hocbasisasandwhennecessary.Whereappropriate,decisions are also taken by way of Directors’ CircularResolutions.Directorsarerequiredtoattendatleast75%ofBoardmeetingsheldineachfinancialyearpursuanttotheBNMCGPolicy.
All Board members are supplied with information in atimely manner. The Bank has moved towards electronicBoard reports. Board reports are circulated electronicallyprior to Board and Board Committee meetings and thereports provide, amongst others, financial and corporateinformation,significantoperational,financialandcorporateissues, updates on the performance of the Bank and oftheGroupandmanagement’sproposalswhichrequiretheapprovaloftheBoard.
All Directors have access to the advice and servicesof a qualified and competent Company Secretary tofacilitate the discharge of their duties effectively. TheCompanySecretary isqualified toactunder Section235of the Companies Act 2016. She supports the effectivefunctioning of the Board, provides advice and guidanceto the Board on policies and procedures, relevant rules,regulationsandlawsinrelationtocorporatesecretarialandgovernancefunctionsandfacilitateseffectiveinformationflow amongst the Board, Board Committees and seniormanagement.AllDirectorsalsohaveaccesstotheadviceand services of the internal auditors and in addition, toindependentprofessionaladvice,wherenecessary,attheBank’sexpense,inconsultationwiththeChairmanortheGMD/CEOoftheBank.
At Board meetings, active deliberations of issues byBoard members are encouraged and such deliberations,decisions and conclusions are recorded by the CompanySecretary accordingly. A Director who has, directly orindirectly,aninterestinamaterialtransactionormaterial
arrangement shall not bepresent at theboardmeetingwherethematerialtransactionormaterialarrangementisbeingdeliberatedbytheBoard.
TheBoardmeteight(8)timesfortheFYE2018withtimelynoticesofissuestobediscussed.DetailsofattendancesofDirectorswereasfollows:
Director attendance
YBhgTanSriQuekLengChan 8/8
MrTanKongKhoon 8/8
MrKwekLengHai 8/8
MsLimLeanSee 8/8
MsChokKweeBee 8/8
YBhgDato’NicholasJohnLough@SharifLoughbinAbdullah 8/8
YBhgDatukDrMdHamzahbinMdKassim 8/8
YBhgDatukWiraAzharbinAbdulHamid(1) 6/7
Note:(1) Retired on 14 May 2018.
The Bank recognises the importance of continuousprofessionaldevelopmentandtrainingforitsDirectors.
The Bank is guided by a Directors’ Training Policy,which covers an Induction Programme and ContinuingProfessional Development (“CPD”) for Directors of theBank. The Induction Programme is organised for newlyappointed Directors to assist them to familiarise and toget acquainted with the Bank’s business, governanceprocess,rolesandresponsibilitiesasDirectoroftheBank.The CPD encompasses areas related to the industry orbusiness of the Bank, governance, risk managementand regulations through a combination of courses andconferences. A trainingbudget is allocated forDirectors’trainingprogrammes.
AllDirectorsof theBankhavecompletedtheMandatoryAccreditationProgramme.
The Bank regularly organises in-house programmes,briefings and updates by its in-house professionals. TheDirectors are also encouraged to attend seminars andbriefings in order to keep themselves abreast with thelatestdevelopments inthebusinessenvironmentandtoenhance their skills and knowledge. Directors are keptinformed of available training programmes on a regularbasis.
The Bank has prepared for the use of its Directors, aDirector Manual which highlights, amongst others, themajor duties and responsibilities of a Director vis-a-visvarious laws, regulations and guidelines governing thesame.
cORPORATe gOVeRNANce OVeRVIeW,rISK MaNaGeMeNt & INterNaL coNtroL StateMeNt
CORPORATE
109ANNUALRePORT
2018
e. coMMItMeNt (coNtINueD)
In assessing the training needs of Directors, the Boardhas determined that appropriate training programmescoveringmattersoncorporategovernance,finance,legal,riskmanagement,informationtechnology,cybersecurity,internal control and/or statutory/regulatory compliance,be recommended and arranged for the Directors toenhancetheircontributionstotheBoard.
During the FYE 2018, the Directors received regularbriefingsandupdatesontheBank’sbusinesses,strategies,operations, risk management and compliance, internalcontrols,corporategovernance,financeandanychangesto relevant legislation, rules and regulations from in-houseprofessionals.TheBankalsoorganisedanin-houseprogrammeforitsDirectorsandseniormanagement.
The Directors of the Bank have also attended variousprogrammes and forums facilitated by externalprofessionalsinaccordancewiththeirrespectiveneedsindischargingtheirdutiesasDirectors.
DuringtheFYE2018,theDirectorsoftheBank,collectivelyor on their own, attended various trainingprogrammes,seminars,briefingsand/orworkshopsincluding:
• FIDE Forum – Fintech: Opportunities for the FinancialServicesIndustryinMalaysia
• FIDEForum–CurrentIssuesinCorporateGovernance
• FIDE Forum – Securities Commission Dialogue:LeveragingTechnologyforGrowth
• FIDEForum–1stDistinguishedBoardLeadershipSeries:NavigatingtheVuCAworld
• FIDEFORuM–5thAnnualDialoguewiththeGovernorofBNM
• FIDE Forum – 5th Annual Dialogue with the DeputyGovernorofBNM
• FIDEForum–CryptocurrencyandBlockchainTechnology
• FIDE Forum – Win the innovation race: unlocking thecreativepowerofAsians
• BNM – Industry Seminar on Recovery and ResolutionPlanninginMalaysia
• BNM–Value-BasedIntermediationDialogue
• BNM, International Monetary Fund (“IMF”) & IMFEconomicReview–SummerConference:GlobalisationintheAftermathoftheCrisis
• KPMG–MCCGupdate
• KPMG–CyberSecurityAwareness
• Securities Commission – World Capital MarketsSymposium2018: Renaissanceof Capitalism:MarketsforGrowth
• SecuritiesIndustryDevelopmentCorporation(“SIDC”)–2018 Budget: Implications to the Malaysian EconomyandCapitalMarket
• SIDC–CyberSecurity:CyberProofingfortheNextWave
• BursaMalaysia–RiskManagementProgramme: IamReadytoManageRisk
• ICLIF–CGBreakfastSeriesEntitled:LeadingChange@TheBrain
• ICLIF – understanding Liquidity Risk Management inBanking
• Malaysian Institute of Accountants – Capital MarketConference2017
• Asian Institute of Finance (AIF) – 9th InternationalConferenceonFinancialCrimeandTerrorismFinancing(IFCTF)2017
• Khazanah Nasional – Khazanah Megatrends Forum2017
• CyberSecurityInsights&Sharing
• Islamic Banking in the 4th Industry Revolution,Compliance, Digital Innovation, Profitability and theWayForward–Insider&GlobalPerspectives
• DigitalTransformationandImpacttoBusinesses
• Malaysian FinancialReportingStandards17 (MFRS17)InsuranceContracts
• KPMG–Digitalization/transformationofoperationsandsaleschannelswithsharingofcasestudiesforKPMG’sotherclients
• KPMG–TheGuangdong-HongKong-MacaoGreaterBayArea
• Briefing on Proposed Changes Code on CorporateGovernance
• updateonSingaporeStockExchangeRegulations
• BriefingonSingaporeCorporateAccess(CorpPass)–anew corporate digital identity to transact onlinewithGovernmentagencies
• Briefing on Guide on prevention of Insider Trading –Handling of Confidential Information and Dealings inSecurities
• updateonAmendments to theBuildingMaintenanceandStrataManagementAct.
cORPORATe gOVeRNANce OVeRVIeW,rISK MaNaGeMeNt & INterNaL coNtroL StateMeNt
110ANNUALRePORT2018
HONG LEONG BANK BERHAD

F. StreNGtHeNING corporate GoVerNaNce cuLture
Hong Leong bank Group code of conduct & ethics
A fundamental value of the Group is that we are ‘Herefor the Long Term’. In upholding this value, the GroupcommitstoahighstandardofprofessionalismandethicsintheconductofourbusinessandprofessionalactivitiesassetoutinthisCodeofConduct&Ethics(“Code”).
TheCodeisapplicableto:
• All employees who work in the Group across thejurisdictions in which we operate – including butnot limited to permanent, part-time and temporaryemployees;
• Any other persons permitted to perform duties orfunctionswithintheGroup–includingbutnotlimitedto vendors, service providers, contractors, secondees,interns,industrialattachmentandagencystaff.
As the Code forms part of the terms and conditions ofemployment,ouremployeesarerequiredtoadheretoahighstandardofprofessionalismandethicsintheconductoftheirbusinessandprofessionalactivities.
principles
TherearesixkeypillarstotheGroup’sCodeofConduct&Ethics:
prINcIpLe 1: coMpeteNce
The Group is committed to ensuring that its employeesdevelopandmaintaintherelevantknowledge,skillsandbehaviours to ensure that our activities are conductedprofessionallyandproficiently.
prINcIpLe 2: INteGrItY
TheGroup’sVision,MissionandValuesidentifiesastrongvalues-based culture to guide decisions, actions andinteractions with stakeholders as a key enabler for thesuccessofourbusiness.
prINcIpLe 3: FaIrNeSS
AcoremissionoftheGroupistohelpourclientssucceedthrough simple, relevant, personal and fair banking.Wemust act responsibly and be fair and transparent in ourbusiness practices, including treating our colleagues,customers and business partners with respect. We mustconsider the impact of our decisions and actions on allstakeholders.
prINcIpLe 4: coNFIDeNtIaLItY
TheGroupiscommittedtoprovidingasafe,reliableandsecuredbankingexperienceforourcustomers.
prINcIpLe 5: obJectIVItY
Employeesmustnotallowanyconflictofinterest,biasorundue influenceofothers tooverride theirbusinessandprofessionaljudgment.Employeesmustnotbeinfluencedby friendships or association in performing their role.Decisionsmustbemadeonastrictlyarms-lengthbusinessbasis.
prINcIpLe 6: eNVIroNMeNt
The Group is committed to reduce the effect of ouroperationsontheenvironmentsothatweareabletobuildourfranchiseinasafeandhealthyenvironment.Weaimtodothisbymanagingtheresourcesweuseacross theGroupand raising staffawarenessabout the importanceofcaringfortheenvironment.TheGroupwillbemindfulofitsactivitieswithemployees,businesspartnersandthecommunityweoperatewithintoensurehumanrightsaresafeguarded. Where there are adverse impacts, we arecommittedtoaddressingthese.
Whistleblowing policy
AWhistleblowingPolicyhasalsobeenestablishedbytheBankanditprovidesastructuredchannelforallemployeesoftheBankandanyotherpersonsprovidingservicesto,orhavingabusinessrelationshipwiththeBank,toreportany concerns about any improper conducts, wrongfulacts or malpractice committed within the Bank. TheWhistleblowingPolicyispublishedontheBank’sWebsite.
other policies and codes of the Group
Forgoodgovernance,theGrouphasvariousotherpoliciessuch as Group Compliance Policy, Group Financial CrimeCompliancePolicy,CodeofConductForWholesaleFinancialMarkets, Group Whistleblowing Policy, Group IT SecurityPolicy, Privacy Policy, Group Media and Public RelationsPolicyandProcurementPolicy.
continuous training & awareness
Multipletrainingchannels,suchasmandatorye-Learningprogrammes, are in place to enable easy access foremployees to be upskilled. Attestation to the Code isconductedonanannualbasis.
cORPORATe gOVeRNANce OVeRVIeW,rISK MaNaGeMeNt & INterNaL coNtroL StateMeNt
CORPORATE
111ANNUALRePORT
2018

G. accouNtabILItY aND auDIt
The Bank has put in place a framework of processeswhereby Board committees provide oversight on criticalprocessesoftheBank’sreportingoffinancialstatements,inordertoensurethataccountabilityandauditareintegralcomponentsofthesaidprocesses.
I. Financial reporting
The Board has a fiduciary responsibility to ensurethepropermaintenanceofaccountingrecordsoftheGroup. TheBoard receives the recommendation toadoptthefinancialstatementsfromtheBAC,whichassesses the integrity of financial statementswiththeassistanceoftheexternalauditors.
II. risk Management and Internal control
TheBoardhasoverallresponsibilityformaintainingasystemofinternalcontrolswhichcoversfinancialand operational controls and risk management.This system provides reasonable but not absoluteassurance against material misstatements, lossesandfraud.
The BRMC is delegated with the responsibility toprovide oversight on the Bank’s management ofcritical risks that theGroup faceswhile theBAC isdelegated with the responsibility to review theeffectiveness of internal controls implemented intheBank.
The Statement on Risk Management and InternalControlasdetailedunderSectionJofthisStatementprovides an overview of the system of internalcontrols and risk management framework of theGroup.
III. relationship with auditors
TheappointmentofexternalauditorsisrecommendedbytheBAC,whichdeterminestheremunerationoftheexternalauditors.TheBACreviewsthesuitabilityandindependenceoftheexternalauditorsannually.Inthisregard,anannualassessmentisconductedbytheBACtoevaluatetheperformance,independenceand objectivity of the external auditors prior tomaking any recommendation to the Board on thereappointmentoftheexternalauditors.
TheBankalsohas aPolicyon theuseof ExternalAuditors for Non-Audit Services to govern theprofessionalrelationshipwiththeexternalauditorsin relation to non-audit services. Assessment willbe conducted by the BAC for non-audit servicesto ensure that the provision of non-audit servicesdoesnotinterferewiththeexerciseofindependentjudgmentoftheexternalauditors.
Duringthefinancialyearunderreview,theexternalauditorsmetwiththeBACto:
• present the scope of the audit before thecommencementofaudit;and
• review the results of the audit as well as themanagement letter after the conclusion of theaudit.
TheexternalauditorsmeetwiththeBACmembersatleasttwiceayearwithout thepresenceofExecutiveDirectorsandmanagement.
H. DIScLoSure
The Bank has in place a Corporate Disclosure Policy forcompliance with the disclosure requirements set out intheMMLR,andtoraiseawarenessandprovideguidancetotheBoardandmanagementontheGroup’sdisclosurerequirementsandpractices.
AlltimelydisclosureandmaterialinformationdocumentswillbepostedontheBank’sWebsiteafterreleasetoBursa.
I. SHareHoLDerS
I. Dialogue between companies and Investors
TheBoardacknowledgestheimportanceofregularcommunication with shareholders and investorsvia the annual reports, circulars to shareholdersand quarterly financial reports and the variousannouncements made during the year, throughwhich shareholders and investors can have anoverviewoftheGroup’sperformanceandoperation.
NoticesofgeneralmeetingsandtheaccompanyingexplanatorynotesareprovidedwithintheprescribednoticeperiodontheBank’sWebsite,Bursa’swebsite,inthemediaandbyposttoshareholders.Thisallowsshareholders tomake thenecessaryarrangementstoattendandparticipateingeneralmeetingseitherinperson,bycorporaterepresentative,byproxyorbyattorney.
TheBankhasawebsiteatwww.hlb.com.mywhichthe shareholders can access for information whichincludestheBoardCharter,TORsofBoardCommittees,corporate information, announcements/pressreleases/briefings, financial information, productsinformation and investor relations. A summary ofthekeymattersdiscussedattheAGMispublishedontheBank’sWebsite.
The Board has identified Ms Lim Lean See, theChairman of the BAC, as the Independent Non-ExecutiveDirector of theBoard towhom concernsmaybeconveyed,andwhowouldbringthesametotheattentionoftheBoard.
cORPORATe gOVeRNANce OVeRVIeW,rISK MaNaGeMeNt & INterNaL coNtroL StateMeNt
112ANNUALRePORT2018
HONG LEONG BANK BERHAD
I. SHareHoLDerS
I. Dialogue between companies and Investors (continued)
In addition, shareholders and investors can havea channel of communication with the followingpersons to direct queries and provide feedback totheGroup:
GeNeraL MaNaGer, coMMuNIcatIoN & cSr
TelNo. :03-20818888ext.61916FaxNo. :03-20817801e-mailaddress :[email protected]
cHIeF FINaNcIaL oFFIcer
TelNo. :03-20818888FaxNo. :03-20818924e-mailaddress :[email protected]
II. aGM
The AGM provides an opportunity for theshareholders to seek and clarify any issues andto have a better understanding of the Group’sperformance.Shareholdersareencouragedtomeetand communicatewith theBoardat theAGMandtovoteonallresolutions.Seniormanagementandtheexternalauditorsarealsoavailabletorespondtoshareholders’queriesduringtheAGM.AllDirectorsandtheGMD/CEOattendedthelastAGMheldon23October2017.
Pursuant to Paragraph 8.29A(1) of the MMLR, allresolutions tabledatgeneralmeetingswillbeputtoavotebywayofapollandthevotingresultswillbeannouncedatthemeetingsandthroughBursa.
J. StateMeNt oN rISK MaNaGeMeNt aND INterNaL coNtroL
I. Introduction
TheBoardrecognisesthatpracticeofgoodgovernanceisanimportantprocessandhasestablishedtheBACandBRMCtoensuremaintenanceofasoundsystemof internal controls and good risk managementpractices. The processes for risks and controlsassessments and improvements are on-going andare regularly reviewed in accordance with theguidelinesonthe‘StatementonRiskManagementand Internal Control: Guidelines for Directors ofListedIssuers’.
II. board responsibilities
The Board acknowledges its overall responsibilityfor the risk management and internal controlenvironment and its effectiveness in safeguardingshareholders’ interestsand theGroup’sassets. Therisk management and internal control framework
is designed to manage rather than to eliminatetheriskoffailure intheachievementofgoalsandobjectivesoftheGroup,andthereforeonlyprovidereasonable assurance and not absolute assurance,againstmaterialmisstatementorloss.
Thesystemofriskmanagementandinternalcontrolinstituted throughout the Group is updated fromtimetotimetoalignwiththedynamicchangesinthe business environment as well as any processimprovement initiatives undertaken. The Boardconfirms that its Management team responsiblyimplements the Board policies, procedures andguidelinesonriskmanagementandinternalcontrol.
III. risk Management and Internal control Framework
The organisational structure of the Group clearlydefinesthelinesofaccountabilityandresponsibility.Risk assessment and evaluation is an integralpart of the Group’s strategic planning cycle andare responsive to business environment andopportunities. Management committees areappropriately set up to ensure proper utilisationand investment of the Group’s assets for effectiverisk return rewards or to limit losses. The GroupRisk Management (“GRM”) and GC divisions haveimplemented an enterprise-wide integrated riskmanagement framework to inculcate continuousrisk and regulatory compliance awareness,understandingofproceduresandcontrolsandthus,improvetheoverallcontrolenvironment.
Operationally, theGroupoperatesmultiple linesofdefensestoeffectarobustcontrolframework.Atthefirstlevel,theoperatingbusinessandsupportunitsare responsible for the day-to-day managementof risks inherent in the various business activities.Regulatory and operational compliance unitsare set up in the various lines of business andsupport departments. They oversee the day-to-day compliance to all regulatory requirements,businessandprocesscontrols.At thesecond level,GRMisresponsibleforsettingtheriskmanagementframeworkanddevelopingtoolsandmethodologiesfor the identification, measurement, monitoring,controlandpricingofriskswhereasGCisresponsiblefor ensuring that controls to manage compliancerisksareadequateandoperatingasintended.Atthethirdlevel,theInternalAuditfunctioncomplementsGRM and GC by monitoring and evaluatingsignificantexposurestoriskandcontributingtotheimprovementof the riskmanagement and controlsystems.Italsoprovidesanindependentperspectiveandassessmentontheadequacyandeffectivenessof the risk management framework governancesystemsandprocesses,includingthoseinstitutedbythecompliancefunction.
Theaboveisdepictedinthefollowingdiagram:
cORPORATe gOVeRNANce OVeRVIeW,rISK MaNaGeMeNt & INterNaL coNtroL StateMeNt
CORPORATE
113ANNUALRePORT
2018

a) risk Management
Managing risks is an integral part of theGroup’soverall business strategy. It involvesaprocessof identifying,assessingandmanagingrisksanduncertaintiesthatcouldinhibittheGroup’sabilitytoachieveitsstrategyandstrategicobjectives.
Riskgovernanceoversightisunderpinnedbythecorepillarsofriskculture,appetite,policies,surveillance,escalationandcapacity.Aboveall,theapproachesneedtoberelevant,forwardlookingandsustainable.
TheGroup’sriskmanagementframeworkstructureincorporatesthecomponentsdepictedinthediagrambelow:
reLeVaNtFocusonthingsthatmatter.
FuNctIoNaL capabILItIeS
aND capacItY
Therighttalentpoolandinfrastructure
arekeytoeffectively
carryoutrisksurveillanceactivities.
robuSt eScaLatIoN Structure
Cultivationofproactiverisk
communicationtosupporttimelyandinformeddecisions.
DeFINeD rISK appetIte
CleararticulationoftheBoard’srisktoleranceinpursuitofitsbusinessobjectives,ensuringbusiness
strategiesarealigned.
rIGorouS rISK
SurVeILLaNce
Facilitiesearlyidentificationofemerging
risksandopportunities.
cuLture oF rISK
oWNerSHIp
Riskmanagementispartoftheday-to-dayjobofall
employees,driventhrough
dailyapplicationofmanagement
decisions.
cLear FraMeWorK, poLIcIeS aND
proceSS
Providecleardirection.Defined
businessrulesandoperatingparameters.Givesclaritytovariousparties’
accountabilities.
pILLarS
Criticalcomponentsto
putinplace
approacH
Howweimplement
ForWarD LooKINGBeproactive.Anticipateemergingrisksandopportunities.
SuStaINabLeStrivetobuildforthelongterm.
RISk gOVeRNANce OVeRSIgHTBoardandmanagementtoexerciseoversightandsettonefromthetop.
cORPORATe gOVeRNANce OVeRVIeW,rISK MaNaGeMeNt & INterNaL coNtroL StateMeNt
J. StateMeNt oN rISK MaNaGeMeNt aND INterNaL coNtroL (coNtINeuD)
III. risk Management and Internal control Framework (continued)
FIrSt LINe oF DeFeNce SecoND LINe oF DeFeNce tHIrD LINe oF DeFeNce
BusinessandSupport
RegulatoryandOperational
GroupRiskManagementGroupCompliance
GroupInternalAudit
Manages inherent risks and ensures compliance in day-to-day activities.
Sets policies, reviews portfolio risks and provides oversight of the management of risk and compliance.
Independent assessment of effectiveness and enforcement of frameworks and policies.
114ANNUALRePORT2018
HONG LEONG BANK BERHAD

J. StateMeNt oN rISK MaNaGeMeNt aND INterNaL coNtroL (coNtINueD)
III. risk Management and Internal control Framework (continued)
a) risk Management (continued)
In addition, the Risk Management Framework is effected through an organisational construct and escalationstructureasdepictedbelow:
TheBoardhastheoverallresponsibilitytoensurethereisproperoversightofthemanagementofrisksintheGroup.TheBoardsetstheriskappetiteandtolerancelevelandallocatestheGroup’scapitalthatisconsistentwiththeGroup’soverallbusinessobjectivesanddesiredriskprofile.GRMmonitorsandreportstheGroup’sCredit,Market,Liquidity,OperationalandITRisks.GCidentifies,assesses,monitorsandreportscomplianceissuesinadditiontoadvising, providing guidance and training on regulatory requirements. These risks are presented to the BRMCregularly.
TheBRMCdeliberatesandevaluatesthereportspreparedbyGRMandGContheadequacyandeffectivenessofthecontrolstomitigatetheGroup’srisksandprovidesupdatestotheBoard,andwhereappropriate,makethenecessaryrecommendationstotheBoard.
RISk mANAgemeNT fRAmeWORk
Topdown
SetRiskAppetite&ToleranceLimit
SetPoliciesandCapitalAllocation
board of Directors
MonitoringandReporting
Bottomup
effective stewardship and control
board risk Management committee
present single view of risks and to ensure adequate policies and controls within the Group
Group risk Management & Group compliance
CreditRisk MarketRisk OperationalRisk LiquidityRisk IT&CyberRiskRegulatoryCompliance
Daily management of risk, limits, policies, procedures and reports
BusinessDivisionsDistribution&Service
ChannelsCreditManagement
FunctionsOperations&Shared
ServiceFunctions
cORPORATe gOVeRNANce OVeRVIeW,rISK MaNaGeMeNt & INterNaL coNtroL StateMeNt
corporate
115ANNUALRePORT
2018

J. StateMeNt oN rISK MaNaGeMeNt aND INterNaL coNtroL (coNtINueD)
III. risk Management and Internal control Framework (continued)
a) risk Management (continued)
HONg LeONg bANkINg gROUP’S key RISkS
creDIt rISKCredit Risk is the risk of loss if a borrower orcounterparty in a transaction fails to meet itsobligations.
operatIoNaL rISKOperational Risk is the risk of loss resulting frominadequate or failed internal processes, people andsystems or from external events which also includeoutsourcingandbusinesscontinuityrisks.
MarKet rISKMarket Risk is the risk of loss in financialinstrumentsorthebalancesheetduetoadversemovementsinmarketfactorssuchasinterestandexchangerates,prices,spreads,volatilities,and/orcorrelations.
LIQuIDItY rISKLiquidity Risk is the risk of loss resulting from theunavailability of sufficient funds to fulfill financialcommitments, including customers’ liquidity needs, astheyfalldue.LiquidityRiskalsoincludestheriskofnotbeingabletoliquidateassetsinatimelymanner.
reGuLatorY coMpLIaNce rISKRegulatoryComplianceRiskistheriskoflegalorregulatorysanctions,materialfinanciallossorlosstoreputationasaresultoffailuretocomplywithlawsandregulations.
It & cYber rISKInformationTechnologyRisk is theriskoftechnologicalfailure which may disrupt business operations such assystem defects or service outages. This also includescyber security risk, which is the risk of possible threatthat might exploit a vulnerability to breach systemsecurityandthereforecausepossibleharm.
b) basel II and III
The Group places great importance on BaselIIandIIIandviewsBaselIIandIIIasabank-wideinitiativethatwillensurethattheGroupcontinuestomeetinternationalbestpracticesfor the Group’s credit, market, operationaland liquidity risk management practices. Byadopting Basel II and III, the Group is ableand will continue to enhance and embedsound riskmanagementpracticeswithin theGroup and be equipped with the right riskmanagement discipline, practices, processesandsystems.
For Basel II Pillar 1, the Group is incompliance with the regulatory standardsand is progressively employing advance riskmeasurementintherespectivebusinesses.ForBaselIIPillar2,theGrouphasestablishedanInternalCapitalAdequacyAssessmentProcessframeworkthatformsanintegratedapproachto manage the Group’s risk, capital andbusiness strategy. ForBasel II Pillar3,whichis relatedtomarketdisciplineanddisclosure
requirements, the Group has provided thedisclosuresunderaseparatePillar3sectioninthisAnnualReport.
ForBaselIII,theGrouphasputinplaceplansto continuously strengthen its capital andliquidity positions well ahead of the BaselCommittee’s time schedule and in advanceanticipationofanylocaljurisdictionguidelinesinallthecountriesthattheBankoperatesin.
c) Internal audit
The Bank’s Group Internal Audit Division(“GIAD”) performs the internal auditingfunction for the various entities in thefinancial services group. GIAD regularlyreviews thecriticaloperations (asdefined inBNMGuidelinesonInternalAuditFunctionofLicensed Institutions) and critical controls inthe Information Technology environment (asoutlinedinBNMGPIS)oftheGrouptoensurethat the internal controls are in place andworkingeffectively.
cORPORATe gOVeRNANce OVeRVIeW,rISK MaNaGeMeNt & INterNaL coNtroL StateMeNt
116ANNUALRePORT2018
HoNG LeoNG baNK berHaD

J. StateMeNt oN rISK MaNaGeMeNt aND INterNaL coNtroL (coNtINueD)
III. risk Management and Internal control Framework (continued)
c) Internal audit (continued)
The results of the audits conducted by GIADarereportedtotheBAC.Follow-upactionsandthe review of the status of corrective actionplansarecarriedoutbyManagementviatheRisk and Compliance Governance Committee(“RCGC”) chaired by the GMD/CEO, whosememberscompriseseniormanagement. TheminutesofmeetingsofRCGCaretabledtotheBRMCandBACfornotation.
ImplementationofcorrectiveactionplansarefolloweduponamonthlybasisandreportedtotheBAC.HighlightsoftheBACmeetingsaresubmittedtotheBoardforreviewandfurtherdeliberation.
Inaddition,internalcontrolsarealsoeffectedthroughthefollowingprocesses:
• The Board receives and reviews regularreports from Management on the keyoperating statistics, business dynamics,legal matters and regulatory issues thatwouldhaveimplicationsoninternalcontrolmeasures.
• The BAC regularly reviews and holdsdiscussions with Management on theactions taken on internal control issuesidentified in reports prepared by GIAD,externalauditorsandregulatoryauthorities.
• Policiesondelegationandauthoritylimitsare strictly implemented to ensure aculturethatrespectsintegrityandhonesty,andtherebyreinforceinternalcontrols.
• Policies and procedures are set out inoperation manuals and disseminatedthroughout theorganisation in support ofa learning culture, so as to reinforce anenvironmentofinternalcontrolsdiscipline.
• Policies for recruitment, promotion andterminationofstaffareinplacetoensuretheGroup’shumanresourcescomplywithinternalcontrols.
IV. assessment of risk Management and Internal control System
TheBoardhasreceivedassurancesfromtheGMD/CEO, chief financial officer, chief risk officer, chiefinternal auditor and chief compliance officer thatthe Group’s risk management and internal controlsystemareoperatingadequatelyandeffectively.
Based on the assurances it has received fromManagement, the Board is of the view that theGroup’s risk management and internal controlsystemareoperatingadequatelyandeffectivelyforthefinancialyearunderreviewanduptothedateofapprovalofthisreport.
V. review of the Statement by external auditors
AsrequiredbyParagraph15.23oftheBursaMalaysiaSecuritiesBerhadMainMarketListingRequirements,theexternalauditorshavereviewedthisStatementon Risk Management and Internal Control. Theirlimited assurance review was performed inaccordancewithAuditandAssurancePracticeGuide(“AAPG”) 3 issued by the Malaysian Institute ofAccountants.AAPG3doesnotrequiretheexternalauditors to form an opinion on the adequacy andeffectivenessof theriskmanagementand internalcontrolsystemsoftheGroup.
K. DIrectorS’ reSpoNSIbILItY IN FINaNcIaL reportING
The MMLR requires the Directors to prepare financialstatementsforeachfinancialyearwhichgiveatrueandfair viewof the stateof affairs of theGroupandof theBankasattheendofthefinancialyearandofitsfinancialresultsandcashflowsoftheGroupandoftheBankforthefinancialyear.
TheDirectorsaresatisfiedthat inpreparing thefinancialstatementsoftheGroupandoftheBankfortheFYE2018,the Group has used the appropriate accounting policiesand applied them consistently. The Directors are also ofthe view that relevant approved accounting standardshavebeenfollowedinthepreparationofthesefinancialstatements.
This Statement on Corporate Governance Overview, RiskManagementandInternalControl ismadeinaccordancewiththeresolutionoftheBoard.
cORPORATe gOVeRNANce OVeRVIeW,rISK MaNaGeMeNt & INterNaL coNtroL StateMeNt
corporate
117ANNUALRePORT
2018

118ANNUALREPORT2018
HONG LEONG BANK BERHAD
The Directors have pleasure in presenting their report together with the audited financial statements of the Group and of the Bank for the financial year ended 30 June 2018.
PRINCIPAL ACTIVITIES
The Bank is principally engaged in all aspects of commercial banking business and in the provision of related services. The principal activity of the significant subsidiary consists of Islamic Banking services. Other subsidiary companies are primarily engaged in property investment and management, investment holding and nominee services. The details of the subsidiary companies are disclosed in Note 13 to the financial statements.
BuSINESS STRATEgy foR ThE CuRRENT fINANCIAL yEAR
The Malaysian economy is expected to grow moderately in 2018, riding on continued expansion in the world economy. Domestic demand will continue to play an integral role in supporting economic growth as the external environment may turn more challenging in the wake of the shift in US trade policies that has invited retaliation from its trading partners. Private consumption is expected to benefit from various government measures to reduce the cost of living including the zero-setting of GST and reintroduction of targeted petrol subsidy, cushioning the impact from postponement and review of numerous higher-priced projects that will adversely impact investment and the construction sector. That said, steady and sound financial markets as well as a still healthy banking system will enable the Malaysian economy to weather any undesirable shocks.
Against a backdrop of moderate economic expansion, business activities and loan demand are expected to remain supported while more upbeat consumer sentiments shall continue to ensure further expansion in household lending. Brick and mortar business aside, the Bank will continue to focus on broadening and deepening our digital strategy to transform and optimize our business to enhance customer experience and deliver operational excellence. We will continue to grow our domestic franchise and regional business through our Community Banking approach and differentiate ourselves via our multi-channel banking services to cater to the evolving needs of the customers.
ouTLook ANd BuSINESS PLAN foR NEw fINANCIAL yEAR
The world economy is expected to maintain a steady growth pace in 2019, underpinned by moderate growth among advanced economies and faster expansion in the emerging economies, albeit the expectation of challenges from geopolitical uncertainties and shift in US trade policies.
In tandem with the world economy, the Malaysian economy is expected to stay on a steady growth path in 2019, driven by sustained domestic demand. A steady labour market, continuous wage growth and improving consumer sentiments arising from policy changes, coupled with fiscal reforms, are expected to provide the much needed support to private consumption and overall economic growth which will help alleviate the short term setback in investment.
Being digital at the core, executing our digital strategy remains our key priority in strengthening our digital offerings and transforming our products and services. We will continue to grow our domestic franchise and regional businesses by entrenching ourselves in the communities leveraging on our branch footprint and digital capabilities. We strive to continue to lead the digital and innovation space to provide best-in-class experience and engage with our customers through reimagined customer journeys.
PERfoRmANCE REVIEw ANd mANAgEmENT REPoRTS
The Board receives and reviews regular reports from the Management on key financial and operating statistics as well as legal and regulatory matters. The performance of each business unit is assessed against the approved budgets and business objectives whilst explanation is provided for significant variances.
dIRECToRS’ REPoRTfoR ThE fINANCIAL yEAR ENdEd 30 JuNE 2018
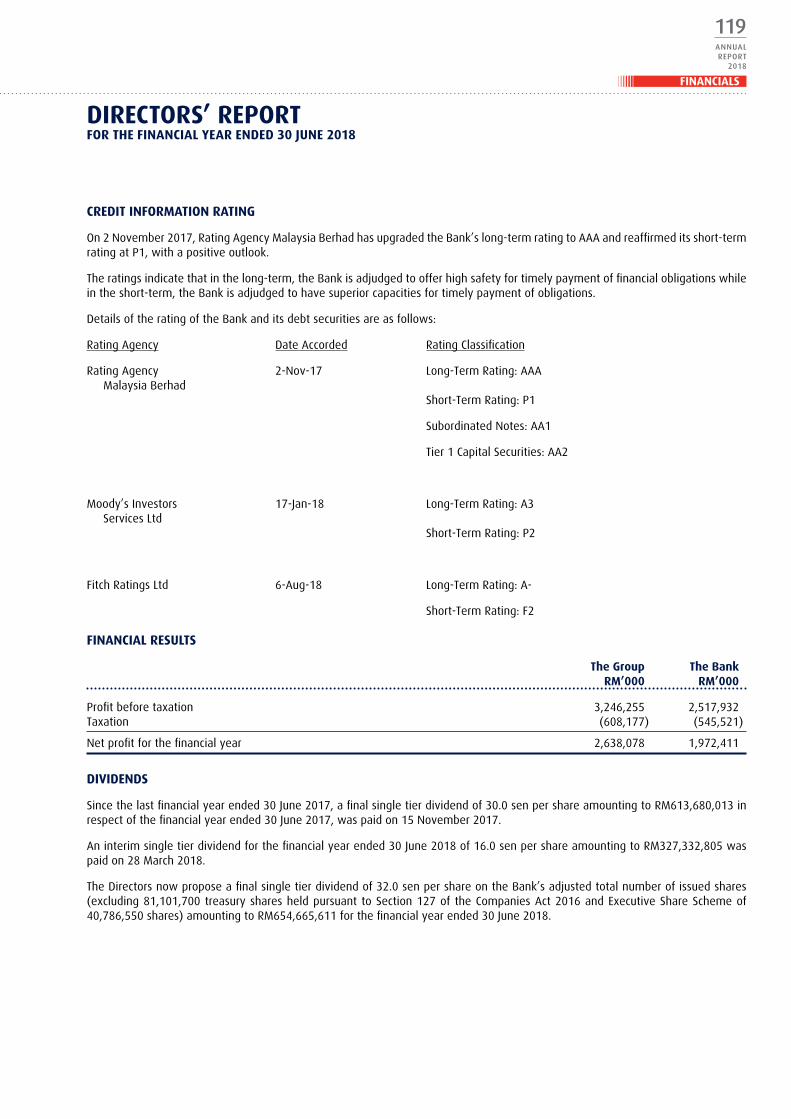
119ANNUALREPORT
2018
fINANCIALS
CREdIT INfoRmATIoN RATINg
On 2 November 2017, Rating Agency Malaysia Berhad has upgraded the Bank’s long-term rating to AAA and reaffirmed its short-term rating at P1, with a positive outlook.
The ratings indicate that in the long-term, the Bank is adjudged to offer high safety for timely payment of financial obligations while in the short-term, the Bank is adjudged to have superior capacities for timely payment of obligations.
Details of the rating of the Bank and its debt securities are as follows:
Rating Agency Date Accorded Rating Classification
Rating Agency 2-Nov-17 Long-Term Rating: AAA Malaysia Berhad Short-Term Rating: P1
Subordinated Notes: AA1
Tier 1 Capital Securities: AA2
Moody’s Investors 17-Jan-18 Long-Term Rating: A3 Services Ltd Short-Term Rating: P2
Fitch Ratings Ltd 6-Aug-18 Long-Term Rating: A-
Short-Term Rating: F2
fINANCIAL RESuLTS
The group The Bank Rm’000 Rm’000
Profit before taxation 3,246,255 2,517,932Taxation (608,177) (545,521)
Net profit for the financial year 2,638,078 1,972,411
dIVIdENdS
Since the last financial year ended 30 June 2017, a final single tier dividend of 30.0 sen per share amounting to RM613,680,013 in respect of the financial year ended 30 June 2017, was paid on 15 November 2017.
An interim single tier dividend for the financial year ended 30 June 2018 of 16.0 sen per share amounting to RM327,332,805 was paid on 28 March 2018.
The Directors now propose a final single tier dividend of 32.0 sen per share on the Bank’s adjusted total number of issued shares (excluding 81,101,700 treasury shares held pursuant to Section 127 of the Companies Act 2016 and Executive Share Scheme of 40,786,550 shares) amounting to RM654,665,611 for the financial year ended 30 June 2018.
dIRECToRS’ REPoRTfoR ThE fINANCIAL yEAR ENdEd 30 JuNE 2018

120ANNUALREPORT2018
HONG LEONG BANK BERHAD
SIgNIfICANT EVENTS duRINg ThE fINANCIAL yEAR
Significant events during the financial year are disclosed in Note 51 to the financial statements.
SuBSEquENT EVENTS AfTER ThE fINANCIAL yEAR
There are no material subsequent events after the financial year that require disclosure or adjustments to the financial statements.
ISSuE of ShARES ANd dEBENTuRES
There were no new ordinary shares or debentures issued during the financial year.
RESERVES ANd PRoVISIoNS
There were no material transfers to or from reserves or provisions during the financial year other than those disclosed in the financial statements.
dIRECToRS
The Directors who have held office during the financial year and during the period from the end of the financial year to the date of this report are:
YBhg Tan Sri Quek Leng Chan (Chairman, Non-Executive Non-Independent)Mr Tan Kong Khoon (Non-Independent Executive Director)Mr Kwek Leng Hai (Non-Independent Non-Executive Director)Ms Lim Lean See (Independent Non-Executive Director)Ms Chok Kwee Bee (Independent Non-Executive Director)YBhg Dato’ Nicholas John Lough @ Sharif Lough bin Abdullah (Independent Non-Executive Director)YBhg Datuk Dr Md Hamzah bin Md Kassim (Independent Non-Executive Director)YBhg Datuk Wira Azhar bin Abdul Hamid (Independent Non-Executive Director) (Retired on 14 May 2018)
The names of Directors of subsidiaries are set out in the respective subsidiary’s statutory accounts and the said information is deemed incorporated herein by such reference and made a part hereof.
dIRECToRS’ REmuNERATIoN
Details of Directors’ remuneration are set out in Note 37 to the financial statements.
dIRECToRS’ REPoRTfoR ThE fINANCIAL yEAR ENdEd 30 JuNE 2018

121ANNUALREPORT
2018
FINANCIALS
dIRECToRS’ INTERESTS
According to the Register of Directors’ Shareholdings kept by the Bank under Section 59 of the Companies Act 2016, the Directors holding office at the end of the financial year who had beneficial interests in the ordinary shares and/or preference shares and/or loan stocks and/or options over ordinary shares of the Bank and/or its related corporations during the financial year are as follows:
directors’ direct interests Number of ordinary shares/preference shares/ordinary shares issued or to be issued or acquired arising from the exercise of options*/conversion of redeemable convertible unsecured loan stocks**/ nominal value in Ringgit malaysia of Additional Tier 1 capital securities/perpetual subordinated sukuk wakalah***
Nominal value per As at As at share 01.07.2017 Acquired Sold 30.06.2018
Rm (unless indicated)
Interests of yBhg Tan Sri quek Leng Chan in:Hong Leong Company (Malaysia) Berhad (1) 390,000 – – 390,000Hong Leong Financial Group Berhad (1) 5,438,664 – – 5,438,664Guoco Group Limited USD0.50 1,056,325 – – 1,056,325GuocoLand Limited (2) 13,333,333 – – 13,333,333GuocoLand (Malaysia) Berhad (1) 19,506,780 – – 19,506,780GL Limited USD0.20 735,000 – – 735,000The Rank Group Plc GBP138/9p 285,207 – – 285,207
Interests of Tan kong khoon in:Hong Leong Financial Group Berhad – 8,000,000* – 8,000,000*
Interests of mr kwek Leng hai in:Hong Leong Company (Malaysia) Berhad (1) 420,500 – – 420,500Hong Leong Industries Berhad (1) 190,000 – – 190,000Hong Leong Financial Group Berhad (1) 2,526,000 – – 2,526,000Hong Leong Bank Berhad (1) 5,510,000 – – 5,510,000Hume Industries Berhad (1) 205,200 – – 205,200Guoco Group Limited USD0.50 3,800,775 – – 3,800,775GuocoLand Limited (2) 35,290,914 – – 35,290,914Lam Soon (Hong Kong) Limited (6) 2,300,000 – – 2,300,000GuocoLand (Malaysia) Berhad (1) 226,800 – – 226,800Malaysian Pacific Industries Berhad (1) 71,250 – – 71,250The Rank Group Plc GBP138/9p 1,026,209 – – 1,026,209
Interests of yBhg dato’ Nicholas John Lough @ Sharif Lough bin Abdullah in:
Hong Leong Financial Group Berhad (1) – 10,000 – 10,000 – 250,000*** – 250,000***
dIRECToRS’ REPoRTfoR ThE fINANCIAL yEAR ENdEd 30 JuNE 2018

122ANNUALREPORT2018
HONG LEONG BANK BERHAD
dIRECToRS’ INTERESTS (CoNTINuEd)
directors’ deemed interests Number of ordinary shares/preference shares/ordinary shares issued or to be issued or acquired arising from the exercise of options*/conversion of redeemable convertible unsecured loan stocks**/ nominal value in Ringgit malaysia of Additional Tier 1 capital securities/perpetual subordinated sukuk wakalah***
Nominal value per As at As at share 01.07.2017 Acquired Sold 30.06.2018
Rm (unless indicated)
Interests of yBhg Tan Sri quek Leng Chan in:Hong Leong Company (Malaysia) Berhad (1) 7,701,455(7) – (50,000)(12) 7,651,455(7)
Hong Leong Financial Group Berhad (1) 896,158,726(7) – – 896,158,726(7)
Hong Leong Capital Berhad (1) 200,805,058 – – 200,805,058Hong Leong Bank Berhad (1) 1,346,237,169 – – 1,346,237,169 – 400,000,000*** – 400,000,000***Hong Leong MSIG Takaful Berhad (1) 65,000,000 – – 65,000,000Hong Leong Assurance Berhad (1) 140,000,000 – – 140,000,000Hong Leong Islamic Bank Berhad – 400,000,000*** – 400,000,000***Hong Leong Industries Berhad (1) 243,415,670(7) 200,000(7)(11) (915,200)(7) 242,700,470(7)
200,000*(7) – (200,000)*(7) –Hong Leong Yamaha Motor Sdn Bhd (1) 17,352,872 – – 17,352,872Guocera Tile Industries (Meru) Sdn Bhd (1) 19,600,000 – – 19,600,000Century Touch Sdn Bhd (1) 6,545,001 – – 6,545,001
(In members’ voluntary liquidation)Varinet Sdn Bhd (1) 10,560,627 – – 10,560,627
(In members’voluntary liquidation) Malaysian Pacific Industries Berhad (1) 108,950,757 – (235,500) 108,715,257Carter Resources Sdn Bhd (1) 5,640,607 – – 5,640,607Carsem (M) Sdn Bhd (1) 84,000,000 – – 84,000,000 (1) 22,400(8) – – 22,400(8)
Hume Industries Berhad (1) 350,231,658(7) – – 350,231,658(7)
100,000*(7) – – 100,000*(7)
Guoco Group Limited USD0.50 237,124,930 – – 237,124,930GuocoLand Limited (2) 817,911,030 35,000(7)(11) – 817,946,030(7)
420,000*(7) – (35,000)*(7) 385,000*(7)
Southern Steel Berhad (1) 292,169,709 – – 292,169,709 (1) 140,076,337** – – 140,076,337**Southern Pipe Industry (Malaysia) Sdn Bhd (1) 123,372,953 1,591,200 – 124,964,153TPC Commercial Pte. Ltd. (2) 189,600,000 – – 189,600,000TPC Hotel Pte. Ltd. (2) 8,000,000 54,400,000 – 62,400,000Wallich Residence Pte. Ltd. (2) 24,000,000 – – 24,000,000GLL A Pte. Ltd. (2) 7(9) – – 7(10)
dIRECToRS’ REPoRTfoR ThE fINANCIAL yEAR ENdEd 30 JuNE 2018
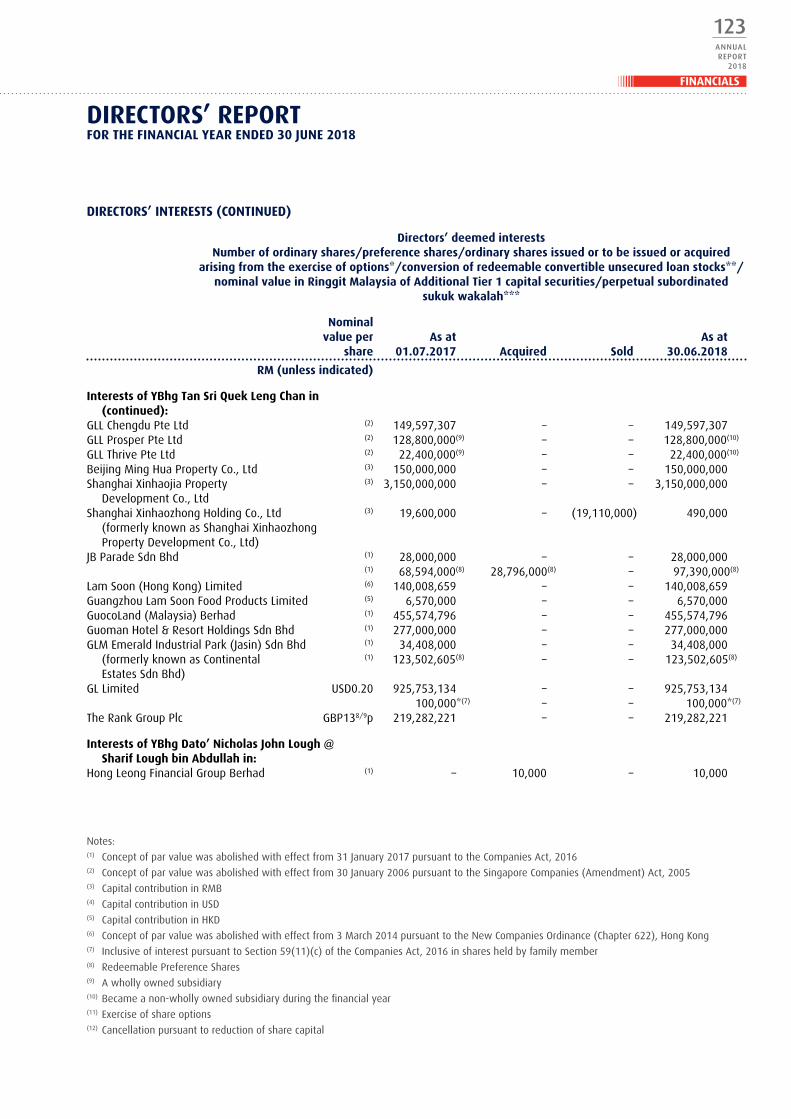
123ANNUALREPORT
2018
FINANCIALS
dIRECToRS’ INTERESTS (CoNTINuEd)
directors’ deemed interests Number of ordinary shares/preference shares/ordinary shares issued or to be issued or acquired arising from the exercise of options*/conversion of redeemable convertible unsecured loan stocks**/ nominal value in Ringgit malaysia of Additional Tier 1 capital securities/perpetual subordinated sukuk wakalah***
Nominal value per As at As at share 01.07.2017 Acquired Sold 30.06.2018
Rm (unless indicated)
Interests of yBhg Tan Sri quek Leng Chan in (continued):
GLL Chengdu Pte Ltd (2) 149,597,307 – – 149,597,307GLL Prosper Pte Ltd (2) 128,800,000(9) – – 128,800,000(10)
GLL Thrive Pte Ltd (2) 22,400,000(9) – – 22,400,000(10)
Beijing Ming Hua Property Co., Ltd (3) 150,000,000 – – 150,000,000Shanghai Xinhaojia Property (3) 3,150,000,000 – – 3,150,000,000
Development Co., LtdShanghai Xinhaozhong Holding Co., Ltd (3) 19,600,000 – (19,110,000) 490,000
(formerly known as Shanghai Xinhaozhong Property Development Co., Ltd)
JB Parade Sdn Bhd (1) 28,000,000 – – 28,000,000 (1) 68,594,000(8) 28,796,000(8) – 97,390,000(8)
Lam Soon (Hong Kong) Limited (6) 140,008,659 – – 140,008,659Guangzhou Lam Soon Food Products Limited (5) 6,570,000 – – 6,570,000GuocoLand (Malaysia) Berhad (1) 455,574,796 – – 455,574,796Guoman Hotel & Resort Holdings Sdn Bhd (1) 277,000,000 – – 277,000,000GLM Emerald Industrial Park (Jasin) Sdn Bhd (1) 34,408,000 – – 34,408,000
(formerly known as Continental (1) 123,502,605(8) – – 123,502,605(8) Estates Sdn Bhd)
GL Limited USD0.20 925,753,134 – – 925,753,134 100,000*(7) – – 100,000*(7)
The Rank Group Plc GBP138/9p 219,282,221 – – 219,282,221
Interests of yBhg dato’ Nicholas John Lough @ Sharif Lough bin Abdullah in:
Hong Leong Financial Group Berhad (1) – 10,000 – 10,000
Notes:(1) Concept of par value was abolished with effect from 31 January 2017 pursuant to the Companies Act, 2016(2) Concept of par value was abolished with effect from 30 January 2006 pursuant to the Singapore Companies (Amendment) Act, 2005(3) Capital contribution in RMB(4) Capital contribution in USD(5) Capital contribution in HKD(6) Concept of par value was abolished with effect from 3 March 2014 pursuant to the New Companies Ordinance (Chapter 622), Hong Kong(7) Inclusive of interest pursuant to Section 59(11)(c) of the Companies Act, 2016 in shares held by family member(8) Redeemable Preference Shares(9) A wholly owned subsidiary(10) Became a non-wholly owned subsidiary during the financial year(11) Exercise of share options(12) Cancellation pursuant to reduction of share capital
dIRECToRS’ REPoRTfoR ThE fINANCIAL yEAR ENdEd 30 JuNE 2018

124ANNUALREPORT2018
HONG LEONG BANK BERHAD
dIRECToRS’ BENEfITS
Since the end of the previous financial year, no Director of the Bank received or became entitled to receive any benefit (other than a benefit included in the aggregate amount of emoluments received or due and receivable by the Directors as shown in the financial statements or as fixed salary of a full-time employee of the Bank or of related corporations) by reason of a contract made by the Bank or its related corporations with the Director or with a firm of which the Director is a member, or with a company in which the Director has a substantial financial interest except for:
YBhg Tan Sri Quek Leng Chan, who may be deemed to derive a benefit by virtue of those transactions, contracts and agreements for the acquisitions and/or disposal of stocks and shares, stocks-in-trade, products, parts, accessories, plants, chattels, fixtures, buildings, land and other properties or any interest in any properties; and/or for the provision of services including but not limited to project and sales management and any other management and consultancy services; and/or for construction, development, leases, tenancy, licensing, dealership and distributorship; and/or for the provision of treasury functions, advances in the conduct of normal trading, banking, insurance, investment, stockbroking and/or other businesses between the Bank or its related corporations and corporations in which YBhg Tan Sri Quek Leng Chan is deemed to have interests.
Neither at the end of the financial year, nor at any time during the financial year, did there subsist any other arrangements to which the Bank is a party, with the object or objects of enabling the Directors of the Bank to acquire benefits by means of the acquisition of shares in, or debentures of, the Bank or any other body corporate, other than the share options granted pursuant to the Executive Share Scheme.
RESPoNSIBILITy STATEmENT By ThE BoARd of dIRECToRS
In the course of preparing the annual financial statements of the Group and of the Bank, the Directors are collectively responsible in ensuring that these financial statements are drawn up in accordance with the Malaysian Financial Reporting Standards, International Financial Reporting Standards and the requirements of the Companies Act 2016 in Malaysia.
It is the responsibility of the Directors to ensure that the financial reporting of the Group and the Bank present a true and fair view of the state of affairs of the Group and the Bank as at 30 June 2018 and of the financial results and cash flows of the Group and of the Bank for the financial year ended 30 June 2018.
The financial statements are prepared on the going concern basis and the Directors have ensured that proper accounting records are kept, applied the appropriate accounting policies on a consistent basis and made accounting estimates that are reasonable and fair so as to enable the preparation of the financial statements of the Group and of the Bank with reasonable accuracy.
ExECuTIVE ShARE SChEmE
The Bank has established and implemented an Executive Share Scheme (“ESS”).
The ESS of up to ten percent (10%) of the total number of issued shares (excluding treasury shares) of the Bank comprises the Executive Share Option Scheme (“ESOS”) and the Executive Share Grant Scheme (“ESGS”).
(i) ESoS
The ESOS which was approved by the shareholders of the Bank on 25 October 2012, was established on 12 March 2013 and would be in force for a period of ten (10) years.
On 18 September 2012, the Bank announced that Bursa Malaysia Securities Berhad had resolved to approve the listing of new ordinary shares of the Bank to be issued pursuant to the exercise of options under the ESOS.
The ESOS would provide an opportunity for eligible executives who had contributed to the growth and development of the HLB Group to participate in the equity of the Bank.
dIRECToRS’ REPoRTfoR ThE fINANCIAL yEAR ENdEd 30 JuNE 2018
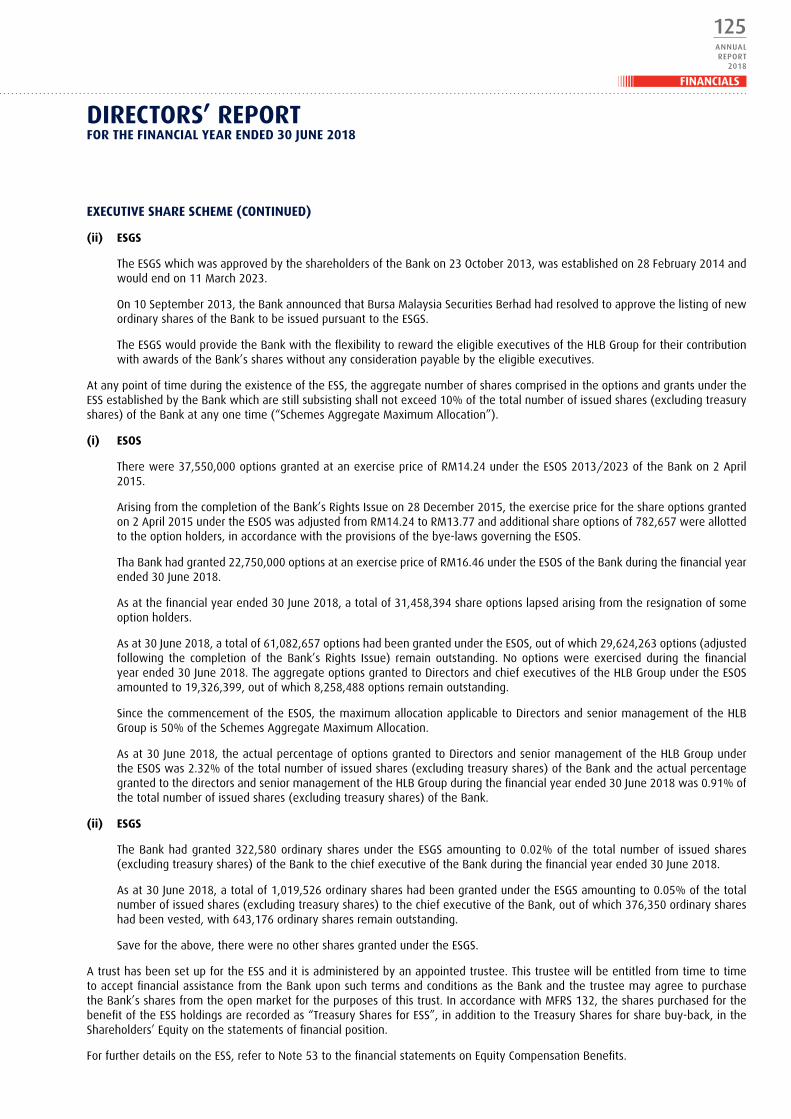
125ANNUALREPORT
2018
FINANCIALS
ExECuTIVE ShARE SChEmE (CoNTINuEd)
(ii) ESgS
The ESGS which was approved by the shareholders of the Bank on 23 October 2013, was established on 28 February 2014 and would end on 11 March 2023.
On 10 September 2013, the Bank announced that Bursa Malaysia Securities Berhad had resolved to approve the listing of new ordinary shares of the Bank to be issued pursuant to the ESGS.
The ESGS would provide the Bank with the flexibility to reward the eligible executives of the HLB Group for their contribution with awards of the Bank’s shares without any consideration payable by the eligible executives.
At any point of time during the existence of the ESS, the aggregate number of shares comprised in the options and grants under the ESS established by the Bank which are still subsisting shall not exceed 10% of the total number of issued shares (excluding treasury shares) of the Bank at any one time (“Schemes Aggregate Maximum Allocation”).
(i) ESoS
There were 37,550,000 options granted at an exercise price of RM14.24 under the ESOS 2013/2023 of the Bank on 2 April 2015.
Arising from the completion of the Bank’s Rights Issue on 28 December 2015, the exercise price for the share options granted on 2 April 2015 under the ESOS was adjusted from RM14.24 to RM13.77 and additional share options of 782,657 were allotted to the option holders, in accordance with the provisions of the bye-laws governing the ESOS.
Tha Bank had granted 22,750,000 options at an exercise price of RM16.46 under the ESOS of the Bank during the financial year ended 30 June 2018.
As at the financial year ended 30 June 2018, a total of 31,458,394 share options lapsed arising from the resignation of some option holders.
As at 30 June 2018, a total of 61,082,657 options had been granted under the ESOS, out of which 29,624,263 options (adjusted following the completion of the Bank’s Rights Issue) remain outstanding. No options were exercised during the financial year ended 30 June 2018. The aggregate options granted to Directors and chief executives of the HLB Group under the ESOS amounted to 19,326,399, out of which 8,258,488 options remain outstanding.
Since the commencement of the ESOS, the maximum allocation applicable to Directors and senior management of the HLB Group is 50% of the Schemes Aggregate Maximum Allocation.
As at 30 June 2018, the actual percentage of options granted to Directors and senior management of the HLB Group under the ESOS was 2.32% of the total number of issued shares (excluding treasury shares) of the Bank and the actual percentage granted to the directors and senior management of the HLB Group during the financial year ended 30 June 2018 was 0.91% of the total number of issued shares (excluding treasury shares) of the Bank.
(ii) ESgS
The Bank had granted 322,580 ordinary shares under the ESGS amounting to 0.02% of the total number of issued shares (excluding treasury shares) of the Bank to the chief executive of the Bank during the financial year ended 30 June 2018.
As at 30 June 2018, a total of 1,019,526 ordinary shares had been granted under the ESGS amounting to 0.05% of the total number of issued shares (excluding treasury shares) to the chief executive of the Bank, out of which 376,350 ordinary shares had been vested, with 643,176 ordinary shares remain outstanding.
Save for the above, there were no other shares granted under the ESGS.
A trust has been set up for the ESS and it is administered by an appointed trustee. This trustee will be entitled from time to time to accept financial assistance from the Bank upon such terms and conditions as the Bank and the trustee may agree to purchase the Bank’s shares from the open market for the purposes of this trust. In accordance with MFRS 132, the shares purchased for the benefit of the ESS holdings are recorded as “Treasury Shares for ESS”, in addition to the Treasury Shares for share buy-back, in the Shareholders’ Equity on the statements of financial position.
For further details on the ESS, refer to Note 53 to the financial statements on Equity Compensation Benefits.
dIRECToRS’ REPoRTfoR ThE fINANCIAL yEAR ENdEd 30 JuNE 2018
126ANNUALREPORT2018
HONG LEONG BANK BERHAD
STATuToRy INfoRmATIoN REgARdINg ThE gRouP ANd ThE BANk
(I) As at the end of the financial year
(a) Before the financial statements of the Group and the Bank were prepared, the Directors took reasonable steps:
(i) to ascertain that proper action had been taken in relation to the writing off of bad debts and financing and the making of allowance for doubtful debts and financing and had satisfied themselves that all known bad debts and financing had been written off and that adequate allowance had been made for doubtful debts and financing; and
(ii) to ensure that any current assets, which were unlikely to be realised in the ordinary course of business including the values of current assets as shown in the accounting records of the Group and of the Bank had been written down to an amount which the current assets might be expected so to realise.
(b) In the opinion of the Directors, the results of the operations of the Group and the Bank during the financial year had not been substantially affected by any item, transaction or event of a material and unusual nature.
(II) from the end of the financial year to the date of this report
(a) The Directors are not aware of any circumstances:
(i) which would render the amount written off for bad debts and financing or the amount of the allowance for doubtful debts and financing in the financial statements of the Group and the Bank, inadequate to any substantial extent;
(ii) which would render the values attributed to current assets in the financial statements of the Group and the Bank misleading; and
(iii) which had arisen which would render adherence to the existing method of valuation of assets or liabilities of the Group and the Bank misleading or inappropriate.
(b) In the opinion of the Directors:
(i) the results of the operations of the Group and the Bank for the financial year ended 30 June 2018 are not likely to be substantially affected by any item, transaction or event of a material and unusual nature which had arisen in the interval between the end of the financial year and the date of this report; and
(ii) no contingent or other liability has become enforceable, or is likely to become enforceable, within the period of twelve months after the end of the financial year which will or may affect the ability of the Group and the Bank to meet their obligations as and when they fall due.
(III) As at the date of this report
(a) There are no charges on the assets of the Group and the Bank which had arisen since the end of the financial year to secure the liabilities of any other person.
(b) There are no contingent liabilities which had arisen since the end of the financial year.
(c) The Directors are not aware of any circumstances not otherwise dealt with in the report or financial statements of the Group and the Bank which would render any amount stated in the financial statements misleading.
dIRECToRS’ REPoRTfoR ThE fINANCIAL yEAR ENdEd 30 JuNE 2018

127ANNUALREPORT
2018
FINANCIALS
dISCLoSuRE of ShARIAh CommITTEE
The Group’s Islamic banking activity is subject to the Shariah compliance and confirmation by the Shariah Committee consisting of 5 scholars, at all times, appointed by the Board of Directors of Hong Leong Islamic Bank Berhad and approved by BNM.
The primary role of the Shariah Committee is mainly advising on matters relating to the business operations and products of the Group and providing support by attending regular meetings with the Group to ensure that they are in conformity with Shariah principles.
hoLdINg ANd uLTImATE hoLdINg ComPANIES
The holding and ultimate holding companies are Hong Leong Financial Group Berhad and Hong Leong Company (Malaysia) Berhad respectively. Both companies are incorporated in Malaysia.
SuBSIdIARIES
Details of subsidiaries are set out in Note 13 to the financial statements.
AudIToRS’ REmuNERATIoN
Details of auditors’ remuneration are set out in Note 34 to the financial statements.
AudIToRS
The auditors, PricewaterhouseCoopers PLT (LLP0014401-LCA & AF 1146), have expressed their willingness to continue in office.
PricewaterhouseCoopers PLT (LLP0014401-LCA & AF 1146) was registered on 2 January 2018 and with effect from that date PricewaterhouseCoopers (AF1146), a conventional partnership was converted to a limited liability partnership.
This report was approved by the Board of Directors on 19 September 2018. Signed on behalf of the Board of Directors:
Tan kong khoon
Lim Lean See
Kuala Lumpur19 September 2018
dIRECToRS’ REPoRTfoR ThE fINANCIAL yEAR ENdEd 30 JuNE 2018

128ANNUALREPORT2018
HONG LEONG BANK BERHAD
The group The Bank 2018 2017 2018 2017 Note Rm’000 Rm’000 Rm’000 Rm’000
AssetsCash and short-term funds 3 6,472,405 10,823,310 5,550,388 10,199,194Deposits and placements with banks and other financial institutions 4 2,796,480 826,743 2,705,522 393,664Securities purchased under resale agreements – 300,880 – 300,880Financial assets held-for-trading 5 5,969,872 5,688,165 5,619,035 5,405,310Financial investments available-for-sale 6 31,862,936 27,654,217 29,018,580 24,886,280Financial investments held-to-maturity 7 14,436,945 13,060,604 10,906,565 10,408,793Loans, advances and financing 8 128,059,105 123,990,941 104,274,903 102,538,550Other assets 9 780,069 1,407,731 686,696 1,309,339Derivative financial instruments 10 918,067 953,042 932,926 947,583Amount due from subsidiaries 11 – – 43,563 13,484Statutory deposits with Central Banks 12 4,312,482 3,738,230 3,453,017 2,986,547Subsidiary companies 13 – – 2,157,132 1,662,409Investment in joint venture 14 179,426 169,185 76,711 76,711Investment in associated companies 15 3,651,091 3,466,891 946,525 946,525Property and equipment 16 1,414,975 1,423,097 782,853 774,999Intangible assets 17 152,541 213,323 137,166 194,870Goodwill 18 1,831,312 1,831,312 1,771,547 1,771,547Deferred tax assets 19 53,067 4,851 47,908 –
Total assets 202,890,773 195,552,522 169,111,037 164,816,685
LiabilitiesDeposits from customers 20 157,414,095 155,233,205 129,583,425 129,859,403Deposits and placements of banks and other financial institutions 21 7,237,434 5,486,692 7,245,854 5,460,076Obligations on securities sold under repurchase agreements 3,831,869 2,829,617 3,805,119 2,801,366Bills and acceptances payable 544,451 364,675 506,971 348,841Other liabilities 22 4,719,446 4,052,667 3,932,169 3,475,689Derivative financial instruments 10 1,020,196 1,405,652 983,680 1,363,654Recourse obligation on loans sold to Cagamas Berhad 23 202,952 202,926 202,952 202,926Tier 2 subordinated bonds 24 2,902,908 2,402,145 2,502,278 2,001,642Multi-currency Additional Tier 1 capital securities 25 401,192 – 401,192 –Innovative Tier 1 capital securities 26 512,352 515,623 512,352 515,623Provision for taxation 211,619 201,713 171,958 173,953Deferred tax liabilities 19 – 172,194 – 171,131
Total liabilities 178,998,514 172,867,109 149,847,950 146,374,304
EquityShare capital 27 7,739,063 7,739,063 7,739,063 7,739,063Reserves 28 16,885,463 15,680,311 12,256,291 11,437,279Less: Treasury shares 29 (732,267) (733,961) (732,267) (733,961)
Total equity 23,892,259 22,685,413 19,263,087 18,442,381
Total equity and liabilities 202,890,773 195,552,522 169,111,037 164,816,685
Commitments and contingencies 42 167,840,081 163,004,495 162,664,431 156,405,399
The accompanying notes form an integral part of the financial statements
STATEmENTS of fINANCIAL PoSITIoNAS AT 30 JuNE 2018
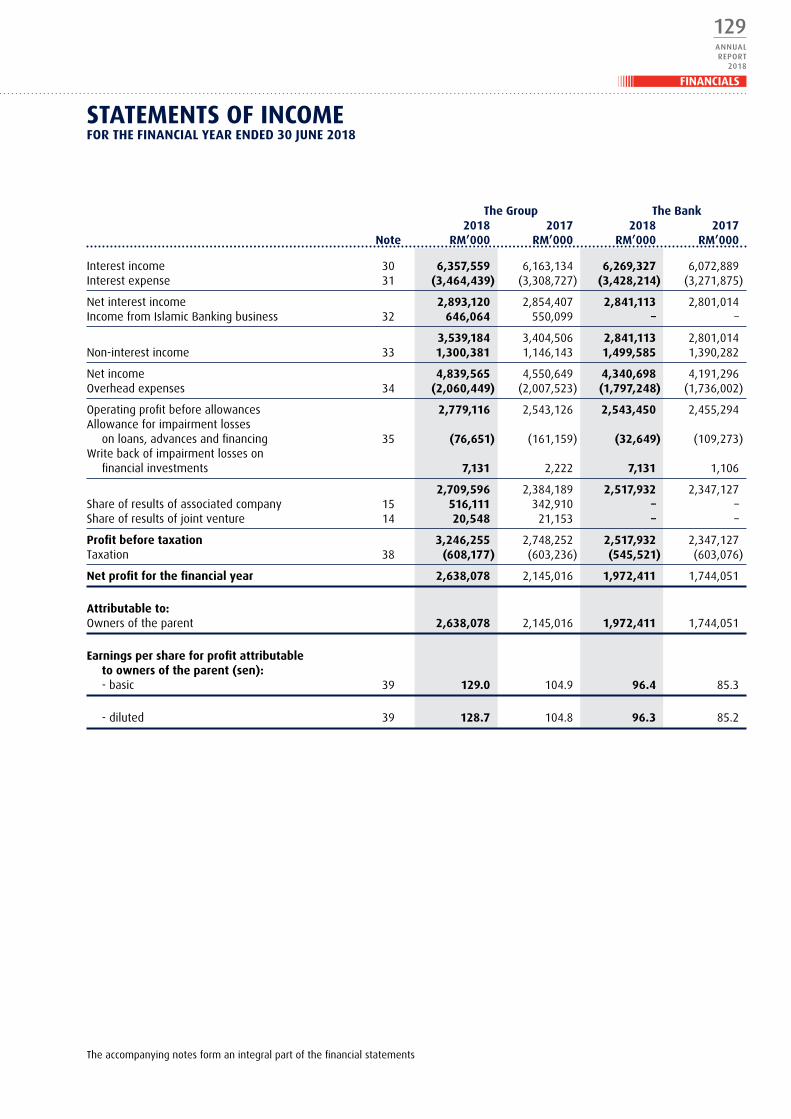
129ANNUALREPORT
2018
FINANCIALS
The group The Bank 2018 2017 2018 2017 Note Rm’000 Rm’000 Rm’000 Rm’000
Interest income 30 6,357,559 6,163,134 6,269,327 6,072,889Interest expense 31 (3,464,439) (3,308,727) (3,428,214) (3,271,875)
Net interest income 2,893,120 2,854,407 2,841,113 2,801,014Income from Islamic Banking business 32 646,064 550,099 – –
3,539,184 3,404,506 2,841,113 2,801,014Non-interest income 33 1,300,381 1,146,143 1,499,585 1,390,282
Net income 4,839,565 4,550,649 4,340,698 4,191,296Overhead expenses 34 (2,060,449) (2,007,523) (1,797,248) (1,736,002)
Operating profit before allowances 2,779,116 2,543,126 2,543,450 2,455,294Allowance for impairment losses
on loans, advances and financing 35 (76,651) (161,159) (32,649) (109,273)Write back of impairment losses on
financial investments 7,131 2,222 7,131 1,106
2,709,596 2,384,189 2,517,932 2,347,127Share of results of associated company 15 516,111 342,910 – –Share of results of joint venture 14 20,548 21,153 – –
Profit before taxation 3,246,255 2,748,252 2,517,932 2,347,127Taxation 38 (608,177) (603,236) (545,521) (603,076)
Net profit for the financial year 2,638,078 2,145,016 1,972,411 1,744,051
Attributable to:Owners of the parent 2,638,078 2,145,016 1,972,411 1,744,051
Earnings per share for profit attributable to owners of the parent (sen):- basic 39 129.0 104.9 96.4 85.3
- diluted 39 128.7 104.8 96.3 85.2
STATEmENTS of INComEfoR ThE fINANCIAL yEAR ENdEd 30 JuNE 2018
The accompanying notes form an integral part of the financial statements
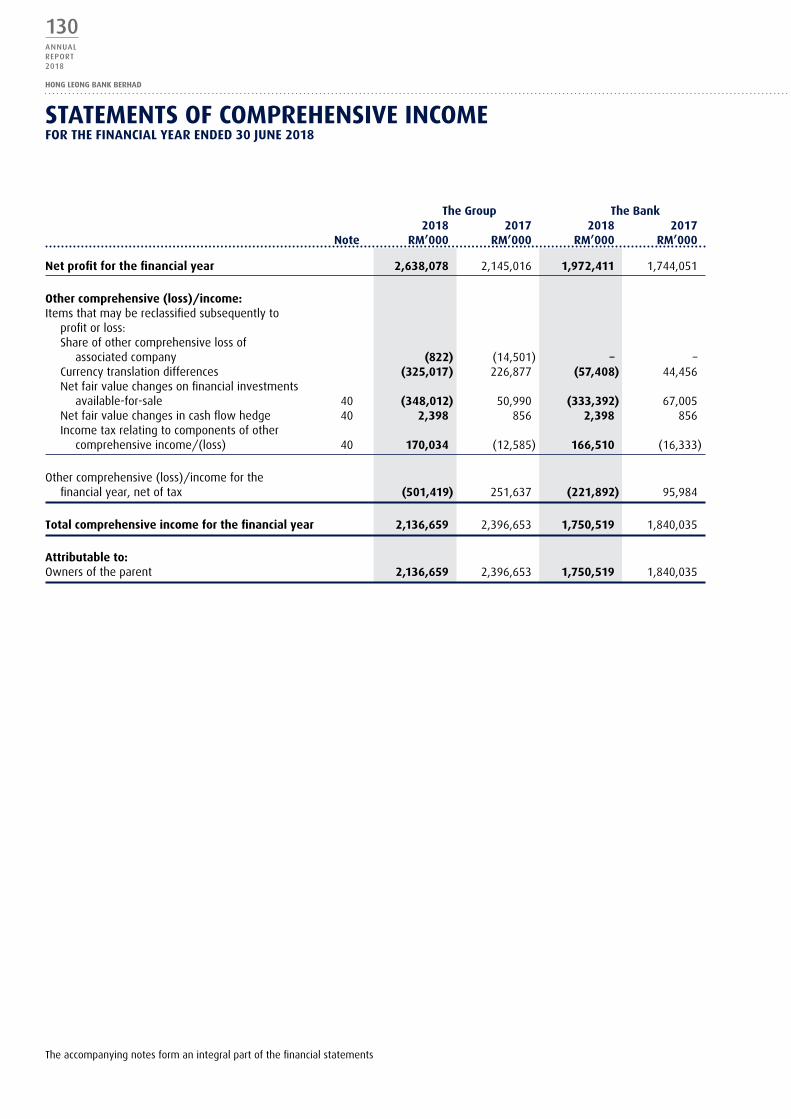
130ANNUALREPORT2018
HONG LEONG BANK BERHAD
The group The Bank 2018 2017 2018 2017 Note Rm’000 Rm’000 Rm’000 Rm’000
Net profit for the financial year 2,638,078 2,145,016 1,972,411 1,744,051
other comprehensive (loss)/income:Items that may be reclassified subsequently to
profit or loss:Share of other comprehensive loss of
associated company (822) (14,501) – –Currency translation differences (325,017) 226,877 (57,408) 44,456Net fair value changes on financial investments
available-for-sale 40 (348,012) 50,990 (333,392) 67,005Net fair value changes in cash flow hedge 40 2,398 856 2,398 856Income tax relating to components of other
comprehensive income/(loss) 40 170,034 (12,585) 166,510 (16,333)
Other comprehensive (loss)/income for the financial year, net of tax (501,419) 251,637 (221,892) 95,984
Total comprehensive income for the financial year 2,136,659 2,396,653 1,750,519 1,840,035
Attributable to:Owners of the parent 2,136,659 2,396,653 1,750,519 1,840,035
STATEmENTS of ComPREhENSIVE INComEfoR ThE fINANCIAL yEAR ENdEd 30 JuNE 2018
The accompanying notes form an integral part of the financial statements

131ANNUALREPORT
2018
FINANCIALS
Attributable to owners of the parent Share Treasury Regulatory other Retained capital shares* reserves^ reserves profits Total The group Note Rm’000 Rm’000 Rm’000 Rm’000 Rm’000 Rm’000
At 1 July 2017 7,739,063 (733,961) 678,483 1,441,246 13,560,582 22,685,413
Comprehensive incomeNet profit for the financial year – – – – 2,638,078 2,638,078Share of other comprehensive
loss of associates – – – (822) – (822)Net fair value changes
in financial investments available-for-sale 40 – – – (177,480) – (177,480)
Net fair value changes in cash flow hedge 40 – – – 1,900 – 1,900
Currency translation differences – – – (325,017) – (325,017)
Total comprehensive (loss)/income – – – (501,419) 2,638,078 2,136,659
Transactions with ownersTransfer to regulatory reserve – – 74,456 – (74,456) –Dividends paid:- final dividend for the
financial year ended 30 June 2017 41 – – – – (613,680) (613,680)
- interim dividend for the financial year ended 30 June 2018 41 – – – – (327,333) (327,333)
ESS exercised – 1,694 – (3,036) 1,342 –Option charge arising
from ESS granted – – – 11,200 – 11,200
Total transactions with owners – 1,694 74,456 8,164 (1,014,127) (929,813)
At 30 June 2018 7,739,063 (732,267) 752,939 947,991 15,184,533 23,892,259
* Treasury shares consist of two categories which are detailed in Note 29
^ Comprise regulatory reserves maintained by the Group’s banking subsidiaries of RM741,694,000 (30 June 2017: RM667,238,000) in accordance with BNM’s Policy Document on Classification and Impairment Provisions for Loans/Financing and the banking subsidiary in Vietnam with the State Bank of Vietnam of RM11,245,000 (30 June 2017: RM11,245,000)
STATEmENTS of ChANgES IN EquITyfoR ThE fINANCIAL yEAR ENdEd 30 JuNE 2018
The accompanying notes form an integral part of the financial statements

132ANNUALREPORT2018
HONG LEONG BANK BERHAD
Attributable to owners of the parent Share Share Treasury Statutory Regulatory other Retained capital premium shares* reserve reserves ^ reserves profits Total The group Note Rm’000 Rm’000 Rm’000 Rm’000 Rm’000 Rm’000 Rm’000 Rm’000
At 1 July 2016 2,167,718 5,571,345 (735,040) 3,920,716 598,772 1,181,271 8,412,365 21,117,147
Comprehensive incomeNet profit for the financial year – – – – – – 2,145,016 2,145,016Share of other comprehensive
loss of associates – – – – – (14,501) – (14,501)Net fair value changes in
financial investments available-for-sale 40 – – – – – 38,611 – 38,611
Net fair value changes in cash flow hedge 40 – – – – – 650 – 650
Currency translation differences – – – – – 226,877 – 226,877
Total comprehensive income – – – – – 251,637 2,145,016 2,396,653
Transactions with ownersTransfer to retained profits – – – (3,920,716) – – 3,920,716 –Transfer to regulatory reserve – – – – 79,711 – (79,711) –Dividends paid:- final dividend for the
financial year ended 30 June 2016 41 – – – – – – (531,818) (531,818)
- interim dividend for the financial year ended 30 June 2017 41 – – – – – – (306,840) (306,840)
Transition to no par value regime under the Companies Act 2016 ** 28(b) 5,571,345 (5,571,345) – – – – – –
ESS exercised - - 1,079 – – (1,933) 854 –Option charge arising
from ESS granted – – – – – 10,271 – 10,271
Total transactions with owners 5,571,345 (5,571,345) 1,079 (3,920,716) 79,711 8,338 3,003,201 (828,387)
At 30 June 2017 7,739,063 – (733,961) – 678,483 1,441,246 13,560,582 22,685,413
* Treasury shares consist of two categories which are detailed in Note 29
** The New Companies Act 2016 (“New Act”), which came into operation on 31 January 2017, abolished the concept of authorised share capital and par value of share capital. Consequently, any amount standing to the credit of the share premium account of RM 5,571,345,000 becomes part of the Group’s share capital pursuant to the transitional provisions set out in Section 618(2) of the New Act. There is no impact on the numbers of ordinary shares in issue or the relative entitlement of any of the members as a result of this transition.
^ Comprise regulatory reserves maintained by the Group’s banking subsidiaries of RM667,238,000 (30 June 2016: RM587,527,000) in accordance with BNM’s Policy Document on Classification and Impairment Provisions for Loans/Financing and the banking subsidiary in Vietnam with the State Bank of Vietnam of RM11,245,000 (30 June 2016: RM11,245,000)
STATEmENTS of ChANgES IN EquITyfoR ThE fINANCIAL yEAR ENdEd 30 JuNE 2018
The accompanying notes form an integral part of the financial statements

133ANNUALREPORT
2018
FINANCIALS
Non-distributable distributable Share Treasury Regulatory other Retained capital shares* reserve reserves profits Total The Bank Note Rm’000 Rm’000 Rm’000 Rm’000 Rm’000 Rm’000
At 1 July 2017 7,739,063 (733,961) 571,678 620,396 10,245,205 18,442,381
Comprehensive incomeNet profit for the financial year – – – – 1,972,411 1,972,411Net fair value changes
in financial investments available-for-sale 40 – – – (166,384) – (166,384)
Net fair value changes in cash flow hedge 40 – – – 1,900 – 1,900
Currency translation differences – – – (57,408) – (57,408)
Total comprehensive (loss)/income – – – (221,892) 1,972,411 1,750,519
Transactions with ownersTransfer to regulatory reserve – – 65,420 – (65,420) –Dividends paid:- final dividend for the
financial year ended 30 June 2017 41 – – – – (613,680) (613,680)
- interim dividend for the financial year ended 30 June 2018 41 – – – – (327,333) (327,333)
ESS exercised – 1,694 – (3,036) 1,342 –Option charge arising
from ESS granted – – - 11,200 – 11,200
Total transactions with owners – 1,694 65,420 8,164 (1,005,091) (929,813)
At 30 June 2018 7,739,063 (732,267) 637,098 406,668 11,212,525 19,263,087
* Treasury shares consist of two categories which are detailed in Note 29
STATEmENTS of ChANgES IN EquITyfoR ThE fINANCIAL yEAR ENdEd 30 JuNE 2018
The accompanying notes form an integral part of the financial statements

134ANNUALREPORT2018
HONG LEONG BANK BERHAD
Non-distributable distributable Share Share Treasury Statutory Regulatory other Retained capital premium shares* reserve reserve reserves profits Total The Bank Note Rm’000 Rm’000 Rm’000 Rm’000 Rm’000 Rm’000 Rm’000 Rm’000
At 1 July 2016 2,167,718 5,571,345 (735,040) 3,380,604 495,008 516,074 6,035,024 17,430,733
Comprehensive incomeNet profit for the financial year – – – – – – 1,744,051 1,744,051Net fair value changes
in financial investments available-for-sale 40 – – – – – 50,878 – 50,878
Net fair value changes in cash flow hedge 40 – – – – – 650 – 650
Currency translation differences – – – – – 44,456 – 44,456
Total comprehensive income – – – – – 95,984 1,744,051 1,840,035
Transactions with ownersTransfer to retained profits – – – (3,380,604) – – 3,380,604 –Transfer to regulatory
reserve – – – – 76,670 – (76,670) –Dividends paid:- final dividend for the
financial year ended 30 June 2016 41 – – – – – – (531,818) (531,818)
- interim dividend for the financial year ended 30 June 2017 41 – – – – – – (306,840) (306,840)
Transition to no-par value regime under the Companies Act 2016 ** 5,571,345 (5,571,345) – – – – –
ESS exercised – – 1,079 – – (1,933) 854 –Option charge arising
from ESS granted – – – – – 10,271 – 10,271
Total transactions with owners 5,571,345 (5,571,345) 1,079 (3,380,604) 76,670 8,338 2,466,130 (828,387)
At 30 June 2017 7,739,063 – (733,961) – 571,678 620,396 10,245,205 18,442,381
* Treasury shares consist of two categories which are detailed in Note 29
** The New Act, which came into operation on 31 January 2017, abolished the concept of authorised share capital and par value of share capital. Consequently, any amount standing to the credit of the share premium account of RM 5,571,345,000 becomes part of the Bank’s share capital pursuant to the transitional provisions set out in Section 618(2) of the New Act. There is no impact on the numbers of ordinary shares in issue or the relative entitlement of any of the members as a result of this transition.
STATEmENTS of ChANgES IN EquITyfoR ThE fINANCIAL yEAR ENdEd 30 JuNE 2018
The accompanying notes form an integral part of the financial statements
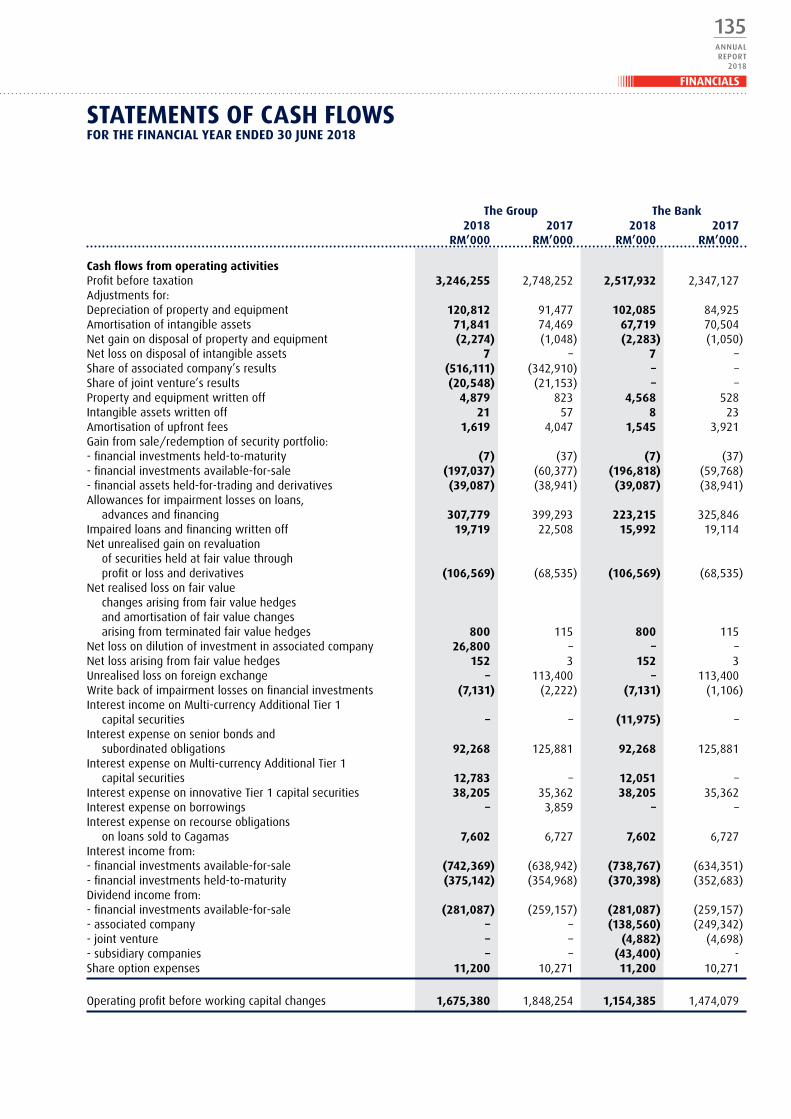
135ANNUALREPORT
2018
FINANCIALS
The group The Bank 2018 2017 2018 2017 Rm’000 Rm’000 Rm’000 Rm’000
Cash flows from operating activitiesProfit before taxation 3,246,255 2,748,252 2,517,932 2,347,127Adjustments for:Depreciation of property and equipment 120,812 91,477 102,085 84,925Amortisation of intangible assets 71,841 74,469 67,719 70,504Net gain on disposal of property and equipment (2,274) (1,048) (2,283) (1,050)Net loss on disposal of intangible assets 7 – 7 –Share of associated company’s results (516,111) (342,910) – –Share of joint venture’s results (20,548) (21,153) – –Property and equipment written off 4,879 823 4,568 528Intangible assets written off 21 57 8 23Amortisation of upfront fees 1,619 4,047 1,545 3,921Gain from sale/redemption of security portfolio:- financial investments held-to-maturity (7) (37) (7) (37)- financial investments available-for-sale (197,037) (60,377) (196,818) (59,768)- financial assets held-for-trading and derivatives (39,087) (38,941) (39,087) (38,941)Allowances for impairment losses on loans,
advances and financing 307,779 399,293 223,215 325,846Impaired loans and financing written off 19,719 22,508 15,992 19,114Net unrealised gain on revaluation
of securities held at fair value through profit or loss and derivatives (106,569) (68,535) (106,569) (68,535)
Net realised loss on fair value changes arising from fair value hedges and amortisation of fair value changes arising from terminated fair value hedges 800 115 800 115
Net loss on dilution of investment in associated company 26,800 – – –Net loss arising from fair value hedges 152 3 152 3Unrealised loss on foreign exchange – 113,400 – 113,400Write back of impairment losses on financial investments (7,131) (2,222) (7,131) (1,106)Interest income on Multi-currency Additional Tier 1
capital securities – – (11,975) –Interest expense on senior bonds and
subordinated obligations 92,268 125,881 92,268 125,881Interest expense on Multi-currency Additional Tier 1
capital securities 12,783 – 12,051 –Interest expense on innovative Tier 1 capital securities 38,205 35,362 38,205 35,362Interest expense on borrowings – 3,859 – –Interest expense on recourse obligations
on loans sold to Cagamas 7,602 6,727 7,602 6,727Interest income from:- financial investments available-for-sale (742,369) (638,942) (738,767) (634,351)- financial investments held-to-maturity (375,142) (354,968) (370,398) (352,683)Dividend income from:- financial investments available-for-sale (281,087) (259,157) (281,087) (259,157)- associated company – – (138,560) (249,342)- joint venture – – (4,882) (4,698)- subsidiary companies – – (43,400) -Share option expenses 11,200 10,271 11,200 10,271
Operating profit before working capital changes 1,675,380 1,848,254 1,154,385 1,474,079
STATEmENTS of CASh fLowSfoR ThE fINANCIAL yEAR ENdEd 30 JuNE 2018

136ANNUALREPORT2018
HONG LEONG BANK BERHAD
The group The Bank 2018 2017 2018 2017 Rm’000 Rm’000 Rm’000 Rm’000
(Increase)/decrease in operating assetsCash and short-term funds and deposits and
placements with banks and other financial institutions with original maturity of more than three months (4,044,396) (254,431) (3,958,708) 103,940
Securities purchased under resale agreements 300,880 3,755,790 300,880 3,755,790Financial assets held-for-trading (273,262) (372,642) (205,280) (284,740)Loans, advances and financing (4,398,167) (4,954,752) (1,978,065) (2,824,452)Derivative financial instruments 3,694 41,467 37,948 72,034Other assets 627,662 295,432 622,642 124,192Amount due from subsidiaries – – (30,079) 992Statutory deposits with Central Banks (574,252) 557,889 (466,470) 616,389
Increase/(decrease) in operating liabilitiesDeposits from customers 2,350,935 6,829,012 (160,505) 3,700,184Deposits and placements of banks
and other financial institutions 1,750,742 (714,538) 1,785,778 (353,557)Securities sold under repurchase agreements 1,002,252 (665,286) 1,003,753 (693,537)Bills and acceptances payable 179,776 14,220 158,130 14,889Derivative financial instruments (385,456) (143,956) (379,974) (168,475)Other liabilities 675,749 148,599 464,575 (68,728)
Cash flows (used in)/generated from operations (1,108,463) 6,385,058 (1,650,990) 5,469,000Taxation paid (660,026) (391,020) (571,611) (322,256)
Net cash (used in)/generated from operating activities (1,768,489) 5,994,038 (2,222,601) 5,146,744
Cash flows from investing activities
Net purchases of financial investments available-for-sale (3,617,252) (1,018,024) (3,530,034) (267,494)
Net purchases of financial investments held-to-maturity (994,134) (934,109) (120,309) (50,633)
Proceeds from sale of intangible assets 1 – 1 –Purchase of property and equipment (124,689) (158,127) (119,942) (147,335)Net proceeds from sale of property and equipment 5,729 3,901 5,569 3,523Purchase of intangible assets (11,337) (19,530) (9,681) (18,613)Investment in Additional Tier 1 perpetual
surbordinated sukuk wakalah – – (389,824) –Investment in subordinated facilities – – (66) –Investment in subsidiary company – – (92,857) (132,649)Dividends received from:- Subsidiary companies – – 43,400 –- Associated company 101,111 181,953 101,111 181,953- Joint venture 3,563 3,428 3,563 3,428- Financial investments available-for-sale 281,087 259,157 281,087 259,157
Net cash used in investing activities (4,355,921) (1,681,351) (3,827,982) (168,663)
STATEmENTS of CASh fLowSfoR ThE fINANCIAL yEAR ENdEd 30 JuNE 2018

137ANNUALREPORT
2018
FINANCIALS
The group The Bank 2018 2017 2018 2017 Note Rm’000 Rm’000 Rm’000 Rm’000
Cash flows from financing activitiesDividends paid (941,013) (838,658) (941,013) (838,658)Repayment of USD 300.0 million senior bonds – (1,323,150) – (1,323,150)Proceeds from debt issuance:- Tier 2 subordinated bonds 500,000 – 500,000 –- Multi-currency Additional Tier 1 capital securities 400,000 – 400,000 –- Recourse obligation on loans sold to Cagamas – 200,050 – 200,050Interest paid:- Senior bonds and subordinated obligations (91,947) (133,363) (92,000) (133,258)- Multi-currency Additional Tier 1 capital securities (10,984) – (10,252) -- Innovative Tier 1 capital securities (38,431) (35,362) (38,431) (35,362)- Recourse obligation on loans sold to Cagamas (7,576) (3,851) (7,576) (3,851)Repayment of borrowings – (388,589) – –
Net cash used in financing activities (189,951) (2,522,923) (189,272) (2,134,229)
Net (decrease)/increase in cash and cash equivalents (6,314,361) 1,789,764 (6,239,855) 2,843,852Effects of exchange rate changes (111,203) 74,543 (55,801) 43,650Cash and cash equivalents at the beginning
of financial year 10,388,873 8,524,566 9,578,350 6,690,848
Cash and cash equivalents at the end of financial year 3,963,309 10,388,873 3,282,694 9,578,350
Cash and cash equivalents comprise the following:Cash and short-term funds 3 6,472,405 10,823,310 5,550,388 10,199,194Deposits and placements with banks
and other financial institutions 4 2,796,480 826,743 2,705,522 393,664
9,268,885 11,650,053 8,255,910 10,592,858
Less:Cash and short-term funds and deposits and
placements with banks and other financial institutions with original maturity of more than three months (5,305,576) (1,261,180) (4,973,216) (1,014,508)
3,963,309 10,388,873 3,282,694 9,578,350
The accompanying notes form an integral part of the financial statements
STATEmENTS of CASh fLowSfoR ThE fINANCIAL yEAR ENdEd 30 JuNE 2018

138ANNUALREPORT2018
HONG LEONG BANK BERHAD
STATEmENTS of CASh fLowSfoR ThE fINANCIAL yEAR ENdEd 30 JuNE 2018
An analysis of changes in liabilities arising from financing activities for the financial year ended 30 June 2018 is as follows:
Cash Changes Non-Cash Changes Balance at the Repayments Balance at the beginning of the Proceeds from Accrued Amortisation/ other end of the The group financial year from issuance redemption Interest paid interest (accretion) non-cash* financial year 2018 Rm’000 Rm’000 Rm’000 Rm’000 Rm’000 Rm’000 Rm’000 Rm’000
Recourse obligation on loans sold to Cagamas Berhad 202,926 – – (7,576) 7,602 – – 202,952
Tier 2 subordinated bonds 2,402,145 500,000 – (91,947) 92,268 442 – 2,902,908
Multi-currency Additional Tier 1 capital securities – 400,000 – (10,984) 12,783 (607) – 401,192
Innovative Tier 1 capital securities 515,623 – – (38,431) 38,205 1,784 (4,829) 512,352
3,120,694 900,000 – (148,938) 150,858 1,619 (4,829) 4,019,404
Cash Changes Non-Cash Changes Balance at the Repayments Balance at the beginning of the Proceeds from Accrued Amortisation/ other end of the The Bank financial year from issuance redemption Interest paid interest (accretion) non-cash* financial year 2018 Rm’000 Rm’000 Rm’000 Rm’000 Rm’000 Rm’000 Rm’000 Rm’000
Recourse obligation on loans sold to Cagamas Berhad 202,926 – – (7,576) 7,602 – – 202,952
Tier 2 subordinated bonds 2,001,642 500,000 – (92,000) 92,268 368 – 2,502,278
Multi-currency Additional Tier 1 capital securities – 400,000 – (10,252) 12,051 (607) – 401,192
Innovative Tier 1 capital securities 515,623 – – (38,431) 38,205 1,784 (4,829) 512,352
2,720,191 900,000 – (148,259) 150,126 1,545 (4,829) 3,618,774
* Other non-cash item comprises changes in fair value adjustments on completion of business combination accounting as disclosed in Note 26.

139ANNUALREPORT
2018
FINANCIALS
The following accounting policies have been used consistently in dealing with items that are considered material in relation to the financial statements.
1 BASIS of PREPARATIoN of ThE fINANCIAL STATEmENTS
The financial statements of the Group and of the Bank have been prepared in accordance with the Malaysian Financial Reporting Standards (“MFRS”), International Financial Reporting Standards (“IFRS”) and the requirements of the Companies Act 2016, in Malaysia.
The financial statements have been prepared under the historical cost convention, as modified by the revaluation of financial investments available-for-sale and financial assets/financial liabilities at fair value through profit or loss (including derivative financial instruments).
The financial statements incorporate the activities relating to Islamic Banking which have been undertaken by the Group in compliance with Shariah principles. Islamic Banking business refers generally to the acceptance of deposits and granting of financing under the Shariah principles.
The preparation of financial statements in conformity with MFRS requires the use of certain critical accounting estimates and assumptions that affect the reported amounts of assets and liabilities and disclosure of contingent assets and liabilities at the date of the financial statements, and the reported amounts of revenues and expenses during the reported financial year. It also requires Directors to exercise their judgment in the process of applying the Group and the Bank’s accounting policies. Although these estimates and judgment are based on the Directors’ best knowledge of current events and actions, actual results may differ.
The areas involving a higher degree of judgment or complexity, or areas where assumptions and estimates are significant to the financial statements are disclosed in Note 54.
A Standards, amendments to published standards and interpretations that are effective and applicable to the group and the Bank
The Group has applied the following amendments for the first time for the financial year beginning on 1 July 2017:
* Amendments to MFRS 107 ‘Statement of Cash Flows – Disclosure Initiative’* Amendments to MFRS 112 ‘Income Taxes – Recognition of Deferred Tax Assets for Unrealised Losses’* Annual Improvements to MFRSs 2014 – 2016 Cycle: MFRS 12 ‘Disclosures of Interests in Other Entities’
The adoption of the Amendments to MFRS 107 has required additional disclosure of changes in liabilities arising from financing activities. Other than that, the adoption of these amendments did not have any impact on the current period or any prior period and is not likely to affect future periods.
B Standards, amendments to published standards and interpretations to existing standards that are applicable to the group and the Bank that have been issued but not yet effective
A number of new standards and amendments to standards and interpretations are effective for financial year beginning after 1 July 2018 that are applicable to the Group and the Bank are as follows.
(i) financial year beginning on/after 1 July 2018
* IC Interpretation 22 ‘Foreign Currency Transactions and Advance Consideration’ (effective from 1 January 2018) applies when an entity recognises a non-monetary asset or non-monetary liability arising from the payment or receipt of advance consideration. MFRS 121 requires an entity to use the exchange rate at the ‘date of the transaction’ to record foreign currency transactions.
IC Interpretation 22 provides guidance how to determine ‘the date of transaction’ when a single payment/ receipt is made, as well as for situations where multiple payments/receipts are made.
The date of transaction is the date when the payment or receipt of advance consideration gives rise to the non-monetary asset or non-monetary liability when the entity is no longer exposed to foreign exchange risk.
NoTES To ThE fINANCIAL STATEmENTSfoR ThE fINANCIAL yEAR ENdEd 30 JuNE 2018
140ANNUALREPORT2018
HONG LEONG BANK BERHAD
1 BASIS of PREPARATIoN of ThE fINANCIAL STATEmENTS (CoNTINuEd)
B Standards, amendments to published standards and interpretations to existing standards that are applicable to the group and the Bank that have been issued but not yet effective (continued)
(i) financial year beginning on/after 1 July 2018 (continued)
If there are multiple payments or receipts in advance, the entity should determine the date of the transaction for each payment or receipt.
An entity has the option to apply IC Interpretation 22 retrospectively or prospectively.
* MFRS 9 ‘Financial Instruments’ (effective from 1 January 2018) will replace MFRS 139 “Financial Instruments: Recognition and Measurement”.
Classification and measurements
MFRS 9 retains but simplifies the mixed measurement model in MFRS 139 and establishes three primary measurement categories for financial assets: amortised cost, fair value through profit or loss (“FVTPL”) and fair value through other comprehensive income (“OCI”). The basis of classification depends on the entity’s business model and the cash flow characteristics of the financial asset. Investments in equity instruments are always measured at fair value through profit or loss with an irrevocable option at inception to present changes in fair value in OCI (provided the instrument is not held for trading). A debt instrument is measured at amortised cost only if the entity is holding it to collect contractual cash flows and the cash flows represent principal and interest.
For liabilities, the standard retains most of the MFRS 139 requirements. These include amortised cost accounting for most financial liabilities, with bifurcation of embedded derivatives. The main change is:
* For financial liabilities classified as FVTPL, the fair value changes due to own credit risk should be recognised directly to OCI. There is no subsequent recycling to profit or loss.
The combined application of the entity’s business model and the cash flow characteristics of the financial assets do not result in the significant change in the classification of financial asset when compared to the existing classification of financial assets in the statement of financial position as at 30 June 2018.
However, the Group and the Bank have identified certain financial investments currently held at both held-to-maturity and available-for-sale which fail the solely for the payment of principal and interest (“SPPI”) test to be reclassified as fair value through profit or loss (“FVTPL”) accordingly on 1 July 2018.
Certain debt instruments which pass the SPPI test have been re-designated from held-to-maturity to fair value through OCI; held for trading to fair value through OCI; and available-for-sale to amortised cost.
The Group and the Bank have classified and measured all equity instruments that are not held for trading at FVTPL except for certain equity instruments which have been identified to elect, at inception, the irrevocable option to present changes in fair value in OCI.
The Group and the Bank do not expect a significant impact arising from the changes in classification and measurement of the financial assets.
There will be no significant changes to the Group’s and the Bank’s accounting for financial liabilities as it largely retains the MFRS 139 requirements. All the financial liabilities, except for derivatives financial liabilities and financial liabilities designated at FVTPL, will remain as amortised cost as there has not been significant change in the requirements for financial liabilities under MFRS 9.
NoTES To ThE fINANCIAL STATEmENTSfoR ThE fINANCIAL yEAR ENdEd 30 JuNE 2018
141ANNUALREPORT
2018
FINANCIALS
1 BASIS of PREPARATIoN of ThE fINANCIAL STATEmENTS (CoNTINuEd)
B Standards, amendments to published standards and interpretations to existing standards that are applicable to the group and the Bank that have been issued but not yet effective (continued)
(i) financial year beginning on/after 1 July 2018 (continued)
* MFRS 9 ‘Financial Instruments’ (effective from 1 January 2018) will replace MFRS 139 “Financial Instruments: Recognition and Measurement” (continued).
Impairment of financial assets
MFRS 9 introduces an expected credit loss model on impairment that replaces the incurred loss impairment model used in MFRS 139. The expected credit loss model is forward-looking and eliminates the need for a trigger event to have occurred before credit losses are recognised.
The new impairment model requires the recognition of impairment allowances based on expected credit losses (“ECL”) rather than only incurred credit losses as is the case under MFRS 139. It applies to financial assets classified at amortised cost, debt instruments measured at FVOCI, lease receivables, loan commitments, financial guarantee contracts and other loan commitments.
Under MFRS 9, impairment will be measured on each reporting date according to a three-stage expected credit loss impairment model:
* Stage 1 – from initial recognition of financial assets to the date on which the credit risk of the asset has increased significantly relative to its initial recognition, a loss allowance is recognised equal to the credit losses expected to result from defaults occurring over the next 12 months (12-month ECL).
* Stage 2 – following a significant increase in credit risk relative to the initial recognition of the financial assets, a loss allowance is recognised equal to the credit losses expected over the remaining life of the asset (Lifetime ECL).
* Stage 3 – When a financial asset is considered to be credit-impaired, a loss allowance equal to full lifetime expected credit losses is to be recognised (Lifetime ECL).
As all financial assets within the scope of MFRS 9 impairment model will be assessed for at least 12-month ECL, and the population of financial assets to which full lifetime ECL applies is larger than the population of impaired loans for which there is objective evidence of impairment in accordance with MFRS 139, the total allowance for credit losses is expected to increase under MFRS 9 relative to the allowance for credit losses under MFRS 139.
In addition, changes in the required credit loss allowance, including the impact of movements between Stage 1 (12-month ECL) and Stage 2 (lifetime ECL) and the application of forward looking information, will be recorded in profit or loss, allowance for credit losses will be more volatile under MFRS 9.
The assessment of credit risk and the estimation of ECL are required to be unbiased, probability-weighted and should incorporate all available information which is relevant to the assessment, including information about past events, current conditions and reasonable and supportable forecasts of future events and economic conditions at the reporting date. In addition, the estimation of ECL should also take into account the time value of money.
hedge accounting
Under MFRS 9, the general hedge accounting requirements have been simplified for hedge effectiveness testing and permit hedge accounting to be applied to a greater variety of hedging instruments and risks. The Group and the Bank do not expect a significant impact arising from the changes in the hedge accounting requirements.
NoTES To ThE fINANCIAL STATEmENTSfoR ThE fINANCIAL yEAR ENdEd 30 JuNE 2018

142ANNUALREPORT2018
HONG LEONG BANK BERHAD
1 BASIS of PREPARATIoN of ThE fINANCIAL STATEmENTS (CoNTINuEd)
B Standards, amendments to published standards and interpretations to existing standards that are applicable to the group and the Bank that have been issued but not yet effective (continued)
(i) financial year beginning on/after 1 July 2018 (continued)
* MFRS 9 ‘Financial Instruments’ (effective from 1 January 2018) will replace MFRS 139 “Financial Instruments: Recognition and Measurement” (continued).
disclosure
The new standard also introduces expanded disclosure requirements and changes in presentation. These are expected to change the nature and extent of the Group and the Bank’s disclosures about its financial instruments particularly in the year of the adoption of the new standard.
The Group and the Bank will apply the new rules retrospectively from 1 July 2018, with the practical expedients permitted under the standard. Comparatives for 2018 will not be restated.
The Group and the Bank are still in the midst of finalising the financial impact in relation to the adoption of MFRS 9. Based on the preliminary assessments undertaken to-date, the Group and the Bank expect an increase in the allowance for impairment on loans, advances and financing under the new impairment requirements, which will result in a reduction in the Group’s and the Bank’s opening retained profits and overall capital positions as of 1 July 2018.
The Group and Bank are in finalisation stages of the MFRS 9 implementation with a view to ensure full compliance of the standard.
* MFRS 15 ‘Revenue from contracts with customers’ (effective from 1 January 2018) replaces MFRS 118 ‘Revenue’ and MFRS 111 ‘Construction contracts’ and related interpretations.
The core principle in MFRS 15 is that an entity recognises revenue to depict the transfer of promised goods or services to the customer in an amount that reflects the consideration to which the entity expects to be entitled in exchange for those goods or services.
Revenue is recognised when a customer obtains control of goods or services, that is, when the customer has the ability to direct the use of and obtain the benefits from the goods or services.
A new five-step process is applied before revenue can be recognised:* Identify contracts with customers;* Identify the separate performance obligations;* Determine the transaction price of the contract;* Allocate the transaction price to each of the separate performance obligations; and* Recognise the revenue as each performance obligation is satisfied.
Key provisions of the new standard are as follows:
* Any bundled goods or services that are distinct must be separately recognised, and any discounts or rebates on the contract price must generally be allocated to the separate elements.
* If the consideration varies (such as for incentives, rebates, performance fees, royalties, success of an outcome etc.), minimum amounts of revenue must be recognised if they are not at significant risk of reversal.
* The point at which revenue is able to be recognised may shift: some revenue which is currently recognised at a point in time at the end of a contract may have to be recognised over the contract term and vice versa.
* There are new specific rules on licenses, warranties, non-refundable upfront fees, and consignment arrangements, to name a few.
NoTES To ThE fINANCIAL STATEmENTSfoR ThE fINANCIAL yEAR ENdEd 30 JuNE 2018
143ANNUALREPORT
2018
FINANCIALS
1 BASIS of PREPARATIoN of ThE fINANCIAL STATEmENTS (CoNTINuEd)
B Standards, amendments to published standards and interpretations to existing standards that are applicable to the group and the Bank that have been issued but not yet effective (continued)
(i) financial year beginning on/after 1 July 2018 (continued)
* MFRS 15 ‘Revenue from contracts with customers’ (effective from 1 January 2018) replaces MFRS 118 ‘Revenue’ and MFRS 111 ‘Construction contracts’ and related interpretations (continued).
* As with any new standard, there are also increased disclosures.
The Group and the Bank are in the process of finalising the financial implication arising from the adoption of this new standard. Based on the preliminary assessment, the Bank expects no significant impact to the fees and other income for the Group and the Bank.
(ii) financial year beginning on/after 1 July 2019
* MFRS 16 ‘Leases’ (effective from 1 January 2019) supersedes MFRS 117 ‘Leases’ and the related interpretations.
Under MFRS 16, a lease is a contract (or part of a contract) that conveys the right to control the use of an identified asset for a period of time in exchange for consideration.
MFRS 16 eliminates the classification of leases by the lessee as either finance leases (on balance sheet) or operating leases (off balance sheet). MFRS 16 requires a lessee to recognise a “right-of-use” of the underlying asset and a lease liability reflecting future lease payments for most leases.
The right-of-use asset is depreciated in accordance with the principle in MFRS 116 ‘Property, Plant and Equipment’ and the lease liability is accreted over time with interest expense recognised in the income statement.
For lessors, MFRS 16 retains most of the requirements in MFRS 117. Lessors continue to classify all leases as either operating leases or finance leases and account for them differently.
* IC Interpretation 23 ‘Uncertainty over Income Tax Treatments’ (effective 1 January 2019) provides guidance on how to recognise and measure deferred and current income tax assets and liabilities where there is uncertainty over a tax treatment.
If an entity concludes that it is not probable that the tax treatment will be accepted by the tax authority, the effect of the tax uncertainty should be included in the period when such determination is made. An entity shall measure the effect of uncertainty using the method which best predicts the resolution of the uncertainty.
IC Interpretation 23 will be applied retrospectively.
* Amendments to MFRS 128 ‘Long-term Interests in Associates and Joint Ventures’ (effective from 1 January 2019) clarify that an entity should apply MFRS 9 ‘Financial Instruments’ (including the impairment requirements) to long-term interests in an associate or joint venture, which are in substance form part of the entity’s net investment, for which settlement is neither planned nor likely to occur in the foreseeable future.
In addition, such long-term interest are subject to loss allocation and impairment requirements in MFRS 128.
The amendments shall be applied retrospectively.
* Amendments to MFRS 9 ‘Prepayment features with negative compensation’ (effective 1 January 2019) allow companies to measure some prepayable financial assets with negative compensation at amortised cost. Negative compensation arises where the contractual terms permit the borrower to prepay the instrument before its contractual maturity, but the prepayment amount could be less than the unpaid amounts of principal and interest. To qualify for amortised cost measurement, the negative compensation must be reasonable compensation for early termination of the contract, and the asset must be held within a ‘held to collect’ business model.
The amendments will be applied retrospectively.
NoTES To ThE fINANCIAL STATEmENTSfoR ThE fINANCIAL yEAR ENdEd 30 JuNE 2018
144ANNUALREPORT2018
HONG LEONG BANK BERHAD
1 BASIS of PREPARATIoN of ThE fINANCIAL STATEmENTS (CoNTINuEd)
B Standards, amendments to published standards and interpretations to existing standards that are applicable to the group and the Bank that have been issued but not yet effective (continued)
(ii) financial year beginning on/after 1 July 2019 (continued)
* Annual Improvements to MFRSs 2015 – 2017 Cycle:
* Amendments to MFRS 3 ‘Business Combinations’ (effective from 1 January 2019) clarify that when a party obtains control of a business that is a joint operation, the acquirer should account the transaction as a business combination achieved in stages. Accordingly it should remeasure its previously held interest in the joint operation (rights to the assets and obligations for the liabilities) at fair value on the acquisition date.
* Amendments to MFRS 11 ‘Joint Arrangements’ (effective from 1 January 2019) clarify that when a party obtains joint control of a business that is a joint operation, the party should not remeasure its previously held interest in the joint operation.
* Amendments to MFRS 112 ‘Income Taxes’ (effective from 1 January 2019) clarify that where income tax consequences of dividends on financial instruments classified as equity is recognised (either in profit or loss, other comprehensive income or equity) depends on where the past transactions that generated distributable profits were recognised. Accordingly, the tax consequences are recognised in profit or loss when an entity determines payments on such instruments are distribution of profits (that is, dividends). Tax on dividend should not be recognised in equity merely on the basis that it is related to a distribution to owners.
* Amendments to MFRS 123 ‘Borrowing Costs’ (effective from 1 January 2019) clarify that if a specific borrowing remains outstanding after the related qualifying asset is ready for its intended use or sale, it becomes part of general borrowings.
* Amendments to MFRS 119 ‘Plan amendment, curtailment or settlement’ (effective 1 January 2019) requires an entity to use the updated actuarial assumptions from remeasurement of its net defined benefit liability or asset arising from plan amendment, curtailment or settlement, to determine current service cost and net interest for the remaining period after the change to the plan. The amendments will be applied prospectively.
None of the standards, amendments and interpretations that are effective for the respective financial years is expected to have a significant effect on the financial statements of the Group and the Bank, except for MFRS 9.
NoTES To ThE fINANCIAL STATEmENTSfoR ThE fINANCIAL yEAR ENdEd 30 JuNE 2018

145ANNUALREPORT
2018
FINANCIALS
2 SummARy of SIgNIfICANT ACCouNTINg PoLICIES
A Consolidation
(i) Subsidiaries
Subsidiaries are all entities (including structured entities) over which the Group has control. The Group controls an entity when the Group is exposed to, or has rights to, variable returns from its involvement with the entity and has the ability to affect those returns through its power to direct the relevant activities of the entity. Subsidiaries are fully consolidated from the date on which control is transferred to the Group and are de-consolidated from the date control ceases.
The consolidated financial statements include the financial statements of the Bank and all its subsidiaries made up to the end of the financial year.
The Group applies the acquisition method to account for business combinations.
The consideration transferred for the acquisition of a subsidiary is the fair values of the assets transferred, the liabilities incurred to the former owners of the acquiree and the equity interests issued by the Group. The consideration transferred includes the fair value of any asset or liability resulting from a contingent consideration arrangement and fair value of any pre-existing equity interest in the subsidiary. Identifiable assets acquired and liabilities and contingent liabilities assumed in a business combination are with limited exceptions, measured initially at their fair values at the acquisition date. The Group recognises any non-controlling interest in the acquiree on an acquisition-by-acquisition basis, either at fair value or at the non-controlling interest’s proportionate share of the recognised amounts of acquiree’s identifiable net assets.
The excess of the consideration transferred, the amount of any non-controlling interest in the acquiree and the acquisition-date fair value of any previous equity interest in the acquiree over the fair value of the identifiable net assets acquired is recognised as goodwill. If the total of consideration transferred, non-controlling interest recognised and previously held interest measured is less than the fair value of the net assets of the subsidiary acquired in the case of a bargain purchase, the difference is recognised directly in the statements of income.
Acquisition-related costs are expensed as incurred.
If the business combination is achieved in stages, carrying value of the acquirer’s previously held equity interest in the acquiree is remeasured to fair value at the acquisition date, any gains or losses from such re-measurement are recognised in the statements of income.
Any contingent consideration to be transferred by the Group is recognised at fair value at the acquisition date. Subsequent changes to the fair value of the contingent consideration that is deemed to be an asset or liability is recognised in accordance with MFRS 139 in the statements of income. Contingent consideration that is classified as equity is not remeasured, and its subsequent settlement is accounted for within equity.
The Group applies predecessor accounting to account for business combinations under common control. Under predecessor accounting, assets and liabilities acquired are not restated to their respective fair values. They are recognised at the carrying amounts from the consolidated financial statements of the ultimate holding company of the Group and adjusted to conform with the accounting policies adopted by the Group. The difference between any consideration given and the aggregate carrying amounts of the assets and liabilities (as of the date of the transaction) of the acquired entity is recognised as an adjustment to equity. No additional goodwill is recognised.
The acquirer only incorporates the acquired entity’s results and statements of financial position prospectively from the date on which the business combination between entities under common control occurred. Consequently, the consolidated financial statements do not reflect the results of the acquired entity for the period before the transaction occurred. The corresponding amounts for the previous financial year are also not restated.
Predecessor accounting may lead to a difference between the cost of the transaction and the carrying value of the net assets. The difference is recorded in retained profits.
Intercompany transactions, balances and unrealised gains on transactions between Group companies are eliminated. Unrealised losses are also eliminated unless the transaction provides evidence of an impairment of the transfer assets. Accounting policies of subsidiaries have been changed where necessary to ensure consistency with the policies adopted by the Group.
NoTES To ThE fINANCIAL STATEmENTSfoR ThE fINANCIAL yEAR ENdEd 30 JuNE 2018

146ANNUALREPORT2018
HONG LEONG BANK BERHAD
2 SummARy of SIgNIfICANT ACCouNTINg PoLICIES (CoNTINuEd)
A Consolidation (continued)
(ii) Changes in ownership interests in subsidiaries without change of control
Transactions with non-controlling interests that do not result in loss of control are accounted for as transactions with equity owners of the Group. A change in ownership interest results in an adjustment between the carrying amounts of the controlling and non-controlling interests to reflect their relative interests in the subsidiary. Any difference between the amount of the adjustment to non-controlling interests and any consideration paid or received is recognised in equity attributable to owners of the Group.
(iii) disposal of subsidiaries
When the Group ceases to consolidate because of loss of control, any retained interest in the entity is re-measured to its fair value at the date when control is lost, with the change in carrying amount recognised in profit or loss. The fair value is the initial carrying amount for the purposes of subsequently accounting for the retained interest as an associate, joint venture or financial asset. In addition, any amounts previously recognised in other comprehensive income in respect of that entity are accounted for as if the Group had directly disposed of the related assets or liabilities. This may mean that amounts previously recognised in other comprehensive income are reclassified to profit or loss.
Gains and losses of the disposal of subsidiaries include the carrying amount of goodwill relating to the subsidiaries sold.
(iv) Joint arrangements
A joint arrangement is an arrangement of which there is contractually agreed sharing of control by the Group with one or more parties, where decisions about the relevant activities relating to the joint arrangement require unanimous consent of the parties sharing control. The classification of a joint arrangement as a joint operation or a joint venture depends upon the rights and obligations of the parties to the arrangement. A joint venture is a joint arrangement whereby the joint venturers have rights to the net assets of the arrangement. A joint operation is a joint arrangement whereby the joint operators have rights to the assets and obligations for the liabilities, relating to the arrangement.
The Group’s interest in a joint venture is accounted for in the financial statements by the equity method of accounting. Under the equity method of accounting, interests in joint ventures are initially recognised at cost and adjusted thereafter to recognise the Group’s share of the post-acquisition profits or losses and the Group’s share of movements in other comprehensive income of the joint venture in other comprehensive income. Dividends received or receivable from a joint venture are recognised as a reduction in the carrying amount of the investment. When the Group’s share of losses in a joint venture equals or exceeds its interests in the joint ventures (which includes any long-term interests that, in substance, form part of the Group’s net investment in the joint ventures), the Group does not recognise further losses, unless it has incurred obligations or made payments on behalf of the joint ventures.
The Group determines at each reporting date whether there is any objective evidence that the investment in the joint venture is impaired. An impairment loss is recognised for the amount by which the carrying amount of the joint venture exceeds its recoverable amount. The Group presents the impairment loss adjacent to ‘share of results of joint venture’ in the income statement.
Unrealised gains on transactions between the Group and its joint ventures are eliminated to the extent of the Group’s interest in the joint ventures. Unrealised losses are also eliminated unless the transaction provides evidence of an impairment of the asset transferred. Accounting policies of the joint ventures have been changed where necessary to ensure consistency with the policies adopted by the Group.
If the ownership interest in a joint venture is reduced but joint control is retained, only a proportionate share of the amounts previously recognised in other comprehensive income is reclassified to profit or loss where appropriate.
NoTES To ThE fINANCIAL STATEmENTSfoR ThE fINANCIAL yEAR ENdEd 30 JuNE 2018
147ANNUALREPORT
2018
FINANCIALS
2 SummARy of SIgNIfICANT ACCouNTINg PoLICIES (CoNTINuEd)
A Consolidation (continued)
(v) Associated companies
Associates are all entities over which the Group has significant influence but not control or joint control, generally accompanying a shareholding of between 20% and 50% of the voting rights. Investments in associates are accounted for using the equity method of accounting. Under the equity method, the investment in an associate is initially recognised at cost, and adjusted thereafter to recognise the Group’s share of the post-acquisition profits or losses of the associate in profit or loss, and the Group’s share of movements in other comprehensive income of the associate in other comprehensive income. Dividends received or receivable from an associate are recognised as a reduction in the carrying amount of the investment. When the Group’s share of losses in an associate equals or exceeds its interests in the associate, including any long-term interests that, in substance, form part of the Group’s net investment in the associate, the Group does not recognise further losses, unless it has incurred legal or constructive obligations or made payments on behalf of the associate. The Group’s investment in associates includes goodwill identified on acquisition.
The Group determines at each reporting date whether there is any objective evidence that the investment in the associate is impaired. An impairment loss is recognised for the amount by which the carrying amount of the associate exceeds its recoverable amount. The Group presents the impairment loss adjacent to ‘share of results of associated company’ in the income statement.
Profits and losses resulting from upstream and downstream transactions between the Group and its associate are recognised in the Group’s financial statements only to the extent of unrelated investor’s interests in the associates. Unrealised losses are eliminated unless the transaction provides evidence of an impairment of the asset transferred. Accounting policies of associates have been changed where necessary to ensure consistency with the policies adopted by the Group.
If the ownership interest in an associate is reduced but significant influence is retained, only a proportionate share of the amounts previously recognised in other comprehensive income is reclassified to profit or loss where appropriate.
Dilution gains and losses arising in investments in associates are recognised in the statements of income.
(vi) Loss of significant influence or joint control
When the Group ceases to equity account its joint venture or associate because of a loss of joint control or significant influence, any retained interest in the entity is remeasured to its fair value with the change in carrying amount recognised in profit or loss. This fair value becomes the initial carrying amount for the purposes of subsequently accounting for the retained interest as a financial asset. In addition, any amount previously recognised in other comprehensive income in respect of the entity is accounted for as if the Group had directly disposed of the related assets or liabilities. This may mean that amounts previously recognised in other comprehensive income are reclassified to profit or loss.
(vii) Investments in subsidiaries, joint venture and associated companies
In the Bank’s separate financial statements, investments in subsidiaries, joint venture and associated companies are carried at cost less any accumulated impairment losses. On disposal of investments in subsidiaries, joint venture and associated companies, the difference between disposal proceeds and the carrying amount of investments are recognised in the statements of income.
The amounts due from subsidiaries of which the Bank does not expect repayment in foreseeable future are considered as part of the Bank’s investment in subsidiaries.
NoTES To ThE fINANCIAL STATEmENTSfoR ThE fINANCIAL yEAR ENdEd 30 JuNE 2018

148ANNUALREPORT2018
HONG LEONG BANK BERHAD
2 SummARy of SIgNIfICANT ACCouNTINg PoLICIES (CoNTINuEd)
B Recognition of interest/profit income and interest/profit expense
Interest and financing income and expense for all interest/profit-bearing financial instruments are recognised within ‘interest income’ and ‘interest expense’ and ‘income from Islamic banking business’ in the statements of income using the effective interest/profit method.
The effective interest/profit method is a method of calculating the amortised cost of a financial asset or a financial liability and of allocating the interest and financing income or interest/profit expense over the relevant period. The effective interest/profit rate is the rate that exactly discounts estimated future cash payments or receipts through the expected life of the financial instruments or, when appropriate, a shorter period to the net carrying amount of the financial asset or financial liability. When calculating the effective interest/profit rate, the Group takes into account all contractual terms of the financial instrument and includes any fees or incremental costs that are directly attributable to the instrument and are an integral part of the effective interest/profit rate, but not future credit losses.
Interest/profit on impaired financial assets is recognised using the rate of interest/profit used to discount the future cash flows for the purpose of measuring the impairment loss. A financial asset or a group of financial assets is deemed to be impaired if, and only if, there is objective evidence of impairment as a result of one or more events that has occurred after the initial recognition of the asset (an incurred ‘loss event’) and that loss event (or events) has an impact on the estimated future cash flows of the financial asset or the group of financial assets that can be reliably estimated.
When a loan/financing receivable is impaired, the Group reduces the carrying amount to its recoverable amount, being the estimated future cash flow discounted at the original effective interest/profit rate of the instrument, and continues unwinding the discount as interest/profit income. Interest/profit income on impaired loan/financing are recognised using the original effective interest/profit rate.
C Recognition of fees and other income
Loan arrangement fees and commissions are recognised as income when all conditions precedent are fulfilled. Guarantee fees which are material are recognised as income based on time apportionment. Services charges and other fee income are recognised as income when the services are rendered.
Commitment fees for loans, advances and financing that are likely to be drawn down and deferred (together with direct costs) and income which forms an integral part of the effective interest rate of a financial instrument is regarded as an adjustment to the effective interest rate of the financial instrument.
Dividends from financial assets held at fair value through profit or loss, financial investments available-for-sale and subsidiary companies are recognised when the right to receive payment is established. This applies even if they are paid out of pre-acquisition profits. However, the investment may need to be tested for impairment as a consequence.
Net profit from financial assets held at fair value through profit or loss and financial investment available-for-sale are recognised upon disposal of the securities, as the difference between net disposal proceeds and the carrying amount of the securities.
d financial assets
(i) Classification
The Group and the Bank classify their financial assets into the following categories: at fair value through profit or loss, loans and receivables, financial investments held-to-maturity and financial investments available-for-sale. The classification depends on the purpose for which the financial assets were acquired. Management determines the classifications of its securities at initial recognition and, in the case of assets classified as held-to-maturity, re-evaluates this designation at the end of each reporting period.
(a) financial assets at fair value through profit or loss
Financial assets at fair value through profit or loss comprise financial assets held-for-trading and other financial assets designated by the Group and the Bank as fair value through profit or loss upon initial recognition.
NoTES To ThE fINANCIAL STATEmENTSfoR ThE fINANCIAL yEAR ENdEd 30 JuNE 2018
149ANNUALREPORT
2018
FINANCIALS
2 SummARy of SIgNIfICANT ACCouNTINg PoLICIES (CoNTINuEd)
d financial assets (continued)
(i) Classification (continued)
(a) financial assets at fair value through profit or loss (continued)
A financial asset is classified as held-for-trading if it is acquired or incurred principally for the purpose of selling or repurchasing it in the near term or if it is part of a portfolio of identified financial instruments that are managed together and for which there is evidence of a recent actual pattern of short-term profit-taking. Derivatives are also categorised as held-for-trading unless they are designated and effective as hedging instruments.
(b) Loans and receivables
Loans and receivables are non-derivative financial assets with fixed or determinable payments that are not quoted in an active market.
(c) financial investments held-to-maturity
Financial investments held-to-maturity are non-derivative instruments with fixed or determinable payments and fixed maturities that the management has the positive intention and ability to hold to maturity. If the Group or the Bank sell other than an insignificant amount of financial investments held-to-maturity, the entire category will be tainted and reclassified as financial investments available-for-sale.
(d) financial investments available-for-sale
Financial investments available-for-sale are those intended to be held for an indefinite period of time, which may be sold in response to needs for liquidity or changes in interest rates, exchange rates or equity prices or that are not classified as financial assets at fair value through profit or loss, loans and receivables and financial investments held-to-maturity.
(ii) Recognition and initial measurement
Financial assets are initially recognised at fair value plus transaction costs that are directly attributable to the acquisition of the financial asset for all financial assets not carried at fair value through profit or loss. Transaction costs for securities carried at fair value through profit or loss are taken directly to the statements of income.
(iii) Subsequent measurement
Financial assets at fair value through profit or loss and financial investments available-for-sale are subsequently carried at fair value, except for investments in equity instruments that do not have a quoted market price in an active market and whose fair value cannot be reliably measured in which case the investments are stated at cost. Gains and losses arising from changes in the fair value of the financial assets at fair value through profit or loss are included in the statements of income in the financial period which they arise. Gains and losses arising from changes in fair value of financial investments available-for-sale are recognised directly in other comprehensive income, until the securities are derecognised or impaired at which time the cumulative gains or losses previously recognised in other comprehensive income are recognised in statements of income. Foreign exchange gains or losses of financial investments available-for-sale are recognised in the statements of income in the financial period it arises.
Financial investments held-to-maturity are subsequently measured at amortised cost using the effective interest method. Gains or losses arising from the de-recognition or impairment of the securities are recognised in the statements of income.
Interest from financial assets held at fair value through profit or loss, financial investments available-for-sale and financial investments held-to-maturity is calculated using the effective interest method and is recognised in the statements of income. Dividends from available-for-sale equity instruments are recognised in the statements of income when the entity’s right to receive payment is established.
NoTES To ThE fINANCIAL STATEmENTSfoR ThE fINANCIAL yEAR ENdEd 30 JuNE 2018
150ANNUALREPORT2018
HONG LEONG BANK BERHAD
2 SummARy of SIgNIfICANT ACCouNTINg PoLICIES (CoNTINuEd)
d financial assets (continued)
(iii) Subsequent measurement (continued)
Loans and receivables are initially recognised at fair value – which is the cash consideration to originate or purchase the loan including the transaction costs, and measured subsequently at amortised cost using the effective interest rate method. Interest on loans is included in the statements of income. In the case of impairment, the impairment loss is reported as a deduction from the carrying value of the loan and recognised in the statements of income.
(iv) Reclassification of financial assets
The Group and the Bank may choose to reclassify a non-derivative financial assets held-for-trading out of the held-for-trading category if the financial asset is no longer held for the purposes of selling in the near term. Financial assets other than loans and receivables are permitted to be reclassified out of the held-for-trading category only in rare circumstances arising from a single event that is unusual and highly unlikely to recur in the near term. In addition, the Group and the Bank may choose to reclassify financial assets that would meet the definition of loans and receivables out of the held-for-trading or available-for-sale categories if the Group and the Bank have the intention and ability to hold these financial assets for the foreseeable future or until maturity at the date of reclassification.
Reclassifications are made at the fair value at the date of the reclassification. The fair values of the securities becomes the new cost or amortised cost as applicable, and no reversals of fair value gains or losses recorded before the reclassification date are subsequently made. The effective interest rates for the securities reclassified to held-to-maturity category are determined at the reclassification date. Further changes in estimates of future cash flows are recognised as an adjustment to the effective interest rates.
E financial liabilities
Financial liabilities are measured at amortised cost, except for trading liabilities and liabilities designated at fair value, which are held at fair value through profit or loss. Financial liabilities are initially recognised at fair value plus transaction costs for all financial liabilities not carried at fair value through profit or loss. Financial liabilities at fair value through profit or loss are initially recognised at fair value, and transaction costs are expensed in statements of income.
(i) financial liabilities at fair value through profit or loss
This category comprises two sub-categories: financial liabilities classified as held-for-trading and financial liabilities designated at fair value through profit or loss upon initial recognition.
A financial liability is classified as held-for-trading if it is acquired or incurred principally for the purpose of selling or repurchasing it in the near term or if it is part of a portfolio of identified financial instruments that are managed together and for which there is evidence of a recent actual pattern of short-term profit-taking. Derivatives are also categorised as held-for-trading unless they are designated and effective as hedging instruments.
The Group and the Bank have also designated certain structured deposits at fair value through profit or loss as permitted under MFRS 139 “Financial Instruments: Recognition and Measurement” as it significantly reduces accounting mismatch that would otherwise arise from measuring the corresponding assets and liabilities on different basis.
(ii) financial liabilities at amortised cost
Financial liabilities that are not classified as at fair value through profit or loss fall into this category and are measured at amortised cost.
Financial liabilities that are derecognised when they have been redeemed or otherwise extinguished.
NoTES To ThE fINANCIAL STATEmENTSfoR ThE fINANCIAL yEAR ENdEd 30 JuNE 2018

151ANNUALREPORT
2018
FINANCIALS
2 SummARy of SIgNIfICANT ACCouNTINg PoLICIES (CoNTINuEd)
f Property and equipment and depreciation
Property, plant and equipment are initially recorded at cost net of the amount of goods and services tax (“GST”) except where the amount of GST incurred is not recoverable from the government. When the amount of GST incurred is not recoverable from the government, the GST is recognised as part of the cost of acquisition of the property, plant and equipment. The cost of an item of property, plant and equipment initially recognised includes its purchase price and any cost that is directly attributable to bringing the asset to the location and condition necessary for it to be capable of operating in the manner intended by management. Cost also includes borrowing costs that are directly attributable to the acquisition, construction or production of a qualifying asset. With effect from 1 June 2018, GST is reduced from 6% to 0%.
Subsequent costs are included in the asset’s carrying amount or recognised as a separate asset, as appropriate, only when it is probable that future economic benefits associated with the item will flow to the Group and the Bank and the cost of the item can be measured reliably. The carrying amount of the replaced part is derecognised. All other repairs and maintenance are charged to the statements of income during the financial period in which they are incurred.
Freehold land is not depreciated as it has an infinite life. Other property and equipment are depreciated on a straight line basis to write off the cost of the assets to their residual values over their estimated useful lives, summarised as follows:
Leasehold land Over the remaining period of the lease or 100 years (1%) whichever is shorterBuildings on freehold land 2%Buildings on leasehold land Over the remaining period of the lease or 50 years (2%) whichever is shorterOffice furniture, fittings, equipment and renovations and computer equipment 10% - 33%Motor vehicles 25%
The assets’ residual values and useful lives are reviewed, and adjusted if appropriate, at the end of each reporting period.
Depreciation on assets under construction commences when the assets are ready for their intended use.
Property and equipment are reviewed for indication of impairment at each statements of financial position date and whenever events or changes in circumstances indicate that the carrying amount may not be recoverable. Where the carrying amount of an asset is greater than its estimated recoverable amount, it is written down to its recoverable amount.
Gains and losses on disposals are determined by comparing proceeds with the carrying amount and are included in non-interest income.
g Intangible assets
(i) Computer software
Acquired computer software licences are capitalised on the basis of the costs incurred to acquire and bring to use the specific software. These costs are amortised over their estimated useful lives of 3 years to 8 years.
(ii) goodwill
Goodwill arises on the acquisition of subsidiaries and represents the excess of the aggregate of the acquisition date fair value of consideration transferred, the amount of any non-controlling interest in the acquiree and the acquisition-date fair value of any previous equity interest in the acquiree over the net of the acquisition date fair value of the identifiable assets acquired and liabilities assumed. If the fair value of consideration transferred, the amount of non-controlling interest and the fair value of previously held interest in the acquiree are less than the fair value of the net identifiable assets of the acquiree, the resulting gain is recognised in the profit or loss.
NoTES To ThE fINANCIAL STATEmENTSfoR ThE fINANCIAL yEAR ENdEd 30 JuNE 2018
152ANNUALREPORT2018
HONG LEONG BANK BERHAD
2 SummARy of SIgNIfICANT ACCouNTINg PoLICIES (CoNTINuEd)
g Intangible assets (continued)
(ii) goodwill (continued)
Goodwill is allocated to cash-generating units (“CGUs”) for the purpose of impairment testing. The allocation is made to those cash-generating units or groups of cash-generating units that are expected to benefit from the synergies of the business combination in which the goodwill arose. Each unit or group of units to which the goodwill is allocated represents the lowest level within the entity at which goodwill is monitored for internal management purposes. Goodwill is tested annually for impairment or more frequently if events or changes in circumstances indicate a potential impairment. The carrying value of goodwill is compared to the recoverable amount, which is the higher of value in use and the fair value less cost of disposal. Any impairment is recognised immediately as an expense and is not subsequently reversed.
(iii) other intangible assets
Other intangible assets include core deposits and customer relationships. These intangible assets were acquired in a business combination and are valued using income approach methodologies. These intangible assets are stated at cost less accumulated amortisation and any accumulated impairment losses.
Other intangible assets have finite useful lives as follows:
Core deposit: 7 years Customer relationships: 10 years
h Leases
(i) finance lease
Assets purchased under lease which in substance transfers the risks and rewards of ownership of the assets to the Group or the Bank are capitalised under property and equipment. The assets and the corresponding lease obligations are recorded at the lower of the present value of the minimum lease payments or the fair value of the leased assets at the beginning of the lease term. Such leased assets are subject to depreciation on the same basis as other property and equipment.
Leases which do not meet such criteria are classified as operating lease and the related rentals are charged to statements of income.
(ii) operating lease
Leases of assets under which all the risks and rewards of ownership are retained by the lessor are classified as operating leases. Payments made under operating leases are charged to the statements of income on a straight line basis over the period of the lease.
When an operating lease is terminated before the lease period has expired, any payment required to be made to the lessor by way of penalty is recognised as an expense in the period in which termination takes place.
NoTES To ThE fINANCIAL STATEmENTSfoR ThE fINANCIAL yEAR ENdEd 30 JuNE 2018
153ANNUALREPORT
2018
FINANCIALS
2 SummARy of SIgNIfICANT ACCouNTINg PoLICIES (CoNTINuEd)
I Impairment of non-financial assets
Assets that have an indefinite useful life are not subject to amortisation and are tested annually for impairment. Assets that are subject to amortisation are reviewed for impairment whenever events or changes in circumstances indicate that the carrying amount may not be recoverable. An impairment loss is recognised for the amount by which the carrying amount of the assets exceeds its recoverable amount. The recoverable amount is the higher of an asset’s fair value less cost of disposal and value in use. For the purposes of assessing impairment, assets are grouped at the lowest levels for which separately identifiable cash flows which are largely independent of the cash inflows from other assets or groups of assets (cash generating units). Non-financial assets other than goodwill that suffered impairment are reviewed for possible reversal of the impairment at each reporting date.
The impairment loss is charged to the statements of income unless it reverses a previous revaluation in which case it is charged to the revaluation surplus. Any subsequent increase in recoverable amount of non-financial assets (other than goodwill) is recognised in the statements of income unless it reverses an impairment loss on a revalued asset in which case it is taken to revaluation surplus.
J Current and deferred income taxes
The tax expense for the period comprises current and deferred income tax. The income tax expense or credit for the period is the tax payable on the current period’s taxable income based on the applicable income tax rate for each jurisdiction adjusted by changes in deferred tax assets and liabilities attributable to temporary differences and to unused tax losses. Tax is recognised in profit or loss, except to the extent that it relates to items recognised in other comprehensive income or directly in equity. In this case, the tax is recognised in other comprehensive income or directly in equity, respectively. The liabilities in relation to tax penalties or its associated interest are included within the taxation liability on the statement of financial position and charged to the tax expense in the statements of income as under provision of prior year tax.
Current income tax expense is determined according to the tax laws enacted or substantially enacted at the end of the reporting period of each jurisdiction in which the Group operates and generates taxable income and includes all taxes based upon the taxable profits.
Management periodically evaluates positions taken in tax returns with respect to situations in which applicable tax regulation is subject to interpretation. It establishes provisions where appropriate on the basis of amounts expected to be paid to the tax authorities. This liability is measured using the single best estimate of the most likely outcome.
Deferred income tax is recognised in full, using the liability method, on temporary differences arising between the tax bases of assets and liabilities and their carrying amounts in the financial statements. However, deferred tax liabilities are not recognised if they arise from the initial recognition of goodwill. Deferred income tax is not accounted for if it arises from initial recognition of an asset or liability in a transaction other than a business combination that at the time of the transaction affects neither accounting nor taxable profit or loss.
Deferred tax assets are recognised to the extent that it is probable that future taxable profits will be available against which the temporary differences of unused tax losses or unused tax credits can be utilised.
Deferred tax liability is recognised on temporary differences arising on investments in subsidiaries, associates and joint ventures except where the timing of the reversal of the temporary difference can be controlled by the Group and it is probable that the temporary difference will not reverse in the foreseeable future. Generally the Group is unable to control the reversal of the temporary difference for associates and joint ventures. Only where there is an agreement in place that gives the Group the ability to control the reversal of the temporary difference, a deferred tax liabilities is not recognised.
NoTES To ThE fINANCIAL STATEmENTSfoR ThE fINANCIAL yEAR ENdEd 30 JuNE 2018

154ANNUALREPORT2018
HONG LEONG BANK BERHAD
2 SummARy of SIgNIfICANT ACCouNTINg PoLICIES (CoNTINuEd)
J Current and deferred income taxes (continued)
Deferred income tax assets are recognised on deductible temporary differences arising from investments in subsidiaries, associates and joint arrangements only to the extent that it is probable the temporary difference will reverse in the future and there is sufficient taxable profit available against which the deductible temporary difference can be utilised.
Deferred income tax related to fair value re-measurement of financial instruments available-for-sale, which are charged or credited directly to equity, is also credited or charged directly to equity and is subsequently recognised in the statements of income together with the deferred gain or loss.
Deferred income tax is determined using tax rates (and tax laws) that have been enacted or substantively enacted by the end of the reporting period and are expected to apply when the related deferred tax asset is realised or the deferred tax liability is settled.
Deferred and income tax assets and liabilities are offset when there is a legally enforceable right to offset current tax assets against current tax liabilities and when the deferred income tax assets and liabilities relate to taxes levied by the same taxation authority on either the taxable entity or different taxable entities where there is an intention to settle the balances on a net basis.
k derivative financial instruments and hedging
Derivatives are initially recognised at fair value on the date on which a derivative contract is entered into and are subsequently remeasured at their fair value at the end of each reporting period. Fair values are obtained from quoted market prices in active markets, including recent market transactions, and valuation techniques, including discounted cash flow models and option pricing models, as appropriate. All derivatives are carried as assets when fair value is positive and as liabilities when fair value is negative. Changes in the fair value of any derivatives that do not qualify for hedge accounting are recognised immediately in the statements of income. Cash collateral held in relation to derivative transactions are carried at amortised cost.
The best evidence of fair value of a derivative at initial recognition is the transaction price (i.e. the fair value of the consideration given or received) unless the fair value of the instrument is evidenced by comparison with other observable current market transactions in the same instrument (i.e. without modification or repackaging) or based on a valuation technique whose variables include only data from observable markets. When such evidence exists, the Group and the Bank recognise profits immediately.
The method of recognising the resulting fair value gain or loss depends on whether the derivative is designated as a hedging instrument, and if so, the nature of the item being hedged. The Group and the Bank designated certain derivatives as either: (1) hedges of the fair value of recognised assets or liabilities or firm commitments (fair value hedge) or (2) hedges of highly probable future cash flows attributable to a recognised asset or liability, or a forecasted transaction (cash flow hedge) or (3) hedges of a net investment in a foreign operation (net investment hedge). Hedge accounting is used for derivatives designated in this way provided certain criteria are met.
At the inception of the transaction, the Group and the Bank document the relationship between hedging instruments and hedged items, as well as their risk management objective and strategy for undertaking various hedge transactions. The Group and the Bank also document their assessment, both at hedge inception and on an ongoing basis, of whether the derivatives that are used in hedging transactions have been and will continue to be highly effective in offsetting changes in fair values or cash flows of hedged items.
NoTES To ThE fINANCIAL STATEmENTSfoR ThE fINANCIAL yEAR ENdEd 30 JuNE 2018

155ANNUALREPORT
2018
FINANCIALS
2 SummARy of SIgNIfICANT ACCouNTINg PoLICIES (CoNTINuEd)
k derivative financial instruments and hedging (continued)
(i) fair value hedge
Changes in the fair value of derivatives that are designated and qualify as fair value hedges are recorded in the statements of income, together with any changes in the fair value of the hedged assets or liabilities that are attributable to the hedged risk.
If the hedge no longer meets the criteria for hedge accounting, the adjustment to the carrying amount of a hedged item for which the effective interest method is used is amortised to statements of income over the period to maturity using a recalculated effective interest rate.
(ii) Cash flow hedge
The effective portion of changes in the fair value of derivatives that are designated and qualify as cash flow hedges are recognised in equity. The gain and loss relating to the ineffective portion is recognised immediately in the statements of income. Amounts accumulated in equity are recycled to the statements of income in the financial periods in which the hedged item will affect statements of income.
When a hedging instrument expires or is sold or transferred, or when a hedge no longer meets the criteria for hedge accounting, any cumulative gain or loss existing in equity at that time remains in equity and is recognised when the forecast transaction is ultimately recognised in the statements of income. When a forecast transaction is no longer expected to occur, the cumulative gain or loss that was reported in equity is immediately reclassified to the statements of income.
(iii) Net investment hedge
Hedges of net investments in foreign operations are accounted for similarly to cash flow hedges. Any gain or loss on the hedging instrument relating to the effective portion of the hedge is recognised in equity. The gain or loss relating to the ineffective portion is recognised immediately in the statements of income.
Gains and losses accumulated in the equity are reclassified to the statements of income when the foreign operation is partially disposed or sold.
(iv) derivatives that do not qualify for hedge accounting
Certain derivative instruments do not qualify for hedge accounting. Changes in the fair value of any derivative instrument that does not qualify for hedge accounting are recognised immediately in the statements of income.
L Currency translations
(i) functional and presentation currency
Items included in the financial statements of each of the Group’s entities are measured using the currency of the primary economic environment in which the entity operates (“the functional currency”). The consolidated financial statements are presented in Ringgit Malaysia, which is the Bank’s functional and presentation currency.
(ii) foreign currency transactions and balances
Foreign currency transactions are translated into the functional currency using the exchange rates prevailing at the dates of the transactions or valuation where items are remeasured. Foreign exchange gains and losses resulting from the settlement of such transactions and from the translation at financial year-end exchange rates of monetary assets and liabilities denominated in foreign currencies are recognised in the statements of income, except when deferred in equity as qualifying cash flow hedges and qualifying net investment hedges or are attributable to items that form part of the net investment in a foreign operation.
NoTES To ThE fINANCIAL STATEmENTSfoR ThE fINANCIAL yEAR ENdEd 30 JuNE 2018
156ANNUALREPORT2018
HONG LEONG BANK BERHAD
2 SummARy of SIgNIfICANT ACCouNTINg PoLICIES (CoNTINuEd)
L Currency translations
(ii) foreign currency transactions and balances (continued)
Changes in the fair value of monetary securities denominated in foreign currency classified as financial instruments available-for-sale are analysed between translation differences resulting from changes in the amortised cost of the security and other changes in the carrying amount of the security. Translation differences related to changes in the amortised cost are recognised in the statements of income, and other changes in the carrying amount are recognised in other comprehensive income.
Non-monetary items that are measured at fair value in a foreign currency are translated using the exchange rates at the date when the fair value is determined. Translation differences such as equity held at fair value through profit or loss and assets and liabilities carried at fair value are reported as part of the fair value gain or loss. Translation differences on non-monetary financial assets such as equities held at fair value through profit or loss are recognised in income as part of the fair value gain or loss. Translation differences on non-monetary financial assets such as equities classified as available-for-sale are included in the fair value reserve in other comprehensive income.
(iii) group companies
The results and financial position of all the Group entities (none of which has the currency of a hyperinflationary economy) that have a functional currency different from the presentation currency are translated into the presentation currency as follows:
• assets and liabilities for each statements of financial position presented are translated at the closing rate at the date of the statements of financial position;
• income and expenses for each statements of income are translated at average exchange rates (unless this average is not a reasonable approximation of the cumulative effect of the rates prevailing on the transaction dates, in which case income and expenses are translated at the rate on the dates of the transactions); and
• all resulting exchange differences are recognised as a separate component of other comprehensive income.
On consolidation, exchange differences arising from the translation of the net investment in foreign operations, and of borrowings and other currency instruments designated as hedges of such investments, are recognised in other comprehensive income.
On the disposal of a foreign operation (that is, a disposal of the Group’s entire interest in a foreign operation, or a disposal involving loss of control over a subsidiary that includes a foreign operation, a disposal involving loss of joint control over a jointly controlled entity that includes a foreign operation, or a disposal involving loss of significant influence over an associate that includes a foreign operation), all of the exchange differences relating to that foreign operation recognised in other comprehensive income and accumulated in the separate component of equity are reclassified to profit or loss. In the case of a partial disposal that does not result in the Group losing control over a subsidiary that includes a foreign operation, the proportionate share of accumulated exchange differences are re-attributed to non-controlling interests and are not recognised in profit or loss. For all other partial disposals (that is, reductions in the group’s ownership interest in associates or jointly controlled entities that do not result in the group losing significant influence or joint control) the proportionate share of the accumulated exchange difference is reclassified to profit or loss.
Goodwill and fair value adjustments arising on the acquisition of a foreign entity are treated as assets and liabilities of the foreign entity and translated at the closing rate. Exchange differences arising are recognised in other comprehensive income.
NoTES To ThE fINANCIAL STATEmENTSfoR ThE fINANCIAL yEAR ENdEd 30 JuNE 2018
157ANNUALREPORT
2018
FINANCIALS
2 SummARy of SIgNIfICANT ACCouNTINg PoLICIES (CoNTINuEd)
m Employee benefits
(i) Short-term employee benefits
Wages, salaries, paid annual leave and sick leave, bonuses, and non-monetary benefits that are expected to be settled wholly within 12 months after the end of the period in which the employees render the related services are recognised in respect of employees’ services up to the end of the reporting period and are measured at the amounts expected to be paid when the liabilities are settled.
The Group and the Bank recognise a liability and an expense for bonuses. The Group and the Bank recognise a provision where contractually obliged or where there is a past practice that has created a constructive obligation.
(ii) defined contribution plan
A defined contribution plan is a pension plan under which the Group and the Bank pay fixed contributions into a separate entity (a fund) on a mandatory, contractual or voluntary basis and the Group and the Bank has no legal or constructive obligations to pay further contributions if the fund does not hold sufficient assets to pay all employees benefits relating to employee service in the current and prior financial periods.
The Group and the Bank contributes to a national defined contribution plan (the Employee Provident Fund) on a mandatory basis and the amounts contributed to the plan are charged to the statements of income in the financial period to which they relate. Once the contributions have been paid, the Group and the Bank have no further payment obligations.
Prepaid contributions are recognised as an asset to the extent that a cash refund or a reduction in the future payments is available.
(iii) Share-based compensation
The Bank operates an equity-settled, share-based compensation plan for the employees of the Bank under which the Bank receives services from employees as consideration for equity instruments (options) of the Bank. The fair value of the employee services received in exchange for the grant of the share options is recognised as an expense in the statements of income over the vesting periods of the grant with a corresponding increase to share options reserve within equity.
The total amount to be expensed over the vesting period is determined by reference to the fair value of the share options granted, excluding the impact of any non-market vesting conditions. Non-market vesting conditions are included in assumptions about the number of options that are expected to vest. At each statements of financial position date, the Bank revises its estimates of the number of share options that are expected to vest based on the non-market vesting conditions. It recognises the impact of the revision of original estimates, if any, in the statements of income, with a corresponding adjustment to share options reserve in equity.
A trust has been set up for the Executive Share Option Scheme (“ESOS”) and is administered by an appointed trustee. The trustee will be entitled from time to time to accept financial assistance from the Bank upon such terms and conditions as the Bank and the trustee may agree to purchase the Bank’s shares from the open market for the purposes of this trust.
In accordance with MFRS 132 ‘Financial Instruments: Presentation’, the shares purchased for the benefit of the ESOS holders are recorded as “Treasury Shares” in equity on the statements of financial position. The cost of operating the ESOS scheme would be charged to the statements of income when incurred in accordance with accounting standards.
When the options are exercised, the Bank transfers the Treasury shares for ESOS scheme to the ESOS holder. The Treasury shares and share options reserve would be adjusted against the retained earnings.
When the options are exercised, the Bank may also issue new shares. The proceeds received net of any directly attributable transaction costs are credited to share capital.
When options are not exercised and lapsed, the share options reserve is transferred to retained earnings.
NoTES To ThE fINANCIAL STATEmENTSfoR ThE fINANCIAL yEAR ENdEd 30 JuNE 2018

158ANNUALREPORT2018
HONG LEONG BANK BERHAD
2 SummARy of SIgNIfICANT ACCouNTINg PoLICIES (CoNTINuEd)
N Impairment of financial assets
(i) Assets carried at amortised cost
A financial asset or a group of financial assets is deemed to be impaired if, and only if, there is objective evidence of impairment as a result of one or more events that has occurred after the initial recognition of the asset (an incurred ‘loss event’) and that loss event (or events) has an impact on the estimated future cash flows of the financial asset or the group of financial assets that can be reliably estimated.
The criteria the Group and the Bank use to determine that there is objective evidence of impairment loss include indications that the borrower or a group of borrowers is experiencing significant financial difficulty, the probability that they will enter bankruptcy or other financial reorganisation, default of delinquency in interest or principal payments and where observable data indicates that there is a measurable decrease in the estimated future cash flows, such as changes in arrears or economic conditions that correlate with defaults.
The Group and the Bank first assesses whether objective evidence of impairment exists individually for financial assets that are individually significant, and individually or collectively for financial assets that are not individually significant. If the Group determines that no objective evidence of impairment exists for an individually assessed financial asset, whether significant or not, it includes the asset in a group of financial assets with similar credit risk characteristics and collectively assesses them for impairment.
The amount of the loss is measured as the difference between the asset’s carrying amount and the present value of estimated future cash flows discounted at the financial assets’ original effective interest rate. The carrying amount of the asset is reduced through the use of an allowance account and the amount of the loss is recognised in the statements of income. If a loan or financial investments held-to-maturity have a variable interest rate, the discount rate for measuring any impairment loss is the current effective interest rate determined under the contract.
Financial assets that have not been individually assessed are grouped together for portfolio impairment assessment. These financial assets are grouped according to their credit risk characteristics for the purposes of calculating an estimated collective loss. These characteristics are relevant to the estimation of future cash flows for groups of such assets by being indicative of the debtors’ ability to pay all amounts due according to the contractual terms of the assets being assessed. Future cash flows on a group of financial assets that are collectively assessed for impairment are estimated on the basis of historical loss experience for assets with credit risk characteristics similar to those in the group.
The methodology and assumptions used for estimating future cash flows are reviewed regularly by the Group and the Bank to reduce any differences between loss estimates and actual loss experience.
When a loan is uncollectible, it is written off against the related allowance for loan impairment and any shortfall will be recognised to statements of income. Such loans are written off after taking into consideration the realisable value of collateral, if any, when in the judgement of the management, there is no prospect of recovery.
If in a subsequent period, the amount of impairment losses decreases and the decrease can be related objectively to an event occurring after the impairment was recognised (such as an improvement in the debtor’s credit rating), the previously recognised impairment loss is reversed by adjusting the allowance account. The amount of the reversal is recognised in the statements of income.
NoTES To ThE fINANCIAL STATEmENTSfoR ThE fINANCIAL yEAR ENdEd 30 JuNE 2018

159ANNUALREPORT
2018
FINANCIALS
2 SummARy of SIgNIfICANT ACCouNTINg PoLICIES (CoNTINuEd)
N Impairment of financial assets (continued)
(ii) Assets classified as available-for-sale
The Group and the Bank assess at each date of the statements of financial position whether there is objective evidence that financial asset or a group of financial assets is impaired.
For debt securities, the Bank uses criteria and measurement of impairment loss applicable for ‘assets carried at amortised cost’ above. If, in a subsequent period, the fair value of a debt instrument classified as available for sale increases and the increase can be objectively related to an event occurring after the impairment loss was recognised in profit or loss, the impairment loss is reversed through the profit or loss.
In the case of equity securities classified as available-for-sale, in addition to the criteria for ‘assets carried at amortised cost’ above, a significant or prolonged decline in the fair value of the security below its cost is also considered as an indicator that the assets are impaired. If any such evidence exists for available-for-sale financial assets, the cumulative loss that had been recognised directly in equity is removed from equity and recognised in profit or loss. The amount of cumulative loss reclassified to profit or loss is the difference between the acquisition cost and the current fair value, less any impairment loss on that financial asset previously recognised in profit or loss. Impairment losses recognised in profit or loss on equity instruments classified as available-for-sale are not reversed through profit or loss in subsequent periods.
o derecognition of financial assets and financial liabilities
Financial assets are derecognised when the contractual rights to receive the cash flows from these assets have ceased to exist or the assets have been transferred and substantially all the risks and rewards of ownership of the assets are also transferred. Financial liabilities are derecognised when they have been redeemed or otherwise extinguished.
Collateral furnished by the Bank under standard repurchase agreements transactions is not derecognised because the Bank retains substantially all the risks and rewards on the basis of the predetermined repurchase price, and the criteria for derecognition are therefore not met.
P offsetting financial instruments
Financial assets and liabilities are offset and the net amount is presented in the statements of financial position where there is a legally enforceable right to offset the recognised amounts and there is an intention to settle on a net basis, or realise the asset and settle the liability simultaneously. The legally enforceable right must not be contingent on future events and must be enforceable in the normal course of business and in the event of default, insolvency or bankruptcy.
q financial guarantee contracts
Financial guarantee contracts are contracts that require the issuer to make specified payments to reimburse the holder for a loss it incurs because a specified debtor fails to make payments when due, in accordance with the terms of a debt instrument. Such financial guarantees are given to banks, financial institutions and other bodies on behalf of customers to secure loans, overdrafts and other banking facilities.
Financial guarantees are initially recognised in the financial statements at fair value on the date the guarantee was given. The financial guarantees are agreed on arm’s length terms and the value of the premium agreed corresponds to the value of the guarantee obligation. No receivable for the future premiums is recognised. Subsequent to initial recognition, the Bank’s liabilities under such guarantees are measured at the higher of the initial amount, less amortisation of fees and the amount determined in accordance with MFRS 137 “Provision, Contingent Liabilities and Contingent Assets”, and the best estimate of the amount required to settle the guarantee. These estimates are determined based on experience of similar transactions and history of past losses, supplemented by the judgement of management. The fee income earned is recognised on a straight-line basis over the life of the guarantee. Any increase in the liability relating to guarantees is reported in the statements of income.
NoTES To ThE fINANCIAL STATEmENTSfoR ThE fINANCIAL yEAR ENdEd 30 JuNE 2018
160ANNUALREPORT2018
HONG LEONG BANK BERHAD
2 SummARy of SIgNIfICANT ACCouNTINg PoLICIES (CoNTINuEd)
R foreclosed properties
Foreclosed properties are stated at the lower of carrying amount and fair value less cost to sell.
S Bills and acceptances payable
Bills and acceptances payable represent the Group’s and the Bank’s own bills and acceptances rediscounted and outstanding in the market.
T Provisions
Provisions are recognised by the Group and the Bank when all of the following conditions have been met:
(i) the Group and the Bank have a present legal or constructive obligation as a result of past events;(ii) it is probable that an outflow of resources to settle the obligation will be required; and(iii) a reliable estimate of the amount of obligation can be made.
Where the Group and the Bank expect a provision to be reimbursed by another party, the reimbursement is recognised as a separate asset but only when the reimbursement is virtually certain. Provisions are not recognised for future operating losses.
Where there are a number of similar obligations, the likelihood that an outflow will be required in settlement is determined by considering the class of obligations as a whole. A provision is recognised even if the likelihood of an outflow with respect to any one item included in the same class of obligations may be small.
Provisions are measured at the present value of management’s best estimate of the expenditures expected to be required to settle the obligation using a pre-tax rate that reflects current market assessments of the time value of money and risks specific to the obligation. The increase in the provision due to passage of time is recognised as interest expense.
u Cash and cash equivalents
Cash and short-term funds in the statement of financial position comprise cash balances and deposits with financial institutions and money at call with a maturity of one month or less, which are subject to an insignificant risk of changes in value.
For the purpose of the statements of cash flows, cash and cash equivalents comprise cash and short-term funds and deposits and placements with financial institutions, with original maturity of 3 months or less.
V Borrowings
Borrowings are recognised initially at fair value, net of transaction costs incurred. Borrowings are subsequently stated at amortised cost; any difference between the proceeds (net of transaction costs) and the redemption value is recognised in the statements of income over the period of the borrowings using the effective interest method.
All other borrowing costs are recognised in profit or loss in the period in which they are incurred.
w Segment reporting
Operating segments are reported in a manner consistent with the internal reporting provided to the chief operating decision maker. The chief operating decision maker is the person or group that allocates resources and assesses the performance of the operating segments of an entity. The Group has determined the Board of Directors as the collective body of chief operating decision makers.
Segment revenue, expense, assets and liabilities are those amount resulting from the operating activities of a segment that are directly attributable to the segment and the relevant portion that can be allocated on a reasonable basis to the segment. Segment revenue, expense, assets and liabilities are determined before intra-group balances and intra-group transactions are eliminated as part of the consolidation process, except to the extent that such intra-group balances and transactions are between group enterprises within a single segment.
NoTES To ThE fINANCIAL STATEmENTSfoR ThE fINANCIAL yEAR ENdEd 30 JuNE 2018
161ANNUALREPORT
2018
FINANCIALS
2 SummARy of SIgNIfICANT ACCouNTINg PoLICIES (CoNTINuEd)
x Non-current assets/disposal groups held-for-sale
Non-current assets/disposal groups are classified as assets held-for-sale and stated at the lower of carrying amount and fair value less costs to sell if their carrying amount is recovered principally through a sale transaction rather than through continuing use and a sale is considered highly probable. They are stated at the lower of carrying amount and fair value less costs to sell, except for assets such as deferred tax assets, assets arising from employee benefits, financial assets and investment property that are carried at fair value and contractual rights under insurance contracts, which are specifically exempt from this requirement.
The Group applies the above policy to an investment or portion of an investment in an associate or joint venture that meets the criteria to be classified as held for sale. Where the Group maintains either significant influence or joint control over the investee, any retained portion of the investment that has not been classified as held for sale continues to be accounted for, using the equity method of accounting, until the disposal of the portion that is classified as held for sale takes place. In cases where significant influence or joint control is lost, the retained interest is accounted for in accordance with MFRS 139 “Financial Instruments: Recognition and Measurement”.
An impairment loss is recognised for any initial or subsequent write-down of the asset/disposal groups to fair value less costs to sell. A gain is recognised for any subsequent increases in fair value less costs to sell of an asset/disposal groups, but not in excess of any cumulative impairment loss previously recognised. A gain or loss not previously recognised by the date of the sale of the non-current asset/disposal groups is recognised at the date of derecognition.
Non-current assets (including those that are part of a disposal group) are not depreciated or amortised while they are classified as held for sale. Interest and other expenses attributable to the liabilities of a disposal group classified as held for sale continue to be recognised.
Non-current assets classified as held for sale and the assets of a disposal group classified as held for sale are presented separately from the other assets in the statement of financial position. The liabilities of a disposal group classified as held for sale are presented separately from other liabilities in the statement of financial position.
A discontinued operation is a component of the entity that has been disposed of or is classified as held for sale and that represents a separate major line of business or geographical area of operations, is part of a single co-ordinated plan to dispose of such a line of business or area of operations, or is a subsidiary acquired exclusively with a view to resale. The results of discontinued operations are presented separately in the income statement.
y Share capital
(i) Classification
Ordinary shares are classified as equity. Other shares are classified as equity and/or liability according to the substance of the particular instrument.
(ii) Share issue costs
Incremental external costs directly attributable to the issue of new shares or options are shown in equity as a deduction, net of tax, from the proceeds.
(iii) dividends
Distributions to shareholders are recognised directly in equity. Liability is recognised for the amount of any dividend declared, being appropriately authorised and no longer at the discretion of the Group, on or before the end of the reporting period but not distributed at the end of the reporting period.
NoTES To ThE fINANCIAL STATEmENTSfoR ThE fINANCIAL yEAR ENdEd 30 JuNE 2018

162ANNUALREPORT2018
HONG LEONG BANK BERHAD
2 SummARy of SIgNIfICANT ACCouNTINg PoLICIES (CoNTINuEd)
y Share capital (continued)
(iv) Purchase of own shares
The Bank has repurchased its shares and designated as treasury shares in accordance with MFRS 132 ‘Financial Instruments: Presentation’. Treasury shares consist of those own shares purchased pursuant to Section 127 of the Companies Act 2016 and those purchased pursuant to ESOS scheme.
Where the Bank or its subsidiaries purchases the Bank’s equity share capital (treasury shares), the consideration paid, including any directly attributable incremental costs, net of tax, is deducted from equity attributable to the Bank’s equity holders as treasury shares until they are cancelled, reissued or disposed off. Where such shares are subsequently sold or reissued, any consideration received, net of any directly attributable incremental transaction costs and the related tax effects, is adjusted against Treasury shares.
Z Contingent assets and contingent liabilities
The Group does not recognise contingent assets and liabilities other than those arising from business combinations, but discloses its existence in the financial statements. A contingent liability is a possible obligation that arises from past events whose existence will be confirmed by the occurrence or non-occurrence of one or more uncertain future events beyond the control of the Group or a present obligation that is not recognised because it is not probable that an outflow of resources will be required to settle the obligation. A contingent liability also arises in the extremely rare case where there is a liability that cannot be recognised because it cannot be measured reliably. However, contingent liabilities do not include financial guarantee contracts. A contingent asset is a possible asset that arises from past events whose existence will be confirmed by the occurrence or non-occurrence of one or more uncertain future events beyond the control of the Group. The Group does not recognise contingent assets but discloses its existence where inflows of economic benefits are probable, but not virtually certain.
AA Sale and repurchase agreements
Securities purchased under resale agreements are securities which the Group and the Bank had purchased with a commitment to re-sell at future dates. The commitment to re-sell the securities is reflected as an asset on the statements of financial position.
Conversely, obligations on securities sold under repurchase agreements are securities which the Group had sold from its portfolio, with a commitment to repurchase at future dates. Such financing transactions and the obligation to repurchase the securities are reflected as a liability on the statements of financial position.
The difference between the sale and repurchase price as well as purchase and resale price is treated as interest and accrued over the life of the resale/repurchase agreement using the effective yield method.
AB Earnings per share
(i) Basic earnings per share
Basic earnings per share is calculated by dividing:
* the profit attributable to owners of the Bank, excluding any costs of servicing equity other than ordinary shares.* by the weighted average number of ordinary shares outstanding during the financial year, adjusted for bonus
elements in ordinary shares issued during the year and excluding treasury shares.
(ii) diluted earnings per share
Diluted earnings per share adjusts the figures in the determination of basic earnings per share to take into account:
* the after income tax effect of interest and other financing costs associated with dilutive potential ordinary shares, and
* the weighted average number of additional ordinary shares that would have been outstanding assuming the conversion of all dilutive potential ordinary shares.
NoTES To ThE fINANCIAL STATEmENTSfoR ThE fINANCIAL yEAR ENdEd 30 JuNE 2018
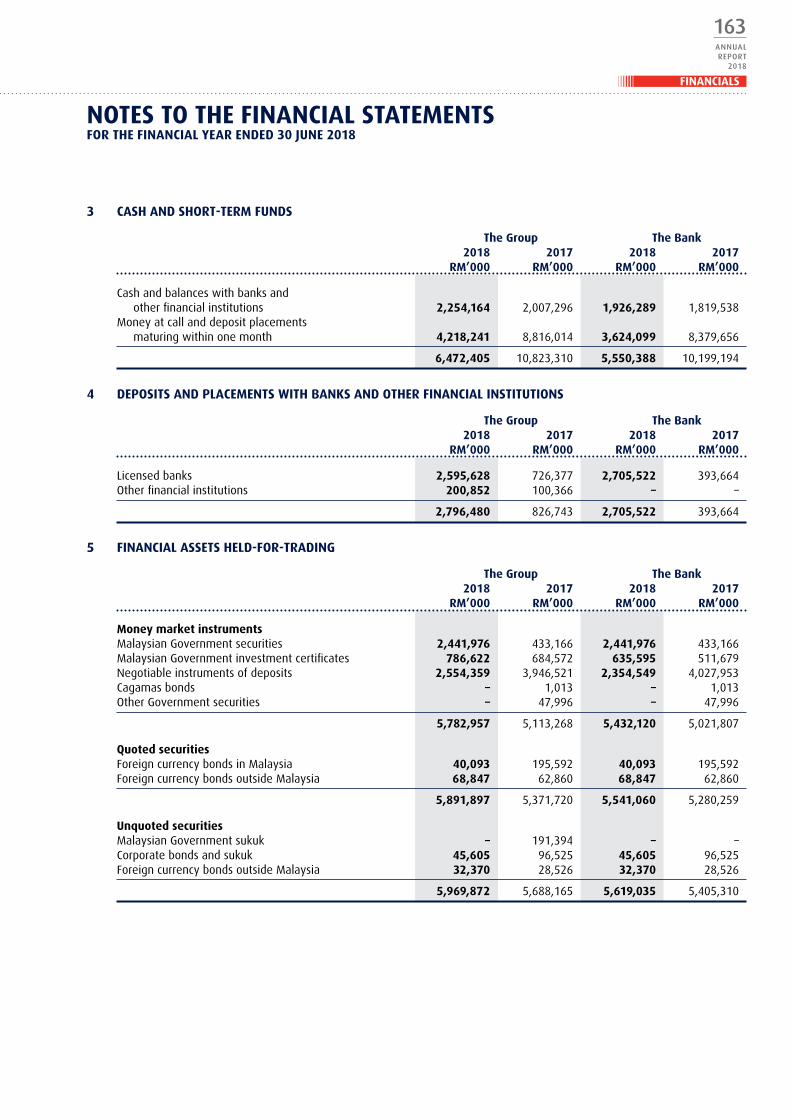
163ANNUALREPORT
2018
FINANCIALS
3 CASh ANd ShoRT-TERm fuNdS
The group The Bank 2018 2017 2018 2017 Rm’000 Rm’000 Rm’000 Rm’000
Cash and balances with banks and other financial institutions 2,254,164 2,007,296 1,926,289 1,819,538Money at call and deposit placements maturing within one month 4,218,241 8,816,014 3,624,099 8,379,656
6,472,405 10,823,310 5,550,388 10,199,194
4 dEPoSITS ANd PLACEmENTS wITh BANkS ANd oThER fINANCIAL INSTITuTIoNS
The group The Bank 2018 2017 2018 2017 Rm’000 Rm’000 Rm’000 Rm’000
Licensed banks 2,595,628 726,377 2,705,522 393,664Other financial institutions 200,852 100,366 – –
2,796,480 826,743 2,705,522 393,664
5 fINANCIAL ASSETS hELd-foR-TRAdINg
The group The Bank 2018 2017 2018 2017 Rm’000 Rm’000 Rm’000 Rm’000
money market instrumentsMalaysian Government securities 2,441,976 433,166 2,441,976 433,166Malaysian Government investment certificates 786,622 684,572 635,595 511,679Negotiable instruments of deposits 2,554,359 3,946,521 2,354,549 4,027,953Cagamas bonds – 1,013 – 1,013Other Government securities – 47,996 – 47,996
5,782,957 5,113,268 5,432,120 5,021,807
quoted securitiesForeign currency bonds in Malaysia 40,093 195,592 40,093 195,592Foreign currency bonds outside Malaysia 68,847 62,860 68,847 62,860
5,891,897 5,371,720 5,541,060 5,280,259
unquoted securitiesMalaysian Government sukuk – 191,394 – –Corporate bonds and sukuk 45,605 96,525 45,605 96,525Foreign currency bonds outside Malaysia 32,370 28,526 32,370 28,526
5,969,872 5,688,165 5,619,035 5,405,310
NoTES To ThE fINANCIAL STATEmENTSfoR ThE fINANCIAL yEAR ENdEd 30 JuNE 2018
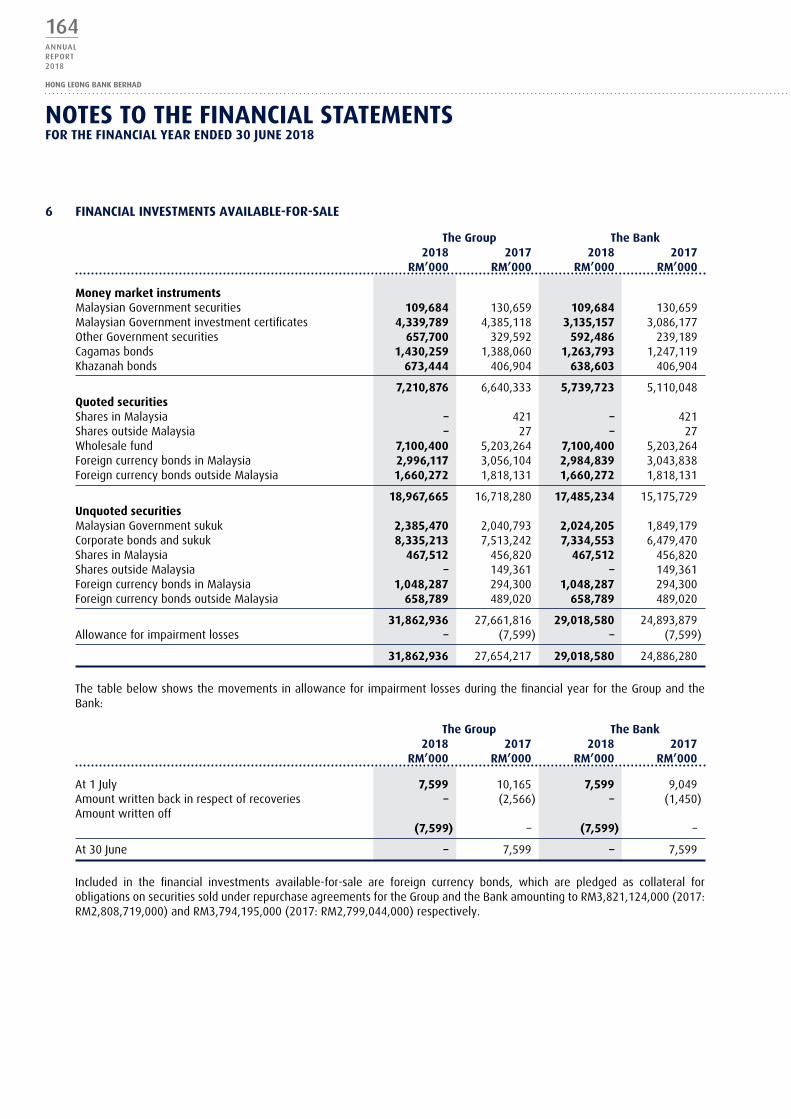
164ANNUALREPORT2018
HONG LEONG BANK BERHAD
6 fINANCIAL INVESTmENTS AVAILABLE-foR-SALE
The group The Bank 2018 2017 2018 2017 Rm’000 Rm’000 Rm’000 Rm’000
money market instrumentsMalaysian Government securities 109,684 130,659 109,684 130,659Malaysian Government investment certificates 4,339,789 4,385,118 3,135,157 3,086,177Other Government securities 657,700 329,592 592,486 239,189Cagamas bonds 1,430,259 1,388,060 1,263,793 1,247,119Khazanah bonds 673,444 406,904 638,603 406,904
7,210,876 6,640,333 5,739,723 5,110,048quoted securitiesShares in Malaysia – 421 – 421Shares outside Malaysia – 27 – 27Wholesale fund 7,100,400 5,203,264 7,100,400 5,203,264Foreign currency bonds in Malaysia 2,996,117 3,056,104 2,984,839 3,043,838Foreign currency bonds outside Malaysia 1,660,272 1,818,131 1,660,272 1,818,131
18,967,665 16,718,280 17,485,234 15,175,729unquoted securitiesMalaysian Government sukuk 2,385,470 2,040,793 2,024,205 1,849,179Corporate bonds and sukuk 8,335,213 7,513,242 7,334,553 6,479,470Shares in Malaysia 467,512 456,820 467,512 456,820Shares outside Malaysia – 149,361 – 149,361Foreign currency bonds in Malaysia 1,048,287 294,300 1,048,287 294,300Foreign currency bonds outside Malaysia 658,789 489,020 658,789 489,020
31,862,936 27,661,816 29,018,580 24,893,879Allowance for impairment losses – (7,599) – (7,599)
31,862,936 27,654,217 29,018,580 24,886,280
The table below shows the movements in allowance for impairment losses during the financial year for the Group and the Bank:
The group The Bank 2018 2017 2018 2017 Rm’000 Rm’000 Rm’000 Rm’000
At 1 July 7,599 10,165 7,599 9,049Amount written back in respect of recoveries – (2,566) – (1,450)Amount written off (7,599) – (7,599) –
At 30 June – 7,599 – 7,599
Included in the financial investments available-for-sale are foreign currency bonds, which are pledged as collateral for obligations on securities sold under repurchase agreements for the Group and the Bank amounting to RM3,821,124,000 (2017: RM2,808,719,000) and RM3,794,195,000 (2017: RM2,799,044,000) respectively.
NoTES To ThE fINANCIAL STATEmENTSfoR ThE fINANCIAL yEAR ENdEd 30 JuNE 2018
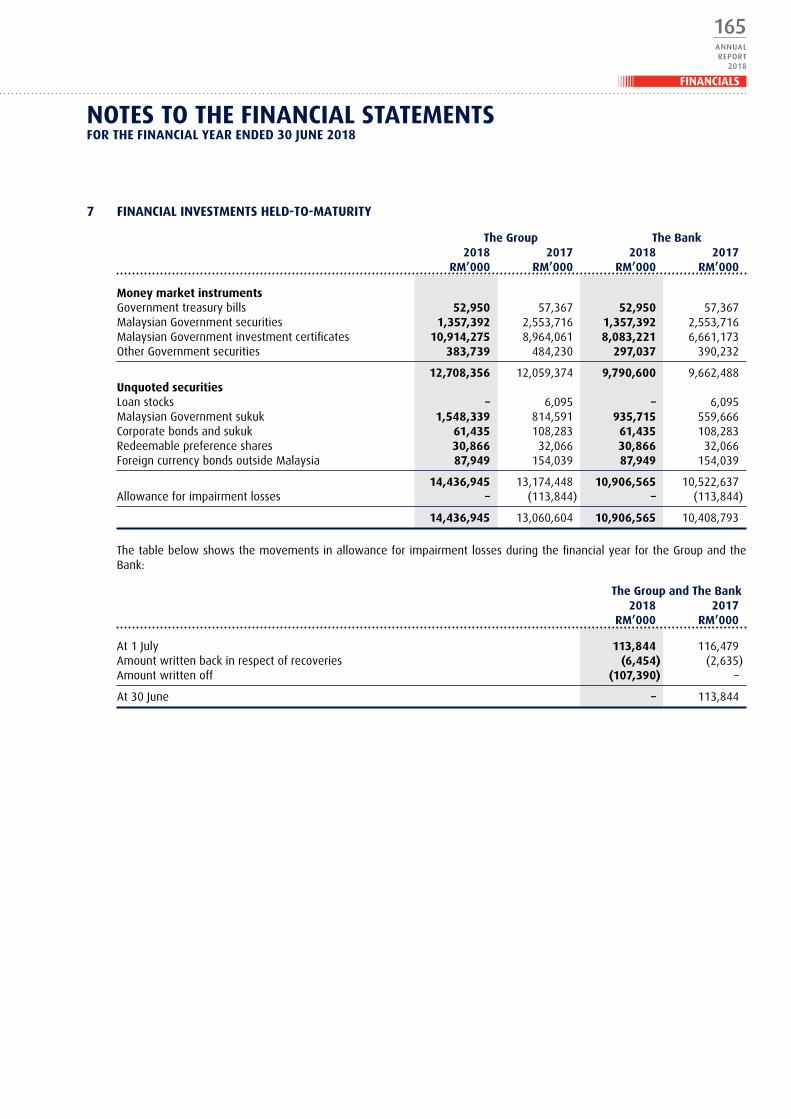
165ANNUALREPORT
2018
FINANCIALS
7 fINANCIAL INVESTmENTS hELd-To-mATuRITy
The group The Bank 2018 2017 2018 2017 Rm’000 Rm’000 Rm’000 Rm’000
money market instrumentsGovernment treasury bills 52,950 57,367 52,950 57,367Malaysian Government securities 1,357,392 2,553,716 1,357,392 2,553,716Malaysian Government investment certificates 10,914,275 8,964,061 8,083,221 6,661,173Other Government securities 383,739 484,230 297,037 390,232
12,708,356 12,059,374 9,790,600 9,662,488unquoted securitiesLoan stocks – 6,095 – 6,095Malaysian Government sukuk 1,548,339 814,591 935,715 559,666Corporate bonds and sukuk 61,435 108,283 61,435 108,283Redeemable preference shares 30,866 32,066 30,866 32,066Foreign currency bonds outside Malaysia 87,949 154,039 87,949 154,039
14,436,945 13,174,448 10,906,565 10,522,637Allowance for impairment losses – (113,844) – (113,844)
14,436,945 13,060,604 10,906,565 10,408,793
The table below shows the movements in allowance for impairment losses during the financial year for the Group and the Bank:
The group and The Bank 2018 2017 Rm’000 Rm’000
At 1 July 113,844 116,479Amount written back in respect of recoveries (6,454) (2,635)Amount written off (107,390) –
At 30 June – 113,844
NoTES To ThE fINANCIAL STATEmENTSfoR ThE fINANCIAL yEAR ENdEd 30 JuNE 2018
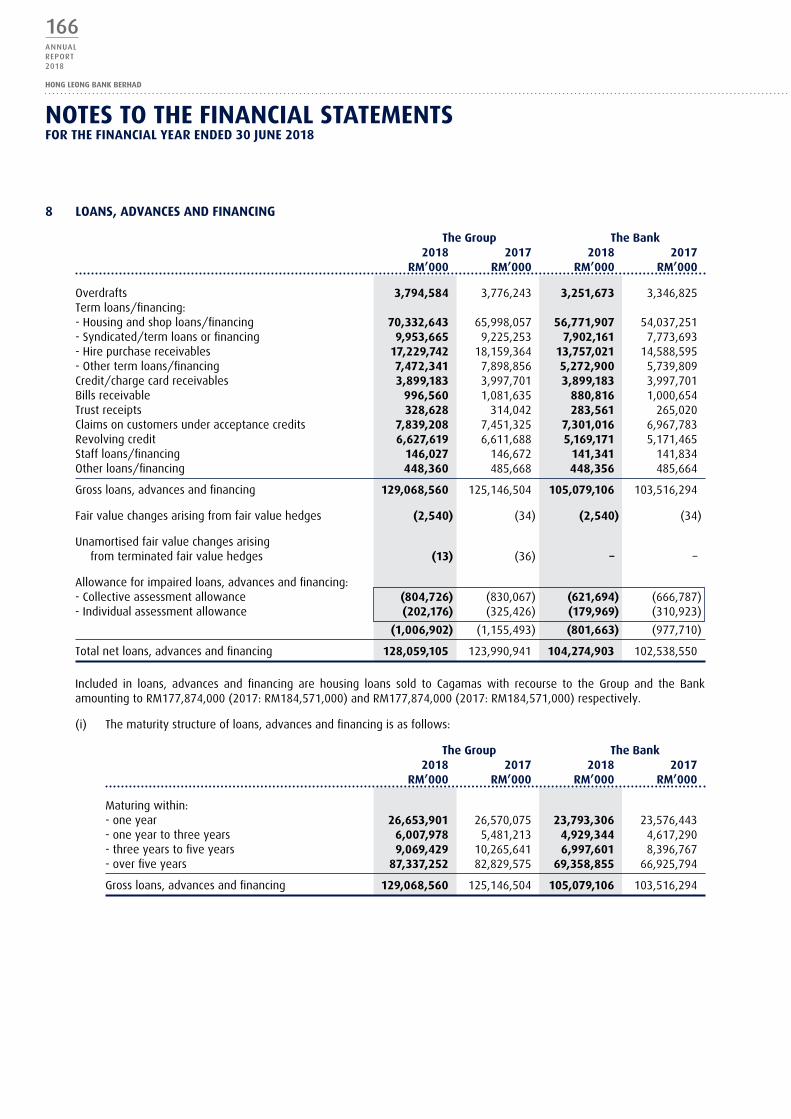
166ANNUALREPORT2018
HONG LEONG BANK BERHAD
8 LoANS, AdVANCES ANd fINANCINg
The group The Bank 2018 2017 2018 2017 Rm’000 Rm’000 Rm’000 Rm’000
Overdrafts 3,794,584 3,776,243 3,251,673 3,346,825Term loans/financing:- Housing and shop loans/financing 70,332,643 65,998,057 56,771,907 54,037,251- Syndicated/term loans or financing 9,953,665 9,225,253 7,902,161 7,773,693- Hire purchase receivables 17,229,742 18,159,364 13,757,021 14,588,595- Other term loans/financing 7,472,341 7,898,856 5,272,900 5,739,809Credit/charge card receivables 3,899,183 3,997,701 3,899,183 3,997,701Bills receivable 996,560 1,081,635 880,816 1,000,654Trust receipts 328,628 314,042 283,561 265,020Claims on customers under acceptance credits 7,839,208 7,451,325 7,301,016 6,967,783Revolving credit 6,627,619 6,611,688 5,169,171 5,171,465Staff loans/financing 146,027 146,672 141,341 141,834Other loans/financing 448,360 485,668 448,356 485,664
Gross loans, advances and financing 129,068,560 125,146,504 105,079,106 103,516,294
Fair value changes arising from fair value hedges (2,540) (34) (2,540) (34)
Unamortised fair value changes arising from terminated fair value hedges (13) (36) – –
Allowance for impaired loans, advances and financing:- Collective assessment allowance (804,726) (830,067) (621,694) (666,787)- Individual assessment allowance (202,176) (325,426) (179,969) (310,923)
(1,006,902) (1,155,493) (801,663) (977,710)
Total net loans, advances and financing 128,059,105 123,990,941 104,274,903 102,538,550
Included in loans, advances and financing are housing loans sold to Cagamas with recourse to the Group and the Bank amounting to RM177,874,000 (2017: RM184,571,000) and RM177,874,000 (2017: RM184,571,000) respectively.
(i) The maturity structure of loans, advances and financing is as follows:
The group The Bank 2018 2017 2018 2017 Rm’000 Rm’000 Rm’000 Rm’000
Maturing within:- one year 26,653,901 26,570,075 23,793,306 23,576,443- one year to three years 6,007,978 5,481,213 4,929,344 4,617,290- three years to five years 9,069,429 10,265,641 6,997,601 8,396,767- over five years 87,337,252 82,829,575 69,358,855 66,925,794
Gross loans, advances and financing 129,068,560 125,146,504 105,079,106 103,516,294
NoTES To ThE fINANCIAL STATEmENTSfoR ThE fINANCIAL yEAR ENdEd 30 JuNE 2018

167ANNUALREPORT
2018
FINANCIALS
8 LoANS, AdVANCES ANd fINANCINg (CoNTINuEd)
(ii) The loans, advances and financing are disbursed to the following types of customers:
The group The Bank 2018 2017 2018 2017 Rm’000 Rm’000 Rm’000 Rm’000
Domestic non-bank financial institutions other than stockbroking companies 597,185 651,907 248,848 226,859
Domestic business enterprises:- small and medium enterprises 20,480,084 20,377,235 17,433,561 17,888,565- others 16,377,193 15,370,541 13,226,492 12,440,268Government and statutory bodies 19,374 29,072 7,803 17,492Individuals 84,422,878 81,370,008 67,261,406 65,852,784Other domestic entities 269,937 79,052 207,752 21,655Foreign entities 6,901,909 7,268,689 6,693,244 7,068,671
Gross loans, advances and financing 129,068,560 125,146,504 105,079,106 103,516,294
(iii) Loans, advances and financing analysed by interest rate/profit rate sensitivity are as follows:
The group The Bank 2018 2017 2018 2017 Rm’000 Rm’000 Rm’000 Rm’000
Fixed rate:- Housing and shop loans/financing 2,583,078 4,753,906 1,769,012 3,371,016- Hire purchase receivables 16,916,260 17,747,828 13,444,246 14,177,059- Credit card 3,899,183 3,997,701 3,899,183 3,997,701- Other fixed rate loans/financing 2,777,605 2,930,770 1,381,055 1,820,721
Variable rate:- Base rate/base lending rate plus 86,079,824 78,636,505 71,114,897 66,091,018- Cost plus 16,407,547 16,681,983 13,470,713 14,058,779- Other variable rates 405,063 397,811 – –
Gross loans, advances and financing 129,068,560 125,146,504 105,079,106 103,516,294
(iv) Loans, advances and financing analysed by their economic purposes are as follows:
The group The Bank 2018 2017 2018 2017 Rm’000 Rm’000 Rm’000 Rm’000
Purchase of securities 382,505 490,252 381,331 486,882Purchase of transport vehicles 16,893,592 17,583,583 13,370,936 13,949,451Residential property (housing) 61,370,372 56,860,638 48,915,309 46,001,510Non-residential property 15,553,253 15,774,407 13,925,835 14,427,100Purchase of fixed assets
(excluding landed properties) 546,924 379,050 482,511 326,595Personal use 3,248,454 3,563,125 2,170,175 2,611,693Credit card 3,899,183 3,997,701 3,899,183 3,997,701Construction 1,552,918 1,238,539 1,024,050 894,464Mergers and acquisition 362,600 201,182 179,269 201,182Working capital 23,850,860 23,190,404 19,761,563 19,087,337Other purpose 1,407,899 1,867,623 968,944 1,532,379
Gross loans, advances and financing 129,068,560 125,146,504 105,079,106 103,516,294
NoTES To ThE fINANCIAL STATEmENTSfoR ThE fINANCIAL yEAR ENdEd 30 JuNE 2018

168ANNUALREPORT2018
HONG LEONG BANK BERHAD
8 LoANS, AdVANCES ANd fINANCINg (CoNTINuEd)
(v) Loans, advances and financing analysed by their geographical distribution are as follows:
The group The Bank 2018 2017 2018 2017 Rm’000 Rm’000 Rm’000 Rm’000
In Malaysia 122,542,932 118,561,256 99,981,335 98,137,161Outside Malaysia:- Singapore 5,097,771 5,379,133 5,097,771 5,379,133- Vietnam 405,063 397,813 – –- Cambodia 1,022,794 808,302 – –
Gross loans, advances and financing 129,068,560 125,146,504 105,079,106 103,516,294
(vi) Impaired loans, advances and financing analysed by their economic purposes are as follows:
The group The Bank 2018 2017 2018 2017 Rm’000 Rm’000 Rm’000 Rm’000
Purchase of securities 1,256 2,196 1,256 2,196Purchase of transport vehicles 134,022 142,643 101,223 108,758Residential property (housing) 352,900 306,758 253,976 225,075Non-residential property 170,961 133,296 165,421 131,408Purchase of fixed assets
(excluding landed properties) 3,465 3,332 3,465 2,101Personal use 46,682 44,066 29,519 34,086Credit card 39,562 48,005 39,562 48,005Construction 3,530 7,209 2,963 5,399Working capital 369,990 499,734 306,284 444,903Other purpose 3,134 16,201 2,564 16,051
Gross impaired loans, advances and financing 1,125,502 1,203,440 906,233 1,017,982
(vii) Movements in the impaired loans, advances and financing are as follows:
The group The Bank 2018 2017 2018 2017 Rm’000 Rm’000 Rm’000 Rm’000
At 1 July 1,203,440 956,579 1,017,982 836,568Classified as impaired during the financial year 1,663,447 1,813,591 1,278,452 1,466,120Reclassified as non-impaired during the financial year (889,043) (821,519) (652,719) (639,505)Amount written back in respect of recoveries (387,313) (336,403) (329,643) (285,379)Amount written off (460,834) (407,656) (404,026) (358,292)Exchange difference (4,195) (1,152) (3,813) (1,530)
At 30 June 1,125,502 1,203,440 906,233 1,017,982
Gross impaired loans as a % of gross loans, advances and financing 0.87% 0.96% 0.86% 0.98%
NoTES To ThE fINANCIAL STATEmENTSfoR ThE fINANCIAL yEAR ENdEd 30 JuNE 2018

169ANNUALREPORT
2018
FINANCIALS
8 LoANS, AdVANCES ANd fINANCINg (CoNTINuEd)
(viii) Impaired loans, advances and financing analysed by their geographical distribution are as follows:
The group The Bank 2018 2017 2018 2017 Rm’000 Rm’000 Rm’000 Rm’000
In Malaysia 1,112,810 1,197,355 904,839 1,017,511Outside Malaysia:- Singapore 1,394 471 1,394 471- Vietnam 3,937 5,098 – –- Cambodia 7,361 516 – –
Gross impaired loans, advances and financing 1,125,502 1,203,440 906,233 1,017,982
(ix) Movements in the allowance for impaired loans, advances and financing are as follows:
The group The Bank 2018 2017 2018 2017 Rm’000 Rm’000 Rm’000 Rm’000
Collective assessment allowanceAt 1 July 830,067 856,057 666,787 714,272Net allowances made during the financial year 299,887 283,057 224,340 217,958Amount transferred to individual assessment – (729) – (744)Amount written off (310,061) (298,120) (257,615) (256,059)Unwinding income (14,475) (10,732) (11,488) (8,911)Exchange difference (692) 534 (330) 271
At 30 June 804,726 830,067 621,694 666,787
Individual assessment allowanceAt 1 July 325,426 289,744 310,923 280,216Allowances made during the financial year 63,397 162,669 50,952 149,891Amount transferred from collective assessment – 729 – 744Amount written back in respect of recoveries (55,505) (46,433) (52,077) (42,003)Amount written off (119,266) (72,260) (118,014) (68,890)Unwinding income (7,959) (8,741) (7,951) (8,712)Exchange difference (3,917) (282) (3,864) (323)
At 30 June 202,176 325,426 179,969 310,923
9 oThER ASSETS
The group The Bank 2018 2017 2018 2017 Rm’000 Rm’000 Rm’000 Rm’000
Foreclosed properties 46 46 46 46Sundry debtors and other prepayments 204,716 154,350 162,716 144,081Treasury related receivables 65,547 457,935 65,547 393,525Cash collateral pledged for derivative transactions 310,933 653,625 310,933 653,625Other receivables 198,827 141,775 147,454 118,062
780,069 1,407,731 686,696 1,309,339
NoTES To ThE fINANCIAL STATEmENTSfoR ThE fINANCIAL yEAR ENdEd 30 JuNE 2018
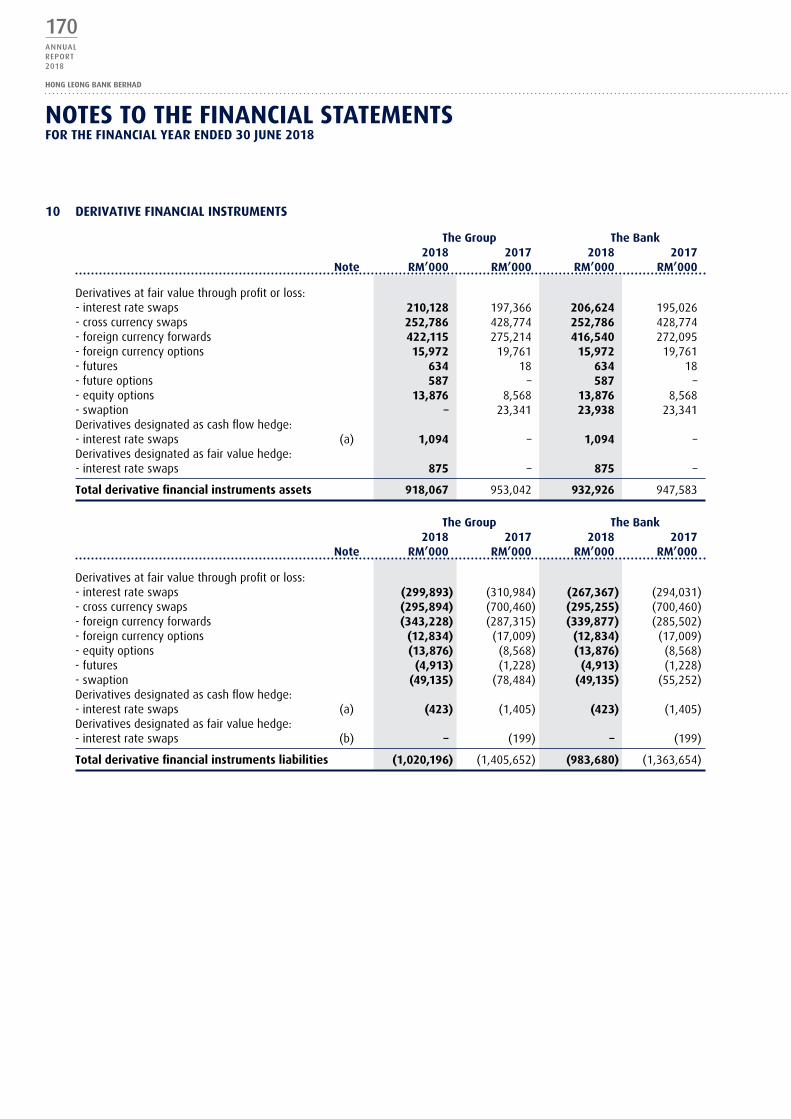
170ANNUALREPORT2018
HONG LEONG BANK BERHAD
10 dERIVATIVE fINANCIAL INSTRumENTS
The group The Bank 2018 2017 2018 2017 Note Rm’000 Rm’000 Rm’000 Rm’000
Derivatives at fair value through profit or loss:- interest rate swaps 210,128 197,366 206,624 195,026- cross currency swaps 252,786 428,774 252,786 428,774- foreign currency forwards 422,115 275,214 416,540 272,095- foreign currency options 15,972 19,761 15,972 19,761- futures 634 18 634 18- future options 587 – 587 –- equity options 13,876 8,568 13,876 8,568- swaption – 23,341 23,938 23,341Derivatives designated as cash flow hedge:- interest rate swaps (a) 1,094 – 1,094 –Derivatives designated as fair value hedge:- interest rate swaps 875 – 875 –
Total derivative financial instruments assets 918,067 953,042 932,926 947,583
The group The Bank 2018 2017 2018 2017 Note Rm’000 Rm’000 Rm’000 Rm’000
Derivatives at fair value through profit or loss:- interest rate swaps (299,893) (310,984) (267,367) (294,031)- cross currency swaps (295,894) (700,460) (295,255) (700,460)- foreign currency forwards (343,228) (287,315) (339,877) (285,502)- foreign currency options (12,834) (17,009) (12,834) (17,009)- equity options (13,876) (8,568) (13,876) (8,568)- futures (4,913) (1,228) (4,913) (1,228)- swaption (49,135) (78,484) (49,135) (55,252)Derivatives designated as cash flow hedge:- interest rate swaps (a) (423) (1,405) (423) (1,405)Derivatives designated as fair value hedge:- interest rate swaps (b) – (199) – (199)
Total derivative financial instruments liabilities (1,020,196) (1,405,652) (983,680) (1,363,654)
NoTES To ThE fINANCIAL STATEmENTSfoR ThE fINANCIAL yEAR ENdEd 30 JuNE 2018

171ANNUALREPORT
2018
FINANCIALS
10 dERIVATIVE fINANCIAL INSTRumENTS (CoNTINuEd)
(a) Cash flow hedge
The Group and the Bank’s cash flow hedges principally consist of interest rate swaps that are used to protect against exposures to variability in future interest cash flows on interest incurring liabilities. The amount and timing of the interest cash flows, are projected on the basis of their contractual terms and other relevant factors, including estimates of renewal of interest incurring liabilities. The aggregate projected interest cash flows over time form the basis for identifying gains and losses on the effective portions of derivatives designated as cash flow hedges to forecast transactions. Gains and losses are initially recognised directly in equity, in the cash flow hedge reserve, and are transferred to profit or loss when the forecast cash flows affect the profit or loss.
The hedging relationship was fully effective for the total hedging period and as of the reporting date. As such, the unrealised gain of RM832,000 (2017: unrealised loss of RM1,068,000) from the hedging relationship as disclosed in Note 28(f) were recognised through other comprehensive income.
The cash flows of the hedging instruments and the hedged items are detailed below:
The group and The Bank up to 1 month > 1 - 3 months > 3 - 6 months > 6 - 12 months > 1 - 5 years Rm’000 Rm’000 Rm’000 Rm’000 Rm’000
As at 30 June 2018Cash inflows (hedging instruments) 1,380 2,770 4,239 8,382 34,814Cash outflows (hedged items) (1,376) (2,524) (3,990) (7,879) (32,374)
Net cash inflows 4 246 249 503 2,440
As at 30 June 2017Cash inflows (hedging instruments) 1,283 1,767 3,070 6,174 34,679Cash outflows (hedged items) (1,279) (1,563) (2,801) (5,638) (31,188)
Net cash inflows 4 204 269 536 3,491
(b) fair value hedge
The Group and the Bank’s fair value hedges principally consist of interest rate swaps that are used to protect against changes in the fair value of financial assets due to movement in interest rates. The Group and the Bank have undertaken fair value hedges on interest rate risk of RM401,786,000 (2017: RM 196,429,000) at Group and Bank respectively on certain receivables using interest rate swaps. The total fair value loss of the said interest rate swaps related to these hedges amounted to RM875,000 (2017: RM 199,000) at Group and Bank, respectively.
Included in the net non-interest income is the net gains and losses arising from fair value hedges that were effective during the financial year as follows:
The group The Bank 2018 2017 2018 2017 Rm’000 Rm’000 Rm’000 Rm’000
Gain on hedging instruments (2,505) 32 (2,505) 32Loss on the hedged items attributable to the hedged risks 2,353 (35) 2,353 (35)
(152) (3) (152) (3)
NoTES To ThE fINANCIAL STATEmENTSfoR ThE fINANCIAL yEAR ENdEd 30 JuNE 2018
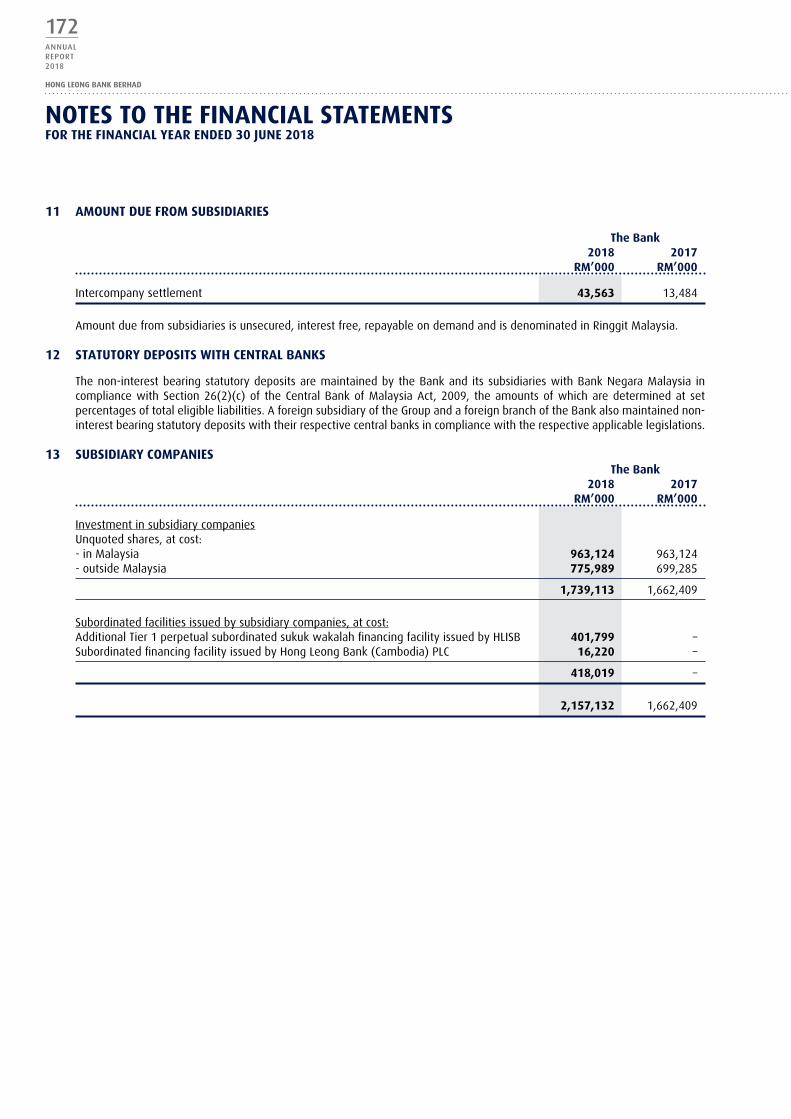
172ANNUALREPORT2018
HONG LEONG BANK BERHAD
11 AmouNT duE fRom SuBSIdIARIES
The Bank 2018 2017 Rm’000 Rm’000
Intercompany settlement 43,563 13,484
Amount due from subsidiaries is unsecured, interest free, repayable on demand and is denominated in Ringgit Malaysia.
12 STATuToRy dEPoSITS wITh CENTRAL BANkS
The non-interest bearing statutory deposits are maintained by the Bank and its subsidiaries with Bank Negara Malaysia in compliance with Section 26(2)(c) of the Central Bank of Malaysia Act, 2009, the amounts of which are determined at set percentages of total eligible liabilities. A foreign subsidiary of the Group and a foreign branch of the Bank also maintained non-interest bearing statutory deposits with their respective central banks in compliance with the respective applicable legislations.
13 SuBSIdIARy ComPANIES The Bank
2018 2017 Rm’000 Rm’000
Investment in subsidiary companiesUnquoted shares, at cost:- in Malaysia 963,124 963,124- outside Malaysia 775,989 699,285
1,739,113 1,662,409
Subordinated facilities issued by subsidiary companies, at cost:Additional Tier 1 perpetual subordinated sukuk wakalah financing facility issued by HLISB 401,799 –Subordinated financing facility issued by Hong Leong Bank (Cambodia) PLC 16,220 –
418,019 –
2,157,132 1,662,409
NoTES To ThE fINANCIAL STATEmENTSfoR ThE fINANCIAL yEAR ENdEd 30 JuNE 2018

173ANNUALREPORT
2018
FINANCIALS
13 SuBSIdIARy ComPANIES (CoNTINuEd)
The subsidiary companies of the Bank are as follows:
Name Percentage (%) of equity held Principal activities 2018 2017
(a) Hong Leong Islamic Bank Berhad 100 100 Islamic Banking business and related financial services
(b) HLB Principal Investments (L) Limited and its 100 100 Investment holding subsidiary company: - Promino Sdn Bhd 100 100 Dormant
(c) EB Nominees (Tempatan) Sendirian Berhad 100 100 Nominees services
(d) EB Nominees (Asing) Sendirian Berhad 100 100 Nominees services
(e) EB Realty Sendirian Berhad 100 100 Property investment
(f) OBB Realty Sdn Bhd 100 100 Property investment
(g) HLF Credit (Perak) Bhd and its subsidiary 100 100 Investment holding companies:
(i) Gensource Sdn Bhd and its subsidiary company: 100 100 Investment holding - Pelita Terang Sdn Bhd 100 100 Dormant
(ii) WTB Corporation Sdn Bhd 100 100 Dormant
(iii) Chew Geok Lin Finance Sdn Bhd 100 100 Dormant
(iv) Hong Leong Leasing Sdn Bhd * 100 100 Dormant
(v) HL Leasing Sdn Bhd 100 100 Dormant
(vi) HLB Realty Sdn Bhd 100 100 Property investment
(h) HLB Nominees (Tempatan) Sdn Bhd 100 100 Agent and nominee for Malaysian clients
(i) HLB Nominees (Asing) Sdn Bhd 100 100 Agent and nominee for foreign clients
(j) HL Bank Nominees (Singapore) Pte Ltd *+ 100 100 Agent and nominee for clients
(k) HLB Trade Services (Hong Kong) Limited *+ 100 100 Ceased operations
(l) Hong Leong Bank Vietnam Limited *+ 100 100 Commercial banking business
(m) Hong Leong Bank (Cambodia) PLC *+ 100 100 Commercial banking business
(n) Promilia Berhad 100 100 Dormant
(o) DC Tower Sdn Bhd 100 100 Property management
(p) Unincorporated trust for ESOS Ω * – – Special purpose vehicle
* Not audited by PricewaterhouseCoopers PLT
+ Audited by member firm of PricewaterhouseCoopers InternationalΩ Deemed subsidiaries pursuant to MFRS 10 ‘Consolidated Financial Statements’
All the subsidiary companies are incorporated in Malaysia with the exception of HL Bank Nominees (Singapore) Pte Ltd which is incorporated in Singapore, HLB Trade Services (Hong Kong) Limited which is incorporated in Hong Kong, Hong Leong Bank Vietnam Limited which is incorporated in Vietnam and Hong Leong Bank (Cambodia) PLC which is incorporated in Cambodia.
NoTES To ThE fINANCIAL STATEmENTSfoR ThE fINANCIAL yEAR ENdEd 30 JuNE 2018

174ANNUALREPORT2018
HONG LEONG BANK BERHAD
14 INVESTmENT IN JoINT VENTuRE
The group The Bank 2018 2017 2018 2017 Rm’000 Rm’000 Rm’000 Rm’000
Retained portionUnquoted shares outside Malaysia, at cost 24,657 24,657 24,657 24,657Cumulative share of results, net of dividends received 26,342 20,882 – –Exchange fluctuation reserve 6,674 8,842 – –
57,673 54,381 24,657 24,657
Equity interest held for sale 121,753 114,804 52,054 52,054
179,426 169,185 76,711 76,711
(a) Information about joint venture
On 1 March 2010, HLB together with Bank of Chengdu Co., Ltd. (“BOCD”), obtained operation approval from China Banking Regulatory Commission (“CBRC”) for Sichuan Jincheng Consumer Finance Limited Company (“JV Co”), a joint venture company that is part of the first batch of approved companies, to start consumer finance operations in Central and Western China. This JV Co focuses primarily in the consumer financing business with HLB having a 49% equity interest and BOCD having a 51% equity interest in the JV Co. This strategic alliance between HLB and BOCD to tap into the promising and growing financial services sector in China further cements the Bank’s strategic partnership in BOCD and affirms the Bank’s vision and belief in the huge potential of China.
In March 2017, the Board of Directors has approved the divestment of 37% of the Bank’s stake through non-subscription of the issuance of new share capital by JV Co and selling down the original share capital held by the Bank to new strategic investors through an exercise to be conducted via Southwest United Equity Exchange. The sale was completed upon obtaining approval from CBRC vide its letter dated 3 September 2018. Post completion of the divestment exercise, the Bank would continue to equity account the retained interest of 12% as the Bank is still deemed to have significant influence in JV Co.
Investment in joint venture classified as held for sale as at the reporting period was measured at the lower of its carrying amount and fair value less costs to sell at the time of the reclassification. The investment classified as held for sale amounted to RM121,753,000 for the financial year ended 30 June 2018. The foreign currency translation differences accumulated in equity relating to joint venture classified as held for sale amounted to RM14,089,000 for the financial year ended 30 June 2018.
JV Co is a private company and there is no quoted market price available for its shares.
(b) Summarised financial information of the joint venture, which is accounted for using the equity method is as follows:
The group 2018 2017 Rm’000 Rm’000
Total assets 1,184,983 783,476Total liabilities (818,808) (438,201)
Net assets 366,175 345,275
NoTES To ThE fINANCIAL STATEmENTSfoR ThE fINANCIAL yEAR ENdEd 30 JuNE 2018
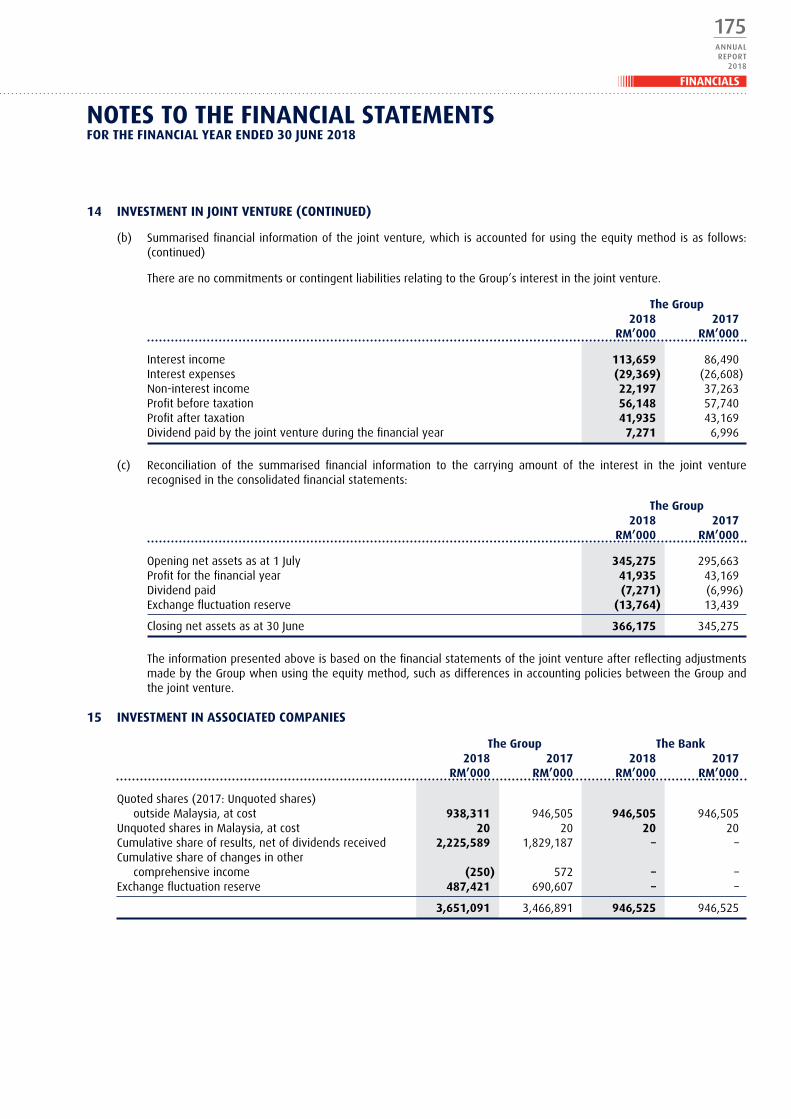
175ANNUALREPORT
2018
FINANCIALS
14 INVESTmENT IN JoINT VENTuRE (CoNTINuEd)
(b) Summarised financial information of the joint venture, which is accounted for using the equity method is as follows: (continued)
There are no commitments or contingent liabilities relating to the Group’s interest in the joint venture.
The group 2018 2017 Rm’000 Rm’000
Interest income 113,659 86,490Interest expenses (29,369) (26,608)Non-interest income 22,197 37,263Profit before taxation 56,148 57,740Profit after taxation 41,935 43,169Dividend paid by the joint venture during the financial year 7,271 6,996
(c) Reconciliation of the summarised financial information to the carrying amount of the interest in the joint venture recognised in the consolidated financial statements:
The group 2018 2017 Rm’000 Rm’000
Opening net assets as at 1 July 345,275 295,663Profit for the financial year 41,935 43,169Dividend paid (7,271) (6,996)Exchange fluctuation reserve (13,764) 13,439
Closing net assets as at 30 June 366,175 345,275
The information presented above is based on the financial statements of the joint venture after reflecting adjustments made by the Group when using the equity method, such as differences in accounting policies between the Group and the joint venture.
15 INVESTmENT IN ASSoCIATEd ComPANIES
The group The Bank 2018 2017 2018 2017 Rm’000 Rm’000 Rm’000 Rm’000
Quoted shares (2017: Unquoted shares) outside Malaysia, at cost 938,311 946,505 946,505 946,505Unquoted shares in Malaysia, at cost 20 20 20 20Cumulative share of results, net of dividends received 2,225,589 1,829,187 – –Cumulative share of changes in other comprehensive income (250) 572 – –Exchange fluctuation reserve 487,421 690,607 – –
3,651,091 3,466,891 946,525 946,525
NoTES To ThE fINANCIAL STATEmENTSfoR ThE fINANCIAL yEAR ENdEd 30 JuNE 2018
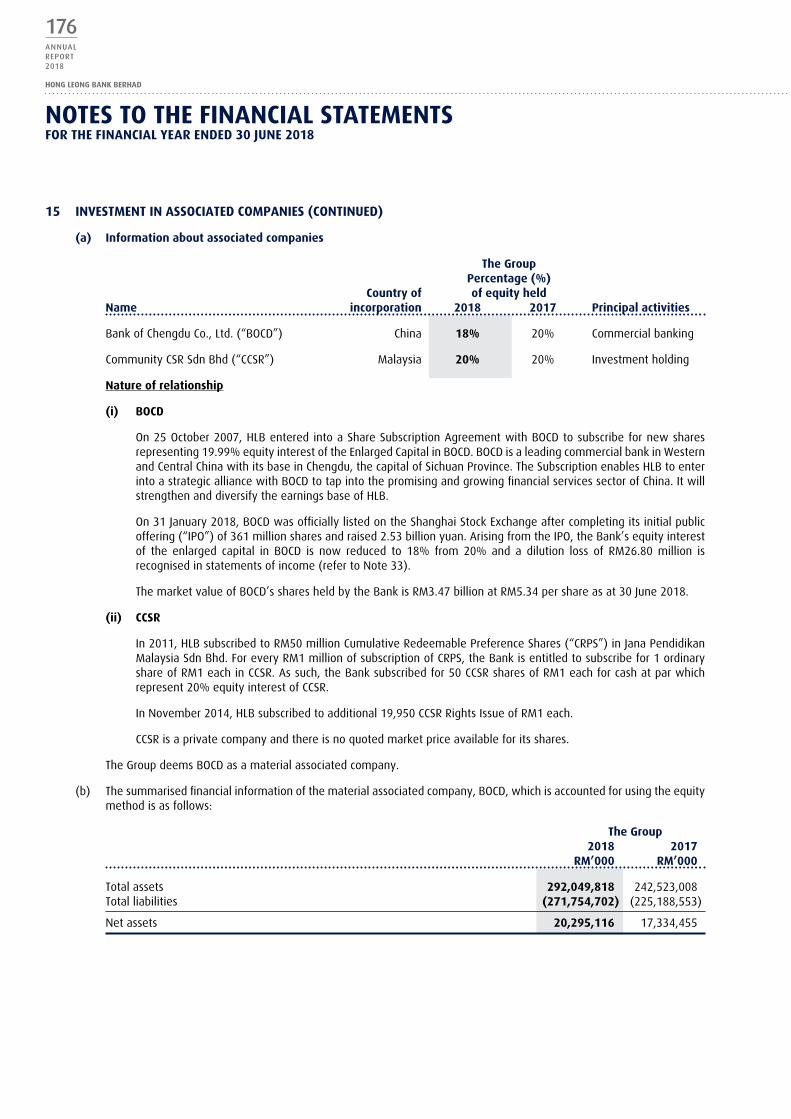
176ANNUALREPORT2018
HONG LEONG BANK BERHAD
15 INVESTmENT IN ASSoCIATEd ComPANIES (CoNTINuEd)
(a) Information about associated companies
The group Percentage (%)
Country of of equity held Name incorporation 2018 2017 Principal activities
Bank of Chengdu Co., Ltd. (“BOCD”) China 18% 20% Commercial banking
Community CSR Sdn Bhd (“CCSR”) Malaysia 20% 20% Investment holding
Nature of relationship
(i) BoCd
On 25 October 2007, HLB entered into a Share Subscription Agreement with BOCD to subscribe for new shares representing 19.99% equity interest of the Enlarged Capital in BOCD. BOCD is a leading commercial bank in Western and Central China with its base in Chengdu, the capital of Sichuan Province. The Subscription enables HLB to enter into a strategic alliance with BOCD to tap into the promising and growing financial services sector of China. It will strengthen and diversify the earnings base of HLB.
On 31 January 2018, BOCD was officially listed on the Shanghai Stock Exchange after completing its initial public offering (“IPO”) of 361 million shares and raised 2.53 billion yuan. Arising from the IPO, the Bank’s equity interest of the enlarged capital in BOCD is now reduced to 18% from 20% and a dilution loss of RM26.80 million is recognised in statements of income (refer to Note 33).
The market value of BOCD’s shares held by the Bank is RM3.47 billion at RM5.34 per share as at 30 June 2018.
(ii) CCSR
In 2011, HLB subscribed to RM50 million Cumulative Redeemable Preference Shares (“CRPS”) in Jana Pendidikan Malaysia Sdn Bhd. For every RM1 million of subscription of CRPS, the Bank is entitled to subscribe for 1 ordinary share of RM1 each in CCSR. As such, the Bank subscribed for 50 CCSR shares of RM1 each for cash at par which represent 20% equity interest of CCSR.
In November 2014, HLB subscribed to additional 19,950 CCSR Rights Issue of RM1 each.
CCSR is a private company and there is no quoted market price available for its shares.
The Group deems BOCD as a material associated company.
(b) The summarised financial information of the material associated company, BOCD, which is accounted for using the equity method is as follows:
The group 2018 2017 Rm’000 Rm’000
Total assets 292,049,818 242,523,008Total liabilities (271,754,702) (225,188,553)
Net assets 20,295,116 17,334,455
NoTES To ThE fINANCIAL STATEmENTSfoR ThE fINANCIAL yEAR ENdEd 30 JuNE 2018
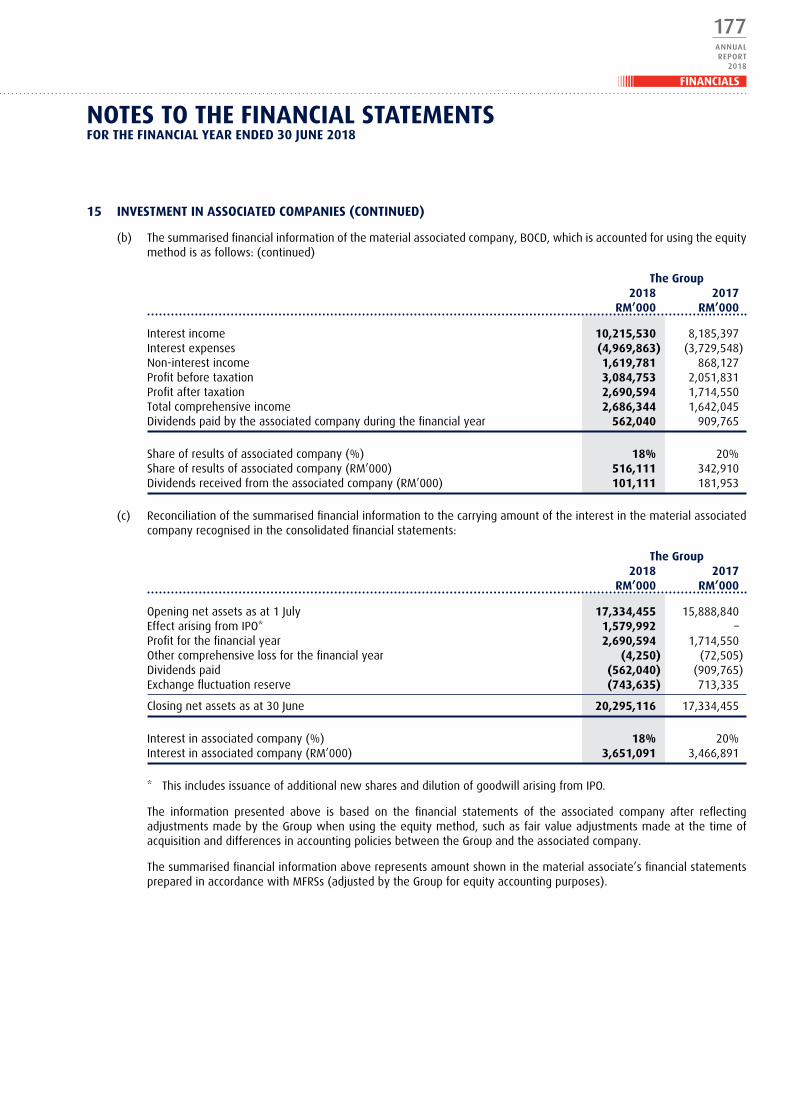
177ANNUALREPORT
2018
FINANCIALS
15 INVESTmENT IN ASSoCIATEd ComPANIES (CoNTINuEd)
(b) The summarised financial information of the material associated company, BOCD, which is accounted for using the equity method is as follows: (continued)
The group 2018 2017 Rm’000 Rm’000
Interest income 10,215,530 8,185,397Interest expenses (4,969,863) (3,729,548)Non-interest income 1,619,781 868,127Profit before taxation 3,084,753 2,051,831Profit after taxation 2,690,594 1,714,550Total comprehensive income 2,686,344 1,642,045Dividends paid by the associated company during the financial year 562,040 909,765
Share of results of associated company (%) 18% 20%Share of results of associated company (RM’000) 516,111 342,910Dividends received from the associated company (RM’000) 101,111 181,953
(c) Reconciliation of the summarised financial information to the carrying amount of the interest in the material associated company recognised in the consolidated financial statements:
The group 2018 2017 Rm’000 Rm’000
Opening net assets as at 1 July 17,334,455 15,888,840Effect arising from IPO* 1,579,992 –Profit for the financial year 2,690,594 1,714,550Other comprehensive loss for the financial year (4,250) (72,505)Dividends paid (562,040) (909,765)Exchange fluctuation reserve (743,635) 713,335
Closing net assets as at 30 June 20,295,116 17,334,455
Interest in associated company (%) 18% 20%Interest in associated company (RM’000) 3,651,091 3,466,891
* This includes issuance of additional new shares and dilution of goodwill arising from IPO.
The information presented above is based on the financial statements of the associated company after reflecting adjustments made by the Group when using the equity method, such as fair value adjustments made at the time of acquisition and differences in accounting policies between the Group and the associated company.
The summarised financial information above represents amount shown in the material associate’s financial statements prepared in accordance with MFRSs (adjusted by the Group for equity accounting purposes).
NoTES To ThE fINANCIAL STATEmENTSfoR ThE fINANCIAL yEAR ENdEd 30 JuNE 2018
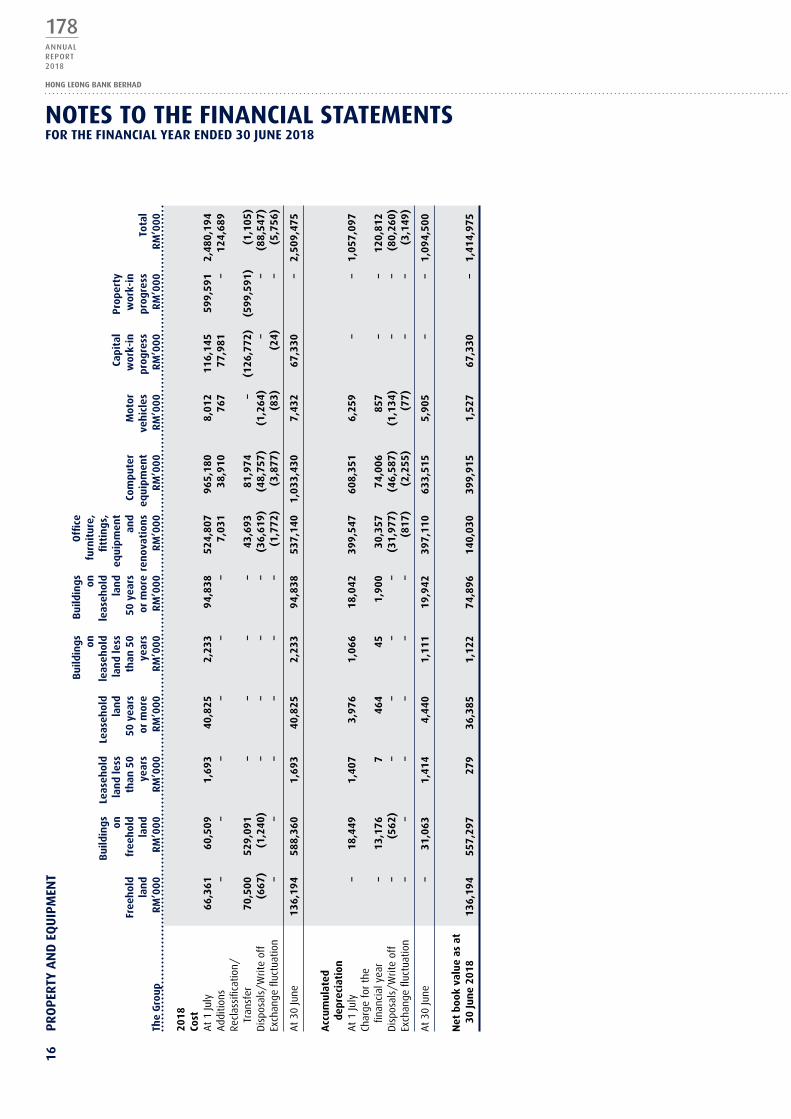
178ANNUALREPORT2018
HONG LEONG BANK BERHAD
16
PR
oP
ERTy
AN
d E
qu
IPm
ENT
B
uild
ings
B
uild
ings
o
ffice
on
on
furn
itur
e,
Bui
ldin
gs
Leas
ehol
d Le
aseh
old
leas
ehol
d le
aseh
old
fitt
ings
,
on
la
nd
less
la
nd
lan
d le
ss
lan
d eq
uipm
ent
Capi
tal
Pro
pert
y
free
hol
d fr
eeh
old
than
50
50 y
ears
th
an 5
0 50
yea
rs
and
Com
pute
r m
otor
w
ork-
in
wor
k-in
lan
d la
nd
year
s or
mor
e ye
ars
or m
ore
ren
ovat
ion
s eq
uipm
ent
veh
icle
s pr
ogre
ss
prog
ress
To
tal
The
gro
up
Rm
’000
R
m’0
00
Rm
’000
R
m’0
00
Rm
’000
R
m’0
00
Rm
’000
R
m’0
00
Rm
’000
R
m’0
00
Rm
’000
R
m’0
00
2018
Cost
At
1 Ju
ly
66,3
61
60,5
09
1,69
3 40
,825
2,
233
94,8
38
524,
807
965,
180
8,01
2 11
6,14
5 59
9,59
1 2,
480,
194
Add
ition
s –
– –
– –
– 7,
031
38,9
10
767
77,9
81
– 12
4,68
9Re
clas
sific
atio
n/
Tr
ansf
er
70,5
00
529,
091
– –
– –
43,6
93
81,9
74
– (1
26,7
72)
(599
,591
) (1
,105
)D
ispo
sals
/Writ
e of
f (6
67)
(1,2
40)
– –
– –
(36,
619)
(4
8,75
7)
(1,2
64)
– –
(88,
547)
Exch
ange
fluc
tuat
ion
– –
– –
– –
(1,7
72)
(3,8
77)
(83)
(2
4)
– (5
,756
)
At
30 Ju
ne
136,
194
588,
360
1,69
3 40
,825
2,
233
94,8
38
537,
140
1,03
3,43
0 7,
432
67,3
30
– 2,
509,
475
Acc
umul
ated
de
prec
iati
onA
t 1
July
–
18,4
49
1,40
7 3,
976
1,06
6 18
,042
39
9,54
7 60
8,35
1 6,
259
– –
1,05
7,09
7Ch
arge
for
the
finan
cial
yea
r –
13,1
76
7 46
4 45
1,
900
30,3
57
74,0
06
857
– –
120,
812
Dis
posa
ls/W
rite
off
– (5
62)
– –
– –
(31,
977)
(4
6,58
7)
(1,1
34)
– –
(80,
260)
Exch
ange
fluc
tuat
ion
– –
– –
– –
(817
) (2
,255
) (7
7)
– –
(3,1
49)
At
30 Ju
ne
– 31
,063
1,
414
4,44
0 1,
111
19,9
42
397,
110
633,
515
5,90
5 –
– 1,
094,
500
Net
boo
k va
lue
as a
t
30 Ju
ne
2018
13
6,19
4 55
7,29
7 27
9 36
,385
1,
122
74,8
96
140,
030
399,
915
1,52
7 67
,330
–
1,41
4,97
5
NoTES To ThE fINANCIAL STATEmENTSfoR ThE fINANCIAL yEAR ENdEd 30 JuNE 2018
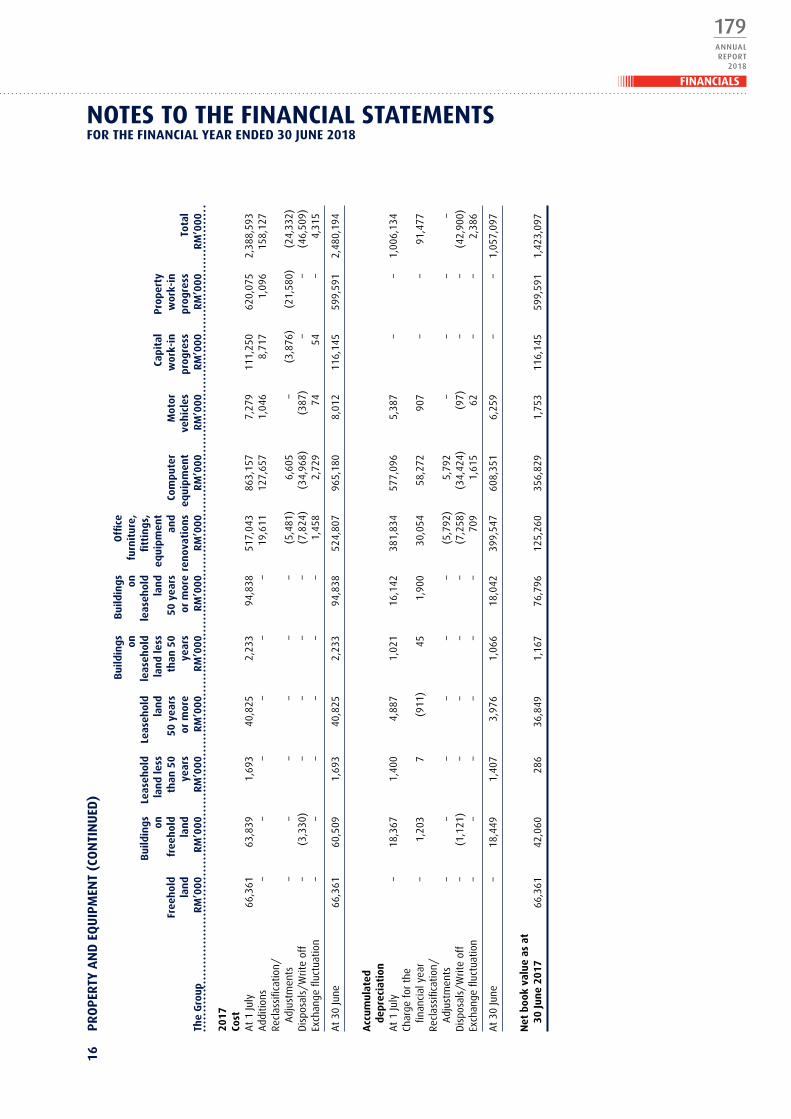
179ANNUALREPORT
2018
FINANCIALS16
P
Ro
PER
Ty A
Nd
Eq
uIP
mEN
T (C
oN
TIN
uEd
)
B
uild
ings
B
uild
ings
o
ffice
on
on
furn
itur
e,
Bui
ldin
gs
Leas
ehol
d Le
aseh
old
leas
ehol
d le
aseh
old
fitt
ings
,
on
la
nd
less
la
nd
lan
d le
ss
lan
d eq
uipm
ent
Capi
tal
Pro
pert
y
free
hol
d fr
eeh
old
than
50
50 y
ears
th
an 5
0 50
yea
rs
and
Com
pute
r m
otor
w
ork-
in
wor
k-in
lan
d la
nd
year
s or
mor
e ye
ars
or m
ore
ren
ovat
ion
s eq
uipm
ent
veh
icle
s pr
ogre
ss
prog
ress
To
tal
The
gro
up
Rm
’000
R
m’0
00
Rm
’000
R
m’0
00
Rm
’000
R
m’0
00
Rm
’000
R
m’0
00
Rm
’000
R
m’0
00
Rm
’000
R
m’0
00
2017
Cost
At
1 Ju
ly
66,3
61
63,8
39
1,69
3 40
,825
2,
233
94,8
38
517,
043
863,
157
7,27
9 11
1,25
0 62
0,07
5 2,
388,
593
Add
ition
s –
– –
– –
– 19
,611
12
7,65
7 1,
046
8,71
7 1,
096
158,
127
Recl
assi
ficat
ion/
Adj
ustm
ents
–
– –
– –
– (5
,481
) 6,
605
– (3
,876
) (2
1,58
0)
(24,
332)
Dis
posa
ls/W
rite
off
– (3
,330
) –
– –
– (7
,824
) (3
4,96
8)
(387
) –
– (4
6,50
9)Ex
chan
ge fl
uctu
atio
n –
– –
– –
– 1,
458
2,72
9 74
54
–
4,31
5
At
30 Ju
ne
66,3
61
60,5
09
1,69
3 40
,825
2,
233
94,8
38
524,
807
965,
180
8,01
2 11
6,14
5 59
9,59
1 2,
480,
194
Acc
umul
ated
depr
ecia
tion
At
1 Ju
ly
– 18
,367
1,
400
4,88
7 1,
021
16,1
42
381,
834
577,
096
5,38
7 –
– 1,
006,
134
Char
ge f
or t
he
fin
anci
al y
ear
– 1,
203
7 (9
11)
45
1,90
0 30
,054
58
,272
90
7 –
– 91
,477
Recl
assi
ficat
ion/
Adj
ustm
ents
–
– –
– –
– (5
,792
) 5,
792
– –
– –
Dis
posa
ls/W
rite
off
– (1
,121
) –
– –
– (7
,258
) (3
4,42
4)
(97)
–
– (4
2,90
0)Ex
chan
ge fl
uctu
atio
n –
– –
– –
– 70
9 1,
615
62
– –
2,38
6
At
30 Ju
ne
– 18
,449
1,
407
3,97
6 1,
066
18,0
42
399,
547
608,
351
6,25
9 –
– 1,
057,
097
Net
boo
k va
lue
as a
t
30 Ju
ne
2017
66
,361
42
,060
28
6 36
,849
1,
167
76,7
96
125,
260
356,
829
1,75
3 11
6,14
5 59
9,59
1 1,
423,
097
NoTES To ThE fINANCIAL STATEmENTSfoR ThE fINANCIAL yEAR ENdEd 30 JuNE 2018

180ANNUALREPORT2018
HONG LEONG BANK BERHAD
16
PR
oP
ERTy
AN
d E
qu
IPm
ENT
(Co
NTI
Nu
Ed)
B
uild
ings
B
uild
ings
o
ffice
on
on
furn
itur
e,
Bui
ldin
gs
Leas
ehol
d Le
aseh
old
leas
ehol
d le
aseh
old
fitt
ings
,
on
la
nd
less
la
nd
lan
d le
ss
lan
d eq
uipm
ent
Capi
tal
fr
eeh
old
free
hol
d th
an 5
0 50
yea
rs
than
50
50 y
ears
an
d Co
mpu
ter
mot
or
wor
k-in
lan
d la
nd
year
s or
mor
e ye
ars
or m
ore
ren
ovat
ion
s eq
uipm
ent
veh
icle
s pr
ogre
ss
Tota
l Th
e B
ank
Rm
’000
R
m’0
00
Rm
’000
R
m’0
00
Rm
’000
R
m’0
00
Rm
’000
R
m’0
00
Rm
’000
R
m’0
00
Rm
’000
2018
Cost
At
1 Ju
ly
56,4
99
57,4
03
433
39,7
74
1,97
2 91
,596
49
1,16
1 92
7,58
9 7,
663
113,
994
1,78
8,08
4A
dditi
ons
– –
– –
– –
6,51
3 38
,406
64
9 74
,374
11
9,94
2Re
clas
sific
atio
n/Tr
ansf
er
– –
– –
– –
42,6
60
79,0
84
– (1
22,2
86)
(542
)D
ispo
sals
/Writ
e of
f (6
67)
(1,2
40)
– –
– –
(33,
895)
(4
6,74
3)
(1,2
58)
– (8
3,80
3)Ex
chan
ge fl
uctu
atio
n –
– –
– –
– (4
45)
(2,7
54)
(64)
–
(3,2
63)
At
30 Ju
ne
55,8
32
56,1
63
433
39,7
74
1,97
2 91
,596
50
5,99
4 99
5,58
2 6,
990
66,0
82
1,82
0,41
8
Acc
umul
ated
dep
reci
atio
nA
t 1
July
–
16,4
82
148
3,71
7 95
8 16
,167
38
0,65
1 58
8,93
7 6,
025
– 1,
013,
085
Char
ge f
or t
he fi
nanc
ial y
ear
– 1,
134
7 45
4 39
1,
822
27,3
14
70,5
49
766
– 10
2,08
5D
ispo
sals
/Writ
e of
f –
(562
) –
– –
– (2
9,55
6)
(44,
702)
(1
,129
) –
(75,
949)
Exch
ange
fluc
tuat
ion
– –
– –
– –
(122
) (1
,470
) (6
4)
– (1
,656
)
At
30 Ju
ne
– 17
,054
15
5 4,
171
997
17,9
89
378,
287
613,
314
5,59
8 –
1,03
7,56
5
Net
boo
k va
lue
as a
t
30 Ju
ne
2018
55
,832
39
,109
27
8 35
,603
97
5 73
,607
12
7,70
7 38
2,26
8 1,
392
66,0
82
782,
853
NoTES To ThE fINANCIAL STATEmENTSfoR ThE fINANCIAL yEAR ENdEd 30 JuNE 2018
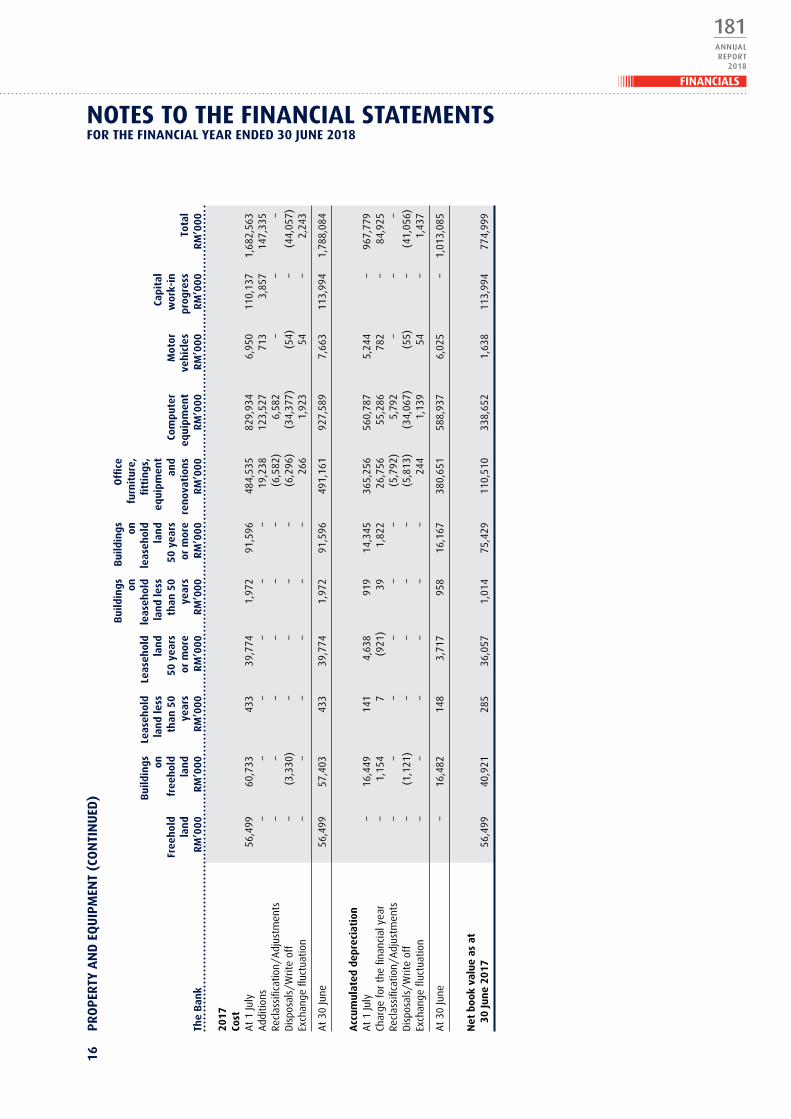
181ANNUALREPORT
2018
FINANCIALS16
P
Ro
PER
Ty A
Nd
Eq
uIP
mEN
T (C
oN
TIN
uEd
)
B
uild
ings
B
uild
ings
o
ffice
on
on
furn
itur
e,
Bui
ldin
gs
Leas
ehol
d Le
aseh
old
leas
ehol
d le
aseh
old
fitt
ings
,
on
la
nd
less
la
nd
lan
d le
ss
lan
d eq
uipm
ent
Capi
tal
fr
eeh
old
free
hol
d th
an 5
0 50
yea
rs
than
50
50 y
ears
an
d Co
mpu
ter
mot
or
wor
k-in
lan
d la
nd
year
s or
mor
e ye
ars
or m
ore
ren
ovat
ion
s eq
uipm
ent
veh
icle
s pr
ogre
ss
Tota
l Th
e B
ank
Rm
’000
R
m’0
00
Rm
’000
R
m’0
00
Rm
’000
R
m’0
00
Rm
’000
R
m’0
00
Rm
’000
R
m’0
00
Rm
’000
2017
Cost
At
1 Ju
ly
56,4
99
60,7
33
433
39,7
74
1,97
2 91
,596
48
4,53
5 82
9,93
4 6,
950
110,
137
1,68
2,56
3A
dditi
ons
– –
– –
– –
19,2
38
123,
527
713
3,85
7 14
7,33
5Re
clas
sific
atio
n/A
djus
tmen
ts
– –
– –
– –
(6,5
82)
6,58
2 –
– –
Dis
posa
ls/W
rite
off
– (3
,330
) –
– –
– (6
,296
) (3
4,37
7)
(54)
–
(44,
057)
Exch
ange
fluc
tuat
ion
– –
– –
– –
266
1,92
3 54
–
2,24
3
At
30 Ju
ne
56,4
99
57,4
03
433
39,7
74
1,97
2 91
,596
49
1,16
1 92
7,58
9 7,
663
113,
994
1,78
8,08
4
Acc
umul
ated
dep
reci
atio
nA
t 1
July
–
16,4
49
141
4,63
8 91
9 14
,345
36
5,25
6 56
0,78
7 5,
244
– 96
7,77
9Ch
arge
for
the
fina
ncia
l yea
r –
1,15
4 7
(921
) 39
1,
822
26,7
56
55,2
86
782
– 84
,925
Recl
assi
ficat
ion/
Adj
ustm
ents
–
– –
– –
– (5
,792
) 5,
792
– –
–D
ispo
sals
/Writ
e of
f –
(1,1
21)
– –
– –
(5,8
13)
(34,
067)
(5
5)
– (4
1,05
6)Ex
chan
ge fl
uctu
atio
n –
– –
– –
– 24
4 1,
139
54
– 1,
437
At
30 Ju
ne
– 16
,482
14
8 3,
717
958
16,1
67
380,
651
588,
937
6,02
5 –
1,01
3,08
5
Net
boo
k va
lue
as a
t
30 Ju
ne
2017
56
,499
40
,921
28
5 36
,057
1,
014
75,4
29
110,
510
338,
652
1,63
8 11
3,99
4 77
4,99
9
NoTES To ThE fINANCIAL STATEmENTSfoR ThE fINANCIAL yEAR ENdEd 30 JuNE 2018

182ANNUALREPORT2018
HONG LEONG BANK BERHAD
17 INTANgIBLE ASSETS
Core Customer Computer The group deposits relationships software Total 2018 Rm’000 Rm’000 Rm’000 Rm’000
Cost or valuationAt 1 July 152,434 127,426 525,424 805,284Additions – – 11,337 11,337Reclassification – – 755 755Disposals/Write off – – (11,807) (11,807)Exchange fluctuation – – (2,068) (2,068)
At 30 June 152,434 127,426 523,641 803,501
Amortisation and impairmentAt 1 July 134,286 78,581 379,094 591,961Amortisation during the financial year 18,148 12,743 40,950 71,841Disposals/Write off – – (11,778) (11,778)Exchange fluctuation – – (1,064) (1,064)
At 30 June 152,434 91,324 407,202 650,960
Net book value as at 30 June 2018 – 36,102 116,439 152,541
Core Customer Computer deposits relationships software Total 2017 Rm’000 Rm’000 Rm’000 Rm’000
Cost or valuationAt 1 July 152,434 127,426 503,179 783,039Additions – – 19,530 19,530Reclassification – – 2,686 2,686Disposals/Write off – – (1,484) (1,484)Exchange fluctuation – – 1,513 1,513
At 30 June 152,434 127,426 525,424 805,284
Amortisation and impairmentAt 1 July 112,510 65,838 339,925 518,273Amortisation during the financial year 21,776 12,743 39,950 74,469Disposals/Write off – – (1,427) (1,427)Exchange fluctuation – – 646 646
At 30 June 134,286 78,581 379,094 591,961
Net book value as at 30 June 2017 18,148 48,845 146,330 213,323
NoTES To ThE fINANCIAL STATEmENTSfoR ThE fINANCIAL yEAR ENdEd 30 JuNE 2018

183ANNUALREPORT
2018
FINANCIALS
17 INTANgIBLE ASSETS (CoNTINuEd)
Core Customer Computer The Bank deposits relationships software Total 2018 Rm’000 Rm’000 Rm’000 Rm’000
Cost or valuationAt 1 July 152,434 127,426 483,989 763,849Additions – – 9,681 9,681Reclassification – – 350 350Disposals/Write off – – (10,378) (10,378)
At 30 June 152,434 127,426 483,642 763,502
Amortisation and impairmentAt 1 July 134,286 78,581 356,112 568,979Amortisation during the financial year 18,148 12,743 36,828 67,719Disposals/Write off – – (10,362) (10,362)
At 30 June 152,434 91,324 382,578 626,336
Net book value as at 30 June 2018 – 36,102 101,064 137,166
Core Customer Computer deposits relationships software Total 2017 Rm’000 Rm’000 Rm’000 Rm’000
Cost or valuationAt 1 July 152,434 127,426 466,818 746,678Additions – – 18,613 18,613Disposals/Write off – – (1,442) (1,442)
At 30 June 152,434 127,426 483,989 763,849
Amortisation and impairmentAt 1 July 112,510 65,838 321,546 499,894Amortisation during the financial year 21,776 12,743 35,985 70,504Disposals/Write off – – (1,419) (1,419)
At 30 June 134,286 78,581 356,112 568,979
Net book value as at 30 June 2017 18,148 48,845 127,877 194,870
Customer relationships acquired in a business combination have value when they represent an identifiable and predictable source of future cash flows to the combined business.
The valuation of business banking customer relationships was determined using an income approach, specifically the multi-period excess earnings method (“MEEM”). This was done by discounting forecasted incremental customer revenues attributable solely to EON Banking Group’s existing business banking customer.
Core deposits comprising savings and current accounts are low cost source of funds. The valuation of core deposits was derived using an income approach, specifically the cost savings method under the incremental cash flow method. This was done by discounting forecast net interest savings from core deposits.
The discount rate used in discounting incremental cash flows was based on the risk associated with the identified intangible assets. The remaining amortisation period of customer relationships is 3 years (2017: 4 years).
NoTES To ThE fINANCIAL STATEmENTSfoR ThE fINANCIAL yEAR ENdEd 30 JuNE 2018

184ANNUALREPORT2018
HONG LEONG BANK BERHAD
18 goodwILL
The group The Bank 2018 2017 2018 2017 Rm’000 Rm’000 Rm’000 Rm’000
CostAs at 1 July/ 30 June 1,831,312 1,831,312 1,771,547 1,771,547
Allocation of goodwill to cash-generating units (“Cgus”)
Goodwill has been allocated to the following CGUs:
The group The Bank 2018 2017 2018 2017 Rm’000 Rm’000 Rm’000 Rm’000
Personal Financial Services 1,188,705 1,188,705 1,149,911 1,149,911Business & Corporate Banking 479,437 479,437 463,791 463,791Global Markets 163,170 163,170 157,845 157,845
1,831,312 1,831,312 1,771,547 1,771,547
Impairment test for goodwill
The recoverable amount of CGUs is determined based on higher of fair value less costs to sell and value-in-use calculations. Fair value is the price that would be received to sell an asset or paid to transfer a liability in an orderly transaction between market participants, less costs of disposal. This estimate is mainly determined, on 30 June 2018, on the basis of available market information such as the fair value of the underlying assets and liabilities which have been marked-to-market.
Value-in-use is the present value of the future cash flows expected to be derived from the CGUs or groups of CGUs. The recoverable amount of CGUs is determined based on value-in-use calculation. This calculation uses pre-tax cash flow projections based on the budget for the financial year ending 2019, which is approved by the Board of Directors with a further projection of 4 years (2017: 4 years). Cash flows beyond the 5 year period are extrapolated using an estimated growth rate of 4.7% (2017: 4.6%) representing the forecasted Gross Domestic Product growth rate of the country for all cash generating units.
The cash flow projections are derived based on a number of key factors including past performance and management’s expectation of market developments.
The discount rates used are pre-tax and reflect specific risks relating to the CGUs.
The discount rates used in determining the recoverable amount are as follows:
discount rate 2018 2017 % %
Personal Financial Services 10.04 10.79Business & Corporate Banking 10.08 10.79Global Markets 10.11 10.82
Based on the impairment test performed, impairment was not required for goodwill arising from all CGUs for the financial year ended 30 June 2018. Management believes that any reasonable possible change to the key assumptions applied would not cause the carrying value of any CGU to exceed its recoverable amount.
NoTES To ThE fINANCIAL STATEmENTSfoR ThE fINANCIAL yEAR ENdEd 30 JuNE 2018

185ANNUALREPORT
2018
FINANCIALS
19 dEfERREd TAxATIoN
Deferred tax assets and liabilities are offset when there is a legally enforceable right to set off current tax assets against current tax liabilities and when the deferred taxes relate to the same authority. The following amounts determined after appropriate set off, are shown in the statements of financial position:
The group The Bank 2018 2017 2018 2017 Rm’000 Rm’000 Rm’000 Rm’000
Deferred tax assets 53,067 4,851 47,908 –Deferred tax liabilities – (172,194) – (171,131)
53,067 (167,343) 47,908 (171,131)
The analysis of deferred tax assets and deferred tax liabilities after appropriate set off is as follows:
The group The Bank 2018 2017 2018 2017 Rm’000 Rm’000 Rm’000 Rm’000
Deferred tax assets- To be recovered within 12 months 85,532 – 83,283 –- To be recovered after more than 12 months (32,465) 4,851 (35,375) –
53,067 4,851 47,908 –Deferred tax liabilities- To be recovered within 12 months – 70,121 – 68,198- To be recovered after more than 12 months – (242,315) – (239,329)
– (172,194) – (171,131)
53,067 (167,343) 47,908 (171,131)
The movements in deferred tax assets and liabilities during the financial year are as follows:
financial Property instruments Cash flow Provisions and available- hedge Intangible Senior and equipment for-sale reserve assets bonds advances Total The group Note Rm’000 Rm’000 Rm’000 Rm’000 Rm’000 Rm’000 Rm’000
deferred tax assets/ (liabilities)
2018At 1 July (94,213) (142,097) 337 (16,079) – 84,709 (167,343)Credited to statements
of income 38 14,566 14,642 – 7,414 – 14,027 50,649Credited/(Charged)
to equity 40 – 170,532 (498) – – – 170,034Exchange difference – – – – – (273) (273)
At 30 June (79,647) 43,077 (161) (8,665) – 98,463 53,067
2017At 1 July (104,875) (116,251) 543 (24,363) 69,732 59,070 (116,144)Credited/(Charged) to
statements of income 38 10,662 (13,467) – 8,284 (69,732) 25,354 (38,899)Charged to equity 40 – (12,379) (206) – – – (12,585)Exchange difference – – – – – 285 285
At 30 June (94,213) (142,097) 337 (16,079) – 84,709 (167,343)
NoTES To ThE fINANCIAL STATEmENTSfoR ThE fINANCIAL yEAR ENdEd 30 JuNE 2018
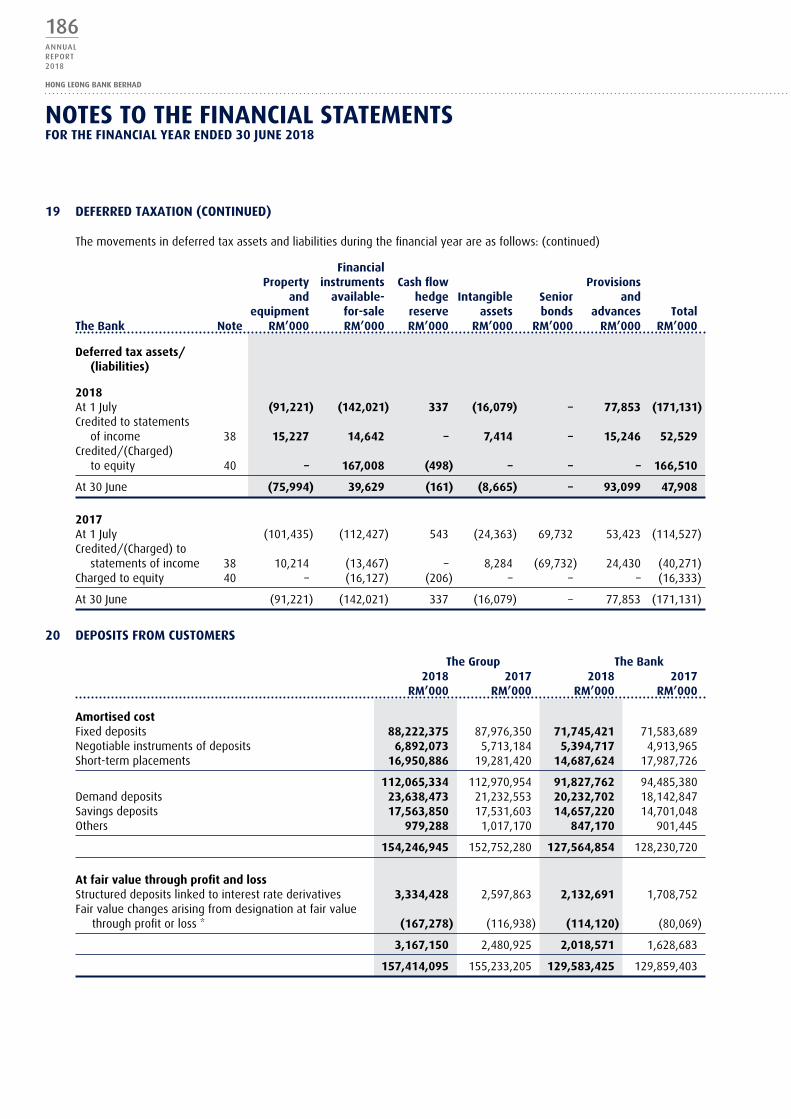
186ANNUALREPORT2018
HONG LEONG BANK BERHAD
19 dEfERREd TAxATIoN (CoNTINuEd)
The movements in deferred tax assets and liabilities during the financial year are as follows: (continued)
financial Property instruments Cash flow Provisions and available- hedge Intangible Senior and equipment for-sale reserve assets bonds advances Total The Bank Note Rm’000 Rm’000 Rm’000 Rm’000 Rm’000 Rm’000 Rm’000
deferred tax assets/ (liabilities)
2018At 1 July (91,221) (142,021) 337 (16,079) – 77,853 (171,131)Credited to statements
of income 38 15,227 14,642 – 7,414 – 15,246 52,529Credited/(Charged)
to equity 40 – 167,008 (498) – – – 166,510
At 30 June (75,994) 39,629 (161) (8,665) – 93,099 47,908
2017At 1 July (101,435) (112,427) 543 (24,363) 69,732 53,423 (114,527)Credited/(Charged) to
statements of income 38 10,214 (13,467) – 8,284 (69,732) 24,430 (40,271)Charged to equity 40 – (16,127) (206) – – – (16,333)
At 30 June (91,221) (142,021) 337 (16,079) – 77,853 (171,131)
20 dEPoSITS fRom CuSTomERS
The group The Bank 2018 2017 2018 2017 Rm’000 Rm’000 Rm’000 Rm’000
Amortised costFixed deposits 88,222,375 87,976,350 71,745,421 71,583,689Negotiable instruments of deposits 6,892,073 5,713,184 5,394,717 4,913,965Short-term placements 16,950,886 19,281,420 14,687,624 17,987,726
112,065,334 112,970,954 91,827,762 94,485,380Demand deposits 23,638,473 21,232,553 20,232,702 18,142,847Savings deposits 17,563,850 17,531,603 14,657,220 14,701,048Others 979,288 1,017,170 847,170 901,445
154,246,945 152,752,280 127,564,854 128,230,720
At fair value through profit and lossStructured deposits linked to interest rate derivatives 3,334,428 2,597,863 2,132,691 1,708,752Fair value changes arising from designation at fair value through profit or loss * (167,278) (116,938) (114,120) (80,069)
3,167,150 2,480,925 2,018,571 1,628,683
157,414,095 155,233,205 129,583,425 129,859,403
NoTES To ThE fINANCIAL STATEmENTSfoR ThE fINANCIAL yEAR ENdEd 30 JuNE 2018

187ANNUALREPORT
2018
FINANCIALS
20 dEPoSITS fRom CuSTomERS (CoNTINuEd)
* The Group and the Bank have issued structured deposits which are linked to interest rate derivatives and designated them at fair value through profit or loss. This designation is permitted under MFRS 139 “Financial Instruments: Recognition and Measurement” as it significantly reduces accounting mismatch. These instruments are managed by the Group on the basis of fair value and includes terms that have substantive derivative characteristics.
The fair value changes of the structured deposits which are linked to interest rate derivatives that are attributable to the changes in own credit risk are not significant.
The carrying amount of the structured deposits of the Group is RM150,847,000 (2017: RM106,355,000) and the Bank is RM104,426,000 (2017: RM73,597,000) lower than the contractual amount at maturity.
(i) The maturity structure of fixed deposits, negotiable instruments of deposits and short-term placements are as follows:
The group The Bank 2018 2017 2018 2017 Rm’000 Rm’000 Rm’000 Rm’000
Due within:- six months 83,581,278 93,770,712 67,728,986 78,802,850- six months to one year 26,159,087 17,376,145 21,998,104 13,904,358- one year to five years 2,324,969 1,824,097 2,100,672 1,778,172
112,065,334 112,970,954 91,827,762 94,485,380
(ii) The deposits are sourced from the following customers:
The group The Bank 2018 2017 2018 2017 Rm’000 Rm’000 Rm’000 Rm’000
Government and statutory bodies 3,977,104 2,939,005 2,016,899 1,872,815Business enterprises 62,744,665 63,339,512 48,300,831 49,509,606Individuals 88,159,470 86,175,897 77,108,346 76,006,815Others 2,532,856 2,778,791 2,157,349 2,470,167
157,414,095 155,233,205 129,583,425 129,859,403
21 dEPoSITS ANd PLACEmENTS of BANkS ANd oThER fINANCIAL INSTITuTIoNS
The group The Bank 2018 2017 2018 2017 Rm’000 Rm’000 Rm’000 Rm’000
Licensed banks 7,084,745 5,484,605 7,095,827 5,460,076Licensed investment banks 150,027 – 150,027 –Other financial institutions 2,662 2,087 – –
7,237,434 5,486,692 7,245,854 5,460,076
NoTES To ThE fINANCIAL STATEmENTSfoR ThE fINANCIAL yEAR ENdEd 30 JuNE 2018

188ANNUALREPORT2018
HONG LEONG BANK BERHAD
22 oThER LIABILITIES
The group The Bank 2018 2017 2018 2017 Rm’000 Rm’000 Rm’000 Rm’000
Zakat 350 350 – –Post employment benefits obligation- defined contribution plan 297 294 297 294Loan advance payment 3,229,766 2,987,067 2,586,339 2,415,873Amount due to subsidiary companies – – – 57,820Treasury and cheque clearing 50,106 129,556 50,106 129,556Treasury related payables 231,223 235,295 231,223 235,295Sundry creditors and accruals 531,979 310,745 494,991 283,492Provision for bonus and staff related expenses 176,617 157,091 168,984 150,118Others 499,108 232,269 400,229 203,241
4,719,446 4,052,667 3,932,169 3,475,689
23 RECouRSE oBLIgATIoN oN LoANS SoLd To CAgAmAS BERhAd
This represents the proceeds received from housing loans sold directly to Cagamas Berhad with recourse to the Group and the Bank. Under this agreement, the Group and the Bank undertake to administer the loans on behalf of Cagamas Berhad and to buy-back any loans which are regarded as defective based on prudential criteria set by Cagamas Berhad. Such financing transactions and the obligation to buy back the loans are reflected as a liability on the statements of financial position. These financial liabilities are stated at amortised cost.
24 TIER 2 SuBoRdINATEd BoNdS
The group The Bank 2018 2017 2018 2017 Note Rm’000 Rm’000 Rm’000 Rm’000
RM1.5 billion Tier 2 subordinated debt, at par (a) 1,500,000 1,500,000 1,500,000 1,500,000Add: Interest payable 1,664 1,664 1,664 1,664
1,501,664 1,501,664 1,501,664 1,501,664Less: Unamortised discounts (91) (277) (91) (277)
1,501,573 1,501,387 1,501,573 1,501,387
RM400 million Tier 2 subordinated Sukuk Ijarah, at par (b) 400,000 400,000 – –Add: Profit payable 684 631 – –
400,684 400,631 – –Less: Unamortised discounts (54) (128) – –
400,630 400,503 – –
RM1.0 billion Tier 2 subordinated notes, at par (c) 1,000,000 500,000 1,000,000 500,000Add: Interest payable 794 526 794 526
1,000,794 500,526 1,000,794 500,526Less: Unamortised discounts (89) (271) (89) (271)
1,000,705 500,255 1,000,705 500,255
2,902,908 2,402,145 2,502,278 2,001,642
NoTES To ThE fINANCIAL STATEmENTSfoR ThE fINANCIAL yEAR ENdEd 30 JuNE 2018

189ANNUALREPORT
2018
FINANCIALS
24 TIER 2 SuBoRdINATEd BoNdS (CoNTINuEd)
(a) On 22 June 2012, the Bank had completed the issuance of RM1.5 billion nominal value of Tier 2 Subordinated Notes (“Sub Notes”). The RM1.5 billion Sub Notes will mature in 2024 and are callable on any interest payment date falling on or after the 7th anniversary of the issue date subject to approval of BNM. The Sub Notes which bears interest of 4.50% per annum is payable semi-annually in arrears.
The Sub Notes constitute unsecured liabilities of the Bank, and is subordinated in right of payment to the deposit liabilities and all other liabilities of the Bank in accordance with the terms and conditions of the issue and qualify as Tier 2 capital for the purpose of determining the capital adequacy ratio of the Group and the Bank.
(b) On 17 June 2014, Hong Leong Islamic Bank Berhad (“HLISB”), a wholly owned subsidiary of the Bank, had completed the first issuance of RM400.0 million nominal value of Tier 2 Subordinated Sukuk Ijarah (“Subordinated Sukuk Ijarah”) out of its RM1.0 billion Tier 2 Subordinated Sukuk Ijarah Programme. The RM400.0 million Subordinated Sukuk Ijarah will mature in 2024 and is callable at end of year 5 and on each subsequent coupon payment date thereafter subject to approval of BNM. The Subordinated Sukuk Ijarah which bears profit rate of 4.80% per annum is payable semi-annually in arrears.
The Subordinated Sukuk Ijarah constitute direct, unconditional, subordinated and unsecured obligations of HLISB and subordinated in right and priority of payment, to the extend and in the manner provided in the Subordinated Sukuk Ijarah, ranking pari passu among themselves. The Subordinated Sukuk Ijarah is subordinated in right of payment to all deposit liabilities and other liabilities of HLISB, except to those liabilities, which by their terms, rank equally in right of payment with or are subordinated to the Subordinated Sukuk Ijarah. The Subordinated Sukuk Ijarah qualifies as Tier 2 capital for the purpose of determining the capital adequacy ratio of HLISB.
(c) On 23 June 2014, HLB had completed the first issuance of RM500.0 million nominal value of Tier 2 Subordinated Notes (“Sub Notes”) out of its RM10.0 billion Multi-Currency Sub Notes Programme. The RM500.0 million Sub Notes will mature in 2024 and is callable on any coupon payment date falling on or after the 5th anniversary of the issue date. The Sub Notes which bears interest rate of 4.80% per annum is payable semi-annually in arrears. The exercise of the call option on the Sub Notes shall be subject to the approval of BNM.
The Sub Notes constitute unsecured liabilities of the Bank, and is subordinated in right of payment to the deposit liabilities and all other liabilities of the Bank in accordance with the terms and conditions of the issue, except to those liabilities, which by their terms, rank equally in right of payment with or are subordinated to the Sub Notes. The Sub Notes may be written off, either fully or partially, at the discretion of BNM at the point of non-viability as determined by BNM or Perbadanan Insurans Deposit Malaysia. The Sub Notes qualify as Tier 2 capital for the purpose of determining the capital adequacy ratio of the Group and the Bank.
Subsequently, on 25 June 2018, the Bank issued a second tranche of RM500.0 million nominal value of 10-year non-callable 5 years Sub Notes callable on 26 June 2023 (and thereafter) and due on 23 June 2028 out of its RM10.0 billion Multi-Currency Sub Notes Programme. The coupon rate for this second tranche of the Sub Notes is 4.86% per annum, which is payable semi-annually in arrears from the date of the issue.
25 muLTI-CuRRENCy AddITIoNAL TIER 1 CAPITAL SECuRITIES
The group and The Bank 2018 2017 Rm’000 Rm’000
RM400 million Multi-currency Additional Tier-1 capital securities at par 400,000 –Add: Interest payable 1,799 –
401,799 –Less: Unamortised discounts (607) –
401,192 –
NoTES To ThE fINANCIAL STATEmENTSfoR ThE fINANCIAL yEAR ENdEd 30 JuNE 2018
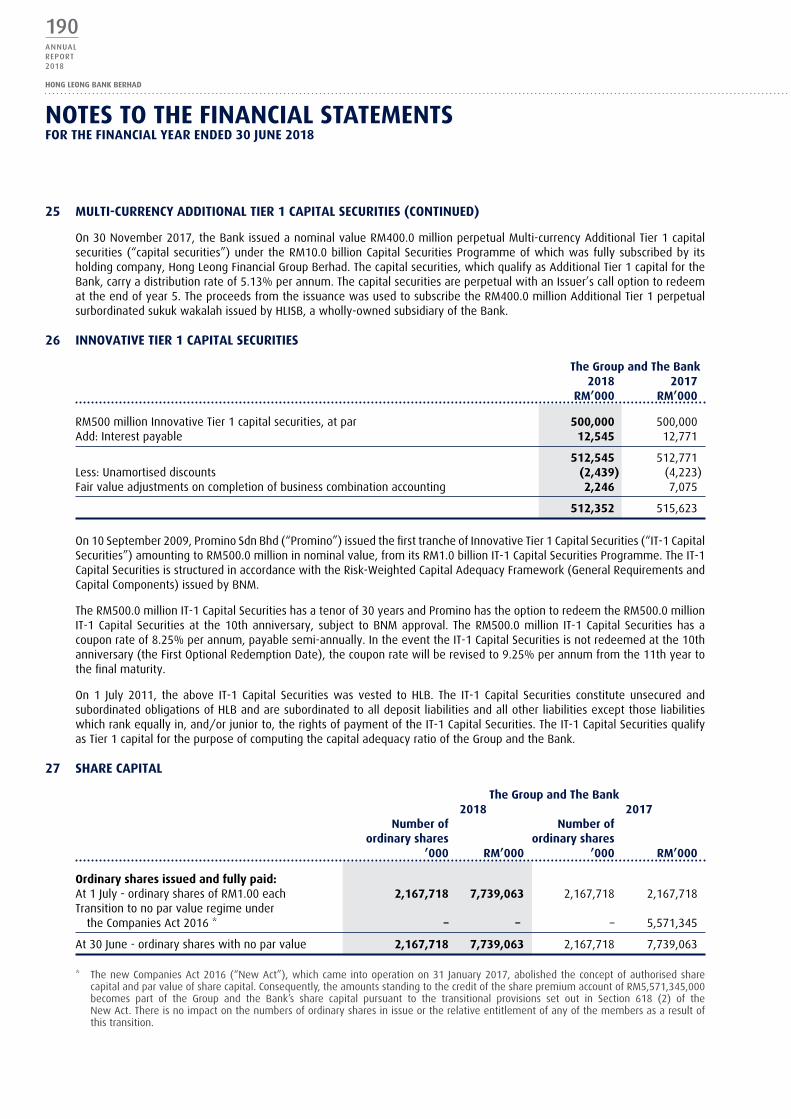
190ANNUALREPORT2018
HONG LEONG BANK BERHAD
25 muLTI-CuRRENCy AddITIoNAL TIER 1 CAPITAL SECuRITIES (CoNTINuEd)
On 30 November 2017, the Bank issued a nominal value RM400.0 million perpetual Multi-currency Additional Tier 1 capital securities (“capital securities”) under the RM10.0 billion Capital Securities Programme of which was fully subscribed by its holding company, Hong Leong Financial Group Berhad. The capital securities, which qualify as Additional Tier 1 capital for the Bank, carry a distribution rate of 5.13% per annum. The capital securities are perpetual with an Issuer’s call option to redeem at the end of year 5. The proceeds from the issuance was used to subscribe the RM400.0 million Additional Tier 1 perpetual surbordinated sukuk wakalah issued by HLISB, a wholly-owned subsidiary of the Bank.
26 INNoVATIVE TIER 1 CAPITAL SECuRITIES
The group and The Bank 2018 2017 Rm’000 Rm’000
RM500 million Innovative Tier 1 capital securities, at par 500,000 500,000Add: Interest payable 12,545 12,771
512,545 512,771Less: Unamortised discounts (2,439) (4,223)Fair value adjustments on completion of business combination accounting 2,246 7,075
512,352 515,623
On 10 September 2009, Promino Sdn Bhd (“Promino”) issued the first tranche of Innovative Tier 1 Capital Securities (“IT-1 Capital Securities”) amounting to RM500.0 million in nominal value, from its RM1.0 billion IT-1 Capital Securities Programme. The IT-1 Capital Securities is structured in accordance with the Risk-Weighted Capital Adequacy Framework (General Requirements and Capital Components) issued by BNM.
The RM500.0 million IT-1 Capital Securities has a tenor of 30 years and Promino has the option to redeem the RM500.0 million IT-1 Capital Securities at the 10th anniversary, subject to BNM approval. The RM500.0 million IT-1 Capital Securities has a coupon rate of 8.25% per annum, payable semi-annually. In the event the IT-1 Capital Securities is not redeemed at the 10th anniversary (the First Optional Redemption Date), the coupon rate will be revised to 9.25% per annum from the 11th year to the final maturity.
On 1 July 2011, the above IT-1 Capital Securities was vested to HLB. The IT-1 Capital Securities constitute unsecured and subordinated obligations of HLB and are subordinated to all deposit liabilities and all other liabilities except those liabilities which rank equally in, and/or junior to, the rights of payment of the IT-1 Capital Securities. The IT-1 Capital Securities qualify as Tier 1 capital for the purpose of computing the capital adequacy ratio of the Group and the Bank.
27 ShARE CAPITAL
The group and The Bank 2018 2017
Number of Number of ordinary shares ordinary shares ’000 Rm’000 ’000 Rm’000
ordinary shares issued and fully paid:At 1 July - ordinary shares of RM1.00 each 2,167,718 7,739,063 2,167,718 2,167,718Transition to no par value regime under
the Companies Act 2016 * – – – 5,571,345
At 30 June - ordinary shares with no par value 2,167,718 7,739,063 2,167,718 7,739,063
* The new Companies Act 2016 (“New Act”), which came into operation on 31 January 2017, abolished the concept of authorised share capital and par value of share capital. Consequently, the amounts standing to the credit of the share premium account of RM5,571,345,000 becomes part of the Group and the Bank’s share capital pursuant to the transitional provisions set out in Section 618 (2) of the New Act. There is no impact on the numbers of ordinary shares in issue or the relative entitlement of any of the members as a result of this transition.
NoTES To ThE fINANCIAL STATEmENTSfoR ThE fINANCIAL yEAR ENdEd 30 JuNE 2018

191ANNUALREPORT
2018
FINANCIALS
28 RESERVES
The group The Bank 2018 2017 2018 2017 Note Rm’000 Rm’000 Rm’000 Rm’000
Retained profits (a) 15,184,533 13,560,582 11,212,525 10,245,205
Share options reserve (b) 26,707 18,543 26,707 18,543Fair value reserve (c) 164,127 342,429 194,544 360,928Exchange fluctuation reserve (d) 756,325 1,081,342 184,585 241,993Regulatory reserves (e) 752,939 678,483 637,098 571,678Cash flow hedge reserve (f) 832 (1,068) 832 (1,068)
1,700,930 2,119,729 1,043,766 1,192,074
16,885,463 15,680,311 12,256,291 11,437,279
(a) The Bank can distribute dividends out of its entire retained earnings under the single-tier system.
(b) The share options reserve arose from share options and ordinary shares granted to eligible executives of the Bank pursuant to the Bank’s ESS. Terms of the Bank’s ESS are disclosed in Note 53 to the financial statements.
(c) Movement of the fair value reserve is as follows:
The group The Bank 2018 2017 2018 2017 Note Rm’000 Rm’000 Rm’000 Rm’000
At 1 July 342,429 318,319 360,928 310,050
Net (loss)/gain from change in fair value (198,264) 96,877 (183,810) 112,429Reclassification to net profit on disposal and impairment (149,748) (45,887) (149,582) (45,424)Deferred taxation 40 170,532 (12,379) 167,008 (16,127)Share of fair value reserve of associated company (822) (14,501) – –
Net change in fair value reserve (178,302) 24,110 (166,384) 50,878
At 30 June 164,127 342,429 194,544 360,928
(d) Currency translation differences arising from translation of the Bank’s foreign branches, subsidiaries, associated companies and joint venture are recognised in exchange fluctuation reserve.
(e) The Bank and its wholly owned subsidiary, Hong Leong Islamic Bank Berhad are required to maintain in aggregate collective impairment allowances of no less than 1.2% of the total outstanding loans, advances and financing, net of individual impairment allowances, in accordance with BNM circular dated 6 April 2015 titled ‘Classification and Impairment Provisions for Loans/Financing’.
During the financial year, an additional amount of RM74.5 million (2017: RM79.7 million) at Group and RM65.4 million (2017: RM76.7 million) at Bank have been transferred from retained profits to regulatory reserves.
Included in the Group is the regulatory reserve maintained by the Group’s banking subsidiary company in Vietnam of RM11.2 million (2017: RM11.2 million) in line with the requirements of the State Bank of Vietnam.
(f) Cash flow hedge reserve arises from cash flow hedge activities undertaken by the Bank to hedge the changes in the cash flow of customer deposits arising from the movement of market interest rates. The reserve is non-distributable and is reversed to the statements of income upon maturity or termination of the cash flow hedge.
NoTES To ThE fINANCIAL STATEmENTSfoR ThE fINANCIAL yEAR ENdEd 30 JuNE 2018

192ANNUALREPORT2018
HONG LEONG BANK BERHAD
29 TREASuRy ShARES
The group The Bank 2018 2017 2018 2017 Note Rm’000 Rm’000 Rm’000 Rm’000
Purchase of own shares pursuant to Section 127, Companies Act 2016 (a) 431,829 431,829 431,829 431,829Treasury shares for ESS (b) 300,438 302,132 300,438 302,132
732,267 733,961 732,267 733,961
(a) Purchase of own shares pursuant to Section 127 of the Companies Act 2016
The shareholders of the Bank, via an ordinary resolution passed at the Annual General Meeting held on 23 October 2013, had approved the Bank’s plan to purchase its own shares up to 10% of the issued and paid-up share capital. The Directors of the Bank are committed to enhance the value of the Bank to its shareholders and believe that the share buyback plan can be applied in the best interests of the Bank and its shareholders.
As at 30 June 2018, the total number of shares bought was 81,101,700 (2017: 81,101,700) and the shares held were accounted as treasury shares in accordance with the provisions of Section 127 of the Companies Act 2016.
There was no resale or cancellation of treasury shares during the financial year. The number of issued shares with voting rights as at 30 June 2018 after deducting treasury shares purchased is 2,086,616,584 shares (2017: 2,086,616,584). Treasury shares have no rights to vote nor participation in dividends or other distribution.
(b) Treasury shares for ESS
In 2006, the Bank entered into a Trust for ESOS purposes established via the signing of a Trust Deed on 23 January 2006 with an appointed Trustee in conjunction with the establishment of an Executive Share Option Scheme (“ESOS”). The trustee will be entitled from time to time to accept financial assistance from the Bank upon such terms and conditions as the Bank and the trustee may agree to purchase the Bank’s shares from the open market for the purposes of this trust.
MFRS 132 ‘Financial Instruments: Presentation’ requires that if an entity reacquires its own equity instruments, those instruments shall be deducted from equity and are not recognised as a financial asset regardless of the reason for which they are reacquired.
In accordance with MFRS 132, the shares purchased for the benefit of the ESS holders are recorded as “Treasury Shares for ESS” in the equity on the statements of financial position.
During the financial year ended 30 June 2018, a total of 229,992 ordinary shares were vested and transferred pursuant to the Bank’s ESS. As at 30 June 2018, the total number of shares held was 40,786,550 (2017: 41,016,542).
NoTES To ThE fINANCIAL STATEmENTSfoR ThE fINANCIAL yEAR ENdEd 30 JuNE 2018

193ANNUALREPORT
2018
FINANCIALS
30 INTEREST INComE
The group The Bank 2018 2017 2018 2017 Rm’000 Rm’000 Rm’000 Rm’000
Loans, advances and financing 4,642,090 4,621,500 4,562,593 4,546,702Money at call and deposit placements with financial institutions 209,538 129,127 209,566 116,701Securities purchased under resale agreements 3,513 35,504 3,513 35,504Financial assets held-for-trading 382,004 382,427 382,086 386,508Financial investments available-for-sale 742,369 638,942 738,767 634,351Financial investments held-to-maturity 375,142 354,968 370,398 352,683Others 2,903 666 2,404 440
6,357,559 6,163,134 6,269,327 6,072,889
Of which:Accretion of discount less amortisation of premium 228,294 183,932 228,294 183,932Interest income earned on impaired loans, advances and financing 52,766 53,446 52,766 53,446
31 INTEREST ExPENSE
The group The Bank 2018 2017 2018 2017 Rm’000 Rm’000 Rm’000 Rm’000
Deposits and placements of banks and other financial institutions 165,480 89,709 175,551 92,010Deposits from other customers 2,803,439 2,724,809 2,757,875 2,689,718Short-term placements 344,662 322,177 344,662 322,177Senior bonds – 33,764 – 33,764Tier 2 subordinated bonds 92,268 92,117 92,268 92,117Multi-currency Additional Tier-1 capital securities 12,783 – 12,051 –Innovative Tier 1 capital securities 38,205 35,362 38,205 35,362Recourse obligation on loans sold to Cagamas 7,602 6,727 7,602 6,727Borrowings – 3,859 – –Others – 203 – –
3,464,439 3,308,727 3,428,214 3,271,875
32 INComE fRom ISLAmIC BANkINg BuSINESS
The group 2018 2017 Rm’000 Rm’000
Income derived from investment of depositors’ funds and others 1,279,994 1,108,101Income derived from investment of shareholders’ funds 137,744 128,043Income attributable to depositors (771,674) (686,045)
646,064 550,099
Of which:Financing income earned on impaired financing and advances 11,941 7,574
NoTES To ThE fINANCIAL STATEmENTSfoR ThE fINANCIAL yEAR ENdEd 30 JuNE 2018

194ANNUALREPORT2018
HONG LEONG BANK BERHAD
33 NoN-INTEREST INComE
The group The Bank 2018 2017 2018 2017 Rm’000 Rm’000 Rm’000 Rm’000
fee income
Commissions 172,773 161,653 168,814 159,508Service charges and fees 62,674 62,661 62,032 62,002Guarantee fees 14,213 13,663 14,117 13,597Credit card related fees 218,225 236,211 218,225 236,211Corporate advisory fees 481 2,114 481 2,114Commitment fees 33,086 34,916 32,407 34,479Fee on loans, advances and financing 39,136 50,541 35,340 46,071Other fee income 33,133 47,428 32,380 47,162
573,721 609,187 563,796 601,144Net income from securities
Net realised gain from sale/redemption of securities portfolio:- Financial assets held-for-trading 10,902 7,321 10,902 7,321- Derivative financial instruments 28,185 31,620 28,185 31,620- Financial investments available-for-sale 197,037 60,377 196,818 59,768- Financial investments held-to-maturity 7 37 7 37Dividend income from:- Subsidiary companies – – 43,400 –- Associated company – – 138,560 249,342- Joint venture – – 4,882 4,698- Financial investments available-for-sale 281,087 259,157 281,087 259,157Net unrealised gain/(loss) on revaluation of:- Financial assets held-for-trading (2,457) (2,039) (2,457) (2,039)- Derivative financial instruments 109,026 70,574 109,026 70,574Net realised loss on fair value changes arising from fair value hedges and amortisation of fair value changes arising from terminated fair value hedges (800) (115) (800) (115)Net loss on fair value changes arising from fair value hedges (152) (3) (152) (3)
622,835 426,929 809,458 680,360other income
Foreign exchange gain 104,749 91,170 103,180 89,779Rental income 7,770 4,267 5,597 4,267Gain on disposal of property and equipment 2,492 1,178 2,492 1,178Net loss on dilution of investment in associated company (26,800) – – –Other non-operating income 15,614 13,412 15,062 13,554
103,825 110,027 126,331 108,778
1,300,381 1,146,143 1,499,585 1,390,282
NoTES To ThE fINANCIAL STATEmENTSfoR ThE fINANCIAL yEAR ENdEd 30 JuNE 2018

195ANNUALREPORT
2018
FINANCIALS
34 oVERhEAd ExPENSES
The group The Bank 2018 2017 2018 2017 Rm’000 Rm’000 Rm’000 Rm’000
Personnel costs 1,106,354 1,112,178 919,275 923,658Establishment costs 533,573 483,914 484,058 418,337Marketing expenses 160,641 155,598 154,897 150,020Administration and general expenses 259,881 255,833 239,018 243,987
2,060,449 2,007,523 1,797,248 1,736,002
The overhead expenses of the Bank are net of shared services costs charged to subsidiaries.
(i) Personnel costs comprise the following:
The group The Bank 2018 2017 2018 2017 Rm’000 Rm’000 Rm’000 Rm’000
Salaries, bonus and allowances 1,008,943 1,006,908 838,865 835,520Medical expenses 35,791 34,660 31,108 29,061Training and convention expenses 26,317 29,407 21,569 26,064Staff welfare 9,253 11,086 7,973 9,510Other employees benefits 26,050 30,117 19,760 23,503
1,106,354 1,112,178 919,275 923,658
(ii) Establishment costs comprise the following:
The group The Bank 2018 2017 2018 2017 Rm’000 Rm’000 Rm’000 Rm’000
Depreciation of property and equipment 120,812 91,477 102,085 84,925Amortisation of intangible assets 71,841 74,469 67,719 70,504Rental of premises 73,071 82,255 87,041 66,719Information technology expenses 164,271 147,713 153,584 133,385Security services 28,896 28,451 22,677 22,988Electricity, water and sewerage 26,447 24,154 20,812 20,783Hire of plant and machinery 12,661 14,529 12,026 13,661Others 35,574 20,866 18,114 5,372
533,573 483,914 484,058 418,337
(iii) Marketing expenses comprise the following:
The group The Bank 2018 2017 2018 2017 Rm’000 Rm’000 Rm’000 Rm’000
Advertisement and publicity 36,888 31,029 33,796 28,026Credit card related fees 107,491 108,998 107,491 108,998Others 16,262 15,571 13,610 12,996
160,641 155,598 154,897 150,020
NoTES To ThE fINANCIAL STATEmENTSfoR ThE fINANCIAL yEAR ENdEd 30 JuNE 2018

196ANNUALREPORT2018
HONG LEONG BANK BERHAD
34 oVERhEAd ExPENSES (CoNTINuEd)
(iv) Administration and general expenses comprise the following:
The group The Bank 2018 2017 2018 2017 Rm’000 Rm’000 Rm’000 Rm’000
Teletransmission expenses 16,225 17,123 15,826 16,769Stationery and printing expenses 14,860 16,454 13,965 15,829Professional fees 88,287 73,986 83,884 71,264Insurance fees 41,772 40,175 36,459 35,363Stamp, postage and courier 13,971 18,572 13,639 18,232Travelling and transport expenses 4,414 4,077 3,283 2,927Registration and license fees 9,125 9,117 8,154 8,111Brokerage and commission 7,946 6,681 3,793 3,569Credit card fees 39,854 39,331 39,854 39,331Others 23,427 30,317 20,161 32,592
259,881 255,833 239,018 243,987
The above expenditure includes the following statutory disclosures:
The group The Bank 2018 2017 2018 2017 Rm’000 Rm’000 Rm’000 Rm’000
Directors’ remuneration (Note 37) 16,695 13,160 13,209 9,080Hire of equipment 12,661 14,529 12,026 13,661Auditors’ remuneration*:Malaysian firm- statutory audit 1,820 1,727 1,579 1,489- regulatory related fees 877 805 601 519- tax compliance 70 60 42 37- other services 603 770 575 669PwC overseas affiliated firms- statutory audit 572 540 441 407- regulatory related fees 192 201 192 201- tax compliance 130 142 101 88Loss on disposal of property and equipment 218 130 209 128Property and equipment written off 4,879 823 4,568 528Intangible assets disposal/written off 29 57 16 23
* There was no indemnity given to or insurance effected for the Group and the Bank during the financial year.
35 ALLowANCE foR ImPAIRmENT LoSSES oN LoANS, AdVANCES ANd fINANCINg
The group The Bank 2018 2017 2018 2017 Rm’000 Rm’000 Rm’000 Rm’000
Allowance for/(write back of) impairment losses on loans, advances and financing:- collective assessment allowance 299,887 283,057 224,340 217,958- individual assessment allowance 7,892 116,236 (1,125) 107,888Impaired loans and financing:- written off 19,719 22,508 15,992 19,114- recovered from bad debt written off (250,847) (260,642) (206,558) (235,687)
76,651 161,159 32,649 109,273
NoTES To ThE fINANCIAL STATEmENTSfoR ThE fINANCIAL yEAR ENdEd 30 JuNE 2018

197ANNUALREPORT
2018
FINANCIALS
36 SIgNIfICANT RELATEd PARTy TRANSACTIoNS ANd BALANCES
(a) Related parties and relationships
The related parties of and their relationships with the Bank are as follows:
Related parties Relationship
Hong Leong Company (Malaysia) Berhad Ultimate holding company
Hong Leong Share Registration Services Sdn Bhd, HLCM Subsidiary companies of ultimate holding company Capital Sdn Bhd, Hong Leong Fund Management Sdn Bhd and HL Management Co Sdn Bhd
Hong Leong Financial Group Berhad Holding company
Subsidiary companies of Hong Leong Financial Group Subsidiary companies of holding company Berhad as disclosed in its financial statements
Hong Leong Industries Berhad and its subsidiary and Subsidiary and associated companies of ultimate associated companies as disclosed in its financial statements holding company
HLMG Management Co Sdn Bhd (formerly known as Subsidiary companies of ultimate holding company HLI-Hume Management Co Sdn Bhd) Hume Cement Sdn Bhd Hume Construction Sdn Bhd Hume Plastics (Malaysia) Sdn Berhad Hume Quarry (Sarawak) Sdn Bhd Hongvilla Development Sdn Bhd HIMB Overseas Limited HIMB Trading Limited and Delta Touch Limited
Guoco Group Limited and its subsidiary and associated Subsidiary and associated companies of ultimate companies as disclosed in its financial statements holding company
GuocoLand (Malaysia) Berhad and its subsidiary and Subsidiary and associated companies of ultimate associated companies as disclosed in its financial statements holding company
Southern Steel Berhad and its subsidiary and associated Subsidiary and associated companies of ultimate companies holding company
Subsidiary companies of the Bank as disclosed in Note 13 Subsidiary companies of the Bank
Joint venture of the Group as disclosed in Note 14 Joint venture of the Group
Associated companies of the Group as disclosed in Note 15 Associated companies of the Group
Key management personnel The key management personnel of the Bank consists of: - All Directors of the Bank and eight members of senior management of the Bank
Related parties of key management personnel (i) Close family members and dependents of key deemed as related to the Bank management personnel
(ii) Entities that are controlled, jointly controlled or significantly influenced by, or for which significant voting power in such entity resides with, directly or indirectly by key management personnel or its close family members
NoTES To ThE fINANCIAL STATEmENTSfoR ThE fINANCIAL yEAR ENdEd 30 JuNE 2018

198ANNUALREPORT2018
HONG LEONG BANK BERHAD
36 SIgNIfICANT RELATEd PARTy TRANSACTIoNS ANd BALANCES (CoNTINuEd)
(b) Related party transactions and balances
other key Parent related Associated management The group company companies company personnel 2018 Rm’000 Rm’000 Rm’000 Rm’000
IncomeInterest:- loans – 9,526 – 37- redeemable preference shares – 1,341 – –Commitment fee and bank charges – – – 51Dividend income – 261,472 – –Commission on Group products/services sold – 31,774 – –Brokerage commission – 931 – –Reimbursement of shared service cost 266 6,908 – –
266 311,952 – 88
Expenditure Rental and maintenance – 20,565 – –Insurance 57 12,527 – –Interest on current accounts and fixed deposits – 1,614 – 3,669Interest on short–term placements 584 17,440 – 1,601Interest on subordinated notes and capital securities – 33,255 – –Management fees 7,777 32,786 – –Other miscellaneous expenses 274 8,545 – –
8,692 126,732 – 5,270
Amounts due fromInterbank placements – – – –Current accounts – – 20,373 –Redeemable preference shares – 30,866 – –Loans – 158,920 – 1,076 Wholesale funds – 6,945,610 – –Derivative assets 327 532 – –Credit card balances – – – 421 Advance rental and deposit – 5,203 – –Others – 594 – –
327 7,141,725 20,373 1,497
Amounts due to Current accounts and fixed deposits – 76,436 – 119,945 Short–term placements – 1,688,239 – 56,505 Subordinated notes and capital securities – 698,806 – –Derivative liabilities – 27,638 – –Others – 24,430 – –
– 2,515,549 – 176,450
Commitment and contingenciesDerivative related contracts 100,000 635,482 – –
NoTES To ThE fINANCIAL STATEmENTSfoR ThE fINANCIAL yEAR ENdEd 30 JuNE 2018

199ANNUALREPORT
2018
FINANCIALS
36 SIgNIfICANT RELATEd PARTy TRANSACTIoNS ANd BALANCES (CoNTINuEd)
(b) Related party transactions and balances (continued)
other key Parent related Associated management The group company companies company personnel 2017 Rm’000 Rm’000 Rm’000 Rm’000
IncomeInterest: - loans – 9,443 – 39 - redeemable preference shares – 2,318 – –Commitment fee and bank charges – – – 41 Dividend income – 55,601 – –Commission on Group products/services sold – 28,315 – –Reimbursement of shared service cost 261 7,754 – –
261 103,431 – 80
ExpenditureRental and maintenance – 26,477 – –Insurance 57 1,333 – –Interest on current accounts and fixed deposits – 288 – 1,747 Interest on short-term placements – 17,918 – 2,256 Interest on subordinated notes and capital securities – 33,255 – –Management fees 4,816 28,473 – –Other miscellaneous expenses 85 39,249 – –
4,958 146,993 – 4,003
Amounts due from Interbank placements – – 4,913 –Current accounts – – 20,849 –Redeemable preference shares – 32,066 – –Loans – 201,182 – 966 Wholesale funds – 5,056,972 – –Derivative assets 874 925 – –Credit card balances – – – 198 Advance rental and deposit – 5,203 – –Others – 658 – –
874 5,297,006 25,762 1,164
Amounts due to Current accounts and fixed deposits 1 99,861 – 113,480 Short-term placements 6,601 1,763,472 – 36,821 Subordinated notes and capital securities – 698,361 – –Derivative liabilities – 11,671 – –Others – 5,862 – –
6,602 2,579,227 – 150,301
Commitment and contingencies Derivative related contracts 100,000 575,319 – –
NoTES To ThE fINANCIAL STATEmENTSfoR ThE fINANCIAL yEAR ENdEd 30 JuNE 2018

200ANNUALREPORT2018
HONG LEONG BANK BERHAD
36 SIgNIfICANT RELATEd PARTy TRANSACTIoNS ANd BALANCES (CoNTINuEd)
(b) Related party transactions and balances (continued) other key Parent Subsidiary Associated related management The Bank company companies company companies personnel 2018 Rm’000 Rm’000 Rm’000 Rm’000 Rm’000
IncomeInterest:- loans – 14,473 – 9,526 37 - interbank placements – 11,320 – – – - current accounts – – 1,277 – – - negotiable instruments of deposits – 82 – – – - redeemable preference shares – – – 1,341 – - subdebt – 65 – – – Dividend income – 43,400 138,560 266,354 – Commitment fee and bank charges – – – – 51 Commission on Group products/services sold – – – 31,774 – Brokerage commission – – – 931 – Reimbursement of shared service cost 266 143,416 – 6,908 –
266 212,756 139,837 316,834 88
Expenditure*Rental and maintenance – 29,405 – 20,225 – Insurance 57 – – 12,527 – Interest on current accounts and fixed deposits – 1,095 – 114 3,659 Interest on short-term placements 584 1,616 – 17,440 1,601 Interest on interbank placements – 2,067 – – – Interest on subordinated notes and capital securities – – – 32,271 – Management fees 7,777 26 – 32,786 – Other miscellaneous expenses 274 1,055 350 8,503 –
8,692 35,264 350 123,866 5,260
Amounts due fromInterbank placements – 959,027 – – – Current accounts – – 20,373 – – Redeemable preference shares – – – 30,866 – Loans – 358,226 – 158,920 818 Wholesale funds – – – 6,945,610 – Credit card balances – – – – 421 Derivative assets 327 60,863 – 532 – Advance rental and deposit – 8,414 – 5,203 – Others – 43,563 – 594 –
327 1,430,093 20,373 7,141,725 1,239
Amounts due toCurrent accounts and fixed deposits – 129,249 – 76,436 119,302 Short-term placements – – – 1,688,239 56,505 Subordinated notes and capital securities – – – 678,237 – Derivative liabilities – 1,890 – 27,638 –
– 131,139 – 2,470,550 175,807
Commitment and contingencies Derivative related contracts 100,000 2,979,856 – 635,482 –
* Pursuant to requirements as set out in Bank Negara Malaysia’s (“BNM”) circular dated 28 March 2018 on Standards on Intercompany Charges Paid/Payable to Foreign Shareholders/Related Entities, the intercompany payments by the Bank are primarily transacted with related parties domiciled in Malaysia.
NoTES To ThE fINANCIAL STATEmENTSfoR ThE fINANCIAL yEAR ENdEd 30 JuNE 2018
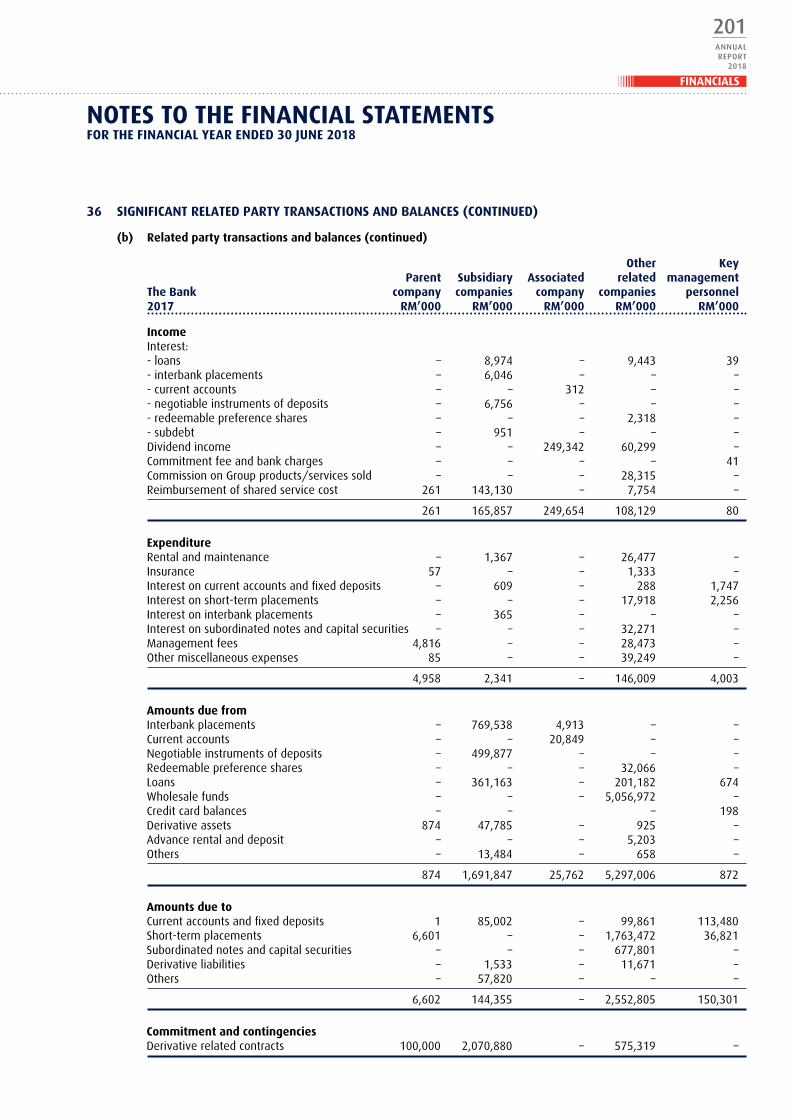
201ANNUALREPORT
2018
FINANCIALS
36 SIgNIfICANT RELATEd PARTy TRANSACTIoNS ANd BALANCES (CoNTINuEd)
(b) Related party transactions and balances (continued)
other key Parent Subsidiary Associated related management The Bank company companies company companies personnel 2017 Rm’000 Rm’000 Rm’000 Rm’000 Rm’000
IncomeInterest:- loans – 8,974 – 9,443 39 - interbank placements – 6,046 – – –- current accounts – – 312 – –- negotiable instruments of deposits – 6,756 – – –- redeemable preference shares – – – 2,318 –- subdebt – 951 – – –Dividend income – – 249,342 60,299 –Commitment fee and bank charges – – – – 41 Commission on Group products/services sold – – – 28,315 –Reimbursement of shared service cost 261 143,130 – 7,754 –
261 165,857 249,654 108,129 80
Expenditure Rental and maintenance – 1,367 – 26,477 –Insurance 57 – – 1,333 –Interest on current accounts and fixed deposits – 609 – 288 1,747 Interest on short-term placements – – – 17,918 2,256 Interest on interbank placements – 365 – – –Interest on subordinated notes and capital securities – – – 32,271 –Management fees 4,816 – – 28,473 –Other miscellaneous expenses 85 – – 39,249 –
4,958 2,341 – 146,009 4,003
Amounts due from Interbank placements – 769,538 4,913 – –Current accounts – – 20,849 – –Negotiable instruments of deposits – 499,877 – – –Redeemable preference shares – – – 32,066 –Loans – 361,163 – 201,182 674 Wholesale funds – – – 5,056,972 –Credit card balances – – – 198 Derivative assets 874 47,785 – 925 –Advance rental and deposit – – – 5,203 –Others – 13,484 – 658 –
874 1,691,847 25,762 5,297,006 872
Amounts due to Current accounts and fixed deposits 1 85,002 – 99,861 113,480 Short-term placements 6,601 – – 1,763,472 36,821 Subordinated notes and capital securities – – – 677,801 –Derivative liabilities – 1,533 – 11,671 –Others – 57,820 – – –
6,602 144,355 – 2,552,805 150,301
Commitment and contingencies Derivative related contracts 100,000 2,070,880 – 575,319 –
NoTES To ThE fINANCIAL STATEmENTSfoR ThE fINANCIAL yEAR ENdEd 30 JuNE 2018

202ANNUALREPORT2018
HONG LEONG BANK BERHAD
NoTES To ThE fINANCIAL STATEmENTSfoR ThE fINANCIAL yEAR ENdEd 30 JuNE 2018
36 SIgNIfICANT RELATEd PARTy TRANSACTIoNS ANd BALANCES (CoNTINuEd)
(b) Related party transactions and balances (continued)
The group 2018 2017 Rm’000 Rm’000
The approved limit on loans, advances and financing for key management personnel 6,160 5,579
(c) key management personnel
Key management compensation
The group The Bank 2018 2017 2018 2017 Rm’000 Rm’000 Rm’000 Rm’000
Salaries and other short-term employee benefits 21,328 18,513 21,328 18,513
Director fees 1,256 1,103 1,088 965
ESS expenses 13,077 8,386 13,077 8,386
Included in the above is the Directors’ remuneration which is disclosed in Note 37 to the financial statements. Loans made to key management personnel of the Group and the Bank will be on similar terms and conditions generally available to other employees within the Group. No impairment allowances were required in 2018 and 2017 for loans made to key management personnel.
(d) Credit transactions and exposures with connected parties
Credit exposures with connected parties as per BNM’s revised “Guidelines on Credit Transactions and Exposures with Connected Parties” which became effective on 1 January 2008 are as follows:
The group The Bank 2018 2017 2018 2017 Rm’000 Rm’000 Rm’000 Rm’000
Outstanding credit exposures with connected parties 2,340,089 1,826,420 2,317,297 1,655,767 Percentage of outstanding credit exposures to connected parties as a proportion of total credit exposures 1.61% 1.30% 1.96% 1.42%Percentage of outstanding credit exposures with connected parties which is non-performing or in default 0.0002% 0.0133% 0.0003% 0.0160%

203ANNUALREPORT
2018
fINANCIALS37
Ch
IEf
ExEC
uTI
VE o
ffIC
ER (
“CEo
”) A
Nd
dIR
ECTo
RS’
REm
uN
ERA
TIo
N
Fo
rms
of r
emun
erat
ion
in a
ggre
gate
for
CEO
and
all
Dire
ctor
s an
d fo
r th
e fin
anci
al y
ear
are
as f
ollo
ws:
Th
e g
roup
Th
e B
ank
Sa
lari
es,
Sala
ries
,
bon
uses
,
bo
nus
es,
al
low
ance
s
al
low
ance
s
and
defi
ned
Esti
mat
ed
an
d de
fin
ed
Es
tim
ated
con
trib
utio
n
m
oney
val
ue f
or
co
ntr
ibut
ion
mon
ey v
alue
for
reti
rem
ent
plan
d
irec
tor
fees
be
nefi
ts-i
n-k
ind
Tota
l re
tire
men
t pl
an
dir
ecto
r fe
es
ben
efits
-in
-kin
d To
tal
2018
R
m’0
00
Rm
’000
R
m’0
00
Rm
’000
R
m’0
00
Rm
’000
R
m’0
00
Rm
’000
CEO
Mr
Dom
enic
Fud
a 7,
641
–
4,38
3 12
,024
7,
641
–
4,38
3 12
,024
Exec
utiv
e D
irect
orM
r Ta
n Ko
ng K
hoon
–
– –
– –
– –
–
Non
-exe
cutiv
e D
irect
ors
YBhg
Tan
Sri
Que
k
Le
ng C
han
– –
– –
– –
– –
Mr
Kwek
Len
g H
ai
– –
– –
– –
– –
Ms
Lim
Lea
n Se
e 26
26
5 –
291
26
265
– 29
1M
s Ch
ok K
wee
Bee
18
19
5 –
213
1
8 19
5 –
213
YBhg
Dat
o’ N
icho
las
John
Lou
gh @
Sha
rif
Loug
h bi
n A
bdul
lah
29
285
– 31
4 29
28
5 –
314
YBhg
Dat
uk W
ira A
zhar
bin
Abd
ul H
amid
*
14
183
– 19
7 14
18
3 –
197
YBhg
Dat
uk D
r M
d
Ha
mza
h bi
n M
d Ka
ssim
25
32
8 –
353
10
160
– 17
0
11
2# 1,
256
– 1,
368
97#
1,08
8 –
1,18
5
Dire
ctor
s of
sub
sidi
arie
s 2,
661
58
0 62
3,
303
– –
– –
Tota
l CEO
and
Dire
ctor
s’
re
mun
erat
ion
10,4
14
1,83
6 4,
445
16
,695
7,
738
1,
088
4,38
3 13
,20
9
The
mov
emen
t an
d de
tails
of
the
Dire
ctor
s of
the
Gro
up a
nd t
he B
ank
in o
ffice
and
inte
rest
s in
sha
res
and
shar
e op
tions
are
rep
orte
d in
the
Dir
ecto
rs’ r
epor
t.
* Re
tired
on
14 M
ay 2
018.
# D
irect
ors’
mee
ting
allo
wan
ces.
Not
e: T
he D
irect
ors’
Rem
uner
atio
n in
the
cur
rent
fina
ncia
l yea
r re
pres
ents
rem
uner
atio
n fo
r D
irect
ors
of t
he G
roup
, th
e B
ank
and
its s
ubsi
diar
ies
to c
ompl
y w
ith t
he
requ
irem
ents
of
Com
pani
es A
ct 2
016.
The
nam
es o
f D
irect
ors
of s
ubsi
diar
ies
and
thei
r re
mun
erat
ion
deta
ils a
re s
et o
ut in
the
res
pect
ive
subs
idia
ries
’ sta
tuto
ry
acco
unts
and
the
sai
d in
form
atio
n is
dee
med
inco
rpor
ated
her
ein
by s
uch
refe
renc
e an
d m
ade
a pa
rt h
ereo
f.
Dur
ing
the
finan
cial
yea
r, D
irect
ors
and
Offi
cers
of
the
Gro
up a
nd t
he B
ank
are
cove
red
unde
r th
e D
irect
ors’
& O
ffice
rs’ L
iabi
lity
Insu
ranc
e in
res
pect
of
liabi
litie
s ar
isin
g fr
om a
cts
com
mitt
ed in
the
ir ca
paci
ty a
s, in
ter
alia
, Dire
ctor
s an
d O
ffice
rs o
f th
e G
roup
and
the
Ban
k su
bjec
t to
the
ter
ms
of t
he p
olic
y. T
he t
otal
am
ount
of
pre
miu
m p
aid
for
the
Dire
ctor
s’ &
Offi
cers
’ Lia
bilit
y In
sura
nce
by t
he G
roup
and
the
Ban
k w
as R
M54
,920
.
NoTES To ThE fINANCIAL STATEmENTSfoR ThE fINANCIAL yEAR ENdEd 30 JuNE 2018

204ANNUALREPORT2018
HONG LEONG BANK BERHAD
37
ChIE
f Ex
ECu
TIVE
off
ICER
(“C
Eo”)
AN
d d
IREC
ToR
S’ R
Emu
NER
ATI
oN
(Co
NTI
Nu
Ed)
Fo
rms
of r
emun
erat
ion
in a
ggre
gate
for
CEO
and
all
Dire
ctor
s an
d fo
r th
e fin
anci
al y
ear
are
as f
ollo
ws:
(co
ntin
ued)
Th
e g
roup
Th
e B
ank
Sa
lari
es a
nd
Sa
lari
es a
nd
bon
uses
bon
uses
an
d de
fin
ed
Es
tim
ated
and
defi
ned
Esti
mat
ed
co
ntr
ibut
ion
mon
ey v
alue
for
con
trib
utio
n
m
oney
val
ue f
or
re
tire
men
t pl
an
dir
ecto
r fe
es
ben
efits
-in
-kin
d To
tal
reti
rem
ent
plan
d
irec
tor
fees
be
nefi
ts-i
n-k
ind
Tota
l 20
17
Rm
’000
R
m’0
00
Rm
’000
R
m’0
00
Rm
’000
R
m’0
00
Rm
’000
R
m’0
00
CEO
and
Exe
cutiv
e D
irect
orM
r D
omen
ic F
uda
* 6,
110
– 2,
005
8,11
5 6,
110
– 2,
005
8,11
5M
r Ta
n Ko
ng K
hoon
–
– –
– –
– –
–
6,
110
– 2,
005
8,11
5 6,
110
– 2,
005
8,11
5
Non
-exe
cutiv
e D
irect
ors
YBhg
Tan
Sri
Que
k Le
ng C
han
– –
– –
– –
– –
Mr
Kwek
Len
g H
ai
– –
– –
– –
– –
Ms
Lim
Lea
n Se
e –
239
– 23
9 –
239
– 23
9M
s Ch
ok K
wee
Bee
–
165
– 16
5 –
165
– 16
5YB
hg D
ato’
Nic
hola
s Jo
hn L
ough
@
Shar
if Lo
ugh
bin
Abd
ulla
h –
255
– 25
5 –
255
– 25
5YB
hg D
atuk
Wira
Azh
ar b
in
A
bdul
Ham
id
– 18
0 –
180
– 18
0 –
180
YBhg
Dat
uk D
r M
d H
amza
h bi
n
M
d Ka
ssim
–
264
– 26
4 –
126
– 12
6M
r Q
uek
Kon
Sean
^
– –
– –
– –
– –
–
1,10
3 –
1,10
3 –
965
– 96
5
Dire
ctor
s of
sub
sidi
arie
s 3,
302
587
53
3,94
2 –
– –
–
Tota
l CEO
and
Dire
ctor
s’ r
emun
erat
ion
9,41
2 1,
690
2,05
8 13
,160
6,
110
965
2,00
5 9,
080
The
mov
emen
t an
d de
tails
of
the
Dire
ctor
s of
the
Gro
up a
nd t
he B
ank
in o
ffice
and
inte
rest
s in
sha
res
and
shar
e op
tions
are
rep
orte
d in
the
Dir
ecto
rs’ r
epor
t.
* Re
sign
ed a
s Bo
ard
mem
ber
with
eff
ect
from
1 Ja
nuar
y 20
17.
^
Resi
gned
with
eff
ect
from
9 Ju
ly 2
016.
Not
e: T
he D
irect
ors’
Rem
uner
atio
n in
the
cur
rent
fina
ncia
l yea
r re
pres
ents
rem
uner
atio
n fo
r D
irec
tors
of
the
Gro
up, t
he B
ank
and
its s
ubsi
diar
ies
to c
ompl
y w
ith t
he
requ
irem
ents
of
Com
pani
es A
ct 2
016.
The
nam
es o
f D
irect
ors
of s
ubsi
diar
ies
and
thei
r re
mun
erat
ion
deta
ils a
re s
et o
ut in
the
res
pect
ive
subs
idia
ries
’ sta
tuto
ry
acco
unts
and
the
sai
d in
form
atio
n is
dee
med
inco
rpor
ated
her
ein
by s
uch
refe
renc
e an
d m
ade
a pa
rt h
ereo
f.
Dur
ing
the
finan
cial
yea
r, D
irect
ors
and
Offi
cers
of
the
Gro
up a
nd t
he B
ank
are
cove
red
unde
r th
e D
irec
tors
’ & O
ffice
rs’ L
iabi
lity
Insu
ranc
e in
res
pect
of
liabi
litie
s ar
isin
g fr
om a
cts
com
mitt
ed in
the
ir ca
paci
ty a
s, in
ter
alia
, Dire
ctor
s an
d O
ffice
rs o
f th
e G
roup
and
the
Ban
k su
bjec
t to
the
ter
ms
of t
he p
olic
y. T
he t
otal
am
ount
of
pre
miu
m p
aid
for
the
Dire
ctor
s’ &
Offi
cers
’ Lia
bilit
y In
sura
nce
by t
he G
roup
and
the
Ban
k w
as R
M57
,162
.
NoTES To ThE fINANCIAL STATEmENTSfoR ThE fINANCIAL yEAR ENdEd 30 JuNE 2018

205ANNUALREPORT
2018
FINANCIALS
NoTES To ThE fINANCIAL STATEmENTSfoR ThE fINANCIAL yEAR ENdEd 30 JuNE 2018
38 TAxATIoN
The group The Bank 2018 2017 2018 2017 Note Rm’000 Rm’000 Rm’000 Rm’000
Current year income tax 655,010 499,689 594,634 496,219Deferred taxation 19 (50,649) 38,899 (52,529) 40,271Under accrual in prior years 3,816 64,648 3,416 66,586
Taxation 608,177 603,236 545,521 603,076
The effective tax rate for the Group and Bank differed from the statutory rate of taxation due to:
The group The Bank 2018 2017 2018 2017 Rm’000 Rm’000 Rm’000 Rm’000
Profit before taxation 3,246,255 2,748,252 2,517,932 2,347,127
Tax calculated at a rate of 24% 779,101 659,580 604,304 563,310Tax effects of:- Income not subject to tax (64,045) (72,283) (80,978) (62,928)- Share of net income of foreign associated
company and joint venture company (128,798) (87,375) – –- Expenses not deductible for tax purposes 18,103 38,666 18,779 36,108Under accrual in prior years* 3,816 64,648 3,416 66,586
Taxation 608,177 603,236 545,521 603,076
* Included in the under accrual in prior years is under accrual of tax of a subsidiary company absorbed by the Bank amounting to RM101,846,000 in 2017.
The group 2018 2017 Rm’000 Rm’000
Unused tax losses from a wholly owned subsidiary for which no deferred tax is recognised in the financial statements 29,046 29,083
39 EARNINgS PER ShARE
Basic earnings per share
Basic earnings per share from operations is calculated by dividing the net profit attributable to ordinary equity holders of the Bank after taxation by the weighted average number of ordinary shares in issue during the financial year, excluding the average number of ordinary shares purchased by the Bank and held as treasury shares.
The group The Bank 2018 2017 2018 2017 Rm’000 Rm’000 Rm’000 Rm’000
Net profit attributable to equity holders 2,638,078 2,145,016 1,972,411 1,744,051Weighted average number of
ordinary shares in issue (‘000) 2,045,677 2,045,503 2,045,677 2,045,503Basic earnings per share (sen) 129.0 104.9 96.4 85.3

206ANNUALREPORT2018
HONG LEONG BANK BERHAD
39 EARNINgS PER ShARE (CoNTINuEd)
diluted earnings per share
The Bank has two categories of dilutive potential ordinary shares, which are the share options and ordinary shares granted under the ESS. For the share options, a calculation is done to determine the number of shares that could have been acquired at fair value (determined as the average annual market share price of the Bank’s shares) based on the monetary value of the subscription rights attached to outstanding share options. The number of shares calculated as below is compared with the number of shares that would have been issued assuming the exercise of the share options.
The group The Bank 2018 2017 2018 2017 Rm’000 Rm’000 Rm’000 Rm’000
Net profit attributable to equity holders 2,638,078 2,145,016 1,972,411 1,744,051Weighted average number of
ordinary shares in issue (‘000) 2,045,677 2,045,503 2,045,677 2,045,503- adjustment for ESS 3,423 551 3,423 551
2,049,100 2,046,054 2,049,100 2,046,054
Diluted earnings per share (sen) 128.7 104.8 96.3 85.2
40 INComE TAx RELATINg To ComPoNENTS of oThER ComPREhENSIVE INComE/(LoSS)
2018 2017 Net of Net of Before Tax tax Before Tax tax tax benefits amount tax benefits amount The group Rm’000 Rm’000 Rm’000 Rm’000 Rm’000 Rm’000
Financial investments available-for-sale- net fair value gain/(loss) (348,012) 170,532 (177,480) 50,990 (12,379) 38,611
Cash flow hedge- net fair value gain/(loss) 2,398 (498) 1,900 856 (206) 650
The Bank
Financial investments available-for-sale
- net fair value gain/(loss) (333,392) 167,008 (166,384) 67,005 (16,127) 50,878
Cash flow hedge- net fair value gain/(loss) 2,398 (498) 1,900 856 (206) 650
NoTES To ThE fINANCIAL STATEmENTSfoR ThE fINANCIAL yEAR ENdEd 30 JuNE 2018
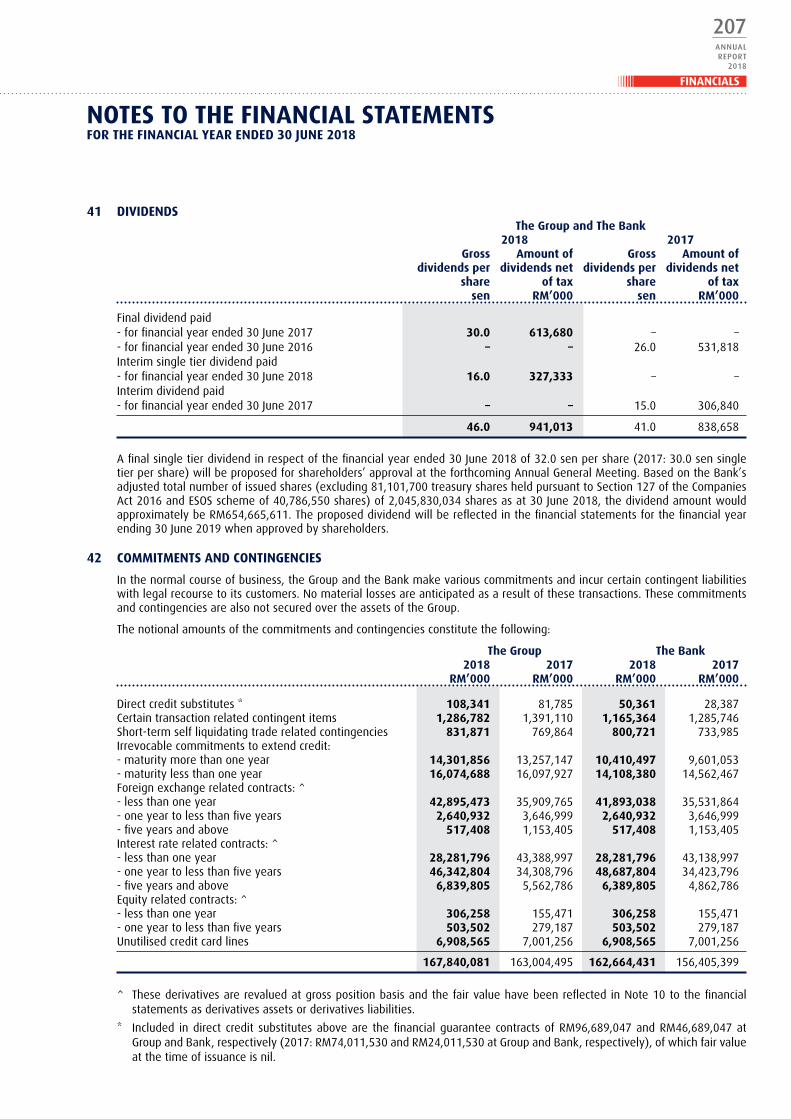
207ANNUALREPORT
2018
FINANCIALS
41 dIVIdENdS The group and The Bank 2018 2017
gross Amount of gross Amount of dividends per dividends net dividends per dividends net share of tax share of tax sen Rm’000 sen Rm’000
Final dividend paid- for financial year ended 30 June 2017 30.0 613,680 – –- for financial year ended 30 June 2016 – – 26.0 531,818Interim single tier dividend paid- for financial year ended 30 June 2018 16.0 327,333 – –Interim dividend paid- for financial year ended 30 June 2017 – – 15.0 306,840
46.0 941,013 41.0 838,658
A final single tier dividend in respect of the financial year ended 30 June 2018 of 32.0 sen per share (2017: 30.0 sen single tier per share) will be proposed for shareholders’ approval at the forthcoming Annual General Meeting. Based on the Bank’s adjusted total number of issued shares (excluding 81,101,700 treasury shares held pursuant to Section 127 of the Companies Act 2016 and ESOS scheme of 40,786,550 shares) of 2,045,830,034 shares as at 30 June 2018, the dividend amount would approximately be RM654,665,611. The proposed dividend will be reflected in the financial statements for the financial year ending 30 June 2019 when approved by shareholders.
42 CommITmENTS ANd CoNTINgENCIES
In the normal course of business, the Group and the Bank make various commitments and incur certain contingent liabilities with legal recourse to its customers. No material losses are anticipated as a result of these transactions. These commitments and contingencies are also not secured over the assets of the Group.
The notional amounts of the commitments and contingencies constitute the following:
The group The Bank 2018 2017 2018 2017 Rm’000 Rm’000 Rm’000 Rm’000
Direct credit substitutes * 108,341 81,785 50,361 28,387Certain transaction related contingent items 1,286,782 1,391,110 1,165,364 1,285,746Short-term self liquidating trade related contingencies 831,871 769,864 800,721 733,985Irrevocable commitments to extend credit:- maturity more than one year 14,301,856 13,257,147 10,410,497 9,601,053- maturity less than one year 16,074,688 16,097,927 14,108,380 14,562,467Foreign exchange related contracts: ^- less than one year 42,895,473 35,909,765 41,893,038 35,531,864- one year to less than five years 2,640,932 3,646,999 2,640,932 3,646,999- five years and above 517,408 1,153,405 517,408 1,153,405Interest rate related contracts: ^- less than one year 28,281,796 43,388,997 28,281,796 43,138,997- one year to less than five years 46,342,804 34,308,796 48,687,804 34,423,796- five years and above 6,839,805 5,562,786 6,389,805 4,862,786Equity related contracts: ^- less than one year 306,258 155,471 306,258 155,471- one year to less than five years 503,502 279,187 503,502 279,187Unutilised credit card lines 6,908,565 7,001,256 6,908,565 7,001,256
167,840,081 163,004,495 162,664,431 156,405,399
^ These derivatives are revalued at gross position basis and the fair value have been reflected in Note 10 to the financial statements as derivatives assets or derivatives liabilities.
* Included in direct credit substitutes above are the financial guarantee contracts of RM96,689,047 and RM46,689,047 at Group and Bank, respectively (2017: RM74,011,530 and RM24,011,530 at Group and Bank, respectively), of which fair value at the time of issuance is nil.
NoTES To ThE fINANCIAL STATEmENTSfoR ThE fINANCIAL yEAR ENdEd 30 JuNE 2018
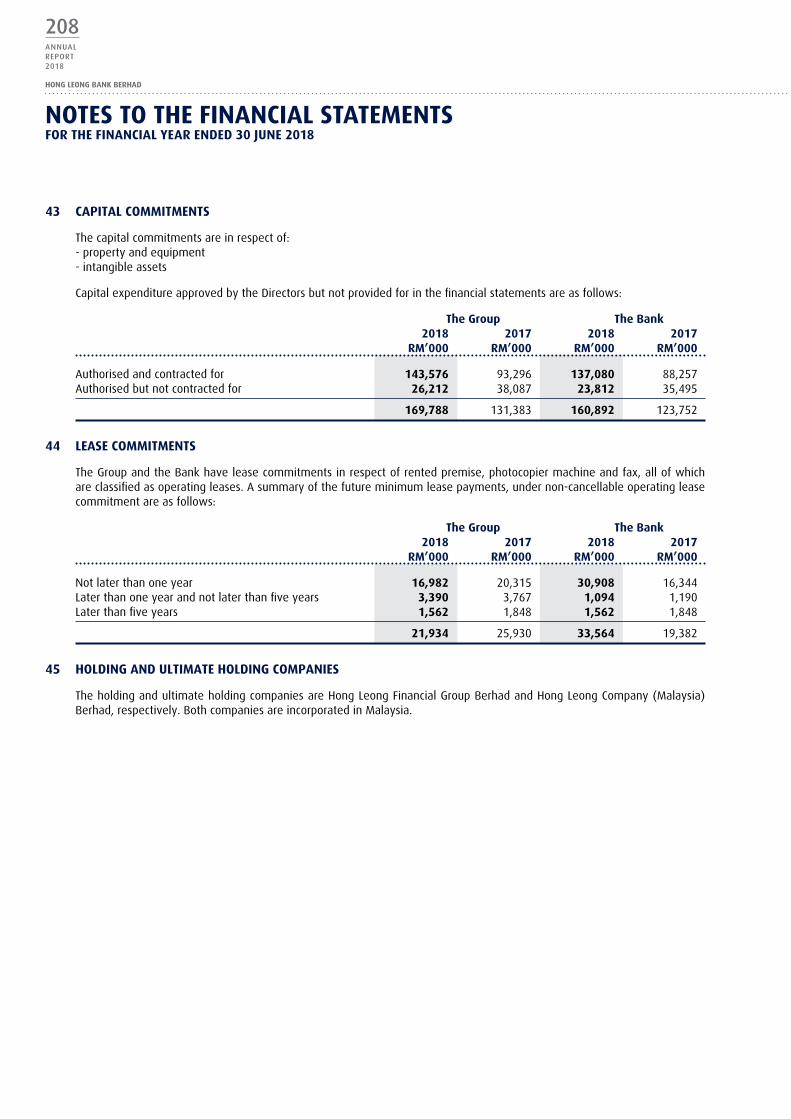
208ANNUALREPORT2018
HONG LEONG BANK BERHAD
43 CAPITAL CommITmENTS
The capital commitments are in respect of: - property and equipment - intangible assets
Capital expenditure approved by the Directors but not provided for in the financial statements are as follows:
The group The Bank 2018 2017 2018 2017 Rm’000 Rm’000 Rm’000 Rm’000
Authorised and contracted for 143,576 93,296 137,080 88,257Authorised but not contracted for 26,212 38,087 23,812 35,495
169,788 131,383 160,892 123,752
44 LEASE CommITmENTS
The Group and the Bank have lease commitments in respect of rented premise, photocopier machine and fax, all of which are classified as operating leases. A summary of the future minimum lease payments, under non-cancellable operating lease commitment are as follows:
The group The Bank 2018 2017 2018 2017 Rm’000 Rm’000 Rm’000 Rm’000
Not later than one year 16,982 20,315 30,908 16,344Later than one year and not later than five years 3,390 3,767 1,094 1,190Later than five years 1,562 1,848 1,562 1,848
21,934 25,930 33,564 19,382
45 hoLdINg ANd uLTImATE hoLdINg ComPANIES
The holding and ultimate holding companies are Hong Leong Financial Group Berhad and Hong Leong Company (Malaysia) Berhad, respectively. Both companies are incorporated in Malaysia.
NoTES To ThE fINANCIAL STATEmENTSfoR ThE fINANCIAL yEAR ENdEd 30 JuNE 2018
209ANNUALREPORT
2018
FINANCIALS
46 fINANCIAL INSTRumENTS
(a) financial risk management objectives and policies
Overview and organisation
group Risk management (“gRm”)
The Group has implemented a risk management framework with the objective to ensure the overall financial soundness and stability of the Group’s business operations. The Group’s risk management framework outlines the overall governance structure, aspiration, values and risk management strategies that balances between risk profiles and returns objectives. Appropriate methodologies and measurements have been developed to manage uncertainties such that deviations from intended strategic objectives are closely monitored and kept within tolerable levels.
From a governance perspective, the Board has the overall responsibility to define the Group’s risk appetite and ensure that a robust risk management and compliance culture prevails. The Board is assisted by the Board Risk Management Committee (“BRMC”) in approving the Group’s risk management framework as well as the attendant capital management framework, risk appetite statement, risk management strategies and risk policies.
Dedicated management level committees are established by the Group to oversee the development and the risk management policies effectiveness, to review risk exposures and portfolio composition as well as to ensure appropriate infrastructures, resources and systems are put in place for effective risk management activities.
From the financial risk perspective, the BRMC is assisted by the Group Risk Management (“GRM”) functions. The GRM function has been established to provide independent oversight on the adequacy, effectiveness and integrity of risk management practices at all levels within the Group. The core functions of the GRM are to identify all key risks for the Group, to measure these risks, to manage the risk positions and to determine the optimum capital allocations. The Group regularly reviews its risk management framework to reflect changes in markets, products, regulatory and emerging best market practice.
Credit Risk management
Credit risk arises as a result of customers or counterparties not being able to or willing to fulfil their financial and contractual obligations as and when they fall due. These obligations arise from lending, trade finance and other activities undertaken by the Group.
The Group has established a credit risk management framework to ensure that exposure to credit risk is kept within the Bank’s financial capacity to withstand potential future losses. Lending activities are guided by the internal credit policies and guidelines that are reviewed and concurred by the Management Credit Committee (“MCC”), endorsed by the Credit Supervisory Committee (“CSC”) and the BRMC, and approved by the Board. These policies are subject to review and enhancements, at least on an annual basis.
Credit portfolio strategies and significant exposures are reviewed by both the BRMC and the Board. These portfolio strategies are designed to achieve a desired portfolio risk tolerance level and sector distribution.
The Group’s credit approving process encompasses pre-approval evaluation, approval and post-approval evaluation. While the business units are responsible for credit origination, the credit approving function rests mainly with the Credit Evaluation Departments, the MCC and the CSC. The Board delegates the approving and discretionary authority to the MCC and the various personnel of the Bank based on job function and designation.
For any new products, credit risk assessment also forms part of the new product sign-off process to ensure that the new product complies with the appropriate policies and guidelines, prior to the introduction of the product.
The Group’s exposure to credit risk is mainly from its retail, small and medium enterprise (“SME”), commercial and corporate customers. The credit assessment for retail customers is managed on a portfolio basis and the risk scoring models and lending templates are designed to assess the credit worthiness and the likelihood of the obligors to repay their debts. The SME, commercial and corporate customers are individually assessed and assigned with a credit rating, which is based on the assessment of relevant factors such as the customer’s financial position, industry outlook, types of facilities and collaterals offered.
In addition, the Group also conducts periodic stress testing of its credit portfolios to ascertain the credit risk impact to capital under the relevant stress scenarios.
NoTES To ThE fINANCIAL STATEmENTSfoR ThE fINANCIAL yEAR ENdEd 30 JuNE 2018

210ANNUALREPORT2018
HONG LEONG BANK BERHAD
46 fINANCIAL INSTRumENTS (CoNTINuEd)
(a) financial risk management objectives and policies (continued)
Credit Risk management (continued)
Internal Audit conducts independent post approval reviews on sampling basis to ensure that the quality of credit appraisals and approval standards are in accordance with the credit standards, lending policies and the directives established and approved by the Group’s management.
market Risk management
Market risk is the risk of financial loss arising from exposure to adverse changes in values of financial instruments caused by changes in market prices or rates, which include changes to interest rates.
The Group adopts a systematic approach in managing such risks by types of instruments and nature of exposure. Market risk is primarily controlled via a series of cut-loss limits and potential loss limits, i.e. Value at Risk (“VaR”), set in accordance with the size of positions and risk tolerance appetites.
Portfolios held under the Group’s trading books are tracked using daily mark-to-market positions, which are compared against preset limits. The daily tracking of positions is supplemented by sensitivity analysis and stress tests, using VaR and other measurements.
Foreign exchange risks arising from adverse exchange rate movements, is managed by the setting of preset limits, matching of open positions against these preset limits and imposition of cut-loss mechanisms.
Interest rate risk is identified, measured and controlled through various types of limits. In addition, the Group regularly review the interest rate outlook and develop strategies to protect the total net interest income from adverse changes in market interest rates. This applies to both interest rate risk exposures in the trading book and the banking book. In managing interest rate risk in the banking book, the Group measures earnings at risk and economic value or capital at risk.
The Group also conducts periodic stress testing of the respective portfolios and on an overall basis to ascertain market risk under abnormal market conditions.
Liquidity Risk management
Liquidity risk is the risk of financial loss arising from the inability to fund increases in assets and/or meet obligations as they fall due. Financial obligations arise from the withdrawal of deposits, funding of loans committed and repayment of borrowed funds. It is the Group’s policy to ensure there is adequate liquidity across all business units to sustain ongoing operations, as well as sufficient liquidity to fund asset growth and strategic opportunities.
Besides adhering to the Regulatory Liquidity Requirement, the Group has put in place a robust and comprehensive liquidity risk management framework consisting of risk appetite, policies, triggers and controls which are reviewed and concurred by the Group Asset-Liability Committee, endorsed by the BRMC and approved by the Board. The key elements of the framework cover proactive monitoring and management of cashflow, maintenance of high quality long-term and short-term marketable debt securities, diversification of funding base as well as maintenance of a liquidity compliance buffer to meet any unexpected cash outflows.
The Group has in place liquidity contingency funding plan and stress test programs to minimise the liquidity risk that may arise due to unforeseen adverse changes in the marketplace. Contingency funding plan sets out the crisis escalation process and the various strategies to be employed to preserve liquidity including an orderly communication channel during liquidity crisis scenarios. Liquidity stress tests are conducted regularly to ensure there is adequate liquidity contingency fund to meet the shortfalls during liquidity crisis scenarios.
(b) market risk
Market risk sensitivity assessment is based on the changes in key variables, such as interest rates and foreign currency rates, while all other variables remain unchanged. The sensitivity factors used are assumptions based on parallel shifts in the key variables to project the impact on the assets and liabilities position of the Group and the Bank.
The scenarios used are simplified whereby it is assumed that all key variables for all maturities move at the same time and by the same magnitude and do not incorporate actions that would be otherwise taken by the business units and risk management to mitigate the effect of this movement in key variables. In reality, the Group and the Bank proactively seek to ensure that the interest rate risk profile is managed to minimise losses and optimise net revenues.
NoTES To ThE fINANCIAL STATEmENTSfoR ThE fINANCIAL yEAR ENdEd 30 JuNE 2018
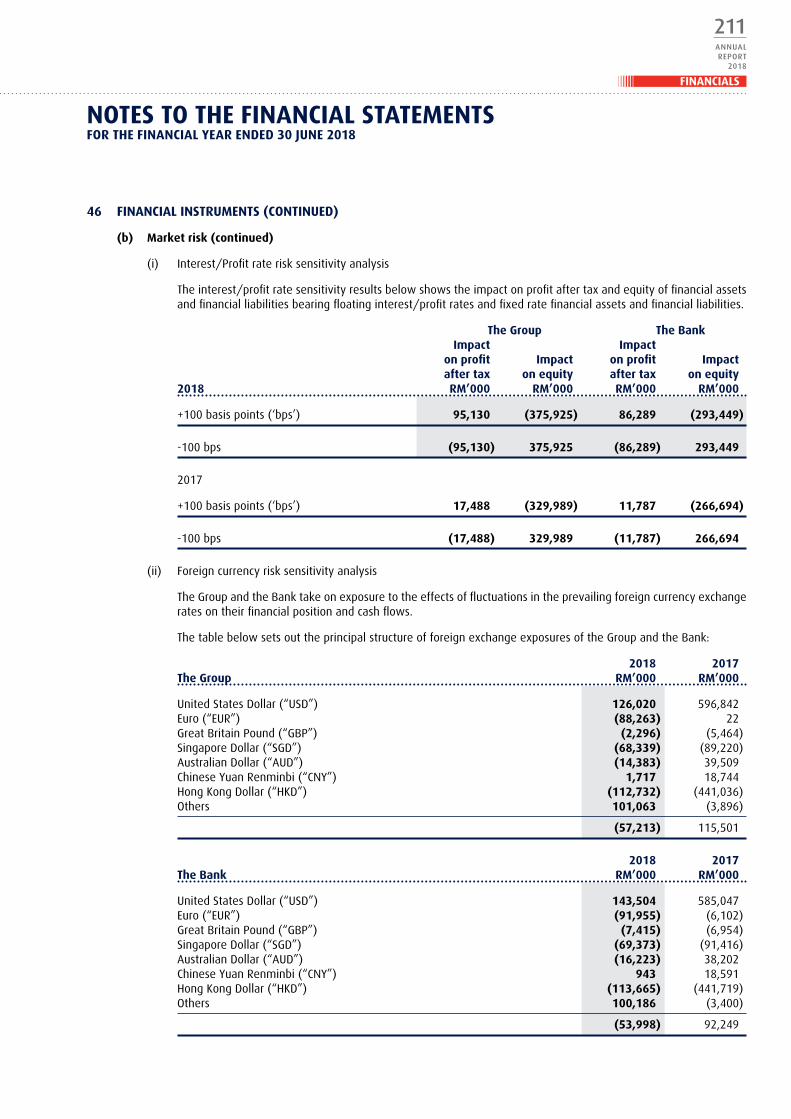
211ANNUALREPORT
2018
FINANCIALS
46 fINANCIAL INSTRumENTS (CoNTINuEd)
(b) market risk (continued)
(i) Interest/Profit rate risk sensitivity analysis
The interest/profit rate sensitivity results below shows the impact on profit after tax and equity of financial assets and financial liabilities bearing floating interest/profit rates and fixed rate financial assets and financial liabilities.
The group The Bank Impact Impact on profit Impact on profit Impact after tax on equity after tax on equity 2018 Rm’000 Rm’000 Rm’000 Rm’000
+100 basis points (‘bps’) 95,130 (375,925) 86,289 (293,449)
-100 bps (95,130) 375,925 (86,289) 293,449
2017
+100 basis points (‘bps’) 17,488 (329,989) 11,787 (266,694)
-100 bps (17,488) 329,989 (11,787) 266,694
(ii) Foreign currency risk sensitivity analysis
The Group and the Bank take on exposure to the effects of fluctuations in the prevailing foreign currency exchange rates on their financial position and cash flows.
The table below sets out the principal structure of foreign exchange exposures of the Group and the Bank:
2018 2017 The group Rm’000 Rm’000
United States Dollar (“USD”) 126,020 596,842Euro (“EUR”) (88,263) 22Great Britain Pound (“GBP”) (2,296) (5,464)Singapore Dollar (“SGD”) (68,339) (89,220)Australian Dollar (“AUD”) (14,383) 39,509Chinese Yuan Renminbi (“CNY”) 1,717 18,744Hong Kong Dollar (“HKD”) (112,732) (441,036)Others 101,063 (3,896)
(57,213) 115,501
2018 2017 The Bank Rm’000 Rm’000
United States Dollar (“USD”) 143,504 585,047Euro (“EUR”) (91,955) (6,102)Great Britain Pound (“GBP”) (7,415) (6,954)Singapore Dollar (“SGD”) (69,373) (91,416)Australian Dollar (“AUD”) (16,223) 38,202Chinese Yuan Renminbi (“CNY”) 943 18,591Hong Kong Dollar (“HKD”) (113,665) (441,719)Others 100,186 (3,400)
(53,998) 92,249
NoTES To ThE fINANCIAL STATEmENTSfoR ThE fINANCIAL yEAR ENdEd 30 JuNE 2018

212ANNUALREPORT2018
HONG LEONG BANK BERHAD
46 fINANCIAL INSTRumENTS (CoNTINuEd)
(b) market risk (continued)
(ii) Foreign currency risk sensitivity analysis (continued)
An analysis of the exposures to assess the impact of a one per cent change in the foreign currency exchange rates to the profit after tax are as follows:
2018 2017 The group Rm’000 Rm’000
-1%United States Dollar (“USD”) (958) (4,536)Euro (“EUR”) 671 –Great Britain Pound (“GBP”) 17 42Singapore Dollar (“SGD”) 519 678Australian Dollar (“AUD”) 109 (300)Chinese Yuan Renminbi (“CNY”) (13) (142)Hong Kong Dollar (“HKD”) 857 3,352Others (768) 30
434 (876)
+1%United States Dollar (“USD”) 958 4,536Euro (“EUR”) (671) –Great Britain Pound (“GBP”) (17) (42)Singapore Dollar (“SGD”) (519) (678)Australian Dollar (“AUD”) (109) 300Chinese Yuan Renminbi (“CNY”) 13 142Hong Kong Dollar (“HKD”) (857) (3,352)Others 768 (30)
(434) 876
2018 2017 The Bank Rm’000 Rm’000
-1%United States Dollar (“USD”) (1,091) (4,446)Euro (“EUR”) 699 46Great Britain Pound (“GBP”) 56 53Singapore Dollar (“SGD”) 527 695Australian Dollar (“AUD”) 123 (290)Chinese Yuan Renminbi (“CNY”) (7) (141)Hong Kong Dollar (“HKD”) 864 3,357Others (761) 26
410 (700)
+1%United States Dollar (“USD”) 1,091 4,446Euro (“EUR”) (699) (46)Great Britain Pound (“GBP”) (56) (53)Singapore Dollar (“SGD”) (527) (695)Australian Dollar (“AUD”) (123) 290Chinese Yuan Renminbi (“CNY”) 7 141Hong Kong Dollar (“HKD”) (864) (3,357)Others 761 (26)
(410) 700
NoTES To ThE fINANCIAL STATEmENTSfoR ThE fINANCIAL yEAR ENdEd 30 JuNE 2018
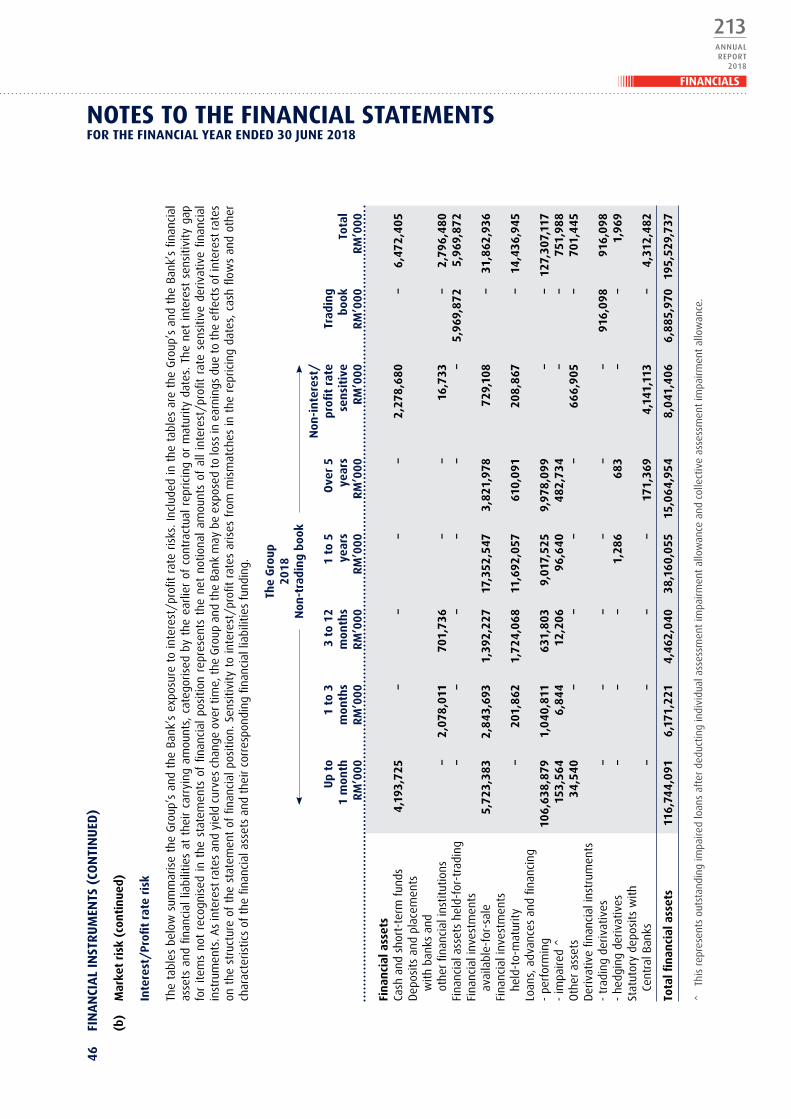
213ANNUALREPORT
2018
FINANCIALS46
fI
NA
NCI
AL
INST
Ru
mEN
TS (
CoN
TIN
uEd
)
(b)
mar
ket
risk
(co
nti
nue
d)
In
tere
st/
Pro
fit
rate
ris
k
Th
e ta
bles
bel
ow s
umm
aris
e th
e G
roup
’s a
nd t
he B
ank’
s ex
posu
re t
o in
tere
st/p
rofit
rat
e ri
sks.
Inc
lude
d in
the
tab
les
are
the
Gro
up’s
and
the
Ban
k’s
finan
cial
as
sets
and
fina
ncia
l lia
bilit
ies
at t
heir
carr
ying
am
ount
s, c
ateg
oris
ed b
y th
e ea
rlie
r of
con
trac
tual
rep
rici
ng o
r m
atur
ity d
ates
. Th
e ne
t in
tere
st s
ensi
tivity
gap
fo
r ite
ms
not
reco
gnis
ed i
n th
e st
atem
ents
of
finan
cial
pos
ition
rep
rese
nts
the
net
notio
nal
amou
nts
of a
ll in
tere
st/
profi
t ra
te s
ensi
tive
deri
vativ
e fin
anci
al
inst
rum
ents
. As
inte
rest
rat
es a
nd y
ield
cur
ves
chan
ge o
ver
time,
the
Gro
up a
nd t
he B
ank
may
be
expo
sed
to lo
ss in
ear
ning
s du
e to
the
eff
ects
of i
nter
est
rate
s on
the
str
uctu
re o
f th
e st
atem
ent
of fi
nanc
ial p
ositi
on.
Sens
itivi
ty t
o in
tere
st/p
rofit
rat
es a
rise
s fr
om m
ism
atch
es in
the
rep
rici
ng d
ates
, ca
sh fl
ows
and
othe
r ch
arac
teris
tics
of t
he fi
nanc
ial a
sset
s an
d th
eir
corr
espo
ndin
g fin
anci
al li
abili
ties
fund
ing.
Th
e g
roup
2018
N
on-t
radi
ng
book
Non
-in
tere
st/
u
p to
1
to 3
3
to 1
2 1
to 5
o
ver
5 pr
ofit
rate
Tr
adin
g
1 m
onth
m
onth
s m
onth
s ye
ars
year
s se
nsi
tive
bo
ok
Tota
l
Rm
’000
R
m’0
00
Rm
’000
R
m’0
00
Rm
’000
R
m’0
00
Rm
’000
R
m’0
00
fin
anci
al a
sset
sCa
sh a
nd s
hort
-ter
m f
unds
4,
193,
725
–
– –
– 2,
278,
680
–
6,47
2,4
05D
epos
its a
nd p
lace
men
ts
w
ith b
anks
and
ot
her
finan
cial
inst
itutio
ns
– 2,
078,
011
701,
736
–
– 16
,733
–
2,79
6,4
80Fi
nanc
ial a
sset
s he
ld-f
or-t
radi
ng
– –
– –
– –
5,96
9,87
2 5,
969,
872
Fina
ncia
l inv
estm
ents
avai
labl
e-fo
r-sa
le
5,7
23,3
83
2,8
43,6
93
1,39
2,22
7 17
,352
,547
3,
821,
978
729
,108
–
31,8
62,9
36Fi
nanc
ial i
nves
tmen
ts
he
ld-t
o-m
atur
ity
– 20
1,8
62
1,7
24,0
68
11,6
92,0
57
610,
091
20
8,8
67
– 14
,436
,945
Loan
s, a
dvan
ces
and
finan
cing
- pe
rfor
min
g 10
6,63
8,87
9 1,
040,
811
631,
803
9,01
7,52
5 9,
978,
09
9 –
– 12
7,30
7,11
7-
impa
ired
^
153,
564
6,8
44
12,2
06
96,6
40
482
,734
–
– 75
1,98
8O
ther
ass
ets
34,5
40
– –
– –
66
6,9
05
– 70
1,4
45D
eriv
ativ
e fin
anci
al in
stru
men
ts-
trad
ing
deriv
ativ
es
– –
– –
– –
916,
098
91
6,0
98-
hedg
ing
deriv
ativ
es
– –
– 1,
286
683
–
– 1,
969
Stat
utor
y de
posi
ts w
ith
Ce
ntra
l Ban
ks
– –
– –
171,
369
4,14
1,11
3 –
4,31
2,4
82
Tota
l fin
anci
al a
sset
s 11
6,74
4,0
91
6,17
1,22
1 4,
462
,04
0 38
,16
0,05
5 15
,06
4,95
4 8,
041,
40
6 6,
885
,970
19
5,52
9,7
37
^
This
rep
rese
nts
outs
tand
ing
impa
ired
loan
s af
ter
dedu
ctin
g in
divi
dual
ass
essm
ent
impa
irmen
t al
low
ance
and
col
lect
ive
asse
ssm
ent
impa
irmen
t al
low
ance
.
NoTES To ThE fINANCIAL STATEmENTSfoR ThE fINANCIAL yEAR ENdEd 30 JuNE 2018
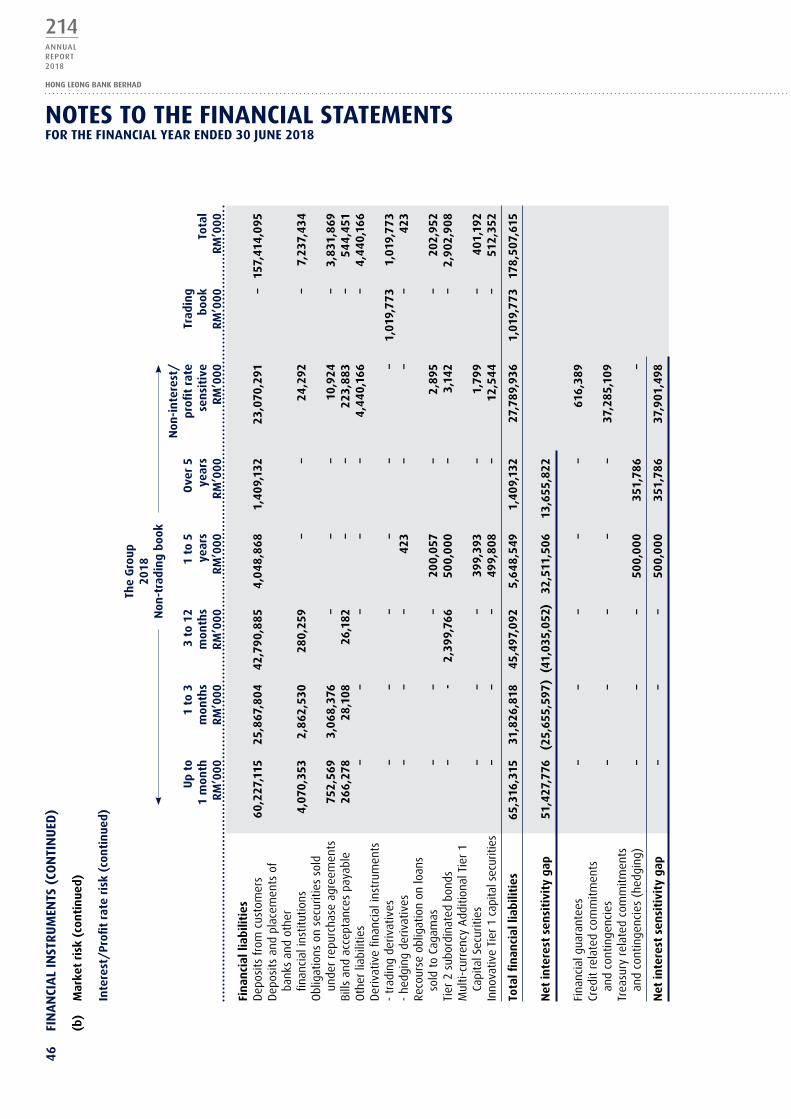
214ANNUALREPORT2018
HONG LEONG BANK BERHAD
46
fIN
AN
CIA
L IN
STR
um
ENTS
(Co
NTI
Nu
Ed)
(b)
mar
ket
risk
(co
nti
nue
d)
In
tere
st/
Pro
fit
rate
ris
k (c
onti
nue
d)
Th
e g
roup
2018
N
on-t
radi
ng
book
Non
-in
tere
st/
u
p to
1
to 3
3
to 1
2 1
to 5
o
ver
5 pr
ofit
rate
Tr
adin
g
1 m
onth
m
onth
s m
onth
s ye
ars
year
s se
nsi
tive
bo
ok
Tota
l
Rm
’000
R
m’0
00
Rm
’000
R
m’0
00
Rm
’000
R
m’0
00
Rm
’000
R
m’0
00
fin
anci
al li
abili
ties
Dep
osits
fro
m c
usto
mer
s 6
0,22
7,11
5 25
,867
,804
42
,79
0,8
85
4,04
8,8
68
1,4
09,
132
23,0
70,2
91
– 15
7,41
4,0
95D
epos
its a
nd p
lace
men
ts o
f
ba
nks
and
othe
r
finan
cial
inst
itutio
ns
4,07
0,35
3 2,
862
,530
28
0,25
9 –
– 24
,292
–
7,23
7,43
4O
blig
atio
ns o
n se
curit
ies
sold
un
der
repu
rcha
se a
gree
men
ts
752,
569
3,0
68,
376
– –
– 10
,924
–
3,83
1,8
69Bi
lls a
nd a
ccep
tanc
es p
ayab
le
266,
278
28,1
08
26,1
82
– –
223,
883
–
544,
451
Oth
er li
abili
ties
– –
– –
– 4,
44
0,16
6 –
4,4
40,
166
Der
ivat
ive
finan
cial
inst
rum
ents
- tr
adin
g de
rivat
ives
–
– –
– –
– 1,
019,
77
3 1,
019,
77
3-
hedg
ing
deriv
ativ
es
– –
– 42
3 –
– –
423
Reco
urse
obl
igat
ion
on lo
ans
sold
to
Caga
mas
–
– –
200,
057
– 2,
895
– 20
2,95
2Ti
er 2
sub
ordi
nate
d bo
nds
– -
2,39
9,76
6 50
0,0
00
– 3,
142
– 2,
902
,908
Mul
ti-cu
rren
cy A
dditi
onal
Tie
r 1
Capi
tal S
ecur
ities
–
– –
399,
393
– 1,
799
– 4
01,1
92In
nova
tive
Tier
1 c
apita
l sec
uriti
es
– –
– 49
9,80
8 –
12,5
44
– 51
2,35
2
Tota
l fin
anci
al li
abili
ties
65
,316
,315
31
,826
,818
45
,497
,092
5,
64
8,54
9 1,
40
9,13
2 27
,789
,936
1,
019,
77
3 17
8,50
7,61
5
Net
inte
rest
sen
siti
vity
gap
51
,427
,776
(2
5,65
5,59
7)
(41,
035,
052)
32
,511
,50
6 13
,655
,822
Fina
ncia
l gua
rant
ees
– –
– –
– 61
6,38
9Cr
edit
rela
ted
com
mitm
ents
and
cont
inge
ncie
s –
– –
– –
37,2
85,1
09
Trea
sury
rel
ated
com
mitm
ents
and
cont
inge
ncie
s (h
edgi
ng)
– –
– 50
0,0
00
351,
786
–
Net
inte
rest
sen
siti
vity
gap
–
– –
500,
00
0 35
1,78
6 37
,901
,498
NoTES To ThE fINANCIAL STATEmENTSfoR ThE fINANCIAL yEAR ENdEd 30 JuNE 2018
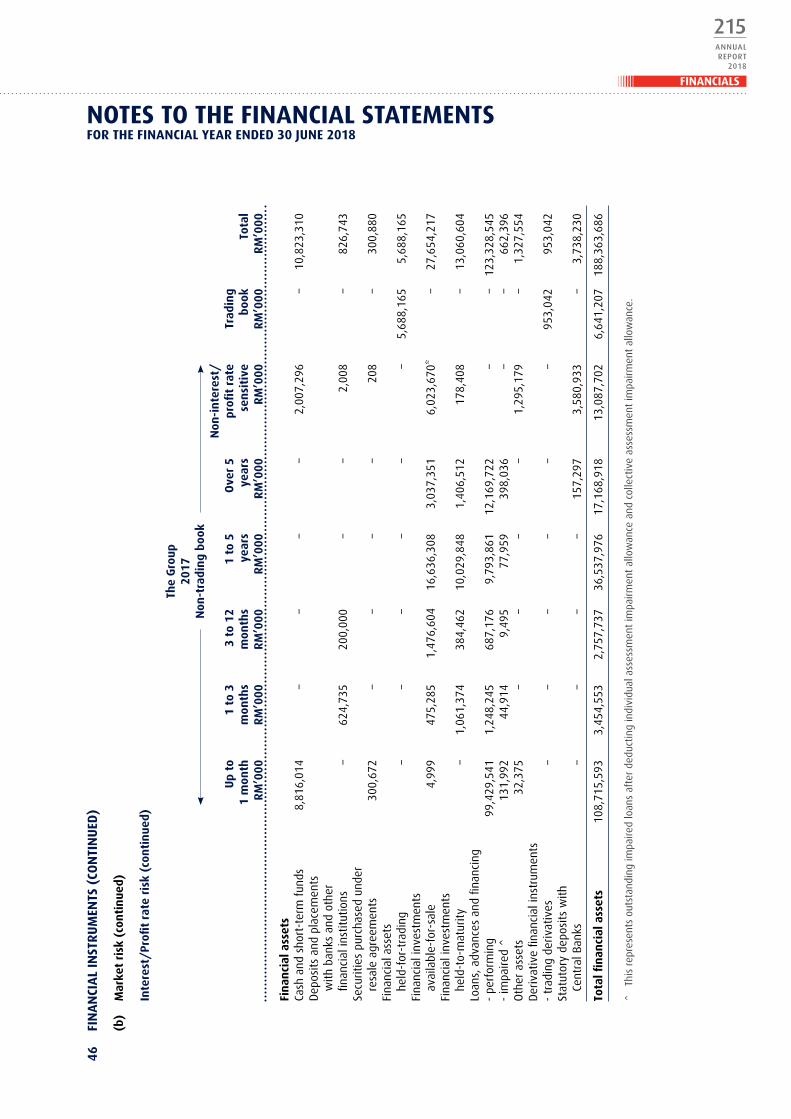
215ANNUALREPORT
2018
FINANCIALS46
fI
NA
NCI
AL
INST
Ru
mEN
TS (
CoN
TIN
uEd
)
(b)
mar
ket
risk
(co
nti
nue
d)
In
tere
st/
Pro
fit
rate
ris
k (c
onti
nue
d)
Th
e g
roup
2017
N
on-t
radi
ng
book
Non
-in
tere
st/
u
p to
1
to 3
3
to 1
2 1
to 5
o
ver
5 pr
ofit
rate
Tr
adin
g
1 m
onth
m
onth
s m
onth
s ye
ars
year
s se
nsi
tive
bo
ok
Tota
l
Rm
’000
R
m’0
00
Rm
’000
R
m’0
00
Rm
’000
R
m’0
00
Rm
’000
R
m’0
00
fin
anci
al a
sset
sCa
sh a
nd s
hort
-ter
m f
unds
8,
816,
014
– –
– –
2,00
7,29
6 –
10,8
23,3
10D
epos
its a
nd p
lace
men
ts
w
ith b
anks
and
oth
er
fin
anci
al in
stitu
tions
–
624,
735
200,
000
– –
2,00
8 –
826,
743
Secu
ritie
s pu
rcha
sed
unde
r
re
sale
agr
eem
ents
30
0,67
2 –
– –
– 20
8 –
300,
880
Fina
ncia
l ass
ets
held
-for
-tra
ding
–
– –
– –
– 5,
688,
165
5,68
8,16
5Fi
nanc
ial i
nves
tmen
ts
av
aila
ble-
for-
sale
4,
999
475,
285
1,47
6,60
4 16
,636
,308
3,
037,
351
6,02
3,67
0*
– 27
,654
,217
Fina
ncia
l inv
estm
ents
held
-to-
mat
urity
–
1,06
1,37
4 38
4,46
2 10
,029
,848
1,
406,
512
178,
408
– 13
,060
,604
Loan
s, a
dvan
ces
and
finan
cing
- pe
rfor
min
g 99
,429
,541
1,
248,
245
687,
176
9,79
3,86
1 12
,169
,722
–
– 12
3,32
8,54
5-
impa
ired
^
131,
992
44,9
14
9,49
5 77
,959
39
8,03
6 –
– 66
2,39
6O
ther
ass
ets
32,3
75
– –
– –
1,29
5,17
9 –
1,32
7,55
4D
eriv
ativ
e fin
anci
al in
stru
men
ts-
trad
ing
deriv
ativ
es
– –
– –
– –
953,
042
953,
042
Stat
utor
y de
posi
ts w
ith
Ce
ntra
l Ban
ks
– –
– –
157,
297
3,58
0,93
3 –
3,73
8,23
0
Tota
l fin
anci
al a
sset
s 10
8,71
5,59
3 3,
454,
553
2,75
7,73
7 36
,537
,976
17
,168
,918
13
,087
,702
6,
641,
207
188,
363,
686
^
This
rep
rese
nts
outs
tand
ing
impa
ired
loan
s af
ter
dedu
ctin
g in
divi
dual
ass
essm
ent
impa
irmen
t al
low
ance
and
col
lect
ive
asse
ssm
ent
impa
irmen
t al
low
ance
.
NoTES To ThE fINANCIAL STATEmENTSfoR ThE fINANCIAL yEAR ENdEd 30 JuNE 2018

216ANNUALREPORT2018
HONG LEONG BANK BERHAD
46
fIN
AN
CIA
L IN
STR
um
ENTS
(Co
NTI
Nu
Ed)
(b)
mar
ket
risk
(co
nti
nue
d)
In
tere
st/
Pro
fit
rate
ris
k (c
onti
nue
d)
Th
e g
roup
2017
N
on-t
radi
ng
book
Non
-in
tere
st/
u
p to
1
to 3
3
to 1
2 1
to 5
o
ver
5 pr
ofit
rate
Tr
adin
g
1 m
onth
m
onth
s m
onth
s ye
ars
year
s se
nsi
tive
bo
ok
Tota
l
Rm
’000
R
m’0
00
Rm
’000
R
m’0
00
Rm
’000
R
m’0
00
Rm
’000
R
m’0
00
fin
anci
al li
abili
ties
Dep
osits
fro
m c
usto
mer
s 62
,516
,952
29
,735
,585
38
,157
,355
3,
042,
102
1,13
4,82
6 20
,646
,385
–
155,
233,
205
Dep
osits
and
pla
cem
ents
of
bank
s an
d ot
her
fin
anci
al in
stitu
tions
2,
886,
329
1,55
2,56
1 1,
017,
246
– –
30,5
56
– 5,
486,
692
Obl
igat
ions
on
secu
ritie
s
so
ld u
nder
rep
urch
ase
ag
reem
ents
55
7,41
6 1,
897,
279
372,
600
– –
2,32
2 –
2,82
9,61
7Bi
lls a
nd a
ccep
tanc
es p
ayab
le
57,5
52
47,4
64
15,8
65
– –
243,
794
– 36
4,67
5O
ther
liab
ilitie
s –
– –
– –
3,83
0,51
0 –
3,83
0,51
0D
eriv
ativ
e fin
anci
al in
stru
men
ts-
trad
ing
deriv
ativ
es
– –
– –
– –
1,40
4,04
8 1,
404,
048
- he
dgin
g de
rivat
ives
–
– –
1,40
9 19
5 –
– 1,
604
Reco
urse
obl
igat
ion
on lo
ans
sold
to
Caga
mas
–
– –
200,
052
– 2,
874
– 20
2,92
6Ti
er 2
sub
ordi
nate
d bo
nds
– –
– 2,
399,
324
– 2,
821
– 2,
402,
145
Inno
vativ
e Ti
er 1
cap
ital s
ecur
ities
–
– –
502,
852
– 12
,771
–
515,
623
Tota
l fin
anci
al li
abili
ties
66
,018
,249
33
,232
,889
39
,563
,066
6,
145,
739
1,13
5,02
1 24
,772
,033
1,
404,
048
172,
271,
045
Net
inte
rest
sen
siti
vity
gap
42
,697
,344
(2
9,77
8,33
6)
(36,
805,
329)
30
,392
,237
16
,033
,897
Fina
ncia
l gua
rant
ees
– –
– –
– 56
3,04
9Cr
edit
rela
ted
com
mitm
ents
and
cont
inge
ncie
s –
– –
– –
36,3
56,3
30Tr
easu
ry r
elat
ed c
omm
itmen
ts a
nd
co
ntin
genc
ies
(hed
ging
) –
– –
400,
000
146,
429
–
Net
inte
rest
sen
siti
vity
gap
–
– –
400,
000
146,
429
36,9
19,3
79
NoTES To ThE fINANCIAL STATEmENTSfoR ThE fINANCIAL yEAR ENdEd 30 JuNE 2018
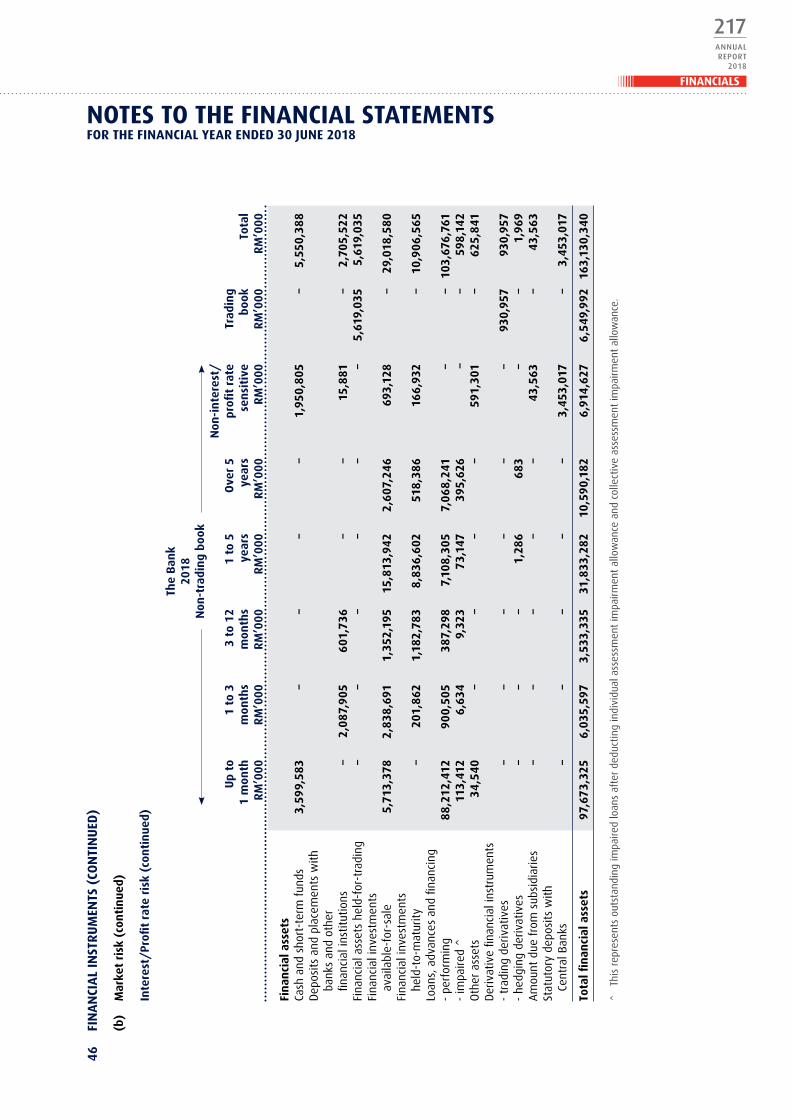
217ANNUALREPORT
2018
FINANCIALS46
fI
NA
NCI
AL
INST
Ru
mEN
TS (
CoN
TIN
uEd
)
(b)
mar
ket
risk
(co
nti
nue
d)
In
tere
st/
Pro
fit
rate
ris
k (c
onti
nue
d)
Th
e B
ank
20
18
Non
-tra
din
g bo
ok
N
on-i
nte
rest
/
up
to
1 to
3
3 to
12
1 to
5
ove
r 5
profi
t ra
te
Trad
ing
1
mon
th
mon
ths
mon
ths
year
s ye
ars
sen
siti
ve
book
To
tal
R
m’0
00
Rm
’000
R
m’0
00
Rm
’000
R
m’0
00
Rm
’000
R
m’0
00
Rm
’000
fin
anci
al a
sset
sCa
sh a
nd s
hort
-ter
m f
unds
3,
599,
583
– –
– –
1,95
0,80
5 –
5,55
0,38
8D
epos
its a
nd p
lace
men
ts w
ith
ba
nks
and
othe
r
finan
cial
inst
itutio
ns
– 2,
087,
905
6
01,7
36
– –
15,8
81
– 2,
705,
522
Fina
ncia
l ass
ets
held
-for
-tra
ding
–
– –
– –
– 5,
619,
035
5,61
9,03
5Fi
nanc
ial i
nves
tmen
ts
av
aila
ble-
for-
sale
5,
713,
378
2,83
8,69
1 1,
352,
195
15,8
13,9
42
2,6
07,2
46
693,
128
– 29
,018
,580
Fina
ncia
l inv
estm
ents
held
-to-
mat
urity
–
201,
862
1,
182,
783
8,83
6,6
02
518,
386
166,
932
– 10
,90
6,56
5Lo
ans,
adv
ance
s an
d fin
anci
ng-
perf
orm
ing
88,
212,
412
90
0,50
5 38
7,29
8 7,
108,
305
7,0
68,
241
– –
103,
676,
761
- im
paire
d ^
11
3,41
2 6,
634
9,32
3 7
3,14
7 39
5,62
6 –
– 59
8,14
2O
ther
ass
ets
34,5
40
– –
– –
591,
301
– 62
5,8
41D
eriv
ativ
e fin
anci
al in
stru
men
ts-
trad
ing
deriv
ativ
es
– –
– –
– –
930,
957
930,
957
- he
dgin
g de
rivat
ives
–
– –
1,28
6 6
83
– –
1,96
9A
mou
nt d
ue f
rom
sub
sidi
arie
s –
– –
– –
43,5
63
– 43
,563
Stat
utor
y de
posi
ts w
ith
Ce
ntra
l Ban
ks
– –
– –
– 3,
453,
017
– 3,
453,
017
Tota
l fin
anci
al a
sset
s 97
,67
3,32
5 6,
035,
597
3,53
3,33
5 31
,833
,282
10
,59
0,18
2 6,
914,
627
6,54
9,9
92
163,
130,
340
^
This
rep
rese
nts
outs
tand
ing
impa
ired
loan
s af
ter
dedu
ctin
g in
divi
dual
ass
essm
ent
impa
irmen
t al
low
ance
and
col
lect
ive
asse
ssm
ent
impa
irmen
t al
low
ance
.
NoTES To ThE fINANCIAL STATEmENTSfoR ThE fINANCIAL yEAR ENdEd 30 JuNE 2018

218ANNUALREPORT2018
HONG LEONG BANK BERHAD
46
fIN
AN
CIA
L IN
STR
um
ENTS
(Co
NTI
Nu
Ed)
(b)
mar
ket
risk
(co
nti
nue
d)
In
tere
st/
Pro
fit
rate
ris
k (c
onti
nue
d)
Th
e B
ank
20
18
Non
-tra
din
g bo
ok
N
on-i
nte
rest
/
up
to
1 to
3
3 to
12
1 to
5
ove
r 5
profi
t ra
te
Trad
ing
1
mon
th
mon
ths
mon
ths
year
s ye
ars
sen
siti
ve
book
To
tal
R
m’0
00
Rm
’000
R
m’0
00
Rm
’000
R
m’0
00
Rm
’000
R
m’0
00
Rm
’000
fin
anci
al li
abili
ties
Dep
osits
fro
m c
usto
mer
s 49
,382
,454
20
,592
,117
35
,597
,40
9 3,
516,
211
593,
082
19,9
02,1
52
– 12
9,58
3,42
5D
epos
its a
nd p
lace
men
ts o
f
ba
nks
and
othe
r
finan
cial
inst
itutio
ns
4,34
7,85
3 2,
696,
513
176,
812
– –
24,6
76
– 7,
245,
854
Obl
igat
ions
on
secu
ritie
s so
ld
unde
r re
purc
hase
agr
eem
ents
74
3,92
2 3,
050,
273
– –
– 10
,924
–
3,80
5,11
9Bi
lls a
nd a
ccep
tanc
es p
ayab
le
265,
634
26,2
94
24,4
60
– –
190,
583
– 50
6,97
1O
ther
liab
ilitie
s –
– –
– –
3,7
24,2
86
– 3,
724
,28
6D
eriv
ativ
e fin
anci
al in
stru
men
ts-
trad
ing
deriv
ativ
es
– –
– –
– –
983,
257
983,
257
- he
dgin
g de
rivat
ives
–
– –
423
– –
– 42
3Re
cour
se o
blig
atio
n on
loan
s
so
ld t
o Ca
gam
as
– –
– 20
0,05
7 –
2,89
5 –
202,
952
Tier
2 s
ubor
dina
ted
bond
s –
– 1,
99
9,82
0 50
0,0
00
– 2,
458
– 2,
502,
278
Mul
ti-cu
rren
cy A
dditi
onal
Tie
r 1
Capi
tal S
ecur
ities
–
– –
399,
393
– 1,
799
– 4
01,1
92In
nova
tive
Tier
1 c
apita
l sec
uriti
es
– –
– 49
9,80
7 –
12,5
45
– 51
2,35
2
Tota
l fin
anci
al li
abili
ties
54
,739
,863
26
,365
,197
37
,798
,501
5,
115,
891
593,
082
23,8
72,
318
983,
257
149,
46
8,10
9
Net
inte
rest
sen
siti
vity
gap
42
,933
,462
(2
0,32
9,6
00)
(34
,265
,16
6)
26,7
17,3
91
9,9
97,1
00
Fina
ncia
l gua
rant
ees
– –
– –
– 52
8,02
8Cr
edit
rela
ted
com
mitm
ents
and
cont
inge
ncie
s –
– –
– –
31,4
27,4
42Tr
easu
ry r
elat
ed c
omm
itmen
ts
an
d co
ntin
genc
ies
(hed
ging
) –
– –
500,
00
0 35
1,78
6 –
Net
inte
rest
sen
siti
vity
gap
–
– –
500,
00
0 35
1,78
6 31
,955
,470
NoTES To ThE fINANCIAL STATEmENTSfoR ThE fINANCIAL yEAR ENdEd 30 JuNE 2018

219ANNUALREPORT
2018
FINANCIALS46
fI
NA
NCI
AL
INST
Ru
mEN
TS (
CoN
TIN
uEd
)
(b)
mar
ket
risk
(co
nti
nue
d)
In
tere
st/
Pro
fit
rate
ris
k (c
onti
nue
d)
Th
e B
ank
20
17
Non
-tra
din
g bo
ok
N
on-i
nte
rest
/
up
to
1 to
3
3 to
12
1 to
5
ove
r 5
profi
t ra
te
Trad
ing
1
mon
th
mon
ths
mon
ths
year
s ye
ars
sen
siti
ve
book
To
tal
R
m’0
00
Rm
’000
R
m’0
00
Rm
’000
R
m’0
00
Rm
’000
R
m’0
00
Rm
’000
fin
anci
al a
sset
sCa
sh a
nd s
hort
-ter
m f
unds
8,
379,
656
– –
– –
1,81
9,53
8 –
10,1
99,1
94D
epos
its a
nd p
lace
men
ts w
ith
ba
nks
and
othe
r
finan
cial
inst
itutio
ns
– 29
2,60
9 10
0,00
0 –
– 1,
055
– 39
3,66
4Se
curit
ies
purc
hase
d un
der
resa
le a
gree
men
ts
300,
672
– –
– –
208
– 30
0,88
0Fi
nanc
ial a
sset
s he
ld-f
or-t
radi
ng
– –
– –
– –
5,40
5,31
0 5,
405,
310
Fina
ncia
l inv
estm
ents
avai
labl
e-fo
r-sa
le
4,99
9 46
0,28
1 1,
276,
387
14,5
46,4
93
2,60
4,86
0 5,
993,
260
– 24
,886
,280
Fina
ncia
l inv
estm
ents
held
-to-
mat
urity
–
941,
388
384,
462
7,96
9,33
8 96
5,60
0 14
8,00
5 –
10,4
08,7
93Lo
ans,
adv
ance
s an
d fin
anci
ng-
perf
orm
ing
83,5
34,5
37
1,19
0,12
9 49
3,94
8 8,
111,
849
8,67
1,78
7 –
– 10
2,00
2,25
0-
impa
ired
^
123,
119
3,36
2 7,
939
66,4
47
335,
433
– –
536,
300
Oth
er a
sset
s 32
,375
–
– –
– 1,
201,
778
– 1,
234,
153
Der
ivat
ive
finan
cial
inst
rum
ents
- tr
adin
g de
rivat
ives
–
– –
– –
– 94
7,58
3 94
7,58
3A
mou
nt d
ue f
rom
sub
sidi
arie
s –
– –
– –
13,4
84
– 13
,484
Stat
utor
y de
posi
ts w
ith
Ce
ntra
l Ban
ks
– –
– –
– 2,
986,
547
– 2,
986,
547
Tota
l fin
anci
al a
sset
s 92
,375
,358
2,
887,
769
2,26
2,73
6 30
,694
,127
12
,577
,680
12
,163
,875
6,
352,
893
159,
314,
438
^
This
rep
rese
nts
outs
tand
ing
impa
ired
loan
s af
ter
dedu
ctin
g in
divi
dual
ass
essm
ent
impa
irmen
t al
low
ance
and
col
lect
ive
asse
ssm
ent
impa
irmen
t al
low
ance
.
NoTES To ThE fINANCIAL STATEmENTSfoR ThE fINANCIAL yEAR ENdEd 30 JuNE 2018

220ANNUALREPORT2018
HONG LEONG BANK BERHAD
46
fIN
AN
CIA
L IN
STR
um
ENTS
(Co
NTI
Nu
Ed)
(b)
mar
ket
risk
(co
nti
nue
d)
In
tere
st/
Pro
fit
rate
ris
k (c
onti
nue
d)
Th
e B
ank
20
17
Non
-tra
din
g bo
ok
N
on-i
nte
rest
/
up
to
1 to
3
3 to
12
1 to
5
ove
r 5
profi
t ra
te
Trad
ing
1
mon
th
mon
ths
mon
ths
year
s ye
ars
sen
siti
ve
book
To
tal
R
m’0
00
Rm
’000
R
m’0
00
Rm
’000
R
m’0
00
Rm
’000
R
m’0
00
Rm
’000
fin
anci
al li
abili
ties
Dep
osits
fro
m c
usto
mer
s 52
,376
,675
24
,649
,354
31
,875
,749
2,
731,
953
452,
051
17,7
73,6
21
– 12
9,85
9,40
3D
epos
its a
nd p
lace
men
ts
of
ban
ks a
nd o
ther
fin
anci
al in
stitu
tions
2,
913,
416
1,49
8,82
6 1,
017,
246
– –
30,5
88
– 5,
460,
076
Obl
igat
ions
on
secu
ritie
s so
ld
unde
r re
purc
hase
agr
eem
ents
52
9,16
5 1,
897,
279
372,
600
– –
2,32
2 –
2,80
1,36
6Bi
lls a
nd a
ccep
tanc
es p
ayab
le
57,3
39
46,2
23
14,8
70
– –
230,
409
– 34
8,84
1O
ther
liab
ilitie
s –
– –
– –
3,29
0,83
2 –
3,29
0,83
2D
eriv
ativ
e fin
anci
al in
stru
men
ts-
trad
ing
deriv
ativ
es
– –
– –
– –
1,36
2,05
0 1,
362,
050
- he
dgin
g de
rivat
ives
–
– –
1,40
9 19
5 –
– 1,
604
Reco
urse
obl
igat
ion
on lo
ans
sold
to
Caga
mas
–
– –
200,
052
– 2,
874
– 20
2,92
6Ti
er 2
sub
ordi
nate
d bo
nds
– –
– 1,
999,
452
– 2,
190
– 2,
001,
642
Inno
vativ
e Ti
er 1
cap
ital s
ecur
ities
–
– –
502,
852
– 12
,771
–
515,
623
Tota
l fin
anci
al li
abili
ties
55
,876
,595
28
,091
,682
33
,280
,465
5,
435,
718
452,
246
21,3
45,6
07
1,36
2,05
0 14
5,84
4,36
3
Net
inte
rest
sen
siti
vity
gap
36
,498
,763
(2
5,20
3,91
3)
(31,
017,
729)
25
,258
,409
12
,125
,434
Fina
ncia
l gua
rant
ees
– –
– –
– 47
4,41
9Cr
edit
rela
ted
com
mitm
ents
and
cont
inge
ncie
s –
– –
– –
31,1
64,7
76Tr
easu
ry r
elat
ed c
omm
itmen
ts
an
d co
ntin
genc
ies
(hed
ging
) –
– –
400,
000
146,
429
–
Net
inte
rest
sen
siti
vity
gap
–
– –
400,
000
146,
429
31,6
39,1
95
NoTES To ThE fINANCIAL STATEmENTSfoR ThE fINANCIAL yEAR ENdEd 30 JuNE 2018

221ANNUALREPORT
2018
FINANCIALS46
fI
NA
NCI
AL
INST
Ru
mEN
TS (
CoN
TIN
uEd
)
(c)
Liqu
idit
y ri
sk
Li
quid
ity r
isk
is d
efine
d as
the
cur
rent
and
pro
spec
tive
risk
aris
ing
from
the
inab
ility
of
the
Gro
up a
nd t
he B
ank
to m
eet
its c
ontr
actu
al o
r re
gula
tory
obl
igat
ions
w
hen
they
bec
ome
due
with
out
incu
rrin
g su
bsta
ntia
l lo
sses
. Th
e liq
uidi
ty r
isk
is i
dent
ified
bas
ed o
n co
ncen
trat
ion,
vol
atili
ty o
f so
urce
of
fund
and
fun
ding
m
atur
ity s
truc
ture
and
it
is m
easu
red
prim
arily
usi
ng B
NM
’s N
ew L
iqui
dity
Fra
mew
ork
and
depo
sito
r’s
conc
entr
atio
n ra
tios.
The
Gro
up a
nd t
he B
ank
seek
to
proj
ect,
mon
itor
and
man
age
its li
quid
ity n
eeds
und
er n
orm
al a
s w
ell a
s ad
vers
e ci
rcum
stan
ces.
Th
e ta
ble
belo
w a
naly
ses
the
carr
ying
am
ount
of
asse
ts a
nd l
iabi
litie
s (i
nclu
ding
non
-fina
ncia
l in
stru
men
ts)
as a
t 30
Jun
e 20
18 b
ased
on
the
rem
aini
ng
cont
ract
ual m
atur
ity:
Th
e g
roup
2018
u
p to
1
wee
k to
1
to 3
3
to 6
6
to 1
2 o
ver
1 N
o sp
ecifi
c
1 w
eek
1 m
onth
m
onth
s m
onth
s m
onth
s ye
ar
mat
urit
y To
tal
R
m’0
00
Rm
’000
R
m’0
00
Rm
’000
R
m’0
00
Rm
’000
R
m’0
00
Rm
’000
Ass
ets
Cash
and
sho
rt-t
erm
fun
ds
5,01
0,89
6 1,
461
,50
9 –
– –
– –
6,47
2,4
05D
epos
its a
nd p
lace
men
ts w
ith b
anks
an
d ot
her
finan
cial
inst
itutio
ns
– –
2,0
91,4
92
66
4,59
6 4
0,39
2 –
– 2,
796,
480
Fina
ncia
l ass
ets
held
-for
-tra
ding
4
00,
168
601
,228
1,
424,
652
150,
111
10,0
65
3,38
3,6
48
– 5,
969,
872
Fina
ncia
l inv
estm
ents
avai
labl
e-fo
r-sa
le
4,6
03,9
24
1,11
9,71
5 2,
845
,539
23
5,4
61
1,10
9,59
1 21
,481
,194
4
67,5
12
31,8
62,9
36Fi
nanc
ial i
nves
tmen
ts
he
ld-t
o-m
atur
ity
– –
204,
482
14
1,13
5 1,
671,
354
12,4
19,9
74
– 14
,436
,945
Loan
s, a
dvan
ces
and
finan
cing
12
,48
4,78
5 6,
087,
736
5,
250,
306
1,78
8,51
1 59
5,16
7 10
1,85
2,6
00
– 12
8,05
9,10
5O
ther
ass
ets
545,
398
7,45
0 9,
384
11,5
25
4,6
47
16,4
27
185,
238
780,
069
Der
ivat
ive
finan
cial
inst
rum
ents
32
,753
67
,845
22
9,65
7 16
8,82
6 76
,187
34
2,79
9 –
918,
067
Stat
utor
y de
posi
ts w
ith C
entr
al B
anks
–
– –
– –
– 4,
312,
482
4,
312,
482
Inve
stm
ent
in a
ssoc
iate
d co
mpa
nies
–
– –
– –
– 3,
651,
091
3,
651,
091
Inve
stm
ent
in jo
int
vent
ure
– –
– –
– –
179,
426
179,
426
Prop
erty
and
equ
ipm
ent
– –
– –
– –
1,41
4,97
5 1,
414,
975
Inta
ngib
le a
sset
s –
– –
– –
– 15
2,54
1 15
2,54
1G
oodw
ill
– –
– –
– –
1,83
1,31
2 1,
831,
312
Def
erre
d ta
x as
sets
–
– –
– –
– 53
,067
53
,067
Tota
l ass
ets
23,0
77,
924
9,34
5,4
83
12,0
55,5
12
3,16
0,16
5 3,
507,
403
13
9,49
6,6
42
12,2
47,6
44
202,
890,
77
3
NoTES To ThE fINANCIAL STATEmENTSfoR ThE fINANCIAL yEAR ENdEd 30 JuNE 2018

222ANNUALREPORT2018
HONG LEONG BANK BERHAD
46
fIN
AN
CIA
L IN
STR
um
ENTS
(Co
NTI
Nu
Ed)
(c)
Liqu
idit
y ri
sk (
con
tin
ued)
Th
e ta
ble
belo
w a
naly
ses
the
carr
ying
am
ount
of
asse
ts a
nd l
iabi
litie
s (i
nclu
ding
non
-fina
ncia
l in
stru
men
ts)
as a
t 30
Jun
e 20
18 b
ased
on
the
rem
aini
ng
cont
ract
ual m
atur
ity: (
cont
inue
d)
Th
e g
roup
2018
u
p to
1
wee
k to
1
to 3
3
to 6
6
to 1
2 o
ver
1 N
o sp
ecifi
c
1 w
eek
1 m
onth
m
onth
s m
onth
s m
onth
s ye
ar
mat
urit
y To
tal
R
m’0
00
Rm
’000
R
m’0
00
Rm
’000
R
m’0
00
Rm
’000
R
m’0
00
Rm
’000
Liab
iliti
esD
epos
its f
rom
cus
tom
ers
58,5
79,3
87
24,8
48,
207
25,4
49,0
16
16,7
26,6
62
26,3
03,0
65
5,50
7,75
8 –
157,
414,
095
Dep
osits
and
pla
cem
ents
of
bank
s an
d ot
her
fin
anci
al in
stitu
tions
3,
499,
882
59
0,20
3 2,
867
,119
20
8,12
9 7
2,10
1 –
– 7,
237,
434
Obl
igat
ions
on
secu
ritie
s so
ld
unde
r re
purc
hase
agr
eem
ents
1,
594
751,
540
3,07
8,7
35
– –
– –
3,83
1,8
69Bi
lls a
nd a
ccep
tanc
es p
ayab
le
39,1
40
227,
138
28,1
08
26,1
82
– –
223,
883
54
4,45
1O
ther
liab
ilitie
s 4,
387,
338
– –
– 19
9,23
3 –
132,
875
4,71
9,4
46
Der
ivat
ive
finan
cial
inst
rum
ents
94
,76
4 11
7,33
6 10
9,29
2 20
4,69
6 82
,230
41
1,87
8 –
1,02
0,19
6Re
cour
se o
blig
atio
n on
loan
s so
ld t
o Ca
gam
as
– –
– –
– 20
2,95
2 –
202,
952
Tier
2 s
ubor
dina
ted
bond
s –
– –
– 2,
402
,50
9 50
0,39
9 –
2,9
02,9
08M
ulti-
curr
ency
Add
ition
al T
ier
1
Ca
pita
l Sec
uriti
es
– –
– –
– 4
01,1
92
– 4
01,1
92In
nova
tive
Tier
1 c
apita
l sec
uriti
es
– –
– –
– 51
2,35
2 –
512,
352
Taxa
tion
– –
– –
– –
211,
619
211,
619
Tota
l lia
bilit
ies
66,
602
,105
26
,534
,424
31
,532
,270
17
,165
,669
29
,059
,138
7,
536,
531
568,
377
178,
998
,514
Tota
l equ
ity
– –
– –
– –
23,8
92,2
59
23,8
92,2
59
Tota
l lia
bilit
ies
and
equi
ty
66,
602
,105
26
,534
,424
31
,532
,270
17
,165
,669
29
,059
,138
7,
536,
531
24,4
60,
636
202,
890,
77
3
Net
liqu
idit
y ga
p (4
3,52
4,18
1)
(17,
188,
941)
(1
9,47
6,75
8) (
14,0
05,5
04)
(25,
551,
735
) 13
1,96
0,11
1 11
,679
,267
23
,892
,259
NoTES To ThE fINANCIAL STATEmENTSfoR ThE fINANCIAL yEAR ENdEd 30 JuNE 2018

223ANNUALREPORT
2018
FINANCIALS46
fI
NA
NCI
AL
INST
Ru
mEN
TS (
CoN
TIN
uEd
)
(c)
Liqu
idit
y ri
sk (
con
tin
ued)
Th
e ta
ble
belo
w a
naly
ses
the
carr
ying
am
ount
of
asse
ts a
nd l
iabi
litie
s (i
nclu
ding
non
-fina
ncia
l in
stru
men
ts)
as a
t 30
Jun
e 20
17 b
ased
on
the
rem
aini
ng
cont
ract
ual m
atur
ity: (
cont
inue
d)
Th
e g
roup
2017
u
p to
1
wee
k to
1
to 3
3
to 6
6
to 1
2 o
ver
1 N
o sp
ecifi
c
1 w
eek
1 m
onth
m
onth
s m
onth
s m
onth
s ye
ar
mat
urit
y To
tal
R
m’0
00
Rm
’000
R
m’0
00
Rm
’000
R
m’0
00
Rm
’000
R
m’0
00
Rm
’000
Ass
ets
Cash
and
sho
rt-t
erm
fun
ds
10,6
86,3
87
136,
923
– –
– –
– 10
,823
,310
Dep
osits
and
pla
cem
ents
with
ban
ks
and
othe
r fin
anci
al in
stitu
tions
–
– 62
6,36
3 20
0,38
0 –
– –
826,
743
Secu
ritie
s pu
rcha
sed
unde
r
re
sale
agr
eem
ents
–
300,
880
– –
– –
– 30
0,88
0Fi
nanc
ial a
sset
s he
ld-f
or-t
radi
ng
1,55
0,72
2 60
2,83
5 1,
520,
395
371,
805
20,4
73
1,62
1,93
5 –
5,68
8,16
5Fi
nanc
ial i
nves
tmen
ts
av
aila
ble-
for-
sale
–
5,07
6 47
1,23
6 52
7,75
3 64
3,43
7 20
,199
,421
5,
807,
294
27,6
54,2
17Fi
nanc
ial i
nves
tmen
ts h
eld-
to-m
atur
ity
48
– 1,
073,
692
384,
880
141,
407
11,4
60,5
77
– 13
,060
,604
Loan
s, a
dvan
ces
and
finan
cing
10
,504
,859
5,
954,
327
6,66
4,06
6 2,
292,
636
616,
847
97,9
58,2
06
– 12
3,99
0,94
1O
ther
ass
ets
1,22
3,27
1 6,
896
10,7
02
14,4
61
6,17
7 18
,820
12
7,40
4 1,
407,
731
Der
ivat
ive
finan
cial
inst
rum
ents
64
,364
59
,284
14
4,84
4 53
,230
15
7,57
0 47
3,75
0 –
953,
042
Stat
utor
y de
posi
ts w
ith C
entr
al B
anks
–
– –
– –
– 3,
738,
230
3,73
8,23
0In
vest
men
t in
ass
ocia
ted
com
pani
es
– –
– –
– –
3,46
6,89
1 3,
466,
891
Inve
stm
ent
in jo
int
vent
ure
– –
– –
– –
169,
185
169,
185
Prop
erty
and
equ
ipm
ent
– –
– –
– –
1,42
3,09
7 1,
423,
097
Inta
ngib
le a
sset
s –
– –
– –
– 21
3,32
3 21
3,32
3G
oodw
ill
– –
– –
– –
1,83
1,31
2 1,
831,
312
Def
erre
d ta
x as
sets
–
– –
– –
– 4,
851
4,85
1
Tota
l ass
ets
24,0
29,6
51
7,06
6,22
1 10
,511
,298
3,
845,
145
1,58
5,91
1 13
1,73
2,70
9 16
,781
,587
19
5,55
2,52
2
NoTES To ThE fINANCIAL STATEmENTSfoR ThE fINANCIAL yEAR ENdEd 30 JuNE 2018

224ANNUALREPORT2018
HONG LEONG BANK BERHAD
46
fIN
AN
CIA
L IN
STR
um
ENTS
(Co
NTI
Nu
Ed)
(c)
Liqu
idit
y ri
sk (
con
tin
ued)
Th
e ta
ble
belo
w a
naly
ses
the
carr
ying
am
ount
of
asse
ts a
nd l
iabi
litie
s (i
nclu
ding
non
-fina
ncia
l in
stru
men
ts)
as a
t 30
Jun
e 20
17 b
ased
on
the
rem
aini
ng
cont
ract
ual m
atur
ity: (
cont
inue
d)
Th
e g
roup
2017
u
p to
1
wee
k to
1
to 3
3
to 6
6
to 1
2 o
ver
1 N
o sp
ecifi
c
1 w
eek
1 m
onth
m
onth
s m
onth
s m
onth
s ye
ar
mat
urit
y To
tal
R
m’0
00
Rm
’000
R
m’0
00
Rm
’000
R
m’0
00
Rm
’000
R
m’0
00
Rm
’000
Liab
iliti
esD
epos
its f
rom
cus
tom
ers
55,4
97,3
92
27,5
13,9
60
29,7
68,5
25
20,7
89,5
67
17,3
40,8
46
4,32
2,91
5 –
155,
233,
205
Dep
osits
and
pla
cem
ents
of
ba
nks
and
othe
r
finan
cial
inst
itutio
ns
1,83
5,22
6 1,
079,
129
1,55
4,58
9 98
3,33
1 34
,417
–
– 5,
486,
692
Obl
igat
ions
on
secu
ritie
s so
ld
unde
r re
purc
hase
agr
eem
ents
52
9,16
5 28
,251
1,
899,
275
372,
926
– –
– 2,
829,
617
Bills
and
acc
epta
nces
pay
able
27
0 57
,282
47
,464
15
,865
–
– 24
3,79
4 36
4,67
5O
ther
liab
ilitie
s 3,
825,
483
– –
– 17
0,45
9 –
56,7
25
4,05
2,66
7D
eriv
ativ
e fin
anci
al in
stru
men
ts
28,6
98
42,1
15
78,5
90
203,
734
274,
995
777,
520
– 1,
405,
652
Reco
urse
obl
igat
ion
on lo
ans
sold
to
Caga
mas
–
– –
– –
202,
926
– 20
2,92
6Ti
er 2
sub
ordi
nate
d bo
nds
– –
– –
– 2,
402,
145
– 2,
402,
145
Inno
vativ
e Ti
er 1
cap
ital s
ecur
ities
–
– –
– –
515,
623
– 51
5,62
3Ta
xatio
n –
– –
– –
– 20
1,71
3 20
1,71
3D
efer
red
tax
liabi
litie
s –
– -
– –
– 17
2,19
4 17
2,19
4
Tota
l lia
bil
itie
s 61
,716
,234
28
,720
,737
33
,348
,443
22
,365
,423
17
,820
,717
8,
221,
129
674,
426
172,
867,
109
Tota
l equ
ity
– –
– –
– –
22,6
85,4
13
22,6
85,4
13
Tota
l lia
bil
itie
s an
d eq
uit
y 61
,716
,234
28
,720
,737
33
,348
,443
22
,365
,423
17
,820
,717
8,
221,
129
23,3
59,8
39
195,
552,
522
Net
liqu
idit
y ga
p (3
7,68
6,58
3)
(21,
654,
516)
(2
2,83
7,14
5)
(18,
520,
278)
(1
6,23
4,80
6)
123,
511,
580
16,1
07,1
61
22,6
85,4
13
NoTES To ThE fINANCIAL STATEmENTSfoR ThE fINANCIAL yEAR ENdEd 30 JuNE 2018

225ANNUALREPORT
2018
FINANCIALS46
fI
NA
NCI
AL
INST
Ru
mEN
TS (
CoN
TIN
uEd
)
(c)
Liqu
idit
y ri
sk (
con
tin
ued)
Th
e ta
ble
belo
w a
naly
ses
the
carr
ying
am
ount
of
asse
ts a
nd l
iabi
litie
s (i
nclu
ding
non
-fina
ncia
l in
stru
men
ts)
as a
t 30
Jun
e 20
18 b
ased
on
the
rem
aini
ng
cont
ract
ual m
atur
ity: (
cont
inue
d)
Th
e B
ank
20
18
up
to
1 w
eek
to
1 to
3
3 to
6
6 to
12
ove
r 1
No
spec
ific
1
wee
k 1
mon
th
mon
ths
mon
ths
mon
ths
year
m
atur
ity
Tota
l
Rm
’000
R
m’0
00
Rm
’000
R
m’0
00
Rm
’000
R
m’0
00
Rm
’000
R
m’0
00
Ass
ets
Cash
and
sho
rt-t
erm
fun
ds
3,6
04,4
63
1,94
5,92
5 –
– –
– –
5,55
0,38
8D
epos
its a
nd p
lace
men
ts w
ith b
anks
an
d ot
her
finan
cial
inst
itutio
ns
– –
2,10
0,96
5 56
4,16
5 4
0,39
2 –
– 2,
705,
522
Fina
ncia
l ass
ets
held
-for
-tra
ding
4
00,
168
401
,418
1,
424,
652
150,
111
10,0
65
3,23
2,62
1 –
5,61
9,03
5Fi
nanc
ial i
nves
tmen
ts
av
aila
ble-
for-
sale
4,
603
,924
1,
109,
454
2,8
40,
482
22
0,33
3 1,
038,
398
18,7
38,4
77
467
,512
29
,018
,580
Fina
ncia
l inv
estm
ents
held
-to-
mat
urity
–
– 20
4,4
82
141,
135
1,04
9,4
60
9,51
1,4
88
– 10
,90
6,56
5Lo
ans,
adv
ance
s an
d fin
anci
ng
11,1
24,8
05
5,33
3,8
67
4,91
0,31
0 1,
567,
186
44
6,07
7 80
,892
,658
–
104,
274,
903
Oth
er a
sset
s 51
6,82
8 4,
922
9,18
6 11
,229
4,
571
16,2
02
123,
758
68
6,69
6D
eriv
ativ
e fin
anci
al in
stru
men
ts
32,0
61
67,7
92
226,
287
167,
365
76,1
60
363,
261
– 93
2,92
6A
mou
nt d
ue f
rom
sub
sidi
arie
s –
– –
– –
– 43
,563
43
,563
Stat
utor
y de
posi
ts w
ith
Ce
ntra
l Ban
ks
– –
– –
– –
3,45
3,01
7 3,
453,
017
Subs
idia
ry c
ompa
nies
–
– –
– –
– 2,
157,
132
2,15
7,13
2In
vest
men
t in
ass
ocia
ted
com
pani
es
– –
– –
– –
946,
525
946,
525
Inve
stm
ent
in jo
int
vent
ure
– –
– –
– –
76,7
11
76,7
11Pr
oper
ty a
nd e
quip
men
t –
– –
– –
– 78
2,85
3 78
2,85
3In
tang
ible
ass
ets
– –
– –
– –
137,
166
137,
166
Goo
dwill
–
– –
– –
– 1,
771
,547
1,
771
,547
Def
erre
d ta
x as
sets
–
– –
– –
– 47
,908
47
,908
Tota
l ass
ets
20,2
82,2
49
8,8
63,3
78
11,7
16,3
64
2,82
1,52
4 2,
665
,123
11
2,75
4,70
7 10
,007
,692
16
9,11
1,03
7
NoTES To ThE fINANCIAL STATEmENTSfoR ThE fINANCIAL yEAR ENdEd 30 JuNE 2018
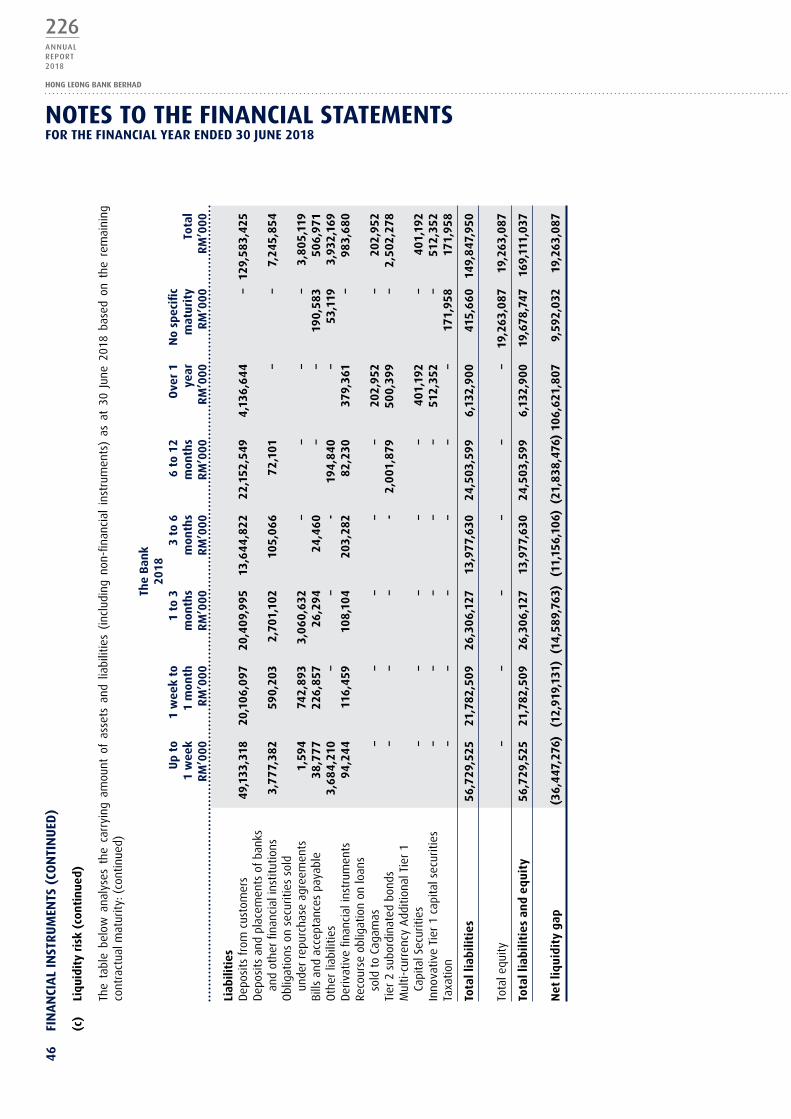
226ANNUALREPORT2018
HONG LEONG BANK BERHAD
46
fIN
AN
CIA
L IN
STR
um
ENTS
(Co
NTI
Nu
Ed)
(c)
Liqu
idit
y ri
sk (
con
tin
ued)
Th
e ta
ble
belo
w a
naly
ses
the
carr
ying
am
ount
of
asse
ts a
nd l
iabi
litie
s (i
nclu
ding
non
-fina
ncia
l in
stru
men
ts)
as a
t 30
Jun
e 20
18 b
ased
on
the
rem
aini
ng
cont
ract
ual m
atur
ity: (
cont
inue
d)
Th
e B
ank
20
18
up
to
1 w
eek
to
1 to
3
3 to
6
6 to
12
ove
r 1
No
spec
ific
1
wee
k 1
mon
th
mon
ths
mon
ths
mon
ths
year
m
atur
ity
Tota
l
Rm
’000
R
m’0
00
Rm
’000
R
m’0
00
Rm
’000
R
m’0
00
Rm
’000
R
m’0
00
Liab
iliti
esD
epos
its f
rom
cus
tom
ers
49,1
33,3
18
20,1
06,
097
20
,40
9,9
95
13,6
44,
822
22,1
52,5
49
4,13
6,6
44
– 12
9,58
3,42
5D
epos
its a
nd p
lace
men
ts o
f ba
nks
an
d ot
her
finan
cial
inst
itutio
ns
3,7
77,
382
590,
203
2,70
1,10
2 10
5,0
66
72,
101
– –
7,24
5,85
4O
blig
atio
ns o
n se
curit
ies
sold
un
der
repu
rcha
se a
gree
men
ts
1,59
4 74
2,89
3 3,
06
0,63
2 –
– –
– 3,
805,
119
Bills
and
acc
epta
nces
pay
able
38
,77
7 22
6,85
7 26
,294
24
,46
0 –
– 19
0,58
3 50
6,97
1O
ther
liab
ilitie
s 3,
68
4,21
0 –
– -
194,
84
0 –
53,1
19
3,93
2,16
9D
eriv
ativ
e fin
anci
al in
stru
men
ts
94,2
44
116,
459
108,
104
203,
282
82,2
30
379,
361
– 98
3,6
80Re
cour
se o
blig
atio
n on
loan
s
so
ld t
o Ca
gam
as
– –
– –
– 20
2,95
2 –
202,
952
Tier
2 s
ubor
dina
ted
bond
s –
– –
- 2,
001
,879
50
0,39
9 –
2,50
2,27
8M
ulti-
curr
ency
Add
ition
al T
ier
1
Ca
pita
l Sec
uriti
es
– –
– –
– 4
01,1
92
– 4
01,1
92In
nova
tive
Tier
1 c
apita
l sec
uriti
es
– –
– –
– 51
2,35
2 –
512,
352
Taxa
tion
– –
– –
– –
171,
958
171,
958
Tota
l lia
bil
itie
s 56
,729
,525
21
,782
,50
9 26
,30
6,12
7 13
,97
7,63
0 24
,503
,59
9 6,
132,
90
0 41
5,6
60
149,
847
,950
Tota
l equ
ity
– –
– –
– –
19,2
63,0
87
19,2
63,0
87
Tota
l lia
bil
itie
s an
d eq
uit
y 56
,729
,525
21
,782
,50
9 26
,30
6,12
7 13
,97
7,63
0 24
,503
,59
9 6,
132,
90
0 19
,678
,747
16
9,11
1,03
7
Net
liq
uid
ity
gap
(3
6,4
47,2
76)
(12,
919,
131)
(1
4,58
9,76
3)
(11,
156,
106)
(21
,838
,476
) 10
6,62
1,80
7 9,
592,
032
19,2
63,0
87
NoTES To ThE fINANCIAL STATEmENTSfoR ThE fINANCIAL yEAR ENdEd 30 JuNE 2018

227ANNUALREPORT
2018
FINANCIALS46
fI
NA
NCI
AL
INST
Ru
mEN
TS (
CoN
TIN
uEd
)
(c)
Liqu
idit
y ri
sk (
con
tin
ued)
Th
e ta
ble
belo
w a
naly
ses
the
carr
ying
am
ount
of
asse
ts a
nd l
iabi
litie
s (i
nclu
ding
non
-fina
ncia
l in
stru
men
ts)
as a
t 30
Jun
e 20
17 b
ased
on
the
rem
aini
ng
cont
ract
ual m
atur
ity: (
cont
inue
d)
Th
e B
ank
20
17
up
to
1 w
eek
to
1 to
3
3 to
6
6 to
12
ove
r 1
No
spec
ific
1
wee
k 1
mon
th
mon
ths
mon
ths
mon
ths
year
m
atur
ity
Tota
l
Rm
’000
R
m’0
00
Rm
’000
R
m’0
00
Rm
’000
R
m’0
00
Rm
’000
R
m’0
00
Ass
ets
Cash
and
sho
rt-t
erm
fun
ds
9,69
9,56
4 49
9,63
0 –
– –
– –
10,1
99,1
94D
epos
its a
nd p
lace
men
ts w
ith b
anks
an
d ot
her
finan
cial
inst
itutio
ns
– –
293,
650
100,
014
– –
– 39
3,66
4Se
curit
ies
purc
hase
d un
der
resa
le a
gree
men
ts
– 30
0,88
0 –
– –
– –
300,
880
Fina
ncia
l ass
ets
held
-for
-tra
ding
1,
900,
702
503,
014
1,35
1,66
9 37
1,80
5 20
,473
1,
257,
647
– 5,
405,
310
Fina
ncia
l inv
estm
ents
avai
labl
e-fo
r-sa
le
– 5,
076
456,
086
381,
760
587,
787
17,6
48,2
77
5,80
7,29
4 24
,886
,280
Fina
ncia
l inv
estm
ents
held
-to-
mat
urity
48
–
952,
371
384,
880
141,
407
8,93
0,08
7 –
10,4
08,7
93Lo
ans,
adv
ance
s an
d fin
anci
ng
9,24
6,87
5 5,
291,
056
5,97
1,56
2 2,
081,
208
477,
702
79,4
70,1
47
– 10
2,53
8,55
0O
ther
ass
ets
1,15
7,33
6 6,
777
10,5
02
14,1
85
6,17
1 16
,524
97
,844
1,
309,
339
Der
ivat
ive
finan
cial
inst
rum
ents
63
,817
57
,557
14
4,13
1 53
,097
15
7,16
4 47
1,81
7 –
947,
583
Am
ount
due
fro
m s
ubsi
diar
ies
– –
– –
– –
13,4
84
13,4
84St
atut
ory
depo
sits
with
Cen
tral
Ban
ks
– –
– –
– –
2,98
6,54
7 2,
986,
547
Subs
idia
ry c
ompa
nies
–
– –
– –
– 1,
662,
409
1,66
2,40
9In
vest
men
t in
ass
ocia
ted
com
pani
es
– –
– –
– –
946,
525
946,
525
Inve
stm
ent
in jo
int
vent
ure
– –
– –
– –
76,7
11
76,7
11Pr
oper
ty a
nd e
quip
men
t –
– –
– –
– 77
4,99
9 77
4,99
9In
tang
ible
ass
ets
– –
– –
– –
194,
870
194,
870
Goo
dwill
–
– –
– –
– 1,
771,
547
1,77
1,54
7
Tota
l ass
ets
22,0
68,3
42
6,66
3,99
0 9,
179,
971
3,38
6,94
9 1,
390,
704
107,
794,
499
14,3
32,2
30
164,
816,
685
NoTES To ThE fINANCIAL STATEmENTSfoR ThE fINANCIAL yEAR ENdEd 30 JuNE 2018

228ANNUALREPORT2018
HONG LEONG BANK BERHAD
46
fIN
AN
CIA
L IN
STR
um
ENTS
(Co
NTI
Nu
Ed)
(c)
Liqu
idit
y ri
sk (
con
tin
ued)
Th
e ta
ble
belo
w a
naly
ses
the
carr
ying
am
ount
of
asse
ts a
nd l
iabi
litie
s (i
nclu
ding
non
-fina
ncia
l in
stru
men
ts)
as a
t 30
Jun
e 20
17 b
ased
on
the
rem
aini
ng
cont
ract
ual m
atur
ity: (
cont
inue
d)
Th
e B
ank
20
17
up
to
1 w
eek
to
1 to
3
3 to
6
6 to
12
ove
r 1
No
spec
ific
1
wee
k 1
mon
th
mon
ths
mon
ths
mon
ths
year
m
atur
ity
Tota
l
Rm
’000
R
m’0
00
Rm
’000
R
m’0
00
Rm
’000
R
m’0
00
Rm
’000
R
m’0
00
Liab
iliti
esD
epos
its f
rom
cus
tom
ers
46,5
69,6
08
23,4
13,3
05
24,5
00,8
47
18,0
22,0
27
13,9
34,8
23
3,41
8,79
3 –
129,
859,
403
Dep
osits
and
pla
cem
ents
of
bank
s
and
othe
r fin
anci
al in
stitu
tions
1,
952,
922
988,
552
1,50
0,85
4 98
3,33
1 34
,417
–
– 5,
460,
076
Obl
igat
ions
on
secu
ritie
s so
ld
unde
r re
purc
hase
agr
eem
ents
52
9,16
5 –
1,89
9,27
5 37
2,92
6 –
– –
2,80
1,36
6Bi
lls a
nd a
ccep
tanc
es p
ayab
le
246
57,0
95
46,2
23
14,8
70
– –
230,
407
348,
841
Oth
er li
abili
ties
3,26
2,29
1 –
– –
165,
880
– 47
,518
3,
475,
689
Der
ivat
ive
finan
cial
inst
rum
ents
28
,696
40
,399
78
,505
20
3,72
6 27
4,50
7 73
7,82
1 –
1,36
3,65
4Re
cour
se o
blig
atio
n on
loan
s so
ld
to
Cag
amas
–
– –
– –
202,
926
– 20
2,92
6Ti
er 2
sub
ordi
nate
d bo
nds
– –
– –
– 2,
001,
642
– 2,
001,
642
Inno
vativ
e Ti
er 1
cap
ital s
ecur
ities
–
– –
– –
515,
623
– 51
5,62
3Ta
xatio
n –
– –
– –
– 17
3,95
3 17
3,95
3D
efer
red
tax
liabi
litie
s –
– –
– –
– 17
1,13
1 17
1,13
1
Tota
l lia
bil
itie
s 52
,342
,928
24
,499
,351
28
,025
,704
19
,596
,880
14
,409
,627
6,
876,
805
623,
009
146,
374,
304
Tota
l equ
ity
– –
– –
– –
18,4
42,3
81
18,4
42,3
81
Tota
l lia
bil
itie
s an
d eq
uit
y 52
,342
,928
24
,499
,351
28
,025
,704
19
,596
,880
14
,409
,627
6,
876,
805
19,0
65,3
90
164,
816,
685
Net
liqu
idit
y ga
p (3
0,27
4,58
6)
(17,
835,
361)
(1
8,84
5,73
3)
(16,
209,
931)
(1
3,01
8,92
3)
100,
917,
694
13,7
09,2
21
18,4
42,3
81
NoTES To ThE fINANCIAL STATEmENTSfoR ThE fINANCIAL yEAR ENdEd 30 JuNE 2018
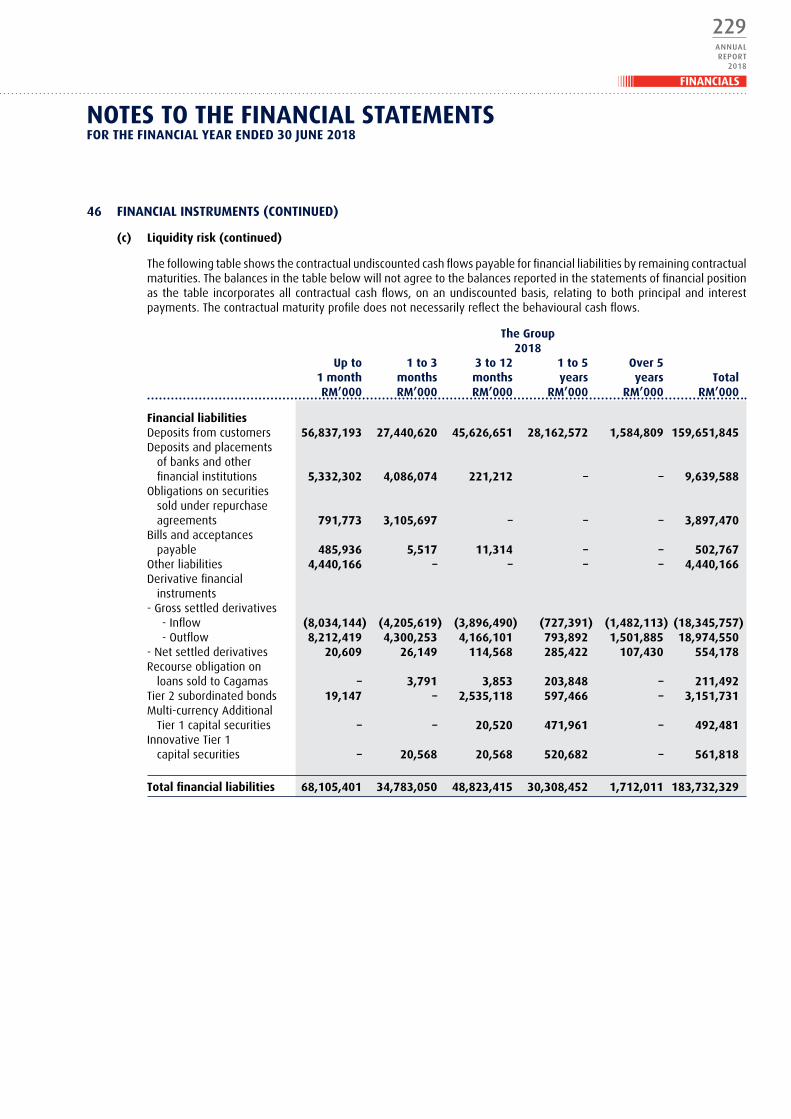
229ANNUALREPORT
2018
FINANCIALS
46 fINANCIAL INSTRumENTS (CoNTINuEd)
(c) Liquidity risk (continued)
The following table shows the contractual undiscounted cash flows payable for financial liabilities by remaining contractual maturities. The balances in the table below will not agree to the balances reported in the statements of financial position as the table incorporates all contractual cash flows, on an undiscounted basis, relating to both principal and interest payments. The contractual maturity profile does not necessarily reflect the behavioural cash flows.
The group 2018
up to 1 to 3 3 to 12 1 to 5 over 5 1 month months months years years Total Rm’000 Rm’000 Rm’000 Rm’000 Rm’000 Rm’000
financial liabilities Deposits from customers 56,837,193 27,440,620 45,626,651 28,162,572 1,584,809 159,651,845Deposits and placements of banks and other financial institutions 5,332,302 4,086,074 221,212 – – 9,639,588Obligations on securities sold under repurchase agreements 791,773 3,105,697 – – – 3,897,470Bills and acceptances payable 485,936 5,517 11,314 – – 502,767Other liabilities 4,440,166 – – – – 4,440,166Derivative financial instruments- Gross settled derivatives
- Inflow (8,034,144) (4,205,619) (3,896,490) (727,391) (1,482,113) (18,345,757)- Outflow 8,212,419 4,300,253 4,166,101 793,892 1,501,885 18,974,550
- Net settled derivatives 20,609 26,149 114,568 285,422 107,430 554,178Recourse obligation on loans sold to Cagamas – 3,791 3,853 203,848 – 211,492Tier 2 subordinated bonds 19,147 – 2,535,118 597,466 – 3,151,731Multi-currency Additional Tier 1 capital securities – – 20,520 471,961 – 492,481Innovative Tier 1 capital securities – 20,568 20,568 520,682 – 561,818
Total financial liabilities 68,105,401 34,783,050 48,823,415 30,308,452 1,712,011 183,732,329
NoTES To ThE fINANCIAL STATEmENTSfoR ThE fINANCIAL yEAR ENdEd 30 JuNE 2018

230ANNUALREPORT2018
HONG LEONG BANK BERHAD
46 fINANCIAL INSTRumENTS (CoNTINuEd)
(c) Liquidity risk (continued)
The following table shows the contractual undiscounted cash flows payable for financial liabilities by remaining contractual maturities. The balances in the table below will not agree to the balances reported in the statements of financial position as the table incorporates all contractual cash flows, on an undiscounted basis, relating to both principal and interest payments. The contractual maturity profile does not necessarily reflect the behavioural cash flows. (continued)
The group 2017
up to 1 to 3 3 to 12 1 to 5 over 5 1 month months months years years Total Rm’000 Rm’000 Rm’000 Rm’000 Rm’000 Rm’000
financial liabilities Deposits from customers 83,202,914 30,144,990 38,617,452 3,693,534 1,255,188 156,914,078Deposits and placements of banks and other financial institutions 3,753,776 3,039,855 164,300 – – 6,957,931Obligations on securities sold under repurchase agreements 28,251 2,427,391 388,132 – – 2,843,774Bills and acceptances payable 297,817 26,867 2,501 – – 327,185Other liabilities 3,830,510 – – – – 3,830,510Derivative financial instruments- Gross settled derivatives
- Inflow (3,729,159) (2,377,441) (8,265,623) (2,310,471) (1,683,057) (18,365,751)- Outflow 3,770,397 2,456,719 8,757,402 2,680,188 1,705,165 19,369,871
- Net settled derivatives 25,490 27,218 165,119 391,031 66,290 675,148Recourse obligation on loans sold to Cagamas – 3,791 3,853 211,486 – 219,130Tier 2 subordinated bonds – – 110,779 2,510,951 – 2,621,730Innovative Tier 1 capital securities – 20,908 20,568 561,818 – 603,294
Total financial liabilities 91,179,996 35,770,298 39,964,483 7,738,537 1,343,586 175,996,900
NoTES To ThE fINANCIAL STATEmENTSfoR ThE fINANCIAL yEAR ENdEd 30 JuNE 2018

231ANNUALREPORT
2018
FINANCIALS
46 fINANCIAL INSTRumENTS (CoNTINuEd)
(c) Liquidity risk (continued)
The following table shows the contractual undiscounted cash flows payable for financial liabilities by remaining contractual maturities. The balances in the table below will not agree to the balances reported in the statements of financial position as the table incorporates all contractual cash flows, on an undiscounted basis, relating to both principal and interest payments. The contractual maturity profile does not necessarily reflect the behavioural cash flows. (continued)
The Bank 2018
up to 1 to 3 3 to 12 1 to 5 over 5 1 month months months years years Total Rm’000 Rm’000 Rm’000 Rm’000 Rm’000 Rm’000
financial liabilities Deposits from customers 42,832,078 22,052,579 38,274,239 27,388,084 711,595 131,258,575Deposits and placements of banks and other financial institutions 4,684,259 3,773,428 178,392 – – 8,636,079Obligations on securities sold under repurchase agreements 783,126 3,087,594 – – – 3,870,720Bills and acceptances payable 452,289 5,246 10,793 – – 468,328Other liabilities 3,724,286 – – – – 3,724,286Derivative financial instruments- Gross settled derivatives
- Inflow (7,866,195) (4,053,926) (3,863,512) (727,391) (1,482,113) (17,993,137)- Outflow 8,043,608 4,145,406 4,131,774 793,892 1,501,885 18,616,565
- Net settled derivatives 21,294 27,508 120,339 232,981 101,356 503,478Recourse obligation on loans sold to Cagamas – 3,791 3,853 203,848 – 211,492Tier 2 subordinated bonds – – 2,115,971 597,466 – 2,713,437Multi-currency Additional Tier 1 capital securities – – 20,520 471,961 – 492,481Innovative Tier 1 capital securities – 20,568 20,568 520,682 – 561,818
Total financial liabilities 52,674,745 29,062,194 41,012,937 29,481,523 832,723 153,064,122
NoTES To ThE fINANCIAL STATEmENTSfoR ThE fINANCIAL yEAR ENdEd 30 JuNE 2018

232ANNUALREPORT2018
HONG LEONG BANK BERHAD
46 fINANCIAL INSTRumENTS (CoNTINuEd)
(c) Liquidity risk (continued)
The following table shows the contractual undiscounted cash flows payable for financial liabilities by remaining contractual maturities. The balances in the table below will not agree to the balances reported in the statements of financial position as the table incorporates all contractual cash flows, on an undiscounted basis, relating to both principal and interest payments. The contractual maturity profile does not necessarily reflect the behavioural cash flows. (continued)
The Bank 2017
up to 1 to 3 3 to 12 1 to 5 over 5 1 month months months years years Total Rm’000 Rm’000 Rm’000 Rm’000 Rm’000 Rm’000
financial liabilities Deposits from customers 69,660,461 24,776,257 32,323,110 3,316,225 513,054 130,589,107Deposits and placements of banks and other financial institutions 3,041,178 3,032,043 164,300 – – 6,237,521Obligations on securities sold under repurchase agreements – 2,427,391 388,132 – – 2,815,523Bills and acceptances payable 284,433 26,867 2,501 – – 313,801Other liabilities 3,290,832 – – – – 3,290,832Derivative financial instruments- Gross settled derivatives
- Inflow (3,602,915) (2,262,798) (8,265,185) (2,310,471) (1,683,057) (18,124,426)- Outflow 3,642,483 2,340,137 8,756,953 2,680,188 1,705,165 19,124,926
- Net settled derivatives 24,288 31,047 169,466 371,864 38,992 635,657Recourse obligation on loans sold to Cagamas – 3,791 3,853 211,486 – 219,130Tier 2 subordinated bonds – – 91,632 2,091,804 – 2,183,436Innovative Tier 1 capital securities – 20,908 20,568 561,818 – 603,294
Total financial liabilities 76,340,760 30,395,643 33,655,330 6,922,914 574,154 147,888,801
The following table presents the contractual expiry by maturity of the Group’s and Bank’s commitments and contingencies:
Less than over The group 1 year 1 year Total 2018 Rm’000 Rm’000 Rm’000
Direct credit substitutes 57,374 50,967 108,341Short-term self liquidating trade related contingencies 508,048 – 508,048Irrevocable commitments to extend credit 16,074,688 14,301,856 30,376,544Unutilised credit card lines 6,908,565 – 6,908,565
Total commitments and contingencies 23,548,675 14,352,823 37,901,498
2017
Direct credit substitutes 31,628 50,157 81,785Short-term self liquidating trade related contingencies 433,912 47,352 481,264Irrevocable commitments to extend credit 16,097,927 13,257,147 29,355,074Unutilised credit card lines 7,001,256 – 7,001,256
Total commitments and contingencies 23,564,723 13,354,656 36,919,379
NoTES To ThE fINANCIAL STATEmENTSfoR ThE fINANCIAL yEAR ENdEd 30 JuNE 2018

233ANNUALREPORT
2018
FINANCIALS
46 fINANCIAL INSTRumENTS (CoNTINuEd)
(c) Liquidity risk (continued)
The following table presents the contractual expiry by maturity of the Group’s and Bank’s commitments and contingencies: (continued)
Less than over The Bank 1 year 1 year Total 2018 Rm’000 Rm’000 Rm’000
Direct credit substitutes 50,361 – 50,361Short-term self liquidating trade related contingencies 477,667 – 477,667Irrevocable commitments to extend credit 14,108,380 10,410,497 24,518,877Unutilised credit card lines 6,908,565 – 6,908,565
Total commitments and contingencies 21,544,973 10,410,497 31,955,470
2017
Direct credit substitutes 28,230 157 28,387Short-term self liquidating trade related contingencies 398,680 47,352 446,032Irrevocable commitments to extend credit 14,562,467 9,601,053 24,163,520Unutilised credit card lines 7,001,256 – 7,001,256
Total commitments and contingencies 21,990,633 9,648,562 31,639,195
Undrawn loan commitments are recognised at activation stage and include commitments which are unconditionally cancellable by the Group and the Bank. The Group and the Bank expect that not all of the contingent liabilities and undrawn loan commitments will be drawn before expiry.
(d) Credit risk
(i) Maximum exposure to credit risk
The maximum exposure to credit risk for financial assets recognised in the statements of financial position is their carrying amounts. For contingent liabilities, the maximum exposure to credit risk is the maximum amount that the Group and the Bank would have to pay if the obligations of the instruments issued are called upon. For credit commitments, the maximum exposure to credit risk is the full amount of the undrawn credit facilities granted to customers. The table below shows the maximum exposure to credit risk for the Group and the Bank:
The group 2018 2017 Rm’000 Rm’000
Credit risk exposure relating to on-balance sheet assets:
Short-term funds and placements with banks and other financial institutions (exclude cash in hand) 7,427,607 9,956,192
Securities purchased under resale agreements – 300,880Financial assets and investments portfolios (exclude shares, and wholesale fund):
- Financial assets held-for-trading 5,969,872 5,688,165 - Financial investments available-for-sale 24,294,684 21,846,485 - Financial investments held-to-maturity 14,436,458 13,060,070
Loans, advances and financing 128,059,105 123,990,941Other assets 666,905 1,295,179Derivative assets 918,067 953,042
Credit risk exposure relating to off-balance sheet items:
Credit related commitments and contingencies 37,901,498 36,919,379
Total maximum credit risk exposure 219,674,196 214,010,333
NoTES To ThE fINANCIAL STATEmENTSfoR ThE fINANCIAL yEAR ENdEd 30 JuNE 2018
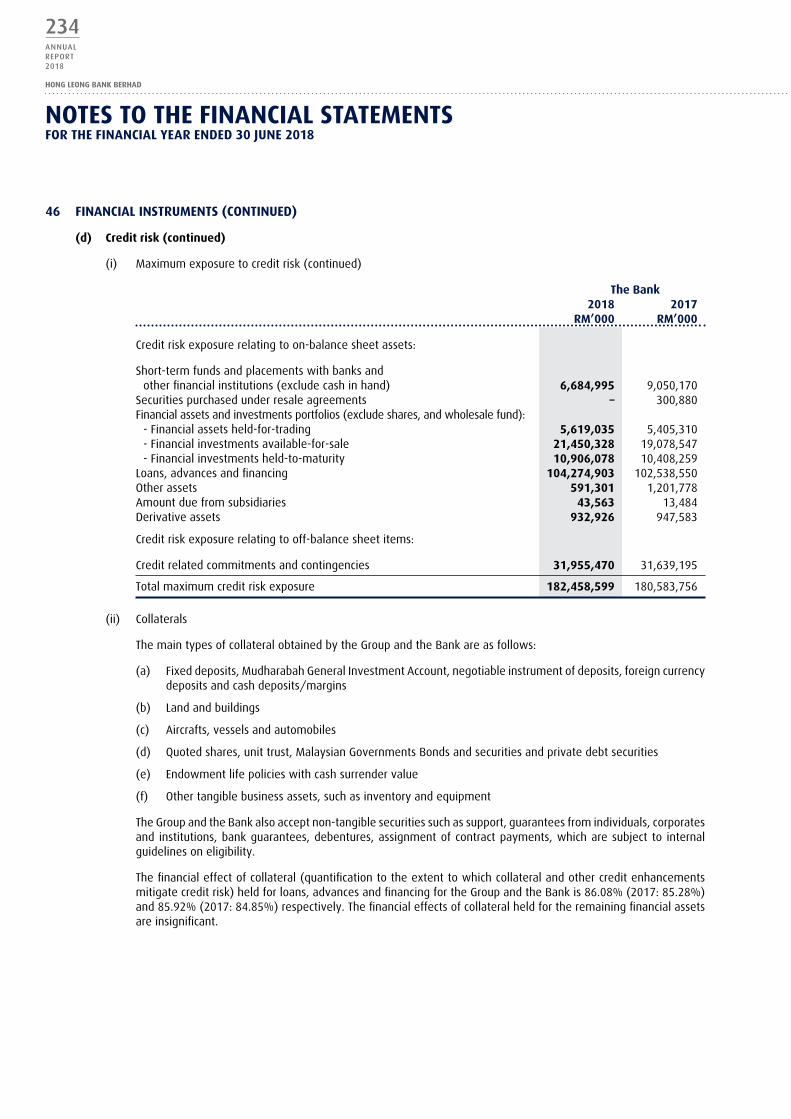
234ANNUALREPORT2018
HONG LEONG BANK BERHAD
46 fINANCIAL INSTRumENTS (CoNTINuEd)
(d) Credit risk (continued)
(i) Maximum exposure to credit risk (continued)
The Bank 2018 2017 Rm’000 Rm’000
Credit risk exposure relating to on-balance sheet assets:
Short-term funds and placements with banks and other financial institutions (exclude cash in hand) 6,684,995 9,050,170
Securities purchased under resale agreements – 300,880Financial assets and investments portfolios (exclude shares, and wholesale fund):
- Financial assets held-for-trading 5,619,035 5,405,310 - Financial investments available-for-sale 21,450,328 19,078,547 - Financial investments held-to-maturity 10,906,078 10,408,259
Loans, advances and financing 104,274,903 102,538,550Other assets 591,301 1,201,778Amount due from subsidiaries 43,563 13,484Derivative assets 932,926 947,583
Credit risk exposure relating to off-balance sheet items:
Credit related commitments and contingencies 31,955,470 31,639,195
Total maximum credit risk exposure 182,458,599 180,583,756
(ii) Collaterals
The main types of collateral obtained by the Group and the Bank are as follows:
(a) Fixed deposits, Mudharabah General Investment Account, negotiable instrument of deposits, foreign currency deposits and cash deposits/margins
(b) Land and buildings
(c) Aircrafts, vessels and automobiles
(d) Quoted shares, unit trust, Malaysian Governments Bonds and securities and private debt securities
(e) Endowment life policies with cash surrender value
(f) Other tangible business assets, such as inventory and equipment
The Group and the Bank also accept non-tangible securities such as support, guarantees from individuals, corporates and institutions, bank guarantees, debentures, assignment of contract payments, which are subject to internal guidelines on eligibility.
The financial effect of collateral (quantification to the extent to which collateral and other credit enhancements mitigate credit risk) held for loans, advances and financing for the Group and the Bank is 86.08% (2017: 85.28%) and 85.92% (2017: 84.85%) respectively. The financial effects of collateral held for the remaining financial assets are insignificant.
NoTES To ThE fINANCIAL STATEmENTSfoR ThE fINANCIAL yEAR ENdEd 30 JuNE 2018

235ANNUALREPORT
2018
FINANCIALS
46 fINANCIAL INSTRumENTS (CoNTINuEd)
(d) Credit risk (continued)
(iii) Credit quality
The Group and the Bank assess credit quality of loans, advances and financing using internal rating techniques tailored to the various categories of products and counterparties. These techniques have been developed internally and combine statistical analysis with credit officers judgement.
The credit quality of financial assets other than loans, advances and financing are determined based on the ratings of counterparties as defined by Moody’s or equivalent ratings of other internationals rating agencies as defined below:
- AAA to AA3 - A1 to A3 - Baa1 to Baa3 - P1 to P3
(a) Loans, advances and financing
Loans, advances and financing are summarised as follows:
The group The Bank 2018 2017 2018 2017 Rm’000 Rm’000 Rm’000 Rm’000
Neither past due nor impaired 120,421,480 116,427,519 98,499,230 96,710,351Past due but not impaired 7,521,578 7,515,545 5,673,643 5,787,961Individually impaired 1,125,502 1,203,440 906,233 1,017,982
Gross loans, advances and financing 129,068,560 125,146,504 105,079,106 103,516,294
Fair value changes arising from fair value hedges (2,540) (34) (2,540) (34)
Unamortised fair value changes arising from terminated fair value hedges (13) (36) – –
Less : Allowance for impaired loans, advances and financing - Individual assessment allowance (202,176) (325,426) (179,969) (310,923) - Collective assessment allowance (804,726) (830,067) (621,694) (666,787)
Net loans, advances and financing 128,059,105 123,990,941 104,274,903 102,538,550
NoTES To ThE fINANCIAL STATEmENTSfoR ThE fINANCIAL yEAR ENdEd 30 JuNE 2018

236ANNUALREPORT2018
HONG LEONG BANK BERHAD
46 fINANCIAL INSTRumENTS (CoNTINuEd)
(d) Credit risk (continued)
(iii) Credit quality (continued)
(a) Loans, advances and financing (continued)
(i) Loans, advances and financing neither past due nor impaired
Analysis of loans, advances and financing that are neither past due nor impaired analysed based on the Group’s and the Bank’s credit grading system is as follows:
The group The Bank 2018 2017 2018 2017 Rm’000 Rm’000 Rm’000 Rm’000
Consumer loans/financing
Risk GradeGood 87,563,208 84,893,412 71,404,614 70,208,652Weakest 423,168 408,017 395,202 395,815
87,986,376 85,301,429 71,799,816 70,604,467
Corporates loans/financing
Risk Grade Credit QualityA Exceptional 790,832 979,207 376,621 620,572B+ Superior 3,419,183 3,286,343 2,497,509 2,107,371B Excellent 4,924,645 5,105,050 4,166,425 4,372,311B- Strong 6,504,184 5,987,873 5,567,254 5,117,836C+ Good 6,385,261 5,179,776 5,105,759 4,451,494C Satisfactory 6,507,306 6,769,870 5,240,671 5,765,541C- Fair 2,941,250 2,790,420 2,871,616 2,759,077D+ Adequate 502,313 508,591 457,534 426,452D Marginal 163,024 189,345 134,668 183,846Un-graded 297,106 329,615 281,357 301,384
32,435,104 31,126,090 26,699,414 26,105,884
Total neither past due nor impaired 120,421,480 116,427,519 98,499,230 96,710,351
NoTES To ThE fINANCIAL STATEmENTSfoR ThE fINANCIAL yEAR ENdEd 30 JuNE 2018

237ANNUALREPORT
2018
FINANCIALS
46 fINANCIAL INSTRumENTS (CoNTINuEd)
(d) Credit risk (continued)
(iii) Credit quality (continued)
(a) Loans, advances and financing (continued)
(ii) Loans, advances and financing past due but not impaired
A financial asset is defined as “past due” when the counterparty has failed to make a principal or interest payment when contractually due.
Loans, advances and financing less than 90 days past due are not considered impaired, unless other information is available to indicate the contrary. Gross amount of loans, advances and financing by class to customers that were past due but not impaired were as follows:
The group The Bank 2018 2017 2018 2017 Rm’000 Rm’000 Rm’000 Rm’000
Past due less than 30 days 5,239,218 5,130,954 4,037,213 3,978,685Past due 30 to less than 60 days 1,595,500 1,667,456 1,158,107 1,265,428Past due 60 to less than 90 days 686,860 717,135 478,323 543,848
Past due but not impaired 7,521,578 7,515,545 5,673,643 5,787,961
(iii) Loans, advances and financing that are determined to be impaired as at 30 June 2018 and 30 June 2017 are as follows:
The group The Bank 2018 2017 2018 2017 Rm’000 Rm’000 Rm’000 Rm’000
Gross amount of impaired loans 1,125,502 1,203,440 906,233 1,017,982Less: Individual assessment
impairment allowance (202,176) (325,426) (179,969) (310,923)Less: Collective assessment
impairment allowance (171,338) (215,618) (128,122) (170,759)
Total net amount impaired loans 751,988 662,396 598,142 536,300
NoTES To ThE fINANCIAL STATEmENTSfoR ThE fINANCIAL yEAR ENdEd 30 JuNE 2018

238ANNUALREPORT2018
HONG LEONG BANK BERHAD
46 fINANCIAL INSTRumENTS (CoNTINuEd)
(d) Credit risk (continued)
(iii) Credit quality (continued)
(b) Other financial assets
Analysis of other financial assets by rating agency designation (where applicable) as at 30 June 2018, based on Moody’s ratings or its equivalent are as follows:
Short-term funds and deposits and placements with banks Securities financial financial financial and other purchased assets investments investments financial under resale held-for- available- held-to- other derivative The group institutions* agreements^ trading# for-sale# maturity# assets assets 2018 Rm’000 Rm’000 Rm’000 Rm’000 Rm’000 Rm’000 Rm’000
Neither past due nor impaired
AAA to AA3 615,596 – 2,179,626 9,189,187 437,936 – 260,413A1 to A3 5,834,635 – 512,023 2,069,712 – – 319,354Baa1 to Baa3 279,441 – – 262,108 – – 66,900P1 to P3 – – – – – – –Non-rated 697,935 – 3,278,223 12,773,677 13,998,522 666,905 271,400
7,427,607 – 5,969,872 24,294,684 14,436,458 666,905 918,067
The amount of short-term funds and deposits and placements with banks and other financial institutions, securities purchased under resale agreements, financial assets and investment portfolios, other assets and derivative assets that are past due but not impaired is not material.
* Placements with banks and other financial institutions with no ratings mainly comprise placements with BNM.
^ Comprises securities purchased under resale agreements with local financial institutions.# Securities with no ratings consist of government securities.
NoTES To ThE fINANCIAL STATEmENTSfoR ThE fINANCIAL yEAR ENdEd 30 JuNE 2018

239ANNUALREPORT
2018
FINANCIALS
46 fINANCIAL INSTRumENTS (CoNTINuEd)
(d) Credit risk (continued)
(iii) Credit quality (continued)
(b) Other financial assets (continued)
Analysis of other financial assets by rating agency designation (where applicable) as at 30 June 2017, based on Moody’s ratings or its equivalent are as follows:
Short-term funds and deposits and placements with banks Securities financial financial financial and other purchased assets investments investments financial under resale held-for- available- held-to- other derivative The group institutions* agreements^ trading# for-sale# maturity# assets assets 2017 Rm’000 Rm’000 Rm’000 Rm’000 Rm’000 Rm’000 Rm’000
Neither past due nor impaired
AAA to AA3 1,894,731 – 3,055,710 6,163,966 447,600 – 136,073A1 to A3 861,992 – 1,720,399 3,725,266 – – 588,519Baa1 to Baa3 580,208 – 38,888 734,692 – – 8,177P1 to P3 – – – 105,323 – – –Non-rated 6,619,261 300,880 873,168 11,117,238 12,612,470 1,295,179 220,273
9,956,192 300,880 5,688,165 21,846,485 13,060,070 1,295,179 953,042
The amount of short-term funds and deposits and placements with banks and other financial institutions, securities purchased under resale agreements, financial assets and investment portfolios, other assets and derivative assets that are past due but not impaired is not material.
* Placements with banks and other financial institutions with no ratings mainly comprise placements with BNM.
^ Comprises securities purchased under resale agreements with local financial institutions.# Securities with no ratings consist of government securities.
NoTES To ThE fINANCIAL STATEmENTSfoR ThE fINANCIAL yEAR ENdEd 30 JuNE 2018

240ANNUALREPORT2018
HONG LEONG BANK BERHAD
46 fINANCIAL INSTRumENTS (CoNTINuEd)
(d) Credit risk (continued)
(iii) Credit quality (continued)
(b) Other financial assets (continued)
Analysis of other financial assets by rating agency designation (where applicable) as at 30 June 2018, based on Moody’s ratings or its equivalent are as follows:
The Bank 2018
Short-term funds and deposits and placements with Securities financial financial financial banks and other purchased assets investments investments Amount financial under resale held-for- available- held-to- other due from derivative
institutions* agreements^ trading# for-sale# maturity# assets subsidiaries assets Rm’000 Rm’000 Rm’000 Rm’000 Rm’000 Rm’000 Rm’000 Rm’000
Neither past due nor impaired
AAA to AA3 998,700 – 1,979,816 8,551,606 437,936 – – 250,505A1 to A3 5,491,704 – 512,023 2,058,434 – – – 313,137Baa1 to Baa3 106,245 – – 262,108 – – – 66,900P1 to P3 – – – – – – – –Non-rated 88,346 – 3,127,196 10,578,180 10,468,142 591,301 43,563 302,384
6,684,995 – 5,619,035 21,450,328 10,906,078 591,301 43,563 932,926
The amount of short-term funds and deposits and placements with banks and other financial institutions, securities purchased under resale agreements, financial assets and investment portfolios, other assets and derivative assets that are past due but not impaired is not material.
* Placements with banks and other financial institutions with no ratings mainly comprise placements with BNM.
^ Comprises securities purchased under resale agreements with local financial institutions.# Securities with no ratings consist of government securities.
NoTES To ThE fINANCIAL STATEmENTSfoR ThE fINANCIAL yEAR ENdEd 30 JuNE 2018

241ANNUALREPORT
2018
FINANCIALS
46 fINANCIAL INSTRumENTS (CoNTINuEd)
(d) Credit risk (continued)
(iii) Credit quality (continued)
(b) Other financial assets (continued)
Analysis of other financial assets by rating agency designation (where applicable) as at 30 June 2017, based on Moody’s ratings or its equivalent are as follows:
The Bank 2017
Short-term funds and deposits and placements with Securities financial financial financial banks and other purchased assets investments investments Amount financial under resale held-for- available- held-to- other due from derivative
institutions* agreements^ trading# for-sale# maturity# assets subsidiaries assets Rm’000 Rm’000 Rm’000 Rm’000 Rm’000 Rm’000 Rm’000 Rm’000
Neither past due nor impaired
AAA to AA3 1,793,058 – 2,637,224 5,277,436 447,600 – – 136,073A1 to A3 762,913 – 1,720,399 3,712,999 – – – 578,670Baa1 to Baa3 578,647 – 38,888 734,692 – – – 8,177P1 to P3 – – – 105,323 – – – –Non-rated 5,915,552 300,880 1,008,799 9,248,097 9,960,659 1,201,778 13,484 224,663
9,050,170 300,880 5,405,310 19,078,547 10,408,259 1,201,778 13,484 947,583
The amount of short-term funds and deposits and placements with banks and other financial institutions, securities purchased under resale agreements, financial assets and investment portfolios, other assets and derivative assets that are past due but not impaired is not material.
* Placements with banks and other financial institutions with no ratings mainly comprise placements with BNM.
^ Comprises securities purchased under resale agreements with local financial institutions.# Securities with no ratings consist of government securities.
NoTES To ThE fINANCIAL STATEmENTSfoR ThE fINANCIAL yEAR ENdEd 30 JuNE 2018
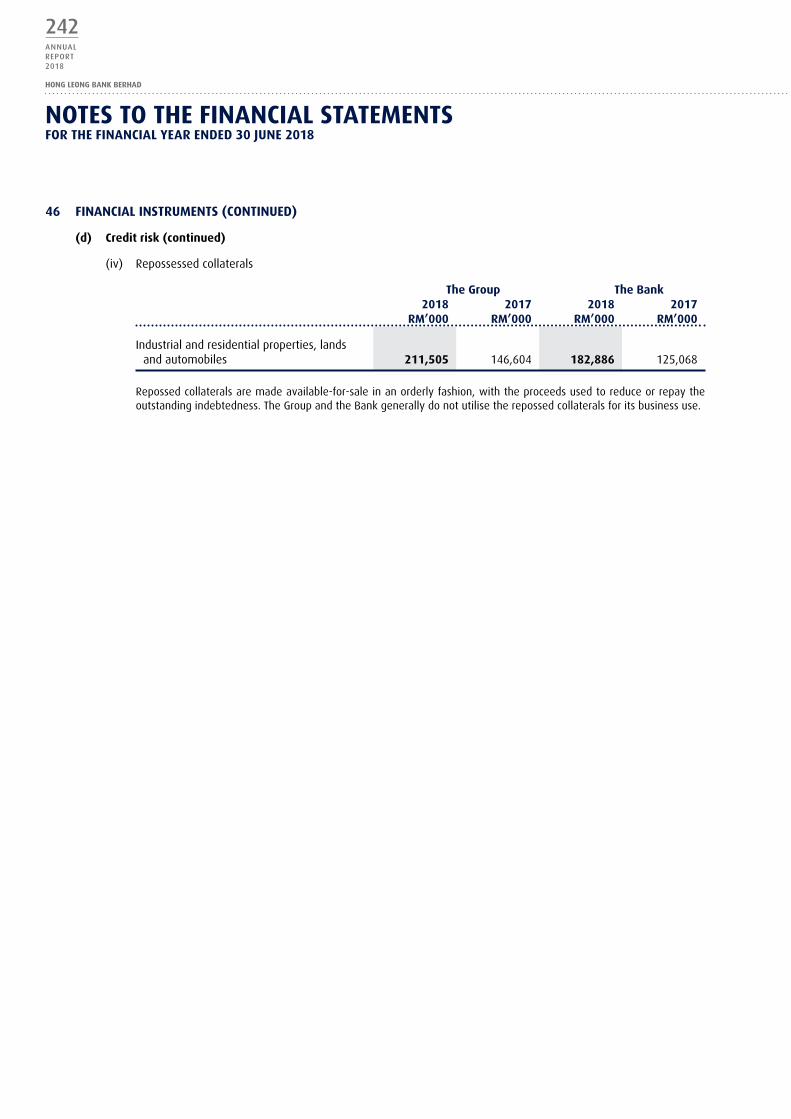
242ANNUALREPORT2018
HONG LEONG BANK BERHAD
46 fINANCIAL INSTRumENTS (CoNTINuEd)
(d) Credit risk (continued)
(iv) Repossessed collaterals
The group The Bank 2018 2017 2018 2017 Rm’000 Rm’000 Rm’000 Rm’000
Industrial and residential properties, lands and automobiles 211,505 146,604 182,886 125,068
Repossed collaterals are made available-for-sale in an orderly fashion, with the proceeds used to reduce or repay the outstanding indebtedness. The Group and the Bank generally do not utilise the repossed collaterals for its business use.
NoTES To ThE fINANCIAL STATEmENTSfoR ThE fINANCIAL yEAR ENdEd 30 JuNE 2018

243ANNUALREPORT
2018
FINANCIALS46
fI
NA
NCI
AL
INST
Ru
mEN
TS (
CoN
TIN
uEd
)
(d)
Cr
edit
ris
k (c
onti
nue
d)
Cr
edit
risk
expo
sure
ana
lyse
d by
indu
stry
in r
espe
ct o
f th
e G
roup
’s a
nd t
he B
ank’
s fin
anci
al a
sset
s ar
e se
t ou
t be
low
:
The
grou
p
20
18
Sh
ort-
term
fu
nds
and
plac
emen
ts
Secu
riti
es
un
draw
n gu
aran
tees
,
w
ith
bank
s pu
rcha
sed
fi
nanc
ial
fina
ncia
l fi
nanc
ial
Loan
s,
lo
an
endo
rsem
ents
an
d ot
her
unde
r as
sets
in
vest
men
ts
inve
stm
ents
ad
vanc
es
Tota
l co
mm
itm
ents
an
d ot
her
finan
cial
re
sale
h
eld-
for-
av
aila
ble-
he
ld-t
o-
and
ot
her
deri
vati
ve
cred
it ri
sk
and
othe
r co
ntin
gent
in
stit
utio
ns
agre
emen
ts
trad
ing
for-
sale
m
atur
ity
fin
anci
ng
asse
ts
asse
ts
expo
sure
s fa
cilit
ies
item
s
Rm
’000
R
m’0
00
Rm’0
00
Rm’0
00
Rm
’000
Rm
’000
Rm
’000
Rm
’000
R
m’0
00
Rm
’000
Rm
’000
Agric
ultu
re
– –
– 9
9,23
2 –
2,66
5,11
4
– –
2,76
4,34
6
952,
054
1,
009
Min
ing
and
quar
ryin
g –
– –
40,2
80
– 14
7,53
4
– –
18
7,81
4
187,
379
18
8M
anuf
actu
ring
–
– –
– –
9,58
6,84
5 –
–
9,
586,
845
6,
318,
050
23
8,56
0El
ectr
icity
, gas
and
wat
er
– –
20,1
70
2,17
9,76
8
60,9
49
201,
063
–
– 2,
461,
950
19
2,92
4 4
6Co
nstr
uctio
n –
– –
266
,875
–
2,74
2,75
4
– –
3,00
9,62
9
1,94
1,67
4
13,6
80W
hole
sale
and
reta
il
– –
– 3
9,35
9
– 10
,581
,176
–
– 10
,620
,535
5,
101,
312
25
8,71
4Tr
ansp
ort,
stor
age
and
com
mun
icat
ions
–
– –
320
,204
–
3,33
2,90
4
– –
3,65
3,10
8
496,
715
5,
528
Fina
nce,
insu
ranc
e, re
al e
stat
e an
d bu
sine
ss
serv
ices
6,
702,
964
–
2,67
2,77
2
12,3
16,2
93
30,8
66
9,53
1,96
3
660,
014
91
8,06
7
32,8
32,9
39
3,58
2,84
7
94,9
93Go
vern
men
t and
gov
ernm
ent a
genc
ies
72
4,64
3
– 3,
276,
930
9,
032,
673
14
,344
,643
–
6,
891
–
27,3
85,7
80
– 20
6Ed
ucat
ion,
hea
lth a
nd o
ther
s
– –
– –
– 1,
728,
563
–
– 1,
728,
563
21
0,31
4 –
Hou
seho
ld
– –
– –
– 86
,942
,754
–
– 86
,942
,754
18
,169
,084
3,
465
Oth
ers
–
– –
– –
598
,435
–
– 5
98,4
35
132,
756
–
7,42
7,60
7
– 5,
969,
872
24
,294
,684
14
,436
,458
12
8,05
9,10
5
666,
905
91
8,06
7
181,
772,
698
37
,285
,109
61
6,38
9
NoTES To ThE fINANCIAL STATEmENTSfoR ThE fINANCIAL yEAR ENdEd 30 JuNE 2018
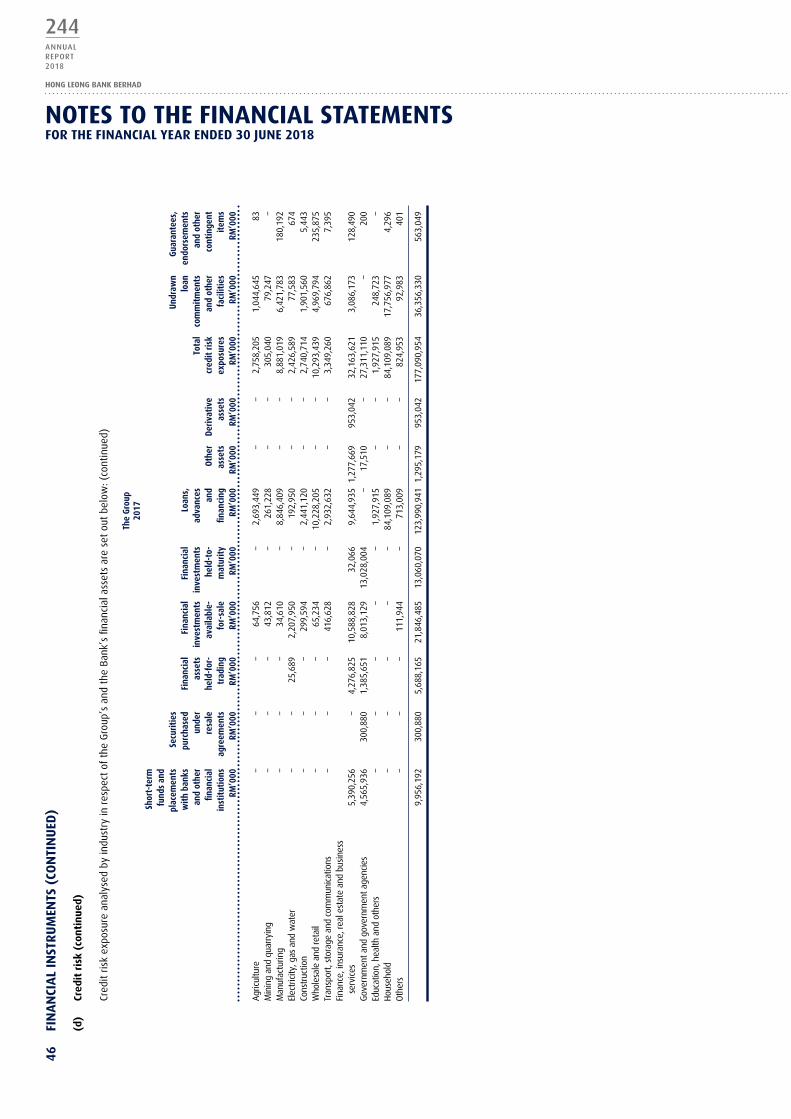
244ANNUALREPORT2018
HONG LEONG BANK BERHAD
46
fIN
AN
CIA
L IN
STR
um
ENTS
(Co
NTI
Nu
Ed)
(d)
Cr
edit
ris
k (c
onti
nue
d)
Cr
edit
risk
expo
sure
ana
lyse
d by
indu
stry
in r
espe
ct o
f th
e G
roup
’s a
nd t
he B
ank’
s fin
anci
al a
sset
s ar
e se
t ou
t be
low
: (co
ntin
ued)
The
grou
p
20
17
Sh
ort-
term
fu
nds
and
plac
emen
ts
Secu
riti
es
un
draw
n gu
aran
tees
,
w
ith
bank
s pu
rcha
sed
fi
nanc
ial
fina
ncia
l fi
nanc
ial
Loan
s,
lo
an
endo
rsem
ents
an
d ot
her
unde
r as
sets
in
vest
men
ts
inve
stm
ents
ad
vanc
es
Tota
l co
mm
itm
ents
an
d ot
her
finan
cial
re
sale
h
eld-
for-
av
aila
ble-
he
ld-t
o-
and
ot
her
deri
vati
ve
cred
it ri
sk
and
othe
r co
ntin
gent
in
stit
utio
ns
agre
emen
ts
trad
ing
for-
sale
m
atur
ity
fin
anci
ng
asse
ts
asse
ts
expo
sure
s fa
cilit
ies
item
s
Rm
’000
R
m’0
00
Rm’0
00
Rm’0
00
Rm
’000
Rm
’000
Rm
’000
Rm
’000
R
m’0
00
Rm
’000
Rm
’000
Agric
ultu
re
– –
– 6
4,75
6 –
2,
693,
449
–
– 2,
758,
205
1,
044,
645
83
Min
ing
and
quar
ryin
g
– –
– 4
3,81
2 –
26
1,22
8
– –
305,
040
79
,247
–
Man
ufac
turin
g
– –
– 34
,610
–
8,84
6,40
9
– –
8,88
1,01
9
6,42
1,78
3
180,
192
Elec
tric
ity, g
as a
nd w
ater
–
– 25
,689
2,
207,
950
–
192,
950
–
– 2
,426
,589
77
,583
67
4Co
nstr
uctio
n
– –
– 2
99,5
94
–
2,44
1,12
0
– –
2,7
40,7
14
1,90
1,56
0 5
,443
Who
lesa
le a
nd re
tail
–
– –
65,2
34
– 10
,228
,205
–
– 1
0,29
3,43
9 4
,969
,794
23
5,87
5Tr
ansp
ort,
stor
age
and
com
mun
icat
ions
–
– –
416,
628
–
2,9
32,6
32
– –
3,34
9,26
0 6
76,8
62
7,39
5Fi
nanc
e, in
sura
nce,
real
est
ate
and
busi
ness
se
rvic
es
5,39
0,25
6 –
4,27
6,82
5
10,5
88,8
28
32,0
66
9,64
4,93
5 1
,277
,669
95
3,04
2 3
2,16
3,62
1 3
,086
,173
12
8,49
0Go
vern
men
t and
gov
ernm
ent a
genc
ies
4,
565,
936
300
,880
1,
385,
651
8,0
13,1
29
13,0
28,0
04
– 1
7,51
0 –
27,3
11,1
10
– 20
0Ed
ucat
ion,
hea
lth a
nd o
ther
s
– –
– –
– 1
,927
,915
–
– 1
,927
,915
24
8,72
3
–H
ouse
hold
–
– –
– –
84,
109,
089
–
– 84
,109
,089
1
7,75
6,97
7
4,29
6O
ther
s
– –
– 11
1,94
4
– 71
3,00
9
– –
824,
953
92
,983
40
1
9,
956,
192
30
0,88
0
5,68
8,16
5
21,8
46,4
85
13,0
60,0
70
123
,990
,941
1,
295,
179
95
3,04
2 1
77,0
90,9
54
36,3
56,3
30
563,
049
NoTES To ThE fINANCIAL STATEmENTSfoR ThE fINANCIAL yEAR ENdEd 30 JuNE 2018

245ANNUALREPORT
2018
FINANCIALS46
fI
NA
NCI
AL
INST
Ru
mEN
TS (
CoN
TIN
uEd
)
(d)
Cr
edit
ris
k (c
onti
nue
d)
Cr
edit
risk
expo
sure
ana
lyse
d by
indu
stry
in r
espe
ct o
f th
e G
roup
’s a
nd t
he B
ank’
s fin
anci
al a
sset
s ar
e se
t ou
t be
low
: (co
ntin
ued)
The
Bank
20
18
Sh
ort-
term
fu
nds
and
plac
emen
ts
Secu
riti
es
undr
awn
gua
rant
ees,
w
ith
bank
s pu
rcha
sed
fi
nanc
ial
fina
ncia
l fi
nanc
ial
Loan
s,
loan
en
dors
emen
ts
and
othe
r un
der
asse
ts
inve
stm
ents
in
vest
men
ts
adva
nces
Amou
nt
To
tal
com
mit
men
ts
and
othe
r
fin
anci
al
resa
le
hel
d-fo
r-
avai
labl
e-
held
-to-
an
d
othe
r du
e fr
om
deri
vati
ve
cred
it ri
sk
and
othe
r co
ntin
gent
in
stit
utio
ns
agre
emen
ts
trad
ing
for-
sale
m
atur
ity
fin
anci
ng
ass
ets
subs
idia
ries
as
sets
ex
posu
res
fa
cilit
ies
item
s
R
m’0
00
Rm’0
00
Rm’0
00
Rm
’000
Rm
’000
Rm
’000
Rm
’000
R
m’0
00
Rm
’000
Rm
’000
Rm
’000
Rm
’000
Agric
ultu
re
– –
– 99
,232
–
1,
737,
836
–
– –
1,8
37,0
68
530,
970
1,
009
Min
ing
and
quar
ryin
g
–
–
–
40,2
80
– 10
8,00
5
–
– –
148,
285
18
7,06
4
188
Man
ufac
turin
g
– –
– –
– 8,
458,
984
– –
– 8,
458,
984
5,
275,
412
23
1,06
1El
ectr
icity
, gas
and
wat
er
– –
20,1
70
1,74
4,94
3
60,9
49
148,
231
– –
–
1,97
4,29
3
79,6
88
–Co
nstr
uctio
n
– –
– 20
1,51
5 –
2,17
4,12
0 –
– –
2,37
5,63
5
1,56
0,01
4
13,1
73W
hole
sale
and
reta
il
– –
– 39
,359
–
9,53
4,67
5 –
– –
9,
574,
034
4,
525,
999
23
0,37
5Tr
ansp
ort,
stor
age
and
co
mm
unic
atio
ns
– –
– 31
5,16
9 –
3,18
4,09
3 –
– –
3,
499,
262
41
1,39
8
3,55
8Fi
nanc
e, in
sura
nce,
real
est
ate
and
busi
ness
ser
vice
s
6,59
5,02
7 –
2,47
2,96
2
11,6
53,1
56
30,8
66
8,19
3,48
8 5
84,4
33
43,5
63
932,
926
30
,506
,421
2,
706,
143
44
,993
Gove
rnm
ent a
nd g
over
nmen
t ag
enci
es
89,9
68
– 3
,125
,903
7,
356,
674
10
,814
,263
–
6,86
8
– –
21
,393
,676
–
206
Educ
atio
n, h
ealth
and
oth
ers
– –
– –
– 90
7,09
0 –
– –
907,
090
19
2,61
6
–H
ouse
hold
–
– –
– –
69,7
57,0
31
– –
– 69
,757
,031
15
,850
,853
3,
465
Oth
ers
–
– –
– –
71,3
50
– –
– 71
,350
10
7,28
5
–
6,
684,
995
– 5,
619,
035
21,4
50,3
28
10,9
06,0
78
104,
274,
903
591,
301
43,5
63
932,
926
150,
503,
129
31,4
27,4
42
528,
028
NoTES To ThE fINANCIAL STATEmENTSfoR ThE fINANCIAL yEAR ENdEd 30 JuNE 2018
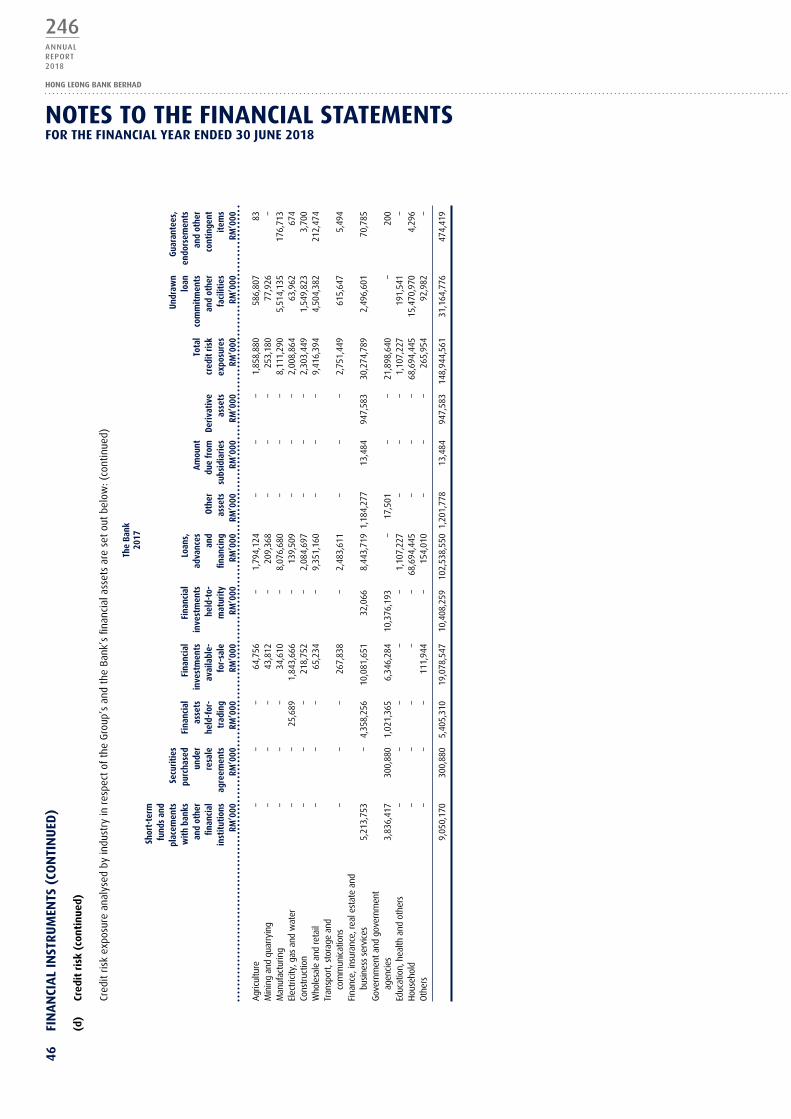
246ANNUALREPORT2018
HONG LEONG BANK BERHAD
46
fIN
AN
CIA
L IN
STR
um
ENTS
(Co
NTI
Nu
Ed)
(d)
Cr
edit
ris
k (c
onti
nue
d)
Cr
edit
risk
expo
sure
ana
lyse
d by
indu
stry
in r
espe
ct o
f th
e G
roup
’s a
nd t
he B
ank’
s fin
anci
al a
sset
s ar
e se
t ou
t be
low
: (co
ntin
ued)
The
Bank
20
17
Sh
ort-
term
fu
nds
and
plac
emen
ts
Secu
riti
es
undr
awn
gua
rant
ees,
w
ith
bank
s pu
rcha
sed
fi
nanc
ial
fina
ncia
l fi
nanc
ial
Loan
s,
loan
en
dors
emen
ts
and
othe
r un
der
asse
ts
inve
stm
ents
in
vest
men
ts
adva
nces
Amou
nt
To
tal
com
mit
men
ts
and
othe
r
fin
anci
al
resa
le
hel
d-fo
r-
avai
labl
e-
held
-to-
an
d
othe
r du
e fr
om
deri
vati
ve
cred
it ri
sk
and
othe
r co
ntin
gent
in
stit
utio
ns
agre
emen
ts
trad
ing
for-
sale
m
atur
ity
fin
anci
ng
ass
ets
subs
idia
ries
as
sets
ex
posu
res
fa
cilit
ies
item
s
R
m’0
00
Rm’0
00
Rm’0
00
Rm
’000
Rm
’000
Rm
’000
Rm
’000
R
m’0
00
Rm
’000
Rm
’000
Rm
’000
Rm
’000
Agric
ultu
re
–
–
–
64,
756
–
1
,794
,124
–
–
–
1
,858
,880
5
86,8
07
83
Min
ing
and
quar
ryin
g –
–
–
4
3,81
2
–
209
,368
–
–
–
2
53,1
80
77,
926
–
M
anuf
actu
ring
–
–
–
34,
610
–
8
,076
,680
–
–
–
8
,111
,290
5
,514
,135
1
76,7
13
Elec
tric
ity, g
as a
nd w
ater
–
–
2
5,68
9
1,8
43,6
66
–
139
,509
–
–
–
2
,008
,864
6
3,96
2
674
Co
nstr
uctio
n –
–
–
2
18,7
52
–
2,0
84,6
97
–
–
–
2,3
03,4
49
1,5
49,8
23
3,7
00
Who
lesa
le a
nd re
tail
–
–
–
65,
234
–
9
,351
,160
–
–
–
9
,416
,394
4
,504
,382
2
12,4
74
Tran
spor
t, st
orag
e an
d co
mm
unic
atio
ns
–
–
–
267
,838
–
2
,483
,611
–
–
–
2
,751
,449
6
15,6
47
5,4
94
Fina
nce,
insu
ranc
e, re
al e
stat
e an
d
busi
ness
ser
vice
s 5
,213
,753
–
4
,358
,256
1
0,08
1,65
1
32,
066
8
,443
,719
1,1
84,2
77
13,
484
9
47,5
83
30,
274,
789
2
,496
,601
7
0,78
5 Go
vern
men
t and
gov
ernm
ent
agen
cies
3
,836
,417
3
00,8
80
1,0
21,3
65
6,3
46,2
84
10,
376,
193
–
1
7,50
1
–
–
21,
898,
640
–
2
00
Educ
atio
n, h
ealth
and
oth
ers
–
–
–
–
–
1,1
07,2
27
–
–
–
1,1
07,2
27
191
,541
–
H
ouse
hold
–
–
–
–
–
6
8,69
4,44
5
–
–
–
68,
694,
445
1
5,47
0,97
0
4,2
96
Oth
ers
–
–
–
111
,944
–
1
54,0
10
–
–
–
265
,954
9
2,98
2
–
9,05
0,17
0
300
,880
5
,405
,310
1
9,07
8,54
7
10,
408,
259
1
02,5
38,5
50 1
,201
,778
1
3,48
4
947
,583
1
48,9
44,5
61
31,
164,
776
4
74,4
19
NoTES To ThE fINANCIAL STATEmENTSfoR ThE fINANCIAL yEAR ENdEd 30 JuNE 2018

247ANNUALREPORT
2018
FINANCIALS
47 fAIR VALuE of fINANCIAL INSTRumENTS
Financial instruments comprise of financial assets and financial liabilities. Fair value is the price that would be received to sell an asset or paid to transfer a liability in an orderly transaction between market participants at the measurement date. The information presented herein represents the estimates of fair values as at the statements of financial position date.
Where available, quoted and observable market prices are used as the measure of fair values. Where such quoted and observable market prices are not available, fair values are estimated based on a range of methodologies and assumptions regarding risk characteristics of various financial instruments, discount rates, estimates of future cash flows and other factors. Changes in the uncertainties and assumptions could materially affect these estimates and the resulting fair value estimates.
(a) determination of fair value and fair value hierarchy
The Group and the Bank measure fair values using the following fair value hierarchy that reflects the significance of the inputs used in making the measurements:
Level 1: Quoted prices (unadjusted) in active markets for identical assets or liabilities.
Level 2: Quoted prices for identical or similar instruments in markets that are not active; and model-derived valuations in which inputs other than quoted prices included within Level 1 that are observable for the asset or liability, either directly or indirectly.
Level 3: Valuations derived from valuation techniques in which one or more significant inputs are not based on observable market data.
Financial instruments are classified as Level 1 if their value is observable in an active market. Such instruments are valued by reference to unadjusted quoted prices for identical assets or liabilities in active markets where the quoted prices is readily available, and the price represents actual and regularly occurring market transactions. An active market is one in which transactions occur with sufficient volume and frequency to provide pricing information on an on-going basis. These would include actively traded listed equities and actively exchange-traded derivatives.
Where fair value is determined using unquoted market prices in less active markets or quoted prices for similar assets and liabilities, such instruments are generally classified as Level 2.
In cases where quoted prices are generally not available, the Group then determines fair value based upon valuation techniques that uses inputs such as market parameters including but not limited to yield curves, volatilities and foreign exchange rates. The majority of valuation techniques employ only observable market data and so reliability of the fair value measurement is high.
Financial instruments are classified as Level 3 if their valuation incorporates significant inputs that are not based on observable market data (unobservable inputs). Such inputs are generally determined based on observable inputs of a similar nature, historical observations on the level of the input or other analytical techniques.
NoTES To ThE fINANCIAL STATEmENTSfoR ThE fINANCIAL yEAR ENdEd 30 JuNE 2018

248ANNUALREPORT2018
HONG LEONG BANK BERHAD
47 fAIR VALuE of fINANCIAL INSTRumENTS (CoNTINuEd)
(a) determination of fair value and fair value hierarchy (continued)
The table below analyses financial instruments carried at fair value analysed by level within the fair value hierarchy:
The group 2018 fair Value
Level 1 Level 2 Level 3 Total Rm’000 Rm’000 Rm’000 Rm’000
Recurring fair value measurementsfinancial AssetsFinancial assets held-for-trading- Money market instrument – 5,782,957 – 5,782,957 - Quoted securities 108,940 – – 108,940 - Unquoted securities – 77,975 – 77,975 Financial investments available-for-sale- Money market instrument – 7,210,876 – 7,210,876 - Quoted securities 11,756,789 – – 11,756,789 - Unquoted securities – 12,427,759 467,512 12,895,271 Derivative financial instruments 1,221 902,970 13,876 918,067
11,866,950 26,402,537 481,388 38,750,875
financial LiabilitiesDerivative financial instruments 4,913 1,001,407 13,876 1,020,196 Financial liabilities designated at fair value- Structured deposits linked to interest rate
derivatives – 3,167,150 – 3,167,150
4,913 4,168,557 13,876 4,187,346
The Group recognises transfers between levels of the fair value hierarchy at the end of the reporting period during which the transfer has occurred. The fair value of an asset to be transferred between levels is determined as of the date of the event or change in circumstances that caused the transfer. There were no transfers between Level 1 and Level 2 of the fair value hierarchy during the financial year (2017: RM Nil).
NoTES To ThE fINANCIAL STATEmENTSfoR ThE fINANCIAL yEAR ENdEd 30 JuNE 2018
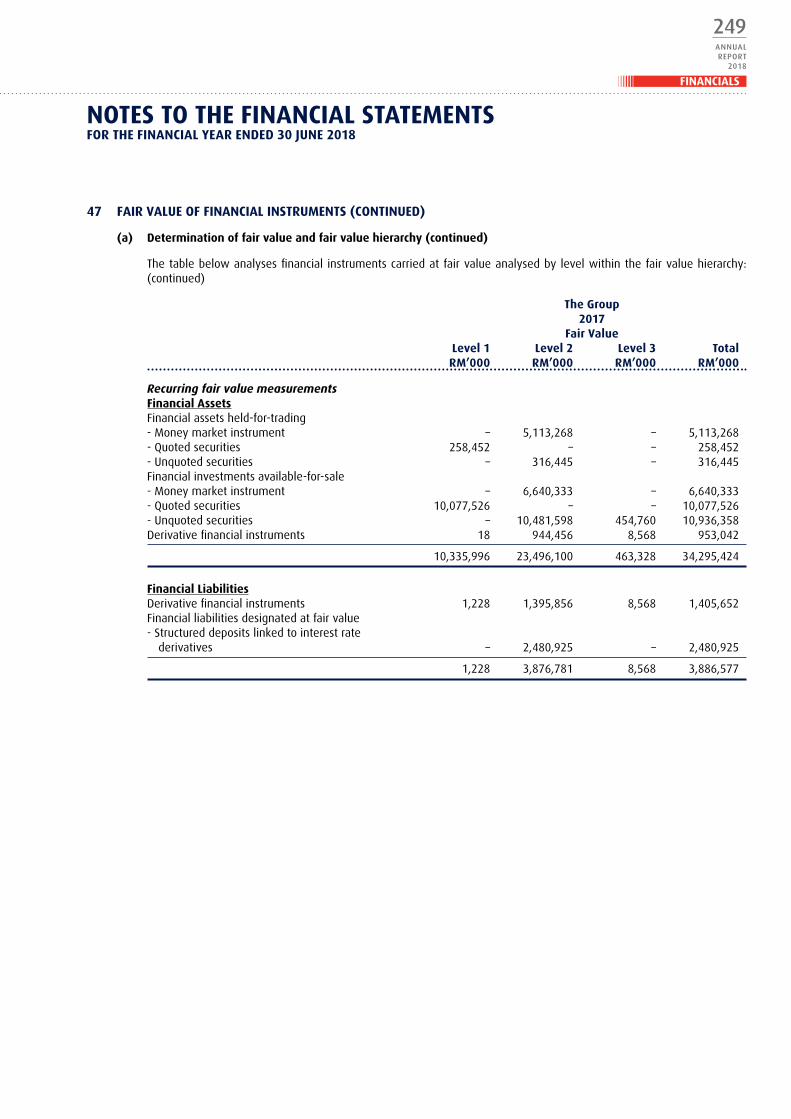
249ANNUALREPORT
2018
FINANCIALS
47 fAIR VALuE of fINANCIAL INSTRumENTS (CoNTINuEd)
(a) determination of fair value and fair value hierarchy (continued)
The table below analyses financial instruments carried at fair value analysed by level within the fair value hierarchy: (continued)
The group 2017 fair Value
Level 1 Level 2 Level 3 Total Rm’000 Rm’000 Rm’000 Rm’000
Recurring fair value measurementsfinancial AssetsFinancial assets held-for-trading- Money market instrument – 5,113,268 – 5,113,268 - Quoted securities 258,452 – – 258,452 - Unquoted securities – 316,445 – 316,445 Financial investments available-for-sale- Money market instrument – 6,640,333 – 6,640,333 - Quoted securities 10,077,526 – – 10,077,526 - Unquoted securities – 10,481,598 454,760 10,936,358 Derivative financial instruments 18 944,456 8,568 953,042
10,335,996 23,496,100 463,328 34,295,424
financial LiabilitiesDerivative financial instruments 1,228 1,395,856 8,568 1,405,652 Financial liabilities designated at fair value- Structured deposits linked to interest rate
derivatives – 2,480,925 – 2,480,925
1,228 3,876,781 8,568 3,886,577
NoTES To ThE fINANCIAL STATEmENTSfoR ThE fINANCIAL yEAR ENdEd 30 JuNE 2018

250ANNUALREPORT2018
HONG LEONG BANK BERHAD
47 fAIR VALuE of fINANCIAL INSTRumENTS (CoNTINuEd)
(a) determination of fair value and fair value hierarchy (continued)
The table below analyses financial instruments carried at fair value analysed by level within the fair value hierarchy: (continued)
The Bank 2018 fair Value
Level 1 Level 2 Level 3 Total Rm’000 Rm’000 Rm’000 Rm’000
Recurring fair value measurementsfinancial AssetsFinancial assets held-for-trading- Money market instrument – 5,432,120 – 5,432,120 - Quoted securities 108,940 – – 108,940 - Unquoted securities – 77,975 – 77,975 Financial investments available-for-sale- Money market instrument – 5,739,723 – 5,739,723 - Quoted securities 11,745,511 – – 11,745,511 - Unquoted securities – 11,065,834 467,512 11,533,346 Derivative financial instruments 1,221 917,829 13,876 932,926
11,855,672 23,233,481 481,388 35,570,541
financial LiabilitiesDerivative financial instruments 4,913 964,891 13,876 983,680 Financial liabilities designated at fair value- Structured deposits linked to interest rate
derivatives – 2,018,571 – 2,018,571
4,913 2,983,462 13,876 3,002,251
The Bank recognises transfers between levels of the fair value hierarchy at the end of the reporting period during which the transfer has occurred. The fair value of an asset to be transferred between levels is determined as of the date of the event or change in circumstances that caused the transfer. There were no transfers between Level 1 and Level 2 of the fair value hierarchy during the financial year (2017: RM Nil).
NoTES To ThE fINANCIAL STATEmENTSfoR ThE fINANCIAL yEAR ENdEd 30 JuNE 2018

251ANNUALREPORT
2018
FINANCIALS
47 fAIR VALuE of fINANCIAL INSTRumENTS (CoNTINuEd)
(a) determination of fair value and fair value hierarchy (continued)
The table below analyses financial instruments carried at fair value analysed by level within the fair value hierarchy: (continued)
The Bank 2017 fair Value
Level 1 Level 2 Level 3 Total Rm’000 Rm’000 Rm’000 Rm’000
Recurring fair value measurementsfinancial AssetsFinancial assets held-for-trading- Money market instrument – 5,021,807 – 5,021,807 - Quoted securities 258,452 – – 258,452 - Unquoted securities – 125,051 – 125,051 Financial investments available-for-sale- Money market instrument – 5,110,048 – 5,110,048 - Quoted securities 10,065,260 – – 10,065,260 - Unquoted securities – 9,256,212 454,760 9,710,972 Derivative financial instruments 18 938,997 8,568 947,583
10,323,730 20,452,115 463,328 31,239,173
financial LiabilitiesDerivative financial instruments 1,228 1,353,858 8,568 1,363,654 Financial liabilities designated at fair value- Structured deposits linked to interest rate
derivatives – 1,628,683 – 1,628,683
1,228 2,982,541 8,568 2,992,337
NoTES To ThE fINANCIAL STATEmENTSfoR ThE fINANCIAL yEAR ENdEd 30 JuNE 2018

252ANNUALREPORT2018
HONG LEONG BANK BERHAD
47 fAIR VALuE of fINANCIAL INSTRumENTS (CoNTINuEd)
(a) determination of fair value and fair value hierarchy (continued)
Reconciliation of fair value measurements in Level 3 of the fair value hierarchy, is as below:
financial financial Assets Liability financial derivative derivative investments financial financial The group available-for-sale instruments instruments 2018 Rm’000 Rm’000 Rm’000
At 1 July 454,760 8,568 8,568 Fair value changes recognised in statements of income – 4,672 4,672 Net fair value changes recognised in other
comprehensive income 162,113 – – Purchases – 6,672 6,672 Settlements – (6,036) (6,036)Disposal (149,361) – –
At 30 June 467,512 13,876 13,876
Fair value changes recognised in statements of income relating to assets/liability held on 30 June 2018 – 4,672 4,672
Total gain recognised in other comprehensive income relating to assets held on 30 June 2018 162,113 – –
financial financial Assets Liability financial derivative derivative investments financial financial The Bank available-for-sale instruments instruments 2018 Rm’000 Rm’000 Rm’000
At 1 July 454,760 8,568 8,568 Fair value changes recognised in statements of income – 4,672 4,672 Net fair value changes recognised in other
comprehensive income 162,113 – –Purchases – 6,672 6,672 Settlements – (6,036) (6,036)Disposal (149,361) – –
At 30 June 467,512 13,876 13,876
Fair value changes recognised in statements of income relating to assets/liability held on 30 June 2018 – 4,672 4,672
Total gain recognised in other comprehensive income relating to assets held on 30 June 2018 162,113 – –
NoTES To ThE fINANCIAL STATEmENTSfoR ThE fINANCIAL yEAR ENdEd 30 JuNE 2018

253ANNUALREPORT
2018
FINANCIALS
47 fAIR VALuE of fINANCIAL INSTRumENTS (CoNTINuEd)
(a) determination of fair value and fair value hierarchy (continued)
Reconciliation of fair value measurements in Level 3 of the fair value hierarchy, is as below (continued):
financial financial Assets Liability financial derivative derivative investments financial financial The group available-for-sale instruments instruments 2017 Rm’000 Rm’000 Rm’000
At 1 July 427,328 7,995 7,995 Fair value changes recognised in statements of income – 7,297 7,297 Net fair value changes recognised in other
comprehensive income 31,814 – – Purchases – 7,582 7,582 Settlements – (14,306) (14,306)Disposal (53) – – Transfer out from Level 3 (4,329) – –
At 30 June 454,760 8,568 8,568
Fair value changes recognised in statements of income relating to assets/liability held on 30 June 2017 – 7,297 7,297
Total gain recognised in other comprehensive income relating to assets held on 30 June 2017 31,814 – –
financial financial Assets Liability financial derivative derivative investments financial financial The Bank available-for-sale instruments instruments 2017 Rm’000 Rm’000 Rm’000
At 1 July 427,328 7,995 7,995 Fair value changes recognised in statements of income – 7,297 7,297 Net fair value changes recognised in other
comprehensive income 31,814 – – Purchases – 7,582 7,582 Settlements – (14,306) (14,306)Disposal (53) – –Transfer out from Level 3 (4,329) – –
At 30 June 454,760 8,568 8,568
Fair value changes recognised in statements of income relating to assets/liability held on 30 June 2017 – 7,297 7,297
Total gain recognised in other comprehensive income relating to assets held on 30 June 2017 31,814 – –
During the financial year ended 30 June 2017, the Group and the Bank transferred certain financial instruments (mainly shares outside Malaysia) from Level 3 to Level 2 of the fair value hierarchy. The reason for the transfer was due to upliftment of conversion restriction whereby certain shares are now convertible to Class A shares which are currently listed on the New York Stock Exchange. Thus, these shares can now be reliably measured based on observable inputs under Level 2.
NoTES To ThE fINANCIAL STATEmENTSfoR ThE fINANCIAL yEAR ENdEd 30 JuNE 2018

254ANNUALREPORT2018
HONG LEONG BANK BERHAD
47 fAIR VALuE of fINANCIAL INSTRumENTS (CoNTINuEd)
(a) determination of fair value and fair value hierarchy (continued)
Quantitative information about fair value measurements using significant unobservable inputs (Level 3)
Inter-relationship The group and the Bank between significant fair value fair value Valuation unobservable Range unobservable inputs description assets liabilities technique(s) input (weighted and fair value 2018 Rm’000 Rm’000 average) measurement
financial investments available-for-sale
Unquoted shares 467,512 – Net tangible Net tangible Not Higher net tangible assets assets applicable assets results in higher fair value
derivative financial instruments
Monte Carlo Equity +1% Higher volatility, Simulation volatility to +8% would generally result in higher fair valuation for long volatility positions and vice versa
Equity derivatives 13,876 (13,876) Monte Carlo Equity/FX -19% An increase in
Simulation Correlation to +18% correlation, would between generally result in a underlyers higher fair value measurement and vice versa
2017
financial investments available-for-sale
Unquoted shares 454,760 – Net tangible Net tangible Not Higher net tangible assets assets applicable assets results in higher fair value
derivative financial instruments
Monte Carlo Equity +3% Higher volatility, Simulation volatility to +37% would generally result in higher fair valuation for long volatility positions and vice versa
Equity derivatives 8,568 (8,568) Monte Carlo Equity/FX -10% An increase in
Simulation Correlation to +60% correlation, would between generally result in a underlyers higher fair value measurement and vice versa
NoTES To ThE fINANCIAL STATEmENTSfoR ThE fINANCIAL yEAR ENdEd 30 JuNE 2018
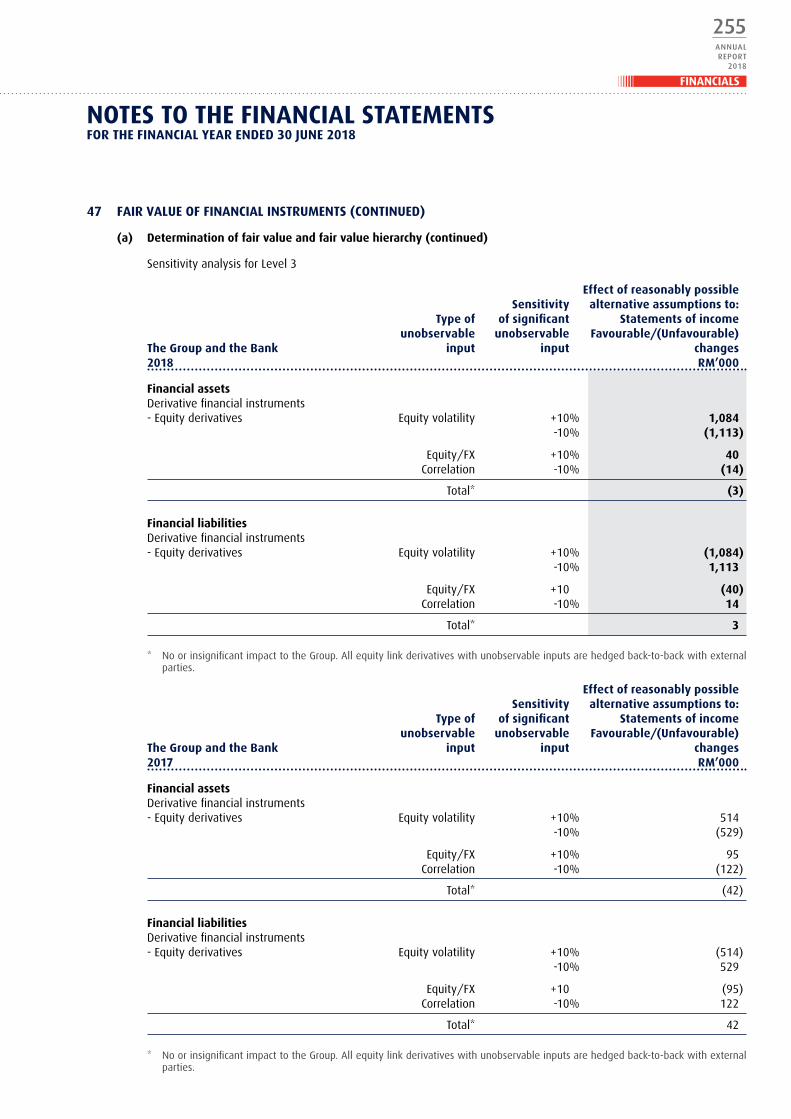
255ANNUALREPORT
2018
FINANCIALS
47 fAIR VALuE of fINANCIAL INSTRumENTS (CoNTINuEd)
(a) determination of fair value and fair value hierarchy (continued)
Sensitivity analysis for Level 3
Effect of reasonably possible Sensitivity alternative assumptions to: Type of of significant Statements of income unobservable unobservable favourable/(unfavourable) The group and the Bank input input changes 2018 Rm’000
financial assetsDerivative financial instruments- Equity derivatives Equity volatility +10% 1,084 -10% (1,113)
Equity/FX +10% 40 Correlation -10% (14)
Total* (3)
financial liabilitiesDerivative financial instruments- Equity derivatives Equity volatility +10% (1,084) -10% 1,113
Equity/FX +10 (40) Correlation -10% 14
Total* 3
* No or insignificant impact to the Group. All equity link derivatives with unobservable inputs are hedged back-to-back with external parties.
Effect of reasonably possible Sensitivity alternative assumptions to: Type of of significant Statements of income unobservable unobservable favourable/(unfavourable) The group and the Bank input input changes 2017 Rm’000
financial assetsDerivative financial instruments- Equity derivatives Equity volatility +10% 514 -10% (529)
Equity/FX +10% 95 Correlation -10% (122)
Total* (42)
financial liabilitiesDerivative financial instruments- Equity derivatives Equity volatility +10% (514) -10% 529
Equity/FX +10 (95) Correlation -10% 122
Total* 42
* No or insignificant impact to the Group. All equity link derivatives with unobservable inputs are hedged back-to-back with external parties.
NoTES To ThE fINANCIAL STATEmENTSfoR ThE fINANCIAL yEAR ENdEd 30 JuNE 2018

256ANNUALREPORT2018
HONG LEONG BANK BERHAD
47 fAIR VALuE of fINANCIAL INSTRumENTS (CoNTINuEd)
(b) fair values of financial instruments not carried at fair value
Set out below is the comparison of the carrying amounts and fair values of the financial instruments of the Group and the Bank which are not carried at fair value in the financial instruments, but for which fair value is disclosed. It does not include those short term/on demand financial assets and financial liabilities where the carrying amounts are reasonable approximation of their fair values:
2018 2017 Carrying fair Carrying fair Amount Value Amount Value The group Rm’000 Rm’000 Rm’000 Rm’000
financial AssetsFinancial investments held-to-maturity- Money market 12,708,356 12,578,559 12,059,374 11,998,585 - Unquoted securities 1,728,589 1,704,579 1,001,230 998,129 Loans, advances and financing 128,059,105 128,173,423 123,990,941 124,086,471
142,496,050 142,456,561 137,051,545 137,083,185
financial LiabilitiesDeposits from customers- At amortised cost 154,246,945 154,653,657 152,752,280 153,554,117 Recourse obligation on loans sold to Cagamas 202,952 201,829 202,926 201,195 Tier 2 subordinated bonds 2,902,908 2,907,243 2,402,145 2,398,710 Multi-currency Additional Tier 1 capital securities 401,192 406,003 – –Innovative Tier 1 capital securities 512,352 533,665 515,623 550,590
158,266,349 158,702,397 155,872,974 156,704,612
The Bank
financial AssetsFinancial investments held-to-maturity- Money market 9,790,600 9,683,606 9,662,488 9,612,915 - Unquoted securities 1,115,965 1,104,374 746,305 750,427 Loans, advances and financing 104,274,903 104,278,792 102,538,550 102,523,943
115,181,468 115,066,772 112,947,343 112,887,285
financial LiabilitiesDeposits from customers- At amortised cost 127,564,854 127,887,723 128,230,720 128,980,028 Recourse obligation on loans sold to Cagamas 202,952 201,829 202,926 201,195 Tier 2 subordinated bonds 2,502,278 2,506,283 2,001,642 1,997,750 Multi-currency Additional Tier 1 capital securities 401,192 406,003 – –Innovative Tier 1 capital securities 512,352 533,665 515,623 550,590
131,183,628 131,535,503 130,950,911 131,729,563
NoTES To ThE fINANCIAL STATEmENTSfoR ThE fINANCIAL yEAR ENdEd 30 JuNE 2018

257ANNUALREPORT
2018
FINANCIALS
47 fAIR VALuE of fINANCIAL INSTRumENTS (CoNTINuEd)
(b) fair values of financial instruments not carried at fair value (continued)
The following table analyses within the fair value hierarchy of the Group’s and the Bank’s assets and liabilities not measured at fair value at 30 June 2018 but for which fair value is disclosed:
The group 2018 Carrying fair Value Amount Level 1 Level 2 Level 3 Rm’000 Rm’000 Rm’000 Rm’000
financial AssetsFinancial investments held-to-maturity- Money market 12,708,356 – 12,578,559 – - Unquoted securities 1,728,589 – 1,704,093 486 Loans, advances and financing 128,059,105 – 128,173,423 –
142,496,050 – 142,456,075 486
financial LiabilitiesDeposits from customers- At amortised cost 154,246,945 – 154,653,657 –Recourse obligation on loans sold to Cagamas 202,952 – 201,829 –Tier 2 subordinated bonds 2,902,908 – 2,907,243 –Multi-currency Additional Tier 1 capital securities 401,192 – 406,003 –Innovative Tier 1 capital securities 512,352 – 533,665 –
158,266,349 – 158,702,397 –
The Bank 2018 Carrying fair Value Amount Level 1 Level 2 Level 3 Rm’000 Rm’000 Rm’000 Rm’000
financial AssetsFinancial investments held-to-maturity- Money market 9,790,600 – 9,683,606 – - Unquoted securities 1,115,965 – 1,103,888 486 Loans, advances and financing 104,274,903 – 104,278,792 –
115,181,468 – 115,066,286 486
financial LiabilitiesDeposits from customers- At amortised cost 127,564,854 – 127,887,723 –Recourse obligation on loans sold to Cagamas 202,952 – 201,829 –Tier 2 subordinated bonds 2,502,278 – 2,506,283 – Multi-currency Additional Tier 1 capital securities 401,192 – 406,003 –Innovative Tier 1 capital securities 512,352 – 533,665 –
131,183,628 – 131,535,503 –
NoTES To ThE fINANCIAL STATEmENTSfoR ThE fINANCIAL yEAR ENdEd 30 JuNE 2018
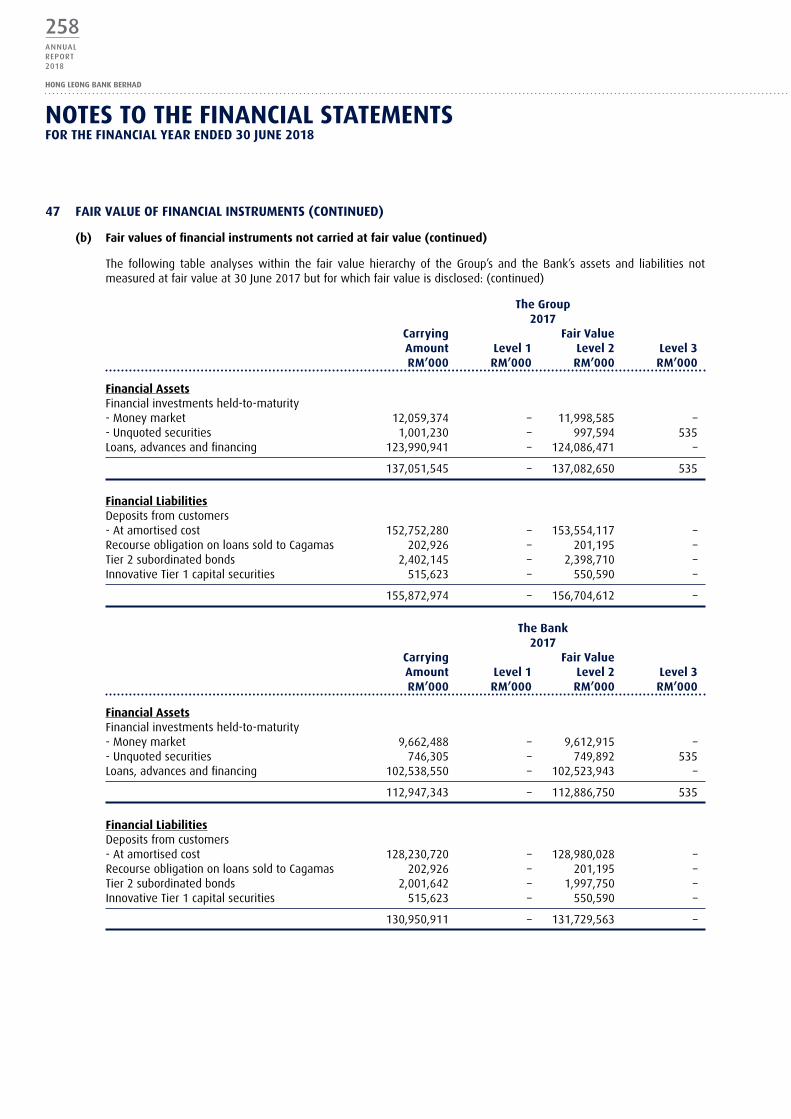
258ANNUALREPORT2018
HONG LEONG BANK BERHAD
47 fAIR VALuE of fINANCIAL INSTRumENTS (CoNTINuEd)
(b) fair values of financial instruments not carried at fair value (continued)
The following table analyses within the fair value hierarchy of the Group’s and the Bank’s assets and liabilities not measured at fair value at 30 June 2017 but for which fair value is disclosed: (continued)
The group 2017 Carrying fair Value Amount Level 1 Level 2 Level 3 Rm’000 Rm’000 Rm’000 Rm’000
financial AssetsFinancial investments held-to-maturity- Money market 12,059,374 – 11,998,585 – - Unquoted securities 1,001,230 – 997,594 535 Loans, advances and financing 123,990,941 – 124,086,471 –
137,051,545 – 137,082,650 535
financial LiabilitiesDeposits from customers- At amortised cost 152,752,280 – 153,554,117 – Recourse obligation on loans sold to Cagamas 202,926 – 201,195 – Tier 2 subordinated bonds 2,402,145 – 2,398,710 –Innovative Tier 1 capital securities 515,623 – 550,590 –
155,872,974 – 156,704,612 –
The Bank 2017 Carrying fair Value Amount Level 1 Level 2 Level 3 Rm’000 Rm’000 Rm’000 Rm’000
financial AssetsFinancial investments held-to-maturity- Money market 9,662,488 – 9,612,915 – - Unquoted securities 746,305 – 749,892 535 Loans, advances and financing 102,538,550 – 102,523,943 –
112,947,343 – 112,886,750 535
financial LiabilitiesDeposits from customers- At amortised cost 128,230,720 – 128,980,028 –Recourse obligation on loans sold to Cagamas 202,926 – 201,195 –Tier 2 subordinated bonds 2,001,642 – 1,997,750 –Innovative Tier 1 capital securities 515,623 – 550,590 –
130,950,911 – 131,729,563 –
NoTES To ThE fINANCIAL STATEmENTSfoR ThE fINANCIAL yEAR ENdEd 30 JuNE 2018
259ANNUALREPORT
2018
FINANCIALS
47 fAIR VALuE of fINANCIAL INSTRumENTS (CoNTINuEd)
(c) fair value methodologies and assumptions
Short-term funds and placements with financial institutions
For short-term funds and placements with financial institutions with maturities of less than six months, the carrying value is a reasonable estimate of fair value. For short-term funds and placements with maturities six months and above, estimated fair value is based on discounted cash flows using prevailing money market interest rates at which similar deposits and placements would be made with financial institutions of similar credit risk and remaining period to maturity.
Securities purchased under resale agreements
The fair values of securities purchased under resale agreements with maturities of less than six months approximate the carrying values. For securities purchased under resale agreements with maturities of six months and above, the estimated fair values are based on discounted cash flows using market rates for the remaining term to maturity.
Securities held at fair value through profit or loss, available-for-sale and held-to-maturity
The estimated fair value is generally based on quoted and observable market prices. Where there is no ready market in certain securities, the Group and the Bank establish the fair value by using valuation techniques.
Loans, advances and financing
For floating rate loans, the carrying value is generally a reasonable estimate of fair value. For fixed rate loans, the fair value is estimated by discounting the estimated future cash flows using the prevailing market rates of loans with similar credit risks and maturities.
deposits from customers
For deposits from customers with maturities of less than six months, the carrying amounts are reasonable estimates of their fair values. For deposit with maturities of six months and above, fair values are estimated using discounted cash flows based on prevailing market rates for similar deposits from customers.
deposits and placements of banks and other financial institutions, bills and acceptances payable
The estimated fair values of deposits and placements of banks and other financial institutions, bills and acceptances payable with maturities of less than six months approximate the carrying values. For the items with maturities six months and above, the fair values are estimated based on discounted cash flows using prevailing money market interest rates with similar remaining period to maturities.
Recourse obligation on loans sold to Cagamas Berhad
For amounts due to Cagamas Berhad with maturities of less than one year, the carrying amounts are a reasonable estimate of their fair values. For amounts due to Cagamas Berhad with maturities of more than one year, fair value is estimated based on discounted cash flows using prevailing money market interest rates with similar remaining period to maturity.
Subordinated obligations and capital securities
The fair value of subordinated obligations and capital securities are based on quoted market prices where available.
NoTES To ThE fINANCIAL STATEmENTSfoR ThE fINANCIAL yEAR ENdEd 30 JuNE 2018
260ANNUALREPORT2018
HONG LEONG BANK BERHAD
47 fAIR VALuE of fINANCIAL INSTRumENTS (CoNTINuEd)
(c) fair value methodologies and assumptions (continued)
other financial assets and liabilities
The carrying value less any estimated allowance for financial assets and liabilities included in “other assets and liabilities” are assumed to approximate their fair values as these items are not materially sensitive to the shift in market interest rates.
Credit related commitment and contingencies
The net fair value of these items was not calculated as estimated fair values are not readily ascertainable. These financial instruments generally relate to credit risks and attract fees in line with market prices for similar arrangements. They are not presently sold nor traded. The fair value may be represented by the present value of fees expected to be received, less associated costs.
foreign exchange and interest rate related contracts
The fair values of foreign exchange and interest rate related contracts are the estimated amounts the Group or the Bank would receive to sell or pay to transfer the contracts at the date of statements of financial position.
NoTES To ThE fINANCIAL STATEmENTSfoR ThE fINANCIAL yEAR ENdEd 30 JuNE 2018
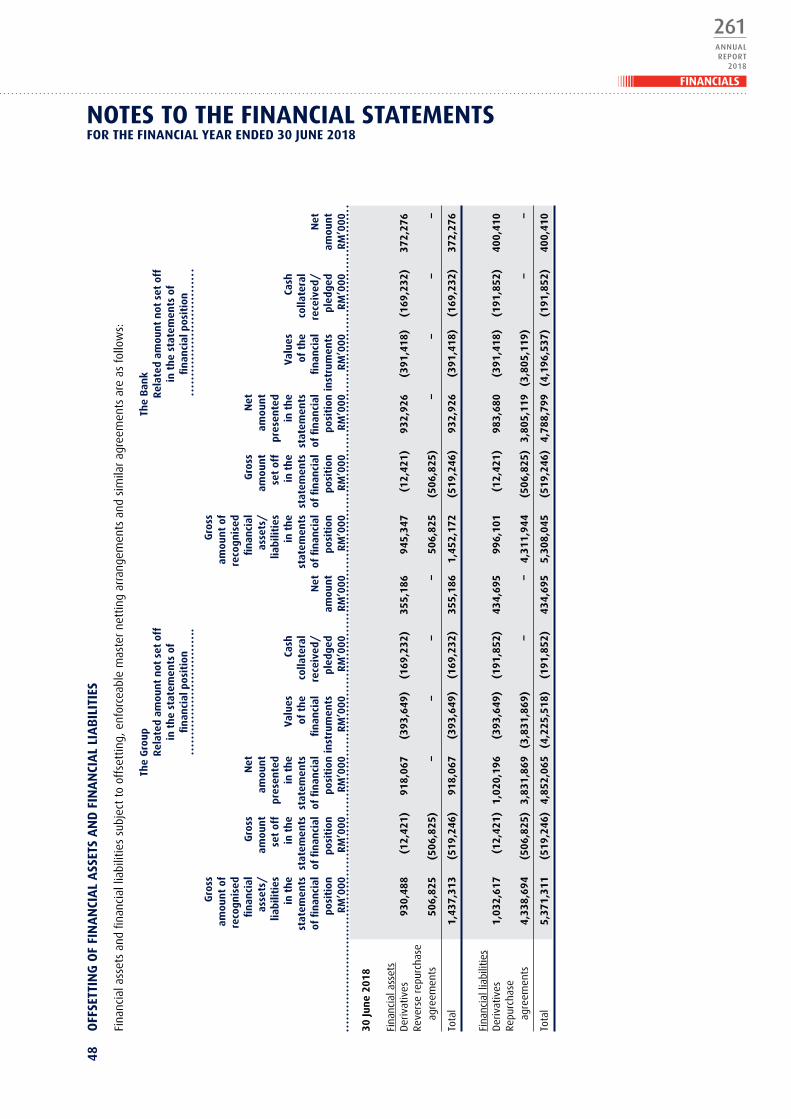
261ANNUALREPORT
2018
FINANCIALS48
o
ffSE
TTIN
g o
f fI
NA
NCI
AL
ASS
ETS
AN
d f
INA
NCI
AL
LIA
BIL
ITIE
S
Fina
ncia
l ass
ets
and
finan
cial
liab
ilitie
s su
bjec
t to
off
sett
ing,
enf
orce
able
mas
ter
nett
ing
arra
ngem
ents
and
sim
ilar
agre
emen
ts a
re a
s fo
llow
s:
Th
e g
roup
Th
e B
ank
R
elat
ed a
mou
nt
not
set
off
R
elat
ed a
mou
nt
not
set
off
in t
he
stat
emen
ts o
f
in t
he
stat
emen
ts o
f
fin
anci
al p
osit
ion
fi
nan
cial
pos
itio
n
g
ross
gro
ss
am
oun
t of
amou
nt
of
re
cogn
ised
reco
gnis
ed
fi
nan
cial
g
ross
N
et
fi
nan
cial
g
ross
N
et
as
sets
/
amou
nt
amou
nt
as
sets
/
amou
nt
amou
nt
lia
bilit
ies
se
t of
f pr
esen
ted
lia
bilit
ies
set
off
pres
ente
d
in t
he
in
th
e in
th
e Va
lues
Ca
sh
in
th
e in
th
e in
th
e Va
lues
Ca
sh
st
atem
ents
st
atem
ents
st
atem
ents
of
th
e co
llate
ral
st
atem
ents
st
atem
ents
st
atem
ents
of
th
e co
llate
ral
of
fin
anci
al
of fi
nan
cial
of
fin
anci
al
fin
anci
al
rece
ived
/
Net
of
fin
anci
al
of fi
nan
cial
of
fin
anci
al
fin
anci
al
rece
ived
/
Net
posi
tion
po
siti
on
posi
tion
in
stru
men
ts
pled
ged
amou
nt
pos
itio
n
posi
tion
po
siti
on i
nst
rum
ents
p
ledg
ed
amou
nt
R
m’0
00
Rm
’000
R
m’0
00
Rm
’000
R
m’0
00
Rm
’000
R
m’0
00
Rm
’000
R
m’0
00
Rm
’000
R
m’0
00
Rm
’000
30 Ju
ne
2018
Fina
ncia
l ass
ets
Der
ivat
ives
9
30,4
88
(12
,421
) 9
18,0
67
(39
3,64
9)
(16
9,23
2)
355
,186
9
45,3
47
(12
,421
) 9
32,9
26
(39
1,41
8)
(16
9,23
2)
372
,276
Re
vers
e re
purc
hase
ag
reem
ents
5
06,8
25
(50
6,82
5)
– –
– –
506
,825
(
506,
825)
–
– –
–
Tota
l 1
,437
,313
(
519,
246)
9
18,0
67
(39
3,64
9)
(16
9,23
2)
355
,186
1
,452
,172
(
519,
246)
9
32,9
26
(39
1,41
8)
(16
9,23
2)
372
,276
Fina
ncia
l lia
bilit
ies
Der
ivat
ives
1
,032
,617
(
12,4
21)
1,0
20,1
96
(39
3,64
9)
(19
1,85
2)
434
,695
9
96,1
01
(12
,421
) 9
83,6
80
(39
1,41
8)
(19
1,85
2)
400
,410
Re
purc
hase
ag
reem
ents
4
,338
,694
(
506,
825)
3,
831,
869
(3,
831,
869)
–
–
4,3
11,9
44
(50
6,82
5)
3,80
5,11
9 (
3,80
5,11
9)
– –
Tota
l 5
,371
,311
(
519,
246)
4,
852,
065
(4,
225,
518)
(
191,
852)
4
34,6
95
5,3
08,0
45
(51
9,24
6)
4,78
8,79
9 (
4,19
6,53
7)
(19
1,85
2)
400
,410
NoTES To ThE fINANCIAL STATEmENTSfoR ThE fINANCIAL yEAR ENdEd 30 JuNE 2018
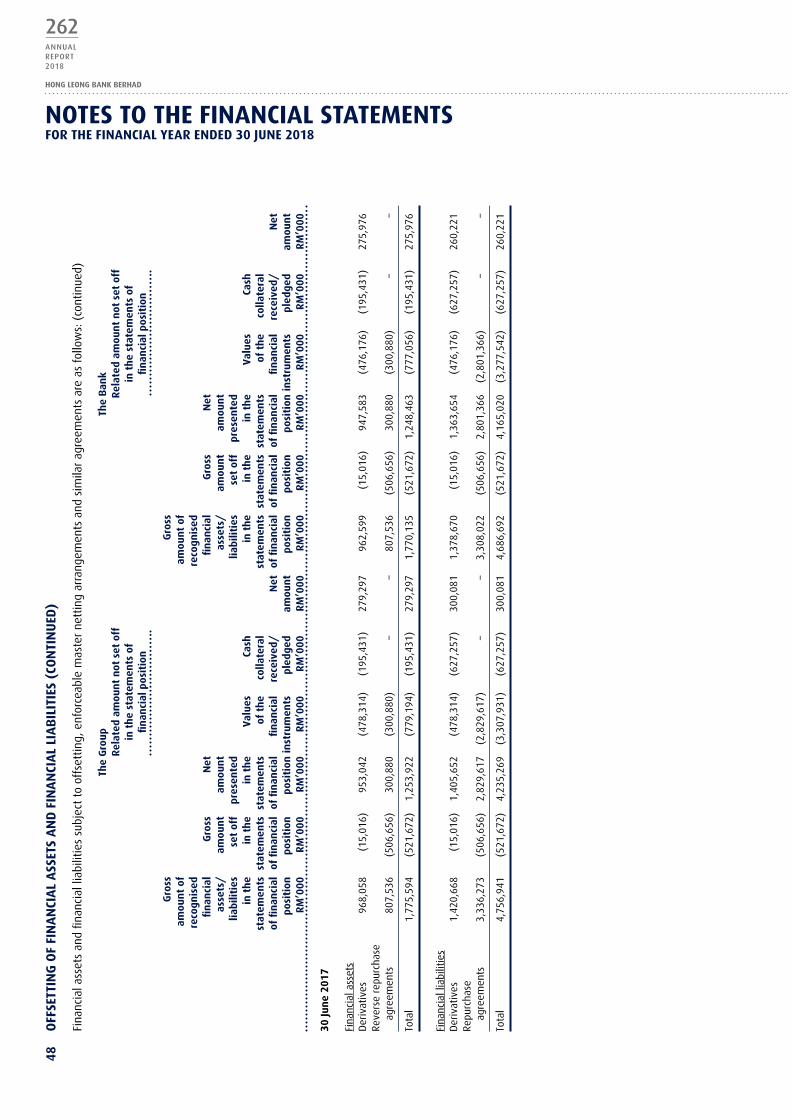
262ANNUALREPORT2018
HONG LEONG BANK BERHAD
48
off
SETT
INg
of
fIN
AN
CIA
L A
SSET
S A
Nd
fIN
AN
CIA
L LI
AB
ILIT
IES
(Co
NTI
Nu
Ed)
Fina
ncia
l ass
ets
and
finan
cial
liab
ilitie
s su
bjec
t to
off
sett
ing,
enf
orce
able
mas
ter
nett
ing
arra
ngem
ents
and
sim
ilar
agre
emen
ts a
re a
s fo
llow
s: (
cont
inue
d)
Th
e g
roup
Th
e B
ank
R
elat
ed a
mou
nt
not
set
off
R
elat
ed a
mou
nt
not
set
off
in t
he
stat
emen
ts o
f
in t
he
stat
emen
ts o
f
fin
anci
al p
osit
ion
fi
nan
cial
pos
itio
n
g
ross
gro
ss
am
oun
t of
amou
nt
of
re
cogn
ised
reco
gnis
ed
fi
nan
cial
g
ross
N
et
fi
nan
cial
g
ross
N
et
as
sets
/
amou
nt
amou
nt
as
sets
/
amou
nt
amou
nt
lia
bilit
ies
se
t of
f pr
esen
ted
lia
bilit
ies
set
off
pres
ente
d
in t
he
in
th
e in
th
e Va
lues
Ca
sh
in
th
e in
th
e in
th
e Va
lues
Ca
sh
st
atem
ents
st
atem
ents
st
atem
ents
of
th
e co
llate
ral
st
atem
ents
st
atem
ents
st
atem
ents
of
th
e co
llate
ral
of
fin
anci
al
of fi
nan
cial
of
fin
anci
al
fin
anci
al
rece
ived
/
Net
of
fin
anci
al
of fi
nan
cial
of
fin
anci
al
fin
anci
al
rece
ived
/
Net
posi
tion
po
siti
on
posi
tion
in
stru
men
ts
pled
ged
amou
nt
pos
itio
n
posi
tion
po
siti
on i
nst
rum
ents
p
ledg
ed
amou
nt
R
m’0
00
Rm
’000
R
m’0
00
Rm
’000
R
m’0
00
Rm
’000
R
m’0
00
Rm
’000
R
m’0
00
Rm
’000
R
m’0
00
Rm
’000
30 Ju
ne
2017
Fina
ncia
l ass
ets
Der
ivat
ives
9
68,0
58
(15
,016
) 9
53,0
42
(47
8,31
4)
(19
5,43
1)
279
,297
9
62,5
99
(15
,016
) 9
47,5
83
(47
6,17
6)
(19
5,43
1)
275
,976
Re
vers
e re
purc
hase
ag
reem
ents
8
07,5
36
(50
6,65
6)
300
,880
(
300,
880)
–
–
8
07,5
36
(50
6,65
6)
300
,880
(
300,
880)
–
–
Tota
l 1
,775
,594
(
521,
672)
1
,253
,922
(
779,
194)
(
195,
431)
2
79,2
97
1,7
70,1
35
(52
1,67
2)
1,2
48,4
63
(77
7,05
6)
(19
5,43
1)
275
,976
Fina
ncia
l lia
bilit
ies
Der
ivat
ives
1
,420
,668
(
15,0
16)
1,4
05,6
52
(47
8,31
4)
(62
7,25
7)
300
,081
1
,378
,670
(
15,0
16)
1,3
63,6
54
(47
6,17
6)
(62
7,25
7)
260
,221
Re
purc
hase
ag
reem
ents
3
,336
,273
(
506,
656)
2
,829
,617
(
2,82
9,61
7)
–
–
3,3
08,0
22
(50
6,65
6)
2,8
01,3
66
(2,
801,
366)
–
–
Tota
l 4
,756
,941
(
521,
672)
4
,235
,269
(
3,30
7,93
1)
(62
7,25
7)
300
,081
4
,686
,692
(
521,
672)
4
,165
,020
(
3,27
7,54
2)
(62
7,25
7)
260
,221
NoTES To ThE fINANCIAL STATEmENTSfoR ThE fINANCIAL yEAR ENdEd 30 JuNE 2018

263ANNUALREPORT
2018
FINANCIALS
49 CAPITAL AdEquACy
The Group’s and the Bank’s regulatory capital is governed by BNM’s Capital Adequacy Framework guidelines. The capital adequacy ratios of the Group and the Bank are computed in accordance with BNM’s Capital Adequacy Framework (Capital Components) (the “Framework”). The Framework sets out the approach for computing the regulatory capital adequacy ratios, the minimum levels of the ratios at which banking institutions are required to operate as well as requirement on Capital Conservation Buffer (“CCB”) and Counter Cyclical Buffer (“CCyB”). The Group and the Bank are also required to maintain CCB of up to 2.500% of total risk weighted assets (“RWA”), which is phased in starting with 0.625% in year 2016, 1.250% in year 2017, 1.875% in year 2018 and 2.500% in year 2019. The CCyB which ranges from 0% up to 2.500% is determined as the weighted average of prevailing CCyB rates applied in the jurisdictions in which a financial institution has credit exposures. The minimum capital adequacy including CCB for Common Equity Tier I (CET I) capital ratio, Tier I capital ratio and Total capital ratio for year 2018 are 6.375%, 7.875% and 9.875% respectively.
The Group and the Bank have adopted the Standardised Approach for Credit Risk and Market Risk, and the Basic Indicator Approach for Operational Risk computation in deriving the RWA.
Individual entities within the Group comply with all externally imposed capital requirements to which they are subject to.
(a) The capital adequacy ratios of the group and the Bank are as follows:
The group The Bank 2018 2017 2018 2017
Before deducting proposed dividendsCET I capital ratio 13.113% 13.788% 12.545% 13.078%Tier I capital ratio 13.797% 14.193% 12.997% 13.556%Total capital ratio 16.752% 16.280% 16.301% 15.997%
After deducting proposed dividendsCET I capital ratio 12.614% 13.286% 11.949% 12.486%Tier I capital ratio 13.298% 13.691% 12.401% 12.964%Total capital ratio 16.253% 15.779% 15.706% 15.405%
NoTES To ThE fINANCIAL STATEmENTSfoR ThE fINANCIAL yEAR ENdEd 30 JuNE 2018
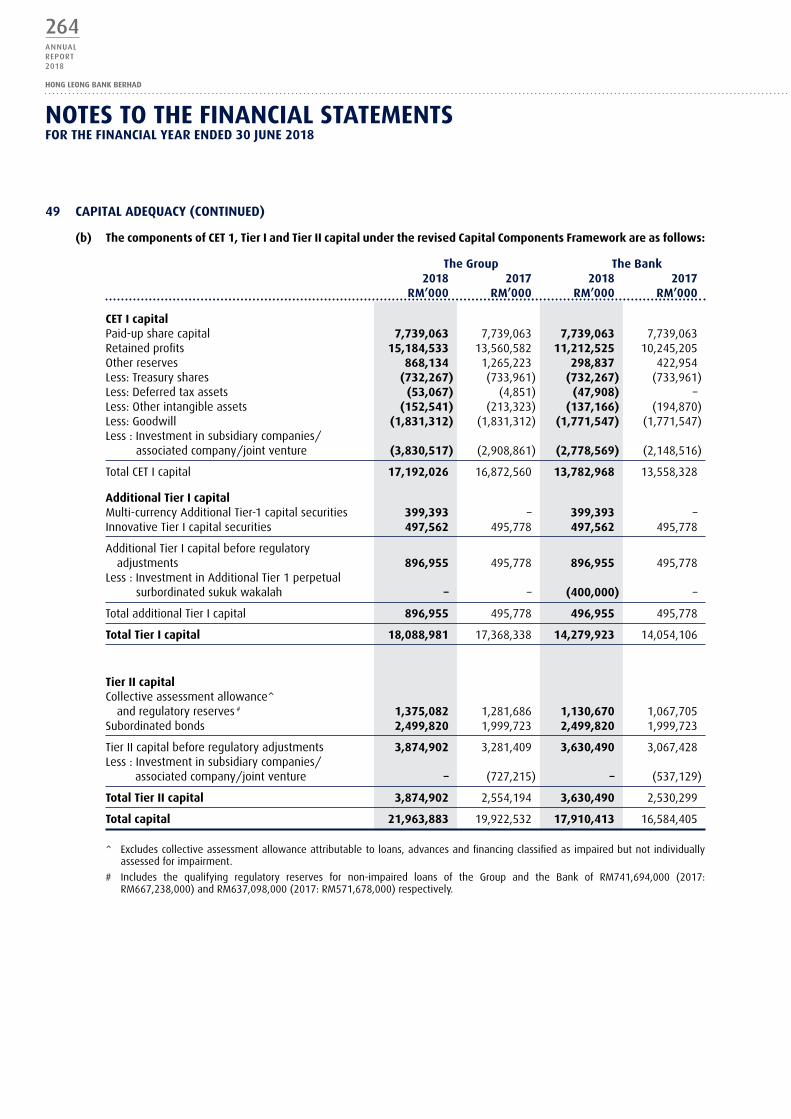
264ANNUALREPORT2018
HONG LEONG BANK BERHAD
49 CAPITAL AdEquACy (CoNTINuEd)
(b) The components of CET 1, Tier I and Tier II capital under the revised Capital Components framework are as follows:
The group The Bank 2018 2017 2018 2017 Rm’000 Rm’000 Rm’000 Rm’000
CET I capitalPaid-up share capital 7,739,063 7,739,063 7,739,063 7,739,063 Retained profits 15,184,533 13,560,582 11,212,525 10,245,205 Other reserves 868,134 1,265,223 298,837 422,954 Less: Treasury shares (732,267) (733,961) (732,267) (733,961)Less: Deferred tax assets (53,067) (4,851) (47,908) – Less: Other intangible assets (152,541) (213,323) (137,166) (194,870)Less: Goodwill (1,831,312) (1,831,312) (1,771,547) (1,771,547)Less : Investment in subsidiary companies/
associated company/joint venture (3,830,517) (2,908,861) (2,778,569) (2,148,516)
Total CET I capital 17,192,026 16,872,560 13,782,968 13,558,328
Additional Tier I capitalMulti-currency Additional Tier-1 capital securities 399,393 – 399,393 – Innovative Tier I capital securities 497,562 495,778 497,562 495,778
Additional Tier I capital before regulatory adjustments 896,955 495,778 896,955 495,778
Less : Investment in Additional Tier 1 perpetual surbordinated sukuk wakalah – – (400,000) –
Total additional Tier I capital 896,955 495,778 496,955 495,778
Total Tier I capital 18,088,981 17,368,338 14,279,923 14,054,106
Tier II capitalCollective assessment allowance^
and regulatory reserves # 1,375,082 1,281,686 1,130,670 1,067,705 Subordinated bonds 2,499,820 1,999,723 2,499,820 1,999,723
Tier II capital before regulatory adjustments 3,874,902 3,281,409 3,630,490 3,067,428 Less : Investment in subsidiary companies/
associated company/joint venture – (727,215) – (537,129)
Total Tier II capital 3,874,902 2,554,194 3,630,490 2,530,299
Total capital 21,963,883 19,922,532 17,910,413 16,584,405
^ Excludes collective assessment allowance attributable to loans, advances and financing classified as impaired but not individually assessed for impairment.
# Includes the qualifying regulatory reserves for non-impaired loans of the Group and the Bank of RM741,694,000 (2017: RM667,238,000) and RM637,098,000 (2017: RM571,678,000) respectively.
NoTES To ThE fINANCIAL STATEmENTSfoR ThE fINANCIAL yEAR ENdEd 30 JuNE 2018

265ANNUALREPORT
2018
FINANCIALS
49 CAPITAL AdEquACy (CoNTINuEd)
(c) The breakdown of RwA by each major risk category is as follows:
The group The Bank 2018 2017 2018 2017 Rm’000 Rm’000 Rm’000 Rm’000
Credit risk 118,853,998 111,299,987 98,504,099 93,397,418 Market risk 3,850,444 3,115,525 4,140,291 3,340,119 Operational risk 8,403,939 7,958,340 7,226,134 6,934,552
Total RWA 131,108,381 122,373,852 109,870,524 103,672,089
(d) The capital adequacy ratios of the banking subsidiary company of the group are as follows:
hong Leong Islamic Bank Berhad 2018 2017
Before deducting proposed dividendsCET I capital ratio 10.461% 10.622%Tier I capital ratio 12.404% 10.622%Total capital ratio 15.477% 13.946%
After deducting proposed dividendsCET I capital ratio 10.461% 10.622%Tier I capital ratio 12.404% 10.622%Total capital ratio 15.477% 13.946%
50 SEgmENT REPoRTINg
Business segment reporting
The business segment results are prepared based on the Group’s internal management reporting reflective of the organisation’s management reporting structure.
The various business segments are described below:
Personal Financial Services focuses mainly on servicing individual customers and small businesses. Products and services that are extended to customers include mortgages, credit cards, hire purchase and others.
Business & Corporate Banking focuses mainly on corporate and small medium enterprises. Products offered include trade financing, working capital facilities, other term financing and corporate advisory services.
Global Markets refers to the Group’s domestic treasury and capital market operations and includes foreign exchange, money market operations as well as capital market securities trading and investments.
Overseas/International Operations refers to Hong Leong Bank Berhad Overseas Branches, Subsidiaries, Associate, Joint Venture and Representative Office. The overseas operations are mainly in commercial banking and treasury business.
Other operations refers to head office and other subsidiaries.
NoTES To ThE fINANCIAL STATEmENTSfoR ThE fINANCIAL yEAR ENdEd 30 JuNE 2018

266ANNUALREPORT2018
HONG LEONG BANK BERHAD
50 SEgmENT REPoRTINg (CoNTINuEd)
Business segment reporting (continued)
Personal Business overseas/ Inter- financial & Corporate global International other Segment Services Banking markets operations operations Elimination Total The group Rm’000 Rm’000 Rm’000 Rm’000 Rm’000 Rm’000 Rm’000
2018Revenue- external 2,610,192 685,968 1,352,599 235,723 198,853 (243,770) 4,839,565 - inter-segment ^ (56,665) 454,651 (775,811) – 377,825 – –
Segment revenue 2,553,527 1,140,619 576,788 235,723 576,678 (243,770) 4,839,565
Overhead expenses (1,359,981) (317,197) (109,178) (198,134) (64,346) (11,613) (2,060,449)of which:
Depreciation of property and equipment 53,799 4,851 13,333 9,454 39,233 142 120,812
Amortisation of intangible assets 9,977 1,672 1,199 3,258 55,735 – 71,841
(Allowance for)/ write-back of allowance for impairment losses on loans, advances and financing (74,930) 979 – 15,298 (17,998) – (76,651)
Write-back of impairment losses on financial investments – 6,381 542 208 – – 7,131
Share of results of associated company – – – 516,111 – – 516,111
Share of results in joint venture – – – 20,548 – – 20,548
Segment results 1,118,616 830,782 468,152 589,754 494,334 (255,383) 3,246,255 Taxation (608,177)
Net profit for the financial year 2,638,078
Segment assets 90,642,621 31,235,152 57,564,956 13,414,023 – – 192,856,752 Unallocated assets 10,034,021
Total assets 202,890,773
Segment liabilities 93,547,364 39,191,881 31,436,788 12,450,549 – – 176,626,582 Unallocated liabilities 2,371,932
Total liabilities 178,998,514
other significant segment items
Capital expenditure 60,281 17,062 2,198 5,354 51,131 – 136,026
^ Inter-segment transfer is based on internally computed cost of funds.
Note:1. Total segment revenue comprises net interest income, income from Islamic Banking business and non-interest income.2. Unallocated assets and liabilities are not directly attributed to the business segments and cannot be allocated on a reasonable basis.
NoTES To ThE fINANCIAL STATEmENTSfoR ThE fINANCIAL yEAR ENdEd 30 JuNE 2018

267ANNUALREPORT
2018
FINANCIALS
50 SEgmENT REPoRTINg (CoNTINuEd)
Business segment reporting (continued)
Personal Business overseas/ Inter- financial & Corporate global International other Segment Services Banking markets operations operations Elimination Total The group Rm’000 Rm’000 Rm’000 Rm’000 Rm’000 Rm’000 Rm’000
2017Revenue- external 2,574,044 681,259 1,275,147 233,649 40,471 (253,921) 4,550,649 - inter-segment ^ (48,016) 413,286 (754,687) – 389,417 – –
Segment revenue 2,526,028 1,094,545 520,460 233,649 429,888 (253,921) 4,550,649
Overhead expenses (1,328,744) (296,655) (111,135) (198,783) (73,676) 1,470 (2,007,523)of which:
Depreciation of property and equipment 48,635 4,300 10,771 8,286 19,343 142 91,477
Amortisation of intangible assets 10,217 1,668 1,194 3,082 58,308 – 74,469
(Allowance for)/ write-back of allowance for impairment losses on loans, advances and financing (77,432) (84,879) – 1,152 – – (161,159)
Write-back of/ (allowance for) impairment losses on financial investments – 5,375 (3,376) 223 – – 2,222
Share of results of associated company – – – 342,910 – – 342,910
Share of results in joint venture – – – 21,153 – – 21,153
Segment results 1,119,852 718,386 405,949 400,304 356,212 (252,451) 2,748,252 Taxation (603,236)
Net profit for the financial year 2,145,016
Segment assets 87,715,416 30,023,755 55,644,489 12,140,376 – – 185,524,036 Unallocated assets 10,028,486
Total assets 195,552,522
Segment liabilities 91,573,091 40,001,306 27,676,608 11,188,959 – – 170,439,964 Unallocated liabilities 2,427,145
Total liabilities 172,867,109
other significant segment items
Capital expenditure 52,546 11,184 3,757 22,347 87,823 – 177,657
^ Inter-segment transfer is based on internally computed cost of funds.
Note:1. Total segment revenue comprises net interest income, income from Islamic Banking business and non-interest income.2. Unallocated assets and liabilities are not directly attributed to the business segments and cannot be allocated on a reasonable basis.
NoTES To ThE fINANCIAL STATEmENTSfoR ThE fINANCIAL yEAR ENdEd 30 JuNE 2018

268ANNUALREPORT2018
HONG LEONG BANK BERHAD
50 SEgmENT REPoRTINg (CoNTINuEd)
The group operates in two main geographical areas:
- Malaysia, the home country of the Group, which includes all the areas of operations in the primary business segments.
- Overseas operations, which includes branch, subsidiary, associate and joint venture operations in Singapore, Hong Kong, China, Vietnam and Cambodia. The overseas operations are mainly in commercial banking and treasury business.
Total Total Capital Revenue assets liabilities expenditure The group Rm’000 Rm’000 Rm’000 Rm’000
2018Malaysia 4,603,842 189,474,863 166,531,761 130,672 Overseas operations 235,723 13,415,910 12,466,753 5,354
4,839,565 202,890,773 178,998,514 136,026
2017Malaysia 4,317,000 183,407,294 161,678,150 155,311 Overseas operations 233,649 12,145,228 11,188,959 22,346
4,550,649 195,552,522 172,867,109 177,657
51 SIgNIfICANT EVENTS duRINg ThE fINANCIAL yEAR
(a) On 2 November 2017, Hong Leong Investment Bank Berhad, on behalf of the Bank, lodged with Securities Commission Malaysia a multi-currency Additional Tier 1 capital securities programme for the issuance of Additional Tier 1 capital securities (“Capital Securities”) of up to RM10.0 billion (or its equivalent in other currencies) in nominal value (“AT1 Programme”).
Proceeds from issuances under the AT1 Programme shall be utilised, without limitation, for on-lending to the Bank’s subsidiaries, for investment into the Bank’s subsidiaries, for working capital, general banking and other corporate purposes and/or if required, the refinancing of any existing financing obligations of the Bank and/or any existing Capital Securities issued under the AT1 Programme.
The AT1 Programme has been assigned an A1 rating by RAM Rating Services Berhad.
The Capital Securities are intended to qualify as Additional Tier 1 capital for the Bank pursuant to the Capital Adequacy Framework (Capital Components) issued by BNM on 4 August 2017 and as updated from time to time (“New CA Framework”), and to qualify as the consolidated Additional Tier 1 capital of Hong Leong Financial Group Berhad under the New CA Framework. Approval from BNM for the establishment of the AT1 Programme was obtained on 15 September 2017 (upon terms and conditions therein contained).
(b) On 31 January 2018, our associated company, BOCD was officially listed on the Shanghai Stock Exchange after completing its initial public offering (“IPO”) of 361 million shares and raised 2.53 billion yuan. Arising from the IPO, the Bank’s equity interest of the enlarged capital in BOCD is now reduced to 18% from 20%.
(c) On 25 June 2018, the Bank issued a second tranche of RM500.0 million nominal value of 10-years non-callable 5 years Sub Notes callable on 26 June 2023 (and thereafter) and due on 23 June 2028 out of its RM10.0 billion Multi-Currency Sub Notes Programme. The coupon rate for this second tranche of the Sub Notes is 4.86% per annum, which is payable semi-annually in arrears from the date of the issue.
NoTES To ThE fINANCIAL STATEmENTSfoR ThE fINANCIAL yEAR ENdEd 30 JuNE 2018
269ANNUALREPORT
2018
FINANCIALS
51 SIgNIfICANT EVENTS duRINg ThE fINANCIAL yEAR (CoNTINuEd)
(d) Pursuant to Section 247(3) of the Companies Act 2016, the Companies Commission of Malaysia had on 5 July 2018 granted its approval for HLBVN, a wholly-owned subsidiary of the Bank incorporated in the Socialist Republic of Vietnam, to have a different financial year end from its holding company. The financial year end of HLBVN is 31 December as required under the Law on Credit Institutions of Vietnam.
(e) Pursuant to Section 247(3) of the Companies Act 2016, the Companies Commission of Malaysia had on 5 July 2018 granted its approval for HLBCAM, a wholly-owned subsidiary of the Bank incorporated in the Kingdom of Cambodia, to have a different financial year end from its holding company. The financial year end of HLBCAM is 31 December as required under the Prakas on Annual Audit of Financial Statement of Banks and Financial Institutions issued by the National Bank of Cambodia.
52 SuBSEquENT EVENTS AfTER ThE fINANCIAL yEAR
There are no material subsequent events after the financial year that require disclosure or adjustments to the financial statements.
53 EquITy ComPENSATIoN BENEfITS
Executive Share Scheme
The Bank has established and implemented an Executive Share Scheme.
(a) Executive Share Scheme (“ESS”)
The ESS of up to ten percent (10%) of the total number of issued shares (excluding treasury shares) of the Bank comprises the Executive Share Option Scheme (“ESOS”) and the Executive Share Grant Scheme (“ESGS”).
The main features of the ESS are, inter alia, as follows:
1. Eligible executives are persons as defined by the ESS Bye-Laws.
2. The maximum allowable allotments for the full time Executive Directors had been approved by the shareholders of the Bank in the annual general meeting held on 29 October 2013 and 25 October 2012. The Board, as defined by the ESS Bye-Laws, may from time to time at its absolute discretion select and identify suitable eligible executives to be offered options or grants.
3. At any point of time during the existence of the ESS, the aggregate number of shares comprised in the options and grants under the ESS and any other executive share schemes established by the Bank which are still subsisting shall not exceed 10% of the total number of issued shares (excluding treasury shares) of the Bank at any one time.
4. The exercise of the options under the ESOS or the vesting of shares under the ESGS may, at the absolute discretion of the Board, be satisfied by way of issuance of new shares; transfer of existing shares purchased by a trust established for the ESS; or a combination of both new shares and existing shares.
NoTES To ThE fINANCIAL STATEmENTSfoR ThE fINANCIAL yEAR ENdEd 30 JuNE 2018
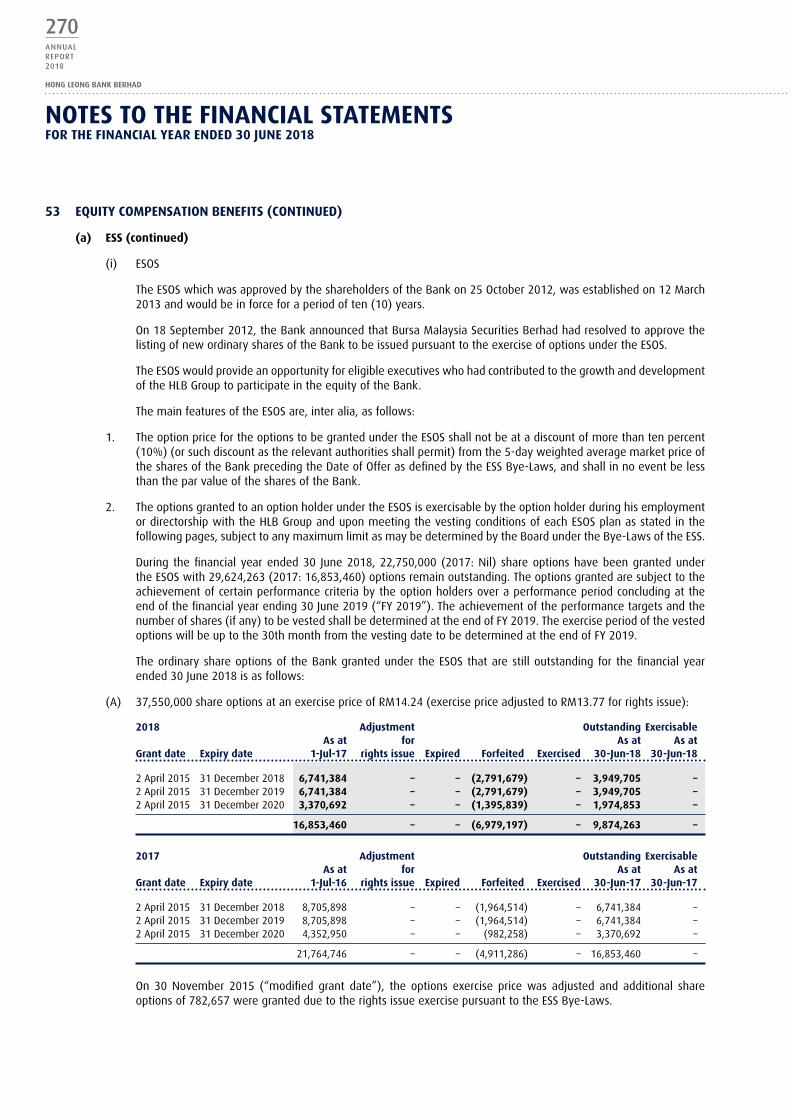
270ANNUALREPORT2018
HONG LEONG BANK BERHAD
53 EquITy ComPENSATIoN BENEfITS (CoNTINuEd)
(a) ESS (continued)
(i) ESOS
The ESOS which was approved by the shareholders of the Bank on 25 October 2012, was established on 12 March 2013 and would be in force for a period of ten (10) years.
On 18 September 2012, the Bank announced that Bursa Malaysia Securities Berhad had resolved to approve the listing of new ordinary shares of the Bank to be issued pursuant to the exercise of options under the ESOS.
The ESOS would provide an opportunity for eligible executives who had contributed to the growth and development of the HLB Group to participate in the equity of the Bank.
The main features of the ESOS are, inter alia, as follows:
1. The option price for the options to be granted under the ESOS shall not be at a discount of more than ten percent (10%) (or such discount as the relevant authorities shall permit) from the 5-day weighted average market price of the shares of the Bank preceding the Date of Offer as defined by the ESS Bye-Laws, and shall in no event be less than the par value of the shares of the Bank.
2. The options granted to an option holder under the ESOS is exercisable by the option holder during his employment or directorship with the HLB Group and upon meeting the vesting conditions of each ESOS plan as stated in the following pages, subject to any maximum limit as may be determined by the Board under the Bye-Laws of the ESS.
During the financial year ended 30 June 2018, 22,750,000 (2017: Nil) share options have been granted under the ESOS with 29,624,263 (2017: 16,853,460) options remain outstanding. The options granted are subject to the achievement of certain performance criteria by the option holders over a performance period concluding at the end of the financial year ending 30 June 2019 (“FY 2019”). The achievement of the performance targets and the number of shares (if any) to be vested shall be determined at the end of FY 2019. The exercise period of the vested options will be up to the 30th month from the vesting date to be determined at the end of FY 2019.
The ordinary share options of the Bank granted under the ESOS that are still outstanding for the financial year ended 30 June 2018 is as follows:
(A) 37,550,000 share options at an exercise price of RM14.24 (exercise price adjusted to RM13.77 for rights issue):
2018 Adjustment outstanding Exercisable As at for As at As at grant date Expiry date 1-Jul-17 rights issue Expired forfeited Exercised 30-Jun-18 30-Jun-18
2 April 2015 31 December 2018 6,741,384 – – (2,791,679) – 3,949,705 – 2 April 2015 31 December 2019 6,741,384 – – (2,791,679) – 3,949,705 – 2 April 2015 31 December 2020 3,370,692 – – (1,395,839) – 1,974,853 –
16,853,460 – – (6,979,197) – 9,874,263 –
2017 Adjustment outstanding Exercisable As at for As at As at grant date Expiry date 1-Jul-16 rights issue Expired forfeited Exercised 30-Jun-17 30-Jun-17
2 April 2015 31 December 2018 8,705,898 – – (1,964,514) – 6,741,384 – 2 April 2015 31 December 2019 8,705,898 – – (1,964,514) – 6,741,384 – 2 April 2015 31 December 2020 4,352,950 – – (982,258) – 3,370,692 –
21,764,746 – – (4,911,286) – 16,853,460 –
On 30 November 2015 (“modified grant date”), the options exercise price was adjusted and additional share options of 782,657 were granted due to the rights issue exercise pursuant to the ESS Bye-Laws.
NoTES To ThE fINANCIAL STATEmENTSfoR ThE fINANCIAL yEAR ENdEd 30 JuNE 2018
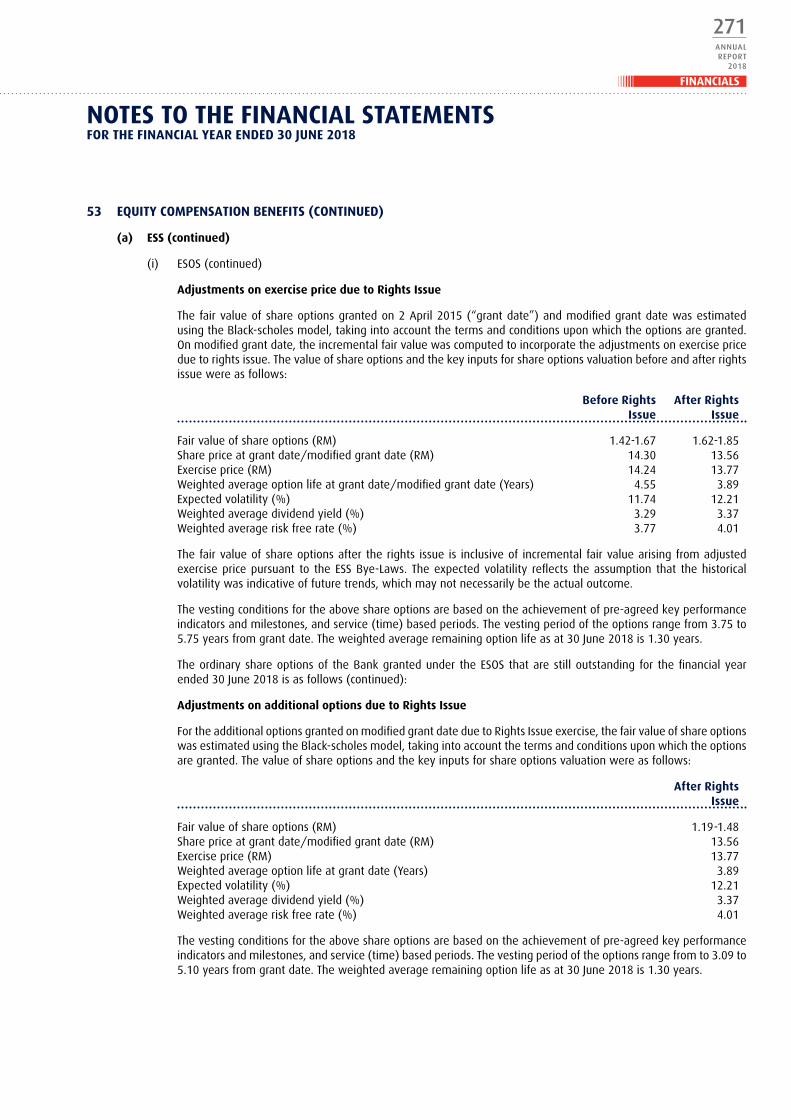
271ANNUALREPORT
2018
FINANCIALS
53 EquITy ComPENSATIoN BENEfITS (CoNTINuEd)
(a) ESS (continued)
(i) ESOS (continued)
Adjustments on exercise price due to Rights Issue
The fair value of share options granted on 2 April 2015 (“grant date”) and modified grant date was estimated using the Black-scholes model, taking into account the terms and conditions upon which the options are granted. On modified grant date, the incremental fair value was computed to incorporate the adjustments on exercise price due to rights issue. The value of share options and the key inputs for share options valuation before and after rights issue were as follows:
Before Rights After Rights Issue Issue
Fair value of share options (RM) 1.42-1.67 1.62-1.85 Share price at grant date/modified grant date (RM) 14.30 13.56 Exercise price (RM) 14.24 13.77 Weighted average option life at grant date/modified grant date (Years) 4.55 3.89 Expected volatility (%) 11.74 12.21 Weighted average dividend yield (%) 3.29 3.37 Weighted average risk free rate (%) 3.77 4.01
The fair value of share options after the rights issue is inclusive of incremental fair value arising from adjusted exercise price pursuant to the ESS Bye-Laws. The expected volatility reflects the assumption that the historical volatility was indicative of future trends, which may not necessarily be the actual outcome.
The vesting conditions for the above share options are based on the achievement of pre-agreed key performance indicators and milestones, and service (time) based periods. The vesting period of the options range from 3.75 to 5.75 years from grant date. The weighted average remaining option life as at 30 June 2018 is 1.30 years.
The ordinary share options of the Bank granted under the ESOS that are still outstanding for the financial year ended 30 June 2018 is as follows (continued):
Adjustments on additional options due to Rights Issue
For the additional options granted on modified grant date due to Rights Issue exercise, the fair value of share options was estimated using the Black-scholes model, taking into account the terms and conditions upon which the options are granted. The value of share options and the key inputs for share options valuation were as follows:
After Rights Issue
Fair value of share options (RM) 1.19-1.48 Share price at grant date/modified grant date (RM) 13.56 Exercise price (RM) 13.77 Weighted average option life at grant date (Years) 3.89 Expected volatility (%) 12.21 Weighted average dividend yield (%) 3.37 Weighted average risk free rate (%) 4.01
The vesting conditions for the above share options are based on the achievement of pre-agreed key performance indicators and milestones, and service (time) based periods. The vesting period of the options range from to 3.09 to 5.10 years from grant date. The weighted average remaining option life as at 30 June 2018 is 1.30 years.
NoTES To ThE fINANCIAL STATEmENTSfoR ThE fINANCIAL yEAR ENdEd 30 JuNE 2018

272ANNUALREPORT2018
HONG LEONG BANK BERHAD
53 EquITy ComPENSATIoN BENEfITS (CoNTINuEd)
(a) ESS (continued)
(i) ESOS (continued)
(B) 22,750,000 share options at an exercise price of RM16.46:
2018 outstanding Exercisable As at As at As at grant date Expiry date 1-Jul-17 granted Expired forfeited Exercised 30-Jun-18 30-Jun-18
30 March 2018 31 August 2019 – 2,730,000 – (360,000) – 2,370,000 –30 March 2018 31 August 2020 – 2,730,000 – (360,000) – 2,370,000 –30 March 2018 31 August 2021 – 1,365,000 – (180,000) – 1,185,000 –30 March 2018 31 August 2021 – 6,370,000 – (840,000) – 5,530,000 –30 March 2018 31 August 2022 – 6,370,000 – (840,000) – 5,530,000 –30 March 2018 31 August 2023 – 3,185,000 – (420,000) – 2,765,000 –
– 22,750,000 – (3,000,000) – 19,750,000 –
The estimated fair value of each share option granted is between RM3.15 and RM4.45 per share. This was calculated using the Black-Scholes model. The model inputs were the share price at grant date of RM18.72, weighted average option life at grant date of 3.6 years, exercise price of RM16.46, expected volatility of 17.94%, weighted average expected dividend yield of 2.15% and a weighted average risk free interest rate of 3.84%.
The vesting conditions for the above share options are based on the achievement of pre-agreed key performance indicators and milestones, and service (time) based periods. The vesting period of the options range from 1.25 to 5.25 years from grant date.
(ii) ESGS
The ESGS which was approved by the shareholders of the Bank on 29 October 2013, was established on 28 February 2014 and would end on 11 March 2023.
On 10 September 2013, the Bank announced that Bursa Malaysia Securities Berhad had resolved to approve in principle the listing of new ordinary shares of the Bank to be issued pursuant to the ESGS.
The ESGS would provide the Bank with the flexibility to reward the eligible executives of the HLB Group for their contribution with awards of the Bank’s shares without any consideration payable by the eligible executives.
The shares to be vested to a grant holder under the ESGS will be vested to the grant holder only during his employment or directorship with the HLB Group and subject to any other terms and conditions as may be determined by the Board.
NoTES To ThE fINANCIAL STATEmENTSfoR ThE fINANCIAL yEAR ENdEd 30 JuNE 2018
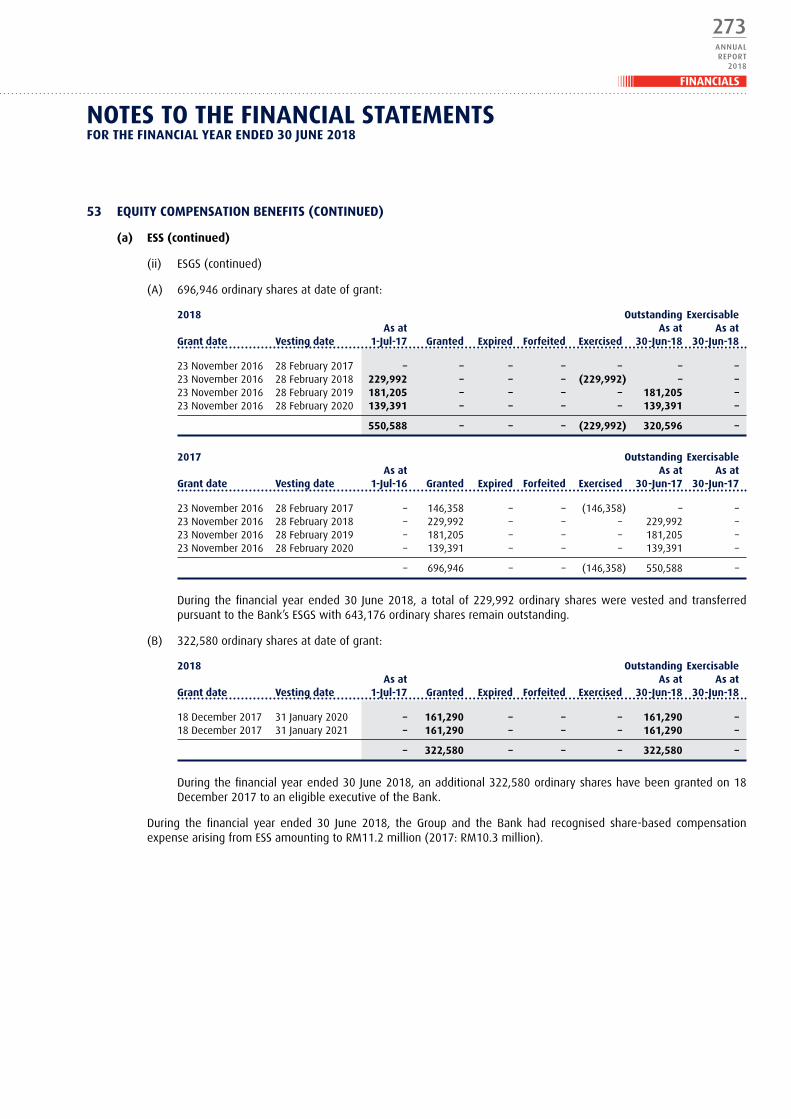
273ANNUALREPORT
2018
FINANCIALS
53 EquITy ComPENSATIoN BENEfITS (CoNTINuEd)
(a) ESS (continued)
(ii) ESGS (continued)
(A) 696,946 ordinary shares at date of grant:
2018 outstanding Exercisable As at As at As at grant date Vesting date 1-Jul-17 granted Expired forfeited Exercised 30-Jun-18 30-Jun-18
23 November 2016 28 February 2017 – – – – – – –23 November 2016 28 February 2018 229,992 – – – (229,992) – –23 November 2016 28 February 2019 181,205 – – – – 181,205 –23 November 2016 28 February 2020 139,391 – – – – 139,391 –
550,588 – – – (229,992) 320,596 –
2017 outstanding Exercisable As at As at As at grant date Vesting date 1-Jul-16 granted Expired forfeited Exercised 30-Jun-17 30-Jun-17
23 November 2016 28 February 2017 – 146,358 – – (146,358) – –23 November 2016 28 February 2018 – 229,992 – – – 229,992 –23 November 2016 28 February 2019 – 181,205 – – – 181,205 –23 November 2016 28 February 2020 – 139,391 – – – 139,391 –
– 696,946 – – (146,358) 550,588 –
During the financial year ended 30 June 2018, a total of 229,992 ordinary shares were vested and transferred pursuant to the Bank’s ESGS with 643,176 ordinary shares remain outstanding.
(B) 322,580 ordinary shares at date of grant:
2018 outstanding Exercisable As at As at As at grant date Vesting date 1-Jul-17 granted Expired forfeited Exercised 30-Jun-18 30-Jun-18
18 December 2017 31 January 2020 – 161,290 – – – 161,290 –18 December 2017 31 January 2021 – 161,290 – – – 161,290 –
– 322,580 – – – 322,580 –
During the financial year ended 30 June 2018, an additional 322,580 ordinary shares have been granted on 18 December 2017 to an eligible executive of the Bank.
During the financial year ended 30 June 2018, the Group and the Bank had recognised share-based compensation expense arising from ESS amounting to RM11.2 million (2017: RM10.3 million).
NoTES To ThE fINANCIAL STATEmENTSfoR ThE fINANCIAL yEAR ENdEd 30 JuNE 2018

274ANNUALREPORT2018
HONG LEONG BANK BERHAD
53 EquITy ComPENSATIoN BENEfITS (CoNTINuEd)
(b) Treasury shares for ESS
A trust has been set up for the ESOS and ESS (collectively “Schemes”) and it is administered by an appointed trustee. This trustee will be entitled from time to time to accept financial assistance from the Bank upon such terms and conditions as the Bank and the trustee may agree to purchase the Bank’s shares from the open market for the purposes of this trust. In accordance with MFRS 132, the shares purchased for the benefit of the Schemes holdings are recorded as “Treasury Shares for ESS” in the Shareholders’ Funds on the statements of financial position. The cost of operating the Schemes is charged to the statements of income.
The number and market values of the ordinary shares held by the Trustee are as follows:
The group and The Bank 2018 2017
Number of Number of trust shares market trust shares market held value held value ‘000 Rm’000 ‘000 Rm’000
As at end of the financial year 40,787 742,323 41,017 642,326
54 CRITICAL ACCouNTINg ESTImATES ANd JudgEmENTS IN APPLyINg ACCouNTINg PoLICIES
The Group and the Bank make estimates and assumptions concerning the future. The resulting accounting estimates will, by definition, rarely equal the related actual results. To enhance the information content of the estimates, certain key variables that are anticipated to have material impact to the Group’s and the Bank’s results and financial position are tested for sensitivity to changes in the underlying parameters. The estimates and assumptions that have a significant risk of causing a material adjustment to the carrying amount of assets and liabilities within the next financial year are outlined below:
(a) Allowance for impairment losses on loans, advances and financing
It is the policy of the Group and the Bank to review their loans/financing portfolios and establish, through charges against profit, individual and collective assessment impairment allowances in respect of estimated and inherent credit losses in their portfolio.
In determining individual assessment impairment allowances for loans/financing above the set threshold, management considers objective evidence of impairment and exercises judgement in estimating cash flows and collateral value. Judgement is made in estimating the amount and timing of future cash flows in assessing allowance for impairment of financial assets. Among the factors considered are the net realisable value of the underlying collateral value, the viability of the customer’s business model and the capacity to generate sufficient cash flow to service debt obligations.
55 gENERAL INfoRmATIoN
The Bank is a public limited liability company that is incorporated and domiciled in Malaysia. The registered office is at Level 30, Menara Hong Leong, No.6, Jalan Damanlela, Bukit Damansara, 50490 Kuala Lumpur, Wilayah Persekutuan, Malaysia.
The financial statements were authorised for issue by the Board of Directors in accordance with a resolution of the Directors on 19 September 2018.
NoTES To ThE fINANCIAL STATEmENTSfoR ThE fINANCIAL yEAR ENdEd 30 JuNE 2018
275ANNUALREPORT
2018
FINANCIALS
STATuToRy dECLARATIoN PuRSuANT ToSECTIoN 251(1) of ThE ComPANIES ACT 2016
We, Tan Kong Khoon and Lim Lean See, two of the Directors of Hong Leong Bank Berhad, do hereby state that, in the opinion of the Directors, the financial statements set out on pages 128 to 274 are drawn up so as to give a true and fair view of the financial position of the Group and the Bank as at 30 June 2018 and financial performance of the Group and the Bank for the financial year then ended on that date, in accordance with Malaysian Financial Reporting Standards, International Financial Reporting Standards and the requirements of the Companies Act 2016 in Malaysia.
On behalf of the Board,
TAN koNg khooN
LIm LEAN SEE
Kuala Lumpur19 September 2018
I, Foong Pik Yee, the officer primarily responsible for the financial management of Hong Leong Bank Berhad, do solemnly and sincerely declare that the, financial statements set out on pages 128 to 274 are, to the best of my knowledge and belief, correct and I make this solemn declaration conscientiously believing the same to be true, and by virtue of the provisions of the Statutory Declarations Act, 1960.
Subscribed and solemnly declared by ) the abovenamed Foong Pik Yee at ) Kuala Lumpur in Wilayah Persekutuan on ) 19 September 2018 ) fooNg PIk yEE
Before me,
TAN SEok kETTCommissioner of Oaths
STATEmENT By dIRECToRS PuRSuANT ToSECTIoN 251(2) of ThE ComPANIES ACT 2016
276ANNUALREPORT2018
HONG LEONG BANK BERHAD
REPoRT oN ThE AudIT of ThE fINANCIAL STATEmENTS
our opinion
In our opinion, the financial statements of Hong Leong Bank Berhad (“the Bank”) and its subsidiaries (“the Group”) give a true and fair view of the financial position of the Group and of the Bank as at 30 June 2018, and of their financial performance and their cash flows for the year then ended in accordance with Malaysian Financial Reporting Standards, International Financial Reporting Standards and the requirements of the Companies Act 2016 in Malaysia.
what we have audited
We have audited the financial statements of the Group and of the Bank, which comprise the statements of financial position as at 30 June 2018 of the Group and of the Bank, and the statements of income, statements of comprehensive income, statements of changes in equity and statements of cash flows of the Group and of the Bank for the year then ended, and notes to the financial statements, including a summary of significant accounting policies, as set out on pages 128 to 274.
Basis for opinion
We conducted our audit in accordance with approved standards on auditing in Malaysia and International Standards on Auditing. Our responsibilities under those standards are further described in the “Auditors’ responsibilities for the audit of the financial statements” section of our report.
We believe that the audit evidence we have obtained is sufficient and appropriate to provide a basis for our opinion.
Independence and other ethical responsibilities
We are independent of the Group and of the Bank in accordance with the By-Laws (on Professional Ethics, Conduct and Practice) of the Malaysian Institute of Accountants (“By-Laws”) and the International Ethics Standards Board for Accountants’ Code of Ethics for Professional Accountants (“IESBA Code”), and we have fulfilled our other ethical responsibilities in accordance with the By-Laws and the IESBA Code.
our audit approach
As part of designing our audit, we determined materiality and assessed the risks of material misstatement in the financial statements of Group and the Bank. In particular, we considered where the Directors made subjective judgements; for example, in respect of significant accounting estimates that involved making assumptions and considering future events that are inherently uncertain. As in all of our audits, we also addressed the risk of management override of internal controls, including among other matters, consideration of whether there was evidence of bias that represented a risk of material misstatement due to fraud.
We tailored the scope of our audit in order to perform sufficient work to enable us to provide an opinion on the financial statements as a whole, taking into account the structure of the Group and of the Bank, the accounting processes and controls, and the industry in which the Group and the Bank operate.
INdEPENdENT AudIToRS’ REPoRTTo ThE mEmBERS of hoNg LEoNg BANk BERhAd

277ANNUALREPORT
2018
FINANCIALS
REPoRT oN ThE AudIT of ThE fINANCIAL STATEmENTS (CoNTINuEd)
key audit matters
Key audit matters are those matters that, in our professional judgement, were of most significance in our audit of the financial statements of the Group and of the Bank for the current year. These matters were addressed in the context of our audit of the financial statements of the Group and of the Bank as a whole, and in forming our opinion thereon, and we do not provide a separate opinion on these matters.
key audit matters how our audit addressed the key audit matters
Impairment of loans, advances and financing
Refer to Note N(i) of the summary of significant accounting policies, and Notes 8, 35 and 54 to the financial statements.
We focused on this area due to the size of the carrying value of loans, advances and financing, which represented 63.1% of total assets. In addition, impairment is a highly subjective area as the Group makes significant judgements on the following areas:
Where the loans, advances and financing are individually assessed for impairment, the Group made subjective estimate on the timing of recognition of impairment and the estimation of the impairment loss.
Where the loans, advances and financing are assessed for impairment on a collective basis, the Group made subjective estimate on the assumptions used in the loss models.
We understood and tested management’s key controls over impairment of loans, advances and financing surrounding the following:
- Identification of occurrence of loss events for individually assessed accounts, being the point of classification as impaired;
- Collateral valuation process including assessment of panel valuer as collateral value is one of the key inputs in determination of the recoverable amount for secured accounts;
- Accuracy of internal credit risk ratings, month-in-arrears data and extraction of these data inputs from source systems which formed the basis of assumptions used in deriving probability of default (“PD”) for collective assessment;
- Collection of historical loss data which formed the basis of assumptions used in deriving loss given default (“LGD”) for collective assessment; and
- Calculation of collective impairment allowance based on loss models and posting of model results to general ledger.
We noted no significant exceptions based on the testing performed on these relevant controls.
Individual assessment
We tested samples of accounts where payment defaults have not occurred to check if these included any impairment indicators not identified by management. Our selection basis focused on loans, advances and financing identified by management as having lower credit quality, rescheduled and restructured, and borrowers with exposures in oil and gas, ship building and wholesale and retail trade industry.
For accounts where impairment loss was recognised, we tested a sample of these accounts and checked whether objective evidence of impairment had been appropriately identified by management in the appropriate period. Where an impairment event has been identified, we checked the measurement of the impairment loss to future cash flow and evidence from past experience.
We noted that certain individually assessed accounts had recorded impairment allowance which was different from our testing results. However these differences are not material in the context of the overall financial statements.
INdEPENdENT AudIToRS’ REPoRTTo ThE mEmBERS of hoNg LEoNg BANk BERhAd
278ANNUALREPORT2018
HONG LEONG BANK BERHAD
REPoRT oN ThE AudIT of ThE fINANCIAL STATEmENTS (CoNTINuEd)
key audit matters (continued)
key audit matters how our audit addressed the key audit matters
Collective assessment
Our work to test the impairment calculations on a collective basis comprised the following:
- On a sample basis, we tested completeness and accuracy of data inputs, particularly borrowers’ internal credit risk ratings and months-in-arrears data used to derive PD statistics and recoveries data used to derive LGD rates;
- Re-performed, on a sample basis, the calculation of collective impairment and checked the posting of model results to general ledger; and
- Understood the basis used by the management to determine the key assumptions used in deriving the PD and LGD.
Based on the procedures performed, the outcome of our independent testing results were not significantly different to the Directors’ collective impairment estimation.
Information other than the financial statements and auditors’ report thereon
The Directors of the Bank are responsible for the other information. The other information comprises:
• Chairman’s Statement
• Group Managing Director/ Chief Executive Officer’s Review
• Management Discussion & Analysis
• Five Year Group Financial Highlights
• Sustainability Statement
• Board Audit Committee Report
• Board Risk Management Committee Report
• Corporate Governance, Risk Management & Internal Control
• Directors’ Report
• Basel II Pillar 3 Disclosures
Other information does not include the financial statements of the Group and of the Bank and our auditors’ report thereon.
Our opinion on the financial statements of the Group and of the Bank does not cover the other information and we do not express any form of assurance conclusion thereon.
In connection with our audit of the financial statements of the Group and of the Bank, our responsibility is to read the other information and, in doing so, consider whether the other information is materially inconsistent with the financial statements of the Group and of the Bank or our knowledge obtained in the audit or otherwise appears to be materially misstated.
If, based on the work we have performed, we conclude that there is a material misstatement of this other information, we are required to report that fact. We have nothing to report in this regard.
INdEPENdENT AudIToRS’ REPoRTTo ThE mEmBERS of hoNg LEoNg BANk BERhAd

279ANNUALREPORT
2018
fINANCIALS
REPoRT oN ThE AudIT of ThE fINANCIAL STATEmENTS (CoNTINuEd)
Responsibilities of the directors for the financial statements
The Directors of the Bank are responsible for the preparation of the financial statements of the Group and of the Bank that give a true and fair view in accordance with Malaysian Financial Reporting Standards, International Financial Reporting Standards and the requirements of the Companies Act 2016 in Malaysia. The Directors are also responsible for such internal control as the Directors determine is necessary to enable the preparation of financial statements of the Group and of the Bank that are free from material misstatement, whether due to fraud or error.
In preparing the financial statements of the Group and of the Bank, the Directors are responsible for assessing the Group’s and the Bank’s ability to continue as a going concern, disclosing, as applicable, matters related to going concern and using the going concern basis of accounting unless the Directors either intend to liquidate the Group or the Bank or to cease operations, or have no realistic alternative but to do so.
Auditors’ responsibilities for the audit of the financial statements
Our objectives are to obtain reasonable assurance about whether the financial statements of the Group and of the Bank as a whole are free from material misstatement, whether due to fraud or error, and to issue an auditors’ report that includes our opinion. Reasonable assurance is a high level of assurance, but is not a guarantee that an audit conducted in accordance with approved standards on auditing in Malaysia and International Standards on Auditing will always detect a material misstatement when it exists. Misstatements can arise from fraud or error and are considered material if, individually or in the aggregate, they could reasonably be expected to influence the economic decisions of users taken on the basis of these financial statements.
As part of an audit in accordance with approved standards on auditing in Malaysia and International Standards on Auditing, we exercise professional judgement and maintain professional scepticism throughout the audit. We also:
(a) Identify and assess the risks of material misstatement of the financial statements of the Group and of the Bank, whether due to fraud or error, design and perform audit procedures responsive to those risks, and obtain audit evidence that is sufficient and appropriate to provide a basis for our opinion. The risk of not detecting a material misstatement resulting from fraud is higher than for one resulting from error, as fraud may involve collusion, forgery, intentional omissions, misrepresentations, or the override of internal control.
(b) Obtain an understanding of internal control relevant to the audit in order to design audit procedures that are appropriate in the circumstances, but not for the purpose of expressing an opinion on the effectiveness of the Group’s and the Bank’s internal control.
(c) Evaluate the appropriateness of accounting policies used and the reasonableness of accounting estimates and related disclosures made by the Directors.
(d) Conclude on the appropriateness of the Directors’ use of the going concern basis of accounting and, based on the audit evidence obtained, whether a material uncertainty exists related to events or conditions that may cast significant doubt on the Group’s or the Bank’s ability to continue as a going concern. If we conclude that a material uncertainty exists, we are required to draw attention in our auditors’ report to the related disclosures in the financial statements of the Group and of the Bank or, if such disclosures are inadequate, to modify our opinion. Our conclusions are based on the audit evidence obtained up to the date of our auditors’ report. However, future events or conditions may cause the Group or the Bank to cease to continue as a going concern.
(e) Evaluate the overall presentation, structure and content of the financial statements of the Group and of the Bank, including the disclosures, and whether the financial statements of the Group and of the Bank represent the underlying transactions and events in a manner that achieves fair presentation.
(f) Obtain sufficient appropriate audit evidence regarding the financial information of the entities or business activities within the Group to express an opinion on the financial statements of the Group. We are responsible for the direction, supervision and performance of the group audit. We remain solely responsible for our audit opinion.
INdEPENdENT AudIToRS’ REPoRTTo ThE mEmBERS of hoNg LEoNg BANk BERhAd

280ANNUALREPORT2018
hoNg LEoNg BANk BERhAd
REPoRT oN ThE AudIT of ThE fINANCIAL STATEmENTS (CoNTINuEd)
Auditors’ responsibilities for the audit of the financial statements (continued)
We communicate with the Directors regarding, among other matters, the planned scope and timing of the audit and significant audit findings, including any significant deficiencies in internal control that we identify during our audit.
We also provide the Directors with a statement that we have complied with relevant ethical requirements regarding independence, and to communicate with them all relationships and other matters that may reasonably be thought to bear on our independence, and where applicable, related safeguards.
From the matters communicated with the Directors, we determine those matters that were of most significance in the audit of the financial statements of the Group and of the Bank for the current year and are therefore the key audit matters. We describe these matters in our auditors’ report unless law or regulation precludes public disclosure about the matter or when, in extremely rare circumstances, we determine that a matter should not be communicated in our report because the adverse consequences of doing so would reasonably be expected to outweigh the public interest benefits of such communication.
REPoRT oN oThER LEgAL ANd REguLAToRy REquIREmENTS
In accordance with the requirements of the Companies Act 2016 in Malaysia, we report that the subsidiaries of which we have not acted as auditors, are disclosed in Note 13 to the financial statements.
oThER mATTERS
This report is made solely to the members of the Bank, as a body, in accordance with Section 266 of the Companies Act 2016 in Malaysia and for no other purpose. We do not assume responsibility to any other person for the content of this report.
PRICEwATERhouSECooPERS PLT Ng yEE LINgLLP0014401-LCA & AF 1146 03032/01/2019 JChartered Accountants Chartered Accountant
Kuala Lumpur19 September 2018
INdEPENdENT AudIToRS’ REPoRTTo ThE mEmBERS of hoNg LEoNg BANk BERhAd

1. INTRODUCTION
This document discloses Hong Leong Bank Berhad (“HLB” or “the Bank”) and its banking subsidiaries (“the Group”) risk profile, risk management practices in accordance with the disclosure requirements as outlined in the Risk-Weighted Capital Adequacy Framework (Basel II) (“RWCAF”) - Disclosure requirements (“Pillar 3”) and Capital Adequacy Framework for Islamic Bank (“CAFIB”) - Disclosure requirements (“Pillar 3”) issued by BNM.
The capital adequacy ratios of the Group and the Bank are computed in accordance with BNM’s Capital Adequacy Framework which sets out the approach for computing the regulatory capital adequacy ratios, the minimum levels of the ratios at which banking institutions are required to operate as well as requirement on Capital Conservation Buffer (“CCB”) and Countercyclical Capital Buffer (“CCyB”). The Group and the Bank are also required to maintain CCB of up to 2.500% of total risk weighted assets (“RWA”), which is phased in starting with 0.625% in year 2016, 1.250% in year 2017, 1.875% in year 2018 and 2.500% in year 2019. The CCyB which ranges from 0% up to 2.500% is determined as the weighted average of prevailing CCyB rates applied in the jurisdictions in which a financial institution has credit exposures. The minimum capital adequacy including CCB for Common Equity Tier I (CET I) capital ratio, Tier I capital ratio and Total capital ratio for year 2018 are 6.375%, 7.875% and 9.875% respectively.
The Group and the Bank have adopted the Standardised Approach for the computation of Credit Risk and Market Risk, and the Basic Indicator Approach for the computation of Operational Risk in deriving the risk-weighted assets.
The following information concerning the Group’s risk exposures, risk management practices and capital adequacy is disclosed as accompanying information to the annual report and does not form part of the audited financial statements.
2. SCOPEOFAPPLICATION
The capital adequacy ratios of the Group consist of capital base and RWA derived from the consolidated balances of the Bank and its banking subsidiaries, namely Hong Leong Islamic Bank Berhad (“HLISB”), Hong Leong Bank Vietnam Limited and Hong Leong Bank (Cambodia) PLC.
The capital adequacy ratios of the Bank and the Group are computed in accordance with BNM’s Capital Adequacy Framework (Capital Components) and Capital Adequacy Framework for Islamic Banks (Capital Components).
The Group’s capital requirements are generally based on the principles of consolidation adopted in the preparation of its financial statements, as disclosed in Note 2A to the financial statements, except where deductions from eligible capital are required under BNM’s Capital Adequacy Framework (Capital Components) and Capital Adequacy Framework for Islamic Banks (Capital Components) or where separation requirements (set by BNM) are met by entities.
During the course of the year, the Bank and its banking subsidiaries did not experience any restrictions or other major impediments on transfer of funds or regulatory capital within the Group.
3. CAPITALSTRUCTUREANDADEQUACY
The Group monitors the capital adequacy position of the Bank and its banking subsidiaries to ensure compliance with the requirements of BNM and to take prompt actions to address projected capital deficiency. The capital position is reviewed on a monthly basis by undertaking stress tests and taking into account the levels and trend of material risks. The sufficiency of capital is assessed against various risks in the balance sheet as well as future capital requirements based on the Group’s expansion plans.
The Group has also formalised an overall capital management framework, which seeks to ensure that it is in line with Basel III Capital Standards.
The following table sets forth details on the capital resources, capital adequacy ratios and risk-weighted assets for the Group and the Bank as at 30 June 2018. BNM’s Capital Adequacy Framework (Capital Components) and Capital Adequacy Framework for Islamic Banks (Capital Components) sets out the minimum capital adequacy ratios for the banking institutions and the methodology for calculating these ratios. As at 30 June 2018, the Group’s and the Bank’s CET I, Tier I capital ratio and Total capital ratio were higher than BNM’s minimum requirements.
BNM’s Capital Adequacy Framework (Capital Components) and Capital Adequacy Framework for Islamic Banks (capital components) set out the constituents of the total eligible capital for the Group and the Bank. For the main features of these capital instruments, please refer to Note 24, Note 25 and Note 26 to the financial statements.
FINANCIALS
281ANNUALREPORT
2018
BASELIIPILLAR3DISCLOSURESFORThEFINANCIALYEARENDED30jUNE2018
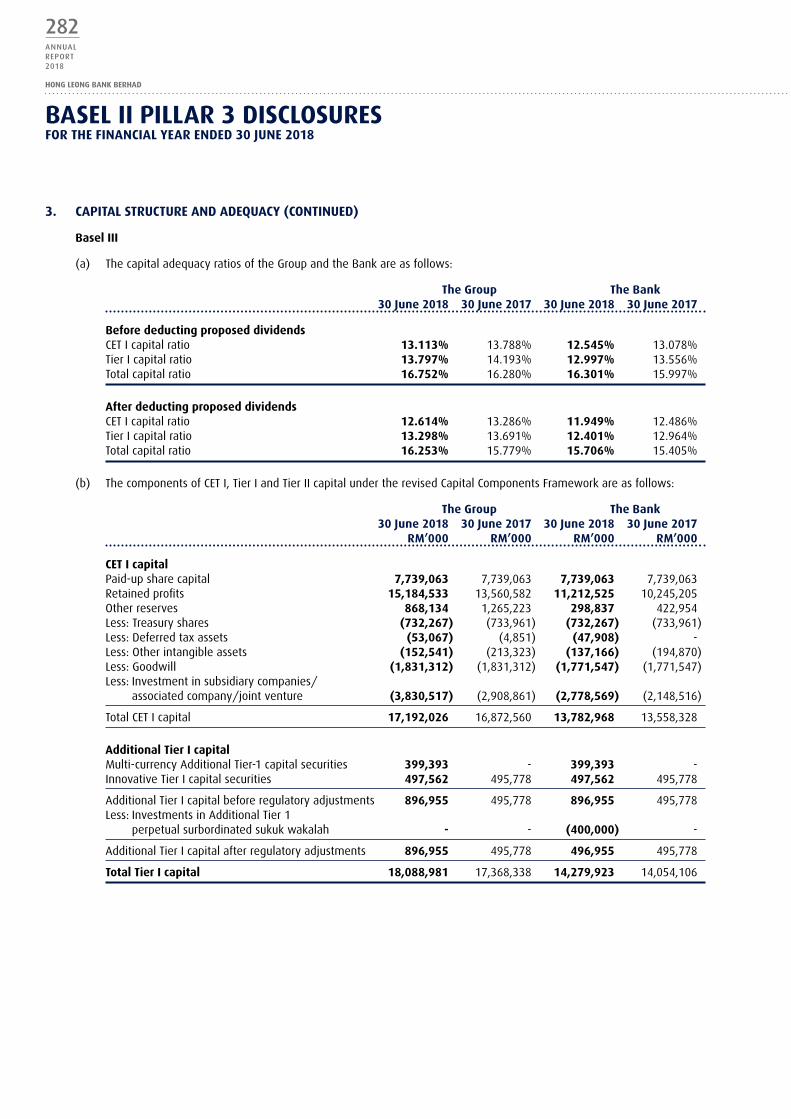
3. CAPITALSTRUCTUREANDADEQUACY(CONTINUED)
BaselIII
(a) The capital adequacy ratios of the Group and the Bank are as follows:
TheGroup TheBank 30june2018 30june2017 30june2018 30june2017
BeforedeductingproposeddividendsCET I capital ratio 13.113% 13.788% 12.545% 13.078%Tier I capital ratio 13.797% 14.193% 12.997% 13.556%Total capital ratio 16.752% 16.280% 16.301% 15.997%
AfterdeductingproposeddividendsCET I capital ratio 12.614% 13.286% 11.949% 12.486%Tier I capital ratio 13.298% 13.691% 12.401% 12.964%Total capital ratio 16.253% 15.779% 15.706% 15.405%
(b) The components of CET I, Tier I and Tier II capital under the revised Capital Components Framework are as follows:
TheGroup TheBank 30june2018 30june2017 30june2018 30june2017 RM’000 RM’000 RM’000 RM’000
CETIcapitalPaid-up share capital 7,739,063 7,739,063 7,739,063 7,739,063 Retained profits 15,184,533 13,560,582 11,212,525 10,245,205 Other reserves 868,134 1,265,223 298,837 422,954 Less: Treasury shares (732,267) (733,961) (732,267) (733,961)Less: Deferred tax assets (53,067) (4,851) (47,908) - Less: Other intangible assets (152,541) (213,323) (137,166) (194,870)Less: Goodwill (1,831,312) (1,831,312) (1,771,547) (1,771,547)Less: Investment in subsidiary companies/
associated company/joint venture (3,830,517) (2,908,861) (2,778,569) (2,148,516)
Total CET I capital 17,192,026 16,872,560 13,782,968 13,558,328
AdditionalTierIcapitalMulti-currency Additional Tier-1 capital securities 399,393 - 399,393 - Innovative Tier I capital securities 497,562 495,778 497,562 495,778
Additional Tier I capital before regulatory adjustments 896,955 495,778 896,955 495,778 Less: Investments in Additional Tier 1
perpetual surbordinated sukuk wakalah - - (400,000) -
Additional Tier I capital after regulatory adjustments 896,955 495,778 496,955 495,778
TotalTierIcapital 18,088,981 17,368,338 14,279,923 14,054,106
282ANNUALREPORT2018
hONGLEONGBANKBERhAD
BASELIIPILLAR3DISCLOSURESFORThEFINANCIALYEARENDED30jUNE2018

3. CAPITALSTRUCTUREANDADEQUACY(CONTINUED)
BaselIII(continued)
(b) The components of CET I, Tier I and Tier II capital under the revised Capital Components Framework are as follows: (continued)
TheGroup TheBank 30june2018 30june2017 30june2018 30june2017 RM’000 RM’000 RM’000 RM’000
TierIIcapitalCollective assessment allowance^ and regulatory reserves# 1,375,082 1,281,686 1,130,670 1,067,705Subordinated bonds 2,499,820 1,999,723 2,499,820 1,999,723
Tier II capital before regulatory adjustments 3,874,902 3,281,409 3,630,490 3,067,428Less: Investment in subsidiary companies/ associated company/joint venture - (727,215) - (537,129)
TotalTierIIcapital 3,874,902 2,554,194 3,630,490 2,530,299
TotalCapital 21,963,883 19,922,532 17,910,413 16,584,405
^ Excludes collective assessment allowance attributable to loans, advances and financing classified as impaired but not individually assessed for impairment.
# Includes the qualifying regulatory reserves for non-impaired loans of the Group and the Bank of RM741,694,000 (2017: RM667,238,000) and RM637,098,000 (2017: RM571,678,000) respectively.
(c) The breakdown of risk-weighted assets (“RWA”) by each major risk category is as follows:
TheGroup TheBank 30june2018 30june2017 30june2018 30june2017 RM’000 RM’000 RM’000 RM’000
Credit risk 118,853,998 111,299,987 98,504,099 93,397,418Market risk 3,850,444 3,115,525 4,140,291 3,340,119Operational risk 8,403,939 7,958,340 7,226,134 6,934,552
Total RWA 131,108,381 122,373,852 109,870,524 103,672,089
(d) The capital adequacy ratios of the banking subsidiary company of the Group are as follows:
hongLeongIslamicBankBerhad 30june2018 30june2017
BeforedeductingproposeddividendsCET I capital ratio 10.461% 10.622%Tier I capital ratio 12.404% 10.622%Total capital ratio 15.477% 13.946%
AfterdeductingproposeddividendsCET I capital ratio 10.461% 10.622%Tier I capital ratio 12.404% 10.622%Total capital ratio 15.477% 13.946%
FINANCIALS
283ANNUALREPORT
2018
BASEL II PILLAR 3 DISCLOSURESfOR thE fInAnCIAL yEAR EnDED 30 jUnE 2018

3. CAPITALSTRUCTUREANDADEQUACY(CONTINUED)
BaselIII(continued)
(e) The breakdown of RWA by exposure is as follows:
Minimum Gross Net Risk capital exposures exposures weighted requirements
TheGroup beforeCRM afterCRM assets at8%30june2018 RM’000 RM’000 RM’000 RM’000
ExposureClass
CreditRiskOn-BalanceSheetExposuresSovereigns/Central Banks 33,253,839 33,253,839 - -Public Sector Entities 293,642 293,642 58,728 4,698Banks, Development Financial Institutions (“DFIs”) and Multilateral Development Bank (“MDBs”) 12,374,681 12,374,681 4,336,113 346,889Insurance Cos, Securities Firms (“SF”) and Fund Managers (“FM”) 76,719 76,468 76,468 6,117Corporates 37,923,078 36,979,415 33,624,769 2,689,982Regulatory Retail 59,751,355 59,277,000 44,559,396 3,564,752Residential Mortgages 35,024,844 35,006,876 13,941,243 1,115,299Higher Risk Assets 513,647 513,634 770,451 61,636Other Assets 10,629,659 10,629,659 8,471,458 677,717Defaulted Exposures 796,925 795,261 930,002 74,400
Total On-Balance Sheet Exposures 190,638,389 189,200,475 106,768,628 8,541,490
Off-BalanceSheetExposuresOver-the-counter (“OTC”) Derivatives 3,314,510 3,314,510 1,452,642 116,211Off-Balance Sheet Exposures Other Than OTC Derivatives or Credit Derivatives 12,566,377 12,385,329 10,484,437 838,755Defaulted Exposures 99,308 98,860 148,291 11,863
Total Off-Balance Sheet Exposures 15,980,195^ 15,798,699 12,085,370 966,829
Total On and Off-Balance Sheet Exposures 206,618,584 204,999,174 118,853,998 9,508,319
Long ShortMarketRisk Position Position
Interest Rate Risk 81,609,842 87,000,464 3,564,594 285,168Foreign Currency Risk 274,973 274,561 277,495 22,200Option Risk - - 8,355 668
Total 81,884,815 87,275,025 3,850,444 308,036
OperationalRisk 8,403,939 672,315
TotalRWAandCapitalRequirements 131,108,381 10,488,670
Note:CRM - credit risk mitigation^ The gross exposures before CRM of Off-Balance Sheet exposures refer to the credit equivalent of Off-Balance Sheet
items on page 313.
284ANNUALREPORT2018
HONG LEONG BANK BERHAD
BASEL II PILLAR 3 DISCLOSURESfOR tHE fINANCIAL yEAR ENDED 30 jUNE 2018

3. CAPITALSTRUCTUREANDADEQUACY(CONTINUED)
BaselIII(continued)
(e) The breakdown of RWA by exposure is as follows: (continued)
Minimum Gross Net Risk capital exposures exposures weighted requirementsTheGroup beforeCRM afterCRM assets at8%30june2017 RM’000 RM’000 RM’000 RM’000
ExposureClass
CreditRiskOn-BalanceSheetExposuresSovereigns/Central Banks 32,611,888 32,611,888 - -Public Sector Entities 572,996 572,996 114,599 9,168Banks, Development Financial Institutions (“DFIs”) and Multilateral Development Bank (“MDBs”) 11,425,790 11,425,790 3,484,431 278,755Insurance Cos, Securities Firms (“SF”) and Fund Managers (“FM”) 180,903 180,903 118,056 9,445Corporates 36,876,799 35,332,964 32,061,154 2,564,892Regulatory Retail 53,897,849 53,358,056 40,132,767 3,210,621Residential Mortgages 38,007,264 37,985,376 15,375,134 1,230,011Higher Risk Assets 633,745 633,724 950,587 76,047Other Assets 8,578,234 8,578,234 6,652,507 532,201Defaulted Exposures 656,988 654,139 754,001 60,320
Total On-Balance Sheet Exposures 183,442,456 181,334,070 99,643,236 7,971,460
Off-BalanceSheetExposuresOTC Derivatives 3,245,889 3,245,889 1,438,419 115,073Off-Balance Sheet Exposures Other Than OTC Derivatives or Credit Derivatives 12,144,754 11,955,351 10,165,897 813,272Defaulted Exposures 34,969 34,957 52,435 4,195
Total Off-Balance Sheet Exposures 15,425,612^ 15,236,197 11,656,751 932,540
Total On and Off-Balance Sheet Exposures 198,868,068 196,570,267 111,299,987 8,904,000
Long ShortMarketRisk Position Position
Interest Rate Risk 88,283,281 74,619,600 2,305,720 184,458Foreign Currency Risk 755,449 562,499 755,450 60,436Option Risk - - 54,355 4,348
Total 89,038,730 75,182,099 3,115,525 249,242
OperationalRisk 7,958,340 636,667
TotalRWAandCapitalRequirements 122,373,852 9,789,909
Note:^ The gross exposures before CRM of Off-Balance Sheet exposures refer to the credit equivalent of Off-Balance Sheet
items on page 314.
FINANCIALS
285ANNUALREPORT
2018
BASEL II PILLAR 3 DISCLOSURESfOR thE fInAnCIAL yEAR EnDED 30 jUnE 2018

3. CAPITALSTRUCTUREANDADEQUACY(CONTINUED)
BaselIII(continued)
(e) The breakdown of RWA by exposure is as follows: (continued)
Minimum Gross Net Risk capital exposures exposures weighted requirementsTheBank beforeCRM afterCRM assets at8%30june2018 RM’000 RM’000 RM’000 RM’000
ExposureClass
CreditRiskOn-BalanceSheetExposuresSovereigns/Central Banks 25,889,320 25,889,320 - -Public Sector Entities 293,642 293,642 58,728 4,698Banks, DFIs and MDBs 11,879,555 11,879,555 4,213,658 337,093Insurance Cos, SF and FM 76,719 76,468 76,468 6,117Corporates 31,903,408 30,990,682 28,010,323 2,240,826Regulatory Retail 46,902,551 46,448,026 34,875,627 2,790,050Residential Mortgages 29,603,112 29,587,161 11,736,665 938,933Higher Risk Assets 511,240 511,229 766,844 61,348Other Assets 10,087,647 10,087,647 8,167,547 653,404Defaulted Exposures 652,988 651,333 774,061 61,925
Total On-Balance Sheet Exposures 157,800,182 156,415,063 88,679,921 7,094,394
Off-BalanceSheetExposuresOTC Derivatives 3,111,793 3,111,793 1,340,588 107,247Off-Balance Sheet Exposures Other Than OTC Derivatives or Credit Derivatives 10,161,502 9,984,689 8,423,777 673,902Defaulted Exposures 40,322 39,875 59,813 4,785
Total Off-Balance Sheet Exposures 13,313,617^ 13,136,357 9,824,178 785,934
Total On and Off-Balance Sheet Exposures 171,113,799 169,551,420 98,504,099 7,880,328
Long ShortMarketRisk Position Position
Interest Rate Risk 77,171,881 82,913,341 3,870,586 309,647Foreign Currency Risk 261,350 258,417 261,350 20,908Option Risk - - 8,355 668
Total 77,433,231 83,171,758 4,140,291 331,223
OperationalRisk 7,226,134 578,091
TotalRWAandCapitalRequirements 109,870,524 8,789,642
Note:^ The gross exposures before CRM of Off-Balance Sheet exposures refer to the credit equivalent of Off-Balance Sheet
items on page 315.
286ANNUALREPORT2018
HONG LEONG BANK BERHAD
BASEL II PILLAR 3 DISCLOSURESfOR tHE fINANCIAL yEAR ENDED 30 jUNE 2018
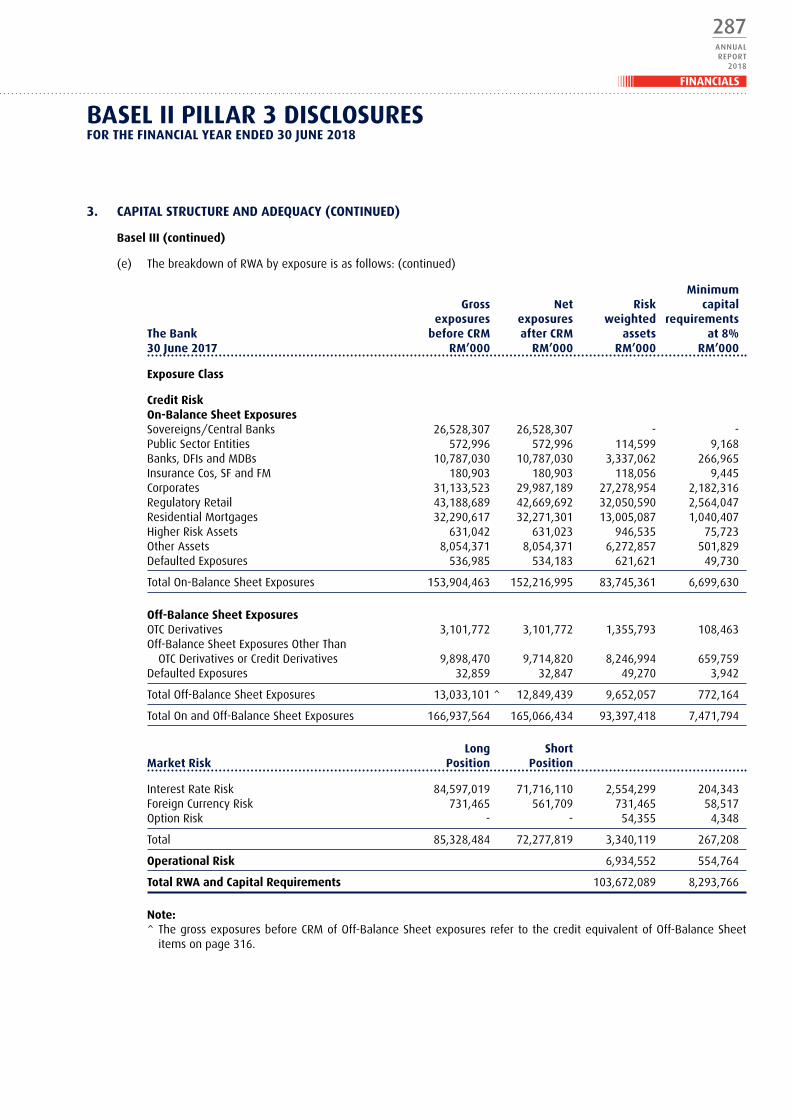
3. CAPITALSTRUCTUREANDADEQUACY(CONTINUED)
BaselIII(continued)
(e) The breakdown of RWA by exposure is as follows: (continued)
Minimum Gross Net Risk capital exposures exposures weighted requirementsTheBank beforeCRM afterCRM assets at8%30june2017 RM’000 RM’000 RM’000 RM’000
ExposureClass
CreditRiskOn-BalanceSheetExposuresSovereigns/Central Banks 26,528,307 26,528,307 - -Public Sector Entities 572,996 572,996 114,599 9,168Banks, DFIs and MDBs 10,787,030 10,787,030 3,337,062 266,965Insurance Cos, SF and FM 180,903 180,903 118,056 9,445Corporates 31,133,523 29,987,189 27,278,954 2,182,316Regulatory Retail 43,188,689 42,669,692 32,050,590 2,564,047Residential Mortgages 32,290,617 32,271,301 13,005,087 1,040,407Higher Risk Assets 631,042 631,023 946,535 75,723Other Assets 8,054,371 8,054,371 6,272,857 501,829Defaulted Exposures 536,985 534,183 621,621 49,730
Total On-Balance Sheet Exposures 153,904,463 152,216,995 83,745,361 6,699,630
Off-BalanceSheetExposuresOTC Derivatives 3,101,772 3,101,772 1,355,793 108,463Off-Balance Sheet Exposures Other Than OTC Derivatives or Credit Derivatives 9,898,470 9,714,820 8,246,994 659,759Defaulted Exposures 32,859 32,847 49,270 3,942
Total Off-Balance Sheet Exposures 13,033,101 ^ 12,849,439 9,652,057 772,164
Total On and Off-Balance Sheet Exposures 166,937,564 165,066,434 93,397,418 7,471,794
Long ShortMarketRisk Position Position
Interest Rate Risk 84,597,019 71,716,110 2,554,299 204,343Foreign Currency Risk 731,465 561,709 731,465 58,517Option Risk - - 54,355 4,348
Total 85,328,484 72,277,819 3,340,119 267,208
OperationalRisk 6,934,552 554,764
TotalRWAandCapitalRequirements 103,672,089 8,293,766
Note:^ The gross exposures before CRM of Off-Balance Sheet exposures refer to the credit equivalent of Off-Balance Sheet
items on page 316.
FINANCIALS
287ANNUALREPORT
2018
BASEL II PILLAR 3 DISCLOSURESfOR thE fInAnCIAL yEAR EnDED 30 jUnE 2018

4. RISKMANAGEMENT
The Group has implemented a risk management and internal control framework with the objective to ensure the overall financial soundness and stability of the Group’s business operations. The risk management and internal control framework outlines the overall governance structure, aspiration, values and risk management strategies that balances between risk profiles and returns objectives. Appropriate methodologies and measurements have been developed to manage uncertainties such that deviations from intended strategic objectives are closely monitored and kept within tolerable levels.
As part of the risk management and internal control framework, the Group has formulated and implemented an Internal Capital Adequacy Assessment Process (“ICAAP”) and a capital management framework to ensure that it maintains the appropriate level of capital, the appropriate quality and structure of capital and the appropriate risk profile to support its strategic objectives. This also includes determining the Group’s minimum capital threshold and target capital levels.
From a governance perspective, the Board has the overall responsibility to define the Group’s risk appetite and ensure that a robust risk management and compliance culture prevails. The Board is assisted by the Board Risk Management Committee (“BRMC”) in approving the risk management and internal control framework as well as the attendant capital management framework, risk appetite statement, risk management and compliance strategies, and risk management and compliance policies.
Dedicated management level committees are established by the Group to oversee the development and the effectiveness of risk management policies, to review risk exposures and portfolio composition as well as to ensure appropriate infrastructures, resources and systems are put in place for effective risk management activities.
Operationally, the Group operates multiple lines of defences to effect a robust control framework. The business units being the first line of defence are responsible for identifying, mitigating and managing risks within their lines of business. The Group Risk Management (“GRM”) function being the second line of defence, is responsible for setting the risk management framework and developing tools and methodologies for the identification, measurement, monitoring, control and mitigation of risks. In addition, GRM undertakes validation to ensure that the business and operating units are in compliance to the Group’s risk appetite thresholds and to the regulatory requirements. The GRM’s functions cover the oversight of the following areas:- Market Risk, Liquidity Risk, Credit Portfolio Risk, Technology Risk, Operational Risk, ICAAP and Integrated Stress Testing and Islamic Banking Risk.
The Group Internal Audit function, being the third line of defence, is responsible to provide independent assurance on the effective functioning of the risk management and internal controls framework for the Group.
The risk management process for each key risk area of the Group and the various risk exposures are described in the following sections of the Pillar 3 disclosures.
288ANNUALREPORT2018
HONG LEONG BANK BERHAD
BASEL II PILLAR 3 DISCLOSURESfOR tHE fINANCIAL yEAR ENDED 30 jUNE 2018

4. RISKMANAGEMENT(CONTINUED)
(A) Creditrisk
Credit risk arises as a result of customers or counterparties not being able to or willing to fulfil their financial and contractual obligations as and when they fall due. These obligations arise from lending, trade finance and other activities undertaken by the Group.
The Group has established a credit risk management framework to ensure that exposure to credit risk is kept within the Bank’s financial capacity to withstand potential future losses. Lending activities are guided by the internal credit policies and guidelines that are reviewed and concurred by the Management Credit Committee (“MCC”), endorsed by the Credit Supervisory Committee (“CSC”) and the BRMC, and approved by the Board. These policies are subject to review and enhancements, at least on an annual basis.
Credit portfolio strategies and significant exposures are reviewed by both the BRMC and the Board. These portfolio strategies are designed to achieve a desired portfolio risk tolerance level and sector distribution.
The Group’s credit approving process encompasses pre-approval evaluation, approval and post-approval evaluation. While the business units are responsible for credit origination, the credit approving function rests mainly with the Credit Evaluation Departments, the MCC and the CSC. The Board delegates the approving and discretionary authority to the MCC and the various personnel of the Bank based on job function and designation.
For any new products, credit risk assessment also forms part of the new product sign-off process to ensure that the new product complies with the appropriate policies and guidelines, prior to the introduction of the product.
The Group’s exposure to credit risk is mainly from its retail customers, small and medium enterprise (“SME”), commercial and corporate customers. The credit assessment for retail customers is managed on a portfolio basis and the risk scoring models and lending templates are designed to assess the credit worthiness and the likelihood of the obligors to repay their debts.
The SME, commercial and corporate customers are individually assessed and assigned with a credit rating, which is based on the assessment of relevant factors such as the customer’s financial position, industry outlook, types of facilities and collaterals offered.
Under the Basel II Standardised Approach, the Group makes use of credit ratings assigned by credit rating agencies in its calculation of credit risk weighted assets. This is applicable for exposures to sovereigns, central banks, public sector entities, banking institutions, corporates as well as certain other specific portfolios.
The approved External Credit Assessment Institutions (“ECAI”) ratings and the prescribed risk weights on the above stated asset classes are used in the computation of regulatory capital. An exposure would be deemed to have an external rating if the issuer or the issue has a rating provided by an ECAI. In cases where an exposure does not have an issuer or issue rating, the exposure shall be deemed unrated and shall be accorded a risk weight appropriate for unrated exposures in their respective exposure category.
The ECAI used by the Bank are Fitch Ratings, Moody’s Investors Service, Standard & Poor’s, Rating and Investment Inc (“R&I”), Malaysia Rating Corporation Berhad (“MARC”) and Rating Agency Malaysia (“RAM”). ECAI ratings are mapped to a common credit quality grade as prescribed by BNM.
In addition, the Bank also conducts periodic stress testing of its credit portfolios to ascertain the credit risk impact to capital under the relevant stress scenarios.
FINANCIALS
289ANNUALREPORT
2018
BASEL II PILLAR 3 DISCLOSURESfOR thE fInAnCIAL yEAR EnDED 30 jUnE 2018

4. RISKMANAGEMENT(CONTINUED)
(A) Creditrisk(continued)
Grosscreditexposure
(i) The table below sets out the breakdown of gross credit exposures by geographical distribution as follows:
OtherTheGroup Malaysia countries Total30june2018 RM’000 RM’000 RM’000
On-BalanceSheetExposuresFinancial assets held-for-trading* 5,868,654 101,218 5,969,872Financial investments available-for-sale* 21,317,922 2,976,762 24,294,684Financial investments held-to-maturity 13,911,820 524,638 14,436,458Loans, advances and financing 121,547,921 6,511,184 128,059,105Derivative financial instruments 882,739 35,328 918,067
TotalOn-BalanceSheetExposures 163,529,056 10,149,130 173,678,186
Off-BalanceSheetExposures^OTC Derivatives 3,246,165 68,345 3,314,510Off-Balance Sheet Exposures Other Than OTC Derivatives or Credit Derivatives 12,493,817 171,868 12,665,685
TotalOff-BalanceSheetExposures 15,739,982 240,213 15,980,195
TotalOnandOff-BalanceSheetExposures 179,269,038 10,389,343 189,658,381
30june2017On-BalanceSheetExposuresFinancial assets held-for-trading* 5,548,784 139,381 5,688,165Financial investments available-for-sale* 19,209,742 2,636,743 21,846,485Financial investments held-to-maturity 12,364,435 695,635 13,060,070Loans, advances and financing 117,418,534 6,572,407 123,990,941Derivative financial instruments 905,224 47,818 953,042
TotalOn-BalanceSheetExposures 155,446,719 10,091,984 165,538,703
Off-BalanceSheetExposures^OTC Derivatives 3,158,162 87,727 3,245,889Off-Balance Sheet Exposures Other Than OTC Derivatives or Credit Derivatives 12,068,780 110,943 12,179,723
TotalOff-BalanceSheetExposures 15,226,942 198,670 15,425,612
TotalOnandOff-BalanceSheetExposures 170,673,661 10,290,654 180,964,315
Note:(1) For this table, the Group and the Bank have allocated the loans, advances and financing to geographical areas
based on the country where the loans, advances and financing were provided.* Excludes equity securities.^ Off-Balance Sheet exposures refer to the credit equivalent of Off-Balance Sheet items on page 313 and page 314.
290ANNUALREPORT2018
HONG LEONG BANK BERHAD
BASEL II PILLAR 3 DISCLOSURESfOR tHE fINANCIAL yEAR ENDED 30 jUNE 2018
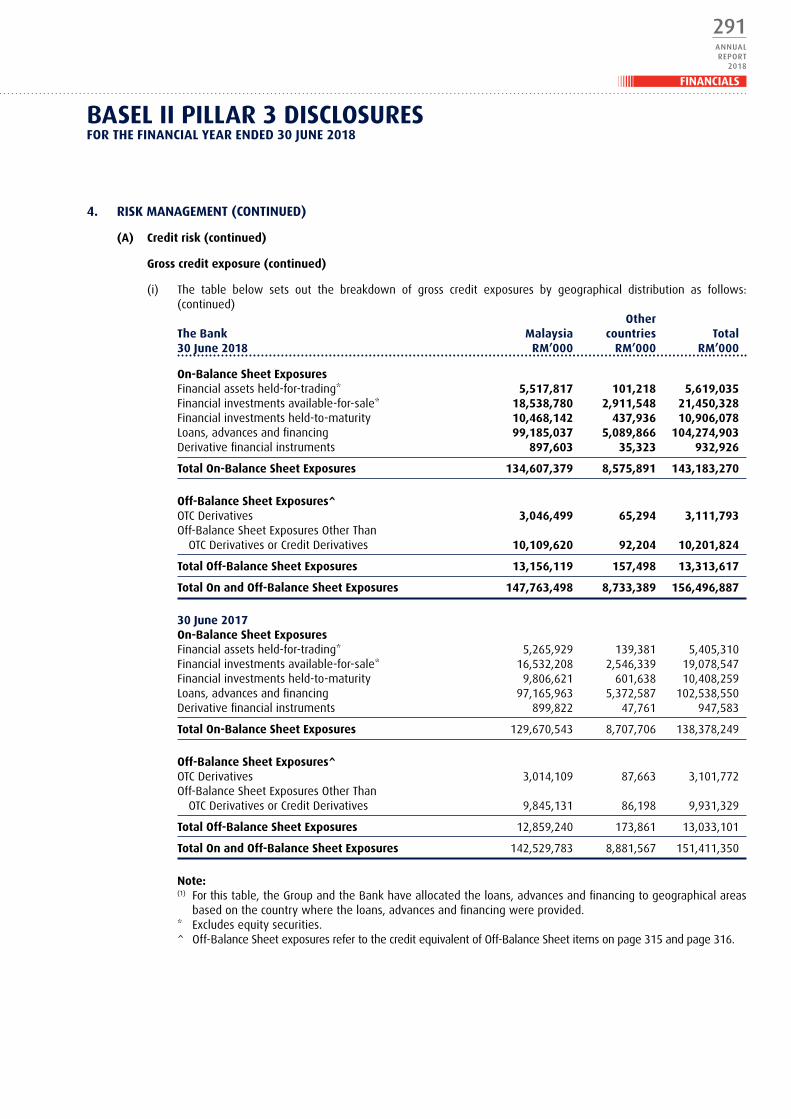
4. RISKMANAGEMENT(CONTINUED)
(A) Creditrisk(continued)
Grosscreditexposure(continued)
(i) The table below sets out the breakdown of gross credit exposures by geographical distribution as follows: (continued) OtherTheBank Malaysia countries Total30june2018 RM’000 RM’000 RM’000
On-BalanceSheetExposuresFinancial assets held-for-trading* 5,517,817 101,218 5,619,035Financial investments available-for-sale* 18,538,780 2,911,548 21,450,328Financial investments held-to-maturity 10,468,142 437,936 10,906,078Loans, advances and financing 99,185,037 5,089,866 104,274,903Derivative financial instruments 897,603 35,323 932,926
TotalOn-BalanceSheetExposures 134,607,379 8,575,891 143,183,270
Off-BalanceSheetExposures^OTC Derivatives 3,046,499 65,294 3,111,793Off-Balance Sheet Exposures Other Than OTC Derivatives or Credit Derivatives 10,109,620 92,204 10,201,824
TotalOff-BalanceSheetExposures 13,156,119 157,498 13,313,617
TotalOnandOff-BalanceSheetExposures 147,763,498 8,733,389 156,496,887
30june2017On-BalanceSheetExposuresFinancial assets held-for-trading* 5,265,929 139,381 5,405,310Financial investments available-for-sale* 16,532,208 2,546,339 19,078,547Financial investments held-to-maturity 9,806,621 601,638 10,408,259Loans, advances and financing 97,165,963 5,372,587 102,538,550Derivative financial instruments 899,822 47,761 947,583
TotalOn-BalanceSheetExposures 129,670,543 8,707,706 138,378,249
Off-BalanceSheetExposures^OTC Derivatives 3,014,109 87,663 3,101,772Off-Balance Sheet Exposures Other Than OTC Derivatives or Credit Derivatives 9,845,131 86,198 9,931,329
TotalOff-BalanceSheetExposures 12,859,240 173,861 13,033,101
TotalOnandOff-BalanceSheetExposures 142,529,783 8,881,567 151,411,350
Note:(1) For this table, the Group and the Bank have allocated the loans, advances and financing to geographical areas
based on the country where the loans, advances and financing were provided.* Excludes equity securities.^ Off-Balance Sheet exposures refer to the credit equivalent of Off-Balance Sheet items on page 315 and page 316.
FINANCIALS
291ANNUALREPORT
2018
BASEL II PILLAR 3 DISCLOSURESfOR thE fInAnCIAL yEAR EnDED 30 jUnE 2018
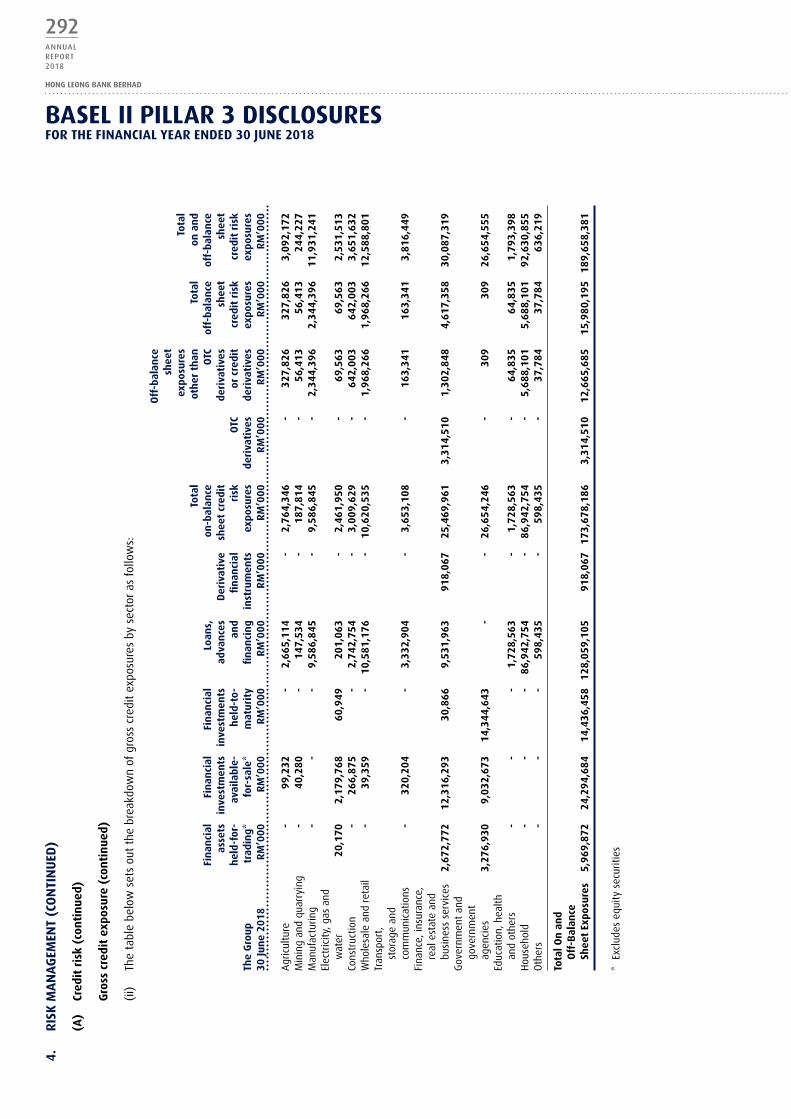
4.
RIS
KM
AN
AG
EMEN
T(C
ON
TIN
UED
)
(A)
Cred
itr
isk
(con
tin
ued)
Gro
ssc
redi
tex
posu
re(
cont
inue
d)
(ii)
Th
e ta
ble
belo
w s
ets
out
the
brea
kdow
n of
gro
ss c
redi
t ex
posu
res
by s
ecto
r as
fol
low
s:
O
ff-b
alan
ce
shee
t
expo
sure
s
Tota
l
Tota
l
oth
ert
han
To
tal
ona
nd
Fin
anci
al
Fin
anci
al
Fin
anci
al
Loan
s,
on
-bal
ance
OTC
of
f-ba
lan
ce
off-
bala
nce
asse
ts
inve
stm
ents
in
vest
men
ts
adva
nce
sD
eriv
ativ
esh
eet
cred
it
de
riva
tive
ssh
eet
shee
t
h
eld-
for-
av
aila
ble-
h
eld-
to-
and
fin
anci
al
risk
O
TC
orc
redi
tcr
edit
ris
kcr
edit
ris
kTh
eG
roup
tr
adin
g*
for-
sale
*m
atur
ity
fin
anci
ng
inst
rum
ents
ex
posu
res
deri
vati
ves
deri
vati
ves
expo
sure
sex
posu
res
30ju
ne
2018
R
M’0
00
RM
’000
R
M’0
00
RM
’000
R
M’0
00
RM
’000
R
M’0
00
RM
’000
R
M’0
00
RM
’000
Agr
icul
ture
-
99,2
32
-2,
665,
114
-2,
764,
346
-32
7,82
632
7,82
63,
092,
172
Min
ing
and
quar
ryin
g -
40,2
80
-14
7,53
4-
187,
814
-56
,413
56
,413
24
4,22
7M
anuf
actu
ring
--
-9,
586,
845
-9,
586,
845
-2,
344,
396
2,34
4,39
611
,931
,241
Elec
tric
ity, g
as a
nd
w
ater
20
,170
2,
179,
768
60,9
49
201,
063
-2,
461,
950
-69
,563
69
,563
2,
531,
513
Cons
truc
tion
-26
6,87
5-
2,74
2,75
4-
3,00
9,62
9-
642,
003
642,
003
3,65
1,63
2W
hole
sale
and
ret
ail
-39
,359
-
10,5
81,1
76
-10
,620
,535
-
1,96
8,26
61,
968,
266
12,5
88,8
01Tr
ansp
ort,
stor
age
and
co
mm
unic
atio
ns
-32
0,20
4-
3,33
2,90
4-
3,65
3,10
8-
163,
341
163,
341
3,81
6,44
9Fi
nanc
e, in
sura
nce,
real
est
ate
and
bu
sine
ss s
ervi
ces
2,67
2,77
212
,316
,293
30
,866
9,
531,
963
918,
067
25,4
69,9
61
3,31
4,51
01,
302,
848
4,61
7,35
830
,087
,319
Gov
ernm
ent
and
go
vern
men
t
agen
cies
3,
276,
930
9,03
2,67
314
,344
,643
-
-26
,654
,246
-
309
309
26,6
54,5
55Ed
ucat
ion,
hea
lth
an
d ot
hers
-
--
1,72
8,56
3-
1,72
8,56
3-
64,8
35
64,8
35
1,79
3,39
8H
ouse
hold
-
--
86,9
42,7
54
-86
,942
,754
-
5,68
8,10
15,
688,
101
92,6
30,8
55O
ther
s -
--
598,
435
-59
8,43
5-
37,7
84
37,7
84
636,
219
Tota
lOn
an
d
Off
-Bal
ance
Sh
eet
Expo
sure
s 5,
969,
872
24,2
94,6
84
14,4
36,4
58
128,
059,
105
918,
067
173,
678,
186
3,31
4,51
012
,665
,685
15
,980
,195
18
9,65
8,38
1
* Ex
clud
es e
quity
sec
uriti
es
292ANNUALREPORT2018
HONG LEONG BANK BERHAD
BASEL II PILLAR 3 DISCLOSURESfOR tHE fINANCIAL yEAR ENDED 30 jUNE 2018
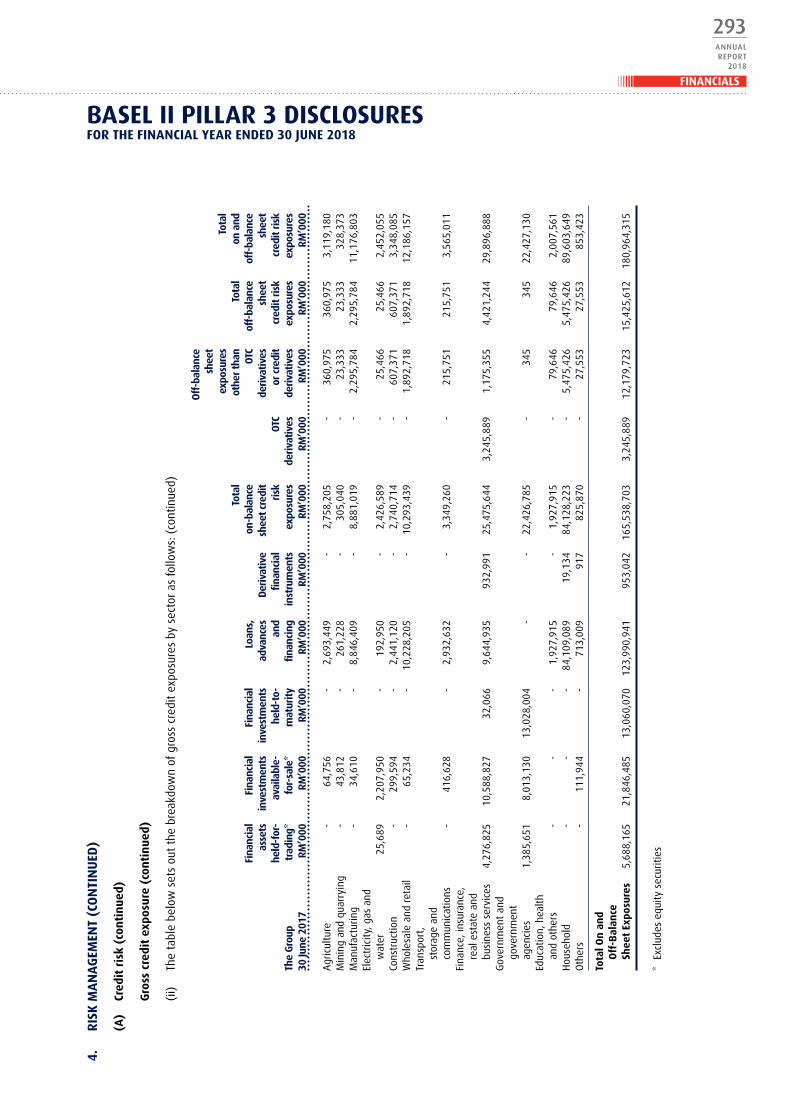
4.
RIS
KM
AN
AG
EMEN
T(C
ON
TIN
UED
)
(A)
Cred
itr
isk
(con
tin
ued)
Gro
ssc
redi
tex
posu
re(
cont
inue
d)
(ii)
Th
e ta
ble
belo
w s
ets
out
the
brea
kdow
n of
gro
ss c
redi
t ex
posu
res
by s
ecto
r as
fol
low
s: (
cont
inue
d)
O
ff-b
alan
ce
shee
t
expo
sure
s
Tota
l
Tota
l
othe
rtha
nTo
tal
ona
nd
Fi
nanc
ial
Fina
ncia
lFi
nanc
ial
Loan
s,
on
-bal
ance
OTC
off-
bala
nce
off-
bala
nce
asse
ts
inve
stm
ents
in
vest
men
ts
adva
nces
D
eriv
ativ
esh
eet
cred
it
de
riva
tive
ssh
eet
shee
t
he
ld-f
or-
avai
labl
e-
held
-to-
an
dfi
nanc
ial
risk
OT
Cor
cre
dit
cred
itri
sk
cred
itri
skTh
eG
roup
tr
adin
g*
for-
sale
*m
atur
ity
fina
ncin
gin
stru
men
ts
expo
sure
sde
riva
tive
sde
riva
tive
sex
posu
res
expo
sure
s30
june
201
7RM
’000
RM
’000
RM
’000
RM
’000
RM
’000
RM
’000
RM
’000
RM
’000
RM
’000
RM
’000
Agr
icul
ture
-
64,7
56
- 2,
693,
449
- 2,
758,
205
- 36
0,97
5 36
0,97
5 3,
119,
180
Min
ing
and
quar
ryin
g -
43,8
12
- 26
1,22
8 -
305,
040
- 23
,333
23
,333
32
8,37
3M
anuf
actu
ring
- 34
,610
-
8,84
6,40
9 -
8,88
1,01
9 -
2,29
5,78
4 2,
295,
784
11,1
76,8
03El
ectr
icity
, gas
and
wat
er
25,6
89
2,20
7,95
0 -
192,
950
- 2,
426,
589
- 25
,466
25
,466
2,
452,
055
Cons
truc
tion
- 29
9,59
4 -
2,44
1,12
0 -
2,74
0,71
4 -
607,
371
607,
371
3,34
8,08
5W
hole
sale
and
ret
ail
- 65
,234
-
10,2
28,2
05
- 10
,293
,439
-
1,89
2,71
8 1,
892,
718
12,1
86,1
57Tr
ansp
ort,
stor
age
and
co
mm
unic
atio
ns
- 41
6,62
8 -
2,93
2,63
2 -
3,34
9,26
0 -
215,
751
215,
751
3,56
5,01
1Fi
nanc
e, in
sura
nce,
real
est
ate
and
bu
sine
ss s
ervi
ces
4,27
6,82
5 10
,588
,827
32
,066
9,
644,
935
932,
991
25,4
75,6
44
3,24
5,88
9 1,
175,
355
4,42
1,24
4 29
,896
,888
Gov
ernm
ent
and
go
vern
men
t
agen
cies
1,
385,
651
8,01
3,13
0 13
,028
,004
-
- 22
,426
,785
-
345
345
22,4
27,1
30Ed
ucat
ion,
hea
lth
an
d ot
hers
-
- -
1,92
7,91
5 -
1,92
7,91
5 -
79,6
46
79,6
46
2,00
7,56
1H
ouse
hold
-
- -
84,1
09,0
89
19,1
34
84,1
28,2
23
- 5,
475,
426
5,47
5,42
6 89
,603
,649
Oth
ers
- 11
1,94
4 -
713,
009
917
825,
870
- 27
,553
27
,553
85
3,42
3
Tota
lOn
an
d
Off
-Bal
ance
Sh
eet
Expo
sure
s 5,
688,
165
21,8
46,4
85
13,0
60,0
70
123,
990,
941
953,
042
165,
538,
703
3,24
5,88
9 12
,179
,723
15
,425
,612
18
0,96
4,31
5
* Ex
clud
es e
quity
sec
uriti
es
FINANCIALS
293ANNUALREPORT
2018
BASEL II PILLAR 3 DISCLOSURESfOR thE fInAnCIAL yEAR EnDED 30 jUnE 2018

4.
RIS
KM
AN
AG
EMEN
T(C
ON
TIN
UED
)
(A)
Cred
itr
isk
(con
tin
ued)
Gro
ssc
redi
tex
posu
re(
cont
inue
d)
(ii)
Th
e ta
ble
belo
w s
ets
out
the
brea
kdow
n of
gro
ss c
redi
t ex
posu
res
by s
ecto
r as
fol
low
s: (
cont
inue
d)
O
ff-b
alan
ce
shee
t
expo
sure
s
Tota
l
Tota
l
oth
ert
han
To
tal
ona
nd
Fin
anci
al
Fin
anci
al
Fin
anci
al
Loan
s,
on
-bal
ance
OTC
of
f-ba
lan
ce
off-
bala
nce
asse
ts
inve
stm
ents
in
vest
men
ts
adva
nce
sD
eriv
ativ
esh
eet
cred
it
de
riva
tive
ssh
eet
shee
t
h
eld-
for-
av
aila
ble-
h
eld-
to-
and
fin
anci
al
risk
O
TC
orc
redi
tcr
edit
ris
kcr
edit
ris
kTh
eB
ank
trad
ing*
fo
r-sa
le*
mat
urit
yfi
nan
cin
gin
stru
men
ts
expo
sure
sde
riva
tive
sde
riva
tive
sex
posu
res
expo
sure
s30
jun
e20
18
RM
’000
R
M’0
00
RM
’000
R
M’0
00
RM
’000
R
M’0
00
RM
’000
R
M’0
00
RM
’000
R
M’0
00
Agr
icul
ture
-
99,2
32
-1,
737,
836
-1,
837,
068
-16
0,47
616
0,47
61,
997,
544
Min
ing
and
quar
ryin
g -
40,2
80
-10
8,00
5-
148,
285
-56
,285
56
,285
20
4,57
0M
anuf
actu
ring
--
-8,
458,
984
-8,
458,
984
-1,
926,
427
1,92
6,42
710
,385
,411
Elec
tric
ity, g
as a
nd
w
ater
20
,170
1,
744,
943
60,9
49
148,
231
-1,
974,
293
-23
,857
23
,857
1,
998,
150
Cons
truc
tion
-20
1,51
5-
2,17
4,12
0-
2,37
5,63
5-
486,
820
486,
820
2,86
2,45
5W
hole
sale
and
ret
ail
-39
,359
-
9,53
4,67
5-
9,57
4,03
4-
1,70
1,04
01,
701,
040
11,2
75,0
74Tr
ansp
ort,
stor
age
and
co
mm
unic
atio
ns
-31
5,16
9-
3,18
4,09
3-
3,49
9,26
2-
128,
508
128,
508
3,62
7,77
0Fi
nanc
e, in
sura
nce,
real
est
ate
and
bu
sine
ss s
ervi
ces
2,47
2,96
211
,653
,156
30
,866
8,
193,
488
932,
926
23,2
83,3
98
3,11
1,79
387
7,74
33,
989,
536
27,2
72,9
34G
over
nmen
t an
d
gove
rnm
ent
ag
enci
es
3,12
5,90
37,
356,
674
10,8
14,2
63
--
21,2
96,8
40
-30
930
921
,297
,149
Educ
atio
n, h
ealt
h
and
othe
rs
--
-90
7,09
0-
907,
090
-57
,665
57
,665
96
4,75
5H
ouse
hold
-
--
69,7
57,0
31
-69
,757
,031
-
4,75
0,57
54,
750,
575
74,5
07,6
06O
ther
s -
--
71,3
50
-71
,350
-
32,1
19
32,1
19
103,
469
Tota
lOn
an
d
Off
-Bal
ance
Sh
eet
Expo
sure
s 5,
619,
035
21,4
50,3
28
10,9
06,0
78
104,
274,
903
932,
926
143,
183,
270
3,11
1,79
310
,201
,824
13
,313
,617
15
6,49
6,88
7
* Ex
clud
es e
quity
sec
uriti
es
294ANNUALREPORT2018
HONG LEONG BANK BERHAD
BASEL II PILLAR 3 DISCLOSURESfOR tHE fINANCIAL yEAR ENDED 30 jUNE 2018

4.
RIS
KM
AN
AG
EMEN
T(C
ON
TIN
UED
)
(A)
Cred
itr
isk
(con
tin
ued)
Gro
ssc
redi
tex
posu
re(
cont
inue
d)
(ii)
Th
e ta
ble
belo
w s
ets
out
the
brea
kdow
n of
gro
ss c
redi
t ex
posu
res
by s
ecto
r as
fol
low
s: (
cont
inue
d)
O
ff-b
alan
ce
shee
t
expo
sure
s
Tota
l
Tota
l
oth
ert
han
To
tal
ona
nd
Fin
anci
al
Fin
anci
al
Fin
anci
al
Loan
s,
on
-bal
ance
OTC
of
f-ba
lan
ce
off-
bala
nce
asse
ts
inve
stm
ents
in
vest
men
ts
adva
nce
sD
eriv
ativ
esh
eet
cred
it
de
riva
tive
ssh
eet
shee
t
h
eld-
for-
av
aila
ble-
h
eld-
to-
and
fin
anci
al
risk
O
TC
orc
redi
tcr
edit
ris
kcr
edit
ris
kTh
eB
ank
trad
ing*
fo
r-sa
le*
mat
urit
yfi
nan
cin
gin
stru
men
ts
expo
sure
sde
riva
tive
sde
riva
tive
sex
posu
res
expo
sure
s30
jun
e20
17
RM
’000
R
M’0
00
RM
’000
R
M’0
00
RM
’000
R
M’0
00
RM
’000
R
M’0
00
RM
’000
R
M’0
00
Agr
icul
ture
-
64,7
56
- 1,
794,
124
- 1,
858,
880
- 17
1,73
8 17
1,73
8 2,
030,
618
Min
ing
and
quar
ryin
g -
43,8
12
- 20
9,36
8 -
253,
180
- 22
,787
22
,787
27
5,96
7M
anuf
actu
ring
- 34
,610
-
8,07
6,68
0 -
8,11
1,29
0 -
1,91
7,16
8 1,
917,
168
10,0
28,4
58El
ectr
icity
, gas
and
wat
er
25,6
89
1,84
3,66
6 -
139,
509
- 2,
008,
864
- 19
,866
19
,866
2,
028,
730
Cons
truc
tion
- 21
8,75
2 -
2,08
4,69
7 -
2,30
3,44
9 -
459,
583
459,
583
2,76
3,03
2W
hole
sale
and
ret
ail
- 65
,234
-
9,35
1,16
0 -
9,41
6,39
4 -
1,68
3,55
8 1,
683,
558
11,0
99,9
52Tr
ansp
ort,
stor
age
and
co
mm
unic
atio
ns
- 26
7,83
8 -
2,48
3,61
1 -
2,75
1,44
9 -
189,
502
189,
502
2,94
0,95
1Fi
nanc
e, in
sura
nce,
real
est
ate
and
bu
sine
ss s
ervi
ces
4,35
8,25
6 10
,081
,651
32
,066
8,
443,
719
927,
532
23,8
43,2
24
3,10
1,77
2 85
2,11
9 3,
953,
891
27,7
97,1
15G
over
nmen
t an
d
gove
rnm
ent
ag
enci
es
1,02
1,36
5 6,
346,
284
10,3
76,1
93
- -
17,7
43,8
42
- 34
5 34
5 17
,744
,187
Educ
atio
n, h
ealt
h
and
othe
rs
- -
- 1,
107,
227
- 1,
107,
227
- 56
,011
56
,011
1,
163,
238
Hou
seho
ld
- -
- 68
,694
,445
19
,134
68
,713
,579
-
4,53
1,46
2 4,
531,
462
73,2
45,0
41O
ther
s -
111,
944
- 15
4,01
0 91
7 26
6,87
1 -
27,1
90
27,1
90
294,
061
Tota
lOn
an
d
Off
-Bal
ance
Sh
eet
Expo
sure
s 5,
405,
310
19,0
78,5
47
10,4
08,2
59
102,
538,
550
947,
583
138,
378,
249
3,10
1,77
2
9,93
1,32
9
13,0
33,1
01
151,
411,
350
* Ex
clud
es e
quity
sec
uriti
es
FINANCIALS
295ANNUALREPORT
2018
BASEL II PILLAR 3 DISCLOSURESfOR thE fInAnCIAL yEAR EnDED 30 jUnE 2018

4. RISKMANAGEMENT(CONTINUED)
(A) Creditrisk(continued)
Grosscreditexposure(continued)
(iii) The table below sets out the breakdown of gross credit exposures by residual contractual maturity as follows:
Lessthan 1-5 Over5TheGroup 1year years years Total30june2018 RM’000 RM’000 RM’000 RM’000
On-BalanceSheetExposuresFinancial assets held-for-trading* 2,586,224 2,514,143 869,505 5,969,872Financial investments available-for-sale* 2,813,489 17,610,277 3,870,918 24,294,684Financial investments held-to-maturity 2,016,971 11,796,310 623,177 14,436,458Loans, advances and financing 26,206,505 14,876,102 86,976,498 128,059,105Derivative financial instruments 575,268 211,156 131,643 918,067
TotalOn-BalanceSheetExposures 34,198,457 47,007,988 92,471,741 173,678,186
Off-BalanceSheetExposures^OTC Derivatives 1,074,925 1,471,031 768,554 3,314,510Off-Balance Sheet Exposures Other Than OTC Derivatives or Credit Derivatives 5,519,230 7,146,455 - 12,665,685
TotalOff-BalanceSheetExposures 6,594,155 8,617,486 768,554 15,980,195
TotalOnandOff-BalanceSheetExposures 40,792,612 55,625,474 93,240,295 189,658,381
30june2017On-BalanceSheetExposuresFinancial assets held-for-trading* 4,066,230 1,262,754 359,181 5,688,165Financial investments available-for-sale* 1,647,064 16,925,260 3,274,161 21,846,485Financial investments held-to-maturity 1,599,979 10,028,926 1,431,165 13,060,070Loans, advances and financing 26,032,735 15,496,384 82,461,822 123,990,941Derivative financial instruments 479,292 368,108 105,642 953,042
TotalOn-BalanceSheetExposures 33,825,300 44,081,432 87,631,971 165,538,703
Off-BalanceSheetExposures^OTC Derivatives 1,030,257 1,504,671 710,961 3,245,889Off-Balance Sheet Exposures Other Than OTC Derivatives or Credit Derivatives 5,551,149 6,628,574 - 12,179,723
TotalOff-BalanceSheetExposures 6,581,406 8,133,245 710,961 15,425,612
TotalOnandOff-BalanceSheetExposures 40,406,706 52,214,677 88,342,932 180,964,315
* Excludes equity securities.^ Off-Balance Sheet exposures refer to the credit equivalent of Off-Balance Sheet items on page 313 and page 314.
296ANNUALREPORT2018
HONG LEONG BANK BERHAD
BASEL II PILLAR 3 DISCLOSURESfOR tHE fINANCIAL yEAR ENDED 30 jUNE 2018

4. RISKMANAGEMENT(CONTINUED)
(A) Creditrisk(continued)
Grosscreditexposure(continued)
(iii) The table below sets out the breakdown of gross credit exposures by residual contractual maturity as follows: (continued)
Lessthan 1-5 Over5TheBank 1year years years Total30june2018 RM’000 RM’000 RM’000 RM’000
On-BalanceSheetExposuresFinancial assets held-for-trading* 2,386,414 2,514,143 718,478 5,619,035Financial investments available-for-sale* 2,711,849 16,098,572 2,639,907 21,450,328Financial investments held-to-maturity 1,395,077 8,981,439 529,562 10,906,078Loans, advances and financing 23,382,245 11,791,544 69,101,114 104,274,903Derivative financial instruments 569,665 234,874 128,387 932,926
TotalOn-BalanceSheetExposures 30,445,250 39,620,572 73,117,448 143,183,270
Off-BalanceSheetExposures^OTC Derivatives 1,054,301 1,415,153 642,339 3,111,793Off-Balance Sheet Exposures Other Than
OTC Derivatives or Credit Derivatives 4,996,575 5,205,249 - 10,201,824
TotalOff-BalanceSheetExposures 6,050,876 6,620,402 642,339 13,313,617
TotalOnandOff-BalanceSheetExposures 36,496,126 46,240,974 73,759,787 156,496,887
30june2017On-BalanceSheetExposuresFinancial assets held-for-trading* 4,147,663 1,130,607 127,040 5,405,310Financial investments available-for-sale* 1,430,271 14,814,517 2,833,759 19,078,547Financial investments held-to-maturity 1,478,658 7,947,377 982,224 10,408,259Loans, advances and financing 23,068,403 12,823,851 66,646,296 102,538,550Derivative financial instruments 475,766 366,449 105,368 947,583
TotalOn-BalanceSheetExposures 30,600,761 37,082,801 70,694,687 138,378,249
Off-BalanceSheetExposures^OTC Derivatives 1,016,533 1,449,923 635,316 3,101,772Off-Balance Sheet Exposures Other Than
OTC Derivatives or Credit Derivatives 5,130,802 4,800,527 - 9,931,329
TotalOff-BalanceSheetExposures 6,147,335 6,250,450 635,316 13,033,101
TotalOnandOff-BalanceSheetExposures 36,748,096 43,333,251 71,330,003 151,411,350
* Excludes equity securities.^ Off-Balance Sheet exposures refer to the credit equivalent of Off-Balance Sheet items on page 315 and page 316.
FINANCIALS
297ANNUALREPORT
2018
BASEL II PILLAR 3 DISCLOSURESfOR thE fInAnCIAL yEAR EnDED 30 jUnE 2018

4. RISKMANAGEMENT(CONTINUED)
(A) Creditrisk(continued)
Loans,advancesandfinancing
(i) The table below sets out the breakdown by sector the amount of past due loans, advances and financing, impaired loans, advances and financing, individual assessment impairment allowance, collective assessment impairment allowance, charge/(write back) for individual assessment impairment allowance during the year and write-offs during the year as follows:
Charge/ (writeback) forindividual Pastdue Impaired assessment loans, loans, Individual Collective impairment advances advances assessment assessment allowance Write-offs and and impairment impairment duringthe duringtheTheGroup financing financing allowance allowance year year30june2018 RM’000 RM’000 RM’000 RM’000 RM’000 RM’000
Agriculture 40,620 5,770 - 8,295 - -Mining and quarrying 1,225 50,474 21,150 1,119 12,309 -Manufacturing 81,183 115,327 75,734 40,817 (9,946) 117,409Electricity, gas and water 2,649 868 - 1,126 (161) -Construction 84,381 43,319 9,678 14,456 (2,013) 83Wholesale and retail 154,048 200,576 68,800 54,231 15,721 1,731Transport, storage and communications 25,304 15,922 10,895 6,684 (12,707) -Finance, insurance, real estate and business services 181,747 122,753 15,527 36,003 4,799 -Education, health and others 23,362 3,826 - 6,098 - -Household 6,921,396 566,568 392 632,568 (110) 43Others 5,663 99 - 3,329 - -
7,521,578 1,125,502 202,176 804,726 7,892 119,266
298ANNUALREPORT2018
HONG LEONG BANK BERHAD
BASEL II PILLAR 3 DISCLOSURESfOR tHE fINANCIAL yEAR ENDED 30 jUNE 2018

4. RISKMANAGEMENT(CONTINUED)
(A) Creditrisk(continued)
Loans,advancesandfinancing(continued)
(i) The table below sets out the breakdown by sector the amount of past due loans, advances and financing, impaired loans, advances and financing, individual assessment impairment allowance, collective assessment impairment allowance, charge/(write back) for individual assessment impairment allowance during the year and write-offs during the year as follows: (continued)
Charge/ (writeback) forindividual Pastdue Impaired assessment loans, loans, Individual Collective impairment advances advances assessment assessment allowance Write-offs and and impairment impairment duringthe duringtheTheGroup financing financing allowance allowance year year30june2017 RM’000 RM’000 RM’000 RM’000 RM’000 RM’000
Agriculture 17,932 13,009 - 8,154 (45) -Mining and quarrying 3,718 50,261 8,841 860 6,477 -Manufacturing 67,806 253,786 207,774 31,452 73,969 27,146Electricity, gas and water 3,770 1,321 169 1,572 199 -Construction 73,146 41,241 12,037 14,897 10,877 6,240Wholesale and retail 149,792 170,717 58,310 55,773 25,077 32,003Transport, storage and communications 30,600 34,014 23,774 6,947 2,255 5,216Finance, insurance, real estate and business services 111,274 108,339 14,056 40,214 (1,869) 134Education, health and others 29,198 3,549 - 5,346 (163) 865Household 6,913,465 523,835 88 662,166 87 -Others 114,844 3,368 377 2,686 (628) 656
7,515,545 1,203,440 325,426 830,067 116,236 72,260
FINANCIALS
299ANNUALREPORT
2018
BASEL II PILLAR 3 DISCLOSURESfOR thE fInAnCIAL yEAR EnDED 30 jUnE 2018

4. RISKMANAGEMENT(CONTINUED)
(A) Creditrisk(continued)
Loans,advancesandfinancing(continued)
(i) The table below sets out the breakdown by sector the amount of past due loans, advances and financing, impaired loans, advances and financing, individual assessment impairment allowance, collective assessment impairment allowance, charge/(write back) for individual assessment impairment allowance during the year and write-offs during the year as follows: (continued)
Charge/ (writeback) forindividual Pastdue Impaired assessment loans, loans, Individual Collective impairment advances advances assessment assessment allowance Write-offs and and impairment impairment duringthe duringtheTheBank financing financing allowance allowance year year30june2018 RM’000 RM’000 RM’000 RM’000 RM’000 RM’000
Agriculture 40,612 5,639 - 6,473 - -Mining and quarrying 1,121 474 - 1,056 - -Manufacturing 67,454 115,088 75,734 36,879 (9,946) 116,200Electricity, gas and water 2,633 838 - 312 (161) -Construction 81,435 41,625 9,659 12,132 (1,735) 83Wholesale and retail 119,419 186,572 68,144 47,011 18,615 1,731Transport, storage and communications 24,184 15,880 10,895 6,168 (12,707) -Finance, insurance, real estate and business services 147,910 108,330 15,527 26,433 4,799 -Education, health and others 22,150 3,826 - 3,979 - -Household 5,162,337 427,961 10 478,068 10 -Others 4,388 - - 3,183 - -
5,673,643 906,233 179,969 621,694 (1,125) 118,014
300ANNUALREPORT2018
HONG LEONG BANK BERHAD
BASEL II PILLAR 3 DISCLOSURESfOR tHE fINANCIAL yEAR ENDED 30 jUNE 2018

4. RISKMANAGEMENT(CONTINUED)
(A) Creditrisk(continued)
Loans,advancesandfinancing(continued)
(i) The table below sets out the breakdown by sector the amount of past due loans, advances and financing, impaired loans, advances and financing, individual assessment impairment allowance, collective assessment impairment allowance, charge/(write back) for individual assessment impairment allowance during the year and write-offs during the year as follows: (continued)
Charge/ (writeback) forindividual Pastdue Impaired assessment loans, loans, Individual Collective impairment advances advances assessment assessment allowance Write-offs and and impairment impairment duringthe duringtheTheBank financing financing allowance allowance year year30june2017 RM’000 RM’000 RM’000 RM’000 RM’000 RM’000
Agriculture 15,159 13,004 - 6,438 (45) -Mining and quarrying 3,593 251 - 805 - -Manufacturing 58,557 252,372 206,566 28,903 73,895 24,554Electricity, gas and water 3,530 1,321 169 956 199 -Construction 69,320 40,094 11,981 12,024 8,513 6,240Wholesale and retail 118,917 165,954 54,752 50,277 25,127 32,003Transport, storage and communications 30,066 33,793 23,774 6,114 2,255 5,216Finance, insurance, real estate and business services 91,488 92,859 13,681 32,275 (1,893) 12Education, health and others 23,949 3,498 - 3,905 (163) 865Household 5,260,734 414,330 - 523,136 - -Others 112,648 506 - 1,954 - -
5,787,961 1,017,982 310,923 666,787 107,888 68,890
FINANCIALS
301ANNUALREPORT
2018
BASEL II PILLAR 3 DISCLOSURESfOR thE fInAnCIAL yEAR EnDED 30 jUnE 2018

4. RISKMANAGEMENT(CONTINUED)
(A) Creditrisk(continued)
Loans,advancesandfinancing(continued)
(ii) The table below sets out the breakdown by geographical areas the amount of past due loans, advances and financing, impaired loans, advances and financing, individual assessment impairment allowance and collective assessment impairment allowance as follows:
Pastdue Impaired loans, loans, Individual Collective advances advances assessment assessment and and impairment impairment
TheGroup financing financing allowance allowance30june2018 RM’000 RM’000 RM’000 RM’000
Malaysia 7,325,188 1,112,810 201,267 791,192Other countries 196,390 12,692 909 13,534
7,521,578 1,125,502 202,176 804,726
30june2017Malaysia 7,367,737 1,197,355 324,480 818,176Other countries 147,808 6,085 946 11,891
7,515,545 1,203,440 325,426 830,067
TheBank30june2018Malaysia 5,526,877 904,839 179,442 614,316Other countries 146,766 1,394 527 7,378
5,673,643 906,233 179,969 621,694
30june2017Malaysia 5,676,216 1,017,511 310,817 660,349Other countries 111,745 471 106 6,438
5,787,961 1,017,982 310,923 666,787
Notes:(1) A financial asset is defined as “past due” when the counterparty has failed to make a principal or interest
payment when contractually due.(2) For description of approaches adopted by the Group and the Bank for the determination of individual and
collective assessment impairment allowances, refer to Note 2N (i) to the financial statements.
302ANNUALREPORT2018
HONG LEONG BANK BERHAD
BASEL II PILLAR 3 DISCLOSURESfOR tHE fINANCIAL yEAR ENDED 30 jUNE 2018
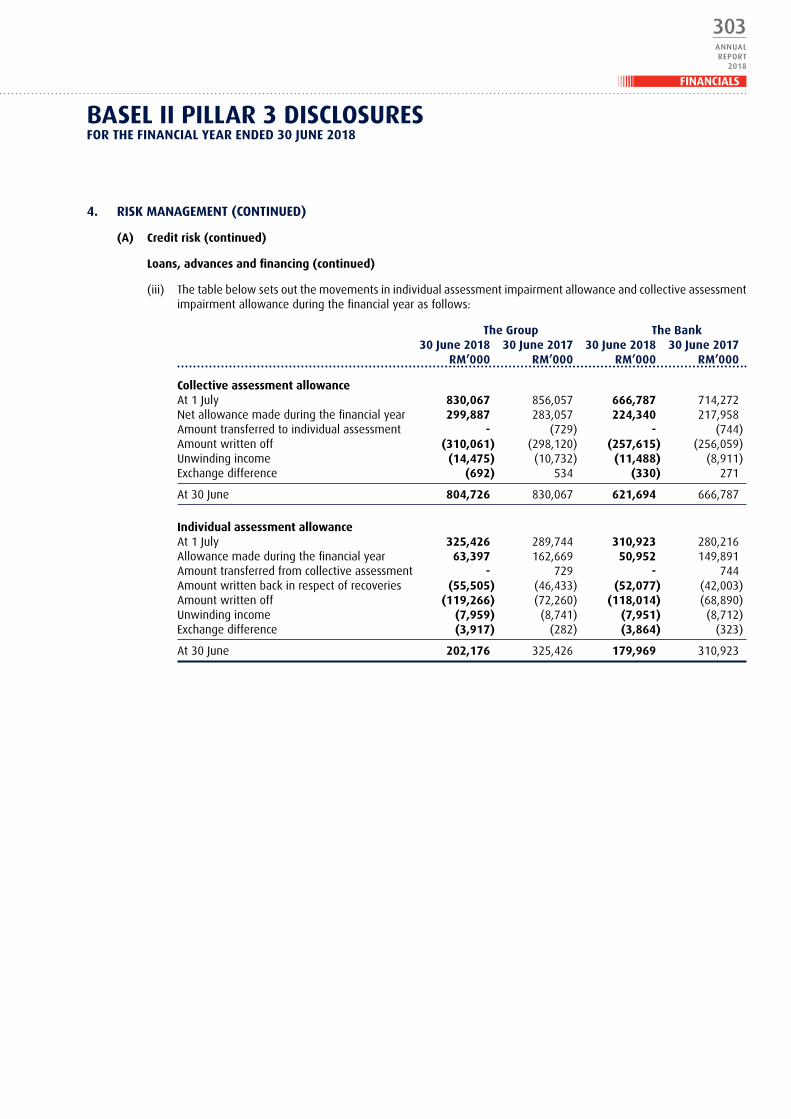
4. RISKMANAGEMENT(CONTINUED)
(A) Creditrisk(continued)
Loans,advancesandfinancing(continued)
(iii) The table below sets out the movements in individual assessment impairment allowance and collective assessment impairment allowance during the financial year as follows:
TheGroup TheBank 30june2018 30june2017 30june2018 30june2017 RM’000 RM’000 RM’000 RM’000
CollectiveassessmentallowanceAt 1 July 830,067 856,057 666,787 714,272Net allowance made during the financial year 299,887 283,057 224,340 217,958Amount transferred to individual assessment - (729) - (744)Amount written off (310,061) (298,120) (257,615) (256,059)Unwinding income (14,475) (10,732) (11,488) (8,911)Exchange difference (692) 534 (330) 271
At 30 June 804,726 830,067 621,694 666,787
IndividualassessmentallowanceAt 1 July 325,426 289,744 310,923 280,216Allowance made during the financial year 63,397 162,669 50,952 149,891Amount transferred from collective assessment - 729 - 744Amount written back in respect of recoveries (55,505) (46,433) (52,077) (42,003)Amount written off (119,266) (72,260) (118,014) (68,890)Unwinding income (7,959) (8,741) (7,951) (8,712)Exchange difference (3,917) (282) (3,864) (323)
At 30 June 202,176 325,426 179,969 310,923
FINANCIALS
303ANNUALREPORT
2018
BASEL II PILLAR 3 DISCLOSURESfOR thE fInAnCIAL yEAR EnDED 30 jUnE 2018

4.
RIS
KM
AN
AG
EMEN
T(C
ON
TIN
UED
)
(A)
Cred
itr
isk
(con
tin
ued)
Cred
itr
isk
expo
sure
sby
ris
kw
eigh
t
The
brea
kdow
n of
cre
dit
risk
expo
sure
s by
ris
k w
eigh
t is
as
follo
ws:
The
Gro
up30
jun
e20
18
E
xpos
ures
aft
erN
etti
ng
and
Cred
itR
isk
Mit
igat
ion
Tota
l
Expo
sure
s
afte
r
So
vere
ign
s/
Pub
lic
Ban
ks,
Insu
ran
ce
h
igh
er
N
etti
ng
&
Tota
lRis
k
Ce
ntra
lSe
ctor
D
FIs
Cos,
SF
R
egul
ator
yR
esid
enti
al
Ris
kO
ther
C
redi
tR
isk
Wei
ghte
d
B
anks
En
titi
es
&M
DB
san
dFM
Co
rpor
ates
R
etai
lM
ortg
ages
A
sset
sA
sset
sM
itig
atio
n
Ass
ets
Ris
kW
eigh
tR
M’0
00
RM
’000
R
M’0
00
RM
’000
R
M’0
00
RM
’000
R
M’0
00
RM
’000
R
M’0
00
RM
’000
R
M’0
00
0%
33,4
32,5
72
--
--
--
-1,
995,
641
35,4
28,2
13
-20
%
-41
9,72
77,
019,
820
-3,
482,
617
--
-20
5,28
111
,127
,445
2,
225,
489
35%
-
--
--
-28
,403
,704
-
-28
,403
,704
9,
941,
296
50%
-
-8,
070,
786
-1,
172,
426
53,1
00
5,31
5,38
8-
-14
,611
,700
7,
305,
850
75%
-
--
--
66,1
58,7
96
91,4
08
--
66,2
50,2
04
49,6
87,6
5310
0%
--
-17
3,70
237
,632
,702
46
5,36
81,
443,
711
-8,
430,
820
48,1
46,3
03
48,1
46,3
0315
0%
--
--
322,
872
195,
040
-51
3,69
3-
1,03
1,60
51,
547,
407
Tota
l 33
,432
,572
41
9,72
715
,090
,606
17
3,70
242
,610
,617
66
,872
,304
35
,254
,211
51
3,69
310
,631
,742
204
,999
,174
118
,853
,998
Risk
Wei
ghte
d
Ass
ets
by
Expo
sure
-
83,9
45
5,43
9,35
717
3,70
239
,399
,746
50
,403
,575
14
,111
,257
77
0,54
08,
471,
876
118,
853,
998
Aver
age
Risk
W
eigh
t 0%
20
.00%
36
.04%
10
0.00
%
92.4
6%
75.3
7%
40.0
3%
150.
00%
79
.68%
57
.98%
Ded
uctio
n fr
om
Capi
tal B
ase
--
--
--
--
--
304ANNUALREPORT2018
HONG LEONG BANK BERHAD
BASEL II PILLAR 3 DISCLOSURESfOR tHE fINANCIAL yEAR ENDED 30 jUNE 2018
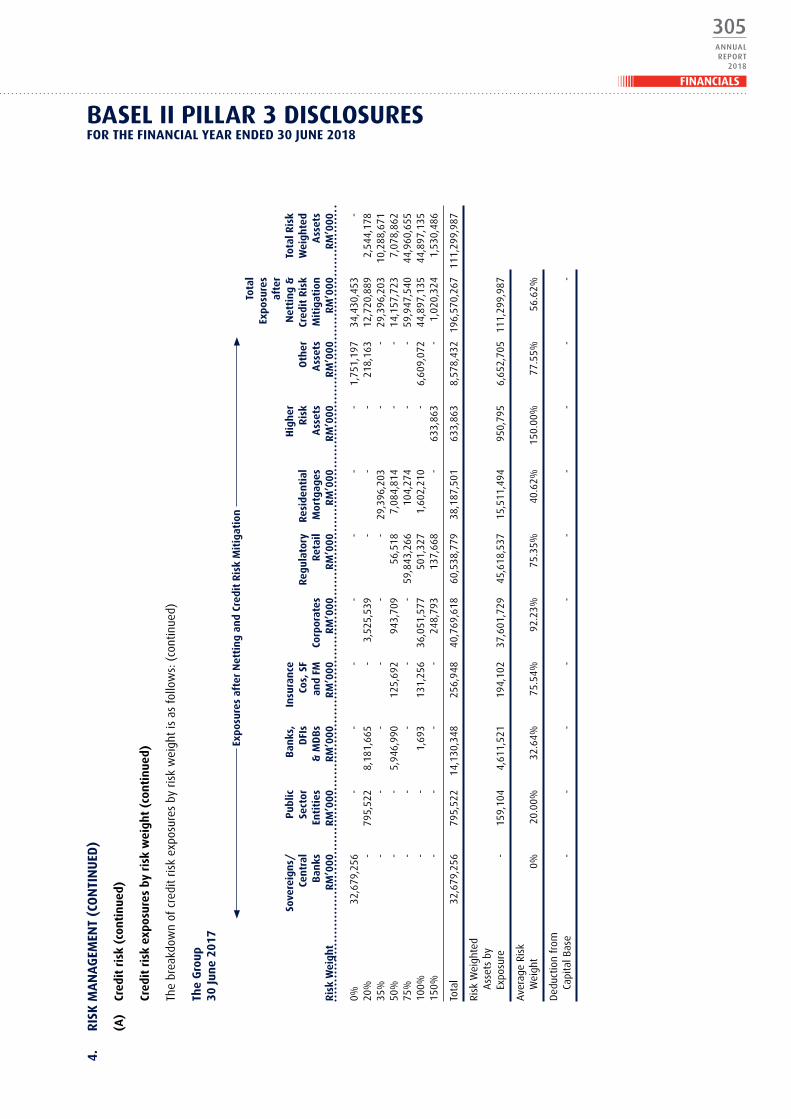
4.
RIS
KM
AN
AG
EMEN
T(C
ON
TIN
UED
)
(A)
Cred
itr
isk
(con
tin
ued)
Cred
itr
isk
expo
sure
sby
ris
kw
eigh
t(c
onti
nue
d)
The
brea
kdow
n of
cre
dit
risk
expo
sure
s by
ris
k w
eigh
t is
as
follo
ws:
(co
ntin
ued)
The
Gro
up30
jun
e20
17
E
xpos
ures
aft
erN
etti
ng
and
Cred
itR
isk
Mit
igat
ion
Tota
l
Expo
sure
s
afte
r
So
vere
ign
s/
Pub
lic
Ban
ks,
Insu
ran
ce
h
igh
er
N
etti
ng
&
Tota
lRis
k
Ce
ntra
lSe
ctor
D
FIs
Cos,
SF
R
egul
ator
yR
esid
enti
al
Ris
kO
ther
C
redi
tR
isk
Wei
ghte
d
B
anks
En
titi
es
&M
DB
san
dFM
Co
rpor
ates
R
etai
lM
ortg
ages
A
sset
sA
sset
sM
itig
atio
n
Ass
ets
Ris
kW
eigh
tR
M’0
00
RM
’000
R
M’0
00
RM
’000
R
M’0
00
RM
’000
R
M’0
00
RM
’000
R
M’0
00
RM
’000
R
M’0
00
0%
32,6
79,2
56
- -
- -
- -
- 1,
751,
197
34,4
30,4
53
-20
%
- 79
5,52
2 8,
181,
665
- 3,
525,
539
- -
- 21
8,16
3 12
,720
,889
2,
544,
178
35%
-
- -
- -
- 29
,396
,203
-
- 29
,396
,203
10
,288
,671
50%
-
- 5,
946,
990
125,
692
943,
709
56,5
18
7,08
4,81
4 -
- 14
,157
,723
7,
078,
862
75%
-
- -
- -
59,8
43,2
66
104,
274
- -
59,9
47,5
40
44,9
60,6
5510
0%
- -
1,69
3 13
1,25
6 36
,051
,577
50
1,32
7 1,
602,
210
- 6,
609,
072
44,8
97,1
35
44,8
97,1
3515
0%
- -
- -
248,
793
137,
668
- 63
3,86
3 -
1,02
0,32
4 1,
530,
486
Tota
l 32
,679
,256
79
5,52
2 14
,130
,348
25
6,94
8 40
,769
,618
60
,538
,779
38
,187
,501
63
3,86
3 8,
578,
432
196,
570,
267
111,
299,
987
Risk
Wei
ghte
d
Ass
ets
by
Expo
sure
-
159,
104
4,61
1,52
1 19
4,10
2 37
,601
,729
45
,618
,537
15
,511
,494
95
0,79
5 6,
652,
705
111,
299,
987
Aver
age
Risk
W
eigh
t 0%
20
.00%
32
.64%
75
.54%
92
.23%
75
.35%
40
.62%
15
0.00
%
77.5
5%
56.6
2%
Ded
uctio
n fr
om
Capi
tal B
ase
- -
- -
- -
- -
- -
FINANCIALS
305ANNUALREPORT
2018
BASEL II PILLAR 3 DISCLOSURESfOR thE fInAnCIAL yEAR EnDED 30 jUnE 2018
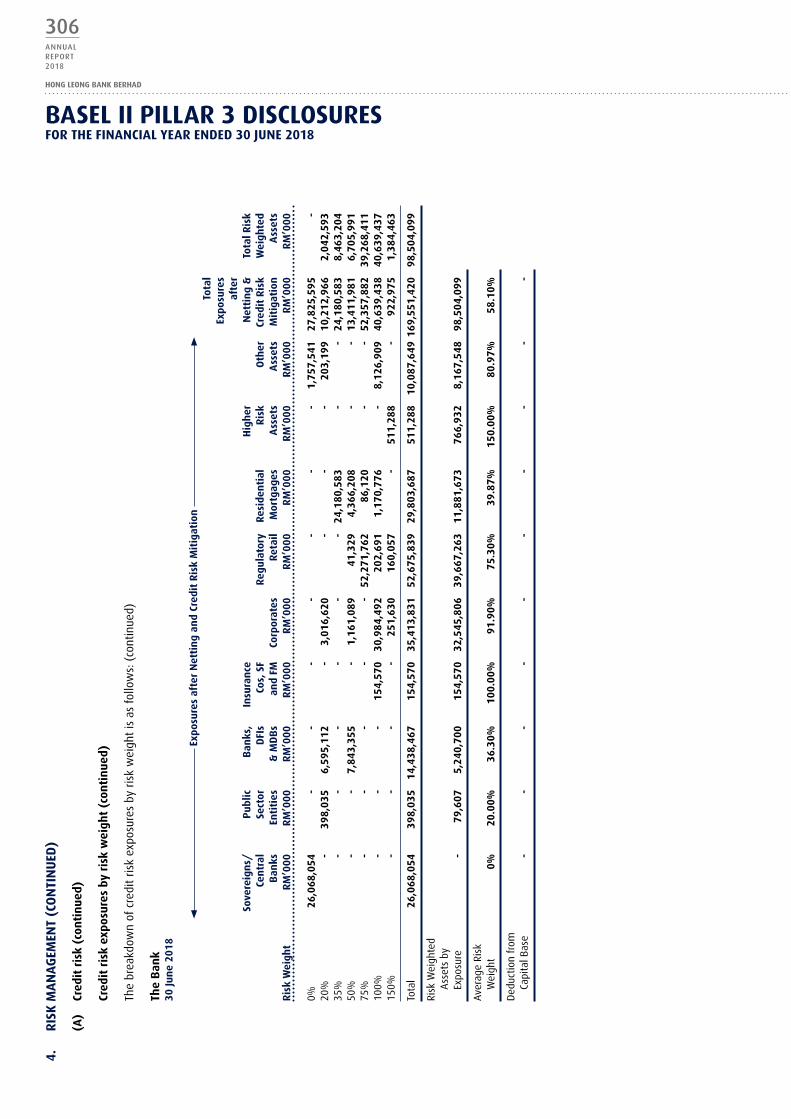
4.
RIS
KM
AN
AG
EMEN
T(C
ON
TIN
UED
)
(A)
Cred
itr
isk
(con
tin
ued)
Cred
itr
isk
expo
sure
sby
ris
kw
eigh
t(c
onti
nue
d)
The
brea
kdow
n of
cre
dit
risk
expo
sure
s by
ris
k w
eigh
t is
as
follo
ws:
(co
ntin
ued)
The
Ban
k30
jun
e20
18
E
xpos
ures
aft
erN
etti
ng
and
Cred
itR
isk
Mit
igat
ion
Tota
l
Expo
sure
s
afte
r
So
vere
ign
s/
Pub
lic
Ban
ks,
Insu
ran
ce
h
igh
er
N
etti
ng
&
Tota
lRis
k
Ce
ntra
lSe
ctor
D
FIs
Cos,
SF
R
egul
ator
yR
esid
enti
al
Ris
kO
ther
C
redi
tR
isk
Wei
ghte
d
B
anks
En
titi
es
&M
DB
san
dFM
Co
rpor
ates
R
etai
lM
ortg
ages
A
sset
sA
sset
sM
itig
atio
n
Ass
ets
Ris
kW
eigh
tR
M’0
00
RM
’000
R
M’0
00
RM
’000
R
M’0
00
RM
’000
R
M’0
00
RM
’000
R
M’0
00
RM
’000
R
M’0
00
0%
26,0
68,0
54
--
--
--
-1,
757,
541
27,8
25,5
95
-20
%
-39
8,03
56,
595,
112
-3,
016,
620
--
-20
3,19
910
,212
,966
2,
042,
593
35%
-
--
--
-24
,180
,583
-
-24
,180
,583
8,
463,
204
50%
-
-7,
843,
355
-1,
161,
089
41,3
29
4,36
6,20
8-
-13
,411
,981
6,
705,
991
75%
-
--
--
52,2
71,7
62
86,1
20
--
52,3
57,8
82
39,2
68,4
1110
0%
--
-15
4,57
030
,984
,492
20
2,69
11,
170,
776
-8,
126,
909
40,6
39,4
38
40,6
39,4
3715
0%
--
--
251,
630
160,
057
-51
1,28
8-
922,
975
1,38
4,46
3
Tota
l 26
,068
,054
39
8,03
514
,438
,467
15
4,57
035
,413
,831
52
,675
,839
29
,803
,687
51
1,28
810
,087
,649
169
,551
,420
98
,504
,099
Risk
Wei
ghte
d
Ass
ets
by
Expo
sure
-
79,6
07
5,24
0,70
015
4,57
032
,545
,806
39
,667
,263
11
,881
,673
76
6,93
28,
167,
548
98,5
04,0
99
Aver
age
Risk
W
eigh
t 0%
20
.00%
36
.30%
10
0.00
%
91.9
0%
75.3
0%
39.8
7%
150.
00%
80
.97%
58
.10%
Ded
uctio
n fr
om
Capi
tal B
ase
--
--
--
--
--
306ANNUALREPORT2018
HONG LEONG BANK BERHAD
BASEL II PILLAR 3 DISCLOSURESfOR tHE fINANCIAL yEAR ENDED 30 jUNE 2018

4.
RIS
KM
AN
AG
EMEN
T(C
ON
TIN
UED
)
(A)
Cred
itr
isk
(con
tin
ued)
Cred
itr
isk
expo
sure
sby
ris
kw
eigh
t(c
onti
nue
d)
The
brea
kdow
n of
cre
dit
risk
expo
sure
s by
ris
k w
eigh
t is
as
follo
ws:
(co
ntin
ued)
The
Ban
k30
jun
e20
17
E
xpos
ures
aft
erN
etti
ng
and
Cred
itR
isk
Mit
igat
ion
Tota
l
Expo
sure
s
afte
r
So
vere
ign
s/
Pub
lic
Ban
ks,
Insu
ran
ce
h
igh
er
N
etti
ng
&
Tota
lRis
k
Ce
ntra
lSe
ctor
D
FIs
Cos,
SF
R
egul
ator
yR
esid
enti
al
Ris
kO
ther
C
redi
tR
isk
Wei
ghte
d
B
anks
En
titi
es
&M
DB
san
dFM
Co
rpor
ates
R
etai
lM
ortg
ages
A
sset
sA
sset
sM
itig
atio
n
Ass
ets
Ris
kW
eigh
tR
M’0
00
RM
’000
R
M’0
00
RM
’000
R
M’0
00
RM
’000
R
M’0
00
RM
’000
R
M’0
00
RM
’000
R
M’0
00
0%
26,5
95,6
75
- -
- -
- -
- 1,
606,
985
28,2
02,6
60
-20
%
- 78
3,49
1 7,
603,
643
- 2,
827,
660
- -
- 21
8,16
3 11
,432
,957
2,
286,
591
35%
-
- -
- -
- 25
,247
,273
-
- 25
,247
,273
8,
836,
545
50%
-
- 5,
768,
753
125,
692
931,
319
43,8
27
5,77
4,67
3 -
- 12
,644
,264
6,
322,
132
75%
-
- -
- -
48,1
68,5
59
99,4
78
- -
48,2
68,0
37
36,2
01,0
2710
0%
- -
1,69
3 11
3,69
7 30
,417
,798
22
4,53
6 1,
324,
339
- 6,
229,
421
38,3
11,4
84
38,3
11,4
8415
0%
- -
- -
206,
894
121,
729
- 63
1,13
6 -
959,
759
1,43
9,63
9
Tota
l 26
,595
,675
78
3,49
1 13
,374
,089
23
9,38
9 34
,383
,671
48
,558
,651
32
,445
,763
63
1,13
6 8,
054,
569
165,
066,
434
93,3
97,4
18
Risk
Wei
ghte
d
Ass
ets
by
Expo
sure
-
156,
698
4,40
6,79
8 17
6,54
3 31
,759
,330
36
,555
,461
13
,122
,830
94
6,70
4 6,
273,
054
93,3
97,4
18
Aver
age
Risk
W
eigh
t 0%
20
.00%
32
.95%
73
.75%
92
.37%
75
.28%
40
.45%
15
0.00
%
77.8
8%
56.5
8%
Ded
uctio
n fr
om
Capi
tal B
ase
- -
- -
- -
- -
- -
FINANCIALS
307ANNUALREPORT
2018
BASEL II PILLAR 3 DISCLOSURESfOR thE fInAnCIAL yEAR EnDED 30 jUnE 2018
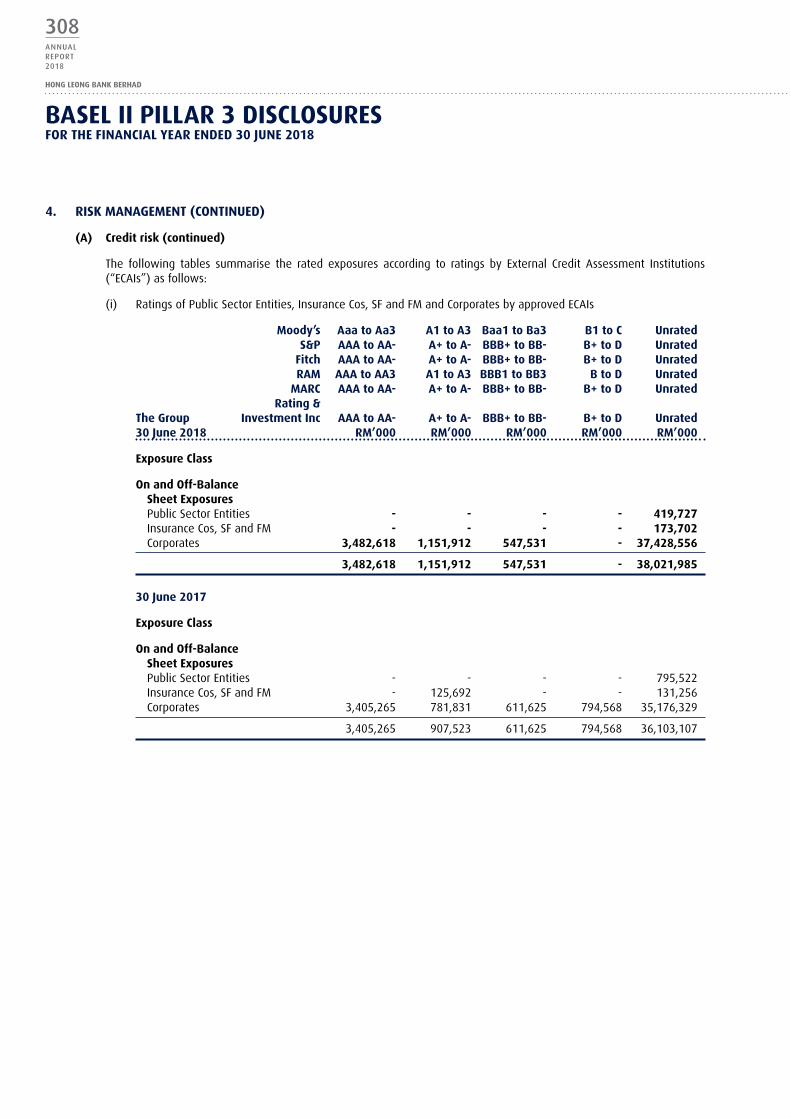
4. RISKMANAGEMENT(CONTINUED)
(A) Creditrisk(continued)
The following tables summarise the rated exposures according to ratings by External Credit Assessment Institutions (“ECAIs”) as follows:
(i) Ratings of Public Sector Entities, Insurance Cos, SF and FM and Corporates by approved ECAIs
Moody’s AaatoAa3 A1toA3 Baa1toBa3 B1toC Unrated S&P AAAtoAA- A+toA- BBB+toBB- B+toD Unrated Fitch AAAtoAA- A+toA- BBB+toBB- B+toD Unrated RAM AAAtoAA3 A1toA3 BBB1toBB3 BtoD Unrated MARC AAAtoAA- A+toA- BBB+toBB- B+toD Unrated Rating&TheGroup InvestmentInc AAAtoAA- A+toA- BBB+toBB- B+toD Unrated30june2018 RM’000 RM’000 RM’000 RM’000 RM’000
ExposureClass
OnandOff-Balance SheetExposures Public Sector Entities - - - - 419,727 Insurance Cos, SF and FM - - - - 173,702 Corporates 3,482,618 1,151,912 547,531 - 37,428,556
3,482,618 1,151,912 547,531 - 38,021,985
30june2017
ExposureClass
OnandOff-Balance SheetExposures Public Sector Entities - - - - 795,522 Insurance Cos, SF and FM - 125,692 - - 131,256 Corporates 3,405,265 781,831 611,625 794,568 35,176,329
3,405,265 907,523 611,625 794,568 36,103,107
308ANNUALREPORT2018
HONG LEONG BANK BERHAD
BASEL II PILLAR 3 DISCLOSURESfOR tHE fINANCIAL yEAR ENDED 30 jUNE 2018
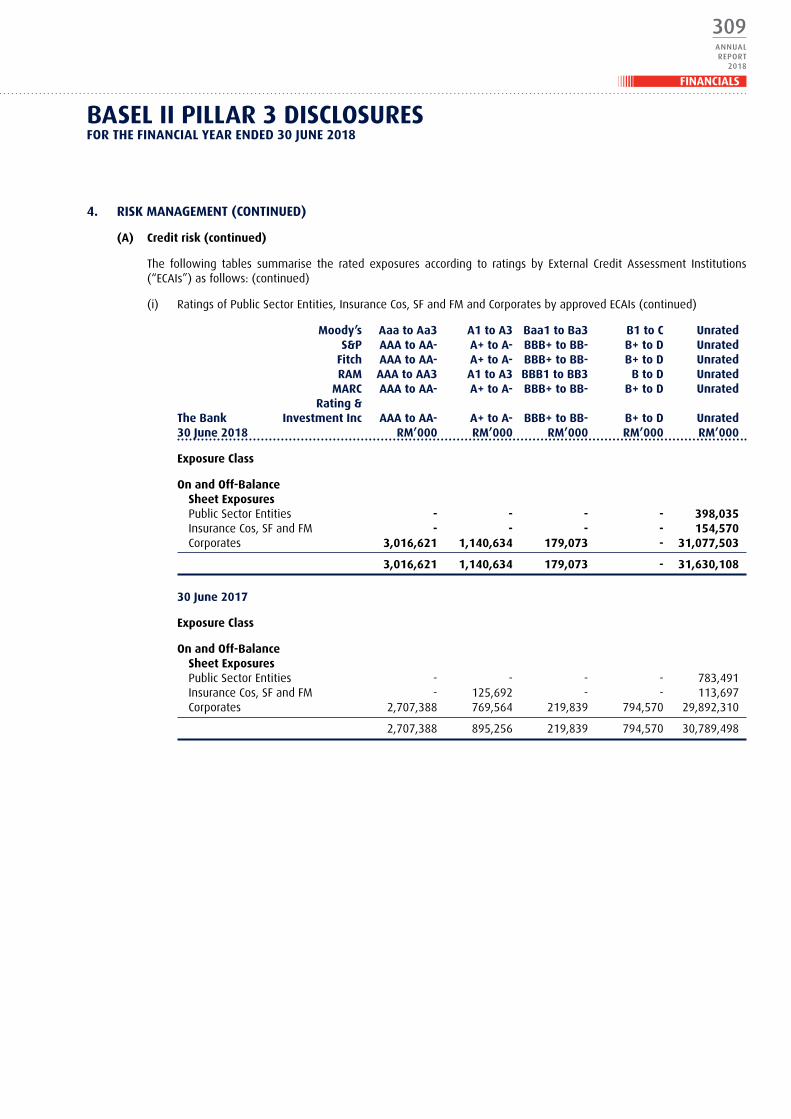
4. RISKMANAGEMENT(CONTINUED)
(A) Creditrisk(continued)
The following tables summarise the rated exposures according to ratings by External Credit Assessment Institutions (“ECAIs”) as follows: (continued)
(i) Ratings of Public Sector Entities, Insurance Cos, SF and FM and Corporates by approved ECAIs (continued)
Moody’s AaatoAa3 A1toA3 Baa1toBa3 B1toC Unrated S&P AAAtoAA- A+toA- BBB+toBB- B+toD Unrated Fitch AAAtoAA- A+toA- BBB+toBB- B+toD Unrated RAM AAAtoAA3 A1toA3 BBB1toBB3 BtoD Unrated MARC AAAtoAA- A+toA- BBB+toBB- B+toD Unrated Rating&TheBank InvestmentInc AAAtoAA- A+toA- BBB+toBB- B+toD Unrated30june2018 RM’000 RM’000 RM’000 RM’000 RM’000
ExposureClass
OnandOff-Balance SheetExposures Public Sector Entities - - - - 398,035 Insurance Cos, SF and FM - - - - 154,570 Corporates 3,016,621 1,140,634 179,073 - 31,077,503
3,016,621 1,140,634 179,073 - 31,630,108
30june2017
ExposureClass
OnandOff-Balance SheetExposures Public Sector Entities - - - - 783,491 Insurance Cos, SF and FM - 125,692 - - 113,697 Corporates 2,707,388 769,564 219,839 794,570 29,892,310
2,707,388 895,256 219,839 794,570 30,789,498
FINANCIALS
309ANNUALREPORT
2018
BASEL II PILLAR 3 DISCLOSURESfOR thE fInAnCIAL yEAR EnDED 30 jUnE 2018

4. RISKMANAGEMENT(CONTINUED)
(A) Creditrisk(continued)
The following tables summarise the rated exposures according to ratings by External Credit Assessment Institutions (“ECAIs”) as follows: (continued)
(ii) Ratings of Sovereigns/Central Banks and Banking Institutions by approved ECAIs
Moody’s S&P AaatoAa3 A1toA3 Baa1toBaa3 Ba1toB3 Caa1toC Unrated Fitch AAAtoAA- A+toA- BBB+toBBB- BB+toB- CCC+toD Unrated RAM AAAtoAA- A+toA- BBB+toBBB- BB+toB- CCC+toD Unrated MARC AAAtoAA3 A1toA3 BBB1toBBB3 BB1toB3 C1toD Unrated Rating& AAAtoAA- A+toA- BBB+toBBB- BB+toB- C+toD UnratedTheGroup InvestmentInc AAAtoAA- A+toA- BBB+toBBB- BB+toB- CCC+toC Unrated30June2018 RM’000 RM’000 RM’000 RM’000 RM’000 RM’000
ExposureClass
OnandOff-Balance SheetExposures Sovereigns/CentralBanks 2,548,707 711,256 173,727 171,369 - 29,827,513 Banks,MDBsandFDIs 2,191,648 4,928,137 860,462 - - 4,266,167
4,740,355 5,639,393 1,034,189 171,369 - 34,093,680
30June2017
ExposureClass
OnandOff-Balance SheetExposures Sovereigns/CentralBanks 2,002,982 552,638 210,620 157,297 - 29,755,719 Banks,MDBsandFDIs 1,805,640 3,691,959 1,265,500 - - 4,192,437
3,808,622 4,244,597 1,476,120 157,297 - 33,948,156
310ANNUALREPORT2018
HONG LEONG BANK BERHAD
BASEL II PILLAR 3 DISCLOSURESfOR tHE fINANCIAL yEAR ENDED 30 jUNE 2018

4. RISKMANAGEMENT(CONTINUED)
(A) Creditrisk(continued)
The following tables summarise the rated exposures according to ratings by External Credit Assessment Institutions (“ECAIs”) as follows: (continued)
(ii) Ratings of Sovereigns/Central Banks and Banking Institutions by approved ECAIs (continued)
Moody’s AaatoAa3 A1toA3 Baa1toBaa3 Ba1toB3 Caa1toC Unrated S&P AAAtoAA- A+toA- BBB+toBBB- BB+toB- CCC+toD Unrated Fitch AAAtoAA- A+toA- BBB+toBBB- BB+toB- CCC+toD Unrated RAM AAAtoAA3 A1toA3 BBB1toBBB3 BB1toB3 C1toD Unrated MARC AAAtoAA- A+toA- BBB+toBBB- BB+toB- C+toD Unrated Rating&TheBank InvestmentInc AAAtoAA- A+toA- BBB+toBBB- BB+toB- CCC+toC Unrated30June2018 RM’000 RM’000 RM’000 RM’000 RM’000 RM’000
ExposureClass
OnandOff-Balance SheetExposures Sovereigns/CentralBanks 2,391,532 711,256 - - - 22,965,266 Banks,MDBsandFDIs 3,521,215 4,489,662 686,368 - - 3,474,757
5,912,747 5,200,918 686,368 - - 26,440,023
30June2017
ExposureClass
OnandOff-Balance SheetExposures Sovereigns/CentralBanks 1,861,036 552,638 - - - 24,182,001 Banks,MDBsandFDIs 2,569,847 3,253,385 1,265,500 - - 3,287,098
4,430,883 3,806,023 1,265,500 - - 27,469,099
FINANCIALS
311ANNUALREPORT
2018
BASEL II PILLAR 3 DISCLOSURESfOR thE fInAnCIAL yEAR EnDED 30 jUnE 2018
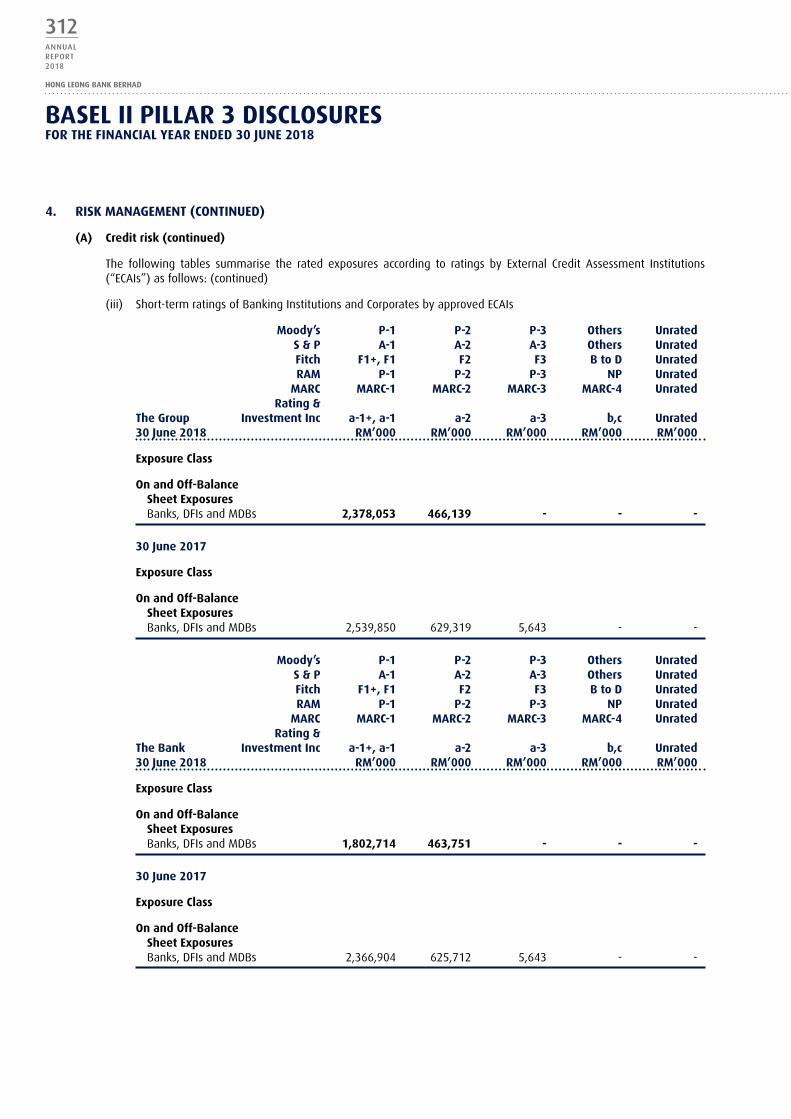
4. RISKMANAGEMENT(CONTINUED)
(A) Creditrisk(continued)
The following tables summarise the rated exposures according to ratings by External Credit Assessment Institutions (“ECAIs”) as follows: (continued)
(iii) Short-term ratings of Banking Institutions and Corporates by approved ECAIs
Moody’s P-1 P-2 P-3 Others Unrated S&P A-1 A-2 A-3 Others Unrated Fitch F1+,F1 F2 F3 BtoD Unrated RAM P-1 P-2 P-3 NP Unrated MARC MARC-1 MARC-2 MARC-3 MARC-4 Unrated Rating&TheGroup InvestmentInc a-1+,a-1 a-2 a-3 b,c Unrated30june2018 RM’000 RM’000 RM’000 RM’000 RM’000
ExposureClass
OnandOff-Balance SheetExposures Banks, DFIs and MDBs 2,378,053 466,139 - - -
30june2017
ExposureClass
OnandOff-Balance SheetExposures Banks, DFIs and MDBs 2,539,850 629,319 5,643 - -
Moody’s P-1 P-2 P-3 Others Unrated S&P A-1 A-2 A-3 Others Unrated Fitch F1+,F1 F2 F3 BtoD Unrated RAM P-1 P-2 P-3 NP Unrated MARC MARC-1 MARC-2 MARC-3 MARC-4 Unrated Rating&TheBank InvestmentInc a-1+,a-1 a-2 a-3 b,c Unrated30june2018 RM’000 RM’000 RM’000 RM’000 RM’000
ExposureClass
OnandOff-Balance SheetExposures Banks, DFIs and MDBs 1,802,714 463,751 - - -
30june2017
ExposureClass
OnandOff-Balance SheetExposures Banks, DFIs and MDBs 2,366,904 625,712 5,643 - -
312ANNUALREPORT2018
HONG LEONG BANK BERHAD
BASEL II PILLAR 3 DISCLOSURESfOR tHE fINANCIAL yEAR ENDED 30 jUNE 2018

4. RISKMANAGEMENT(CONTINUED)
(A) Creditrisk(continued)
Creditriskmitigation
The Group grants credit facilities on the basis of the borrower’s credit standing, repayment and debt servicing ability. Where possible, collateral is taken to mitigate and reduce any credit risk for the particular credit facility extended. The value of the collateral is monitored periodically and where applicable, a revised valuation may be requested from the borrower. The types of collateral accepted include cash, marketable securities, properties, machineries, equipments, inventories and receivables. In certain cases, corporate guarantees are obtained where the credit worthiness of the corporate borrower is insufficient for the amount sought. There are policies and processes in place to monitor collateral concentration. For Credit Risk Management (“CRM”) purposes, only collateral or guarantees that are legally enforceable are taken into account. The credit exposures are computed on a net basis only when there is a legally enforceable netting arrangements for loans and deposits. The Group and the Bank use the Comprehensive Approach for computation of the adjusted exposures.
The following table summarises the breakdown of CRM by exposure as follows:
Exposures Exposures coveredby coveredby Exposures guarantees/ eligible before credit financialTheGroup CRM derivatives collateral30june2018 RM’000 RM’000 RM’000
ExposureClass
On-BalanceSheetExposuresSovereigns/Central Banks 33,253,839 - -Public Sector Entities 293,642 - -Banks, DFIs and MDBs 12,374,681 - -Insurance Cos, SF and FM 76,719 - 251Corporates 37,923,078 - 943,663Regulatory Retail 59,751,355 - 474,355Residential Mortgages 35,024,844 - 17,968Higher Risk Assets 513,647 - 13Other Assets 10,629,659 - -Defaulted Exposures 796,925 - 1,664
Total On-Balance Sheet Exposures 190,638,389 - 1,437,914
Off-BalanceSheetExposuresOTC Derivatives 3,314,510 - -Off-Balance Sheet Exposures Other Than OTC Derivatives or Credit Derivatives 12,566,377 - 181,048Defaulted Exposures 99,308 - 448
Total Off-Balance Sheet Exposures 15,980,195 - 181,496
Total On and Off-Balance Sheet Exposures 206,618,584 - 1,619,410
FINANCIALS
313ANNUALREPORT
2018
BASEL II PILLAR 3 DISCLOSURESfOR thE fInAnCIAL yEAR EnDED 30 jUnE 2018

4. RISKMANAGEMENT(CONTINUED)
(A) Creditrisk(continued)
Creditriskmitigation(continued)
The following table summarises the breakdown of CRM by exposure as follows: (continued)
Exposures Exposures coveredby coveredby Exposures guarantees/ eligible before credit financialTheGroup CRM derivatives collateral30june2017 RM’000 RM’000 RM’000
ExposureClass
On-BalanceSheetExposuresSovereigns/Central Banks 32,611,888 - -Public Sector Entities 572,996 - -Banks, DFIs and MDBs 11,425,790 - -Insurance Cos, SF and FM 180,903 - -Corporates 36,876,799 350,000 1,193,835Regulatory Retail 53,897,849 - 539,793Residential Mortgages 38,007,264 - 21,888Higher Risk Assets 633,745 - 21Other Assets 8,578,234 - -Defaulted Exposures 656,988 - 2,849
Total On-Balance Sheet Exposures 183,442,456 350,000 1,758,386
Off-BalanceSheetExposuresOTC Derivatives 3,245,889 - -Off-Balance Sheet Exposures Other Than OTC Derivatives or Credit Derivatives 12,144,754 - 189,403Defaulted Exposures 34,969 - 12
Total Off-Balance Sheet Exposures 15,425,612 - 189,415
Total On and Off-Balance Sheet Exposures 198,868,068 350,000 1,947,801
314ANNUALREPORT2018
HONG LEONG BANK BERHAD
BASEL II PILLAR 3 DISCLOSURESfOR tHE fINANCIAL yEAR ENDED 30 jUNE 2018

4. RISKMANAGEMENT(CONTINUED)
(A) Creditrisk(continued)
Creditriskmitigation(continued)
The following table summarises the breakdown of CRM by exposure as follows: (continued)
Exposures Exposures coveredby coveredby Exposures guarantees/ eligible before credit financialTheBank CRM derivatives collateral30june2018 RM’000 RM’000 RM’000
ExposureClass
On-BalanceSheetExposuresSovereigns/Central Banks 25,889,320 - -Public Sector Entities 293,642 - -Banks, DFIs and MDBs 11,879,555 - -Insurance Cos, SF and FM 76,719 - 251Corporates 31,903,408 - 912,726Regulatory Retail 46,902,551 - 454,525Residential Mortgages 29,603,112 - 15,951Higher Risk Assets 511,240 - 11Other Assets 10,087,647 - -Defaulted Exposures 652,988 - 1,655
Total On-Balance Sheet Exposures 157,800,182 - 1,385,119
Off-BalanceSheetExposuresOTC Derivatives 3,111,793 - -Off-Balance Sheet Exposures Other Than OTC Derivatives or Credit Derivatives 10,161,502 - 176,813Defaulted Exposures 40,322 - 447
Total Off-Balance Sheet Exposures 13,313,617 - 177,260
Total On and Off-Balance Sheet Exposures 171,113,799 - 1,562,379
FINANCIALS
315ANNUALREPORT
2018
BASEL II PILLAR 3 DISCLOSURESfOR thE fInAnCIAL yEAR EnDED 30 jUnE 2018

4. RISKMANAGEMENT(CONTINUED)
(A) Creditrisk(continued)
Creditriskmitigation(continued)
The following table summarises the breakdown of CRM by exposure as follows: (continued)
Exposures Exposures coveredby coveredby Exposures guarantees/ eligible before credit financialTheBank CRM derivatives collateral30june2017 RM’000 RM’000 RM’000
ExposureClass
On-BalanceSheetExposuresSovereigns/Central Banks 26,528,307 - -Public Sector Entities 572,996 - -Banks, DFIs and MDBs 10,787,030 - -Insurance Cos, SF and FM 180,903 - -Corporates 31,133,523 - 1,146,334Regulatory Retail 43,188,689 - 518,997Residential Mortgages 32,290,617 - 19,316Higher Risk Assets 631,042 - 19Other Assets 8,054,371 - -Defaulted Exposures 536,985 - 2,802
Total On-Balance Sheet Exposures 153,904,463 - 1,687,468
Off-BalanceSheetExposuresOTC Derivatives 3,101,772 - -Off-Balance Sheet Exposures Other Than OTC Derivatives or Credit Derivatives 9,898,470 - 183,650Defaulted Exposures 32,859 - 12
Total Off-Balance Sheet Exposures 13,033,101 - 183,662
Total On and Off-Balance Sheet Exposures 166,937,564 - 1,871,130
316ANNUALREPORT2018
HONG LEONG BANK BERHAD
BASEL II PILLAR 3 DISCLOSURESfOR tHE fINANCIAL yEAR ENDED 30 jUNE 2018

4. RISKMANAGEMENT(CONTINUED)
(A) Creditrisk(continued)
Counterpartycreditrisk
Counterparty credit risk is the risk of trading counterparties’ failure to honour its obligations to the Group and the Bank. To control over-exposure of counterparty credit risk, credit limits are established for each trading counterparty. The credit limits are determined individually based on its credit strength and profile, which also takes into consideration the Group’s and the Bank’s risk appetite and trading strategies.
Appropriate methodologies have been implemented to measure counterparty credit risk against credit limits of each trading counterparty. These measurement methodologies implemented are in line with BNM’s Capital Adequacy Framework on the treatment of counterparty credit risk.
The Group and the Bank also engage in netting and margining agreements with major trading counterparties to mitigate counterparty credit risks. Under these agreements, the counterparty credit exposures are mitigated with collaterals whenever the exposures exceed the margin threshold.
Nature of commitments and contingencies
Direct credit substitutes comprise guarantees undertaken by the Group and the Bank to support the financial obligations of their customers to third parties.
Non credit related contingent items represent financial products such as Performance Guarantee whose crystallisations are dependent on specific events other than default payment by the customers.
Short term self liquidating trade-related contingencies relate to bills of exchange which have been accepted by the Group and the Bank and represent liabilities in the event of default by the acceptors and the drawers of the bills.
Assets sold with recourse and commitments with certain drawdown represents assets sold by the Group and the Bank with recourse in the event of defects in the assets, and investment or purchase commitments entered into by the Group and the Bank, where drawdown is certain to occur.
Obligations under underwriting agreements arise from underwriting agreements relating to the issuance of equity and debts securities, where the Group and the Bank are obliged to subscribe or purchase the securities in the event the securities are not taken up when issued.
Irrevocable commitments to extend credit include all obligations on the part of the Group and the Bank to provide funding facilities or the undrawn portion of an approved credit facilities to customers.
Forward foreign exchange contracts are agreements to buy or sell fixed amounts of currencies at agreed rates of exchange on a specified future date.
Interest rate swaps involve the exchange of interest obligations with a counterparty for a specified period without the exchange of the underlying principal.
FINANCIALS
317ANNUALREPORT
2018
BASEL II PILLAR 3 DISCLOSURESfOR thE fInAnCIAL yEAR EnDED 30 jUnE 2018

4. RISKMANAGEMENT(CONTINUED)
(A) Creditrisk(continued)
Counterpartycreditrisk(continued)
The Off-Balance Sheet exposures and their related counterparty credit risk of the Group and the Bank are as follows:
PositiveFair Valueof Credit Risk Principal Derivative Equivalent WeightedTheGroup Amount Contracts Amount* Assets*30june2018 RM’000 RM’000 RM’000 RM’000
CommitmentsandContingentLiabilitiesDirect credit substitutes 108,341 - 108,341 104,003
Transaction related contingent items 1,286,782 - 643,391 604,849
Short term self liquidating trade related contingencies 831,871 - 166,374 160,228
Irrevocable commitments to extend credit:- More than one year 14,301,856 - 7,150,928 5,882,218- Less than one year 16,074,688 - 3,214,938 2,844,103
Unutilised credit card lines 6,908,565 - 1,381,713 1,037,327
39,512,103 - 12,665,685 10,632,728
DerivativeFinancialContractsForeign exchange related contracts:- Less than one year 42,895,473 563,643 1,018,772 408,992- One year to less than five years 2,640,932 77,030 306,028 161,771- Five years and above 517,408 50,202 108,954 58,566
Interest/profit rate related contracts:- Less than one year 28,281,796 7,697 32,770 13,873- One year to less than five years 46,342,804 133,243 1,115,508 481,148- Five years and above 6,839,805 72,375 659,600 291,074
Equity related contracts:- Less than one year 306,258 3,928 23,383 12,470- One year to less than five years 503,502 9,949 49,495 24,748
128,327,978 918,067 3,314,510 1,452,642
167,840,081 918,067 15,980,195 12,085,370
* The credit equivalent amount and risk-weighted assets are arrived at using the credit conversion factors and risk-weights as defined in BNM’s revised RWCAF and CAFIB.
318ANNUALREPORT2018
HONG LEONG BANK BERHAD
BASEL II PILLAR 3 DISCLOSURESfOR tHE fINANCIAL yEAR ENDED 30 jUNE 2018

4. RISKMANAGEMENT(CONTINUED)
(A) Creditrisk(continued)
Counterpartycreditrisk(continued)
The Off-Balance Sheet exposures and their related counterparty credit risk of the Group and the Bank are as follows: (continued)
PositiveFair Valueof Credit Risk Principal Derivative Equivalent WeightedTheGroup Amount Contracts Amount* Assets*30june2017 RM’000 RM’000 RM’000 RM’000
CommitmentsandContingentLiabilitiesDirect credit substitutes 81,785 - 81,785 77,372
Transaction related contingent items 1,391,110 - 695,555 652,871
Short term self liquidating trade related contingencies 769,864 - 153,973 147,737
Irrevocable commitments to extend credit:- More than one year 13,257,147 - 6,628,573 5,424,889- Less than one year 16,097,927 - 3,219,586 2,863,935
Unutilised credit card lines 7,001,256 - 1,400,251 1,051,528
38,599,089 - 12,179,723 10,218,332
DerivativeFinancialContractsForeign exchange related contracts:- Less than one year 35,909,765 466,417 980,780 420,368- One year to less than five years 3,646,999 200,808 380,766 168,101- Five years and above 1,153,405 56,526 238,057 123,956
Interest/profit rate related contracts:- Less than one year 43,388,997 12,467 39,737 13,717- One year to less than five years 34,308,796 159,414 1,093,412 479,615- Five years and above 5,562,786 48,842 472,906 210,631
Equity related contracts:- Less than one year 155,471 410 9,739 6,786- One year to less than five years 279,187 8,158 30,492 15,245
124,405,406 953,042 3,245,889 1,438,419
163,004,495 953,042 15,425,612 11,656,751
* The credit equivalent amount and risk-weighted assets are arrived at using the credit conversion factors and risk-weights as defined in BNM’s revised RWCAF and CAFIB.
FINANCIALS
319ANNUALREPORT
2018
BASEL II PILLAR 3 DISCLOSURESfOR thE fInAnCIAL yEAR EnDED 30 jUnE 2018

4. RISKMANAGEMENT(CONTINUED)
(A) Creditrisk(continued)
Counterpartycreditrisk(continued)
The Off-Balance Sheet exposures and their related counterparty credit risk of the Group and the Bank are as follows: (continued)
PositiveFair Valueof Credit Risk Principal Derivative Equivalent WeightedTheBank Amount Contracts Amount* Assets*30june2018 RM’000 RM’000 RM’000 RM’000
CommitmentsandContingentLiabilitiesDirect credit substitutes 50,361 - 50,361 46,023
Transaction related contingent items 1,165,364 - 582,682 544,141
Short term self liquidating trade related contingencies 800,721 - 160,144 153,998
Irrevocable commitments to extend credit:- More than one year 10,410,497 - 5,205,249 4,219,031- Less than one year 14,108,380 - 2,821,676 2,483,070
Unutilised credit card lines 6,908,565 - 1,381,712 1,037,327
33,443,888 - 10,201,824 8,483,590
DerivativeFinancialContractsForeign exchange related contracts:- Less than one year 41,893,038 558,071 999,857 395,399- One year to less than five years 2,640,932 77,027 306,028 161,771- Five years and above 517,408 50,202 108,954 58,566
Interest/profit rate related contracts:- Less than one year 28,281,796 7,669 31,060 13,531- One year to less than five years 48,687,804 147,895 1,059,632 452,906- Five years and above 6,389,805 78,185 533,384 221,197
Equity related contracts:- Less than one year 306,258 3,928 23,383 12,470- One year to less than five years 503,502 9,949 49,495 24,748
129,220,543 932,926 3,111,793 1,340,588
162,664,431 932,926 13,313,617 9,824,178
* The credit equivalent amount and risk-weighted assets are arrived at using the credit conversion factors and risk-weights as defined in BNM’s revised RWCAF and CAFIB.
320ANNUALREPORT2018
HONG LEONG BANK BERHAD
BASEL II PILLAR 3 DISCLOSURESfOR tHE fINANCIAL yEAR ENDED 30 jUNE 2018

4. RISKMANAGEMENT(CONTINUED)
(A) Creditrisk(continued)
Counterpartycreditrisk(continued)
The Off-Balance Sheet exposures and their related counterparty credit risk of the Group and the Bank are as follows: (continued)
PositiveFair Valueof Credit Risk Principal Derivative Equivalent WeightedTheBank Amount Contracts Amount* Assets*30june2017 RM’000 RM’000 RM’000 RM’000
CommitmentsandContingentLiabilitiesDirect credit substitutes 28,387 - 28,387 23,974
Transaction related contingent items 1,285,746 - 642,873 600,189Short term self liquidating trade related contingencies 733,985 - 146,797 140,562
Irrevocable commitments to extend credit:- More than one year 9,601,053 - 4,800,528 3,900,248- Less than one year 14,562,467 - 2,912,493 2,579,763
Unutilised credit card lines 7,001,256 - 1,400,251 1,051,528
33,212,894 - 9,931,329 8,296,264
DerivativeFinancialContractsForeign exchange related contracts:- Less than one year 35,531,864 463,297 968,370 411,965- One year to less than five years 3,646,999 200,808 380,766 168,101- Five years and above 1,153,405 56,526 238,057 123,956
Interest/profit rate related contracts:- Less than one year 43,138,997 12,061 38,422 13,454- One year to less than five years 34,423,796 157,481 1,038,665 450,538- Five years and above 4,862,786 48,842 397,261 165,748
Equity related contracts:- Less than one year 155,471 410 9,739 6,786- One year to less than five years 279,187 8,158 30,492 15,245
123,192,505 947,583 3,101,772 1,355,793
156,405,399 947,583 13,033,101 9,652,057
* The credit equivalent amount and risk-weighted assets are arrived at using the credit conversion factors and risk-weights as defined in BNM’s revised RWCAF and CAFIB.
FINANCIALS
321ANNUALREPORT
2018
BASEL II PILLAR 3 DISCLOSURESfOR thE fInAnCIAL yEAR EnDED 30 jUnE 2018

4. RISKMANAGEMENT(CONTINUED)
(B) Marketrisk
Market risk is the risk of loss in financial instruments or the balance sheet due to adverse movements in market factors such as interest rates, foreign exchange rates, equities, spreads, volatilities and/or correlations.
The Bank adopts a systematic approach in managing such risks by types of instruments and nature of exposure. Market risk is primarily controlled via a series of cut-loss limits and potential loss limits, i.e. Value at Risk (“VaR”). The amount of market risk that the Bank is prepared to take for each financial year is based on the budget, business direction, its risk-taking strategies, the impact on earnings and capital utilisation. These factors are used as a basis for setting market risk limits for the Group and the Bank.
Market risk limits, the monitoring and escalation processes, delegation of authority, model validation and valuation methodologies are built into the Bank’s market risk policies, which are reviewed and concurred by the Group Asset and Liability Management Committee (“Group ALCO”), endorsed by the BRMC and approved by the Board.
The main market risk limits are stop loss limits, VaR limits, counterparty limits, sensitivity limits, position/instrument limits and holding period limits.
VaR is defined as the maximum loss at a specific confidence level over a specified period of time under normal market conditions. The Bank computes the Historical Simulation VaR on a daily basis based on the recent 250-days of market observations at a 99.0% confidence level.
Over the course of the financial year, the VaR of the banking group’s trading book ranged between RM3.3 million to RM15.1 million with an average of RM6.4 million.
The Bank performs backtesting on VaR on a hypothetical and actual basis and the results are tabled to the Group ALCO.
In addition, stress tests are conducted regularly on the trading book. In performing stress-testing, the Bank uses the following:
1) Scenario analysis, which is a combination of expected movements on risk factors.
2) Historical crisis event, which is based on actual movements that occurred in the relevant risk factors. The main risk factors that are stressed are the KL Financial Bursa Composite Index, interest rates movements (for MYR, USD and other major currencies), ratings migration and Foreign Exchange spot and volatilities.
In managing interest rate risk in the banking book, the Group measures earnings at risk and economic value or capital at risk.
(C) Liquidityrisk
Liquidity risk is the risk of financial loss arising from the inability to fund increases in assets and/or meet financial obligations as they fall due. Financial obligations arise from withdrawal of deposits, funding of loans committed and repayment of borrowed funds. It is the Bank’s policy to ensure there is adequate liquidity across all business units to sustain ongoing operations, as well as sufficient liquidity to fund asset growth and strategic opportunities.
Besides adhering to the Regulatory Liquidity Requirement, the Bank has put in place a robust and comprehensive liquidity risk management framework consisting of risk appetite, policies, triggers and controls which are reviewed and concurred by the Group ALCO, endorsed by the BRMC and approved by the Board. The key elements of the framework cover proactive monitoring and management of cashflow, maintenance of high quality liquid assets, diversification of funding sources and maintaining a liquidity compliance buffer to meet any unexpected cash outflow.
The Bank has in place liquidity contingency funding plan and stress test programs to minimise the liquidity risk that may arise due to unforeseen adverse changes in the marketplace. Contingency funding plan sets out the crisis escalation process and the various strategies to be employed to preserve liquidity including an orderly communication channel during liquidity crisis scenarios. Liquidity stress tests are conducted regularly to ensure there is adequate liquidity contingency fund to meet any shortfalls during liquidity crisis scenarios.
322ANNUALREPORT2018
HONG LEONG BANK BERHAD
BASEL II PILLAR 3 DISCLOSURESfOR tHE fINANCIAL yEAR ENDED 30 jUNE 2018

4. RISKMANAGEMENT(CONTINUED)
(D) Operationalrisk
Operational Risk is the risk of loss resulting from inadequate or failed internal processes, people and systems or from external events.
Management oversight on operational risk management (“ORM”) matters are effected through the Risk & Compliance Governance Committee (“RCGC”) whilst Board oversight is effected through the BRMC.
The Group’s ORM strategy is based on a framework of continuous improvements, good governance structure, policies and procedures as well as the employment of risk mitigation strategies. The Group adopts ORM tools such as loss event reporting, risk and control self assessment and key risk indicators to manage operational risks.
These tools are based on international best practices for the management of operational risks and are explained in more detail below:
i) Risk and Control Self Assessment (“RCSA”) is an assessment process on severity of potential risk and control effectiveness.
ii) Key Risk Indicators (“KRI”) is a set of measures to allow the Group to monitor and facilitate early detection of operational risks.
iii) Loss Event Reporting (“LER”) is a process for collecting and reporting operational risk events. These are further used for analysis of operational risks for the purpose of developing mitigating controls.
The operational risk mitigation strategies that are implemented include:
i) Policies, Guidelines and Standard Operating Procedures that define the roles and responsibilities of personnel and their respective operating limits.
ii) Insurance against operational losses as a form of risk mitigation especially for risks which are deemed as high severity.
iii) System of controls, established to provide reasonable assurance of effective and efficient operation.
iv) Business Continuity Management to facilitate the continuance of business activities in the event of disaster or crisis situations by means of ensuring appropriate redundancy of systems are available.
v) Outsourcing Management to ensure proper due diligence review is performed prior to engaging outsource service providers and continuous tracking of existing outsource service providers’ performance, code of conduct, compliance, and business viability.
(E) Financialhedgestomitigateinterestraterisks
The following actions describe the accounting treatment for financial hedges that may be entered into to mitigate the interest rate risk exposures of the Bank.
(i) Financial instruments designated as fair value through profit and loss
The Group and the Bank use derivative hedge instruments, such as interest rate swaps to undertake economic hedges on part of their existing fixed rate loans to reduce the exposure on interest rate risk as part of its risk management strategy.
(ii) Fair value hedges
The Group and the Bank use interest rate swap as the hedge instruments to hedge the interest rate risk of fixed rate loans exposure. The interest rate swap contracts used for the hedging are contracted with other financial institutions.
FINANCIALS
323ANNUALREPORT
2018
BASEL II PILLAR 3 DISCLOSURESfOR thE fInAnCIAL yEAR EnDED 30 jUnE 2018

4. RISKMANAGEMENT(CONTINUED)
(E) Financialhedgestomitigateinterestraterisks(continued)
(iii) Cash flow hedges
The Group and the Bank use interest rate swaps as hedge instruments to hedge the variability of future cash flows on fixed deposits.
Further information relating to the cash flow hedges are disclosed in Note 10(a) to the financial statements.
(iv) The accounting policies on derivative financial instruments and hedge accounting are disclosed in Note 2K to the financial statements.
5. EQUITYEXPOSURESINBANKINGBOOK
The Group’s and the Bank’s banking book’s equity investments consist of equity holdings in organisations which are set up for specific socio-economic reasons and equity holdings and equity instruments received as a result of loan/financing restructuring or loan/financing conversion.
The Group’s and the Bank’s banking book’s equity investments are classified and measured in accordance with MFRS 139 and are categorised as financial investments available-for-sale. Refer to Note 2D(i)(d) to the financial statements for the accounting policies of the Group and the Bank.
Details of the Group and Bank’s financial investments available-for-sale are set out in Note 6 to the financial statements.
The following table summarises the Group’s and the Bank’s equity exposures in the banking book:
TheGroup TheBank Exposures Exposures subjectto subjectto risk- Risk risk- Risk weighting weights weighting weights30june2018 RM’000 % RM’000 %
Financial investments available-for-saleQuoted equity securities - 100% - 100%Unquoted equity securities 467,512 150% 467,512 150%
30june2017Financial investments available-for-saleQuoted equity securities 27 100% 27 100%Unquoted equity securities 604,101 150% 604,101 150%
Realised gains arising from sales and liquidations of equity exposures are as follows:
TheGroupandtheBank 30june2018 30june2017 RM’000 RM’000
Net gains arising from sales of equity securities 194,543 41,971
There are no unrealised gains/(losses) for equity securities that have not been reflected in the statements of income of the Group and the Bank but have been recognised under other comprehensive income of the Group and the Bank for the financial year ended 30 June 2018.
324ANNUALREPORT2018
HONG LEONG BANK BERHAD
BASEL II PILLAR 3 DISCLOSURESfOR tHE fINANCIAL yEAR ENDED 30 jUNE 2018
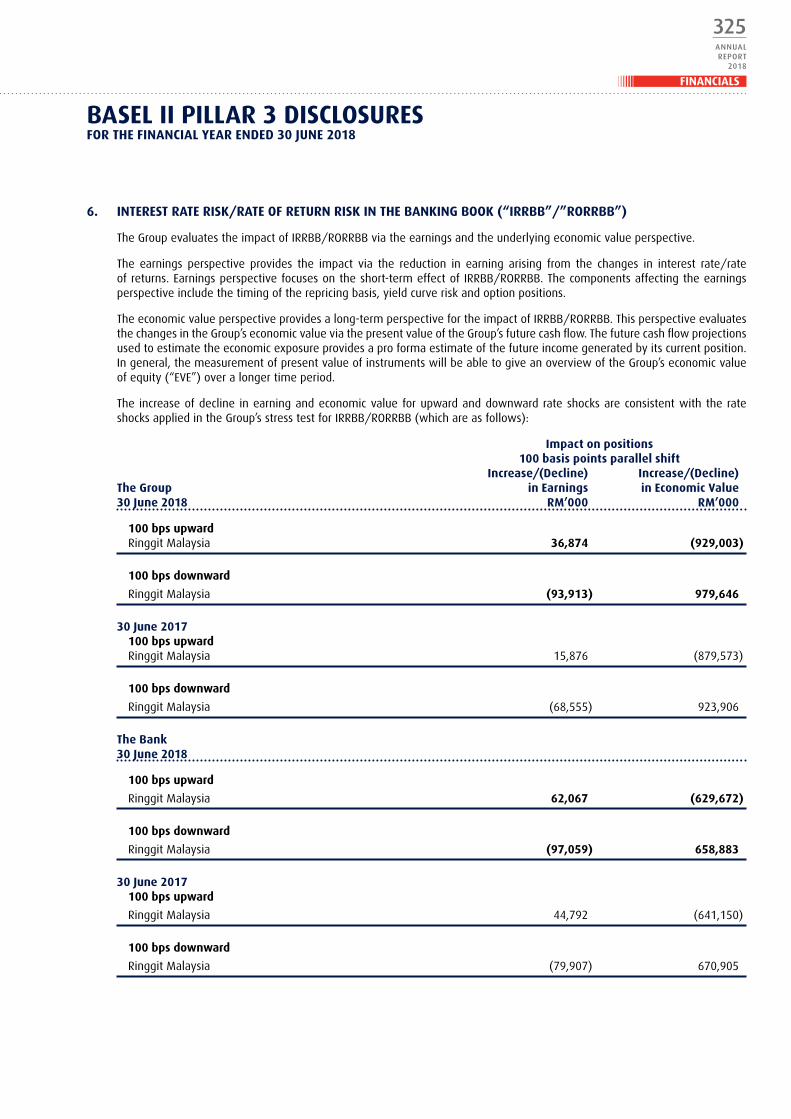
6. INTERESTRATERISK/RATEOFRETURNRISKINThEBANKINGBOOK(“IRRBB”/”RORRBB”)
The Group evaluates the impact of IRRBB/RORRBB via the earnings and the underlying economic value perspective.
The earnings perspective provides the impact via the reduction in earning arising from the changes in interest rate/rate of returns. Earnings perspective focuses on the short-term effect of IRRBB/RORRBB. The components affecting the earnings perspective include the timing of the repricing basis, yield curve risk and option positions.
The economic value perspective provides a long-term perspective for the impact of IRRBB/RORRBB. This perspective evaluates the changes in the Group’s economic value via the present value of the Group’s future cash flow. The future cash flow projections used to estimate the economic exposure provides a pro forma estimate of the future income generated by its current position. In general, the measurement of present value of instruments will be able to give an overview of the Group’s economic value of equity (“EVE”) over a longer time period.
The increase of decline in earning and economic value for upward and downward rate shocks are consistent with the rate shocks applied in the Group’s stress test for IRRBB/RORRBB (which are as follows):
Impactonpositions 100basispointsparallelshift Increase/(Decline) Increase/(Decline)TheGroup inEarnings inEconomicValue30june2018 RM’000 RM’000
100bpsupward Ringgit Malaysia 36,874 (929,003)
100bpsdownward
Ringgit Malaysia (93,913) 979,646
30june2017 100bpsupward Ringgit Malaysia 15,876 (879,573)
100bpsdownward
Ringgit Malaysia (68,555) 923,906
TheBank30june2018
100bpsupward
Ringgit Malaysia 62,067 (629,672)
100bpsdownward
Ringgit Malaysia (97,059) 658,883
30june2017 100bpsupward
Ringgit Malaysia 44,792 (641,150)
100bpsdownward
Ringgit Malaysia (79,907) 670,905
FINANCIALS
325ANNUALREPORT
2018
BASELIIPILLAR3DISCLOSURESFORThEFINANCIALYEARENDED30jUNE2018
7. ShARIAhGOVERNANCEDISCLOSURE
In October 2010, BNM has issued Shariah Governance Framework (“SGF”) to guide Islamic financial institutions to establish a comprehensive governance policy framework which sets out the strategic roles and functions of each organ of governance and mechanism in ensuring that the overall Islamic financial system operates in accordance with Shariah principles. The new Islamic Financial Services Act (“IFSA”) 2013, which came into force on 30 June 2013, statutorily enforce the management of Shariah non-compliance risk and require Islamic financial institutions to ensure that their aim, operation, business, affairs and activities are Shariah-compliant at all time.
HLISB has developed its own Shariah Governance Framework to ensure the management of Shariah matters in the Bank is of the highest standard in line with SGF and IFSA.
The Bank’s Shariah Governance Framework governs and guides HLISB on the on-going development and enhancement of its Shariah governance infrastructure. It forms the basic foundation upon which Shariah governance policies are to be developed, Shariah governance structure is to be operated in, and Shariah governance initiatives are to be carried out.
326ANNUALREPORT2018
hONGLEONGBANKBERhAD
BASELIIPILLAR3DISCLOSURESFORThEFINANCIALYEARENDED30jUNE2018

OTHERINFORMATION
1. MATERIALCONTRACTS
There were no material contracts (not being contracts entered into in the ordinary course of business) which had been entered into by the Bank and its subsidiaries involving the interest of Directors and major shareholders, either still subsisting at the end of the financial year or entered into since the end of the previous financial year pursuant to Item 21, Part A, Appendix 9C of the Main Market Listing Requirements of the Bursa Malaysia Securities Berhad.
2. ANALYSISOFSHAREHOLDINGSASAT30AUGUST2018
Total number of issued shares : 2,167,718,284
Adjusted total number of issued shares : 2,086,616,584 (after deducting treasury shares pursuant to Section 127 of the Companies Act 2016)
Class of shares : Ordinary shares
Voting rights : 1 vote for each share held
DISTRIbUTIONSCHEDULEOFSHAREHOLDERSASAT30AUGUST2018
SizeofHoldings No.ofShareholders % No.ofShares* %
Less than 100 343 3.41 7,121 0.00100 – 1,000 1,900 18.88 1,174,040 0.061,001 – 10,000 6,100 60.63 20,550,602 0.9810,001 – 100,000 1,288 12.80 40,441,166 1.94100,001 – less than 5% of issued shares 428 4.25 435,246,453 20.865% and above of issued shares 3 0.03 1,589,197,202 76.16
10,062 100.00 2,086,616,584 100.00
* Excluding81,101,700sharesboughtbackandretainedbytheBankastreasuryshares
LISTOFTHIRTYLARGESTSHAREHOLDERSASAT30AUGUST2018
NameofShareholders No.ofShares %
1. Assets Nominees (Tempatan) Sdn Bhd 1,155,753,941 55.39- Hong Leong Financial Group Berhad
2. Citigroup Nominees (Tempatan) Sdn Bhd 249,059,521 11.94- Employees Provident Fund Board
3. Hong Leong Financial Group Berhad 184,383,740 8.84
4. MTrustee Berhad 40,786,550 1.95- Exempt AN for Hong Leong Bank Berhad (ESOS)
5. Cartaban Nominees (Asing) Sdn Bhd 23,517,000 1.13- Exempt AN for State Street Bank & Trust Company (West Clt OD67)
6. Malaysia Nominees (Tempatan) Sendirian Berhad 18,818,400 0.90- Great Eastern Life Assurance (Malaysia) Berhad (Par 1)
7. Kumpulan Wang Persaraan (Diperbadankan) 15,067,800 0.72
8. CIMSEC Nominees (Tempatan) Sdn Bhd 14,294,300 0.69- CIMB for Rakaman Anggun Sdn Bhd (PB)
9. HSBC Nominees (Asing) Sdn Bhd 10,115,642 0.48- JPMCB NA for Vanguard Emerging Markets Stock Index Fund
ADDITIONALINFORMATION
327ANNUALREPORT
2018

LISTOFTHIRTYLARGESTSHAREHOLDERSASAT30AUGUST2018(CONTINUED)
NameofShareholders No.ofShares %
10. AmanahRaya Trustees Berhad 10,000,000 0.48- Amanah Saham Wawasan 2020
11 AmanahRaya Trustees Berhad 9,474,400 0.45- Amanah Saham Malaysia
12. Cartaban Nominees (Tempatan) Sdn Bhd 9,346,180 0.45- PAMB for Prulink Equity Fund
13. HSBC Nominees (Asing) Sdn Bhd 9,112,952 0.44- JPMCB NA for Vanguard Total International Stock Index Fund
14. Citigroup Nominees (Asing) Sdn Bhd 8,663,200 0.42- Exempt AN for Citibank New York (Norges Bank 14)
15. Cartaban Nominees (Asing) Sdn Bhd 7,447,374 0.36- GIC Private Limited for Government Of Singapore (C)
16. Cartaban Nominees (Asing) Sdn Bhd 7,235,500 0.35- RBC Investor Services Bank S.A. for Robeco Capital Growth Funds
17. HLIB Nominees (Tempatan) Sdn Bhd 6,485,863 0.31- Chew Brothers Development Corporation Sdn Bhd
18. Citigroup Nominees (Asing) Sdn Bhd 6,354,000 0.30 - Exempt AN for Citibank New York (Norges Bank 9)
19. AmanahRaya Trustees Berhad 6,237,800 0.30- Amanah Saham Bumiputera
20. Pertubuhan Keselamatan Sosial 6,131,600 0.29
21. Citigroup Nominees (Tempatan) Sdn Bhd 6,105,000 0.29- Employees Provident Fund Board (Nomura)
22. Cartaban Nominees (Asing) Sdn Bhd 5,933,008 0.28- BBH And Co Boston for WGI Emerging Markets Smaller Companies Fund, LLC
23. HLB Nominees (Asing) Sdn Bhd 5,510,000 0.26- Kwek Leng Hai (Custodian)
24. Citigroup Nominees (Tempatan) Sdn Bhd 4,802,740 0.23- Exempt AN for AIA Bhd.
25. AmanahRaya Trustees Berhad 4,500,000 0.22- Amanah Saham Bumiputera 2
26. DB (Malaysia) Nominee (Asing) Sdn Bhd 3,831,000 0.18- State Street London Fund U8T8 for Pinebridge Asia Ex Japan Small Cap Equity Fund (Pinebridge GL F)
OTHERINFORMATION
328ANNUALREPORT2018
HONG LEONG BANK BERHAD

LISTOFTHIRTYLARGESTSHAREHOLDERSASAT30AUGUST2018(CONTINUED)
NameofShareholders No.ofShares %
27. Malaysia Nominees (Tempatan) Sendirian Berhad 3,716,140 0.18- Great Eastern Life Assurance (Malaysia) Berhad (Par 3)
28. HSBC Nominees (Asing) Sdn Bhd- JPMCB NA for MSCI Equity Index Fund B - Malaysia 3,620,280 0.17
29. DB (Malaysia) Nominee (Asing) Sdn Bhd 3,505,696 0.17- BNYM SA/NV for People’s Bank of China (SICL Asia EM)
30. HSBC Nominees (Asing) Sdn Bhd 3,269,777 0.16- JPMCB NA for Blackrock Institutional Trust Company, N.A. Investment Funds for Employee Benefit Trusts
1,843,079,404 88.33
SUbSTANTIALSHAREHOLDERS
According to the Register of Substantial Shareholders, the substantial shareholders of the Bank as at 30 August 2018 are as follows:
Direct IndirectShareholders No.ofshares % No.ofshares %
Hong Leong Financial Group Berhad 1,340,137,681 64.23 3,057,504 0.15(a)
Hong Leong Company (Malaysia) Berhad – – 1,346,181,489 64.52(a)
HL Holdings Sdn Bhd – – 1,346,181,489 64.52(b)
Tan Sri Quek Leng Chan – – 1,346,237,169 64.52(c)
Hong Realty (Private) Limited – – 1,346,181,489 64.52(b)
Hong Leong Investment Holdings Pte Ltd – – 1,346,181,489 64.52(b)
Kwek Holdings Pte Ltd – – 1,346,181,489 64.52(b)
Kwek Leng Beng – – 1,346,181,489 64.52(b)
Davos Investment Holdings Private Limited – – 1,346,181,489 64.52(b)
Kwek Leng Kee 282,344 0.01 1,346,181,489 64.52(b)
Guoco Assets Sdn Bhd – – 1,343,195,185 64.37(d)
GuoLine Overseas Limited – – 1,343,405,145 64.38(e)
Guoco Group Limited – – 1,343,405,145 64.38(e)
GuoLine Capital Assets Limited – – 1,346,181,489 64.52(e)
Employees Provident Fund Board 260,463,721 12.48 – –
Notes:(a) Heldthroughsubsidiaries(b) HeldthroughHongLeongCompany(Malaysia)Berhad(“HLCM”)(c) HeldthroughHLCMandacompanyinwhichthesubstantialshareholderhasinterest(d) HeldthroughHongLeongFinancialGroupBerhad(“HLFG”)(e) Heldthroughsubsidiary(ies)andHLFG
OTHERINFORMATION
ADDITIONAL INFORMATION
329ANNUALREPORT
2018

OTHERINFORMATION
DIRECTORS’INTERESTSASAT30AUGUST2018
Subsequent to the financial year end, there is no change, as at 30 August 2018, to the Directors’ interests in the ordinary shares, preference shares and/or options over ordinary shares of the Bank and/or its related corporations (other than wholly-owned subsidiaries), appearing in the Directors’ Report on pages 121 to 123 as recorded in the Register of Directors’ Shareholdings kept by the Company under Section 219 of Companies Act 2016 except for the change set out below:
IndirectInterest NumberofShares %
YbhgTanSriQuekLengChanin:
Hong Leong MSIG Takaful Berhad 97,500,000 65.00
GROUpMANAGINGDIRECTOR/CHIEFExECUTIvEOFFICER’SINTERESTSASAT30AUGUST2018
DirectInterest Numberofordinaryshares/sharesissued ortobeissuedoracquiredarising fromtheexerciseofoptions* %
MrDomenicFuda 350 #
643,176** N/A 8,000,000* N/A
# Negligible
** Free ordinary shares to be vested pursuant to the Executive Share Scheme of HLB
330ANNUALREPORT2018
HONG LEONG BANK BERHAD

OTHERINFORMATION
LISTOFpROpERTIESHELDASAT30JUNE2018
Location
Tenure
Descriptionofproperty
held
GrossArea
(Sq-ft)
Approx.Age
(Years)
Netbookvalue
(RM‘000)
Dateof
acquisition
1 No. 1, Light Street, Georgetown 10200 Pulau Pinang
Freehold Branch premises
20,594 84 7,436 30/12/1986
2 No. 15-G-1, 15-1-1 & 15-2-1 Medan Kampung Relau Bayan Point 11900 Pulau Pinang
Freehold Branch premises
9,968 19 2,071 26/06/1997
3 No. 42, Jalan Pending 93450 Kuching Sarawak
Leasehold - 859 years
(31/12/2779)
Branch premises
4,425 36 1,525 27/12/1983
4 No. 133, 135 & 137 Jalan Kampong Nyabor 96000 Sibu Sarawak
Freehold Branch premises
4,871 26 2,895 28/12/1992
5 Jungle land at Sungai Lisut Rejang Sarawak Occupation Ticket 612 of 1931
Leasehold - 99 years
(31/12/2026)
Jungle land 1,217,938 n/a 1 31/12/1938
6 No. 25 & 27, Jalan Tun Ismail 25000 Kuantan Pahang Darul Makmur
Freehold Branch premises
1,600 27 1,138 29/06/1996
7 No. 69, 70 & 71 Jalan Dato’ Bandar Tunggal 70000 Seremban Negeri Sembilan Darul Khusus
Freehold Branch premises
6,000 Pre-war 1,412 27/12/1994
8 No. 26, Lorong Rahim Kajai 14 Taman Tun Dr Ismail 60000 Kuala Lumpur
Freehold Branch premises
3,750 32 499 30/12/1986
9 No. 120-122, Jalan Mersing 86000 Kluang Johor Darul Takzim
Leasehold - 99 years
(22/8/2063)
Branch premises
3,355 52 546 31/05/1990
10 No. 100, Jalan Gurney 72100 Bahau Negeri Sembilan Darul Khusus
Freehold Branch premises
5,107 32 2,091 25/06/1992
11 No. 12, 14 & 16 Jalan Wong Ah Fook 80000 Johor Bahru Johor Darul Takzim
Freehold Branch premises
4,174 27 3,511 25/06/1992
12 No. 6, Jalan Merdeka 96100 Sarikei Sarawak
Leasehold - 60 years
(31/12/2029)
Vacant 2,240 49 56 18/10/1969
ADDITIONAL INFORMATION
331ANNUALREPORT
2018
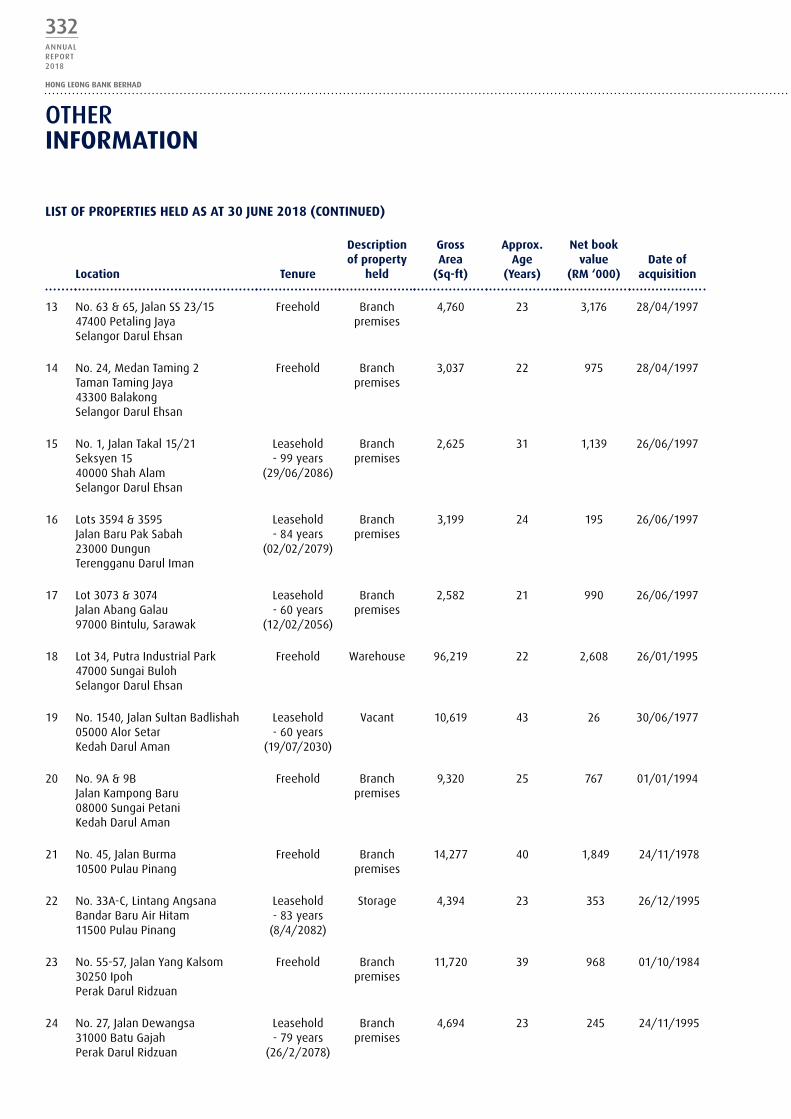
OTHERINFORMATION
Location
Tenure
Descriptionofproperty
held
GrossArea
(Sq-ft)
Approx.Age
(Years)
Netbookvalue
(RM‘000)
Dateof
acquisition
13 No. 63 & 65, Jalan SS 23/15 47400 Petaling Jaya Selangor Darul Ehsan
Freehold Branch premises
4,760 23 3,176 28/04/1997
14 No. 24, Medan Taming 2 Taman Taming Jaya 43300 Balakong Selangor Darul Ehsan
Freehold Branch premises
3,037 22 975 28/04/1997
15 No. 1, Jalan Takal 15/21 Seksyen 15 40000 Shah Alam Selangor Darul Ehsan
Leasehold - 99 years
(29/06/2086)
Branch premises
2,625 31 1,139 26/06/1997
16 Lots 3594 & 3595 Jalan Baru Pak Sabah 23000 Dungun Terengganu Darul Iman
Leasehold - 84 years
(02/02/2079)
Branch premises
3,199 24 195 26/06/1997
17 Lot 3073 & 3074 Jalan Abang Galau 97000 Bintulu, Sarawak
Leasehold - 60 years
(12/02/2056)
Branch premises
2,582 21 990 26/06/1997
18 Lot 34, Putra Industrial Park 47000 Sungai Buloh Selangor Darul Ehsan
Freehold Warehouse 96,219 22 2,608 26/01/1995
19 No. 1540, Jalan Sultan Badlishah 05000 Alor Setar Kedah Darul Aman
Leasehold - 60 years
(19/07/2030)
Vacant 10,619 43 26 30/06/1977
20 No. 9A & 9B Jalan Kampong Baru 08000 Sungai Petani Kedah Darul Aman
Freehold Branch premises
9,320 25 767 01/01/1994
21 No. 45, Jalan Burma 10500 Pulau Pinang
Freehold Branch premises
14,277 40 1,849 24/11/1978
22 No. 33A-C, Lintang Angsana Bandar Baru Air Hitam 11500 Pulau Pinang
Leasehold - 83 years
(8/4/2082)
Storage 4,394 23 353 26/12/1995
23 No. 55-57, Jalan Yang Kalsom 30250 Ipoh Perak Darul Ridzuan
Freehold Branch premises
11,720 39 968 01/10/1984
24 No. 27, Jalan Dewangsa 31000 Batu Gajah Perak Darul Ridzuan
Leasehold - 79 years
(26/2/2078)
Branch premises
4,694 23 245 24/11/1995
LISTOFpROpERTIESHELDASAT30JUNE2018(CONTINUED)
332ANNUALREPORT2018
HONG LEONG BANK BERHAD

OTHERINFORMATION
Location
Tenure
Descriptionofproperty
held
GrossArea
(Sq-ft)
Approx.Age
(Years)
Netbookvalue
(RM‘000)
Dateof
acquisition
25 No. 75, Jalan Sultan Idris Shah 30000 Ipoh Perak Darul Ridzuan
Freehold Branch premises
1,900 21 602 15/06/1998
26 No. 80 & 82, Jalan Othman 1/14 46000 Petaling Jaya Selangor Darul Ehsan
Leasehold - 90 years
(15/6/2089)
Branch premises
9,062 28 870 01/06/1994
27 No. 19, Jalan 54, Desa Jaya 52100 Kepong Selangor Darul Ehsan
Leasehold - 99 years
(8/3/2081)
Branch premises
5,859 36 321 29/11/1985
28 No. 55, Jalan Pasar 55100 Kuala Lumpur
Freehold Branch premises
4,313 38 297 01/04/1980
29 Lot 111, Jalan Mega Mendung Kompleks Bandar Off Jalan Klang Lama 58200 Kuala Lumpur
Leasehold - 99 years
(11/10/2076)
Branch premises
4,978 38 404 31/07/1988
30 No. 161, Jalan Imbi 55100 Kuala Lumpur
Freehold Vacant 2,454 22 2,682 14/02/1996
31 No. 8A-C, Jalan Station 80000 Johor Bahru Johor Darul Takzim
Freehold Branch premises
12,854 25 352 22/10/1977
32 No. 109, Main Road 83700 Yong Peng Johor Darul Takzim
Freehold Branch premises
2,740 30 202 01/09/1988
33 No. 1, Bentong Heights 28700 Bentong Pahang Darul Makmur
Freehold Branch premises
5,432 50 32 30/06/1977
34 No. 36, Main Road Tanah Rata 39000 Cameron Highland Pahang Darul Makmur
Leasehold - 99 years
(24/11/2039)
Branch premises
1,728 78 95 30/08/1982
35 W-1-0, W-2-0 & W-1-1 Subang Square Business Centre Jalan SS15/4G 47500 Subang Jaya Selangor Darul Ehsan
Freehold Branch premises
4,545 19 1,199 18/12/1999
36 No. 2828-G-02 & 2828-1-02 Jalan Bagan Luar 12000 Butterworth Pulau Pinang
Freehold Branch premises
12,173 19 2,279 18/12/1999
LISTOFpROpERTIESHELDASAT30JUNE2018(CONTINUED)
ADDITIONAL INFORMATION
333ANNUALREPORT
2018
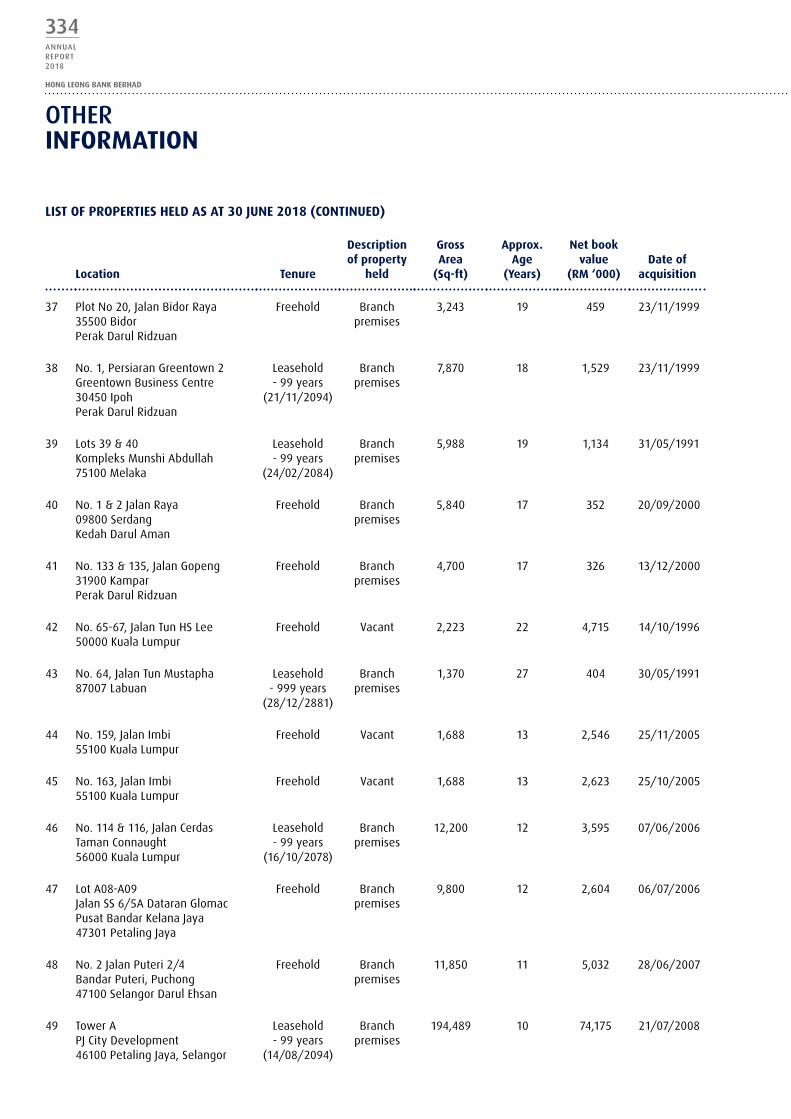
OTHERINFORMATION
Location
Tenure
Descriptionofproperty
held
GrossArea
(Sq-ft)
Approx.Age
(Years)
Netbookvalue
(RM‘000)
Dateof
acquisition
37 Plot No 20, Jalan Bidor Raya 35500 Bidor Perak Darul Ridzuan
Freehold Branch premises
3,243 19 459 23/11/1999
38 No. 1, Persiaran Greentown 2 Greentown Business Centre 30450 Ipoh Perak Darul Ridzuan
Leasehold - 99 years
(21/11/2094)
Branch premises
7,870 18 1,529 23/11/1999
39 Lots 39 & 40 Kompleks Munshi Abdullah 75100 Melaka
Leasehold - 99 years
(24/02/2084)
Branch premises
5,988 19 1,134 31/05/1991
40 No. 1 & 2 Jalan Raya 09800 Serdang Kedah Darul Aman
Freehold Branch premises
5,840 17 352 20/09/2000
41 No. 133 & 135, Jalan Gopeng 31900 Kampar Perak Darul Ridzuan
Freehold Branch premises
4,700 17 326 13/12/2000
42 No. 65-67, Jalan Tun HS Lee 50000 Kuala Lumpur
Freehold Vacant 2,223 22 4,715 14/10/1996
43 No. 64, Jalan Tun Mustapha 87007 Labuan
Leasehold - 999 years
(28/12/2881)
Branch premises
1,370 27 404 30/05/1991
44 No. 159, Jalan Imbi 55100 Kuala Lumpur
Freehold Vacant 1,688 13 2,546 25/11/2005
45 No. 163, Jalan Imbi 55100 Kuala Lumpur
Freehold Vacant 1,688 13 2,623 25/10/2005
46 No. 114 & 116, Jalan Cerdas Taman Connaught 56000 Kuala Lumpur
Leasehold - 99 years
(16/10/2078)
Branch premises
12,200 12 3,595 07/06/2006
47 Lot A08-A09 Jalan SS 6/5A Dataran Glomac Pusat Bandar Kelana Jaya 47301 Petaling Jaya
Freehold Branch premises
9,800 12 2,604 06/07/2006
48 No. 2 Jalan Puteri 2/4 Bandar Puteri, Puchong 47100 Selangor Darul Ehsan
Freehold Branch premises
11,850 11 5,032 28/06/2007
49 Tower A PJ City Development 46100 Petaling Jaya, Selangor
Leasehold - 99 years
(14/08/2094)
Branch premises
194,489 10 74,175 21/07/2008
LISTOFpROpERTIESHELDASAT30JUNE2018(CONTINUED)
334ANNUALREPORT2018
HONG LEONG BANK BERHAD
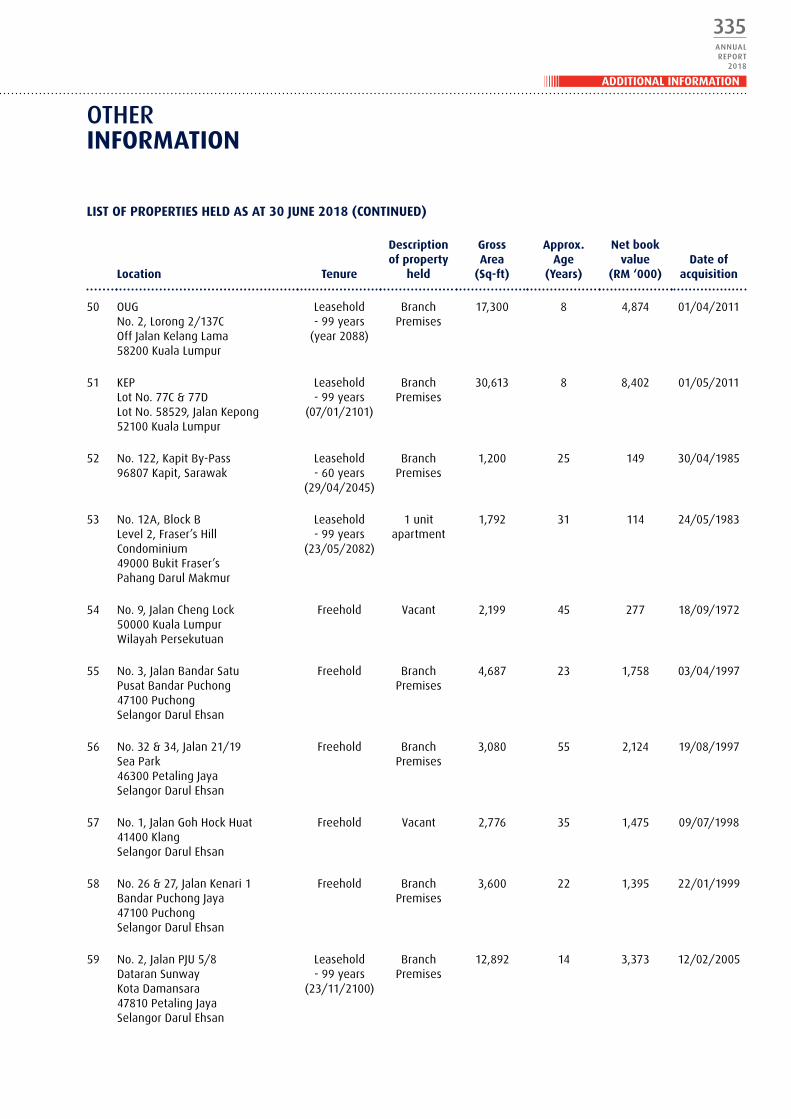
OTHERINFORMATION
Location
Tenure
Descriptionofproperty
held
GrossArea
(Sq-ft)
Approx.Age
(Years)
Netbookvalue
(RM‘000)
Dateof
acquisition
50 OUG No. 2, Lorong 2/137C Off Jalan Kelang Lama 58200 Kuala Lumpur
Leasehold - 99 years
(year 2088)
Branch Premises
17,300 8 4,874 01/04/2011
51 KEP Lot No. 77C & 77D Lot No. 58529, Jalan Kepong 52100 Kuala Lumpur
Leasehold - 99 years
(07/01/2101)
Branch Premises
30,613 8 8,402 01/05/2011
52 No. 122, Kapit By-Pass 96807 Kapit, Sarawak
Leasehold - 60 years
(29/04/2045)
Branch Premises
1,200 25 149 30/04/1985
53 No. 12A, Block B Level 2, Fraser’s Hill Condominium 49000 Bukit Fraser’s Pahang Darul Makmur
Leasehold - 99 years
(23/05/2082)
1 unit apartment
1,792 31 114 24/05/1983
54 No. 9, Jalan Cheng Lock 50000 Kuala Lumpur Wilayah Persekutuan
Freehold Vacant 2,199 45 277 18/09/1972
55 No. 3, Jalan Bandar Satu Pusat Bandar Puchong 47100 Puchong Selangor Darul Ehsan
Freehold Branch Premises
4,687 23 1,758 03/04/1997
56 No. 32 & 34, Jalan 21/19 Sea Park 46300 Petaling Jaya Selangor Darul Ehsan
Freehold Branch Premises
3,080 55 2,124 19/08/1997
57 No. 1, Jalan Goh Hock Huat 41400 Klang Selangor Darul Ehsan
Freehold Vacant 2,776 35 1,475 09/07/1998
58 No. 26 & 27, Jalan Kenari 1 Bandar Puchong Jaya 47100 Puchong Selangor Darul Ehsan
Freehold Branch Premises
3,600 22 1,395 22/01/1999
59 No. 2, Jalan PJU 5/8 Dataran Sunway Kota Damansara 47810 Petaling Jaya Selangor Darul Ehsan
Leasehold - 99 years
(23/11/2100)
Branch Premises
12,892 14 3,373 12/02/2005
LISTOFpROpERTIESHELDASAT30JUNE2018(CONTINUED)
ADDITIONAL INFORMATION
335ANNUALREPORT
2018

OTHERINFORMATION
Location
Tenure
Descriptionofproperty
held
GrossArea
(Sq-ft)
Approx.Age
(Years)
Netbookvalue
(RM‘000)
Dateof
acquisition
60 No. J09-6 and J02-06 Paradise Lagoon Holiday Apartment Batu 3 1/2 Jalan Pantai 70100 Port Dickson Negeri Sembilan Darul Khusus
Leasehold - 99 years
(07/06/2087)
2 units apartment
2,088 22 189 21/04/1994
61 No. S-3, Kompleks Negeri Jalan Dr. Krishnan 70000 Seremban Negeri Sembilan Darul Khusus
Leasehold - 99 years
(30/01/2078)
Storage for branches
1,680 34 249 29/06/1981
62 No. 105 & 107 Jalan Melaka Raya 24 Taman Melaka Raya 75000 Melaka
Leasehold - 99 years
(20/03/2094)
Vacant 3,132 22 496 17/04/1998
63 No. 67 & 69, Jalan Merdeka 75000 Taman Merdeka Raya Melaka
Leasehold - 99 years
(07/07/2093)
Branch Premises
3,080 23 647 15/08/1999
64 No. 21 & 23, Jalan Indah 15/1 Bukit Indah, 81200 Johor Bahru Johor Darul Takzim
Freehold Branch Premises
5,090 16 1,378 27/05/2002
65 No. 35, 37 & 39 Jalan Johor Satu Taman Desa Cemerlang 81800 Ulu Tiram Johor Darul Takzim
Freehold Branch Premises
13,965 15 1,957 12/02/2003
66 No. 21, Jalan Permas 10/1 Bandar Baru Permas Jaya 81750 Masai Johor Darul Takzim
Freehold Branch Premises
2,624 21 974 05/04/1999
67 No. B-278 & B-280 Jalan Beserah 25300 Kuantan Pahang Darul Makmur
Freehold Branch Premises
3,208 17 1,387 04/08/1999
68 No. 31, 33, 35 & 37 Jalan Usahaniaga 1 Taman Niagajaya 14000 Bukit Mertajam Seberang Perai Tengah Pulau Pinang
Freehold Branch Premises
15,844 15 1,138 10/07/2003
LISTOFpROpERTIESHELDASAT30JUNE2018(CONTINUED)
336ANNUALREPORT2018
HONG LEONG BANK BERHAD
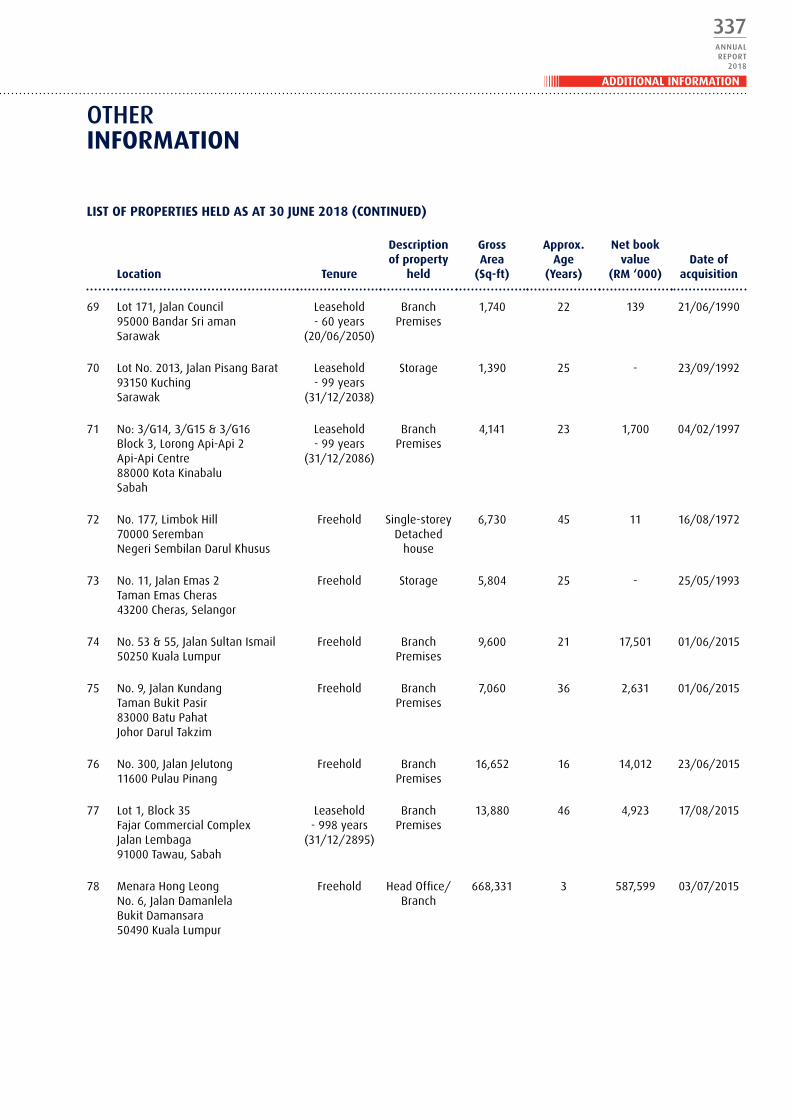
OTHERINFORMATION
Location
Tenure
Descriptionofproperty
held
GrossArea
(Sq-ft)
Approx.Age
(Years)
Netbookvalue
(RM‘000)
Dateof
acquisition
69 Lot 171, Jalan Council 95000 Bandar Sri aman Sarawak
Leasehold - 60 years
(20/06/2050)
Branch Premises
1,740 22 139 21/06/1990
70 Lot No. 2013, Jalan Pisang Barat 93150 Kuching Sarawak
Leasehold - 99 years
(31/12/2038)
Storage 1,390 25 - 23/09/1992
71 No: 3/G14, 3/G15 & 3/G16 Block 3, Lorong Api-Api 2 Api-Api Centre 88000 Kota Kinabalu Sabah
Leasehold - 99 years
(31/12/2086)
Branch Premises
4,141 23 1,700 04/02/1997
72 No. 177, Limbok Hill 70000 Seremban Negeri Sembilan Darul Khusus
Freehold Single-storey Detached
house
6,730 45 11 16/08/1972
73 No. 11, Jalan Emas 2 Taman Emas Cheras 43200 Cheras, Selangor
Freehold Storage 5,804 25 - 25/05/1993
74 No. 53 & 55, Jalan Sultan Ismail 50250 Kuala Lumpur
Freehold Branch Premises
9,600 21 17,501 01/06/2015
75 No. 9, Jalan Kundang Taman Bukit Pasir 83000 Batu Pahat Johor Darul Takzim
Freehold Branch Premises
7,060 36 2,631 01/06/2015
76 No. 300, Jalan Jelutong 11600 Pulau Pinang
Freehold Branch Premises
16,652 16 14,012 23/06/2015
77 Lot 1, Block 35 Fajar Commercial Complex Jalan Lembaga 91000 Tawau, Sabah
Leasehold - 998 years
(31/12/2895)
Branch Premises
13,880 46 4,923 17/08/2015
78 Menara Hong Leong No. 6, Jalan Damanlela Bukit Damansara 50490 Kuala Lumpur
Freehold Head Office/Branch
668,331 3 587,599 03/07/2015
LISTOFpROpERTIESHELDASAT30JUNE2018(CONTINUED)
ADDITIONAL INFORMATION
337ANNUALREPORT
2018
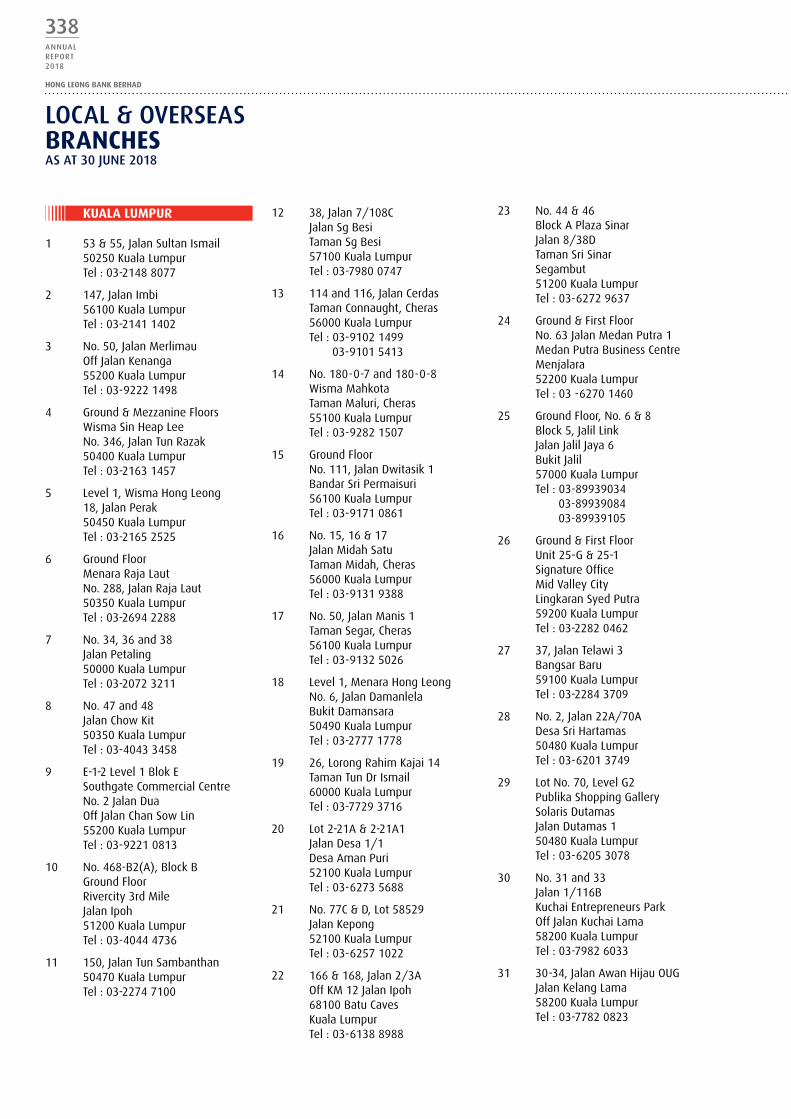
LOcAL & OvERsEAsbRANCHESAs AT 30 JUNE 2018
KUALALUMpUR
1 53 & 55, Jalan Sultan Ismail 50250 Kuala Lumpur Tel : 03-2148 8077
2 147, Jalan Imbi 56100 Kuala Lumpur Tel : 03-2141 1402
3 No. 50, Jalan Merlimau Off Jalan Kenanga 55200 Kuala Lumpur Tel : 03-9222 1498
4 Ground & Mezzanine Floors Wisma Sin Heap Lee No. 346, Jalan Tun Razak 50400 Kuala Lumpur Tel : 03-2163 1457
5 Level 1, Wisma Hong Leong 18, Jalan Perak 50450 Kuala Lumpur Tel : 03-2165 2525
6 Ground Floor Menara Raja Laut No. 288, Jalan Raja Laut 50350 Kuala Lumpur Tel : 03-2694 2288
7 No. 34, 36 and 38 Jalan Petaling 50000 Kuala Lumpur Tel : 03-2072 3211
8 No. 47 and 48 Jalan Chow Kit 50350 Kuala Lumpur Tel : 03-4043 3458
9 E-1-2 Level 1 Blok E Southgate Commercial Centre No. 2 Jalan Dua Off Jalan Chan Sow Lin 55200 Kuala Lumpur Tel : 03-9221 0813
10 No. 468-B2(A), Block B Ground Floor Rivercity 3rd Mile Jalan Ipoh 51200 Kuala Lumpur Tel : 03-4044 4736
11 150, Jalan Tun Sambanthan 50470 Kuala Lumpur Tel : 03-2274 7100
12 38, Jalan 7/108C Jalan Sg Besi Taman Sg Besi 57100 Kuala Lumpur Tel : 03-7980 0747
13 114 and 116, Jalan Cerdas Taman Connaught, Cheras 56000 Kuala Lumpur Tel : 03-9102 1499 03-9101 5413
14 No. 180-0-7 and 180-0-8 Wisma Mahkota Taman Maluri, Cheras 55100 Kuala Lumpur Tel : 03-9282 1507
15 Ground Floor No. 111, Jalan Dwitasik 1 Bandar Sri Permaisuri 56100 Kuala Lumpur Tel : 03-9171 0861
16 No. 15, 16 & 17 Jalan Midah Satu Taman Midah, Cheras 56000 Kuala Lumpur Tel : 03-9131 9388
17 No. 50, Jalan Manis 1 Taman Segar, Cheras 56100 Kuala Lumpur Tel : 03-9132 5026
18 Level 1, Menara Hong Leong No. 6, Jalan Damanlela Bukit Damansara 50490 Kuala Lumpur Tel : 03-2777 1778
19 26, Lorong Rahim Kajai 14 Taman Tun Dr Ismail 60000 Kuala Lumpur Tel : 03-7729 3716
20 Lot 2-21A & 2-21A1 Jalan Desa 1/1 Desa Aman Puri 52100 Kuala Lumpur Tel : 03-6273 5688
21 No. 77C & D, Lot 58529 Jalan Kepong 52100 Kuala Lumpur Tel : 03-6257 1022
22 166 & 168, Jalan 2/3A Off KM 12 Jalan Ipoh 68100 Batu Caves Kuala Lumpur Tel : 03-6138 8988
23 No. 44 & 46 Block A Plaza Sinar Jalan 8/38D Taman Sri Sinar Segambut 51200 Kuala Lumpur Tel : 03-6272 9637
24 Ground & First Floor No. 63 Jalan Medan Putra 1 Medan Putra Business Centre Menjalara 52200 Kuala Lumpur Tel : 03 -6270 1460
25 Ground Floor, No. 6 & 8 Block 5, Jalil Link Jalan Jalil Jaya 6 Bukit Jalil 57000 Kuala Lumpur Tel : 03-89939034 03-89939084 03-89939105
26 Ground & First Floor Unit 25-G & 25-1 Signature Office Mid Valley City Lingkaran Syed Putra 59200 Kuala Lumpur Tel : 03-2282 0462
27 37, Jalan Telawi 3 Bangsar Baru 59100 Kuala Lumpur Tel : 03-2284 3709
28 No. 2, Jalan 22A/70A Desa Sri Hartamas 50480 Kuala Lumpur Tel : 03-6201 3749
29 Lot No. 70, Level G2 Publika Shopping Gallery Solaris Dutamas Jalan Dutamas 1 50480 Kuala Lumpur Tel : 03-6205 3078
30 No. 31 and 33 Jalan 1/116B Kuchai Entrepreneurs Park Off Jalan Kuchai Lama 58200 Kuala Lumpur Tel : 03-7982 6033
31 30-34, Jalan Awan Hijau OUG Jalan Kelang Lama 58200 Kuala Lumpur Tel : 03-7782 0823
338ANNUALREPORT2018
HONG LEONG BANK BERHAD
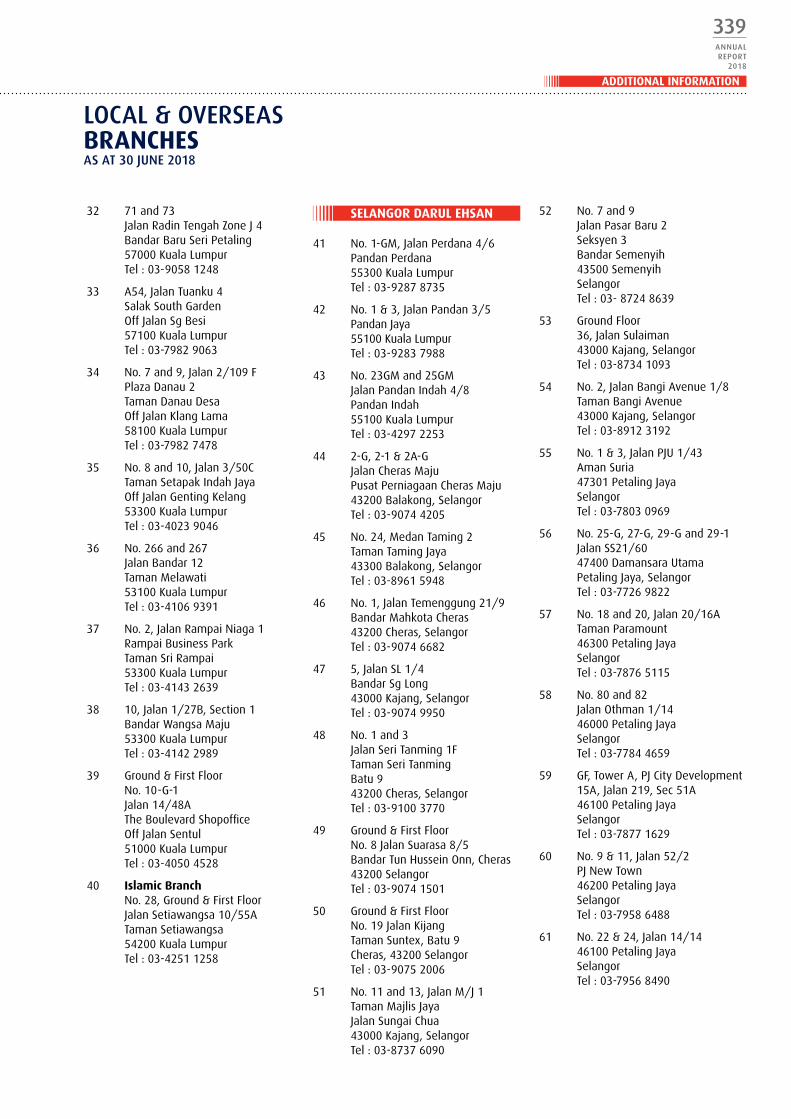
LOcAL & OvERsEAsbRANCHESAs AT 30 JUNE 2018
32 71 and 73 Jalan Radin Tengah Zone J 4 Bandar Baru Seri Petaling 57000 Kuala Lumpur Tel : 03-9058 1248
33 A54, Jalan Tuanku 4 Salak South Garden Off Jalan Sg Besi 57100 Kuala Lumpur Tel : 03-7982 9063
34 No. 7 and 9, Jalan 2/109 F Plaza Danau 2 Taman Danau Desa Off Jalan Klang Lama 58100 Kuala Lumpur Tel : 03-7982 7478
35 No. 8 and 10, Jalan 3/50C Taman Setapak Indah Jaya Off Jalan Genting Kelang 53300 Kuala Lumpur Tel : 03-4023 9046
36 No. 266 and 267 Jalan Bandar 12 Taman Melawati 53100 Kuala Lumpur Tel : 03-4106 9391
37 No. 2, Jalan Rampai Niaga 1 Rampai Business Park Taman Sri Rampai 53300 Kuala Lumpur Tel : 03-4143 2639
38 10, Jalan 1/27B, Section 1 Bandar Wangsa Maju 53300 Kuala Lumpur Tel : 03-4142 2989
39 Ground & First Floor No. 10-G-1 Jalan 14/48A The Boulevard Shopoffice Off Jalan Sentul 51000 Kuala Lumpur Tel : 03-4050 4528
40 Islamicbranch No. 28, Ground & First Floor Jalan Setiawangsa 10/55A Taman Setiawangsa 54200 Kuala Lumpur Tel : 03-4251 1258
52 No. 7 and 9 Jalan Pasar Baru 2 Seksyen 3 Bandar Semenyih 43500 Semenyih Selangor Tel : 03- 8724 8639
53 Ground Floor 36, Jalan Sulaiman 43000 Kajang, Selangor Tel : 03-8734 1093
54 No. 2, Jalan Bangi Avenue 1/8 Taman Bangi Avenue 43000 Kajang, Selangor Tel : 03-8912 3192
55 No. 1 & 3, Jalan PJU 1/43 Aman Suria 47301 Petaling Jaya Selangor Tel : 03-7803 0969
56 No. 25-G, 27-G, 29-G and 29-1 Jalan SS21/60 47400 Damansara Utama Petaling Jaya, Selangor Tel : 03-7726 9822
57 No. 18 and 20, Jalan 20/16A Taman Paramount 46300 Petaling Jaya Selangor Tel : 03-7876 5115
58 No. 80 and 82 Jalan Othman 1/14 46000 Petaling Jaya Selangor Tel : 03-7784 4659
59 GF, Tower A, PJ City Development 15A, Jalan 219, Sec 51A 46100 Petaling Jaya Selangor Tel : 03-7877 1629
60 No. 9 & 11, Jalan 52/2 PJ New Town 46200 Petaling Jaya Selangor Tel : 03-7958 6488
61 No. 22 & 24, Jalan 14/14 46100 Petaling Jaya Selangor Tel : 03-7956 8490
SELANGORDARULEHSAN
41 No. 1-GM, Jalan Perdana 4/6 Pandan Perdana 55300 Kuala Lumpur Tel : 03-9287 8735
42 No. 1 & 3, Jalan Pandan 3/5 Pandan Jaya 55100 Kuala Lumpur Tel : 03-9283 7988
43 No. 23GM and 25GM Jalan Pandan Indah 4/8 Pandan Indah 55100 Kuala Lumpur Tel : 03-4297 2253
44 2-G, 2-1 & 2A-G Jalan Cheras Maju Pusat Perniagaan Cheras Maju 43200 Balakong, Selangor Tel : 03-9074 4205
45 No. 24, Medan Taming 2 Taman Taming Jaya 43300 Balakong, Selangor Tel : 03-8961 5948
46 No. 1, Jalan Temenggung 21/9 Bandar Mahkota Cheras 43200 Cheras, Selangor Tel : 03-9074 6682
47 5, Jalan SL 1/4 Bandar Sg Long 43000 Kajang, Selangor Tel : 03-9074 9950
48 No. 1 and 3 Jalan Seri Tanming 1F Taman Seri Tanming Batu 9 43200 Cheras, Selangor Tel : 03-9100 3770
49 Ground & First Floor No. 8 Jalan Suarasa 8/5 Bandar Tun Hussein Onn, Cheras 43200 Selangor Tel : 03-9074 1501
50 Ground & First Floor No. 19 Jalan Kijang Taman Suntex, Batu 9 Cheras, 43200 Selangor Tel : 03-9075 2006
51 No. 11 and 13, Jalan M/J 1 Taman Majlis Jaya Jalan Sungai Chua 43000 Kajang, Selangor Tel : 03-8737 6090
ADDITIONAL INFORMATION
339ANNUALREPORT
2018

62 No. 28 & 30, Jalan SS2/67 47300 Petaling Jaya Selangor Tel : 03-7877 6800
63 2, Jalan PJU 5/8 Dataran Sunway Kota Damansara 47810 Petaling Jaya Selangor Tel : 03-6141 3886
64 Lot G-18 and G-19 Perdana The Place Damansara Perdana 47820 Petaling Jaya Selangor Tel : 03-7724 1357
65 A-G-08, A-1-08, A-2-08, A-G-09, A-1-09, A-2-09 Glomac Square Jalan SS6/54, Dataran Glomac Pusat Bandar Kelana Jaya 47301 Petaling Jaya Selangor Tel : 03-7804 0221
66 12 and 14, Jalan PJS 11/28A Metro Bandar Sunway Bandar Sunway 46150 Petaling Jaya Selangor Tel : 03-5637 5396
67 No. 68 Lorong Batu Nilam 4A Bandar Bukit Tinggi 41200 Klang, Selangor Tel : 03-3324 9490
68 No. 119 and 121 Jalan Sultan Abdul Samad 42700 Banting, Selangor Tel : 03-3187 6758
69 26-32, Jalan Kapar 41400 Klang, Selangor Tel : 03-3343 1188
70 Wisma Meru 1 Lintang Pekan Baru Off Jalan Meru 41050 Klang, Selangor Tel : 03-3343 7677
71 90, Persiaran Raja Muda Musa 42000 Pelabuhan Klang Selangor Tel : 03-3166 1188
72 No. 216 & 218 Persiaran Pegaga Taman Bayu Perdana 41200 Klang, Selangor Tel : 03-3324 3303
73 No. 1 and 3 Jalan Sri Sarawak 17 Taman Sri Andalas 41200 Klang, Selangor Tel : 03-3324 2545
74 169, Jalan Teluk Pulai 41100 Klang, Selangor Tel : 03-3372 1000
75 No. 36 Jalan Dato Shahbudin 30 Taman Sentosa 41200 Klang, Selangor Tel : 03-5161 1753
76 No. 174 and 174A Jalan Besar 42800 Tanjung Sepat Kuala Langat, Selangor Tel : 03-3197 2149
77 Ground Floor No. 109 & 111 Jalan Mahogani 5 Bandar Botanic 41200 Klang, Selangor Tel : 03-3323 0526
78 Ground & First Floor Lot 529, Jalan Besar Kapar KU13, 42200 Klang Selangor Tel : 03-3250 1784
79 No. 15 and 16 Jalan Menteri Besar 2 New Sekinchan Business Centre 45400 Sekinchan, Selangor Tel : 03-3241 6351
80 No. 64 Jalan Stesen 45000 Kuala Selangor Selangor Tel : 03-3289 5958
81 No. 64 Jalan BRP 1/2 Bukit Rahman Putra 47000 Sungai Buloh Selangor Tel : 03-61560195
82 51 & 53, Jalan TSB 10A Taman Industri Sg Buloh 47000 Sg Buloh Selangor Tel : 03-6157 5811
83 19, Jalan 54 Desa Jaya 52100 Kepong, Selangor Tel : 03-6276 3701
84 No. 23 and 24 Jalan KIP 1 Taman Perindustrian KIP 52200 Selangor Tel : 03-6277 6310
85 59A, Jalan Welman 48000 Rawang, Selangor Tel : 03-6091 0460
86 No. 2 Jalan Public Kampung Baru Sungai Buloh 40160 Shah Alam Selangor Tel : 03-6156 9385
87 No. 39 and 41 Jalan SJ 17 Taman Selayang Jaya 68100 Batu Caves Selangor Tel : 03-6120 6803
88 No. 5 & 7, Jalan Cempaka 1 Taman Cempaka 48200 Serendah Hulu Selangor, Selangor Tel : 03-6081 3182
89 No. G-16, 1-16, 2-16, G-17, 1-17 & 2-17 Jalan Prima SG1 Taman Prima Sri Gombak 68100 Batu Caves Selangor Tel : 03-6184 2492
90 Wisma Keringat 2 No. 17, Lorong Batu Caves 2 68100 Batu Caves Selangor Tel : 03-6187 7464
91 29-1, Jalan SP 2/1 Seksyen 2 Taman Serdang Perdana 43300 Seri Kembangan Selangor Tel : 03-8943 0795
92 No. 5 & 7 Jalan Besar Susur 1 43300 Seri Kembangan Selangor Tel : 03-8948 3162
LOcAL & OvERsEAsbRANCHESAs AT 30 JUNE 2018
340ANNUALREPORT2018
HONG LEONG BANK BERHAD

93 Ground Floor No. 4G & 6G Jalan Equine 1B Taman Equine Boulevard 43300 Seri Kembangan Selangor Tel : 03-8938 1400
94 No. 21 Jalan BS10/6 Seksyen 10, Bukit Serdang 43300 Seri Kembangan Selangor Tel : 03-8945 5688
95 3, Jalan Bandar Satu Pusat Bandar Puchong 47100 Puchong, Selangor Tel : 03-5882 4388
96 No. 2 Jalan Puteri 2/4 Bandar Puteri 47100 Puchong, Selangor Tel : 03-8063 6839
97 2, Jalan Kinrara Taman Kinrara Jalan Puchong 47100 Selangor Tel : 03-8075 1486
98 No. 26 & 27, Jalan Kenari 1 Bandar Puchong Jaya 47100 Puchong, Selangor Tel : 03-5882 7100
99 No. E-01-07 and E-01-08 Jalan Puchong Prima 5/3 Puchong Prima 47100 Puchong, Selangor Tel : 03-8060 7409
100 No. 120 Jalan PUJ 3/2 Taman Puncak Jalil Bandar Putra Permai 43300 Seri Kembangan Selangor Tel : 03-8938 1190
101 Lot 43 & 45 Jalan USJ 10/1G 47620 UEP Subang Jaya Selangor Tel : 03-5637 1984
102 W-1-0, W-2-0 and W-1-1 Subang Square Business Centre Jalan SS15/4G 47500 Subang Jaya Selangor Tel : 03–5632 9034 03-5632 9068
103 No. 16, Jalan SS19/6 47500 Subang Jaya Selangor Tel : 03-5631 1818
104 Ground Floor, Lot G01 Giant Hypermarket Putra Heights Persiaran Putra Perdana 47560 Putra Heights Selangor Tel : 03-5101 9007
105 No. 3-G, Jalan Anggerik Vanilla N31/N, Kota Kemuning 40460 Shah Alam Selangor Tel : 03-5122 5912
106 3, Jalan Takal 15/21 Seksyen 15 40000 Shah Alam Selangor Tel : 03-5510 9021 03-5510 9023
107 34, Jalan Perbahan Satu Section 26/2A 40000 Shah Alam Selangor Tel : 03-5191 8888
108 19, Jalan Setia Prima RU 13/R Setia Alam 40170 Shah Alam Selangor Tel : 03-3344 6888
109 1G-3G, Jalan Wawasan 2/10 Bandar Baru Ampang 68000 Ampang Selangor Tel : 03-4291 0437
110 No. 91, Lorong Mamanda 1 Ampang Point 68000 Ampang Selangor Tel : 03-4253 2449
111 No. 7 and 9 Jalan Bunga Tanjong 6A Taman Putra 68000 Ampang Selangor Tel : 03-4293 9988
112 Ground Floor No. 8 Jalan UP 1/5 Taman Ukay Perdana 68000 Ampang Selangor Tel : 03-4101 2143
113 Islamicbranch 26, Jalan Tengku Ampuan Zabedah D9/D, Section 9 40100 Shah Alam Selangor Tel : 03-5880 8047
114 Islamicbranch Lot G13A (Ground Floor) D’Pulze Shopping Centre P-01, D’Pulze Lingkaran Cyber Point Timur Cyberjaya 12, Cyberjaya 63000 Selangor Tel : 03-8318 0473
pAHANGDARULMAKMUR
115 No. 1 Bentong Heights 28700 Bentong Pahang Tel : 09-222 1080
116 21 Jalan Tun Razak 27600 Raub Pahang Tel : 09-355 4422
117 No. 113, Jalan Inderapura 1 Bandar Inderapura 27000 Jerantut Pahang Tel : 09-266 3184
118 No. B278 & B280 Jalan Beserah 25300 Kuantan Pahang Tel : 09-566 4100
119 25, Jalan Tun Ismail 25000 Kuantan Pahang Tel : 09-515 7158
120 59 and 60, Jalan Temerloh Locked Bag No. 9 28409 Mentakab Pahang Tel : 09-277 2954
121 F107, Jalan Kuantan 28000 Temerloh Pahang Tel : 09-296 7492
122 No. 36, Main Road Tanah Rata 39000 Cameron Highlands Pahang Tel : 05-491 1941
LOcAL & OvERsEAsbRANCHESAs AT 30 JUNE 2018
ADDITIONAL INFORMATION
341ANNUALREPORT
2018
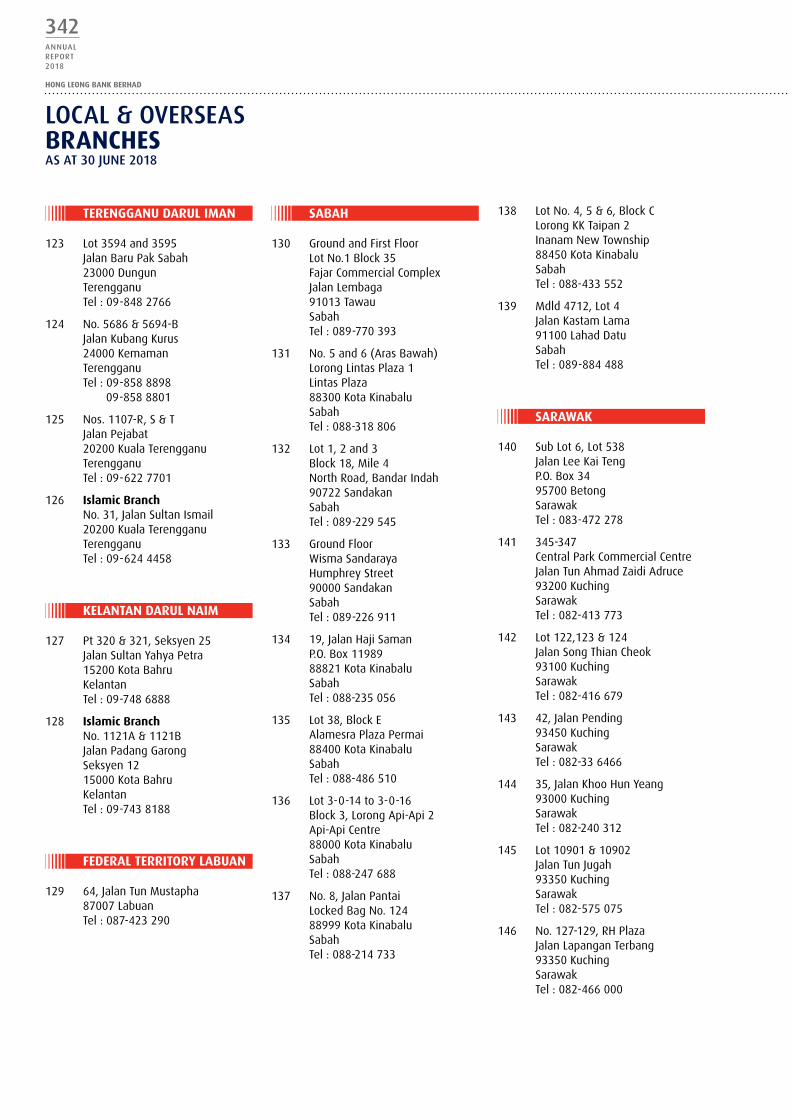
TERENGGANUDARULIMAN
123 Lot 3594 and 3595 Jalan Baru Pak Sabah 23000 Dungun Terengganu Tel : 09-848 2766
124 No. 5686 & 5694-B Jalan Kubang Kurus 24000 Kemaman Terengganu Tel : 09-858 8898 09-858 8801
125 Nos. 1107-R, S & T Jalan Pejabat 20200 Kuala Terengganu Terengganu Tel : 09-622 7701
126 Islamicbranch No. 31, Jalan Sultan Ismail 20200 Kuala Terengganu Terengganu Tel : 09-624 4458
KELANTANDARULNAIM
127 Pt 320 & 321, Seksyen 25 Jalan Sultan Yahya Petra 15200 Kota Bahru Kelantan Tel : 09-748 6888
128 Islamicbranch No. 1121A & 1121B Jalan Padang Garong Seksyen 12 15000 Kota Bahru Kelantan Tel : 09-743 8188
FEDERALTERRITORYLAbUAN
129 64, Jalan Tun Mustapha 87007 Labuan Tel : 087-423 290
SAbAH
130 Ground and First Floor Lot No.1 Block 35 Fajar Commercial Complex Jalan Lembaga 91013 Tawau Sabah Tel : 089-770 393
131 No. 5 and 6 (Aras Bawah) Lorong Lintas Plaza 1 Lintas Plaza 88300 Kota Kinabalu Sabah Tel : 088-318 806
132 Lot 1, 2 and 3 Block 18, Mile 4 North Road, Bandar Indah 90722 Sandakan Sabah Tel : 089-229 545
133 Ground Floor Wisma Sandaraya Humphrey Street 90000 Sandakan Sabah Tel : 089-226 911
134 19, Jalan Haji Saman P.O. Box 11989 88821 Kota Kinabalu Sabah Tel : 088-235 056
135 Lot 38, Block E Alamesra Plaza Permai 88400 Kota Kinabalu Sabah Tel : 088-486 510
136 Lot 3-0-14 to 3-0-16 Block 3, Lorong Api-Api 2 Api-Api Centre 88000 Kota Kinabalu Sabah Tel : 088-247 688
137 No. 8, Jalan Pantai Locked Bag No. 124 88999 Kota Kinabalu Sabah Tel : 088-214 733
138 Lot No. 4, 5 & 6, Block C Lorong KK Taipan 2 Inanam New Township 88450 Kota Kinabalu Sabah Tel : 088-433 552
139 Mdld 4712, Lot 4 Jalan Kastam Lama 91100 Lahad Datu Sabah Tel : 089-884 488
SARAwAK
140 Sub Lot 6, Lot 538 Jalan Lee Kai Teng P.O. Box 34 95700 Betong Sarawak Tel : 083-472 278
141 345-347 Central Park Commercial Centre Jalan Tun Ahmad Zaidi Adruce 93200 Kuching Sarawak Tel : 082-413 773
142 Lot 122,123 & 124 Jalan Song Thian Cheok 93100 Kuching Sarawak Tel : 082-416 679
143 42, Jalan Pending 93450 Kuching Sarawak Tel : 082-33 6466
144 35, Jalan Khoo Hun Yeang 93000 Kuching Sarawak Tel : 082-240 312
145 Lot 10901 & 10902 Jalan Tun Jugah 93350 Kuching Sarawak Tel : 082-575 075
146 No. 127-129, RH Plaza Jalan Lapangan Terbang 93350 Kuching Sarawak Tel : 082-466 000
LOcAL & OvERsEAsbRANCHESAs AT 30 JUNE 2018
342ANNUALREPORT2018
HONG LEONG BANK BERHAD
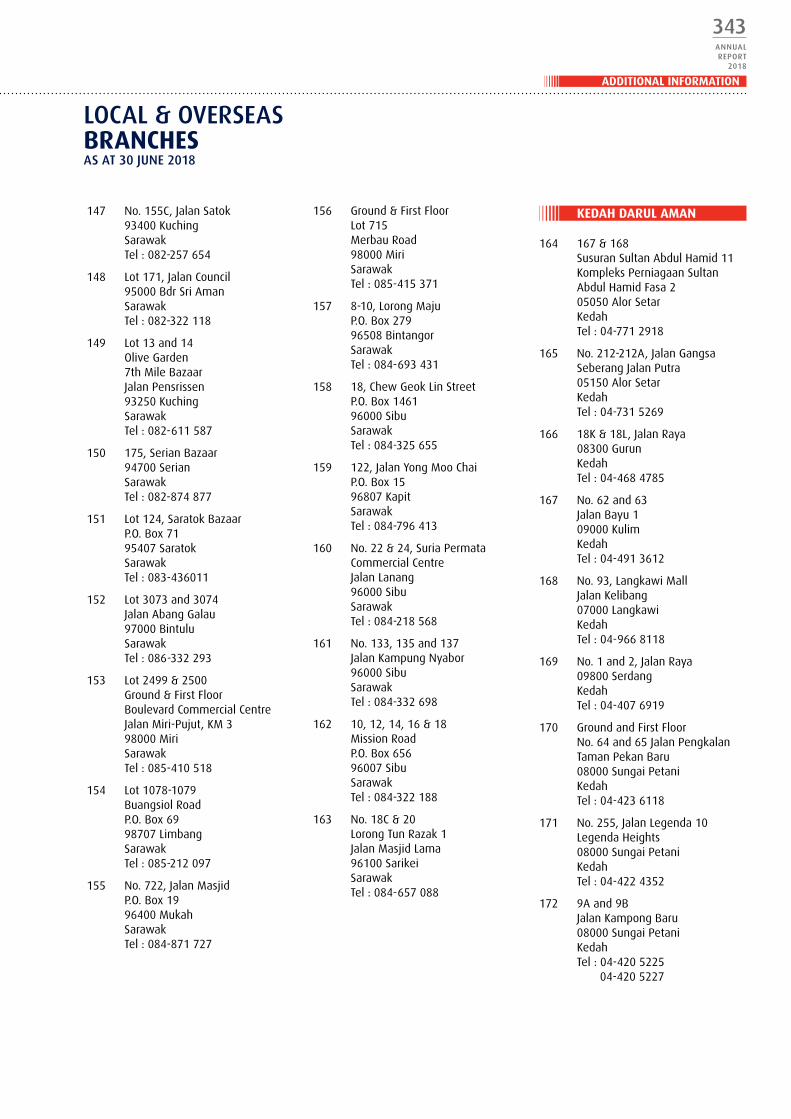
147 No. 155C, Jalan Satok 93400 Kuching Sarawak Tel : 082-257 654
148 Lot 171, Jalan Council 95000 Bdr Sri Aman Sarawak Tel : 082-322 118
149 Lot 13 and 14 Olive Garden 7th Mile Bazaar Jalan Pensrissen 93250 Kuching Sarawak Tel : 082-611 587
150 175, Serian Bazaar 94700 Serian Sarawak Tel : 082-874 877
151 Lot 124, Saratok Bazaar P.O. Box 71 95407 Saratok Sarawak Tel : 083-436011
152 Lot 3073 and 3074 Jalan Abang Galau 97000 Bintulu Sarawak Tel : 086-332 293
153 Lot 2499 & 2500 Ground & First Floor Boulevard Commercial Centre Jalan Miri-Pujut, KM 3 98000 Miri Sarawak Tel : 085-410 518
154 Lot 1078-1079 Buangsiol Road P.O. Box 69 98707 Limbang Sarawak Tel : 085-212 097
155 No. 722, Jalan Masjid P.O. Box 19 96400 Mukah Sarawak Tel : 084-871 727
156 Ground & First Floor Lot 715 Merbau Road 98000 Miri Sarawak Tel : 085-415 371
157 8-10, Lorong Maju P.O. Box 279 96508 Bintangor Sarawak Tel : 084-693 431
158 18, Chew Geok Lin Street P.O. Box 1461 96000 Sibu Sarawak Tel : 084-325 655
159 122, Jalan Yong Moo Chai P.O. Box 15 96807 Kapit Sarawak Tel : 084-796 413
160 No. 22 & 24, Suria Permata Commercial Centre Jalan Lanang 96000 Sibu Sarawak Tel : 084-218 568
161 No. 133, 135 and 137 Jalan Kampung Nyabor 96000 Sibu Sarawak Tel : 084-332 698
162 10, 12, 14, 16 & 18 Mission Road P.O. Box 656 96007 Sibu Sarawak Tel : 084-322 188
163 No. 18C & 20 Lorong Tun Razak 1 Jalan Masjid Lama 96100 Sarikei Sarawak Tel : 084-657 088
KEDAHDARULAMAN
164 167 & 168 Susuran Sultan Abdul Hamid 11 Kompleks Perniagaan Sultan Abdul Hamid Fasa 2 05050 Alor Setar Kedah Tel : 04-771 2918
165 No. 212-212A, Jalan Gangsa Seberang Jalan Putra 05150 Alor Setar Kedah Tel : 04-731 5269
166 18K & 18L, Jalan Raya 08300 Gurun Kedah Tel : 04-468 4785
167 No. 62 and 63 Jalan Bayu 1 09000 Kulim Kedah Tel : 04-491 3612
168 No. 93, Langkawi Mall Jalan Kelibang 07000 Langkawi Kedah Tel : 04-966 8118
169 No. 1 and 2, Jalan Raya 09800 Serdang Kedah Tel : 04-407 6919
170 Ground and First Floor No. 64 and 65 Jalan Pengkalan Taman Pekan Baru 08000 Sungai Petani Kedah Tel : 04-423 6118
171 No. 255, Jalan Legenda 10 Legenda Heights 08000 Sungai Petani Kedah Tel : 04-422 4352
172 9A and 9B Jalan Kampong Baru 08000 Sungai Petani Kedah Tel : 04-420 5225 04-420 5227
LOcAL & OvERsEAsbRANCHESAs AT 30 JUNE 2018
ADDITIONAL INFORMATION
343ANNUALREPORT
2018

173 Ground Floor Lot 1520-2A Pantai Halban 06000 Jitra Kedah Tel : 04-919 0278
174 Islamicbranch172, Susuran Sultan Abdul Hamid 10 Komplex Perniagaan Sultan Abd Hamid PH 2 05050 Alor Setar Kedah Tel : 04-771 3228
pULAUpINANG
175 19 Jalan Bertam 13200 Kepala Batas Seberang Prai Pulau Pinang Tel : 04-575 4900
176 No. 421 & 423 Jalan Burmah 10350 Pulau Pinang Tel : 04-228 3202
177 15-G-1 (Bayan Point) Medan Kampong Relau 11900 Pulau Pinang Tel : 04-642 8643
178 No. 300, Jalan Jelutong 11600 Pulau Pinang Tel : 04-282 6688
179 45 Jalan Burma 10050 Pulau Pinang Tel : 04-210 3508
180 98-G-15 Prima Tanjong Jalan Fettes 10470 Tanjong Tokong Pulau Pinang Tel : 04-890 4188
181 No. 1, Light Street Georgetown 10200 Pulau Pinang Tel : 04-261 5154
182 No. 405 Jalan Burmah 10350 Pulau Pinang Tel : 04-228 8475
183 No. 723-G-G, 723-H-G and 723-I-G Jalan Sungai Dua 11700 Pulau Pinang Tel : 04-658 6699 04-656 7614
184 Lot G17 & G18 Penang Times Square Jalan Dato Keramat 10150 Pulau Pinang Tel : 04-226 4177
185 306-F Jalan Dato Ismail Hashim 11900 Bayan Lepas Pulau Pinang Tel : 04-646 2331
186 No. 16A & 16B Lebuhraya Thean Teik Bandar Baru Ayer Itam 11500 Pulau Pinang Tel : 04-827 1688
187 Ground & First Floor No. 82 Jalan Besar Balik Pulau 11000 Pulau Pinang Tel : 04-866 5188
188 2828-G-02 and 2828-1-02 Jalan Bagan Luar 12000 Butterworth Pulau Pinang Tel : 04-3315659 04-3315660 04-3315661
189 No. 7 & 9, Tingkat Kikik 7 Taman Inderawasih 13600 Prai Pulau Pinang Tel : 04-399 3134
190 No. 1, Lebuh Kurau 1 Taman Chai Leng 13700 Prai Pulau Pinang Tel : 04-397 8018
191 No. 9 and 10 Jalan Todak 2 Pusat Bandar Seberang Jaya 13700 Prai Pulau Pinang Tel : 04-397 2097
192 No. 26, 28 & 30 Lorong Murni 1 Taman Desa Murni Sg. Dua 13800 Butterworth Pulau Pinang Tel : 04-356 2688
193 No.3350 & 3351 Jalan Rozhan Taman Industri Alma Jaya 14000 Bukit Mertajam Pulau Pinang Tel : 04-552 2188
194 No. 31, 33, 35 Jalan Usahaniaga 1 Taman Niagajaya 14000 Bukit Mertajam Pulau Pinang Tel : 04-538 1549
195 No. 6963 and 6964 Jalan Ong Yi How Kawasan Perindustrian Raja Uda 13400 Butterworth Pulau Pinang Tel : 04-331 2277
196 No. 1781 Jalan Nibong Tebal Taman Panchor Indah 14300 Nibong Tebal Pulau Pinang Tel : 04-594 2889
197 No. 1, Jalan Besar Taman Tempua 14000 Simpang Ampat Pulau Pinang Tel : 04-588 8208
198 1435 & 1436, Jalan Besar 14200 Sg Bakap Seberang Prai Selatan Pulau Pinang Tel : 04-582 1134
199 No. 1823-G1 Jalan Perusahaan Auto City North-South Highway Juru Interchange 13600 Prai Pulau Pinang Tel : 04-502 1488
200 Ground & First Floor No. 1 Medan Limau Emas Pusat Perniagaan Limau Emas Off Jalan Song Ban Keng 14000 Bukit Mertajam Pulau Pinang Tel : 04-502 2352
LOcAL & OvERsEAsbRANCHESAs AT 30 JUNE 2018
344ANNUALREPORT2018
HONG LEONG BANK BERHAD
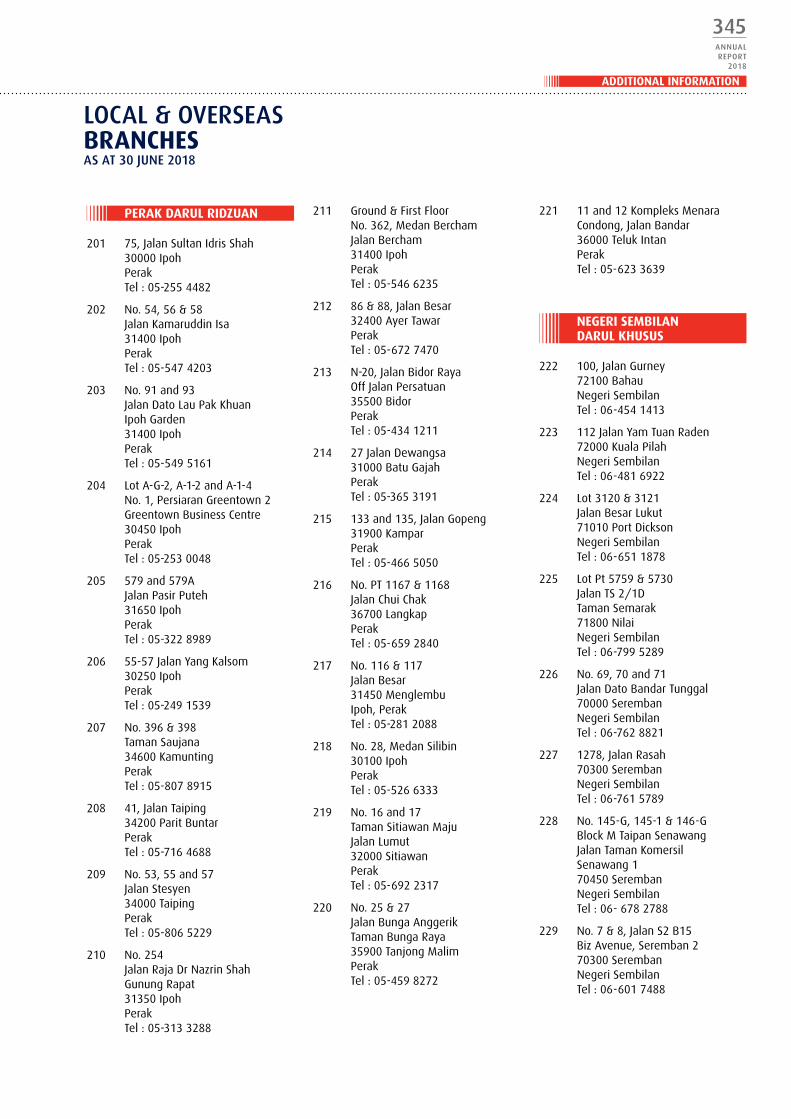
pERAKDARULRIDzUAN
201 75, Jalan Sultan Idris Shah 30000 Ipoh Perak Tel : 05-255 4482
202 No. 54, 56 & 58 Jalan Kamaruddin Isa 31400 Ipoh Perak Tel : 05-547 4203
203 No. 91 and 93 Jalan Dato Lau Pak Khuan Ipoh Garden 31400 Ipoh Perak Tel : 05-549 5161
204 Lot A-G-2, A-1-2 and A-1-4 No. 1, Persiaran Greentown 2 Greentown Business Centre 30450 Ipoh Perak Tel : 05-253 0048
205 579 and 579A Jalan Pasir Puteh 31650 Ipoh Perak Tel : 05-322 8989
206 55-57 Jalan Yang Kalsom 30250 Ipoh Perak Tel : 05-249 1539
207 No. 396 & 398 Taman Saujana 34600 Kamunting Perak Tel : 05-807 8915
208 41, Jalan Taiping 34200 Parit Buntar Perak Tel : 05-716 4688
209 No. 53, 55 and 57 Jalan Stesyen 34000 Taiping Perak Tel : 05-806 5229
210 No. 254 Jalan Raja Dr Nazrin Shah Gunung Rapat 31350 Ipoh Perak Tel : 05-313 3288
211 Ground & First Floor No. 362, Medan Bercham Jalan Bercham 31400 Ipoh Perak Tel : 05-546 6235
212 86 & 88, Jalan Besar 32400 Ayer Tawar Perak Tel : 05-672 7470
213 N-20, Jalan Bidor Raya Off Jalan Persatuan 35500 Bidor Perak Tel : 05-434 1211
214 27 Jalan Dewangsa 31000 Batu Gajah Perak Tel : 05-365 3191
215 133 and 135, Jalan Gopeng 31900 Kampar Perak Tel : 05-466 5050
216 No. PT 1167 & 1168 Jalan Chui Chak 36700 Langkap Perak Tel : 05-659 2840
217 No. 116 & 117 Jalan Besar 31450 Menglembu Ipoh, Perak Tel : 05-281 2088
218 No. 28, Medan Silibin 30100 Ipoh Perak Tel : 05-526 6333
219 No. 16 and 17 Taman Sitiawan Maju Jalan Lumut 32000 Sitiawan Perak Tel : 05-692 2317
220 No. 25 & 27 Jalan Bunga Anggerik Taman Bunga Raya 35900 Tanjong Malim Perak Tel : 05-459 8272
221 11 and 12 Kompleks Menara Condong, Jalan Bandar 36000 Teluk Intan Perak Tel : 05-623 3639
NEGERISEMbILANDARULKHUSUS
222 100, Jalan Gurney 72100 Bahau Negeri Sembilan Tel : 06-454 1413
223 112 Jalan Yam Tuan Raden 72000 Kuala Pilah Negeri Sembilan Tel : 06-481 6922
224 Lot 3120 & 3121 Jalan Besar Lukut 71010 Port Dickson Negeri Sembilan Tel : 06-651 1878
225 Lot Pt 5759 & 5730 Jalan TS 2/1D Taman Semarak 71800 Nilai Negeri Sembilan Tel : 06-799 5289
226 No. 69, 70 and 71 Jalan Dato Bandar Tunggal 70000 Seremban Negeri Sembilan Tel : 06-762 8821
227 1278, Jalan Rasah 70300 Seremban Negeri Sembilan Tel : 06-761 5789
228 No. 145-G, 145-1 & 146-G Block M Taipan Senawang Jalan Taman Komersil Senawang 1 70450 Seremban Negeri Sembilan Tel : 06- 678 2788
229 No. 7 & 8, Jalan S2 B15 Biz Avenue, Seremban 2 70300 Seremban Negeri Sembilan Tel : 06-601 7488
LOcAL & OvERsEAsbRANCHESAs AT 30 JUNE 2018
ADDITIONAL INFORMATION
345ANNUALREPORT
2018

MELAKA
230 Lot 215 & 130, Jalan Besar 78300 Masjid Tanah Melaka Tel : 06-384 7137
231 345, Jalan Ong Kim Wee 75300 Melaka Tel : 06-284 2311
232 No. 67 & 69, Jalan Merdeka Taman Melaka Raya 75000 Melaka Tel : 06-281 2688
233 150 and 152 Kompleks Munshi Abdullah Jalan Munshi Abdullah 75100 Melaka Tel : 06-286 5988
234 Lot BB-371A & B Taman Melaka Baru Batu Berendam 75350 Melaka Tel : 06-317 3235
235 No. 1, 1-1 & 3 Jalan Malim Jaya 2/7A Taman Malim Permai 75250 Melaka Tel : 06-336 3188
236 No. 76 Jalan Inang 4 Taman Paya Rumput Utama 76300 Paya Rumput Melaka Tel : 06-334 2266
JOHORDARULTAKzIM
237 9, Jalan Kundang Taman Bukit Pasir 83000 Batu Pahat Johor Tel : 07-433 7488
238 Ground Floor Penggaram Complex No. 1 Jalan Abdul Rahman Off Jalan Rahmat 83000 Batu Pahat Johor Tel : 07-431 4436
239 120 and 122 Jalan Mersing 86000 Kluang Johor Tel : 07-773 2234
240 No. 70, Jalan Segamat 85300 Labis Johor Tel : 07-925 1200
241 No. 3, Pusat Dagangan Bakri Jalan Bakri 84000 Muar Johor Tel : 06-954 2888
242 No. 43A & 45 Jalan Genuang Kampung Kampung Abdullah 85000 Segamat Johor Tel : 07-931 3650
243 No. LC531, Jalan Payamas 84900 Tangkak Johor Tel : 06-978 1994
244 108, 109 & 110, Main Road 83700 Yong Peng Johor Tel : 07-467 2350
245 No. 345A, Jalan Ismail 86800 Mersing Johor Tel : 07-799 6018
246 No. 6 and 7 Jalan Anggerik 1 Taman Kulai Utama 81000 Kulai Johor Tel : 07-663 2373 07-663 5282 07-663 6282
247 No. 25 & 25A Jalan Kenanga 29/1 Indahpura 81000 Kulai Johor Tel : 07-662 6388
248 Ground Floor No. 121 & 123 Jalan Austin Heights 3 Taman Mount Austin 81100 Johor Bahru Johor Tel : 07-351 1687
249 No. 21 & 23, Jalan Indah 15/1, Bukit Indah 81200 Johor Bahru Johor Tel : 07-239 1388
250 No. 8-10, Jalan Nusaria 11/7 Taman Nusantara 81550 Gelang Patah Johor Tel : 07-553 9749
251 No. 24-25, Jalan Ahmad Ujan Taman Kota Besar 81900 Kota Tinggi Johor Tel : 07-883 2020 07-883 2021 07-883 3401
252 No. 2 Jalan Jati Satu Taman Nusa Bestari Jaya 81300 Skudai Johor Bahru Johor Tel : 07-511 2596
253 1, 1A, 1B & 1C Jalan Belimbing 81400 Senai Johor Tel : 07-599 4598
254 6 & 8, Jalan Nakhoda 12 Taman Ungku Tun Aminah 81300 Skudai Johor Tel : 07-556 6681
255 Ground Floor No. 1, Jalan Setia Tropika 1/15 Taman Setia Tropika 81200 Johor Bahru Johor Tel : 07-235 9531
LOcAL & OvERsEAsbRANCHESAs AT 30 JUNE 2018
346ANNUALREPORT2018
HONG LEONG BANK BERHAD

256 1 & 3, Jalan Persiaran Tanjung Susur 1, Taman Bukit Alif Tampoi 81200 Johor Bahru Johor Tel : 07-235 5930
257 No. 39 & 41 Jalan Kebudayaan 1 Taman Universiti 81300 Skudai Johor Tel : 07-521 7806
258 No. 5 Jalan Camar 1/3 Taman Perling 81200 Johor Bahru Johor Tel : 07-231 5199
259 No. 115 Jalan Sutera Tanjung 8/2 Taman Sutera Utama 81300 Skudai Johor Tel : 07-554 8298
260 No. 30 & 31, Jalan Delima Pusat Perdagangan Pontian 82000 Pontian Johor Tel : 07-687 5002
261 37 & 39, Jalan Johar 1 Taman Desa Cemerlang 81800 Ulu Tiram Johor Tel : 07-861 7488
262 12-16, Jalan Wong Ah Fook 80000 Johor Bahru Johor Tel : 07-222 8311
263 8A-C, Jalan Station 80000 Johor Bahru Johor Tel : 07-222 0188
264 105-106, Jalan Besar 81750 Masai Johor Tel : 07-252 2960
265 30 & 31, Jalan Mawar 1 Taman Mawar 81700 Pasir Gudang Johor Tel : 07-252 2740
266 No. 173 & 175 Jalan Sri Pelangi Taman Pelangi 80400 Johor Bahru Johor Tel : 07-335 3614
267 No. 21, Jalan Permas 10/1 Bandar Baru Permas Jaya 81750 Masai Johor Tel : 07-387 1828
268 No. 20 & 21 Jalan Harimau Tarum Taman Abad 80250 Johor Bahru Johor Tel : 07-331 1421
269 80, Jalan Dedap 13 Taman Johor Jaya 81100 Johor Bahru Johor Tel : 07-354 6321
270 No. 29 & 31 Jalan Molek 2/4 Taman Molek 81100 Johor Bahru Johor Tel : 07-353 7003
271 Ground Floor Bangunan Persekutuan Tiong Hua JB No. 8, Jalan Keris Taman Sri Tebrau 80050 Johor Bahru Johor Tel : 07-332 1323
pERLIS
272 No. 40 and 42 Jalan Bukit Lagi 01000 Kangar Perlis Tel : 04-977 1066
FEDERALTERRITORYpUTRAJAYA
273 IslamicbranchLot T00-U01 No. 5, Jalan 16 Precint 16 62150 Putrajaya Wilayah Persekutuan Tel : 03-8888 2188
bUREAUDECHANGE
1 S2-3-L34, Terminal KLIA2 Jalan KLIA2 64000 KLIA Selangor Darul Ehsan Tel : 03-8775 8033
2 No. 53 & 55, Jalan Sultan Ismail 50250 Kuala Lumpur Tel : 03-2141 1119
3 No. 25, Jalan Tun Ismail 25000 Kuantan Pahang Tel : 09-513 4698 09-513 3893
4 Penang International Airport Lot L2LS16B, Level 2 Departure Landside (Public Concourse), Penang International Airport 11900 Bayan Lepas Pulau Pinang Tel : 04-643 7835
SINGApORE
1 MainOffice 1 Wallich Street #29-01 Guoco Tower Singapore 078881
bankingHall 7 Wallich Street #B1-25 & B1-26 Tanjong Pagar Center Singapore 078884 Tel : (65)-6349 8338
LOcAL & OvERsEAsbRANCHESAs AT 30 JUNE 2018
ADDITIONALINFORMATION
347ANNUALREPORT
2018

HONGKONG
1 RM 1504 & 50/F The Center 99 Queen’s Road Central Central, Hong Kong Tel : 852 2283 8838
vIETNAM
1 HongLeongbankvietnamLimited Ground Floor Centec Tower 72-74 Nguyen Thi Minh Khai Street District 3, Ho Chi Minh City Tel : 848 6299 8100
2 HongLeongbankvietnamLimited Pacific Place, GF, Unit 08-09 83B LY Thuong Kiet Str Tran Hung Dao Ward Hoan Kiem District Hanoi, Vietnam Tel : 848 6299 8100
3 HongLeongbankvietnamLimited Binh Duong Branch: Unit 102, 103 Canary Plaza Binh Duong Boulevard Thuan An District Binh Duong, Vietnam Tel : 84650 625 9696
4 HongLeongbankvietnamLimited Transaction Office: 302 An Duong Vuong Street District 5, Ho Chi Minh City Vietnam Tel : 848 6261 1195
CAMbODIA
1 HongLeongbank(Cambodia)pLC Head Office Branch: No. 28, Samdech Pan Avenue (St. 214), Sangkat Boeung Raing Khan Daun Penh, Phnom Penh Kingdom of Cambodia Tel : +855 23 999 711
2 HongLeongbank(Cambodia)pLCTuol Kork Branch: No. 150 G & 150 M Street 289 Sangkat Boeung Kak 1 Khan Toul Kork, Phnom Penh Tel : +855 23 999 711
3 HongLeongbank(Cambodia)pLCOlympic Branch: No. 345, 347, and 349 Street 274 Sangkat Veal Vong, Khan 7 Makara, Phnom Penh Tel : +855 23 999 711
4 HongLeongbank(Cambodia)pLC Pet Lok Sang Branch: No. 23, Street 271 Sangkat Toeuk Thla Khan Sensok, Phnom Penh Cambodia Tel : +855 23 999 711
5 HongLeongbank(Cambodia)pLC Mao Tse Toung Branch: No. 167CD Mao Tse Toung Blvd (St. 245) Sangkat Toul Svay Prey 1 Khan Chamkamorn Phnom Penh Tel : +855 23 999 711
LAbUANOFFSHORE
1 HongLeongbankberhadLabuan International Branch Level 6 (G), Main Office Tower Financial Park Labuan Complex Jalan Merdeka 87000 Labuan F.T. Malaysia Tel : 6087-422 253
LOcAL & OvERsEAsbRANCHESAs AT 30 JUNE 2018
348ANNUALREPORT2018
HONGLEONGbANKbERHAD

I/We
NRIC/Passport/Company No.
of
being a member of HONG LEONG BANK BERHAD (the “Bank”), hereby appoint
NRIC/Passport No.
of
or failing him/her
NRIC/Passport No.
of
or failing him/her, the Chairman of the meeting as my/our proxy/proxies to vote for me/us on my/our behalf at the Seventy-Seventh Annual General Meeting of the Bank to be held at the Auditorium, Ground Floor, Menara Hong Leong, No. 6, Jalan Damanlela, Bukit Damansara, 50490 Kuala Lumpur on Monday, 29 October 2018 at 10:30 a.m. and at any adjournment thereof.
My/Our proxy/proxies is/are to vote as indicated below with an “X”:
RESOLUTIONS FOR AGAINST1. To declare a final single-tier dividend of 32 sen per share2. To approve the payment of Directors’ Fees and Directors’ Other Benefits3. To re-elect Mr Kwek Leng Hai as Director4. To re-elect Ms Lim Lean See as Director5. To re-appoint PricewaterhouseCoopers PLT as Auditors of the Bank and to authorise the
Directors to fix their remunerationSpecialbusiness
6. To approve the ordinary resolution on Authority to Directors to Allot Shares7. To approve the ordinary resolution on the Proposed Renewal of Shareholders’ Mandate
for Recurrent Related Party Transactions of a Revenue or Trading Nature with Hong Leong Company (Malaysia) Berhad (“HLCM”) and Persons Connected with HLCM
(97141-X)FORM OF pROxY
Notes:1. Forthepurposeofdeterminingmembers’eligibilitytoattendthismeeting,onlymemberswhosenamesappearintheRecordofDepositorsasat19October
2018shallbeentitledtoattendthismeetingorappointproxy(ies)toattendandvoteontheirbehalf.2. Ifyouwishtoappointotherperson(s)tobeyourproxy,insertthename(s)andaddress(es)oftheperson(s)desiredinthespacesoprovided.3. Ifthereisnoindicationastohowyouwishyourvote(s)tobecast,theproxywillvoteorabstainfromvotingathis/herdiscretion.4. AproxymaybutneednotbeamemberoftheBank.5. Saveforamemberwhoisanexemptauthorisednominee,amembershallnotbeentitledtoappointmorethantwo(2)proxiestoattend,participate,speak
andvoteatthesamemeeting.WhereamemberoftheBankisanauthorisednomineeasdefinedundertheSecuritiesIndustry(CentralDepositories)Act,1991,itmayappointnotmorethantwo(2)proxiesinrespectofeachsecuritiesaccountitholdswithordinarysharesoftheBankstandingtothecreditofthesaidsecuritiesaccount.Amemberwhoisanexemptauthorisednomineeformultiplebeneficialownersinonesecuritiesaccount(“OmnibusAccount”)mayappointanynumberofproxiesinrespectoftheOmnibusAccount.
6. Wheretwo(2)ormoreproxiesareappointed,theproportionofshareholdingstoberepresentedbyeachproxymustbespecifiedintheinstrumentappointingtheproxies,failingwhichtheappointmentsshallbeinvalid(pleaseseenote9below).
7. Inthecasewhereamemberisacorporation,thisFormofProxymustbeexecutedunderitsCommonSealorunderthehandofitsAttorney.8. AllFormsofProxymustbedulyexecutedanddepositedattheRegisteredOfficeoftheBankatLevel30,MenaraHongLeong,No.6,JalanDamanlela,Bukit
Damansara,50490KualaLumpurnotlessthan48hoursbeforethetimeanddateofthemeetingoradjournedmeeting.9. Intheeventtwo(2)ormoreproxiesareappointed,pleasefillintheensuingsection:
Name of Proxies % of shareholdings to be represented
10. PursuanttoParagraph8.29A(1)oftheMainMarketListingRequirementsofBursaMalaysiaSecuritiesBerhad,alltheresolutionssetoutinthenoticewillbeputtovotebywayofapoll.
Signature(s) of MemberNumber of shares held
Dated this day of 2018.

Foldthisflapforsealing
Thenfoldhere
1stfoldhere
Affix Stamp
TheGroupCompanySecretary
HONGLEONGbANKbERHAD(Company No. 97141-X)
Level 30, Menara Hong Leong No. 6, Jalan Damanlela Bukit Damansara 50490 Kuala Lumpur Malaysia

AN
NU
AL R
EPO
RT 2
01
8
Hong Leong Bank Berhad (97141-X)
Level 19, Menara Hong Leong6, Jalan Damanlela, Bukit Damansara50490 Kuala LumpurTel : 03-2081 8888Fax : 03-2081 7801
w w w. h l b . c o m . m y
As part of Hong Leong Bank’s support for environmental sustainability, this Annual Report is printed on Forest Stewardship Council (FSC) certified paper and recycled paper.
Bank Berhad
Bank Berhad
ANNUAL REPORT 2018
Top Related