


Languages
Pages
Legal


BALLISTIC TRANSPARENT ARMOR TESTING USING A MULTI-HIT RIFLE PATTERN
A thesis written at
U.S. ARMY TANK-AUTOMOTIVE COMMAND
and submitted to
KETTERING UNIVERSITY
in partial fulfillment of the requirements for the
degree of
BACHELOR OF SCIENCE IN MECHANICAL ENGINEERING
by
ANTHONY M. DOLAN
December 2007
Author
Employer Advisor Faculty Advisor

Report Documentation Page Form ApprovedOMB No. 0704-0188
Public reporting burden for the collection of information is estimated to average 1 hour per response, including the time for reviewing instructions, searching existing data sources, gathering andmaintaining the data needed, and completing and reviewing the collection of information. Send comments regarding this burden estimate or any other aspect of this collection of information,including suggestions for reducing this burden, to Washington Headquarters Services, Directorate for Information Operations and Reports, 1215 Jefferson Davis Highway, Suite 1204, ArlingtonVA 22202-4302. Respondents should be aware that notwithstanding any other provision of law, no person shall be subject to a penalty for failing to comply with a collection of information if itdoes not display a currently valid OMB control number.
1. REPORT DATE 01 DEC 2007
2. REPORT TYPE N/A
3. DATES COVERED -
4. TITLE AND SUBTITLE Ballistic Transparent Armor Testing Using A Multi-Hit Rifle Pattern
5a. CONTRACT NUMBER
5b. GRANT NUMBER
5c. PROGRAM ELEMENT NUMBER
6. AUTHOR(S) Dolan, Anthony, M
5d. PROJECT NUMBER
5e. TASK NUMBER
5f. WORK UNIT NUMBER
7. PERFORMING ORGANIZATION NAME(S) AND ADDRESS(ES) TACOM RESEARCH DEVELOPMENT AND ENGINEERINGCENTER 6501 E 11 Mile Road Warren, MI 48397-5000
8. PERFORMING ORGANIZATION REPORT NUMBER 17746 RC
9. SPONSORING/MONITORING AGENCY NAME(S) AND ADDRESS(ES) 10. SPONSOR/MONITOR’S ACRONYM(S) TACOM/TARDEC
11. SPONSOR/MONITOR’S REPORT NUMBER(S) 17746 RC
12. DISTRIBUTION/AVAILABILITY STATEMENT Approved for public release, distribution unlimited
13. SUPPLEMENTARY NOTES A thesis written at U.S. ARMY TANK-AUTOMOTIVE COMMAND and submitted to KETTERINGUNIVERSITY in partial fulfillment of the requirements for the degree of BACHELOR OF SCIENCE INMECHANICAL ENGINEERING, The original document contains color images.
14. ABSTRACT
15. SUBJECT TERMS
16. SECURITY CLASSIFICATION OF: 17. LIMITATIONOF ABSTRACT
SAR
18. NUMBEROF PAGES
55
19a. NAME OFRESPONSIBLE PERSON
a. REPORT unclassified
b. ABSTRACT unclassified
c. THIS PAGE unclassified
Standard Form 298 (Rev. 8-98) Prescribed by ANSI Std Z39-18

ii
DISCLAIMER
This thesis is submitted as partial and final fulfillment of the cooperative work
experience requirements of Kettering University needed to obtain a Bachelor of Science
in Mechanical Engineering.
The conclusions and opinions expressed in this thesis are those of the writer and
do not necessarily represent the position of Kettering University or U.S. Army Tank-
Automotive Command, or any of its directors, officers, agents, or employees with respect
to the matters discussed.

PREFACE
This thesis represents the capstone of my five years combined academic work at
Kettering University and job experience at U.S. Army Tank-Automotive Command.
Academic experience in statistics, material science, and mechanical engineering proved
to be valuable assets while I developed this thesis and addressed the problem it concerns.
Although this thesis represents the compilation of my own efforts, I would like to
acknowledge and extend my sincere gratitude to the following persons for their valuable
time and assistance, without whom the completion of this thesis would not have been
possible:
1. My parents, family, and friends, who really had nothing to do with this thesis, but have had EVERYTHING to do with every other thing in my life. I love you all.
2. The entire crew of the TAIL laboratory. Without your excessive amounts of
sarcasm and good-natured harassment, my day at work would actually be…work. Also, a special thank you to Terry Avery whose “old-fashioned” style makes me appreciated the advent of computers. May you never use a CAD program in your life.
3. Also, Professor Laura Sullivan for dealing with my obscene procrastination and
barrage of questions, you are far too patient. Thank you.
iii

TABLE OF CONTENTS
DISCLAIMER ....................................................................................................................... ii
PREFACE ............................................................................................................................. iii
LIST OF ILLUSTRATIONS ................................................................................................ vi
I. INTRODUCTION ..................................................................................................... 1 Problem Topic ............................................................................................... 1 Background .................................................................................................... 1 Criteria and Parameter Restrictions ............................................................... 4 Methodology .................................................................................................. 5 Primary Purpose ............................................................................................. 5 Overview ........................................................................................................ 5
II. BALLISTIC TESTING ............................................................................................. 6
Testing toward Specification ........................................................................... 6 Test Set-up ....................................................................................................... 8 Testing............................................................................................................ 10 Results............................................................................................................ 15
III. LIGHT TRANSMISSION TESTING ....................................................................... 20 Test Method ................................................................................................... 21 Results............................................................................................................ 21
IV. CONCLUSIONS AND RECOMMENDATIONS .................................................... 24
Conclusions.................................................................................................... 24 Recommendations.......................................................................................... 24
REFERENCES .................................................................................................................... 25 ACRONYMS ....................................................................................................................... 26 APPENDICES ..................................................................................................................... 27
APPENDIX A: PICTURES OF TEST SET-UP....................................................... 28 APPENDIX B: TEST SAMPLE PICTURES........................................................... 33 APPENDIX C: BALLISTIC TESTING RESULTS ................................................ 38 APPENDIX D: LIGHT TRANSMISSION RESULTS............................................ 43
iv

v
APPENDIX E: ABET PROGRAM OUTCOMES................................................... 45
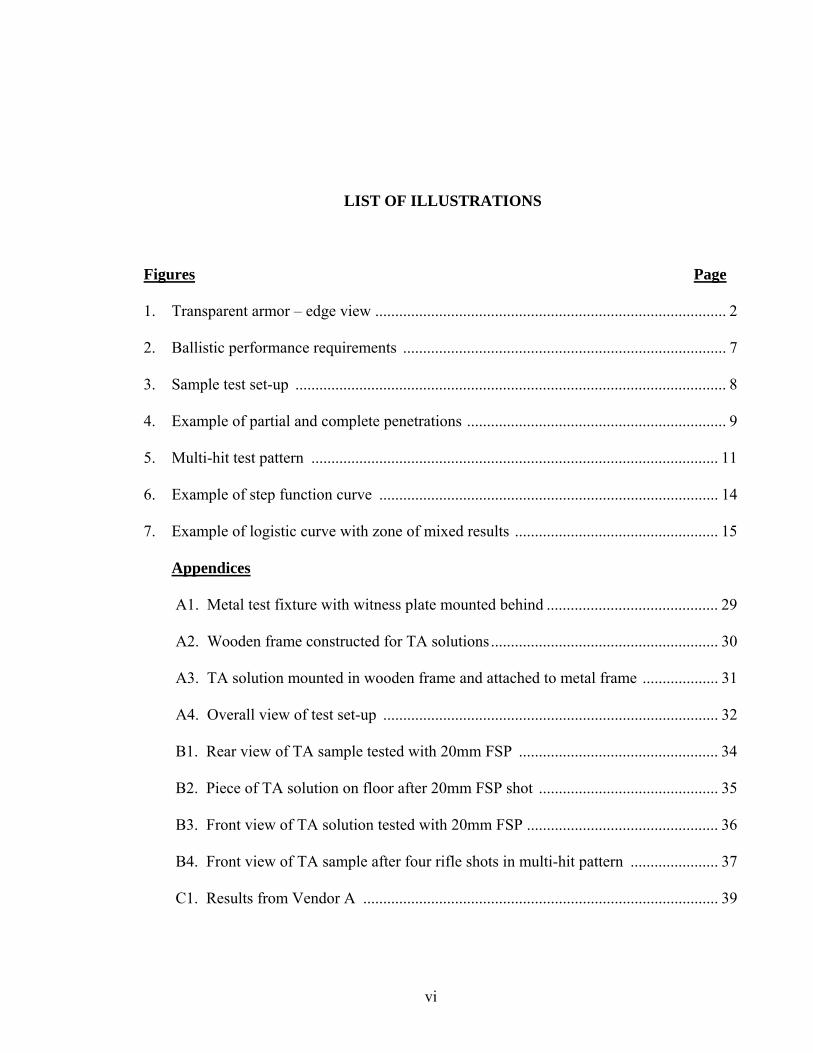
LIST OF ILLUSTRATIONS
Figures Page
1. Transparent armor – edge view ........................................................................................ 2
2. Ballistic performance requirements ................................................................................. 7
3. Sample test set-up ............................................................................................................ 8
4. Example of partial and complete penetrations ................................................................. 9
5. Multi-hit test pattern ...................................................................................................... 11
6. Example of step function curve ..................................................................................... 14
7. Example of logistic curve with zone of mixed results ................................................... 15
Appendices
A1. Metal test fixture with witness plate mounted behind ........................................... 29
A2. Wooden frame constructed for TA solutions......................................................... 30
A3. TA solution mounted in wooden frame and attached to metal frame ................... 31
A4. Overall view of test set-up .................................................................................... 32
B1. Rear view of TA sample tested with 20mm FSP .................................................. 34
B2. Piece of TA solution on floor after 20mm FSP shot ............................................. 35
B3. Front view of TA solution tested with 20mm FSP ................................................ 36
B4. Front view of TA sample after four rifle shots in multi-hit pattern ...................... 37
C1. Results from Vendor A ......................................................................................... 39
vi

C2. Results from Vendor B .......................................................................................... 40
C3. Results from Vendor C .......................................................................................... 41
C4. Results from Vendor D ......................................................................................... 42
D1. Light transmission test results ............................................................................... 44
Tables Page
1. Vendor A Results ........................................................................................................... 16
2. Vendor B Results ........................................................................................................... 17
3. Vendor C Results ........................................................................................................... 17
4. Vendor D Results ........................................................................................................... 18
5. Photopic Transmission Results ...................................................................................... 22
6. Night Vision Transmission Results ............................................................................... 22
vii

I. INTRODUCTION
Problem Topic
Currently, the United States Army does not have a ballistic standard for
measuring the multi-hit performance of its transparent armor (TA). The results of this
testing may aid in the establishment of a ballistic performance standard. A draft TACOM
Transparent Armor Purchase Document (ATPD 2352) has been written based on early
testing. This study adds data to validate the outlined ballistic testing method and
conformance of the TA to the light transmission requirements. This information is
pertinent to the development of new solutions (e.g. recipes of glass laminations) that may
further improve the protection of occupants of U.S. Army vehicles.
Background
Since the beginning of Operation Iraqi Freedom (Iraq) and Operation Enduring
Freedom (Afghanistan) occupant safety in U.S. Army vehicles has become an escalating
issue. U.S. Army vehicles in operation are facing increased threats from armed
insurgents and improvised explosive devices (IEDs). As a result, the U.S. Army is
constantly evaluating its vehicles, looking for ways to improve their protection
capabilities. The windows and windshield, usually the most targeted areas of the vehicle,
are given extra attention.
1

Most transparent armor solutions consist of layers made from glass and plastic.
The number of layers in each solution and their respective thicknesses can be varied to
achieve different ballistic protection capabilities. Bullet projectiles typically behave
differently than fragments from an IED, therefore specific solutions can be made to better
protect against one threat or the other. Figure 1 is an edge view of sample transparent
armor and details each of the layers as they appear in the solution.
Strike Face
Plastic Layer
Glass layer
Figure 1. Transparent armor – edge view.
2

When a solution is installed on a vehicle, the surface that the projectile first
impacts is called the strike face. The strike face is made of glass so that the solution can
initially absorb large amounts of energy. Also the glass provides scratch and abrasion
resistance which may occur from windshield wipers, or from dusty, dirty environments.
The final piece of the solution is polycarbonate which is used to soak up the broken
pieces of glass and prevent them from entering the vehicle. The solution must be installed
on the vehicle in the correct orientation (strike face out), as much testing and research has
shown that when the solution is installed incorrectly, the TA will suffer a major decrease
in ballistic protection.
Temperature can also play a role in the effectiveness of the TA. Hot as well as
cold testing must be performed to understand how the solutions work in all types of
environments. During the summer, the elevated temperatures seen in Iraq and
Afghanistan have been known to cause a decrease in ballistic protection. In addition, de-
lamination of the glass and plastic layers has been observed at higher temperatures,
resulting in lower visibility. Cold temperature testing reveals when vendors have used
interlaminate adhesive materials that become brittle at low temperatures. Most vendors
now use urethane which does not exhibit low temperature brittleness. Consequently,
higher importance is placed on the elevated temperature protection as opposed to the cold
temperature protection.
Although the ballistic protection of TA is essential, another important aspect of
TA is optical clarity. Vehicles are far more difficult to drive and operate if a Soldier does
not have clear visibility from the inside. Without clear visibility, the Soldiers will not be
able to carry out their daily tasks, which may include spotting roadside mines and
3
locating insurgent hiding places. To ensure sufficient visibility, the TA solution must
have adequate light transmission values at specified ranges in the visible and infrared
light spectra. This is especially important for Soldiers who are using night vision
goggles.
In the past, the Army has had the problem of TA vendors shipping “green” glass.
Green glass is caused by a high concentration of iron which tints the glass a slight shade
of green. This green glass is cheaper to process than clear white water glass because it is
made with a greater number of impurities. Soldiers who have operated vehicles with
green glass installed have reported low visibility in normal conditions, and almost no
visibility when using night vision goggles. These complaints have caused the Army to
reject green glass from vendors.
As mentioned earlier, U.S. Army vehicles face two main threats, armed insurgents
and IEDs. The armed insurgents are usually equipped with handguns, small caliber rifles,
or medium machine guns. This type of threat is known as small arms fire. These small
arms threats come in all different sizes, ranging from a 9mm all the way up to a .50
caliber. The small arms projectiles can also vary, and include ball ammunition, armor
piercing rounds (AP), and tracers. For the testing performed under the present study, the
IED threat was simulated using a Fragment Simulating Projectile (FSP). The FSP is used
to model the fragments generated by an exploding artillery shell.
Criteria and Parameter Restrictions
For evaluating the effectiveness and viability of our test procedure as a means of
comparing and contrasting different TA solutions, three requirements have been outlined.
This evaluation is based on the following criteria:
4

• The data that is obtained from testing must be accurate and repeatable.
• The data that is obtained must provide useful information allowing upper management to make informed decisions based on these results.
• Light transmission data must verify that the laminate recipe meets the minimum
standard for use with night vision goggles. Methodology Published Army documents and direct observation of ballistic testing were used to
justify the effectiveness of the test procedure.
Primary Purpose
The purpose of this thesis is to examine and validate the testing method used in
ATPD 2352 as well as the light transmission requirements outlined in the specification.
Overview
The following chapters will discuss the results of the ballistic testing, followed by
an explanation of the results attained. Analysis of both the testing method and the
collected data will be included. Also incorporated are the results from light transmission
testing, along with an explanation of these results.
5

6
II. BALLISTIC TESTING
The U.S. Army requires ballistic testing on all vehicles that see combat while in
service. It is important for the engineers to design these vehicles to provide as much
protection as possible while also keeping the weight of the vehicle to a minimum. In
terms of protection, TA is one of the weakest areas on the vehicle and also the most
inefficient when comparing weight versus ballistic protection. Since windows and
windshields provide attackers with a line-of-sight on their target, they are some of the
most heavily attacked areas on the vehicle. With this in mind, a complete understanding
of how the TA will react under different threats is necessary.
Testing toward Specification
The U.S. Army is in the process of developing a new specification for testing TA.
ATPD 2352, a TACOM purchase specification, is in development and close to being
accepted as a standard Army specification. ATPD 2352 outlines all of the key
requirements that a TA solution must possess to be considered for purchase by the Army.
This specification places an emphasis on the ballistic performance, light transmissivity,
and environmental durability of a TA solution. Exceptional results in these areas have
proven to be essential in selecting superior TA solutions.
This new specification is required because current ballistic threats far exceed any
of the requirements outlined in available specifications. The Army formerly used
commercial specifications to purchase TA, however, with the development of this new

specification, the Army now has its own standard document for purchasing TA. There
are many different commercial testing methods available for use; however, most of these
only cover handguns and small caliber rifle rounds. U.S. Army vehicles face a larger
range of heavier ammunition than accounted for by these commercial standards.
Although the specific threats and the test results necessary to achieve acceptance are
classified for ATPD 2352, Figure 2 illustrates the National Institute of Justice (NIJ) test
standard which specifies the results required for commercially available TA.
Figure 2. Ballistic performance requirements. NIJ, September 1985.Ballistic Resistant Protective Materials. NIJ Standard 0108.01.
7

ATPD 2352 also includes requirements for FSP testing. The FSP threat is
military specific and is not outlined in any commercial specification. FSP testing has
recently become a priority for the Army since IED related vehicle deaths have been on
the rise. With the inclusion of FSP testing on ATPD 2352, the Army now has a sufficient
test method to test TA against this threat.
Test Set-up
Ballistic testing was done at the TARDEC Armor Integration Laboratory (TAIL)
located on base in Warren, MI. This facility houses an indoor testing range as well as a
drop tower that is used for landmine blast simulation. During testing, the projectiles are
fired from one end of the range into the impact chamber where the samples are set up.
Inside the impact chamber the test fixture supports the sample that is being tested.
Between both ends of the range is a chronograph, which is used to determine the velocity
of the fired projectile. Figure 3 illustrates this set-up.
Figure 3. Sample test set-up. NIJ, September 1985.Ballistic Resistant Protective Materials. NIJ Standard 0108.01.
8

To support the glass samples evaluated in this study properly, a new test fixture
was specifically fabricated. The new test fixture helped ensure a consistent and
repeatable setup between all vendors and samples tested. A piece of aluminum foil
behind the test setup was used as a witness plate. The witness plate, in the case of opaque
armor, simulates a Soldier’s skin and uniform. In the case of TA, the witness plate is
thinner, and simulates a Soldier’s eyes. A perforation in the witness plate indicates that a
Soldier not wearing eye protection will suffer an injury. If this result should occur, the
test is marked as a complete penetration and the sample is considered a failure. The
distinction between a complete and partial penetration is shown in Figure 4.
Figure 4. Example of partial and complete penetrations.
9

Testing
Glass samples were ordered from four different TA suppliers. Sixteen pieces
were ordered from each supplier except for one. In that case, thirty-two samples were
ordered for the purpose of conducting elevated temperature testing. All of the samples
ordered were 12”x12” and had a nominal thickness of 73mm (≈ 2.9”).
The orientation of testing was originally specified as a single 20mm FSP shot
aimed at the center of the TA sample. Testing two panels in this manner indicated that
this test method was not going to provide results that were accurate or usable. This is
because the 20mm FSP threat was an overmatch for the size of test sample used. Simply
put, there was not enough material in the sample to absorb all of the energy that was
generated by the FSP. Previous testing of samples with the same thickness, but with a
surface area 1.7 times larger than 12”x12”, showed that the 20mm FSP threat can be
stopped at the test velocity. This finding indicates the possibility that data and results
from windshield tests can no longer be compared equally to side window tests, since side
windows are usually much smaller and are therefore unable to absorb the same amount of
energy. Furthermore, results from sample testing cannot be accurately compared unless
the samples have the same surface area and overall dimensions. ATPD 2352 requires a
uniform sample size for all testing, to eliminate the advantages, or disadvantages, of
different sample sizes.
Since the 20mm FSP threat was an obvious overmatch for our solutions, the focus
of the testing switched from a single FSP shot to a multi-hit rifle pattern. The projectile
chosen for testing was the .30 caliber M2AP round and the test pattern used is
documented in ATPD 2352. The test pattern, which is unique to ATPD 2352, was
10

developed with the help of a TARDEC research project used to write a NATO Test
Standard (STANAG). Figure 5 illustrates the test pattern used for testing.
Figure 5. Multi-hit test pattern (units in mm)
With this method of testing TA, the engineer seeks to identify the velocity of the
chosen threat at which there is only a five percent chance of penetrating the solution.
This is different from testing opaque armor, where the engineer is testing to find the
velocity at which fifty percent of the projectiles will penetrate the armor, this is known as
a V50. The V50 method is outlined in the military document MIL-HDBK-690(AT).
Another ballistic limit test, known as the six-round limit, uses three complete penetrations and three partial penetrations within a specified velocity range – usually 27, 38, or 46 m/s (90, 125, 150 ft/s). Firing is discontinued as soon as three complete penetrations and three partial penetrations are obtained within the specified velocity range. The striking
11

velocities of the three lowest complete penetrations and the three highest partial penetrations are averaged to obtain the V50 ballistic limit. The six-round ballistic limit is reasonably accurate and generally is used to test metallics and nonmetallics, regardless of the size of the projectiles. A V50 is often used for opaque armor testing as a quick method to acquire data on
how effective the armor is. A V50 value also gives the designer a result that is
representative of the solution at its breaking point. During V50 testing, each shot is
counted as a different statistical event. Individual shots are physically spaced far enough
apart so that each new shot is considered to be taken on virgin material. This is opposed
to a multi-hit pattern, where the panel is conditioned by previous shots, making some
shots more difficult to pass than others. In the ATPD 2352 pattern, all fours shots on the
target are considered one statistical event, not each individual shot. The following is an
equation for finding the V50 of a sample.
CP
V
NNS
V+
=50 (1)
SV = sum of the striking velocities of all rounds in the zone of mixed results, m/s (ft/s) NP = number of partial penetrations in the zone of mixed results, dimensionless NC = number of complete penetrations in the zone of mixed results, dimensionless
The data analysis method used for the TA tests is known as a logistic response
function. In this case, this testing method gives the probability of penetration in relation
to the velocity of the projectiles. Since the results are given as a probability, all values
stay between the boundaries zero and one. While testing, a partial penetration is reported
as a zero and a complete penetration is reported as a one. There are two reasons why this
12
type of data analysis is used for TA testing. First, a logistic regression curve determines
the relationship between velocity and penetration, and second, the curve provides for an
estimation of the velocity needed to produce a certain level of penetrations. The logistic
regression model can be written as
Probability of Penetration )( 1011
velocitye •+−+= ββ (2)
where 0β and 1β are coefficients estimated from the data. Since the logistic function to
be fitted is nonlinear, a transformation is chosen to make the response function linear.
The weighted least squares are typically used to estimate the values of 0β and 1β .
There are a few problems with this type of data analysis. First, a relatively large
number of data points are required for the testing. Compared to the six to ten data points
needed for a V50, the logistic response function needs more data to generate an accurate
curve throughout the entire range of velocities. The second problem comes when the
testing is completed and there is no zone of mixed results. When the logistic regression
curve of this data is plotted, the resulting curve looks similar to a step function, as seen in
Figure 6.
13
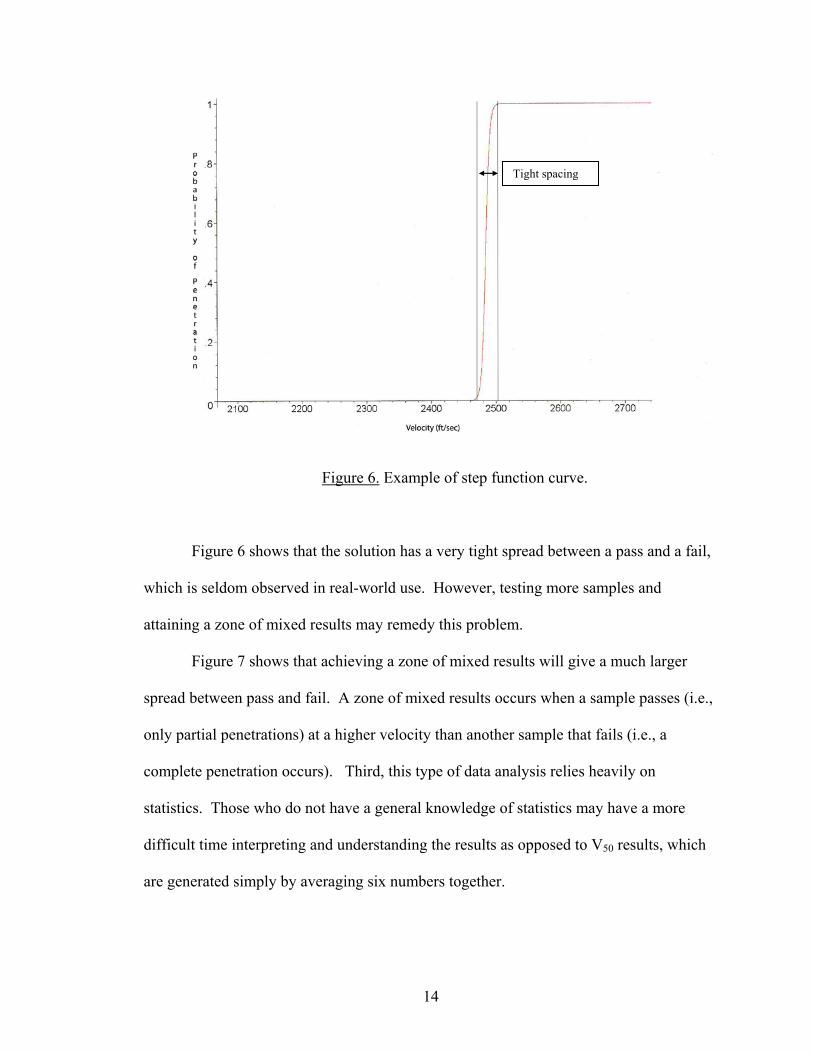
Tight spacing
Figure 6. Example of step function curve.
Figure 6 shows that the solution has a very tight spread between a pass and a fail,
which is seldom observed in real-world use. However, testing more samples and
attaining a zone of mixed results may remedy this problem.
Figure 7 shows that achieving a zone of mixed results will give a much larger
spread between pass and fail. A zone of mixed results occurs when a sample passes (i.e.,
only partial penetrations) at a higher velocity than another sample that fails (i.e., a
complete penetration occurs). Third, this type of data analysis relies heavily on
statistics. Those who do not have a general knowledge of statistics may have a more
difficult time interpreting and understanding the results as opposed to V50 results, which
are generated simply by averaging six numbers together.
14

Figure 7. Example of logistic curve with zone of mixed results.
Large spacing
Results
The testing was conducted over a four-week period. During this period, the
samples were shot and the data was collected and analyzed on a daily basis. Each sample
was subjected to the pattern of four shots, and testing was stopped at the first complete
penetration. After each shot, the samples were photographed and then checked for a
partial or complete penetration. Based on previous knowledge and test experience, it was
known that complete penetrations were more likely to occur during either the second or
fourth shot, since each of these shots was the second projectile placed in a tight area. All
of the shots taken on each individual sample were similar in velocity, so if 2200 ft/sec
15

was the target velocity of the projectile for a given sample, then each shot on the sample
was 2200 ±50 ft/sec. The velocity listed in the tables is simply the average velocity of all
the shots taken on that sample.
The vendors were kept anonymous for the disclosure of the results. They are
labeled as vendor A, B, C, or D. The results for each vendor can be found below in
Tables 1 through 4.
Table 1
Vendor A Results
Vendor A Sample
# Avg. Velocity
(ft/s) Penetration
Type 1 2068 Partial 2 2099 Partial 3 2175 Partial 4 2204 Partial 5 2347 Partial 6 2427 Partial 7 2537 Complete 8 2539 Complete 9 2607 Complete
10 2741 Complete
16

Table 2
Vendor B Results
Vendor B Sample
# Avg. Velocity
(ft/s) Penetration
Type 1 2044 Partial 2 2160 Partial 3 2243 Partial 4 2262 Partial 5 2273 Complete 6 2281 Complete 7 2287 Complete 8 2292 Complete 9 2350 Complete
10 2353 Complete 11 2435 Complete 12 2544 Complete 13 2582 Complete 14 2712 Complete
Table 3
Vendor C Results
Vendor C Sample
# Avg. Velocity
(ft/s) Penetration
Type 1 2223 Complete 2 2224 Complete 3 2235 Partial 4 2261 Complete 5 2278 Complete 6 2290 Partial 7 2372 Complete 8 2413 Complete 9 2486 Complete
17
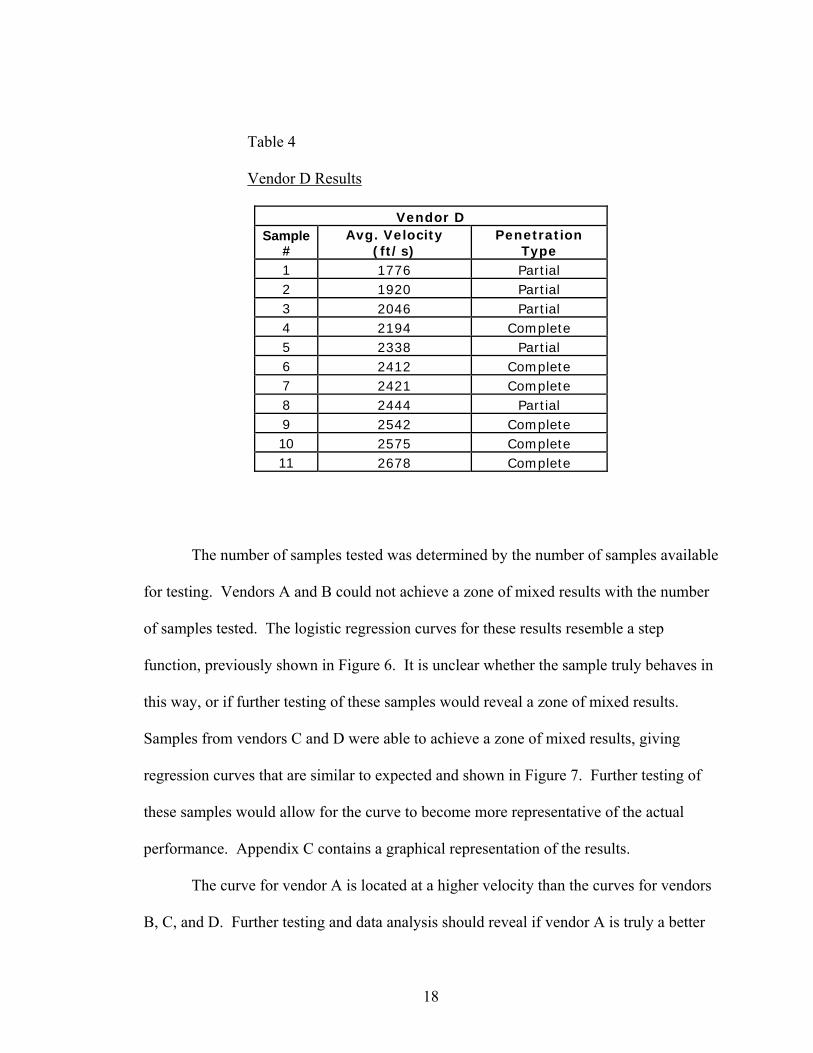
Table 4
Vendor D Results
Vendor D Sample
# Avg. Velocity
(ft/s) Penetration
Type 1 1776 Partial 2 1920 Partial 3 2046 Partial 4 2194 Complete 5 2338 Partial 6 2412 Complete 7 2421 Complete 8 2444 Partial 9 2542 Complete
10 2575 Complete 11 2678 Complete
The number of samples tested was determined by the number of samples available
for testing. Vendors A and B could not achieve a zone of mixed results with the number
of samples tested. The logistic regression curves for these results resemble a step
function, previously shown in Figure 6. It is unclear whether the sample truly behaves in
this way, or if further testing of these samples would reveal a zone of mixed results.
Samples from vendors C and D were able to achieve a zone of mixed results, giving
regression curves that are similar to expected and shown in Figure 7. Further testing of
these samples would allow for the curve to become more representative of the actual
performance. Appendix C contains a graphical representation of the results.
The curve for vendor A is located at a higher velocity than the curves for vendors
B, C, and D. Further testing and data analysis should reveal if vendor A is truly a better
18

solution. As mentioned earlier, the curves for vendors C and D seem to be more
representative of a logistic response curve than the curves generated by vendors A and B.
Currently, it is uncertain if this indicates statistically superior results, or if the samples for
vendors A and B truly behave in this manner.
19

20
III. LIGHT TRANSMISSION TESTING
Light transmission testing is necessary on all of the different solutions of TA.
The TA solution must have a certain level of light transmission through a selected range
of the visible light spectrum in order to be functional. If the operator’s vision through the
TA becomes inadequate, the operator will no longer able to perform their duties to their
full potential. The driver may have a difficult time seeing the road and the other
occupants may not be able to detect threats to the vehicle such as roadside IEDs. This
type of testing becomes more important as the TA solutions become thicker since there is
more material to look through and there is a higher probability of finding defects in the
solution. Previous research indicated that lower light transmission levels occur when the
solution contains “green” glass, or if the solution includes a large amount of plastic.
Requirements
The requirements for light transmission testing outlined in ATPD 2352 are as
follows:
The integrated luminous (photopic) transmittance of transparent armor shall be equal to or greater than 70% for protection classes 1 through 3, TBD for protection class 4, and TBD for protection class 5, measured according to the photopic transmission measurement procedure given in MIL-DTL-62420. For compatibility with night vision goggles the spectral transmission shall not be less than 50% at all wavelengths from 550 nm to 1000 nm, and shall be not less than 72% at 550 nm when tested using a spectroradiometer.

This means that protection classes 1 through 3 must have at least a 70 percent average
photopic transmission, or the TA fails. Also, the occupants must have at least 50 percent
photopic transmission while wearing the PVS14 Gen III Night Vision Goggles. Photopic
transmission is a weighted value that is calculated based on the light transmission of the
sample, the human eye photopic response curve, and a “weighting” for the artificial light
source. The visible light photopic transmission is derived from:
∑=700
400)()()( dwwVwSwTX (3)
∑=700
400)()( dwwVwSY (4)
YXPT = (5)
= Wavelength w = Sample Measured Light Transmission )(wT ) = Artificial Light “weighting” (wS ) = Eye Photopic Response (wV = 10 nm Intervals dw
Test Method
Testing was done using a Perkin Elmer 900 Lambda Series Spectrophotometer.
The sample light transmission was tested through the visible light spectrum, from 400nm
to 1000nm wavelengths. The results were then calculated and compared to one another,
as well as the specification requirements.
Results
The results of the photopic transmission can be seen below in Table 5.
21

Table 5
Photopic Transmission Results
Photopic Transmission Vendor PT (%)
A 72.2 B 59.5 C 82.5 D 62.5
The photopic transmission results came out as expected. Both of the samples of
“green” glass failed the photopic transmission testing according to the guidelines set in
ATPD 2352, while both of the clear glass solutions passed. The value that is given in
Table 5 is an average transmission percentage over the wavelength range extending from
400nm to 700nm. For a graph of the transmission percentage over the entire range of
wavelengths, please refer to Appendix D.
The results for the PVS14 Gen III transmission can be seen in Table 6.
Table 6
Night Vision Transmission Results
Night Vision Transmission Vendor PT (%)
A 63.8 B 25.7 C 76.5 D 28.3
Again, these results clearly show that the “green” glass failed the night vision
transmission testing. Although the average photopic transmission for Vendor A was
22

above 60 percent, it still failed the night vision goggle testing because transmission
dropped below the 50 percent minimum at the 920nm wavelength range.
23

24
IV. CONCLUSIONS AND RECOMMEDATIONS
The U.S. Army is continually searching to improve vehicle occupant protection.
As new technologies become available, they must be tested and compared to existing
technologies to observe any discernable difference, either good or bad. It is the job of the
test engineer to derive the most effective means of testing to efficiently and accurately
compare two different samples of transparent armor.
Conclusions
Based on the results of the ballistic testing, two conclusions could be drawn from the data gathered. 1. Ballistic testing results are dependant upon the overall physical size of the sample
being tested. A uniform test sample size must be specified in order to directly compare different TA solutions.
2. No zone of mixed results in the data means the probability of penetration curve
will have a very tight spacing between pass and fail. Acquiring a zone of mixed results extends the probability of penetration curve over a much larger velocity range.
Recommendations
1. Further testing is suggested to confirm the repeatability of the results. 2. Research is recommended to determine the ideal physical size for test samples. 3. Further testing is recommended to determine if the probability of penetration
curve with a very steep slope, is an accurate representation of the actual performance of the TA solution.
4. Determine if data is accurate when the pattern is broken down into two, two shot
patterns when compared with one, four shot pattern.

REFERENCES
Ballistic Resistant Protective Materials. NIJ Standard 0108.01. National Institute of Justice, U.S. Department of Justice, Washington DC 20531
MIL-HDBK-690(AT) Purchase Specification Transparent Armor. ATPD-2352.
25

ACRONYMS
AP Armor Piercing ATPD Transparent Armor Purchase Document FSP Fragment Simulating Projectile IED Improvised Explosive Device TA Transparent Armor TACOM Tank-Automotive Command TAIL TARDEC Armor Integration Laboratory TARDEC Tank-Automotive Research Development and Engineering Center
APPENDICES
26

APPENDIX A
27

PICTURES OF TEST SET-UP
This appendix gives an overall view of the test set-up, as well as pictures of
the individual components.
28

Figure A1. Metal test fixture with witness plate mounted behind.
29
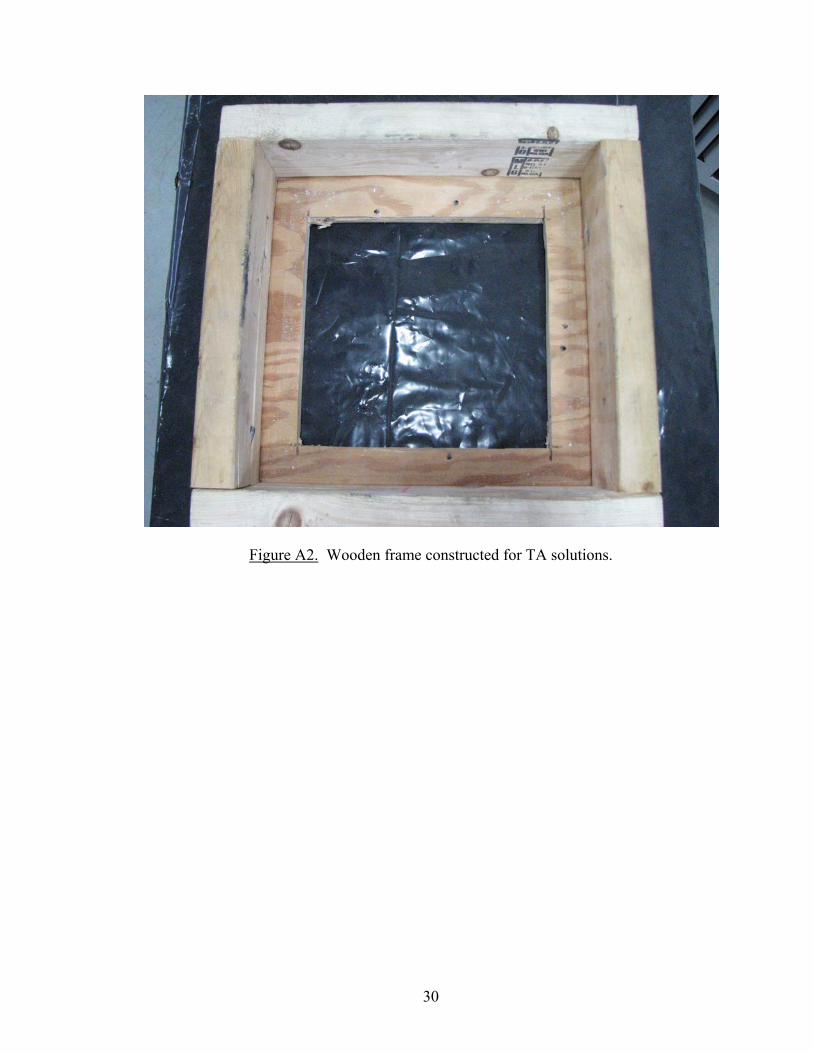
Figure A2. Wooden frame constructed for TA solutions.
30

Figure A3. TA solution mounted in wooden frame and attached to metal frame.
31
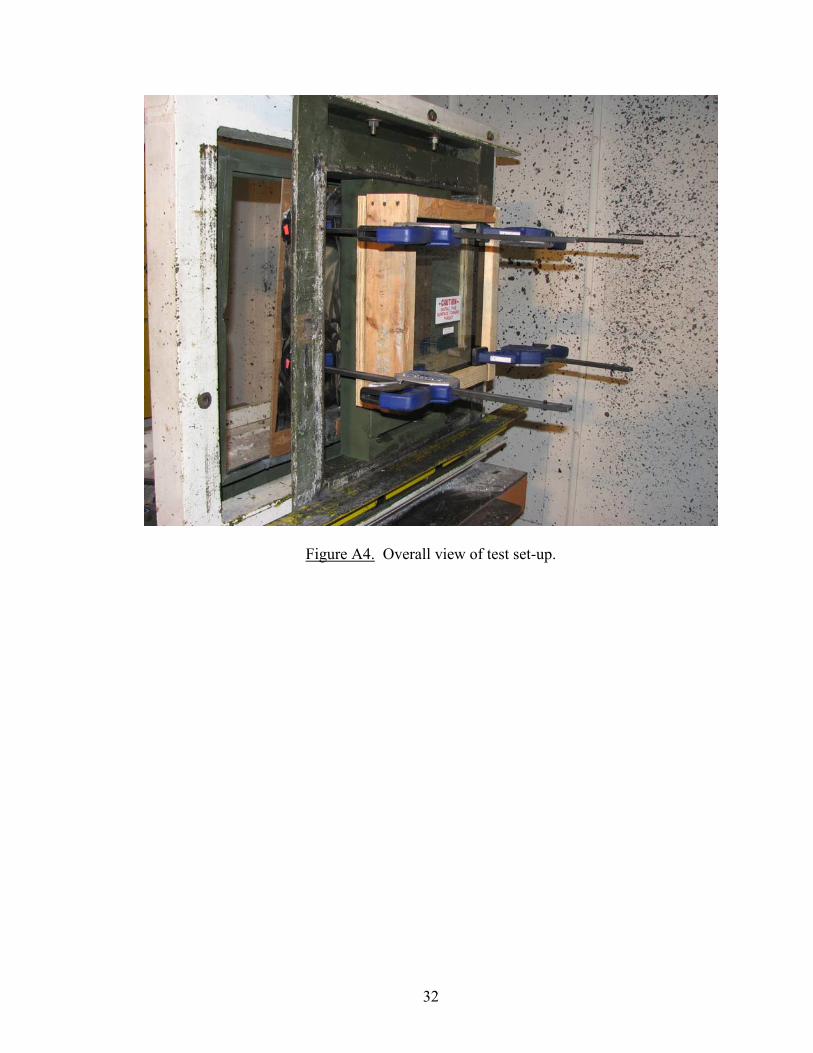
Figure A4. Overall view of test set-up.
32

33
APPENDIX B
TEST SAMPLE PICTURES
This appendix contains pictures from the ballistic testing, including both 20mm
and the multi-hit rifle pattern.

Figure B1. Rear view of TA sample tested with 20mm FSP.
34

Figure B2. Piece of TA solution on floor after 20mm FSP shot.
35

Figure B3. Front view of TA solution tested with 20mm FSP.
36

Figure B4. Front view of TA sample after 4 rifle shots in multi-hit pattern.
37

38
APPENDIX C
BALLISTIC TESTING RESULTS
This appendix gives the graphical results of the ballistic test results from each
vendor. These graphs represent probability of penetration vs. velocity.

Figu
re C
1. R
esul
ts fr
om V
endo
r A.
39

Figu
re C
2. R
esul
ts fr
om V
endo
r B.
40

Figu
re C
3. R
esul
ts fr
om V
endo
r C.
41

Figu
re C
4. R
esul
ts fr
om V
endo
r D.
42

43
APPENDIX D
LIGHT TRANSMISSION RESULTS
This appendix gives the results of the entire range of light transmission testing in
graphical form.

Figu
re D
1. L
ight
Tra
nsm
issi
on T
est R
esul
ts
44

APPENDIX E
ABET PROGRAM OUTCOMES
45

A. An ability to apply knowledge of mathematics, science, and engineering.
This investigation required the ability to apply the knowledge of mathematics, science, and engineering to analyze the accuracy and effectiveness of the testing method outlined in ATPD 2352.
B. An ability to design and conduct experiments, as well as to analyze and interpret data.
The program outcome was an analysis of the data collected and was used to measure the effectiveness of the testing method and the repeatability of the data.
C. An ability to design a system, component, or process to meet desired needs.
This program outcome was utilized in the fabrication of the test fixtures needed to complete the testing.
D. An ability to function on multi-disciplinary teams.
This program outcome was shown in that the student was required to work with mechanical and optical engineers and statisticians to complete this thesis.
E. An ability to identify, formulate, and solve engineering problems.
This skill was required to compare the results of each vendor as well as analyze the data that was collected.
F. An understanding of professional and ethical responsibility.
Due to the nature of the testing performed, professional and ethical responsibility was necessary. It is important that the testing and results are accurate in to ensure the safety of United States Soldiers.
G. An ability to communicate effectively.
This thesis, as well as the necessity to communicate with statisticians’ shows that the student has an ability to communicate effectively.
H. The broad education necessary to understand the impact of engineering solutions in a
global and societal context.
46

Ballistic testing and armored vehicle safety are especially important now as United States troops are fighting in Iraq and Afghanistan. Casualties of any sort reduce morale, and erode public confidence and support in a war or peacekeeping military effort. By decreasing the number of casualties, society may be more supportive of military operations.
I. A recognition of the need for, and an ability to engage in lifelong learning.
Further learning will be required to improve the test procedure and test method. The ballistic requirements are always changing in this environment so constant learning is necessary to keep up-to-date on current situations.
J. A knowledge of contemporary issues.
The student recognizes that there is conflict and fighting taking place all over the world. When United States Soldiers are involved in these conflicts it is important that they are well protected and as safe as possible.
K. An ability to use the techniques, skills, and modern engineering tools necessary for
engineering practice.
The student was required to use computer based analytical software to analyze the data collected during testing.
L. An ability to work professionally in both thermal and mechanical systems areas
including the design and realization of such systems.
The student was not required to complete this task for this thesis project. M. A competence in the use of computational mathematics tools and systems analysis
tools germane to the world of engineering.
The student used Maple in order to determine the probability of penetration at selected velocities.
N. A competence in experimental design, automatic data acquisition, data analysis, data
reduction, and data presentation, both orally and in the written form.
47
48
The student was required to verify the accuracy of the current testing method and statistically analyze the results acquired. The data has been presented to the employer in written form and will be published for future Army use.
O. A competence in the use of computer graphics for design communication and visualization. The student was not required to complete this task for this thesis project.
P. A knowledge of chemistry and calculus based physics with a depth in at least one of
them. A knowledge of chemistry was not required for the completion of this thesis project. A knowledge of physics was required to understand the effects of the transparent armor when struck by the projectile. It is important to understand how the material reacts to large forces.
Q. An ability to manage engineering projects including the analysis of economic factors and their impact on the design. The experiment designed took economic factors into account in the selection of transparent armor for testing. The sample size required for testing was chosen to give accurate results while maintaining a low price.
R. An ability to understand the dynamics of people both in a singular and group setting. This thesis required the student to work with engineers and management from TARDEC as well as the suppliers in both singular and group settings.
S. A competence in the analysis of inter-disciplinary mechanical/electrical/hydraulic systems. The student was not required to complete this task for this thesis project.
Top Related