


Languages
Pages
Legal

Bahrs Scrub Local Development Area Master Planning Infrastructure and Services Assessment
Project Number: 763778
31 May 2012 Prepared for Logan City Council

Bahrs Scrub Local Development Area Master Planning
Infrastructure and Services Assessment
763778 Version FINAL 31 May 2012 Commercial in Confidence Page ii
Cardno (Qld) Pty Ltd
ABN 57 051 074 992
Level 11 Green Square North Tower
515 St Paul’s Terrace
Fortitude Valley Qld 4006
Locked Bag 4006 Fortitude Valley
Queensland 4006 Australia
Telephone: 07 3369 9822
Facsimile: 07 3369 9722
International: +61 7 3369 9822
www.cardno.com.au
"© 2012 Cardno All Rights Reserved. Copyright in the whole and every part of this document belongs to
Cardno and may not be used, sold, transferred, copied or reproduced in whole or in part in any manner or
form or in or on any media to any person without the prior written consent of Cardno.”
Document Control: Infrastructure & Service Assessment
Version Date Author Reviewer
Name Initials Name Initials
1 23 February 2011 Joshua McKenzie Andy Lees
2 22 March 2011 Joshua McKenzie Andy Lees
3 23 June 2011 Joshua McKenzie Andy Lees
4 26 July 2011 Joshua McKenzie Andy Lees
5 15 August 2011 Joshua McKenzie Andy Lees
6 1 September 2011 Joshua McKenzie Andy Lees
7 1 December 2011 Joshua McKenzie Andy Lees
8 9 March 2012 Joshua Lake Andy Lees
9 27 March 2012 Joshua Lake Andy Lees
FINAL 31 May 2012 Joshua Lake JL Andy Lees

Bahrs Scrub Local Development Area Master Planning
Infrastructure and Services Assessment
763778 Version FINAL 31 May 2012 Commercial in Confidence Page iii
TABLE OF CONTENTS
GLOSSARY V
EXECUTIVE SUMMARY VI
1 INTRODUCTION 1
1.1 BACKGROUND 1
1.2 SCOPE OF WORKS 2
1.3 STUDY AREA 4
2 DESIRED STANDARDS OF SERVICE 5
2.1 WATER SUPPLY 5
2.2 SEWERAGE 6
2.3 ADDITIONAL SERVICES 6
3 EXISTING AND PROJECTED DEMANDS 7
3.1 POPULATION PROJECTIONS 7
3.2 BAHRS SCRUB YIELD SCENARIOS 7
3.3 WATER SUPPLY DEMANDS 9
4 WATER SUPPLY INFRASTRUCTURE 11
4.1 EXISITNG WATER SUPPLY SYSTEM 11
4.2 ULTIMATE WATER SUPPLY STRATEGY AND STAGING 13
4.3 WATER SUPPLY CAPITAL WORKS PROGRAM 14
5 SEWERAGE INFRASTRUCTURE 17
5.1 EXISITNG SEWERAGE SYSTEM 17
5.2 ULTIMATE SEWERAGE SYSTEM AND STAGING 18
6 ADDITIONAL SERVICES 21
6.1 POWER RETICULATION 21
6.2 GAS RETICULATION 21
6.3 TELECOMMUNICATIONS 22
7 CONCLUSIONS 23
7.1 WATER SUPPLY 23
7.2 SEWERAGE 23
7.3 ADDITIONAL SERVICES 23

Bahrs Scrub Local Development Area Master Planning
Infrastructure and Services Assessment
763778 Version FINAL 31 May 2012 Commercial in Confidence Page iv
List of Tables Table 1 Water Supply Desired Standards of Service 5
Table 2 Sewerage Desired Standards of Service 6
Table 3 Bahrs Scrub Local Development Area Population Projections (EP) 8
Table 4 Study Area Population Projections (EP) 8
Table 5 Bahrs Scrub LDA Water Demands (MDMM) ML 9
Table 6 Logan East Water Demands (MDMM) ML 9
Table 7 Bahrs Scrub LDA Sewage Loads (ADWF) ML 10
Table 8 Beenleigh Sewage Treatment Plant Loads (ADWF) ML 10
Table 9 Loganholme, Staplyton and Beenleigh Sewage Treatment Plant Loads (ADWF) ML 10
Table 10 Logan East Water Supply Storage Volume (ML) 12
Table 11 Bahrs Scrub LDA HLZ 14
Table 12 Water Supply Pipe Length Totals for Bahrs Scrub LDA (m) 15
Table 13 Variation in Pipe Length Totals for Bahrs Scrub LDA 15
Table 14 Variation in HLZ Pump Requirements Based on Yield Scenarios 15
Table 15 Capital Works Program Summary – Water Supply 15
Table 16 Sewage Treatment Plant Capacities 17
Table 17 Sewer Pipe Length Totals for Bahrs Scrub LDA 19
Table 18 Variation in internal Sewage Pump Station Requirements Based on Yield Scenarios 19
Table 19 Capital Works Program Summary – Sewerage Supply 19
Appendices Appendix A Figures
Appendix B Development Yield Calculations
Appendix C Water and Sewerage Capital Cost Estimates
Appendix D Additional Services – Contact Details
Appendix E Additional Services – Supporting Information
Appendix F Bahrs Scrub to Beenleigh Wastewater Preliminary Design (Logan Water Alliance)

Bahrs Scrub Local Development Area Master Planning
Infrastructure and Services Assessment
763778 Version FINAL 31 May 2012 Commercial in Confidence Page v
Glossary
ADWF Average Dry Weather Flow
AD Average Day
AHD Australian Height Datum
EP Equivalent Persons
ET Equivalent Tenements
ha Hectare
HLZ High Level Zone
IDM Infrastructure Demand Model
kW Kilowatt
LDA Local Development Area
L/ET/d Litre per ET per day
L/s Litres per second
LCC Logan City Council
LWA Logan Water Alliance
m Metre
MDMM Mean Day Maximum Month
MD Maximum Day
MH Maximum Hour
ML Mega litre
mm Millimetre
m/s Metre per second
PDWF Peak Dry Weather Flow
PIP Priority Infrastructure Plan
PRV Pressure Reducing Valve
PVC Polyvinyl chloride
PWWF Peak Wet Weather Flow
RFI Request for Information
RL Reduced Level
STP Sewage Treatment Plant
WSA Water Supply Area
WSAA Water Services Association of Australia
Bahrs Scrub Local Development Area Master Planning
Infrastructure and Services Assessment
763778 Version FINAL 31 May 2012 Commercial in Confidence Page vi
EXECUTIVE SUMMARY
The Bahrs Scrub Local Development Area (LDA) has been identified in the South East Queensland Regional Plan
2009-2031 as an area that could potentially help meet dwelling targets for the Logan City Local Government area
and greater South East Queensland region.
To assist in realising this potential growth, and provide a regulatory mechanism to facilitate structured development
of the area, Logan City Council are undertaking a robust planning process which will ultimately take effect as an
amendment to the existing Logan City Planning Scheme.
This planning process has initially been broken down into two distinct stages aimed at adequately assessing
opportunities and constraints while providing key stakeholders a chance to have input into the process.
Cardno were engaged to complete an Infrastructure and Services assessment for the Bahrs Scrub LDA which
formed part of Stage 2 of the investigation.
The aim of this assessment is to provide a detailed understanding of the water, sewer, gas, telecommunications
and power issues for the LDA to identify potential servicing options and constraints as well as develop indicative
internal infrastructure delivery costs.
The outcome of this assessment will provide technical input to inform the preparation of the Planning Study for the
LDA and also assist in guiding further detailed investigation of external trunk infrastructure which will enable
infrastructure agreements with relevant authorities to be developed.
The Bahrs Scrub Net Developable Area Plan (developed as part of the Stage 1 studies) was adopted by Logan
City Council on 15 November 2011 and has been used to determine population numbers for the site with the plan
identifying a range of dwelling units that could be realised under each scenario.
BULK WATER SUPPLY
Bulk supply to the site will be available via connection to the trunk mains fed from the Wuraga Road reservoirs. The
Logan Water Alliance – Logan East Water Servicing Plan – Task 90-11-28 – April 2012 planning report identifies
strategic bulk water supply options to ensure the long term supply to the Wuraga Road reservoir.
Final external infrastructure requirements will be dependent on the servicing option identified and approved by
Allconnex Water.
RESERVOIR STORAGE
The Logan East Water Supply area (WSA) is serviced by three reservoirs at two sites, Mt Warren 35.5 ML and
Wuraga Road 13.5ML. The existing storages are sufficient to service the Logan East WSA through to the ultimate
demands. Reservoir storage from the Bahrs Scrub LDA will be provided by the 13.5ML Wuraga Road reservoir.

Bahrs Scrub Local Development Area Master Planning
Infrastructure and Services Assessment
763778 Version FINAL 31 May 2012 Commercial in Confidence Page vii
INTERNAL WATER SUPPLY INFRASTRUCTURE
With consideration to the topography of the site it has been identified that a dedicated High level Zone (HLZ) will be
required to service land that is nominally above 55m AHD and below 75m AHD along the southern and western
fringes of the LDA. It is our understanding; Council will not support residential development above the 75m AHD
level as the Desired Standards of Service cannot be guaranteed.
The proposed HLZ will be sized in accordance with the final yield scenario adopted with consideration been given
to water quality issues which could arise if the size of the zone was reduced.
With no detailed staging plan being proposed to date, an opportunity may exist to develop the lower areas initially
and stage the development of the HLZ with dedicated boosters, these would be installed for initial stages until a
reservoir and dedicated HLZ is constructed.
The remainder of the development will be serviced by an internal network of distribution mains up to 450mm in
diameter.
Confirmation of the final internal reticulation design, and HLZ parameters, will be subject to further detailed
investigation as the development assessment process progresses.
EXTERNAL WATER SUPPLY INFRASTRUCTURE
Final external infrastructure requirements will be dependent on the servicing option approved by Allconnex Water.
The South East Queensland Infrastructure Plan and Program 2010-2031 provides information on regional water
supply in particular the Wyaralong Water Treatment Plant and Cedar Grove Interconnector which will enhance
overall bulk supplies for the region.
SEWAGE TREATMENT
The system as a whole has sufficient capacity to treat flows for an extended period into the future however the
optimum transportation of sewage and timing of capital investment is a key strategic decision that is required to be
made by Allconnex Water.
Theoretical flows overstate actual flows for the Beenleigh and Staplyton Catchment areas where actual flows of 11
ML/d compare with 15 ML/d, however Beenleigh STP does require an upgrade to ensure ongoing compliance at
the current load.
It is understood that Allconnex Water are likely to adopt a strategy soon centred on the centralising treatment at
Beenleigh and Loganholme STP’s with either option providing a sound solution to servicing growth in the
catchment.
Bahrs Scrub Local Development Area Master Planning
Infrastructure and Services Assessment
763778 Version FINAL 31 May 2012 Commercial in Confidence Page viii
SEWERAGE INFRASTRUCTURE
External sewerage infrastructure augmentation requirements and optimum alignments have been identified by the
Logan Water Alliance (LWA) in Bahrs Scrub to Beenleigh Wastewater Preliminary Design Phase 1t (LWA, 2012)
and adopted by Allconnex Water.
In addition a new trunk main external to the LDA will likely be required to connect Precinct 4 to the existing sewage
pump station BE34.
Internal sewerage infrastructure will be dependent on the yield scenario adopted however will be centred around a
trunk main network with mains up to 675mm diameter and will include one minor pump station to service loads from
Precinct 2.
ADDITIONAL SERVICES
This Infrastructure and Services Assessment also provides information on the existing and potential future
networks relating to power reticulation, gas reticulation and telecommunications within and surrounding the
proposed development of Bahrs Scrub.
To assist the respective agencies in assessing the impacts on the existing and future infrastructure networks as a
result of the Bahrs Scrub development population scenarios in line with those presented in Table 3 were provided
to assist in quantifying requirements.
Limited detailed information is currently available however advice received from responsible agencies indicates that
the area can be adequately serviced by gas, telecommunications and power infrastructure.

Bahrs Scrub Local Development Area Master Planning
Infrastructure and Services Assessment
763778 Version FINAL 31 May 2012
Commercial in Confidence Page 1
1 INTRODUCTION
1.1 BACKGROUND
The Bahrs Scrub Local Development Area (LDA) has been identified in the South East Queensland Regional Plan
2009-2031 as an area that could potentially help meet dwelling targets for the Logan City Local Government area
and greater South East Queensland region.
To assist in realising this potential growth, and provide a regulatory mechanism to facilitate structured development
of the area, Logan City Council are undertaking a robust planning process which will ultimately take effect as an
amendment to the existing Logan City Planning Scheme.
This planning process has initially been broken down into two distinct stages aimed at adequately assessing
opportunities and constraints while providing key stakeholders a chance to have input into the process.
Stage 1 involved an initial constraints analysis that identified and considered key issues such as cultural heritage,
contaminated land, hydraulic assessment, landscape and visual amenity, ecological assessment and bushfire risk
assessment.
The outcome of this stage was a Draft Planning Study Report which summarised the findings of Stage 1 and
included a Net Developable Area Plan with potential yield scenarios which was used to progress the Stage 2
investigations.
The final Bahrs Scrub Net Developable Area Plan was adopted by Logan City Council on the 15 November 2011
and has been used as the basis for this investigation.
Stage 2 builds on the work carried out as part of Stage 1 with detailed technical studies undertaken, these
included:
Infrastructure and services assessment;
Land Use options assessment;
Transport and Acoustics assessment;
Social and Community assessment; and a
Housing needs analysis.
At the completion of Stage 2 Logan City Council will release a draft land use plan with supporting technical
information which will be used for public consultation as the basis for making amendments to the existing Planning
Scheme, giving statutory effect to the plan.
Stage 2 works will also assist in identifying a potential sequencing strategy for the LDA and highlight opportunities
for common infrastructure servicing corridors to be established to accommodate new infrastructure however
detailed infrastructure requirements will be addressed in future as part of detailed design stages.
For further information on the regulatory and planning process, and outcomes of Stage 1 of the planning process,
refer to the “Bahrs Scrub- Draft Planning Study- Logan City Council- November 2010”.

Bahrs Scrub Local Development Area Master Planning
Infrastructure and Services Assessment
763778 Version FINAL 31 May 2012
Commercial in Confidence Page 2
1.2 SCOPE OF WORKS
Cardno were engaged to complete the Infrastructure and Services assessment for the Bahrs Scrub LDA.
The aim of this assessment is to provide an understanding of the water, sewer, gas, telecommunications and
power issues for the LDA to identify potential servicing options and constraints as well as develop indicative
internal infrastructure delivery costs.
Further detailed investigation will be required to confirm actual requirements as the LDA progresses through the
subsequent stages of the development approval process.
The outcome of this assessment will provide technical input to inform the preparation of the Planning Study for the
LDA and also assist in guiding further detailed investigation of external trunk infrastructure which will enable
infrastructure agreements with relevant authorities to be developed.
While internal staging has not been included, for the purposes of sizing trunk infrastructure, demands from the LDA
have been interpolated based on initial demands coming online between 2012 and 2016 and the area fully
developed within 15 years (2031). This assumption has been made to align with current planning horizons and
makes a conservative allowance for 25% of Bahrs Scrub being constructed through to the 2016 planning horizon
from 2012.
Figure A-4 and Figure A-6, Appendix A provide details on the extent of the primary investigation for the Bahrs
Scrub LDA Master Planning Infrastructure and services assessment.
1.2.1 WATER AND SEWERAGE SERVICES ASSESSMENT
While additional services have been considered in this report, due to the regional nature of power,
telecommunications and gas supplies, the primary focus has been on the water supply and sewerage infrastructure
required to facilitate development.
The Bahrs Scrub LDA is currently within the Logan City Council Local Government Area however prior to local
government amalgamations in March 2008 the study area was formally under the jurisdiction of Gold Coast City
Council. As a result Bahrs Scrub LDA is still captured by relevant infrastructure charges and planning scheme
policy provisions until such time as the Logan City Council Planning Scheme is amended.
On 1 July 2010 Allconnex Water become the Service Water Provider for the Gold Coast, Logan City and Redlands
Local Government areas as part of water reform initiatives in South East Queensland.
With the recent changes to the service provider structure arrangement a number of water and sewerage planning
studies have been undertaken by the respective entities, past and present including Gold Coast City Council,
Logan City Council (Logan Water Alliance) and Allconnex Water with a number of strategies being developed and
modified in light of changing circumstances and these organisational differences.
In terms of this investigation the South East Queensland Water (Distribution and Retail Restructuring) Act 2009
requires Allconnex Water to prepare a NetServ Plan by July 2013 which will oversee Infrastructure delivery and
facilitate charges independent of Council Planning Schemes.
Bahrs Scrub Local Development Area Master Planning
Infrastructure and Services Assessment
763778 Version FINAL 31 May 2012
Commercial in Confidence Page 3
As Allconnex Water is the current service provider, they will have final determination of the infrastructure
requirements for the water supply and sewerage services. This commission has focussed on reviewing recent
planning to assess the impacts on the developable area against a range of yield scenarios (as agreed with Logan
City Council).
This study has been completed in conjunction with the Allconnex Water Development Assessment (DASS) Team
so should be considered as a sound basis upon which future infrastructure plans are based, with the primary scope
incorporating:
Review of the latest water supply and sewerage planning strategies for the Bahrs Scrub LDA including
relevant hydraulic models;
Assess impacts of the various yield scenarios on planning outcomes and infrastructure requirements;
Identify internal infrastructure servicing option based on Allconnex Water’s Desired Standards of Service;
Review impacts on external infrastructure servicing strategies and identify potential servicing options for
further development (as agreed with the DASS Team); and
Develop indicative capital works requirements and associated cost estimates for the internal options.
The South East Queensland Infrastructure Plan and Program 2010-2031 was reviewed as part of this commission,
it was found to include limited relevant infrastructure which could impact on the Bahrs Scrub LDA development with
the exception of the regional water supply strategy initiatives that will see the delivery of the Wyaralong Water
Treatment Plant and associated Cedar Grove Interconnector Water Pipeline.
Note recycled water has been excluded from this investigation as a result of previous studies carried out by
Allconnex Water and Logan City Council, these studies identified, large scale dual reticulation was not feasible in
meeting water supply demands in this area.
Information for this assessment has been sourced from various locations however the following documents, and
supporting hydraulic models provided, have been the primary basis for water supply and sewerage assessment:
Bahrs Scrub Local Development Area: Planning Study Summary of Stage 1 Technical Studies – October 2010
Logan Water Alliance – Logan East Water Servicing Plan – Task 90-11-28 – April 2012
Logan Water Alliance – Whole of City Water Supply Trunk Model – Task:90-10-21 – July 2010
Logan Water Alliance – Review of Desired Standards of Service – Task:90-10-29 – September 2010
Logan Water Alliance – Water Distribution Strategy – Task:90-10-73 – October 2010 (PIPWATER 2010)
Logan Water Alliance – Loganholme, Beenleigh and Staplyton Wastewater Strategy –Task:90-10-84 –
November 2010 (PIPSEWER 2010)
Logan Water Alliance – Bahrs Scrub to Beenleigh Wastewater Preliminary Design Phase 1 –Task:90-11-12 –
January 2012
Allconnex Water – Logan District Hydraulic Network Model - Logan_East_PIP_V30
Logan City Council – Draft Infrastructure Demand Model (IDM) – Version 5, 2011
Bahrs Scrub Local Development Area Master Planning
Infrastructure and Services Assessment
763778 Version FINAL 31 May 2012
Commercial in Confidence Page 4
1.2.2 ADDITIONAL SERVICES ASSESSMENT
This Infrastructure and Services Assessment also provides information on the existing and potential future
networks relating to power reticulation, gas reticulation and telecommunications within and surrounding the
proposed development of Bahrs Scrub.
To assist the respective agencies in assessing the impacts on the existing and future infrastructure networks as a
result of the Bahrs Scrub development population scenarios in line with those presented in Table 3 were provided
to assist in quantifying requirements.
Contact details of agency representatives contacted during this investigation are contained in Appendix D.
1.3 STUDY AREA
The Bahrs Scrub LDA has an area of some 800 ha and is located approximately 2km south-west of Beenleigh,
within the Logan City Local Government Area.
At present the LDA is a predominately rural residential area currently comprising some 375 properties with mixed
ownership, however due to its proximity to major centres and infrastructure the area has been identified for future
growth.
Studies carried out during Stage 1 provided further detail of the characteristics of the LDA.
From a water supply perspective the area has been included in the “Logan East” water supply planning area which
is bounded by “Logan North”, “Logan South” and Allconnex Water Gold Coast District.
While adjacent supply areas were investigated and considered the primary focus has concentrated on the existing
Logan East supply area.
In relation to sewerage the site is located within the Beenleigh Sewage Treatment Plant catchment however
strategic planning work carried out has investigated opportunities for intra catchment transfers so the study also
considered Loganholme and Staplyton Catchment areas to be consistent with current planning.
The location of the LDA is provided in Figure A-1, Appendix A with the current development plan provided in Figure
A-2, Appendix A.
Bahrs Scrub Local Development Area Master Planning
Infrastructure and Services Assessment
763778 Version FINAL 31 May 2012
Commercial in Confidence Page 5
2 DESIRED STANDARDS OF SERVICE
2.1 WATER SUPPLY
Allconnex water is the water service provider for the proposed Bahrs Scrub LDA and they provided the latest
desired Standards of Service in the document “Review of Desired Standards of Service 2010 – Task Number: 90-
10-29 – September 2010”.
In regard to a bulk water supply, this relates to the capacity of trunk infrastructure (considered to be >250mm
diameter mains) to deliver and store adequate supply, while distribution and reticulation networks are sized to
ensure adequate flows and pressures to satisfy peak demands and fire flow requirements.
Table 1 Water Supply Desired Standards of Service
Parameter Criteria
Water Supply
Average Day Demand 260L/EP/day (based on 230 L/EP/d + allowance for leakage/losses
(30L/EP/day)
Mean Day Maximum Month
(MDMM)/Average Day(AD) 1.4 (Residential Detached)
Max Day(MD) /Average Day (AD) 1.7 (Residential Detached)
Max Hour (MH) 3.8 (Residential Detached)
Trunk Main/Supply Capacity MDMM over 20hours
Reservoir Storage
3 (MD-MDMM) + (Greater of emergency storage/fire fighting storage)
Emergency storage = the greater of 4hr MDMM demand in zone or 0.5ML
whichever is greater
Fire Fighting
System pressure 12 m minimum at property boundary
Fire flow Residential – 15l/s for 2 hrs.
Commercial & Industrial – 30 l/s for 4 hrs.
Background demand 2/3 MH (as per DERM requirements)
Reservoir level Minimum Operating Level (MOL)
Number of fires <5000 EP – single fire for residential or industrial / commercial
>5000 EP – simultaneous single residential fire plus single commercial /
industrial fire for sizing trunk mains
As discussed further in Section 4, whilst considered, bulk water treatment and supply infrastructure in the study
area is the responsibility of State Government owned bodies Link water and SEQ Water.
Bahrs Scrub Local Development Area Master Planning
Infrastructure and Services Assessment
763778 Version FINAL 31 May 2012
Commercial in Confidence Page 6
2.2 SEWERAGE
Tabulated below, the desired Standards of Service for Sewerage
Table 2 Sewerage Desired Standards of Service
Parameter Criteria
Sewerage
Average Dry Weather Flow (ADWF) 200 L/EP/day
Peak Wet Weather Flow 1300 L/EP/Day (Residential)
These DSS formed the basis for the sewerage infrastructure investigation.
Additional pump station and rising main design considerations will be developed once staging is known, for the
purposes of this strategic investigation internal reticulation and external impacts of yield scenarios was considered.
Sewage Treatment Plant performance for the purposes of this study has been based on hydraulic capacity i.e.
ADWF as peak flow and treatment process requirements would be developed around these fundamental planning
assumptions.
Similarly pump stations would be designed based on ADWF, PDWF and PWWF standards.
2.3 ADDITIONAL SERVICES
Due to the nature of relevant legislation infrastructure provided by state government agencies and government
owned corporations (such as Energex) are effectively outside the scope of the Logan Planning scheme (as will
water and sewerage post 2013).
Despite this, for a LDA Plan to be endorsed by the relevant minister, it will be required to demonstrate that an
integrated approach that adequately considers all infrastructure requirements has been carried out so therefore
these matters have been incorporated into this assessment.
Advice received from responsible agencies forms the basis of this investigation in this regard.

Bahrs Scrub Local Development Area Master Planning
Infrastructure and Services Assessment
763778 Version FINAL 31 May 2012
Commercial in Confidence Page 7
3 EXISTING AND PROJECTED DEMANDS
3.1 POPULATION PROJECTIONS
The population projections and subsequent demands have been sourced from the latest Infrastructure Demand
Model (IDM) endorsed by Logan City Council and provided water and sewerage strategic planning reports and
hydraulic models issued by Allconnex Water.
Yield scenarios for the Bahrs Scrub LDA have been developed from the Bahrs Scrub Net Developable Area Plan
developed from stage 1 studies and approved by Logan City Council on the 15 November 2011. This plan was
used to quantify the impacts that alternate development yields may have on infrastructure servicing requirements.
Apart from the revised Bahrs Scrub yields all remaining demands have been assumed to remain as per the IDM
and current planning.
3.2 BAHRS SCRUB YIELD SCENARIOS
The Bahrs Scrub LDA is located within the Logan East water supply area, this area is currently under the planning
control of Allconnex Water – Logan Division.
The Bahrs Scrub Net Developable Area Plan (developed as part of the Stage 1 studies) and associated dwelling
yield scenarios has been used to determine population numbers for the site with the plan identifying a range of
dwelling units that could be realised under each scenario.
For the purposes of converting dwelling units or Equivalent Tenements (ET) to Equivalent Persons (EP) the Logan
Water Alliance Sewer Strategy identified a ratio 2.8 EP/ET while the Gold Coast Planning Scheme policy utilised a
ratio of 3.2 EP/ET. For the purposes of this assessment a ratio of 3 EP/ET has been adopted and considered to be
a reasonable assumption.
The yield scenarios were developed by Logan City Council – Strategy and Planning and agreed upon to be the
basis for this planning study. From the water supply and sewerage hydraulic models issued by the Logan Water
Alliance (LWA) we could determine the population projections as a comparison to the yield scenarios.
Table 3 below details the scenario Equivalent Populations and the Priority Infrastructure Plans (PIP) populations
from the hydraulic models issued by the LWA.
Bahrs Scrub Local Development Area Master Planning
Infrastructure and Services Assessment
763778 Version FINAL 31 May 2012
Commercial in Confidence Page 8
Table 3 Bahrs Scrub Local Development Area Population Projections (EP)
LDA EP Planning Horizon
Scenario Yield 2011 2016 2021 2026 2031 2051
Scenario 1 Low Yield 0 2,692 5,384 8,075 10,767 10,767
Scenario 2 Medium Yield 0 3,259 6,517 9,776 13,034 13,034
Scenario 3 High Yield 0 3,825 7,650 11,475 15,300 15,300
LWA Population Projections
Current PIP/IDM
Assumptions (Sewer) - 586 1,052 1,254 1,254 9,167
Current PIP/IDM
Assumptions (Water) - 1,512 1,979 2,180 2,180 9,518
Table 4 Study Area Population Projections (EP)
Study Area EP 2011 2016 2021 2026 2031 2051
Current PIP/IDM
Assumptions (Sewer) 51,633 67,813 73,342 76,133 78,314
94,472
(102,136)
(Ult.)
Current PIP/IDM
Assumptions (Water) 61,770 77,685 83,206 85,981 88,260 104,090
No staging plan has been developed at the current time so internal infrastructure has been sized based on ultimate
demand requirements.
While internal staging has not been included, for the purposes of sizing trunk infrastructure, demands from the LDA
have been interpolated based on initial demands coming online between 2012 and 2016 and the area fully
developed within 15 years. This assumption has been made to align with current planning horizons and makes a
conservative allowance for 25% of Bahrs Scrub being constructed through to the 2016 planning horizon from 2012.
Detailed staging will be developed during further stages of the investigation as an outcome of this work.
Current planning (undertaken by the LWA) was based on an ultimate population similar to the Low Yield Scenario
however the proposed timing of growth in current planning is out of synch with the yield scenarios adopted for this
investigation with current forecast demands essentially not coming on line until after 2031.
While growth in the Bahrs Scrub LDA has been pushed out in current planning there is significant growth in the
catchment area as a whole specifically in the north eastern portion of the Logan east study area. Including the
additional population of 5,000EP that will be realised from Bahrs Scrub (Low yield scenario) the overall Logan East
area is forecast to experience an increase of 25,000EP over the 10 years to 2021.
This increase of approximately 40% on the 2011 population of 61,000 EP does not include anticipated growth in
Logan South and additional green field developments within the broader Logan City Council area.
Bahrs Scrub Local Development Area Master Planning
Infrastructure and Services Assessment
763778 Version FINAL 31 May 2012
Commercial in Confidence Page 9
As the IDM is developed from population projections generally on a local Government area scale the bringing
forward of Bahrs scrub demands could potentially delay growth in other parts of the study area however this aspect
will require further consideration as actual growth is observed.
Comparative EPs from the Hydraulic Water Model and Strategic Sewer Report used in this assessment, and
projected populations from the 3 development yield scenarios are provided in Table 3 with development yield
calculations provided in Appendix B.
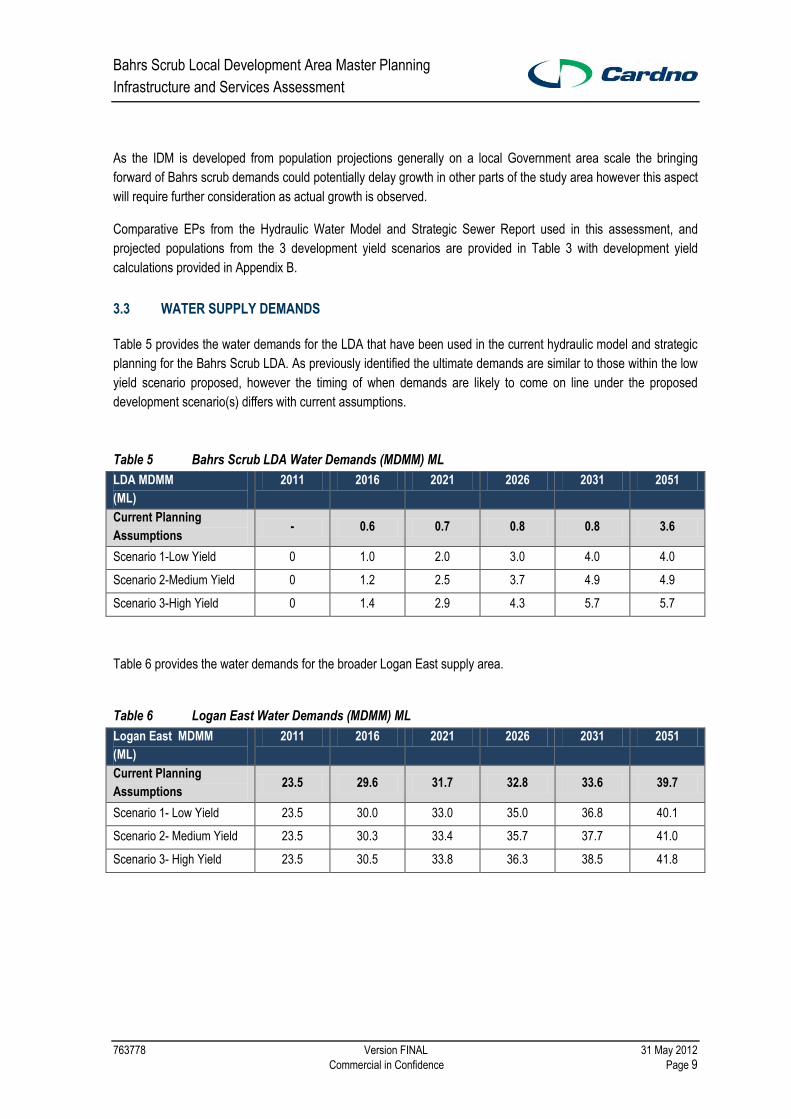
3.3 WATER SUPPLY DEMANDS
Table 5 provides the water demands for the LDA that have been used in the current hydraulic model and strategic
planning for the Bahrs Scrub LDA. As previously identified the ultimate demands are similar to those within the low
yield scenario proposed, however the timing of when demands are likely to come on line under the proposed
development scenario(s) differs with current assumptions.
Table 5 Bahrs Scrub LDA Water Demands (MDMM) ML
LDA MDMM
(ML)
2011 2016 2021 2026 2031 2051
Current Planning
Assumptions - 0.6 0.7 0.8 0.8 3.6
Scenario 1-Low Yield 0 1.0 2.0 3.0 4.0 4.0
Scenario 2-Medium Yield 0 1.2 2.5 3.7 4.9 4.9
Scenario 3-High Yield 0 1.4 2.9 4.3 5.7 5.7
Table 6 provides the water demands for the broader Logan East supply area.
Table 6 Logan East Water Demands (MDMM) ML
Logan East MDMM
(ML)
2011 2016 2021 2026 2031 2051
Current Planning
Assumptions 23.5 29.6 31.7 32.8 33.6 39.7
Scenario 1- Low Yield 23.5 30.0 33.0 35.0 36.8 40.1
Scenario 2- Medium Yield 23.5 30.3 33.4 35.7 37.7 41.0
Scenario 3- High Yield 23.5 30.5 33.8 36.3 38.5 41.8
Bahrs Scrub Local Development Area Master Planning
Infrastructure and Services Assessment
763778 Version FINAL 31 May 2012
Commercial in Confidence Page 10
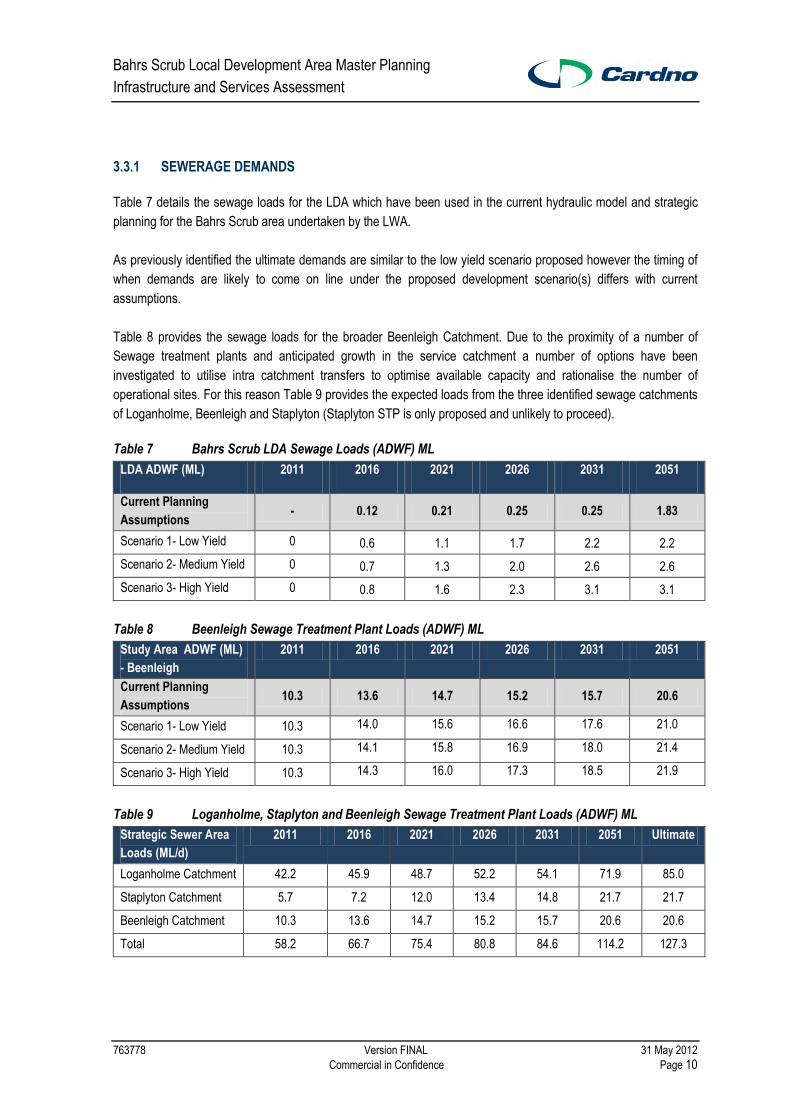
3.3.1 SEWERAGE DEMANDS
Table 7 details the sewage loads for the LDA which have been used in the current hydraulic model and strategic
planning for the Bahrs Scrub area undertaken by the LWA.
As previously identified the ultimate demands are similar to the low yield scenario proposed however the timing of
when demands are likely to come on line under the proposed development scenario(s) differs with current
assumptions.
Table 8 provides the sewage loads for the broader Beenleigh Catchment. Due to the proximity of a number of
Sewage treatment plants and anticipated growth in the service catchment a number of options have been
investigated to utilise intra catchment transfers to optimise available capacity and rationalise the number of
operational sites. For this reason Table 9 provides the expected loads from the three identified sewage catchments
of Loganholme, Beenleigh and Staplyton (Staplyton STP is only proposed and unlikely to proceed).
Table 7 Bahrs Scrub LDA Sewage Loads (ADWF) ML
LDA ADWF (ML) 2011 2016 2021 2026 2031 2051
Current Planning
Assumptions - 0.12 0.21 0.25 0.25 1.83
Scenario 1- Low Yield 0 0.6 1.1 1.7 2.2 2.2
Scenario 2- Medium Yield 0 0.7 1.3 2.0 2.6 2.6
Scenario 3- High Yield 0 0.8 1.6 2.3 3.1 3.1
Table 8 Beenleigh Sewage Treatment Plant Loads (ADWF) ML
Study Area ADWF (ML)
- Beenleigh
2011 2016 2021 2026 2031 2051
Current Planning
Assumptions 10.3 13.6 14.7 15.2 15.7 20.6
Scenario 1- Low Yield 10.3 14.0 15.6 16.6 17.6 21.0
Scenario 2- Medium Yield 10.3 14.1 15.8 16.9 18.0 21.4
Scenario 3- High Yield 10.3 14.3 16.0 17.3 18.5 21.9
Table 9 Loganholme, Staplyton and Beenleigh Sewage Treatment Plant Loads (ADWF) ML
Strategic Sewer Area
Loads (ML/d)
2011 2016 2021 2026 2031 2051 Ultimate
Loganholme Catchment 42.2 45.9 48.7 52.2 54.1 71.9 85.0
Staplyton Catchment 5.7 7.2 12.0 13.4 14.8 21.7 21.7
Beenleigh Catchment 10.3 13.6 14.7 15.2 15.7 20.6 20.6
Total 58.2 66.7 75.4 80.8 84.6 114.2 127.3

Bahrs Scrub Local Development Area Master Planning
Infrastructure and Services Assessment
763778 Version FINAL 31 May 2012
Commercial in Confidence Page 11
4 WATER SUPPLY INFRASTRUCTURE
4.1 EXISITNG WATER SUPPLY SYSTEM
4.1.1 CATCHMENT OVERVIEW
SUPPLY ARRANGEMENT
The Logan East Water Supply area (WSA) is currently supplied from a nominal 30ML/d allowance from the
Allconnex Water - Gold Coast district, this supply is from the Molendinar Water Treatment Plant via the Stanmore
Road pump station (Capacity 400L/s). An additional connection to the north, the Logan River pump station,
currently inactive, is also available for supply. These two supply areas have historically been under the control of
Logan City Council (Logan North) and Gold Coast City Council (Logan East) as a result the current boundaries
appear to be a carryover from previous institutional arrangements.
The Logan East WSA contains two primary supply zones namely Mt Warren and Wuraga Road, within these zones
are three high level zones and a number of localised Demand Management Areas (DMA’s).
RESERVOIR STORAGE
The existing Wuraga Road zone is serviced by a 13.5 ML reservoir while the Mt Warren Zone currently has a total
capacity of 32 ML made up of two reservoirs; 20ML and 12 ML, located on the same site. Total storage within the
Logan East WSA is 45.5ML
All three of these reservoirs have a common Bottom Water Level (BWL) of 87m AHD.
EXTERNAL TRUNK MAIN INFRASTRUCTURE
A current network of large diameter (600 mm) trunk mains supply the Wuraga Road and Mt Warren reservoirs from
the Stanmore Road pump station and continue to the Logan River pump station. Supply from the Wuraga Road
and Mt warren to the reticulation network is via network of trunk mains ranging in diameters from 450 mm to 300
mm. Figure A4; Appendix A provides an overview of the existing water supply infrastructure servicing Logan East
WSA.
In addition the Southern Regional Water Pipeline (SRWP) runs past the southern side of the LDA site and is owned
and operated by Linkwater.
4.1.2 CAPACITY OF EXISTING SYSTEM
Allconnex Water has identified a number of primary drivers for water supply planning including:
Ensure appropriate level of flexibility and redundancy in the network;
Ensure water turnover (prevent water quality issues);
Ensure Regional water supply is directed to reservoirs;
Minimise long term energy requirements; and
Minimise mixing of water sources and disinfection methods.
These principles have been considered in carrying out this investigation.

Bahrs Scrub Local Development Area Master Planning
Infrastructure and Services Assessment
763778 Version FINAL 31 May 2012
Commercial in Confidence Page 12
BULK WATER SUPPLY
Currently the Logan East WSA is supplied via a connection to the Gold Coast water supply network, via the
Stanmore Road pump station. This supply has a nominal capacity of 30 ML/d. Advice from Allconnex Water
confirmed the current pumping arrangement has a capacity of 400L/s which equates to a Mean Day Maximum
Month (MDMM) supply of 28.8 ML over 20 hours.
Allconnex Water and the Logan Water Alliance (LWA) have identified that due to growth in the Logan East WSA
the existing bulk water supply would be near capacity in the immediate future. To address this short fall in supply
the LWA has undertaken a review of the external bulk water supply arrangements and provided advice to
Allconnex Water in regard to the ultimate servicing of the Logan East WSA.
At the time of writing the technical document, Logan Water Alliance – Logan East Water Servicing Plan – Task 90-
11-28 – April 2012 was being considered by Allconnex Water. This report identified numerous servicing options to
ensure the long term supply of water to the Wuraga Road and Mt Warren reservoirs in the Logan East WSA. Final
external infrastructure requirements will be dependent on the servicing option identified and approved by Allconnex
Water.
RESERVOIR STORAGE
Review of planning assumptions and the hydraulic model suggests that with considered establishment and
reconfiguration of the existing supply zone arrangement the existing storages are sufficient to service the Logan
East WSA through to the ultimate demands.
Table 10 provides an overview of existing and forecast water storage requirements and demonstrates that there is
existing storage capacity available to service the Logan East WSA through to the ultimate planning horizon where
minor additional storage augmentations would be required.
Table 10 Logan East Water Supply Storage Volume (ML)
Planning Horizons
2011 2016 2021 2026 2031 2051
Existing Storage Available (ML) 45.5 45.5 45.5 45.5 45.5 45.5
Total Storage Required Logan East
(Current Planning) 26 33 35 36 38 44
Total Storage - Scenario 1 26 34 37 40 42 47
Total Storage - Scenario 2 26 34 38 40 43 48
Total Storage - Scenario 3 26 34 38 41 44 50
From investigation and analyses the existing storages, Wuraga Road and Mt Warren reservoirs are sufficient to
service the Logan East WSA through to the ultimate horizon with minor additional storage potentially required in
2051 depending on the final yield scenario adopted.
Due to the proximity to the Bahrs Scrub LDA the Wuraga Road reservoir will provide the primary storage and
pressures to the LDA.

Bahrs Scrub Local Development Area Master Planning
Infrastructure and Services Assessment
763778 Version FINAL 31 May 2012
Commercial in Confidence Page 13
4.2 ULTIMATE WATER SUPPLY STRATEGY AND STAGING
As discussed in Section 4.1, minimal capital intensive augmentations to the existing network are anticipated to
service the Bahrs Scrub LDA from a bulk supply perspective and as such the majority of capital works required will
relate to internal infrastructure.
The Allconnex Water – Logan District hydraulic network model developed in the H20MAP Water software
(Logan_East_PIP_V30) was issued to Cardno to carry out a review of the external and internal infrastructure
requirements to service the Bahrs Scrub LDA
With consideration to the topography of the site it has been identified that a dedicated High level Zone (HLZ) will be
required to service land that is nominally above 55m AHD and below 75m AHD. The extent of the HLZ is influenced
not only by the elevation of the properties, but also by hydraulic characteristics of the area (system demand and
distance from the reservoir. This HLZ identified in this study is based on the development layout provided (detailed
in Figure A2). Changes to the layout, composition of the land uses, etc. would require further analysis as it may
impact the extent of the HLZ.
The adopted HLZ includes land contained within precincts 1, 2, 3 and 4. As a general rule, Council will not support
residential development above the 75m AHD level as the desired standards of service cannot be guaranteed.
Should isolated areas be identified that cannot reasonably serviced by the HLZ the option of private booster
systems under a body corporate structure could be investigated.
Table 11 details the population to be serviced by the HLZ under the 3 yield scenarios. To accommodate demand
and fire fighting requirements a reservoir for the HLZ is required. Too adequately service the HLZ the proposed
reservoir would need to be situated at an elevation of approximately 105m AHD. The reservoir will have a nominal
Top Water Level (TWL) of 115m AHD, Bottom Water Level (BWL) of 109m AHD. Consideration should be given to
reservoir sizing due to water quality issues which could arise if the size of the zone was reduced. Two booster
pumps have also been identified as being necessary to service the HLZ. The exact location and operation of these
boosters will need to be determined during the detailed planning stage after finalisation of the local development
master plan by the Council. Council will also consider sequencing development within the HLZ to ensure that the
LLZ is developed first before bringing forward the need for a HLZ reservoir and booster pumps.
Figure A-3, Appendix A provides an overview of the distribution infrastructure proposed for the Bahrs Scrub LDA.
For the distribution network infrastructure the three yield scenarios have limited impact on the overall infrastructure
needs due to overriding fire flow Standards of Service level requirements however impacts are detailed in Section
4.3.
Confirmation of the final internal reticulation design, and HLZ parameters, will be subject to further detailed
investigation once the development assessment process progresses.
Bahrs Scrub Local Development Area Master Planning
Infrastructure and Services Assessment
763778 Version FINAL 31 May 2012
Commercial in Confidence Page 14
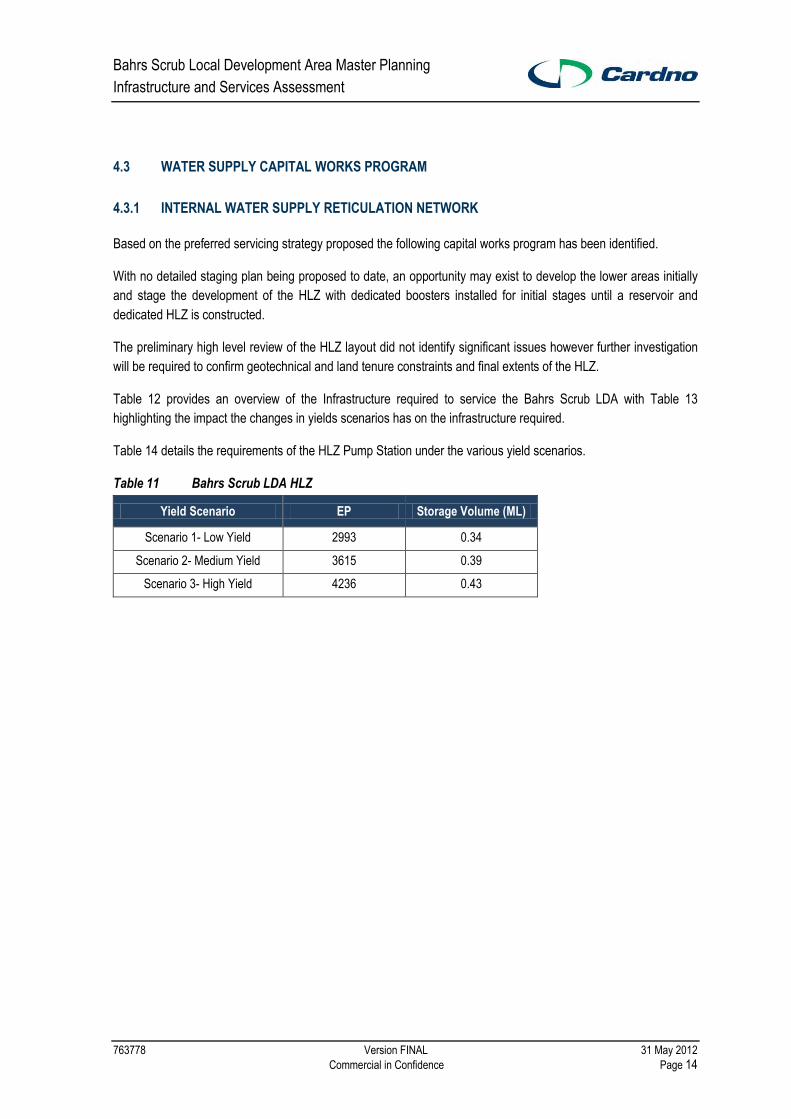
4.3 WATER SUPPLY CAPITAL WORKS PROGRAM
4.3.1 INTERNAL WATER SUPPLY RETICULATION NETWORK
Based on the preferred servicing strategy proposed the following capital works program has been identified.
With no detailed staging plan being proposed to date, an opportunity may exist to develop the lower areas initially
and stage the development of the HLZ with dedicated boosters installed for initial stages until a reservoir and
dedicated HLZ is constructed.
The preliminary high level review of the HLZ layout did not identify significant issues however further investigation
will be required to confirm geotechnical and land tenure constraints and final extents of the HLZ.
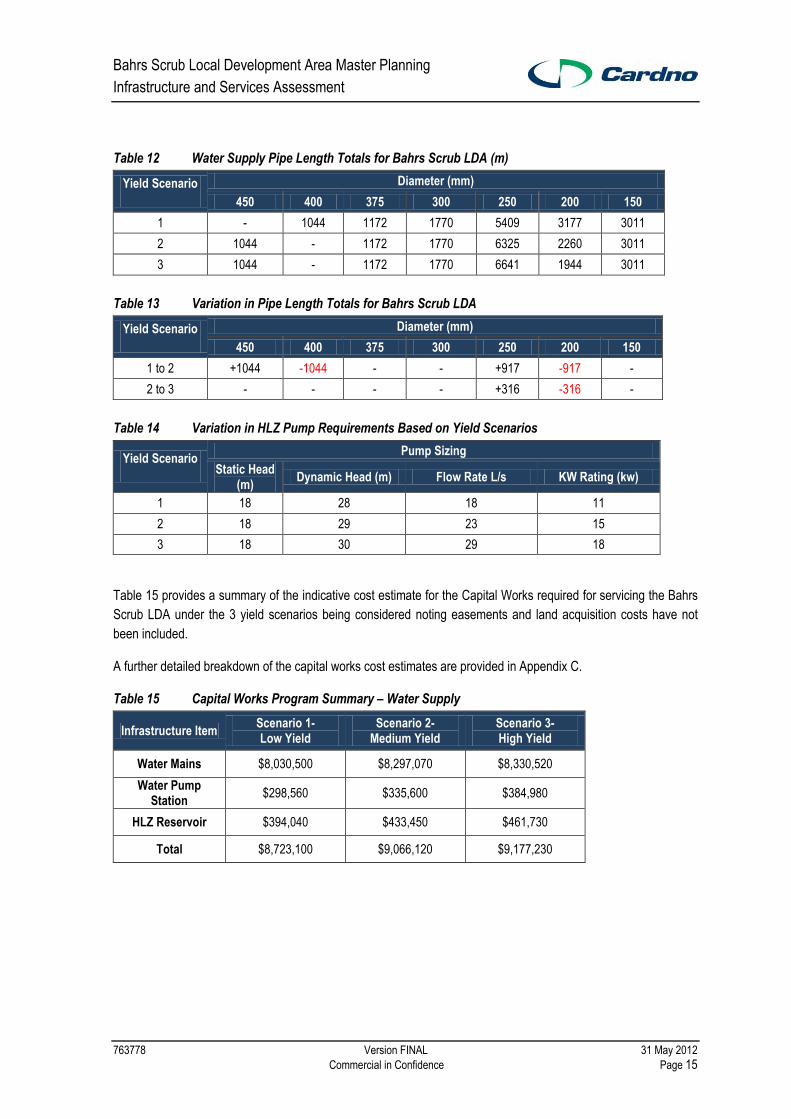
Table 12 provides an overview of the Infrastructure required to service the Bahrs Scrub LDA with Table 13
highlighting the impact the changes in yields scenarios has on the infrastructure required.
Table 14 details the requirements of the HLZ Pump Station under the various yield scenarios.
Table 11 Bahrs Scrub LDA HLZ
Yield Scenario EP Storage Volume (ML)
Scenario 1- Low Yield 2993 0.34
Scenario 2- Medium Yield 3615 0.39
Scenario 3- High Yield 4236 0.43
Bahrs Scrub Local Development Area Master Planning
Infrastructure and Services Assessment
763778 Version FINAL 31 May 2012
Commercial in Confidence Page 15
Table 12 Water Supply Pipe Length Totals for Bahrs Scrub LDA (m)
Yield Scenario Diameter (mm)
450 400 375 300 250 200 150
1 - 1044 1172 1770 5409 3177 3011
2 1044 - 1172 1770 6325 2260 3011
3 1044 - 1172 1770 6641 1944 3011
Table 13 Variation in Pipe Length Totals for Bahrs Scrub LDA
Yield Scenario Diameter (mm)
450 400 375 300 250 200 150
1 to 2 +1044 -1044 - - +917 -917 -
2 to 3 - - - - +316 -316 -
Table 14 Variation in HLZ Pump Requirements Based on Yield Scenarios
Yield Scenario Pump Sizing
Static Head (m)
Dynamic Head (m) Flow Rate L/s KW Rating (kw)
1 18 28 18 11
2 18 29 23 15
3 18 30 29 18
Table 15 provides a summary of the indicative cost estimate for the Capital Works required for servicing the Bahrs
Scrub LDA under the 3 yield scenarios being considered noting easements and land acquisition costs have not
been included.
A further detailed breakdown of the capital works cost estimates are provided in Appendix C.
Table 15 Capital Works Program Summary – Water Supply
Infrastructure Item Scenario 1- Low Yield
Scenario 2- Medium Yield
Scenario 3- High Yield
Water Mains $8,030,500 $8,297,070 $8,330,520
Water Pump Station
$298,560 $335,600 $384,980
HLZ Reservoir $394,040 $433,450 $461,730
Total $8,723,100 $9,066,120 $9,177,230
Bahrs Scrub Local Development Area Master Planning
Infrastructure and Services Assessment
763778 Version FINAL 31 May 2012
Commercial in Confidence Page 16
4.3.2 EXTERNAL WATER SUPPLY WORKS
Final external infrastructure requirements will be dependent on the servicing option identified and approved by
Allconnex Water.
The South East Queensland Infrastructure Plan and Program 2010-2031 provides information on regional water
supply in particular the Wyaralong Water Treatment Plant and Cedar Grove Interconnector which will enhance
overall bulk supplies for the region.

Bahrs Scrub Local Development Area Master Planning
Infrastructure and Services Assessment
763778 Version FINAL 31 May 2012
Commercial in Confidence Page 17
5 SEWERAGE INFRASTRUCTURE
5.1 EXISITNG SEWERAGE SYSTEM
5.1.1 CATCHMENT OVERVIEW
TREATMENT
The Beenleigh Sewerage Treatment Plant (BSTP) currently has approval to discharge up to 15 ML/d ADWF
however operational limitations means its actual capacity is closer to 7 - 10 ML/d.
The BSTP at present services both the Beenleigh Catchment and what has been identified as the Staplyton
Catchment which the former Gold Coast Water had intended to be serviced by a new Sewage treatment Plant
which was to be operational by 2011.
An Alliance was established to deliver this project however the Target Outrun Cost (TOC) determined was in
excess of previous estimates and as per capita hydraulic loads were decreasing in the area and excess capacity
was available in nearby plants the opportunity to review the original strategy was taken. It is understood that the
Staplyton Plant is no longer being considered as a servicing option for the area,
A thorough strategic assessment of options to service the Logan East area was carried out by Allconnex Water –
Logan Division, as part of their Priority Infrastructure Planning (PIP) (PIPSEWER 2010). The preferred option
being proposed is an upgrade of the Beenleigh STP treatment capacity to 15 ML/d and utilisation and transfer of
additional loads to the under capacity Loganholme STP with upgrades made at Loganholme to accommodate
future demands. A subsequent planning study, Bahrs Scrub to Beenleigh Wastewater Preliminary Design Phase 1
(LWA Task: 90-11-12, January 2012), available in Appendix F, has detailed the additional strategic inter catchment
transfers and network optimisation of the system as a whole.
5.1.2 CAPACITY OF EXISTING SYSTEM
Table 16 details the capacities of the current Loganholme and Beenleigh STPs.
Table 16 Sewage Treatment Plant Capacities
STP Approved Discharge Volume
ML ADWF Current Actual Current Capacity
Beenleigh 15 11 7-10
Loganholme 75 40 66.5
Total 90 51 73-76
As can be seen from Table 16 and Table 9, the system as a whole has sufficient capacity to treat flows for an
extended period into the future however the optimum transportation of sewage and timing of capital investment is a
key strategic decision that will be made by Allconnex Water.
Bahrs Scrub Local Development Area Master Planning
Infrastructure and Services Assessment
763778 Version FINAL 31 May 2012
Commercial in Confidence Page 18
Theoretical flows overstate actual flows especially for the Beenleigh and Staplyton Catchment areas where actual
flows of 11 ML/d compare with 15 ML/d, it should be noted Beenleigh STP does require an upgrade to ensure
ongoing compliance at the current load.
Allconnex Water are currently in the process of reviewing the processes at Beenleigh STP to identify augmentation
options including the plants ability to treat the high proportion of industrial load contained in the Staplyton
catchment area.
The current treatment strategy appears sound noting the two points:
Reduction in ADWF hydraulic figures does not necessarily transfer into additional capacity at an STP due to
organic and solids loads that may or may not remain regardless of the water volume and impact key process
units; and
The option of increasing capacity at the Beenleigh STP has not been raised in detail and while bringing
forward some treatment capital costs would avoid the capital and operational costs associated with
constructing the pump and pipe network required to transferring flows in excess of 15ML/d between plants.
There will be a need to negotiate revised development approval conditions for either Loganholme or Beenleigh
option and due to the close proximity of discharge locations similar processes and issues would be considered
to apply for each plant. As such the option of upgrading Beenleigh to an ultimate capacity of 42 ML/d in two
13.5 ML/d stages could be explored.
While a number of options remain at the treatment end of the network these have limited impact on the collection
and transfer infrastructure required to service the Bahrs Scrub LDA now that the Staplyton STP is no longer
considered to be a viable alternative.
Network upgrades required to service the Bahrs Scrub LDA have been identified in the current strategy
(PIPSEWER2010) and include upgrades to a number of pump station and rising mains as well as sections of
gravity reticulation networks.
Final infrastructure requirements and optimum alignments will be determined by Allconnex Water.
5.2 ULTIMATE SEWERAGE SYSTEM AND STAGING
5.2.1 INTERNAL INFRASTRUCTURE REQUIREMENTS
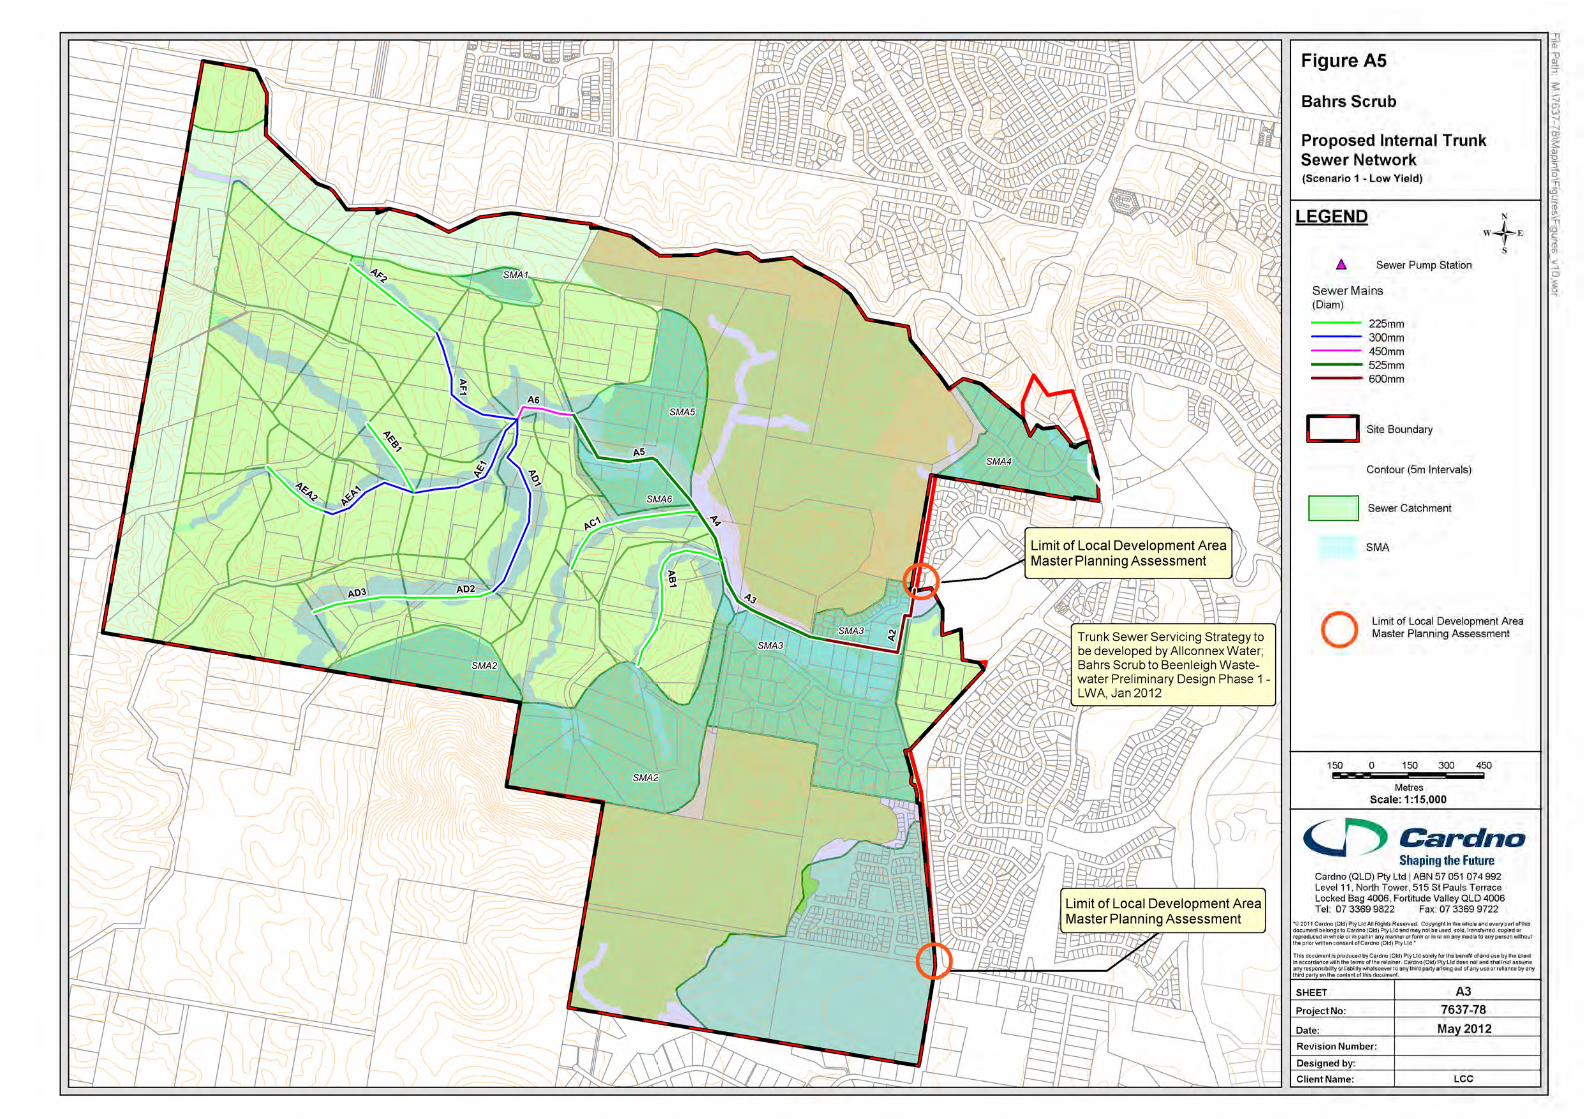
Figure A5, Appendix A provides an overview of the proposed internal sewer reticulation layout required to service
the Bahrs Scrub LDA.
The LDA is capable of being serviced by gravity with a trunk main proposed which will service the area and connect
to a new sewage pump station external to the site. Precinct 2, to the west of the site would require a dedicated
pump station and rising main to discharge to the Bahrs Scrub catchment.
Bahrs Scrub Local Development Area Master Planning
Infrastructure and Services Assessment
763778 Version FINAL 31 May 2012
Commercial in Confidence Page 19
While the current proposal is to transfer flows in Precinct 2 to the Bahrs Scrub catchment an opportunity may exist
to direct the pump station and rising main to existing infrastructure in Tallagandra Rd. The merits of this option
could be investigated further during design stages however based on the minimal overall impact on the LDA, or
infrastructure requirements, for the purposes of this planning assessment the identified option has been considered
to provide a sound servicing solution and has been adopted for this study as the basis for the development of
infrastructure costs.
Precinct 4 will be serviced by an internal gravity mains discharging to an external trunk main. This trunk main will
connect this area to the existing sewage pump station BE34.
The loads generated from the three yield scenarios have an impact on the sizing of infrastructure required to
service the LDA with an overview of infrastructure required provided in Table 17.
Table 18 provides high level details for the proposed internal sewage pump station required to service Precinct 2.
Table 17 Sewer Pipe Length Totals for Bahrs Scrub LDA
Yield Scenario Diameter (mm)
225 300 375 450 525 600 675
1 3079 2266 - 260 1471 1423 -
2 4176 2002 557 - 955 2199 -
3 3385 2794 557 - - 1174 1979
Table 18 Variation in internal Sewage Pump Station Requirements Based on Yield Scenarios
Yield
Scenario
Pump Sizing Rising Main
Static Head (m)
Dynamic Head (m)
Flow Rate L/s
KW Rating (kw)
Diameter (mm) Length (m)
1 35 2 4.4 2 100 300
2 35 3 5.4 3 100 300
3 35 4 6.5 3 100 300
Table 19 provides a summary of the Capital Works required for servicing the Bahrs Scrub LDA under the 3 yield
scenarios being considered noting easements and land acquisition costs have not been included.
A further detailed breakdown of the capital works cost estimates are provided in Appendix C.
Table 19 Capital Works Program Summary – Sewerage Supply
Infrastructure Item Scenario 1- Low Yield
Scenario 2- Medium Yield
Scenario 3- High Yield
Gravity Mains $5,315,240 $6,080,830 $6,655,830
Sewer Pump Station and Rising Main $245,323 $267,597 $283,247
Total $5,560,563 $6,348,427 $6,939,077
Bahrs Scrub Local Development Area Master Planning
Infrastructure and Services Assessment
763778 Version FINAL 31 May 2012
Commercial in Confidence Page 20
5.2.2 EXTERNAL INFRASTRUCTURE REQUIREMENTS
Precinct 4 will discharge to a new gravity trunk main conveying flow to the existing sewage pump station BE34. The
layout is provided as an indication only and will be required to be developed once the development plan and road
infrastructure layouts are finalised. Conflicts with existing services including the 600mm APA gas trunk main will be
addressed during detailed design.
Servicing options for the Bahrs Scrub LDA including the associated infrastructure requirements including cost
estimates and optimum alignments have been developed for Allconnex Water by the Logan Water Alliance. The
Bahrs Scrub to Beenleigh Wastewater Preliminary Design Phase 1 (LWA Task: 90-11-12, January 2012) report
details the preferred servicing strategy.

Bahrs Scrub Local Development Area Master Planning
Infrastructure and Services Assessment
763778 Version FINAL 31 May 2012
Commercial in Confidence Page 21
6 ADDITIONAL SERVICES
6.1 POWER RETICULATION
Energex have advised that there is 11kV feeder coverage over most of the site however power currently existing
within the study area is of limited capacity and intended to service the existing residential large lots. Also crossing
the study area is an Energex 33kV overhead line that forms part of the existing circuit to the bulk supply substation
at Beenleigh. This 33kV line is currently within a 20m wide easement corridor from Wuraga Road to Menora Street
with the remainder covered by a wayleave agreement. The existing easement/wayleave corridor can have future
uses such as parkland and road crossings.
Preference is for the eastern parts of the site to develop first with nominal capacity for 250 homes in the eastern
corner of Precinct 1 (South of Bahrs Scrub Road to Adele Crescent) and 300 homes in the Precinct 4 area without
exceeding capacity or voltage limits.
Details of the existing and proposed future networks relating to the study area have been provided by Energex as
shown on Figure 3, Appendix E.
To support the proposed development Energex have indicated they would need to establish a new zone substation
(33/11kV) within the development. This would require securing a site, being a parcel of land approximately
4,000sqm preferably in a commercial area adjacent to the existing 33kV overhead line running across the upper
north-west third of the development.
Energex have indicated they will also need to establish an additional 33kV circuit from the bulk supply substation at
Beenleigh, which would cross the study area east to west following the existing road reserve of Bahrs Scrub Road.
From discussions with Energex they believe the new circuit should ideally be completely contained within the road
reserve corridor. Energex have also indicated that the final route and timing of this new circuit will depend on the
actual location of the substation and the staging of the development.
6.2 GAS RETICULATION
6.2.1 TRUNK GAS PIPELINE INFRASTRUCTURE
There currently exists an APA Group (APA) owned and operated 600mm diameter gas pipeline, referred to as the
Gold Coast Pipeline, which traverses the proposed development. The pipeline runs along the road reserve of
Prangley Road south to Bahrs Scrub Road then east to New Horizon Avenue and south to Lee Court - refer to
Figure 4, Appendix E which shows the indicative location of the existing pipeline and the relationship to the
proposed development.
Connection to this pipeline is not available for development reticulation. Our initial discussions indicate that the
pipeline is located within the existing road reserve and shouldn’t have any impact on the proposed development,
provided the above mentioned existing road reserves are maintained.
Bahrs Scrub Local Development Area Master Planning
Infrastructure and Services Assessment
763778 Version FINAL 31 May 2012
Commercial in Confidence Page 22
6.2.2 NATURAL GAS
Existing natural gas reticulation infrastructure owned by APA currently exists adjacent to the proposed
development in Tallagandra Road. Initial advice received indicates the Bahrs Scrub development can be serviced
with natural gas via this existing network. Approximately 600m of future external network along Prangley Road to
Tallagandra Road would be required to connect the development to the existing infrastructure.
6.2.3 METER GAS - LPG
An alternative to reticulation natural gas to service the development is ‘Origin Metered Gas’ – a metered LPG
network which would be available to the development should an alternative to electricity be required and if servicing
the development with natural gas becomes unavailable. The National Reticulation Sales Manager for Origin has
provided an Introduction to Metered LPG Letter which provides further details (Appendix E).
6.3 TELECOMMUNICATIONS
Telstra have indicated that there is currently existing fibre optic cable located within and around the development
study area. Basic telecommunication networks currently service the existing residential large lots. These may
require recovering and/or moving depending on the proposed road reserve layout of future development.
Telstra have advised that they would require the installation of a minimum of one Telstra NextG base station with
the development to assist in servicing the area.
Additional advice about telecommunications can be obtained from the below resources.
Telstra Smart Community
Telstra’s Smart Community – program that works in partnership with developers to deliver modern
telecommunications to Greenfield estates. Preliminary advice can be obtained by registering on the Telstra smart
community website under the Intent to Develop form (ITD) found through this weblink:
http://www.telstra.com.au/smartcommunity/developers.html.
NBNCo
National Broadband Network (NBN) offers a service to register new developments through New Development
Request Service (NDRS) form, which allows developers to request NBNCo to install fibre broadband infrastructure
in their newly approved development. Details can be found through this weblink:
https://www.nbnco.com.au/new_developments/development.
Bahrs Scrub Local Development Area Master Planning
Infrastructure and Services Assessment
763778 Version FINAL 31 May 2012
Commercial in Confidence Page 23
7 CONCLUSIONS
7.1 WATER SUPPLY
Final external infrastructure requirements will be dependent on the servicing option identified and approved by
Allconnex Water. Analysis undertaken by Allconnex Water and the Logan Water Alliance has indicated that a short
fall of supply is expected in the immediate future. Allconnex Water are considering the bulk supply options
developed within the LWA report, Logan Water Alliance – Logan East Water Servicing Plan – Task 90-11-28 – April
2012, to ensure continued supply to the Wuraga Road an Mt Warren reservoirs.
The Bahrs Scrub LDA will be supplied via a two trunk connections to the existing trunk mains from the Wuraga
Road reservoir. These trunk mains will supply an internal ring main. A HLZ to service those properties along the
southern and western fringes above 55m AHD and below 75m AHD will be required along a high level reservoir
and booster pump stations as required.
7.2 SEWERAGE
It is understood that Allconnex Water are likely to adopt a strategy soon centred on the centralising treatment at
Beenleigh and Loganholme STP’s. Both options provide a sound solution to servicing growth in the catchment.
As a result the infrastructure required to service the LDA in the current strategy will include a series of network
upgrades and augmentations that convey the sewage load from Bahrs Scrub to a new site pump station and
transfer to Beenleigh STP.
Internal sewerage infrastructure sizing will be dependent on the yield scenario adopted. However, the servicing
strategy centres on a trunk gravity main network with mains up to 675mm diameter discharging to the existing
catchment.
7.3 ADDITIONAL SERVICES
Advice received from responsible agencies indicates that the area can be adequately serviced by gas,
telecommunications and power infratsructure.
Bahrs Scrub Local Development Area Master Planning
Infrastructure and Services Assessment
763778 Version FINAL 31 May 2012
Commercial in Confidence
Appendix A
Figures
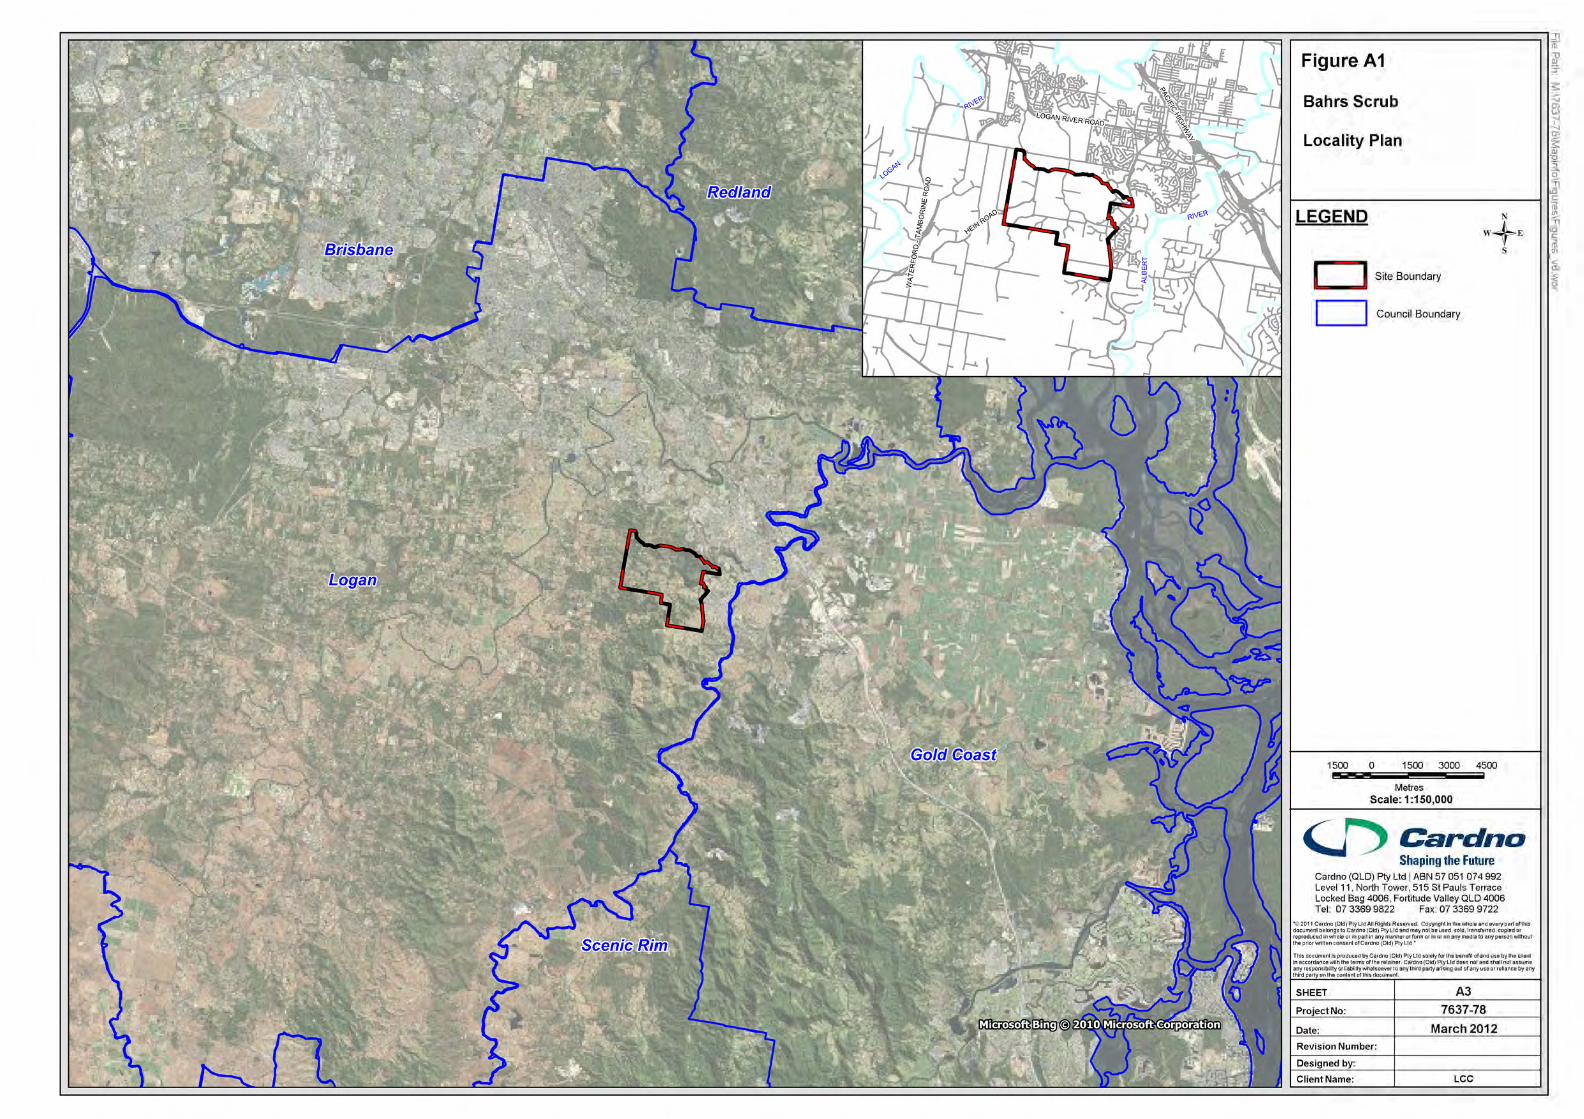

Figure A2
LEGEND
SHEET
Project No:
Client Name:
Date:
Revision Number:
Cardno (QLD) Pty Ltd | ABN 57 051 074 992Level 11, North Tower, 515 St Pauls TerraceLocked Bag 4006, Fortitude Valley QLD 4006Tel: 07 3369 9822 Fax: 07 3369 9722
200 0 200 400 600
Metres
Scale: 1:20,000
Designed by:
"© 2011 Cardno (Qld) Pty Ltd All Rights Reserved. Copyright in the whole and every part of this
document belongs to Cardno (Qld) Pty Ltd and may not be used, sold, transferred, copied or
reproduced in whole or in part in any manner or form or in or on any media to any person without
the prior written consent of Cardno (Qld) Pty Ltd."
This document is produced by Cardno (Qld) Pty Ltd solely for the benefit of and use by the client
in accordance with the terms of the retainer. Cardno (Qld) Pty Ltd does not and shall not assume
any responsibility or liability whatsoever to any third party arising out of any use or reliance by any
third party on the content of this document.
Bahrs Scrub
Site Development
File Path: M
:\7637-78\Mapinfo\Figures\Figures_v9.worSite Boundary
Environmental Management Areas will be retained for
conservation purposes. No further urban development
of these areas will occur, except under any existing
lawful development approvals.
Environmental Management Area - EMA
Wildlife Management Areas will be protected for their
role in providing a continuous wildlife corridor between
major environmental management areas. These wild life
corridors are to be of sufficient width and habitat diversity
as to enable safe passage for fauna and in particular
koalas.
Wildlife Movement Area - WiMA
Special Management Areas represent areas that
will accomodate some urban development, but
any development needs to be carefully managed
to protect identified environmental values.
Special Management Area - SMA
Waterway Management Areas will be managed primarily
for water quality and quantity outcomes. In some instances
they will also be managed for recreational needs and
offset areas.
Waterway Management Area
& Buffer - WMA
Developable Area
Approved and Undecided
Development Application
7637-78
A3
LCC
May 2012


Bahrs Scrub Local Development Area Master Planning
Infrastructure and Services Assessment
763778 Version FINAL 31 May 2012
Commercial in Confidence
Appendix B
Development Yield Calculations
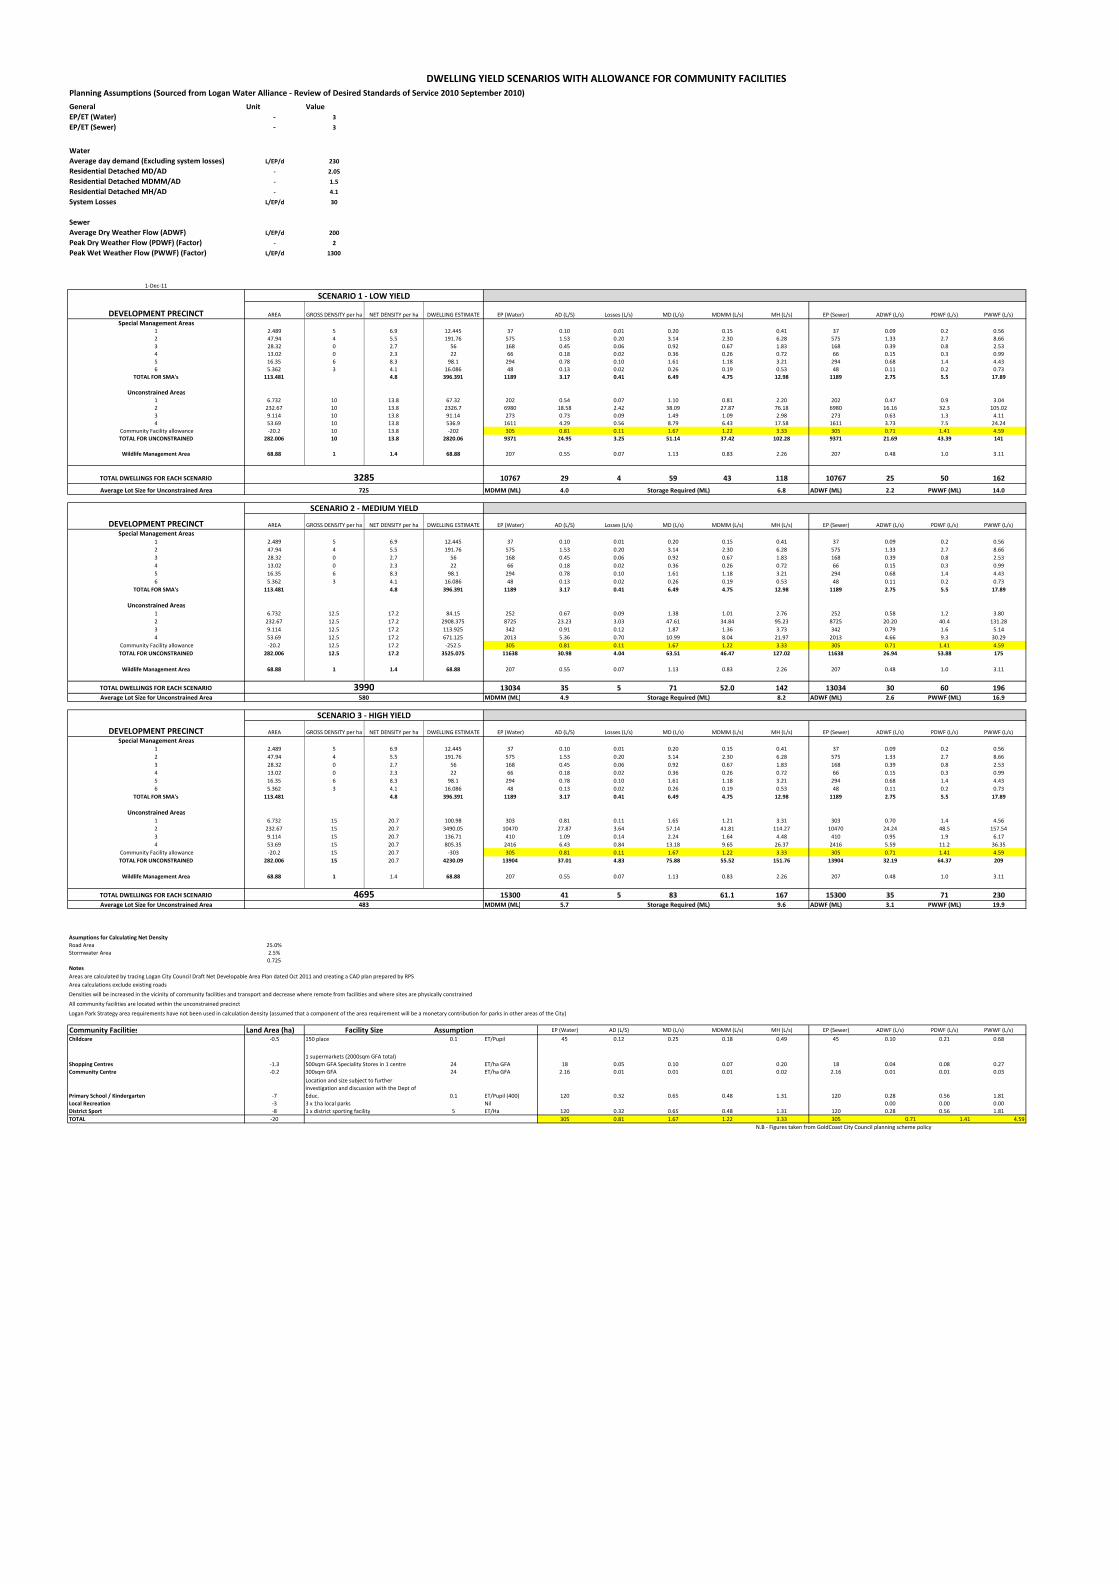
Planning Assumptions (Sourced from Logan Water Alliance - Review of Desired Standards of Service 2010 September 2010)
General Unit Value
EP/ET (Water) - 3
EP/ET (Sewer) - 3
Water
Average day demand (Excluding system losses) L/EP/d 230
Residential Detached MD/AD - 2.05
Residential Detached MDMM/AD - 1.5
Residential Detached MH/AD - 4.1
System Losses L/EP/d 30
Sewer
Average Dry Weather Flow (ADWF) L/EP/d 200
Peak Dry Weather Flow (PDWF) (Factor) - 2
Peak Wet Weather Flow (PWWF) (Factor) L/EP/d 1300
1-Dec-11
AREA GROSS DENSITY per ha NET DENSITY per ha DWELLING ESTIMATE EP (Water) AD (L/S) Losses (L/s) MD (L/s) MDMM (L/s) MH (L/s) EP (Sewer) ADWF (L/s) PDWF (L/s) PWWF (L/s)
Special Management Areas
1 2.489 5 6.9 12.445 37 0.10 0.01 0.20 0.15 0.41 37 0.09 0.2 0.56
2 47.94 4 5.5 191.76 575 1.53 0.20 3.14 2.30 6.28 575 1.33 2.7 8.66
3 28.32 0 2.7 56 168 0.45 0.06 0.92 0.67 1.83 168 0.39 0.8 2.53
4 13.02 0 2.3 22 66 0.18 0.02 0.36 0.26 0.72 66 0.15 0.3 0.99
5 16.35 6 8.3 98.1 294 0.78 0.10 1.61 1.18 3.21 294 0.68 1.4 4.43
6 5.362 3 4.1 16.086 48 0.13 0.02 0.26 0.19 0.53 48 0.11 0.2 0.73
TOTAL FOR SMA's 113.481 4.8 396.391 1189 3.17 0.41 6.49 4.75 12.98 1189 2.75 5.5 17.89
Unconstrained Areas
1 6.732 10 13.8 67.32 202 0.54 0.07 1.10 0.81 2.20 202 0.47 0.9 3.04
2 232.67 10 13.8 2326.7 6980 18.58 2.42 38.09 27.87 76.18 6980 16.16 32.3 105.02
3 9.114 10 13.8 91.14 273 0.73 0.09 1.49 1.09 2.98 273 0.63 1.3 4.11
4 53.69 10 13.8 536.9 1611 4.29 0.56 8.79 6.43 17.58 1611 3.73 7.5 24.24
Community Facility allowance -20.2 10 13.8 -202 305 0.81 0.11 1.67 1.22 3.33 305 0.71 1.41 4.59
TOTAL FOR UNCONSTRAINED 282.006 10 13.8 2820.06 9371 24.95 3.25 51.14 37.42 102.28 9371 21.69 43.39 141
Wildlife Management Area 68.88 1 1.4 68.88 207 0.55 0.07 1.13 0.83 2.26 207 0.48 1.0 3.11
TOTAL DWELLINGS FOR EACH SCENARIO 10767 29 4 59 43 118 10767 25 50 162
Average Lot Size for Unconstrained Area MDMM (ML) 4.0 Storage Required (ML) 6.8 ADWF (ML) 2.2 PWWF (ML) 14.0
AREA GROSS DENSITY per ha NET DENSITY per ha DWELLING ESTIMATE EP (Water) AD (L/S) Losses (L/s) MD (L/s) MDMM (L/s) MH (L/s) EP (Sewer) ADWF (L/s) PDWF (L/s) PWWF (L/s)
Special Management Areas
1 2.489 5 6.9 12.445 37 0.10 0.01 0.20 0.15 0.41 37 0.09 0.2 0.56
2 47.94 4 5.5 191.76 575 1.53 0.20 3.14 2.30 6.28 575 1.33 2.7 8.66
3 28.32 0 2.7 56 168 0.45 0.06 0.92 0.67 1.83 168 0.39 0.8 2.53
4 13.02 0 2.3 22 66 0.18 0.02 0.36 0.26 0.72 66 0.15 0.3 0.99
5 16.35 6 8.3 98.1 294 0.78 0.10 1.61 1.18 3.21 294 0.68 1.4 4.43
6 5.362 3 4.1 16.086 48 0.13 0.02 0.26 0.19 0.53 48 0.11 0.2 0.73
TOTAL FOR SMA's 113.481 4.8 396.391 1189 3.17 0.41 6.49 4.75 12.98 1189 2.75 5.5 17.89
Unconstrained Areas
1 6.732 12.5 17.2 84.15 252 0.67 0.09 1.38 1.01 2.76 252 0.58 1.2 3.80
2 232.67 12.5 17.2 2908.375 8725 23.23 3.03 47.61 34.84 95.23 8725 20.20 40.4 131.28
3 9.114 12.5 17.2 113.925 342 0.91 0.12 1.87 1.36 3.73 342 0.79 1.6 5.14
4 53.69 12.5 17.2 671.125 2013 5.36 0.70 10.99 8.04 21.97 2013 4.66 9.3 30.29
Community Facility allowance -20.2 12.5 17.2 -252.5 305 0.81 0.11 1.67 1.22 3.33 305 0.71 1.41 4.59
TOTAL FOR UNCONSTRAINED 282.006 12.5 17.2 3525.075 11638 30.98 4.04 63.51 46.47 127.02 11638 26.94 53.88 175
Wildlife Management Area 68.88 1 1.4 68.88 207 0.55 0.07 1.13 0.83 2.26 207 0.48 1.0 3.11
TOTAL DWELLINGS FOR EACH SCENARIO 13034 35 5 71 52.0 142 13034 30 60 196
Average Lot Size for Unconstrained Area MDMM (ML) 4.9 Storage Required (ML) 8.2 ADWF (ML) 2.6 PWWF (ML) 16.9
AREA GROSS DENSITY per ha NET DENSITY per ha DWELLING ESTIMATE EP (Water) AD (L/S) Losses (L/s) MD (L/s) MDMM (L/s) MH (L/s) EP (Sewer) ADWF (L/s) PDWF (L/s) PWWF (L/s)
Special Management Areas
1 2.489 5 6.9 12.445 37 0.10 0.01 0.20 0.15 0.41 37 0.09 0.2 0.56
2 47.94 4 5.5 191.76 575 1.53 0.20 3.14 2.30 6.28 575 1.33 2.7 8.66
3 28.32 0 2.7 56 168 0.45 0.06 0.92 0.67 1.83 168 0.39 0.8 2.53
4 13.02 0 2.3 22 66 0.18 0.02 0.36 0.26 0.72 66 0.15 0.3 0.99
5 16.35 6 8.3 98.1 294 0.78 0.10 1.61 1.18 3.21 294 0.68 1.4 4.43
6 5.362 3 4.1 16.086 48 0.13 0.02 0.26 0.19 0.53 48 0.11 0.2 0.73
TOTAL FOR SMA's 113.481 4.8 396.391 1189 3.17 0.41 6.49 4.75 12.98 1189 2.75 5.5 17.89
Unconstrained Areas
1 6.732 15 20.7 100.98 303 0.81 0.11 1.65 1.21 3.31 303 0.70 1.4 4.56
2 232.67 15 20.7 3490.05 10470 27.87 3.64 57.14 41.81 114.27 10470 24.24 48.5 157.54
3 9.114 15 20.7 136.71 410 1.09 0.14 2.24 1.64 4.48 410 0.95 1.9 6.17
4 53.69 15 20.7 805.35 2416 6.43 0.84 13.18 9.65 26.37 2416 5.59 11.2 36.35
Community Facility allowance -20.2 15 20.7 -303 305 0.81 0.11 1.67 1.22 3.33 305 0.71 1.41 4.59
TOTAL FOR UNCONSTRAINED 282.006 15 20.7 4230.09 13904 37.01 4.83 75.88 55.52 151.76 13904 32.19 64.37 209
Wildlife Management Area 68.88 1 1.4 68.88 207 0.55 0.07 1.13 0.83 2.26 207 0.48 1.0 3.11
TOTAL DWELLINGS FOR EACH SCENARIO 15300 41 5 83 61.1 167 15300 35 71 230
Average Lot Size for Unconstrained Area MDMM (ML) 5.7 Storage Required (ML) 9.6 ADWF (ML) 3.1 PWWF (ML) 19.9
Road Area 25.0%
Stormwater Area 2.5%
0.725
Notes
Areas are calculated by tracing Logan City Council Draft Net Developable Area Plan dated Oct 2011 and creating a CAD plan prepared by RPS
Community Facilities Land Area (ha) Assumption EP (Water) AD (L/S) MD (L/s) MDMM (L/s) MH (L/s) EP (Sewer) ADWF (L/s) PDWF (L/s) PWWF (L/s)
Childcare -0.5 0.1 ET/Pupil 45 0.12 0.25 0.18 0.49 45 0.10 0.21 0.68
Shopping Centres -1.3 24 ET/ha GFA 18 0.05 0.10 0.07 0.20 18 0.04 0.08 0.27
Community Centre -0.2 24 ET/ha GFA 2.16 0.01 0.01 0.01 0.02 2.16 0.01 0.01 0.03
Primary School / Kindergarten -7 0.1 ET/Pupil (400) 120 0.32 0.65 0.48 1.31 120 0.28 0.56 1.81
Local Recreation -3 Nil 0.00 0.00 0.00
District Sport -8 5 ET/Ha 120 0.32 0.65 0.48 1.31 120 0.28 0.56 1.81
TOTAL -20 305 0.81 1.67 1.22 3.33 305 0.71 1.41 4.59
N.B - Figures taken from GoldCoast City Council planning scheme policy
300sqm GFA
Location and size subject to further
investigation and discussion with the Dept of
Educ.
3 x 1ha local parks
1 x district sporting facility
DEVELOPMENT PRECINCT
DEVELOPMENT PRECINCT
Facility Size150 place
1 supermarkets (2000sqm GFA total)
500sqm GFA Speciality Stores in 1 centre
4695
725
580
483
Asumptions for Calculating Net Density
Densities will be increased in the vicinity of community facilities and transport and decrease where remote from facilities and where sites are physically constrained
All community facilities are located within the unconstrained precinct
Area calculations exclude existing roads
Logan Park Strategy area requirements have not been used in calculation density (assumed that a component of the area requirement will be a monetary contribution for parks in other areas of the City)
DWELLING YIELD SCENARIOS WITH ALLOWANCE FOR COMMUNITY FACILITIES
DEVELOPMENT PRECINCT
SCENARIO 1 - LOW YIELD
SCENARIO 2 - MEDIUM YIELD
SCENARIO 3 - HIGH YIELD
3285
3990
Bahrs Scrub Local Development Area Master Planning
Infrastructure and Services Assessment
763778 Version FINAL 31 May 2012
Commercial in Confidence
Appendix C
Water and Sewerage Capital Cost Estimates
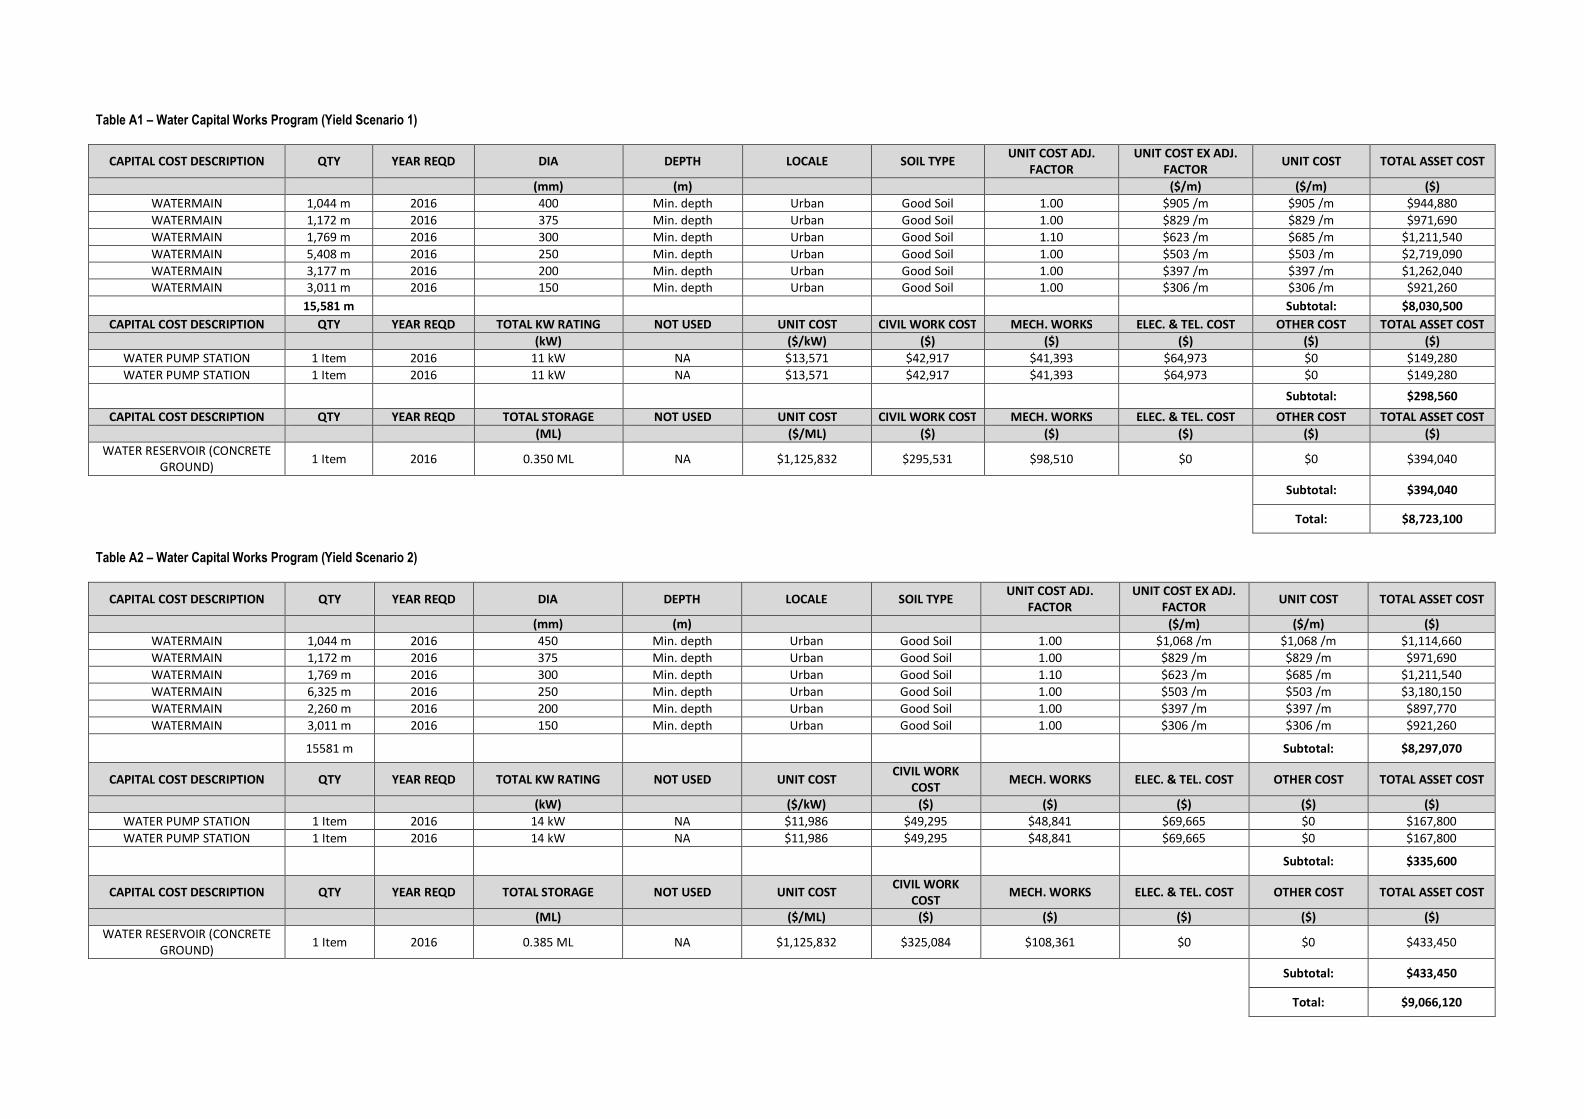
Table A1 – Water Capital Works Program (Yield Scenario 1)
CAPITAL COST DESCRIPTION QTY YEAR REQD DIA DEPTH LOCALE SOIL TYPE UNIT COST ADJ.
FACTOR
UNIT COST EX ADJ.
FACTOR UNIT COST TOTAL ASSET COST
(mm) (m) ($/m) ($/m) ($)
WATERMAIN 1,044 m 2016 400 Min. depth Urban Good Soil 1.00 $905 /m $905 /m $944,880
WATERMAIN 1,172 m 2016 375 Min. depth Urban Good Soil 1.00 $829 /m $829 /m $971,690
WATERMAIN 1,769 m 2016 300 Min. depth Urban Good Soil 1.10 $623 /m $685 /m $1,211,540
WATERMAIN 5,408 m 2016 250 Min. depth Urban Good Soil 1.00 $503 /m $503 /m $2,719,090
WATERMAIN 3,177 m 2016 200 Min. depth Urban Good Soil 1.00 $397 /m $397 /m $1,262,040
WATERMAIN 3,011 m 2016 150 Min. depth Urban Good Soil 1.00 $306 /m $306 /m $921,260
15,581 m Subtotal: $8,030,500
CAPITAL COST DESCRIPTION QTY YEAR REQD TOTAL KW RATING NOT USED UNIT COST CIVIL WORK COST MECH. WORKS ELEC. & TEL. COST OTHER COST TOTAL ASSET COST
(kW) ($/kW) ($) ($) ($) ($) ($)
WATER PUMP STATION 1 Item 2016 11 kW NA $13,571 $42,917 $41,393 $64,973 $0 $149,280
WATER PUMP STATION 1 Item 2016 11 kW NA $13,571 $42,917 $41,393 $64,973 $0 $149,280
Subtotal: $298,560
CAPITAL COST DESCRIPTION QTY YEAR REQD TOTAL STORAGE NOT USED UNIT COST CIVIL WORK COST MECH. WORKS ELEC. & TEL. COST OTHER COST TOTAL ASSET COST
(ML) ($/ML) ($) ($) ($) ($) ($)
WATER RESERVOIR (CONCRETE
GROUND) 1 Item 2016 0.350 ML NA $1,125,832 $295,531 $98,510 $0 $0 $394,040
Subtotal: $394,040
Total: $8,723,100
Table A2 – Water Capital Works Program (Yield Scenario 2)
CAPITAL COST DESCRIPTION QTY YEAR REQD DIA DEPTH LOCALE SOIL TYPE UNIT COST ADJ.
FACTOR
UNIT COST EX ADJ.
FACTOR UNIT COST TOTAL ASSET COST
(mm) (m) ($/m) ($/m) ($)
WATERMAIN 1,044 m 2016 450 Min. depth Urban Good Soil 1.00 $1,068 /m $1,068 /m $1,114,660
WATERMAIN 1,172 m 2016 375 Min. depth Urban Good Soil 1.00 $829 /m $829 /m $971,690
WATERMAIN 1,769 m 2016 300 Min. depth Urban Good Soil 1.10 $623 /m $685 /m $1,211,540
WATERMAIN 6,325 m 2016 250 Min. depth Urban Good Soil 1.00 $503 /m $503 /m $3,180,150
WATERMAIN 2,260 m 2016 200 Min. depth Urban Good Soil 1.00 $397 /m $397 /m $897,770
WATERMAIN 3,011 m 2016 150 Min. depth Urban Good Soil 1.00 $306 /m $306 /m $921,260
15581 m Subtotal: $8,297,070
CAPITAL COST DESCRIPTION QTY YEAR REQD TOTAL KW RATING NOT USED UNIT COST CIVIL WORK
COST MECH. WORKS ELEC. & TEL. COST OTHER COST TOTAL ASSET COST
(kW) ($/kW) ($) ($) ($) ($) ($)
WATER PUMP STATION 1 Item 2016 14 kW NA $11,986 $49,295 $48,841 $69,665 $0 $167,800
WATER PUMP STATION 1 Item 2016 14 kW NA $11,986 $49,295 $48,841 $69,665 $0 $167,800
Subtotal: $335,600
CAPITAL COST DESCRIPTION QTY YEAR REQD TOTAL STORAGE NOT USED UNIT COST CIVIL WORK
COST MECH. WORKS ELEC. & TEL. COST OTHER COST TOTAL ASSET COST
(ML) ($/ML) ($) ($) ($) ($) ($)
WATER RESERVOIR (CONCRETE
GROUND) 1 Item 2016 0.385 ML NA $1,125,832 $325,084 $108,361 $0 $0 $433,450
Subtotal: $433,450
Total: $9,066,120
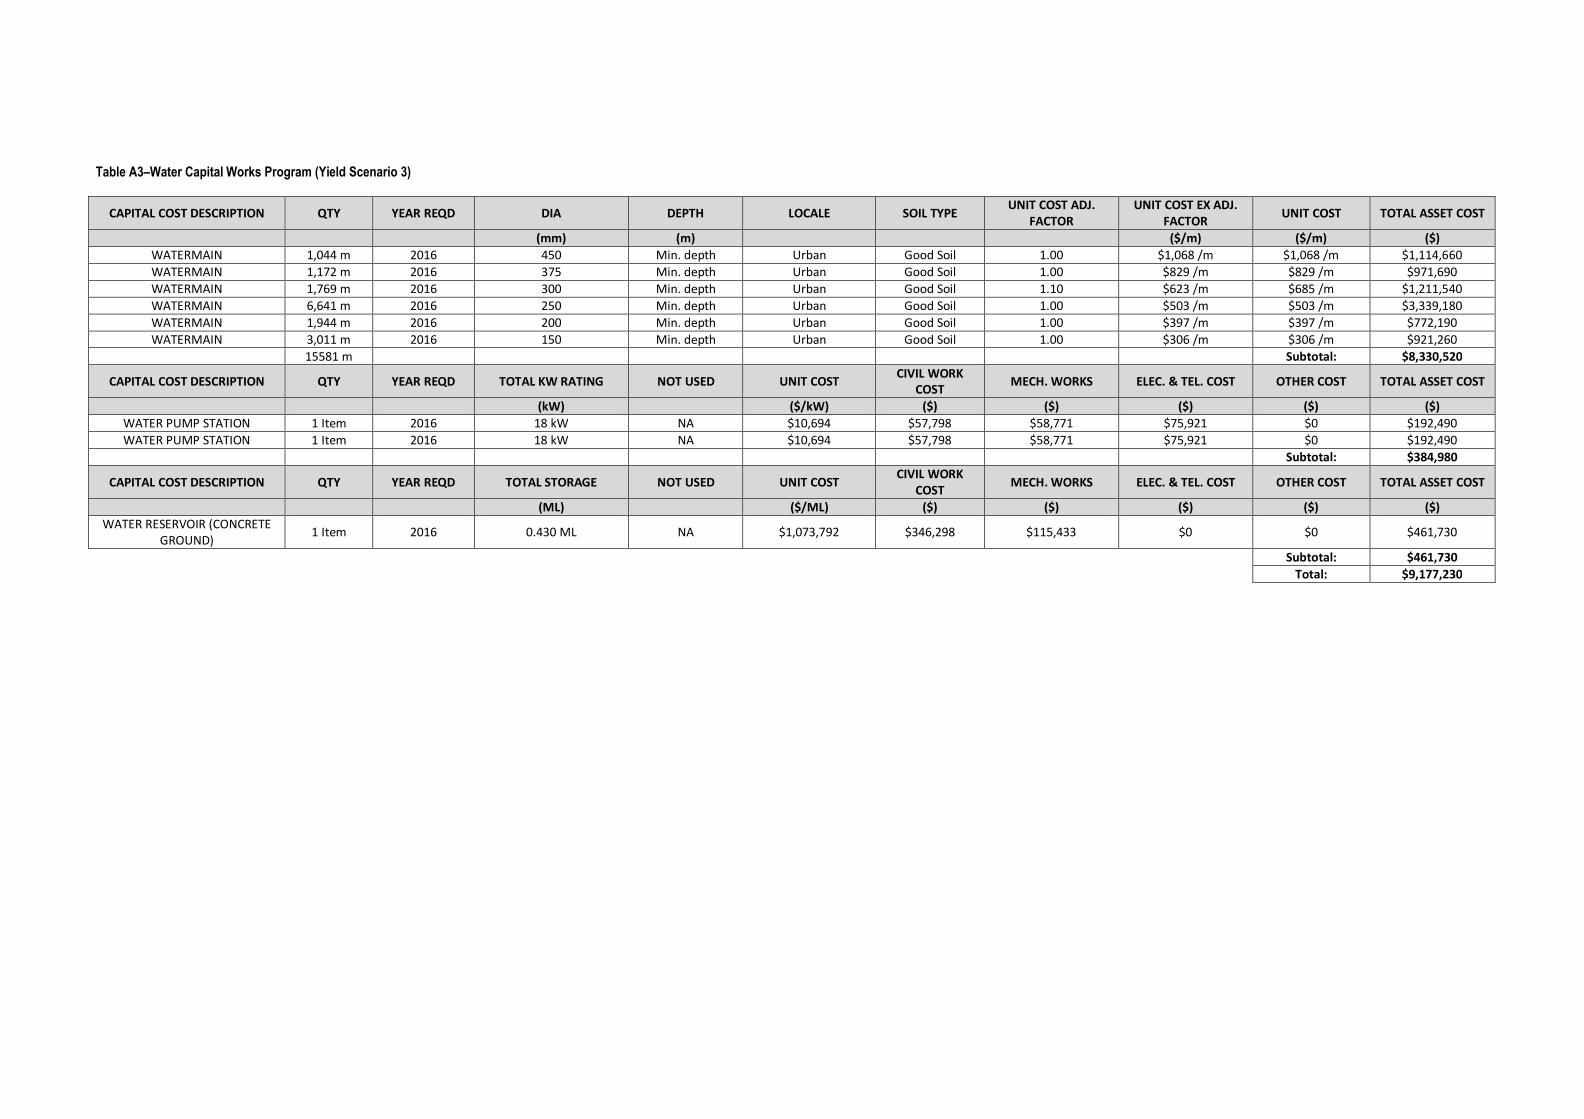
Table A3–Water Capital Works Program (Yield Scenario 3)
CAPITAL COST DESCRIPTION QTY YEAR REQD DIA DEPTH LOCALE SOIL TYPE UNIT COST ADJ.
FACTOR
UNIT COST EX ADJ.
FACTOR UNIT COST TOTAL ASSET COST
(mm) (m) ($/m) ($/m) ($)
WATERMAIN 1,044 m 2016 450 Min. depth Urban Good Soil 1.00 $1,068 /m $1,068 /m $1,114,660
WATERMAIN 1,172 m 2016 375 Min. depth Urban Good Soil 1.00 $829 /m $829 /m $971,690
WATERMAIN 1,769 m 2016 300 Min. depth Urban Good Soil 1.10 $623 /m $685 /m $1,211,540
WATERMAIN 6,641 m 2016 250 Min. depth Urban Good Soil 1.00 $503 /m $503 /m $3,339,180
WATERMAIN 1,944 m 2016 200 Min. depth Urban Good Soil 1.00 $397 /m $397 /m $772,190
WATERMAIN 3,011 m 2016 150 Min. depth Urban Good Soil 1.00 $306 /m $306 /m $921,260
15581 m Subtotal: $8,330,520
CAPITAL COST DESCRIPTION QTY YEAR REQD TOTAL KW RATING NOT USED UNIT COST CIVIL WORK
COST MECH. WORKS ELEC. & TEL. COST OTHER COST TOTAL ASSET COST
(kW) ($/kW) ($) ($) ($) ($) ($)
WATER PUMP STATION 1 Item 2016 18 kW NA $10,694 $57,798 $58,771 $75,921 $0 $192,490
WATER PUMP STATION 1 Item 2016 18 kW NA $10,694 $57,798 $58,771 $75,921 $0 $192,490
Subtotal: $384,980
CAPITAL COST DESCRIPTION QTY YEAR REQD TOTAL STORAGE NOT USED UNIT COST CIVIL WORK
COST MECH. WORKS ELEC. & TEL. COST OTHER COST TOTAL ASSET COST
(ML) ($/ML) ($) ($) ($) ($) ($)
WATER RESERVOIR (CONCRETE
GROUND) 1 Item 2016 0.430 ML NA $1,073,792 $346,298 $115,433 $0 $0 $461,730
Subtotal: $461,730
Total: $9,177,230
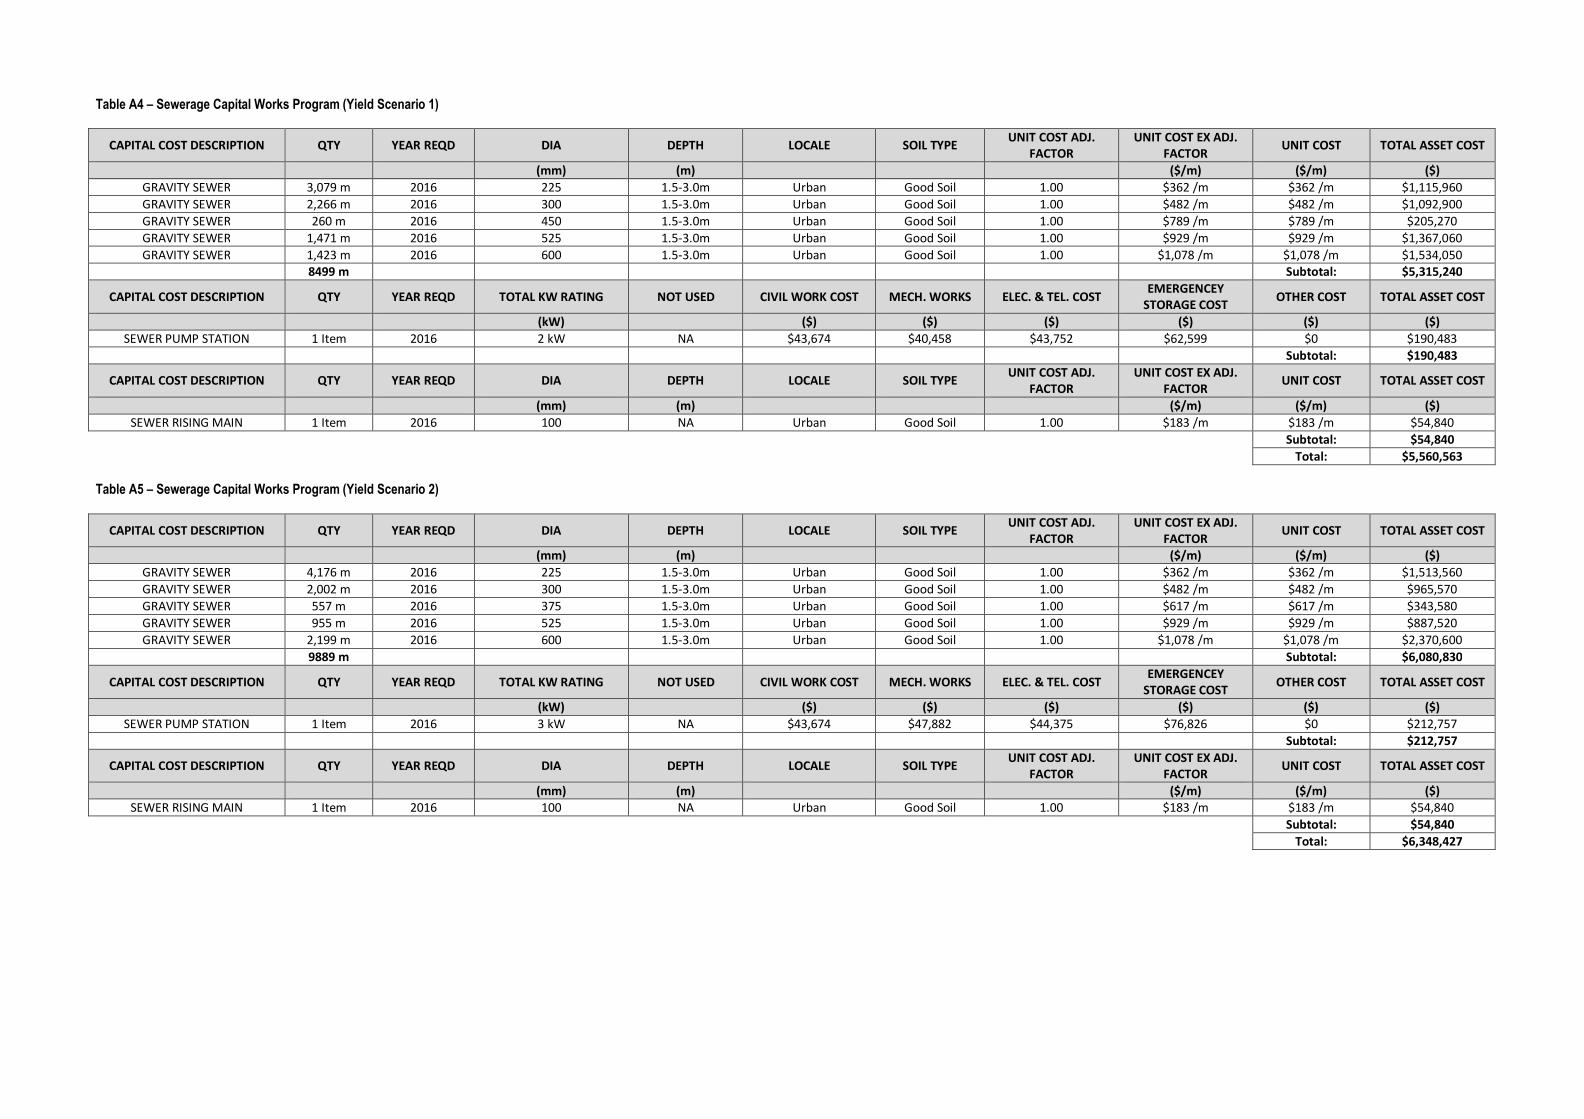
Table A4 – Sewerage Capital Works Program (Yield Scenario 1)
CAPITAL COST DESCRIPTION QTY YEAR REQD DIA DEPTH LOCALE SOIL TYPE UNIT COST ADJ.
FACTOR
UNIT COST EX ADJ.
FACTOR UNIT COST TOTAL ASSET COST
(mm) (m) ($/m) ($/m) ($)
GRAVITY SEWER 3,079 m 2016 225 1.5-3.0m Urban Good Soil 1.00 $362 /m $362 /m $1,115,960
GRAVITY SEWER 2,266 m 2016 300 1.5-3.0m Urban Good Soil 1.00 $482 /m $482 /m $1,092,900
GRAVITY SEWER 260 m 2016 450 1.5-3.0m Urban Good Soil 1.00 $789 /m $789 /m $205,270
GRAVITY SEWER 1,471 m 2016 525 1.5-3.0m Urban Good Soil 1.00 $929 /m $929 /m $1,367,060
GRAVITY SEWER 1,423 m 2016 600 1.5-3.0m Urban Good Soil 1.00 $1,078 /m $1,078 /m $1,534,050
8499 m Subtotal: $5,315,240
CAPITAL COST DESCRIPTION QTY YEAR REQD TOTAL KW RATING NOT USED CIVIL WORK COST MECH. WORKS ELEC. & TEL. COST EMERGENCEY
STORAGE COST OTHER COST TOTAL ASSET COST
(kW) ($) ($) ($) ($) ($) ($)
SEWER PUMP STATION 1 Item 2016 2 kW NA $43,674 $40,458 $43,752 $62,599 $0 $190,483
Subtotal: $190,483
CAPITAL COST DESCRIPTION QTY YEAR REQD DIA DEPTH LOCALE SOIL TYPE UNIT COST ADJ.
FACTOR
UNIT COST EX ADJ.
FACTOR UNIT COST TOTAL ASSET COST
(mm) (m) ($/m) ($/m) ($)
SEWER RISING MAIN 1 Item 2016 100 NA Urban Good Soil 1.00 $183 /m $183 /m $54,840
Subtotal: $54,840
Total: $5,560,563
Table A5 – Sewerage Capital Works Program (Yield Scenario 2)
CAPITAL COST DESCRIPTION QTY YEAR REQD DIA DEPTH LOCALE SOIL TYPE UNIT COST ADJ.
FACTOR
UNIT COST EX ADJ.
FACTOR UNIT COST TOTAL ASSET COST
(mm) (m) ($/m) ($/m) ($)
GRAVITY SEWER 4,176 m 2016 225 1.5-3.0m Urban Good Soil 1.00 $362 /m $362 /m $1,513,560
GRAVITY SEWER 2,002 m 2016 300 1.5-3.0m Urban Good Soil 1.00 $482 /m $482 /m $965,570
GRAVITY SEWER 557 m 2016 375 1.5-3.0m Urban Good Soil 1.00 $617 /m $617 /m $343,580
GRAVITY SEWER 955 m 2016 525 1.5-3.0m Urban Good Soil 1.00 $929 /m $929 /m $887,520
GRAVITY SEWER 2,199 m 2016 600 1.5-3.0m Urban Good Soil 1.00 $1,078 /m $1,078 /m $2,370,600
9889 m Subtotal: $6,080,830
CAPITAL COST DESCRIPTION QTY YEAR REQD TOTAL KW RATING NOT USED CIVIL WORK COST MECH. WORKS ELEC. & TEL. COST EMERGENCEY
STORAGE COST OTHER COST TOTAL ASSET COST
(kW) ($) ($) ($) ($) ($) ($)
SEWER PUMP STATION 1 Item 2016 3 kW NA $43,674 $47,882 $44,375 $76,826 $0 $212,757
Subtotal: $212,757
CAPITAL COST DESCRIPTION QTY YEAR REQD DIA DEPTH LOCALE SOIL TYPE UNIT COST ADJ.
FACTOR
UNIT COST EX ADJ.
FACTOR UNIT COST TOTAL ASSET COST
(mm) (m) ($/m) ($/m) ($)
SEWER RISING MAIN 1 Item 2016 100 NA Urban Good Soil 1.00 $183 /m $183 /m $54,840
Subtotal: $54,840
Total: $6,348,427

Table A6 – Sewerage Capital Works Program (Yield Scenario 3)
CAPITAL COST DESCRIPTION QTY YEAR REQD DIA DEPTH LOCALE SOIL TYPE UNIT COST ADJ.
FACTOR
UNIT COST EX ADJ.
FACTOR UNIT COST TOTAL ASSET COST
(mm) (m) ($/m) ($/m) ($)
GRAVITY SEWER 3,385 m 2016 225 1.5-3.0m Urban Good Soil 1.00 $362 /m $362 /m $1,226,870
GRAVITY SEWER 2,794 m 2016 300 1.5-3.0m Urban Good Soil 1.00 $482 /m $482 /m $1,347,550
GRAVITY SEWER 557 m 2016 375 1.5-3.0m Urban Good Soil 1.00 $617 /m $617 /m $343,580
GRAVITY SEWER 1,174 m 2016 600 1.5-3.0m Urban Good Soil 1.00 $1,078 /m $1,078 /m $1,265,620
GRAVITY SEWER 1,979 m 2016 675 1.5-3.0m Urban Good Soil 1.00 $1,249 /m $1,249 /m $2,472,210
9889m Subtotal: $6,655,830
CAPITAL COST DESCRIPTION QTY YEAR REQD TOTAL KW RATING NOT USED CIVIL WORK COST MECH. WORKS ELEC. & TEL. COST EMERGENCEY
STORAGE COST OTHER COST TOTAL ASSET COST
(kW) ($) ($) ($) ($) ($) ($)
SEWER PUMP STATION 1 Item 2016 3 kW NA $43,674 $47,882 $44,375 $92,476 $0 $228,407
Subtotal: $228,407
CAPITAL COST DESCRIPTION QTY YEAR REQD DIA DEPTH LOCALE SOIL TYPE UNIT COST ADJ.
FACTOR
UNIT COST EX ADJ.
FACTOR UNIT COST TOTAL ASSET COST
(mm) (m) ($/m) ($/m) ($)
SEWER RISING MAIN 1 Item 2016 100 NA Urban Good Soil 1.00 $183 /m $183 /m $54,840
Subtotal: $54,840
Total: $6,939,077
Bahrs Scrub Local Development Area Master Planning
Infrastructure and Services Assessment
763778 Version FINAL 31 May 2012
Commercial in Confidence
Appendix D
Additional Services – Contact Details
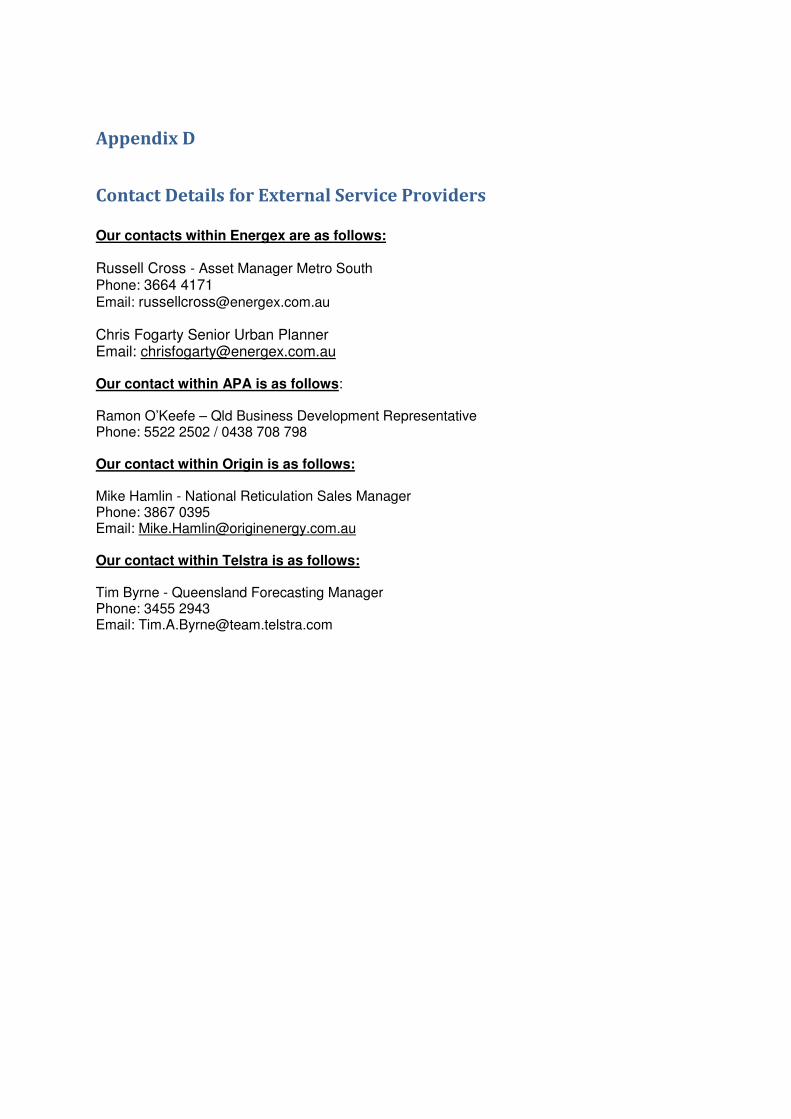
Appendix D
Contact Details for External Service Providers
Our contacts within Energex are as follows:
Russell Cross - Asset Manager Metro South Phone: 3664 4171
Email: [email protected]
Chris Fogarty Senior Urban Planner Email: [email protected] Our contact within APA is as follows: Ramon O’Keefe – Qld Business Development Representative Phone: 5522 2502 / 0438 708 798 Our contact within Origin is as follows: Mike Hamlin - National Reticulation Sales Manager Phone: 3867 0395 Email: [email protected] Our contact within Telstra is as follows: Tim Byrne - Queensland Forecasting Manager Phone: 3455 2943 Email: [email protected]
Bahrs Scrub Local Development Area Master Planning
Infrastructure and Services Assessment
763778 Version FINAL 31 May 2012
Commercial in Confidence
Appendix E
Additional Services – Supporting Information

Origin Energy Retail Ltd ABN 22 078 868 425 � GPO Box 1199, Adelaide SA 5001 Telephone 13 24 62 � Facsimile 1800 444 369 � originenergy.com.au
8 February 2011
K Nisbet Cardno Group Locked bag 4006, Fortitude Valley, Qld 4006
Dear Kerry
Metered LPG for Bahrs Scrub Local Development Area Thank you for discussing your new development with us and providing us with the opportunity to provide more information on how we can meet your business needs. Your choice in energy is a critical aspect of the new development and Origin is able to provide you with solutions to your energy requirements.
Metered LPG – how it works Origin installs Metered LPG networks within estates where natural gas is unavailable. Installing a Metered LPG network means gas is piped to homes and businesses from a storage tank providing ongoing LPG supply. We refill the tank on a regular delivery schedule so customers never run out of gas.
� Occurs in a shared trench along with other utility services � A storage facility site would be required, typically installed mainly aboveground
within a reserve or common utility area with trees visually concealing them or underground which conceals around 95% of the installation
� Unlike natural gas, LPG networks are owned and operated by Origin, where we are the sole supplier of gas to the consumers
� In most instances, a contribution fee is required by the developer and this depends on the actual capital required for each development. Typically contributions would range up to $700 per lot for aboveground and $1,200 for underground and would be confirmed on a case by case basis.
Why Metered LPG? Metered LPG allows developments without access to natural gas the following advantages:
� A constant supply of LPG for hot water, cooking and internal or external heating solutions for your customers
� A reduced investment on electrical networks as water heating, heating and cooking loads are transferred to metered networks
� Providing green environmentally friendly energy options allowing developers and builders to promote sustainable environmental projects to end users
� Providing a network system designed for natural gas should it become available � Improved safety for end users as a single storage tank is used instead of multiple
cylinder installations � More space for end users as individual cylinders are not required for LPG � Price competitive energy options for end users and no need to rent cylinders
Why Origin?A leading Australian companyOrigin has been supplying businesses with energy for over 150 years and today power more than three million homes and businesses. Our operations and interests span the energy supply chain, providing us with a unique perspective on the evolving energy market and the needs of our customers.
Our service commitment Origin offers a team with a wealth of expertise and experience in the Metered LPG business. Our team of experts has a depth of knowledge and skills within the energy industry to understand and meet your LPG requirements.
ATTACHMENT 1
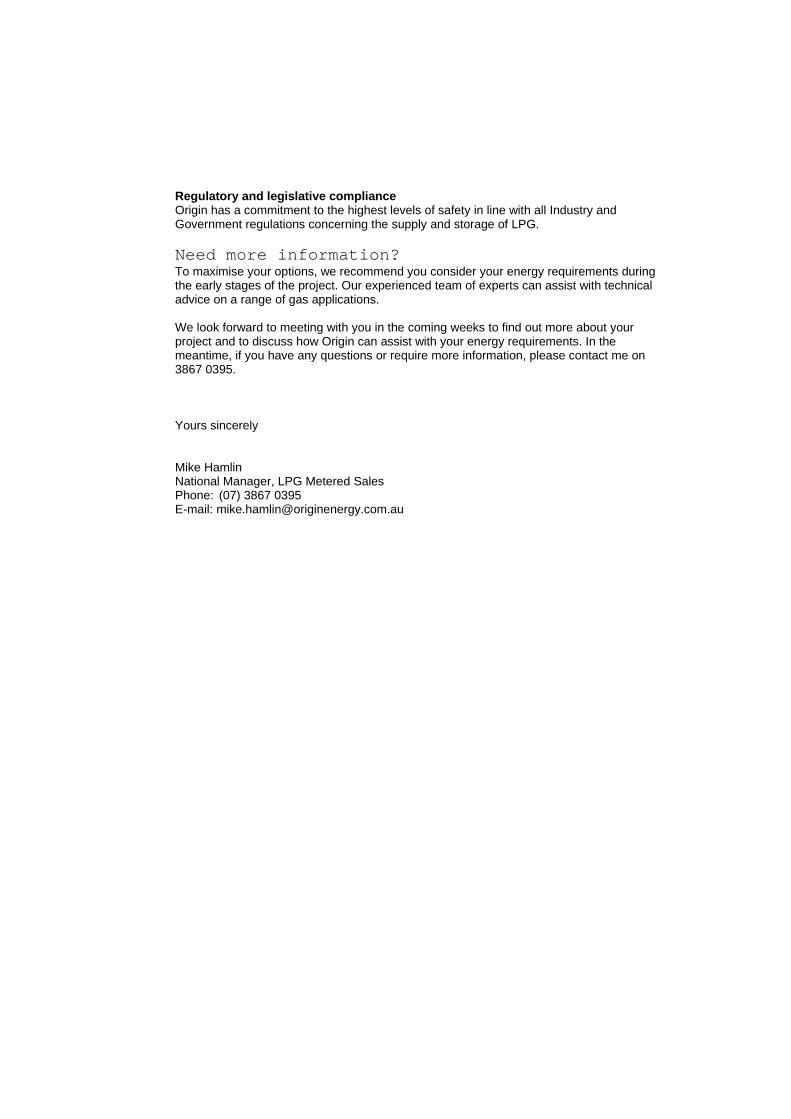
Regulatory and legislative compliance Origin has a commitment to the highest levels of safety in line with all Industry and Government regulations concerning the supply and storage of LPG.
Need more information?To maximise your options, we recommend you consider your energy requirements during the early stages of the project. Our experienced team of experts can assist with technical advice on a range of gas applications.
We look forward to meeting with you in the coming weeks to find out more about your project and to discuss how Origin can assist with your energy requirements. In the meantime, if you have any questions or require more information, please contact me on 3867 0395.
Yours sincerely
Mike Hamlin National Manager, LPG Metered Sales Phone: (07) 3867 0395 E-mail: [email protected]
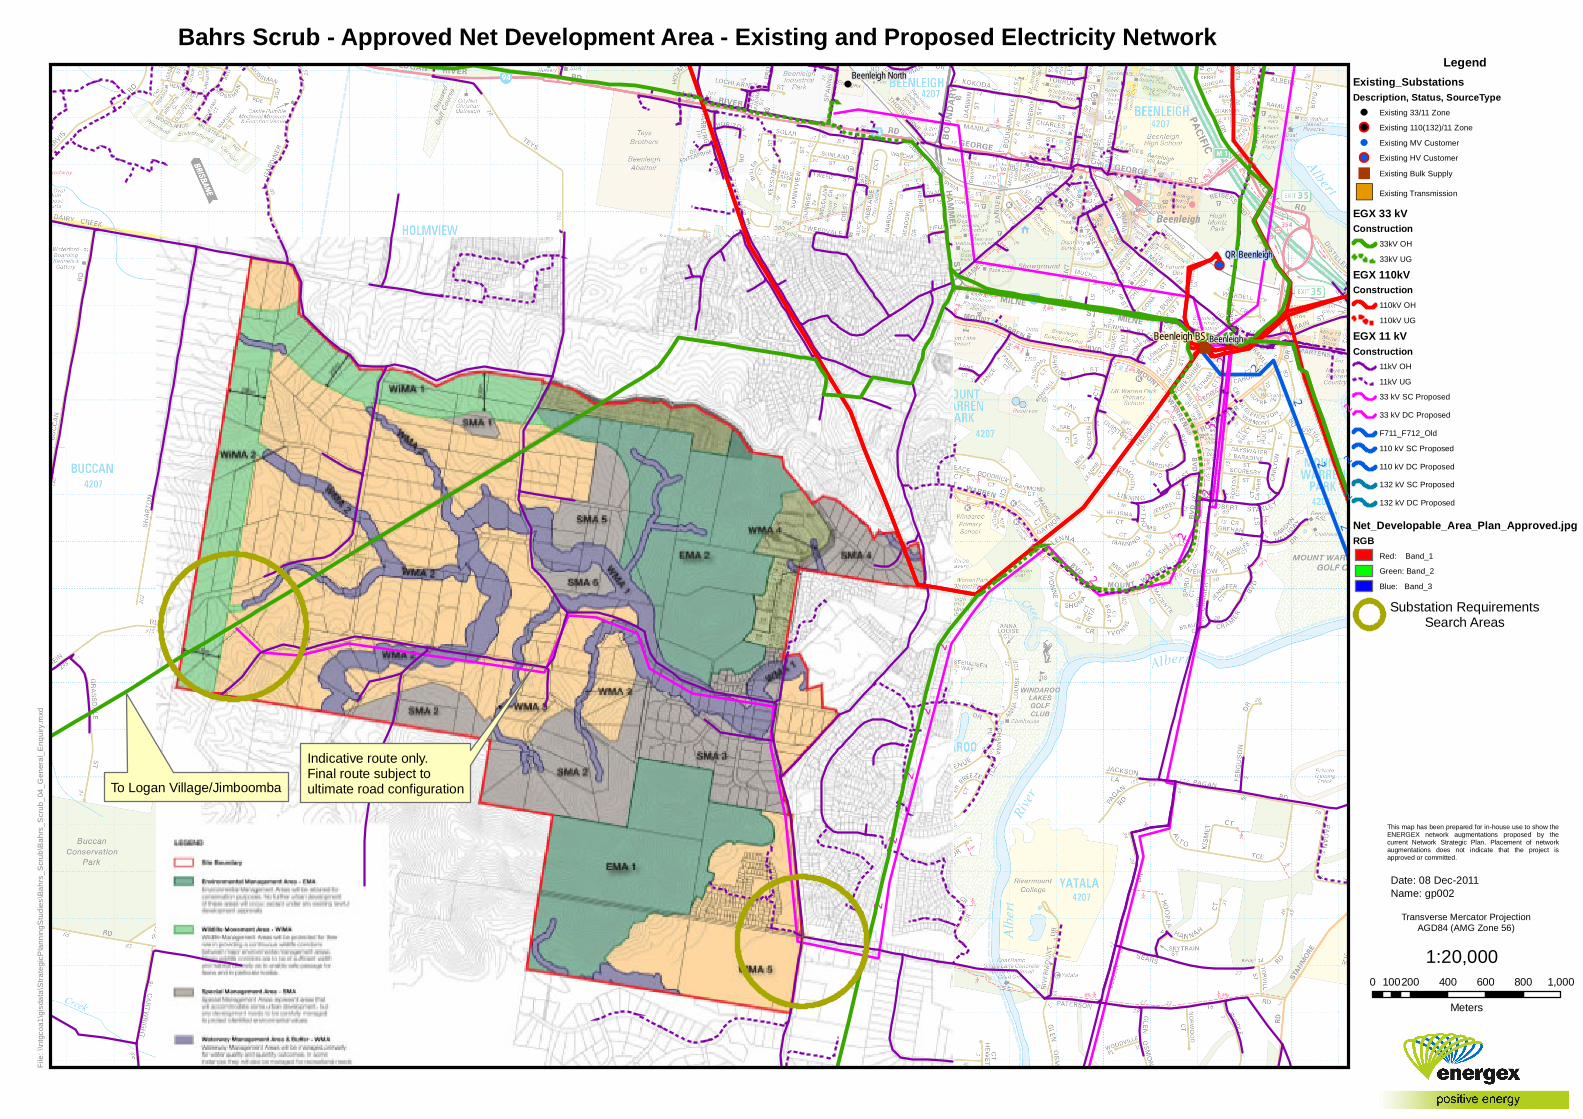
Beenleigh
Beenleigh North
QR Beenleigh
Beenleigh BS
LegendExisting_SubstationsDescription, Status, SourceType
Existing 33/11 ZoneExisting 110(132)/11 ZoneExisting MV CustomerExisting HV CustomerExisting Bulk Supply
Existing Transmission
EGX 33 kVConstruction
33kV OH33kV UG
EGX 110kVConstruction
110kV OH110kV UG
EGX 11 kVConstruction
11kV OH11kV UG33 kV SC Proposed33 kV DC ProposedF711_F712_Old110 kV SC Proposed110 kV DC Proposed132 kV SC Proposed132 kV DC Proposed
Net_Developable_Area_Plan_Approved.jpgRGB
Red: Band_1Green: Band_2Blue: Band_3
Bahrs Scrub - Approved Net Development Area - Existing and Proposed Electricity Network
1:20,0000 200 400 600 800 1,000100
Meters
File:
\\ntgc
oa1\g
isdata
\Stra
tegicP
lannin
gStud
ies\Ba
hrs_S
crub\B
ahrs_
Scrub
_04_
Gene
ral_E
nquir
y.mxd
Transverse Mercator ProjectionAGD84 (AMG Zone 56)
This map has been prepared for in-house use to show theENERGEX network augmentations proposed by thecurrent Network Strategic Plan. Placement of networkaugmentations does not indicate that the project isapproved or committed.
Date: 08 Dec-2011Name: gp002
To Logan Village/Jimboomba
Substation RequirementsSearch Areas
Indicative route only. Final route subject to ultimate road configuration
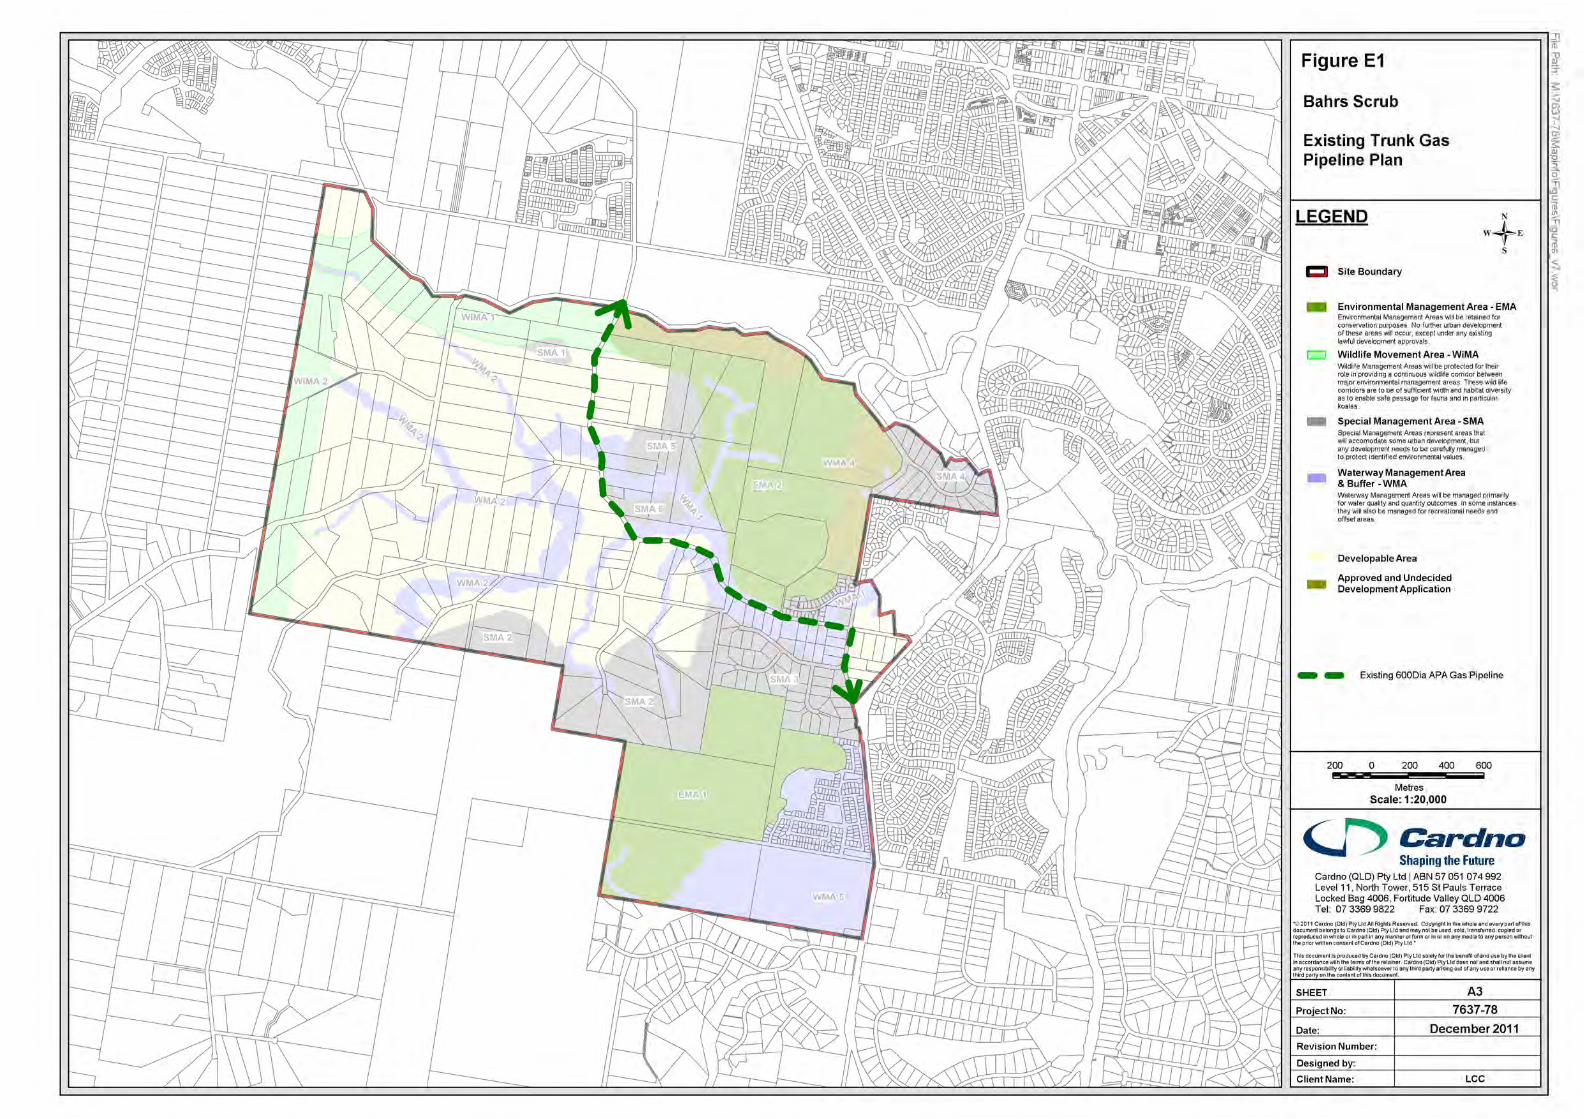
Top Related