


Languages
Pages
Legal

USING ECOGNITION TO AUTOMATICALLY DETECT AND MAP AVALANCHE
DEPOSITS FROM THE SPRING 2009 AVALANCHE CYCLE IN THE TATRA MTS.,
SLOVAKIA
R. Frauenfelder a,0F*, M. J. Lato b, M. Biskupič c,d
a Norwegian Geotechnical Institute, P.O. Box 3930 Ullevaal Stadion, 0806 Oslo, Norway – [email protected] b BGC Engineering Inc., Ottawa ON, Canada – [email protected]
c Avalanche Prevention Center, Dr. J. Gašperíka 598, 033 01 Liptovský Hrádok , Slovakia – [email protected] d Institute for Environmental Studies, Charles University, Ovocný trh 3-5, 116 36 Praha 1, Czech Republic
KEY WORDS: Avalanche debris detection, Tatra Mountains, Slovakia, eCognition
ABSTRACT:
Here we present results from ongoing work where we apply an object oriented mapping algorithm developed in eCognition in order
to automatically identify and digitally map avalanche deposits. The algorithm performance is compared with respect to a selected
number of manually digitized avalanche outlines mapped by avalanche experts.
* Corresponding author
1. INTRODUCTION
1.1 The March 2009 avalanche cycle in the High Tatras
The Tatra Mountains, located in the border region between
Slovakia and Poland, experienced several severe avalanche
cycles during spring 2009. The peak was reached between
March 25-31, 2009, when an estimated number of more than
200 avalanches were observed in the area of the Tatra national
park on an area of approximately 738 km2.
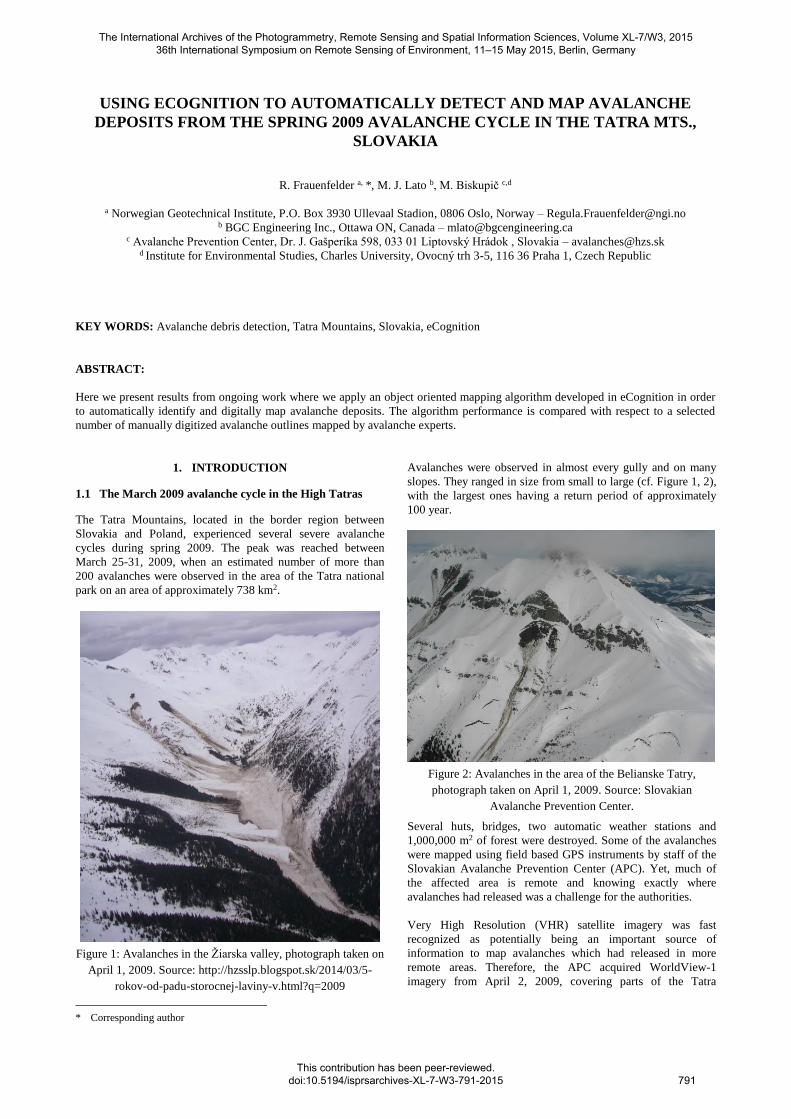
Figure 1: Avalanches in the Žiarska valley, photograph taken on
April 1, 2009. Source: http://hzsslp.blogspot.sk/2014/03/5-
rokov-od-padu-storocnej-laviny-v.html?q=2009
Avalanches were observed in almost every gully and on many
slopes. They ranged in size from small to large (cf. Figure 1, 2),
with the largest ones having a return period of approximately
100 year.
Figure 2: Avalanches in the area of the Belianske Tatry,
photograph taken on April 1, 2009. Source: Slovakian
Avalanche Prevention Center.
Several huts, bridges, two automatic weather stations and
1,000,000 m2 of forest were destroyed. Some of the avalanches
were mapped using field based GPS instruments by staff of the
Slovakian Avalanche Prevention Center (APC). Yet, much of
the affected area is remote and knowing exactly where
avalanches had released was a challenge for the authorities.
Very High Resolution (VHR) satellite imagery was fast
recognized as potentially being an important source of
information to map avalanches which had released in more
remote areas. Therefore, the APC acquired WorldView-1
imagery from April 2, 2009, covering parts of the Tatra
The International Archives of the Photogrammetry, Remote Sensing and Spatial Information Sciences, Volume XL-7/W3, 2015 36th International Symposium on Remote Sensing of Environment, 11–15 May 2015, Berlin, Germany
This contribution has been peer-reviewed. doi:10.5194/isprsarchives-XL-7-W3-791-2015
791

Mountains, in order to detect and map avalanches in regions
that were inaccessible for the field teams.
1.2 Avalanche mapping techniques
1.2.1 Traditional methods: With few exceptions in densely
studied areas (e.g., around avalanche research stations), snow
avalanches are, in general, relatively poorly mapped. This is
commonly due to the remote location of their occurrence. Often
avalanches are only reported if they caused fatalities, led to an
obstruction to public infrastructure, damage to personal
property, or are witnessed and reported by local observers.
However, decisions regarding, e.g., the closure of roads and the
setting of warning levels, rely on information derived from
knowledge of historic events in combination with
meteorological data of the recent past and expected future.
The general practiced routine for mapping snow avalanches
relies on two main techniques: a) the first technique involves a
field mission to map the extent and location of avalanche start-
zones and runout-zones by hand, by amateur photographs, or
with a GPS device. Problems related to this method are poor
accessibility of the terrain due to avalanche danger, that only
small areas can be surveyed, and that surveys only can be
conducted in good weather. b) The second commonly used
technique for mapping snow avalanches is the visual analysis
and digitising of aerial photographs or optical remote-sensing
imagery (Scott, 2009). Both methods require expert
involvement and visual identification of an occurred snow
avalanche.
Identified and mapped avalanches are usually used to nourish
avalanche data bases, also known as avalanche cadastres. A
small section of an avalanche map based on data from the
Slovakian avalanche cadastre (accessible online at
http://mapy.hiking.sk/) is visualised in Figure 3. In this map, the
length of the avalanche paths is the longest ever recorded in a
given avalanche path.
Figure 3: Slovakian avalanche map, example from the Žiarska
valley. Blue colour = slopes with an infrequent occurrence of
avalanches; yellow = slopes with frequent occurrence of
avalanches; red = slopes with very frequent occurrence of
avalanches. Triangular shapes in orange, red and yellow within
a given avalanche frequency zone mark avalanche paths with a
higher frequency than the respective zone they are located in
would indicate. (Map source: Copyright © HZS, hiking.sk,
SHOcart)
Such maps are used to estimate regional susceptibility, to
perform risk assessments and, eventually, to design hazards
maps which directly link to policy making, i.e., to land use
planning and land use regulations. More frequent information
on avalanche occurrences provides decision makers with
knowledge of the frequency of avalanches as well as details
regarding the size and extent of such events. It becomes,
therewith, evident that the more and better observations that are
available, the more reliable avalanche databases and avalanche
maps can become.
1.2.2 Applying VHR optical imagery: The ability to
automatically identify snow avalanches using VHR optical
imagery greatly assists in the development of such accurate,
spatially widespread, detailed maps and databases of areas
historically prone to avalanches.
Recent developments in the field of imaging sensors and data
processing techniques in the last two decades have resulted in
the use of remotely sensed data for various and diverse
applications for hazard mapping. Advancements in data
collection techniques are producing imagery at previously
unprecedented and unimaginable spatial, spectral, radiometric
and temporal resolution. The advantages of using remotely
sensed data vary by topic, but generally include safer evaluation
of unstable and/or inaccessible regions, high spatial resolution,
spatially continuous and multi-temporal mapping capabilities
(change detection) and automated processing possibilities. Of
course, as with every method, there are also disadvantages
involved with the use of remotely sensed data. These are
generally in relation to the lack of ground truth data available
during an analysis and to data acquisition costs.
Recent publications in the literature on the use of optical remote
sensing for hazard applications include, among others: landslide
and rockfall evaluation (e.g., Mantovani et al., 1996; Roessner
et al., 2005; Miller et al., 2012;), flood mapping and modelling
(e.g., Townsend and Walsh, 1998; Sanyal and Lu, 2004),
glacier- and permafrost related hazard assessements (e.g., Kääb
et al., 2005) and avalanche detection (Bühler et al., 2009; Lato
et al., 2012). An extensive list of various satellite and airborne
sensors with sufficient resolution for such analyses is given in,
for example, Lato et al. (2012).
2. DATA AND RESULTS
The Slovakian Avalanche Prevention Center (APC) acquired
WorldView-1 imagery from April 2, 2009, which covered large
parts of the Tatra Mountains. While the eastern part of the
imagery (Figure 4) was totally cloud-free, featuring a stunning
quality, the western part was largely cloud-covered, thus,
hampering its further use for avalanche detection, both for
manual and automatic detection.
2.1 Algorithm training
The algorithm that we applied was originally designed to
perform on data from a multi-band, 12-bit opto-electronic
pushbroom scanner by Leica (ADS40-SH52; cf., Bühler et al.,
2009) and on VHR optical imagery from the QuickBird satellite
(cf., Lato et al., 2012). The algorithm was subsequently trained
further on WorldView-1 imagery from Norway (not discussed
here) and using the south-eastern third of the Slovakian imagery
(marked with a blue rectangle in Figure 4).
The International Archives of the Photogrammetry, Remote Sensing and Spatial Information Sciences, Volume XL-7/W3, 2015 36th International Symposium on Remote Sensing of Environment, 11–15 May 2015, Berlin, Germany
This contribution has been peer-reviewed. doi:10.5194/isprsarchives-XL-7-W3-791-2015
792
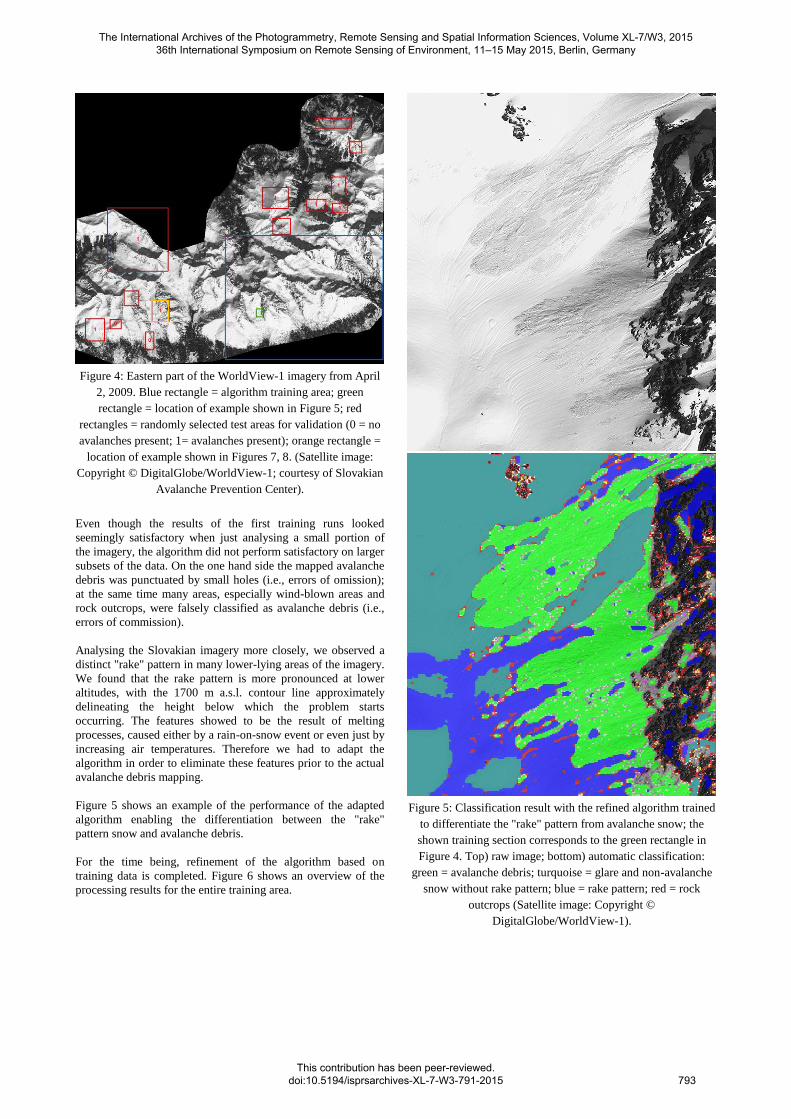
Figure 4: Eastern part of the WorldView-1 imagery from April
2, 2009. Blue rectangle = algorithm training area; green
rectangle = location of example shown in Figure 5; red
rectangles = randomly selected test areas for validation (0 = no
avalanches present; 1= avalanches present); orange rectangle =
location of example shown in Figures 7, 8. (Satellite image:
Copyright © DigitalGlobe/WorldView-1; courtesy of Slovakian
Avalanche Prevention Center).
Even though the results of the first training runs looked
seemingly satisfactory when just analysing a small portion of
the imagery, the algorithm did not perform satisfactory on larger
subsets of the data. On the one hand side the mapped avalanche
debris was punctuated by small holes (i.e., errors of omission);
at the same time many areas, especially wind-blown areas and
rock outcrops, were falsely classified as avalanche debris (i.e.,
errors of commission).
Analysing the Slovakian imagery more closely, we observed a
distinct "rake" pattern in many lower-lying areas of the imagery.
We found that the rake pattern is more pronounced at lower
altitudes, with the 1700 m a.s.l. contour line approximately
delineating the height below which the problem starts
occurring. The features showed to be the result of melting
processes, caused either by a rain-on-snow event or even just by
increasing air temperatures. Therefore we had to adapt the
algorithm in order to eliminate these features prior to the actual
avalanche debris mapping.
Figure 5 shows an example of the performance of the adapted
algorithm enabling the differentiation between the "rake"
pattern snow and avalanche debris.
For the time being, refinement of the algorithm based on
training data is completed. Figure 6 shows an overview of the
processing results for the entire training area.
Figure 5: Classification result with the refined algorithm trained
to differentiate the "rake" pattern from avalanche snow; the
shown training section corresponds to the green rectangle in
Figure 4. Top) raw image; bottom) automatic classification:
green = avalanche debris; turquoise = glare and non-avalanche
snow without rake pattern; blue = rake pattern; red = rock
outcrops (Satellite image: Copyright ©
DigitalGlobe/WorldView-1).
The International Archives of the Photogrammetry, Remote Sensing and Spatial Information Sciences, Volume XL-7/W3, 2015 36th International Symposium on Remote Sensing of Environment, 11–15 May 2015, Berlin, Germany
This contribution has been peer-reviewed. doi:10.5194/isprsarchives-XL-7-W3-791-2015
793
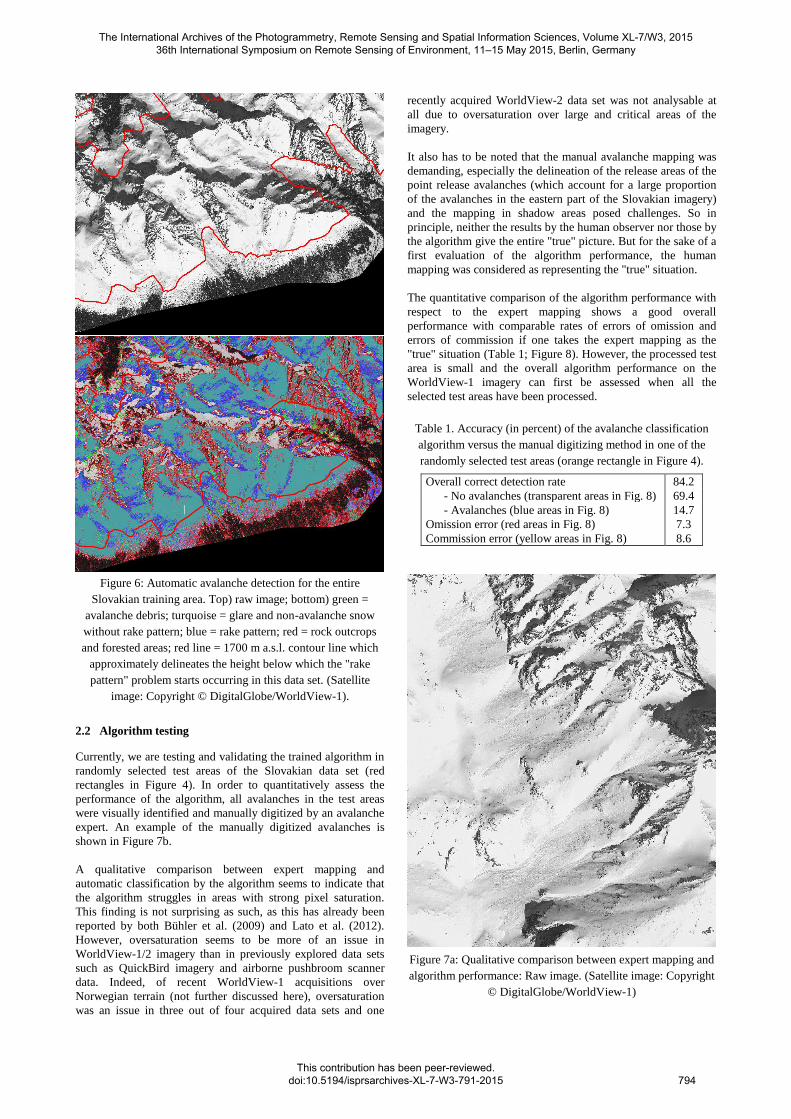
Figure 6: Automatic avalanche detection for the entire
Slovakian training area. Top) raw image; bottom) green =
avalanche debris; turquoise = glare and non-avalanche snow
without rake pattern; blue = rake pattern; red = rock outcrops
and forested areas; red line = 1700 m a.s.l. contour line which
approximately delineates the height below which the "rake
pattern" problem starts occurring in this data set. (Satellite
image: Copyright © DigitalGlobe/WorldView-1).
2.2 Algorithm testing
Currently, we are testing and validating the trained algorithm in
randomly selected test areas of the Slovakian data set (red
rectangles in Figure 4). In order to quantitatively assess the
performance of the algorithm, all avalanches in the test areas
were visually identified and manually digitized by an avalanche
expert. An example of the manually digitized avalanches is
shown in Figure 7b.
A qualitative comparison between expert mapping and
automatic classification by the algorithm seems to indicate that
the algorithm struggles in areas with strong pixel saturation.
This finding is not surprising as such, as this has already been
reported by both Bühler et al. (2009) and Lato et al. (2012).
However, oversaturation seems to be more of an issue in
WorldView-1/2 imagery than in previously explored data sets
such as QuickBird imagery and airborne pushbroom scanner
data. Indeed, of recent WorldView-1 acquisitions over
Norwegian terrain (not further discussed here), oversaturation
was an issue in three out of four acquired data sets and one
recently acquired WorldView-2 data set was not analysable at
all due to oversaturation over large and critical areas of the
imagery.
It also has to be noted that the manual avalanche mapping was
demanding, especially the delineation of the release areas of the
point release avalanches (which account for a large proportion
of the avalanches in the eastern part of the Slovakian imagery)
and the mapping in shadow areas posed challenges. So in
principle, neither the results by the human observer nor those by
the algorithm give the entire "true" picture. But for the sake of a
first evaluation of the algorithm performance, the human
mapping was considered as representing the "true" situation.
The quantitative comparison of the algorithm performance with
respect to the expert mapping shows a good overall
performance with comparable rates of errors of omission and
errors of commission if one takes the expert mapping as the
"true" situation (Table 1; Figure 8). However, the processed test
area is small and the overall algorithm performance on the
WorldView-1 imagery can first be assessed when all the
selected test areas have been processed.
Table 1. Accuracy (in percent) of the avalanche classification
algorithm versus the manual digitizing method in one of the
randomly selected test areas (orange rectangle in Figure 4).
Overall correct detection rate 84.2
- No avalanches (transparent areas in Fig. 8) 69.4
- Avalanches (blue areas in Fig. 8)
Omission error (red areas in Fig. 8)
14.7
7.3
Commission error (yellow areas in Fig. 8) 8.6
Figure 7a: Qualitative comparison between expert mapping and
algorithm performance: Raw image. (Satellite image: Copyright
© DigitalGlobe/WorldView-1)
The International Archives of the Photogrammetry, Remote Sensing and Spatial Information Sciences, Volume XL-7/W3, 2015 36th International Symposium on Remote Sensing of Environment, 11–15 May 2015, Berlin, Germany
This contribution has been peer-reviewed. doi:10.5194/isprsarchives-XL-7-W3-791-2015
794

Figure 7b: Qualitative comparison between expert mapping and
algorithm performance: manually digitized avalanche outlines
(in pink) superimposed on the automatically classified
avalanches (in green). (Satellite image: Copyright ©
DigitalGlobe/WorldView-1)
Figure 8: Quantitative comparison between expert mapping and
algorithm performance. Blue = mapped as avalanche snow by
both methods; red = only mapped as avalanche snow by manual
method; yellow = only mapped as avalanche snow by algorithm.
(Satellite image: Copyright © DigitalGlobe/WorldView-1).
3. CONCLUSIONS
We presented results of avalanche debris detection by an
automatic detection algorithm implemented within eCognition.
The method described and illustrated above is flexible and
easily adaptable to different sensors and image quality, however
it requires further testing and validation before, e.g.,
implementation in an operational setting is possible.
ACKNOWLEDGEMENTS
This contribution was partly funded by the ESA PRODEX
project ASAM ("Towards an automated snow property and
avalanche mapping system"; contract no. 4000107724). The
satellite image from the Tatra Mountains was obtained with the
support of the Slovakian Ministry of Interior, Department of
Scientific and Technological Development. Kristine Ekseth
(NGI) is acknowledged for her help during an early phase of the
algorithm training and Galina Ragulina (NGI) for her
meticulous manual mapping of the numerous avalanches in the
presented data set.
REFERENCES
Bühler, Y., Hüni, A., Christen, M., Meister, R., Kellenberger, T.
2009. Automated detection and mapping of avalanche deposits
using airborne optical remote sensing data. Cold Reg. Sci.
Technol., 57, 99–106.
Kääb, A., Huggel, C., Fischer, L., Guex, S., Paul, F., Roer, I.,
Salzmann, N., Schlaefli, S., Schmutz, K., Schneider, D.,
Strozzi, T., Weidmann, Y. 2005. Remote sensing of glacier- and
permafrost-related hazards in high mountains: an overview. Nat.
Hazards Earth Syst. Sci., 5, 527–554, doi:10.5194/nhess-5-527-
2005.
Lato, M., Frauenfelder, R., Bühler, Y. 2012. Automated
detection of snow avalanche deposits: segmentation and
classification of optical remote sensing imagery. Nat. Haz. And
Earth. Syst. Sci., 12, 2893–2906. doi:10.5194/nhess-12-2893-
2012.
Mantovani, R., Soeters, R., van Western, C. J. 1996. Remote
sensing techniques for landslide studies and hazard zonation in
Europe. Geomorphology, 15, 213–225.
Miller, P.E., Mills, J.P., Barr, S.L., Birkinshaw, S.J., Hardy,
A.J., Parkin, G., Hall, S.J. 2012. A Remote Sensing Approach
for Landslide Hazard Assessment on Engineered Slopes.
Geoscience and Remote Sensing, IEEE Transactions, 50(4), pp.
1048, 1056, doi: 10.1109/TGRS.2011.2165547.
Roessner, R., Wetzel, H.-U., Kaufmann, H., Sarnagoev, A.
2005. Potential of Satellite Remote Sensing and GIS for
Landslide Hazard Assessment in Southern Kyrgyzstan (Central
Asia). Natural Hazards, 35(3), 395–416.
Sanyal, J., Lu, X.X. 2004. Application of Remote Sensing in
Flood Management with Special Reference to Monsoon Asia: A
Review. Natural Hazards, 33(2), pp. 283–301.
Townsend, P.A., Walsh, S.J. 1998. Modeling floodplain
inundation using an integrated GIS with radar and optical
remote sensing. Geomorphology, 21(3–4), pp. 295–312.
The International Archives of the Photogrammetry, Remote Sensing and Spatial Information Sciences, Volume XL-7/W3, 2015 36th International Symposium on Remote Sensing of Environment, 11–15 May 2015, Berlin, Germany
This contribution has been peer-reviewed. doi:10.5194/isprsarchives-XL-7-W3-791-2015
795
Top Related