


Languages
Pages
Legal

PhD Course in Basic and Developmental Neuroscience
Head: Prof. Giovanni Cioni
“Autism Spectrum Disorders: from clinical identification
to neuroimaging detection of brain abnormalities”
Tutor Candidate
Prof. Filippo Muratori Dr.ssa Sara Calderoni
CYCLE XXIII (2008-2010)
SSD MED 39

ii
Contents
Abstract …………………………………………………………………………………………………. iv
Introduction …………………………………………………………………………………………………. 1
Chapter 1 Screening for Autism Spectrum Disorders (ASD) ………………..…… 4
1.1 Early ASD identification ………………………………………………………….. 4
1.2 Preliminary data from the first Italian screening for ASD …............ 6
Chapter 2 Identification of ASD preschoolers ………………………………………….. 9
2.1 Child Behavior Checklist for Ages 1½-‐5 (CBCL) ……………………….. 9
2.2 Methods …………………………………………………………………………………. 11 2.3 Data analysis ………………………………………………………………………….. 13 2.4 Results …………………………………………………………………………………… 14 2.5 Discussion ……………………………………………………………………………… 21 2.6 Conclusions …………………………………………………………………………… 24
Chapter 3 Head circumference growth in ASD ………………………………………… 26
3.1 Introduction …………………………………………………………………………… 26
3.2 Methods and materials …………………………………………………………… 29 3.3 Results …………………………………………………………………………………… 30
3.4 Discussion ……………………………………………………………………………… 34 Chapter 4 Structural magnetic resonance techniques ……………………………….. 38
4.1 Voxel-‐based morphometry ……………………………………………………… 38
4.2 Diffusion tensor imaging (DTI) ……………………………………………… 39
Chapter 5 A DTI study in ASD ………………………………………………………………… 42
5.1 Introduction …………………………………………………………………………… 42
5.2 Methods and materials …………………………………………………………… 43 5.3 Results …………………………………………………………………………………… 48
5.4 Discussion ……………………………………………………………………………… 49 Chapter 6 Voxel-‐based morphometry in ASD females ………………………………. 52
6.1 Introduction …………………………………………………………………………… 52
6.2 Methods and materials …………………………………………………………… 55

iii
6.3 Results …………………………………………………………………………………. 62
6.4 Discussion ……………………………………………………………………………. 70
6.5 Conclusions …………………………………………………………………………… 77
Selected references ……………………………………………………………………………………… 78
References ………………………………………………………………………………………………… 80

iv
v
Abstract
This thesis collects doctoral studies about early autism spectrum disorders (ASD) clinical
identification and early ASD detection of brain magnetic resonance imaging (MRI)
abnormalities. The work has been organized in five parts. In particular, the first report
regards a screening population program for early ASD identification, purposely suited by Prof.
Muratori and its research group and carried out by pediatricians of ASL 1 in all children of
Massa-‐Carrara district twice, i.e. at 12 and 18 months of age. The second work is a
retrospective study about growth of head circumference (HC) during the first 14 months of
age, in children with ASD compared to typical developing children. Respect to anthropometric
measurement of control group, courtesy provided by pediatricians Dr. Becattini and Dr.
Soldateschi, children subsequently diagnosed as ASD show in the first six months of life
significantly excessive growth of HC. Nevertheless, the mechanism for ASD brain enlargement
remains to be elucidated and it is unknown whether brain enlargement is a cause or
consequence of ASD. The third report analyzes the capacity of CBCL parent-‐report
questionnaire to discriminate between ASD patients, subjects with other psychiatric disorders
and typical children and investigates on its possible use as a ASD screening instrument for
children between 18 and 60 months of ages. The fourth research is implemented in
cooperation with the Natbrainlab laboratory (Institute of Psychiatry, King’s College Hospital
London), directed by Dr. Marco Catani, with the aim of detecting structural connectivity
differences between ASD patients and control subjects by means diffusion tensor imaging
(DTI) measurements. The fifth and last study stems from the strong collaboration with the
Istituto Nazionale di Fisica Nucleare (INFN) and concerns a structural MRI investigation on
female children with ASD, a population poorly investigated in ASD neuroimaging studies and,
for this reason, considered as “research orphan”.
vi
Riassunto
Questa tesi raccoglie gli studi effettuati nel corso del dottorato riguardanti il riconoscimento
clinico precoce dei disturbi dello spettro autistico (DSA) e l’identificazione precoce tramite
risonanza magnetica (RM), delle anomalie cerebrali nei pazienti DSA. Il lavoro è stato
organizzato in cinque parti. In particolare, il primo resoconto riguarda un programma di
screening per l’identificazione precoce dei DSA, messo a punto dal Prof. Muratori e dal suo
gruppo di ricerca e condotto dai pediatri di libera scelta della ASL 1 con una duplice
valutazione, effettuata a 12 e a 18 mesi di vita in tutti i bambini della provincia di Massa-‐
Carrara. Il secondo lavoro è uno studio retrospettivo sulla crescita della circonferenza cranica
(CC) nei primi 14 mesi di vita in bambini con DSA confrontati con bambini con uno sviluppo
tipico. Rispetto alle misure antropometriche del gruppo di controllo, cortesemente fornite dai
pediatri Dott.ssa Becattini e Dott. Soldateschi, i bambini successivamente diagnosticati come
DSA mostrano nei primi sei mesi di vita una crescita significativamente maggiore della CC.
Tuttavia, il meccanismo alla base dell’aumento cerebrale e il suo ruolo nell’eziopatogenesi dei
DSA rimangono argomenti da chiarire. La terza ricerca analizza la capacità del questionario
CBCL compilato dai genitori di discriminare tra pazienti con DSA, soggetti con altri disturbi
psichiatrici e bambini con sviluppo tipico e indaga inoltre il suo possibile utilizzo come
strumento di screening per i DSA nei bambini di età compresa tra i 18 e i 60 mesi. Il quarto
lavoro è stato progettato in collaborazione con il laboratorio Natbrainlab (Institute of
Psychiatry, King’s College Hospital London), diretto dal Dott. Marco Catani, ed ha lo scopo di
individuare eventuali differenze nella connettività strutturale tra i pazienti DSA e i soggetti di
controllo attraverso misure derivate dall’imaging del tensore di diffusione (DTI). Il quinto e
ultimo studio nasce dalla forte collaborazione con l’Istituto Nazionale di Fisica Nucleare
(INFN) e riguarda un’indagine di RM strutturale focalizzata sulle bambine con DSA, una
popolazione scarsamente presa in considerazione dagli studi di neuroimmagine nei DSA e

vii
pertanto considerata “research orphan”.
1
Introduction
Autistic Disorder –AD-‐, Asperger Syndrome –AS-‐ and Pervasive Developmental Disorder Not
Otherwise Specified –PDD-‐NOS-‐ (referred to hereafter as Autistic Spectrum Disorders, -‐ASD-‐)
are a class of neurodevelopmental pathologies characterized by a triad of early symptoms:
qualitative impairments in social interaction and in social communication, alongside
unusually restricted or stereotyped interests and behaviours (American Psychiatric
Association, 2000). The pathogenesis remains unclear in more than 90% of cases (Fombonne,
2003), in which the pathology is defined as "idiopathic", i.e. triggered by interactions between
multiple, unknown genes and environmental factors (Bailey et al. 1996; Trottier et al. 1999).
ASD is a relative common disability, with a prevalence of 1:110 children in the U.S (Centers for
Disease Control and Prevention -‐CDC-‐, 2009) increasing almost ten-‐fold from studies
published fifty years ago. Remains to be elucidated if it is a true increase in the prevalence of
ASD or a consequence of: a) changing criteria (inclusion of milder cases, such individuals with
PDD-‐NOS – first appeared as a new category in the Diagnostic and Statistical Manual of Mental
Disorders, Third Edition, Revised DSM-‐III-‐R-‐ and AS -‐included for the first time in the DSM-‐IV)
b) changing characteristics (enhanced inclusion of ASD subjects without mental retardation,
i.e. high-‐functioning autism); c) diagnostic substitution (inclusion of children that were
diagnosed as having conditions such as idiopathic mental retardation, speech impairment and
learning disability -‐Shattuck 2006-‐); d) increased early recognition (reconductable to higher
public awareness and parents knowledge of ASD symptomatology and, on the other hand, to
employment of screening tools and more reliable evaluation instruments by health care
professionals).
Currently, ASD is only defined on the basis of a select set of behavioral abnormalities that map
onto specific functional circuitry of the brain. The difficulties with social reciprocity,

2
communication, and restricted and repetitive behaviors and interests that occur with ASD
suggest that the syndrome affects a diverse and widely distributed set of neural systems.
There is converging evidence that ASD is associated with structural and/or functional brain
abnormalities. In particular, several volumetric MRI studies, in agreement with clinical
measurement of head circumference, have demonstrated that ASD brain undergoes atypical
patterns of growth during early postnatal life and thus it is accompanied by subtle and
spatially distributed differences in brain anatomy in comparison with typical development
subjects. In particular, differences in regional grey matter (GM) and white matter (WM)
volumes have been found by several neuroimaging laboratories, according to voxel-‐based
morphometry (VBM) studies of structural T1 brain MRI data. Theoretic models suggest that
one consequence of an increased brain size in ASD patients will be an alteration of neural
connectivity that in its turn could determine a distorted information transfer characterized by
local over-‐connectivity and long-‐range under-‐connectivity. New procedures for studying brain
connectivity include diffusion tensor imaging (DTI), a non-‐invasive magnetic-‐resonance
method that can identify the presence of subtle WM abnormalities in the absence of
volumetric changes detectable by conventional MRI. Recent studies on DTI data have reported
abnormal connectivity patterns in the brains of ASD subjects that may be accompanied by
decreases in white matter integrity. On the other hand, functional magnetic resonance
imaging (fMRI) has shed some light on which brain regions show functional abnormality in
ASD, revealing, for example, altered functional activity in the brain region that strongly
supports language and communication abilities, as well as social perception and social
cognition.
However, the considerable heterogeneity of results between existing studies requires further
work to better characterize both the GM and the WM abnormalities. Several studies on this
topic are actually affected by the limiting factor of an exiguous sample size and/or

3
heterogeneity investigated age range that disturbs clear hypothesis about brain
developmental trajectories.
Our research can be subdivided into two main domains:
1) clinical studies on early ASD diagnosis by means a population screening program, a parent-‐
report questionnaire and a seriate measurement of early head circumference;
2) MRI studies on brain volumetric and structural connectivity (DTI) data in ASD children.
In particular, the following aspects will be trated in the thesis:
Chapter 1 focuses on the challenge of early ASD identification and presents the preliminary
data of a pilot ASD screening study.
Chapter 2 presents the final data of a doctoral study on the identification of preschoolers
with ASD through a care-‐giver-‐completed behavioral checklist, the Child Behavior Checklist
for Ages 1½-‐5 (CBCL 1½-‐5).
Chapter 3 shows the final data of a doctoral study on abnormal head circumference (HC)
growth during the first months of life in children with ASD.
Chapter 4 describes neuroimaging techniques (diffusion tensor imaging –DTI-‐, voxel based
morphometry –VBM-‐) applied to the in vivo study of the brain in children with ASD.
Chapter 5 illustrates the final data of a doctoral study on VBM in female children with ASD.
Chapter 6 reports the preliminary data of an ongoing doctoral study on DTI in children with
ASD.

4
Chapter 1
Screening for Autism Spectrum Disorders 1.1 Early ASD identification Early diagnosis is a crucial step to ameliorate outcome of children with Autism Spectrum
Disorders (ASD); in fact a timely, intensive and specialized treatment can have a beneficial
impact and achieve encouraging results for both language and cognitive skills as well as social
functioning (Bristol, 1996; Dawson, 2010; Harris and Handleman, 2000; Landa, 2008; Matson,
2007; National Research Council, 2001; Reichow, 2009; Rogers and Lewis, 1989; Rogers,
2008; Stone, 1999-‐2001; Szatmari, 2003): this assumption has led the American Academy of
Pediatrics (AAP; 2006) to recommend a screening for ASD in all 18-‐ and 24-‐month-‐olds
children.
In clinical practice, in order to realize a standardized diagnostic evaluation in young children
referred for possible ASD, the Autism Diagnostic Observation Schedule-‐Generic (ADOS-‐G;
Lord et al., 2000) and the Autism Diagnostic Interview – Revised (ADI-‐R; Rutter et al., 2003)
are widely used and accepted as a “gold standard" diagnostic instrument. However, these
tools were not developed for the purpose of an initial screening of autism during a well-‐being
check-‐up, because they are lengthy, require extensive training, skill and experience on the
part of the examiner to be administered and appropriately interpreted (Scambler et al., 2001);
for these reasons they can be considered second level instruments (Filipek et al., 2000).
In the absence of a standardized, validated and reliable screening protocol for ASD (for a
review see Barbaro et al., 2009 and Zwaigenbaum et al., 2009), different studies have
proposed behavior checklists and questionnaires for detect ASD during the first years of life,
searching for good sensitivity and specificity (Baron-‐Cohen et al., 1992; Dietz et al., 2006; Gray
et al., 2008; Oosterling et al, 2009; Pierce et al., 2009; Robins et al., 2001; Reznick et al., 2006;
Wetherby et al., 2004). In fact, even if most parents of children with ASD first become

5
concerned about their child’s development between 12 and 23 months of age (Baghdadli et al.,
2003; Chawarska et al., 2007; Coonrod et al., 2004; Cox et al., 1999; De Giacomo et al., 1998;
Frith and Soares, 1993; Lord, 1995; Ozonoff et al., 2009), several months may elapse before
they discuss it with their child’s physician and there may be a further delay between the
paediatric visit and ASD diagnosis. This implies that these toddlers are not professionally
diagnosed until approximately 3 years or older (Howlin et al., 1997; Howlin and Asgharian,
1999; Maestro et al, 1999; Mandell et al., 2002; Mandell et al., 2005; Sivberg et al, 2003;
Wiggins et al., 2006).
The implications of this gap extend far beyond developmental gains associated with early
intervention; in fact, most parents of children with autism experience considerable amounts
of stress owing to the fact that they parenting a child with atypical development, and the
uncertainty of diagnosis accentuates parental anxiety (Doussard-‐Roosvelt et al., 2003).
Since parents are for the most part reliable informants, checklists and questionnaires can help
clinicians to point out the actual risk for ASD, provide a prompt assessment procedure, and
reduce the lag between parental concerns and treatment (Wiggins et al., 2006).
Some screening instruments are developed in order to identify very young children with ASD
(for a review, see Robins et al., 2006; Johnson et al., 2007 and Pinto-‐Martin et al., 2008), while
others provide informations about general developmental and behavioral disorders (Briggs-‐
Gowan et al., 2006; Carter et al., 1999; DeGangi et al., 1995; Doig et al., 1999; Gadow &
Sprafkin 1997, 2000; Glascoe et al., 1997; Matson et al., 2010).
Difficulty in early recognize ASD subjects
In the second year of life (Palomo et al., 2006) consistent behavioral differences could be
identified between children subsequently diagnosed as ASD and typical subjects. The attempt
to diagnose ASD children before the age of 24 months is hampered by the fact that ASD
symptomatology usually emerge gradually over time (Ozonoff et al., 2008) and earliest

6
abnormalities of children subsequently diagnosed as ASD are often non-‐specific (sleeping,
eating, temperament alterations). Moreover, prospective studies on younger siblings of ASD
patients (children with an higher genetic risk of developing an ASD) show the absence of
group differences during the first year of life (Bryson et al., 2007; Landa et al., 2006; Nadig et
al., 2007; Yirmiya et al., 2007; Zwaigenbaum et al., 2005): only by 12 months, developmental
differences begin to differentiate ASD from typical subjects.
1.2 Preliminary data from the first Italian screening for ASD.
In the present study, we used two screening programs, at 12 and 18 months, each of them
combining a parent-‐report instrument with a task the child has been submitted to by
the paediatrician. The aim is to identify children at risk of ASD in a community-‐based sample
through the application of the presented screening protocol. The first screening program
consists in its turn of two different levels. At first level: a) parents fill out First Year Inventory
(FYI; Baraneck et al., 2003); b) paediatricians carry out the “response to name” task during
medical well-‐child visits. At second level, children who failed “response to name” and/or met
a score above the cut-‐off in Social-‐Communication Domain and/or in Total score at FYI were
evaluated by an expert child psychiatrist with the Autism Observation Scale for Infants (AOSI;
Bryson et al., 2007). The second screening program was realized at 18 months of age through
a) the filling out by parents of Modified Checklist for Autism in Toddlers (M-‐CHAT) b) the
“joint attention” task administered by paediatrician.
7
Methods
Subjects
A preliminary ongoing sample is composed of 180 children recruited in a primary care setting.
Chronological (or corrected in preterm) age of 12 months (within two weeks before or after
the baby’s first birthday), absence of severe sensory or motor impairments and absence of
identified genetic disorders were the inclusion criteria.
Measures
First Year Inventory: is a 63-‐item parent-‐report questionnaire developed as a general
population-‐screening tool to identify 12-‐month old infants that might be at-‐risk for autism or
a related developmental disorder. The FYI comprises two broad developmental domains:
social communication and sensory regulatory functions. Established cut-‐off score are 10 for
the Social Domain and 8 for the Total score.
Autism Observation Scale for Infants: is a brief set of tasks intended to discriminate children
with ASD from other children in infancy and has shown promising results as low as 12
months.
Modified Checklist for Autism in Toddlers: is a 23-‐item parent-‐report questionnaire that is used
as a screening tool for autism in toddlers between 18 and 30 months.
Results
Among the 180 children participating in first level screening, 8 were considered at risk (in
particular: 3 of them failed both tasks, while the remaining 5 passed the response to name
task, but went beyond the fixed cut-‐off at the FYI). The AOSI was employed as second level
screening instruments on all 8 subjects, in order to reduce false positive. Only one child failed
the task and was therefore referred to a diagnostic and therapeutic assessment. The
remaining 7 children will undergo a neuropsychiatric evaluation at 15 months of age to
monitor chiefly the socio-‐communicative skills. In order to minimize the false negative results,

8
all the 180 children of the sample will be re-‐evaluated at 18 months (second screening
program) and finally at their third year of life.
Conclusions
This double screening program could be a promising instrument to detect children at risk for
ASD, but larger samples are necessary in order to define its most effective use.

9
Chapter 2
The CBCL 1½-‐5 and the identification of preschoolers with autism
spectrum disorders.
2.1 Child Behavior Checklist for Ages 1½-‐5 (CBCL)
The CBCL 1½-‐5 (Achenbach & Rescorla, 2000; Frigerio et al., 2006) is a 100 item parent-‐
report measure designed to record the maladaptive behaviour of preschoolers. Each item
describes a specific behavior and the parent is asked to rate its frequency on a three-‐point
Likert scale (0 = not true; 1 = somewhat or sometimes true; 2 = very true or often true). The
scoring gives summary profiles (including Internalizing, Externalizing and Total problems
scores), syndrome profiles (i.e. Emotionally Reactive, Anxious/Depressed, Somatic
Complaints, Withdrawn, Sleep Problems, Attention Problems, and Aggressive Behavior), and
five different DSM-‐Oriented scales (Affective Problems, Anxiety Problems, Pervasive
Developmental Problems, Attention Deficit/Hyperactive Problems and Oppositional Defiant
Problems). A T-‐score of 63 and above for summary scales, and of 70 and above for syndrome
and DSM-‐Oriented scales, are generally considered clinically significant; values between 60
and 63 for summary scales, or between 65 and 70 for syndrome and DSM-‐oriented scales,
identify the borderline clinical range; values under 60 or under 65 are not-‐clinical. Scores and
profiles for each child were obtained thanks to a computer scoring software. Each profile has
an easy-‐reading layout, which allows to immediately understanding if the scores are in
normal, borderline or clinical range. For our research aim we focus on the Pervasive
Developmental Problems scale (Table 2.1.), which is composed of 13 item that seemed to best
fit with DSM-‐IV-‐TR criteria based on clinical judgement.
Among evaluation instruments, CBCL is the most widely used parent report checklist that
measures a broad range of behavioral and emotional problems (Bird et al, 1987; Achenbach et
10
al, 1987; Crijen et al, 1999), displays adequate reliability and validity (Achenbach & Rescorla
2000) and requires little effort (it takes 5-‐10 min for parents to complete and 5 min to score).
Almost twenty-‐years-‐ago, Rescorla was the first researcher to use CBCL for preschoolers with
autism (Rescorla, 1988). In this study the emergence of an autistic factor suggested that a
future use of the CBCL as a possible instrument to recognize children with autism might be
fruitful. However, after Rescorla’s investigation, only a few studies have applied CBCL to
young children with autism (Duarte et al., 2003; Eisenhower et al., 2005; Hartley et al., 2008-‐
2009).
In more recent years the CBCL was reformulated as ASEBA (Achenbach System of Empirically
Based Assessment) where the preschool form, the CBCL 1½-‐5, was identified and used in
different settings (Rescorla, 2005). The 100 problem item of the CBCL 1½-‐5 allows for both
empirically based summary and syndrome scales and the new DSM-‐oriented scales
(Achenbach and Rescorla, 2000). To construct these new DSM-‐oriented scales, the
relationship between DSM IV diagnostic criteria for ASD and item of CBCL 1½-‐5 were studied
(Krol et al., 2006). During the last years we have used this CBCL form for preliminary
assessment in our second level neuropsychiatric clinic and we assumed, over time, that
clinically significant elevations on the PDP scale was in good agreement with clinical ASD
diagnosis. Our observation is supported by a recent paper that applied the CBCL 1½-‐5 to a
sample of children referred to a third level autism program (Sikora et al., 2007), and where it
was suggested that it can be a useful behavioral checklist for screening ASD.
ASD screening tools covers until about the child’s first two years of life, but early identification
programs couldn’t be available in every area (e.g.: in Italy, few regions performs screening
ASD survey) or the disorder could be recognized only later, especially if belong to regressive
onset (Werner et al., 2005) or if the level of impairment is subtle (Wiggins et al., 2006). In
11
these cases may be useful an instrument that helps a non-‐ASD-‐specialistic clinician to identify
developmental anomalies not previously detected.
The overall purpose of the present investigation is to provide more detailed understanding of
the predictive properties of the CBCL 1½-‐5 and in particular the Pervasive Developmental
Problems (PDP) scale as an instrument to address a preschooler ASD diagnosis in a non-‐
specialistic setting.
2.2 Methods
Participants
A total of 313 children aged 18-‐71 months were included in the study. Participants were
divided into three groups: 1) an experimental group of 101 children (85 males and 16
females) affected by an ASD; 2) a control group of 95 children (43 males and 52 females) with
other psychiatric disorders (OPD); 3) a second control group of 117 pre-‐schoolers (65 males
and 52 females) with Typical Development (TD). Demographic characteristics of patients and
controls are summarized in Table 1. All the ASD subjects were consecutively admitted to the
Division of Child Neuropsychiatry of the University of Pisa, Scientific Institute ‘Stella Maris’
(Pisa, Italy) between September 2005 and June 2008 and diagnosed based on DSM-‐IV-‐TR
criteria coupled with clinical judgments made by a research child psychiatrist and an
experienced clinically trained research child psychologist with expertise in autism and
confirmed by ADOS-‐G. Laboratory tests to rule-‐out medical causes of autism included
audiometry, standard karyotyping, fragile X testing, and metabolic screening; brain imaging
and EEG were performed when there was a clinical indication.
In the OPD group, diagnostic assessment were made by two experienced child psychiatrists
and ASD was clinically eliminated; in order to support the exclusion of an ASD, the Childhood
Autism Rating Scales (CARS; Schopler et al, 1986) was applied to this sample and all the
children showed a total score less than or equal to 21, i.e. much less than 30, the cut-‐off point

12
for an ASD diagnosis. This clinical control group was recruited at the Department of Infant
Psychiatry of the same Scientific Institute; final diagnosis of these children, according to the
Diagnostic and Statistical Manual of Mental Disorders criteria (DSM-‐IV-‐TR; 2000) or
Diagnostic and Classification of Mental Health and Developmental Disorders of Infancy and
Early Childhood system, Revised Edition (DC: 0-‐3; 2005) was affective disorders for 59
subjects, oppositional defiant disorder for 25 subjects, and mixed disorders (adjustment
disorder, reactive attachment disorder, encopresis, or feeding disorder) for 11 subjects, in the
absence of mental retardation. Children with a clinical diagnosis of attention deficit
hyperactivity disorder (ADHD), multi-‐system developmental disorder (MSDD) or regulatory
disorder were excluded from this sample in order to avoid a possible, partial overlap with
ASD symptoms.
The sample with TD was collected in three urban kindergartens in Pisa, Tuscany (Italy); were
excluded subjects with whatever internistic problems or/and some parent or teacher concern
about child development. The whole group (ASD, OPD and TD) was composed of Caucasian
children of Italian descent belonging mostly to middle/upper middle class families according
to the Hollingshead and Redlich criteria (1958). There were no differences in socio-‐economic
status among the three groups of patients.
The study was approved by the research ethics boards of the Stella Maris Scientific Institute.
13
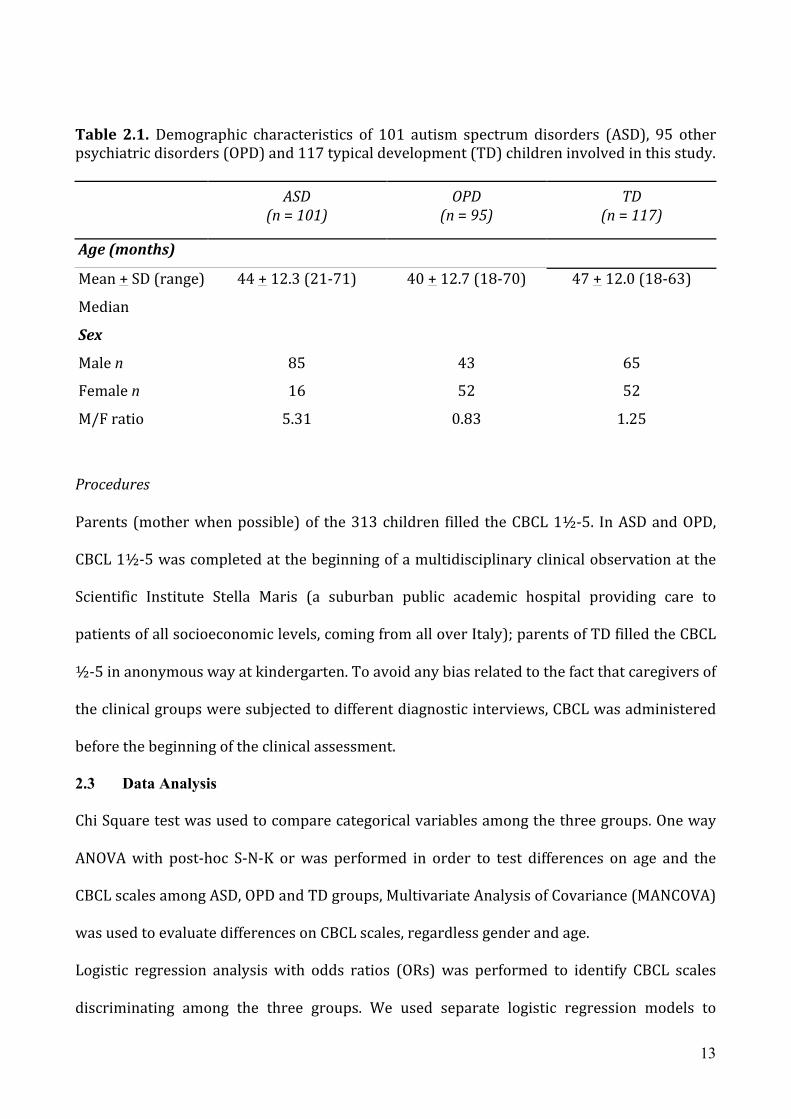
Table 2.1. Demographic characteristics of 101 autism spectrum disorders (ASD), 95 other psychiatric disorders (OPD) and 117 typical development (TD) children involved in this study.
ASD
(n = 101) OPD
(n = 95) TD
(n = 117)
Age (months)
Mean + SD (range) 44 + 12.3 (21-‐71) 40 + 12.7 (18-‐70) 47 + 12.0 (18-‐63)
Median
Sex
Male n 85 43 65
Female n 16 52 52
M/F ratio 5.31 0.83 1.25
Procedures
Parents (mother when possible) of the 313 children filled the CBCL 1½-‐5. In ASD and OPD,
CBCL 1½-‐5 was completed at the beginning of a multidisciplinary clinical observation at the
Scientific Institute Stella Maris (a suburban public academic hospital providing care to
patients of all socioeconomic levels, coming from all over Italy); parents of TD filled the CBCL
½-‐5 in anonymous way at kindergarten. To avoid any bias related to the fact that caregivers of
the clinical groups were subjected to different diagnostic interviews, CBCL was administered
before the beginning of the clinical assessment.
2.3 Data Analysis
Chi Square test was used to compare categorical variables among the three groups. One way
ANOVA with post-‐hoc S-‐N-‐K or was performed in order to test differences on age and the
CBCL scales among ASD, OPD and TD groups, Multivariate Analysis of Covariance (MANCOVA)
was used to evaluate differences on CBCL scales, regardless gender and age.
Logistic regression analysis with odds ratios (ORs) was performed to identify CBCL scales
discriminating among the three groups. We used separate logistic regression models to

14
compare ASD with TD and ASD with OPD. In Model 1, the independent variable was CBCL
Total score; in Model 2, the independent variables were Internalizing and Externalizing
scores; in Model 3 the independent variables were syndrome scales; in Model 4 the
independent variables were the five different DSM-‐Oriented scales.
CBCL scales which were identified as predictors of an ASD diagnosis in the logistic regression
analysis at p<.001 were used in a receiver operating characteristic (ROC) analysis, in order to
determine their optimal cut-‐offs to differentiate children with ASD from children with TD or
OPD.
In the ROC analysis, sensitivity and specificity were plotted over the range of cutoff points.
The area under the curve (AUC) represents the accuracy of the instrument in predicting
children who will have or will not have ASD. The interpretation of the AUC values is
traditionally as follows: an AUC<0.7 suggests “low” diagnostic accuracy; an AUC from 0.7 to
0.9 suggests “moderate” diagnostic accuracy; an AUC≥0.9 suggests “high” diagnostic accuracy
(Sweet and Picket, 1982).
Analyses were carried out using SPSS version 15.0 for Windows (SPSS Inc. Chicago, IL, USA).
2.4 Results
Participant characteristics
Overall, 313 subjects were recruited (61% males and 38% females, mean age 43.8±12.5
months).
Chi-‐square analysis revealed a significant difference between gender distribution among ASD,
OPD and TD groups (Chi-‐square=36.32, p<0.001), in particular the percentage of females was
significantly lower in the ASD group as compared to the other two groups.
A one-‐way ANOVA indicated a significant difference in age among the groups (F[2,310]=5.20,
p=0.006); S-‐N-‐K post hoc test revealed that the difference was due to the younger age of the

15
OPD compared to TD group (p=0.005); no differences were found between ASD and TD and
between ASD and OPD.
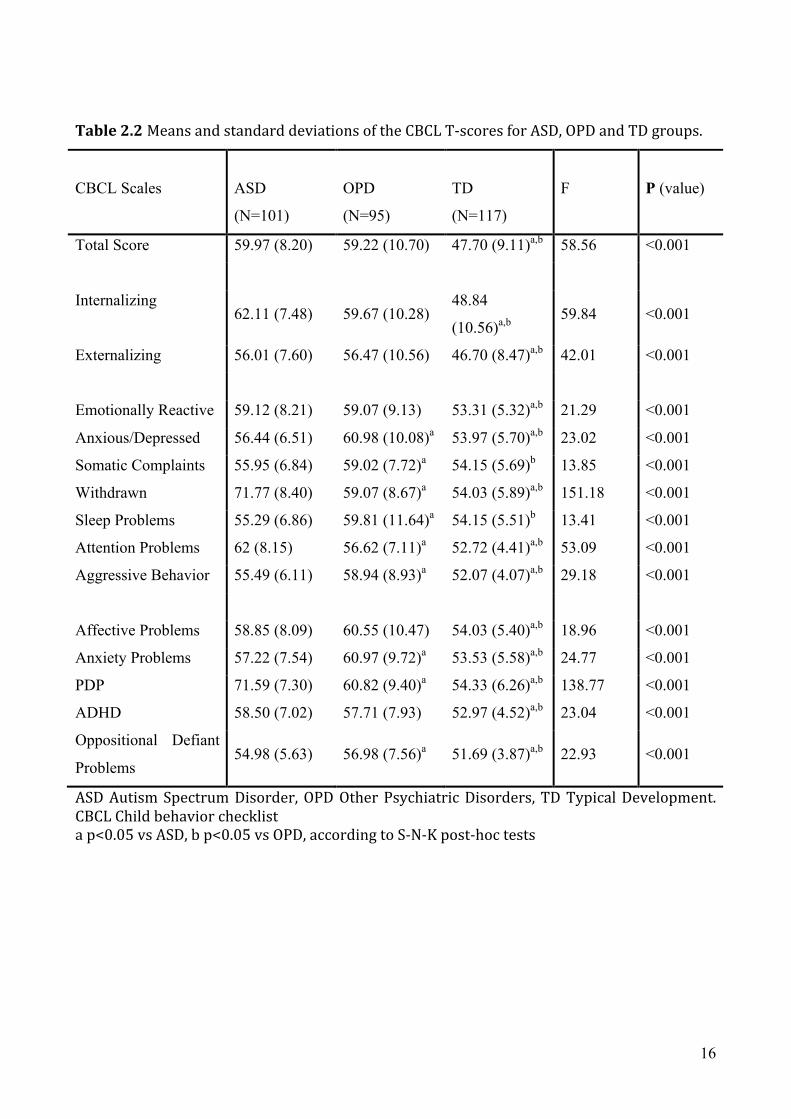
Clinical characteristics
Analysis of Variance comparing ASD, OPD and TD groups revealed that ASD and OPD groups
had significantly higher scores in all CBCL scales than TD group, except for Somatic
Complaints and Sleep Problems scales that were not significantly different between ASD and
TD groups. Moreover, ASD group presented higher scores than OPD group on Withdrawn and
Attention Problems scales of the CBCL syndrome profile and on PDP scale of the CBCL DSM-‐
Oriented. OPD group had higher scores compared to ASD on Anxious/Depressed, Somatic
Complaints, Sleep Problems, and Aggressive Behavior scales of the CBCL syndrome profile
and on Anxiety Problems and Oppositional Defiant Problems of the CBCL DSM-‐Oriented scales
(Table 2.2.).
Using MANCOVA we found that the results were not significantly different after controlling for
age and gender.
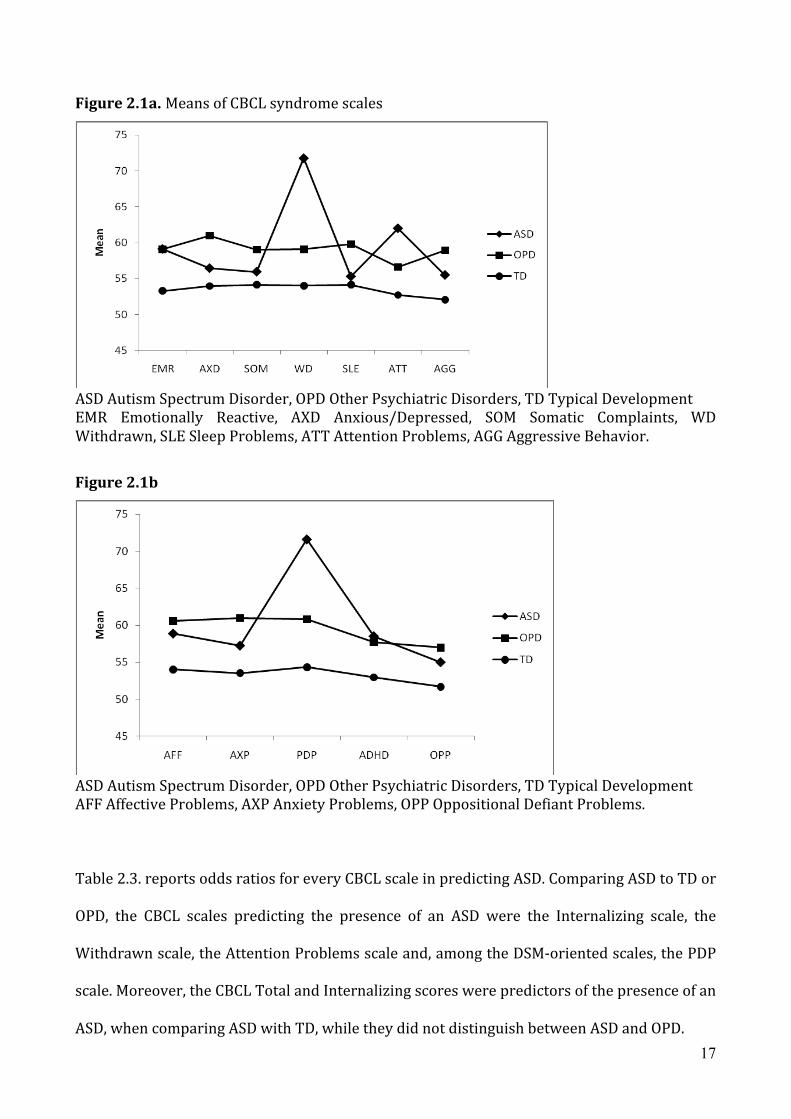
Figure 2.1a and 2.1b show CBCL profiles of the three groups on the syndrome scales and the
DSM-‐Oriented scales, respectively.
16
Table 2.2 Means and standard deviations of the CBCL T-‐scores for ASD, OPD and TD groups.
CBCL Scales
ASD
(N=101)
OPD
(N=95)
TD
(N=117)
F P (value)
Total Score 59.97 (8.20) 59.22 (10.70) 47.70 (9.11)a,b 58.56 <0.001
Internalizing 62.11 (7.48) 59.67 (10.28)
48.84
(10.56)a,b 59.84 <0.001
Externalizing 56.01 (7.60) 56.47 (10.56) 46.70 (8.47)a,b 42.01 <0.001
Emotionally Reactive 59.12 (8.21) 59.07 (9.13) 53.31 (5.32)a,b 21.29 <0.001
Anxious/Depressed 56.44 (6.51) 60.98 (10.08)a 53.97 (5.70)a,b 23.02 <0.001
Somatic Complaints 55.95 (6.84) 59.02 (7.72)a 54.15 (5.69)b 13.85 <0.001
Withdrawn 71.77 (8.40) 59.07 (8.67)a 54.03 (5.89)a,b 151.18 <0.001
Sleep Problems 55.29 (6.86) 59.81 (11.64)a 54.15 (5.51)b 13.41 <0.001
Attention Problems 62 (8.15) 56.62 (7.11)a 52.72 (4.41)a,b 53.09 <0.001
Aggressive Behavior 55.49 (6.11) 58.94 (8.93)a 52.07 (4.07)a,b 29.18 <0.001
Affective Problems 58.85 (8.09) 60.55 (10.47) 54.03 (5.40)a,b 18.96 <0.001
Anxiety Problems 57.22 (7.54) 60.97 (9.72)a 53.53 (5.58)a,b 24.77 <0.001
PDP 71.59 (7.30) 60.82 (9.40)a 54.33 (6.26)a,b 138.77 <0.001
ADHD 58.50 (7.02) 57.71 (7.93) 52.97 (4.52)a,b 23.04 <0.001
Oppositional Defiant
Problems 54.98 (5.63) 56.98 (7.56)a 51.69 (3.87)a,b 22.93 <0.001
ASD Autism Spectrum Disorder, OPD Other Psychiatric Disorders, TD Typical Development. CBCL Child behavior checklist a p<0.05 vs ASD, b p<0.05 vs OPD, according to S-‐N-‐K post-‐hoc tests
17
Figure 2.1a. Means of CBCL syndrome scales
ASD Autism Spectrum Disorder, OPD Other Psychiatric Disorders, TD Typical Development EMR Emotionally Reactive, AXD Anxious/Depressed, SOM Somatic Complaints, WD Withdrawn, SLE Sleep Problems, ATT Attention Problems, AGG Aggressive Behavior.
Figure 2.1b
ASD Autism Spectrum Disorder, OPD Other Psychiatric Disorders, TD Typical Development AFF Affective Problems, AXP Anxiety Problems, OPP Oppositional Defiant Problems.
Table 2.3. reports odds ratios for every CBCL scale in predicting ASD. Comparing ASD to TD or
OPD, the CBCL scales predicting the presence of an ASD were the Internalizing scale, the
Withdrawn scale, the Attention Problems scale and, among the DSM-‐oriented scales, the PDP
scale. Moreover, the CBCL Total and Internalizing scores were predictors of the presence of an
ASD, when comparing ASD with TD, while they did not distinguish between ASD and OPD.

18
Table 2.3. Odds Ratio and 95% Confidence Interval in ASD vs. OPD and ASD vs. TD
CBCL Scales
ASD vs OPD ASD vs TD
p OR 95%CI p OR 95%CI
Model 1
Total Score .447 1.01 0.98 to 1.04 .000 1.17 1.12 to 1.23
Model 2
Internalizing .014 1.05 1.01 to 1.10 .000 1.13 1.07 to 1.18
Externalizing .116 0.96 0.92 to 1 .015 1.07 1.01 to 1.13
Model 3
Emotionally Reactive .063 1.10 0.99 to 1.22 .047 1.10 1 to 1.21
Anxious/Depressed .001 0.85 0.78 to 0.94 .099 0.91 0.82 to 1.01
Somatic Complaints .024 0.87 0.78 to 0.98 .132 0.92 0.83 to 1.02
Withdrawn .000 1.32 1.2 to 1.45 .000 1.29 1.19 to 1.39
Sleep Problems .723 0.98 0.90 to 1.06 .145 0.92 0.82 to 1.02
Attention Problems .001 1.17 1.06 to 1.29 .000 1.18 1.07 to 1.30
Aggressive Behavior .000 0.75 0.66 to 0.86 .303 0.92 0.70 to 1.07
Model 4
Affective Problems .216 0.96 0.90 to 1.02 .334 0.95 0.87 to 1.04
Anxiety Problems .000 0.87 0.81 to 0.94 .035 0.91 0.83 to 0.99
PDP .000 1.27 1.18 to 1.37 .000 1.34 1.23 to 1.45
ADHD .970 1 0.93 to 1.07 .099 1.08 0.98 to 1.19
Oppositional Defiant Problems .110 0.93 0.85 to 1.10 .885 0.99 0.86 to 1.13
ROC analyses
Because Withdrawn, Attention Problem and PDP scales have been identified as the best
predictors of the probably presence of ASD in the logistic regression analysis, we have used
ROC analyses to estimate the best cut-‐offs for these scales (Figure 2.2). In Table 2.4.
sensitivity, specificity, negative and positive predictive values and area under the curve (at the
optimal cut-‐offs for the three scales in discriminating ASD from TD and OPD) are reported.

19
ASD vs TD
ROC analysis indicated that in discriminating ASD from TD group the optimal compromise
between sensitivity and specificity was achieved at a score of 65 both on PDP and Withdrawn
scales (PDP scale: AUC=0.947; 95% CI 0.920–0.975; Withdrawn scale: AUC=0.945; 95% CI
0.914–0.977).
For the PDP scale the sensitivity was 0.85, indicating the proportion of actual ASD subjects
who were correctly identified as such and the specificity was 0.90 indicating the proportion of
actual TD subjects who were correctly identified. The score of 65 yielded a positive predictive
value of 0.88 (i.e., the proportion of individuals with a score of 65 or more who were
diagnosed in the ASD group) and a negative predictive value of 0.87 (i.e., the proportion of
individuals with a score less than 65 who were diagnosed in the TD group).
For the Withdrawn scale the sensitivity was 0.85 and the specificity was 0.92 (PPN=0.90,
PNV=0.90).
For the Attention Problems the best cut-‐off discriminating ASD from TD was 55 (AUC=0.850;
95% CI 0.799–0.902) with a positive predict value and a negative predict value near to 0.80.
ASD vs OPD
In order to discriminate ASD from OPD using the PDP scale the optimal cut-‐off was 65
(AUC=0.813; 95% CI 0.753-‐0.873), the proportion of subjects with ASD who were correctly
diagnosed was 0.85 (sensitivity) and the proportion of cases with OPD who were correctly
diagnosed was 0.60 (specificity) (PPV=0.69, PNV=0.79).
For Withdrawn scale the optimal compromise between sensitivity and specificity was
achieved at a score of 62 and for the Attention Problems scale the optimal cut-‐off was 55.

20
Table 2.4 Sensitivity, specificity, PPV and PNV at the best cutoff points in the Withdrawn,
Attention Problems and PDP scales of the CBCL, discriminating ASD from OPD and TD.
ASD vs TD ASD vs OPD
Withdrawn
(cutoff=65)
Attention
Problems
(cutoff=55)
PDP
(cutoff=65)
Withdrawn
(cutoff=62)
Attention
Problems
(cutoff=55)
PDP
(cutoff=65)
Sensitivity 89% 72% 85% 89% 72% 85%
Specificity 92% 80% 90% 65% 55% 60%
PPV 90% 76% 88% 72% 63% 69%
PNV 90% 77% 87% 87% 55% 79%
AUC 0.945 0.850 0.947 0.850 0.704 0.813
Sweet & Picket criteria for AUC interpretation (1982) High Moderate High Moderate Moderate Moderate
Figure 2.2 Receiver operating curve (ROC) for Withdrawn (red), Attention Problems (yellow)
and PDP (blu) scales. Under the figures are reported Sensitivity, Specificity, PPV and PNV at the
best cutoff points in the three CBCL scales discriminating ASD vs TD and ASD vs OPD.

21
2.5 Discussion
The lack of medical tests or biological markers for identifying ASD has led researchers to
concentrate on behavioural anomalies in order to detect early signs of autism. As
recommended by the Practice Parameters of the AACN (Filipek et al., 2000), an appropriate
and timely ASD diagnosis requires two different level of investigation: 1) a routine
developmental surveillance and 2) an exhaustive evaluation restricted to children identified
at risk at level 1. The aim of the present study was to investigate the possible use of CBCL 1½-‐
5 PDP scale as a level 1 tool to support non-‐specialized professionals (e.g. a paediatrician) in
their ability to detect behaviours that are suggestive of an ASD. In fact, in primary care
settings it is not possible to provide a thorough evaluation of emotional and behavioural
disorders; nevertheless, in this context brief and validated tools must be used in order to
redirect families for an in-‐depth examination by professionals experienced in developmental
disabilities and in the administration of the ADOS which is widely accepted as a gold standard
diagnostic instrument for autism.
The present study has examined CBCL 1½-‐5 as one of these level 1 instruments. Results from
Odd ratios and ROC analysis to evaluate discriminative ability of CBCL scales suggest the
following considerations.
First, we confirm the validity of the PDP scale in differentiating preschoolers with ASD from
those with TD. Therefore, we confirm its utility as an effective level 1 tool in individuating
children at risk for ASD in the general population. According to Sweet and Picket (1982)
interpretation of the Area Under the Curve (AUC) values, the diagnostic accuracy of the PDP
scale is high. When ASD is compared to TD, sensitivity, specificity, PPV and NPV of the PDP
scale are all above 80% which is the recommended cutoff for first level instruments (Meisels,
1989). Sensitivity, that is the proportion of actual ASD which are correctly identified as such,

22
is the main value for a good first level tool; high sensitivity, indeed, corresponds to a low
percentage of false negatives, so that the possibility of being affected by an ASD and not being
properly diagnosed is reduced. Thus the low rates of false negatives indicates that the PDP
scale is able to identify preschoolers at risk for ASD and that the majority of these young
children can be referred to appropriate services with minimal delay. For this reason our
results provide support for the CBCL ½-‐5 – PDP scale as a screening tool for ASD. Moreover,
the PDP scale shows a very high specificity (90%) that means low rates of false positives. This
is the second reason to support its use as a screening tool because it limits to families of
healthy preschoolers an unnecessary, time-‐consuming and emotionally exhausting referral to
specialty clinics.
As a complementary finding, the Withdrawn scale has shown a power of discrimination that is
similar to the PDP scale. The presence of Withdrawn as a discriminative scale for ASD is
consistent with Sikora findings (2008) and with the more recent paper on older children
conducted in Singapore (Ooi et al., 2010). In both these papers elevation on this scale is
reported as a specific behavioral pattern indicative of autism, and it may be pointed out that
the Withdrawn cluster of items has to be considered in future research and practice not only
as indicative of an affective or mood disorder, as usually it is intended, but also as the
expression of social difficulties specific to ASD. Findings from the present research support
that a very high value on the Withdrawn scale, associated with a similar high value on the PDP
scale could be considered more indicative of autism than of an affective disorder. It should be
noted that five out of the eight items in the Withdrawn scale are shared with the thirteen
items in the PDP scale: thus, future research has to take in consideration this overlapping of
items and to develop clusters of items better fitting in the depressive withdrawn or in a social
withdrawn indicative of autism.

23
Third, the present study adds a contribution to the literature on differentiating ASD from
other psychiatric disorders. At the cutoff of 65, the PDP scale obtained an high sensitivity but
a too low specificity so that this scale (and, similarly, the Withdrawn scale at the cutoff of 62)
has a moderate diagnostic accuracy according to the Sweet and Picket (1982) interpretation
of the Area Under the Curve (AUC) values. The high rate of false positives, that is preschoolers
having a psychiatric disorder and who are misdiagnosed as having ASD, is only partially
unexpected. One interpretation could be linked to the prevalence in our OPD group of young
children with internalizing disorders who usually have high scores in the Withdrawn scale.
This view is supported by the fact that five out of eight item in the Withdrawn scale are also
present in the 13-‐items PDP scale, so that their positivity on the PDP scale can be due
essentially to the high rate in these items. A second explanation concerns the high co
morbidity between autistic conditions and internalizing disorders; recent meta-‐analyses have
reported that up to 84% of ASD experience anxiety (White et al, 2009) and up to 34%
experience depression (Stewart et al, 2006). Thus we can hypothesize that parents of ASD
children answer positively to some item considering the internalizing traits of their autistic
child. For both these reasons, that are linked to the overlap of items between Withdrawn and
PDP scales, the specificity of the PDP scale in differentiating ASD vs OPD decreases.
Fourth, the elevation on the Attention problem scale in ASD compared to TD or OPD confirms
also in preschoolers the frequently observed coexistence of attention problems in older
children with autism (Bolte et al., 1999; Sinzig et al., 2009). The overlap between ASD and
ADHD is often reported in literature (de Bruin et al., 2007) and sometime it makes hard to
distinguish between these two disorders. Our study confirms that attention deficit as an
externalizing symptom on the clinical autism phenotype may be important not only as a
coexisting symptom but also in identifying some preschoolers with ASD. Nevertheless,
according to the AUC, diagnostic accuracy is only moderate when ASD are compared to both
24
TD and OPD. Thus, while we confirm the frequent association we do not confirm the utility of
this scale in screening autism.
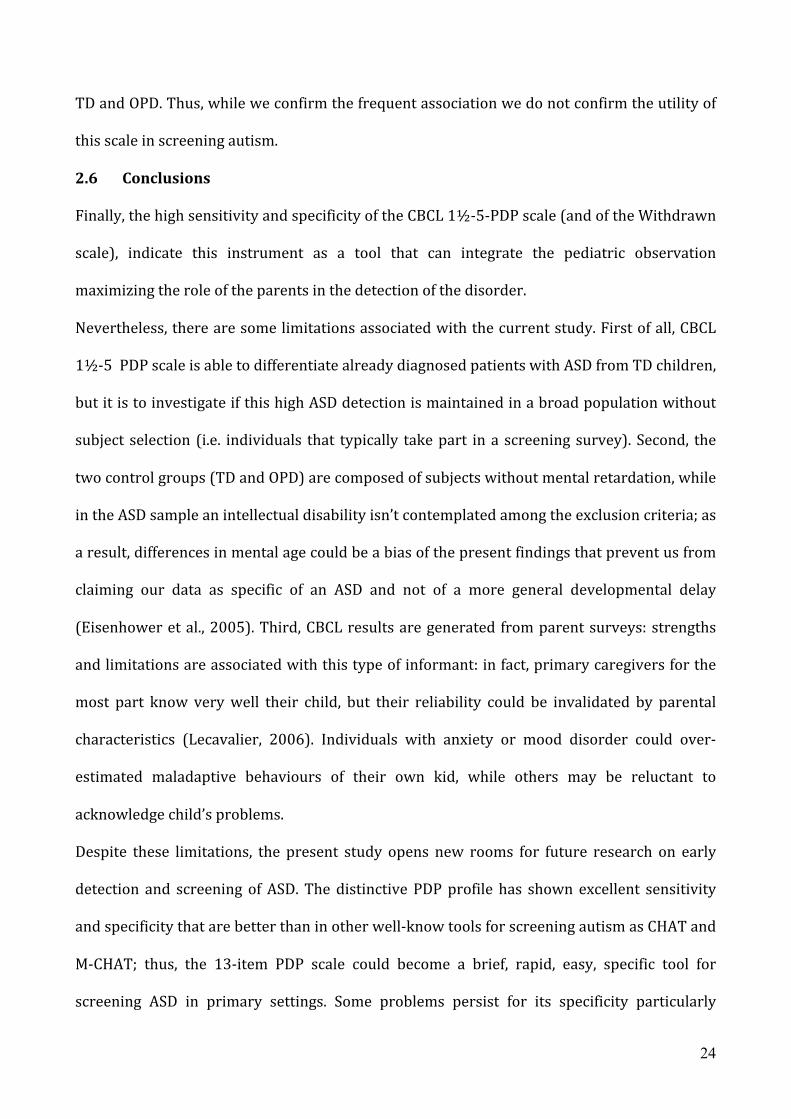
2.6 Conclusions
Finally, the high sensitivity and specificity of the CBCL 1½-‐5-‐PDP scale (and of the Withdrawn
scale), indicate this instrument as a tool that can integrate the pediatric observation
maximizing the role of the parents in the detection of the disorder.
Nevertheless, there are some limitations associated with the current study. First of all, CBCL
1½-‐5 PDP scale is able to differentiate already diagnosed patients with ASD from TD children,
but it is to investigate if this high ASD detection is maintained in a broad population without
subject selection (i.e. individuals that typically take part in a screening survey). Second, the
two control groups (TD and OPD) are composed of subjects without mental retardation, while
in the ASD sample an intellectual disability isn’t contemplated among the exclusion criteria; as
a result, differences in mental age could be a bias of the present findings that prevent us from
claiming our data as specific of an ASD and not of a more general developmental delay
(Eisenhower et al., 2005). Third, CBCL results are generated from parent surveys: strengths
and limitations are associated with this type of informant: in fact, primary caregivers for the
most part know very well their child, but their reliability could be invalidated by parental
characteristics (Lecavalier, 2006). Individuals with anxiety or mood disorder could over-‐
estimated maladaptive behaviours of their own kid, while others may be reluctant to
acknowledge child’s problems.
Despite these limitations, the present study opens new rooms for future research on early
detection and screening of ASD. The distinctive PDP profile has shown excellent sensitivity
and specificity that are better than in other well-‐know tools for screening autism as CHAT and
M-‐CHAT; thus, the 13-‐item PDP scale could become a brief, rapid, easy, specific tool for
screening ASD in primary settings. Some problems persist for its specificity particularly

25
towards internalizing disorders and there could be strong argument for some adjustment of
the PDP items reducing the overlap of its items with those in the Withdrawn scale.
26
Chapter 3
Abnormal growth of head circumference in ASD is limited
to the first six months of life.
3.1 Introduction
Since the first Kanner’s description, macrocephaly is an intriguing finding in children with
Autism Spectrum Disorders (ASD). Several retrospective, prospective and postmortem studies
have reported increased incidences of macrocephaly (head size greater than 2 standard
deviations above the norm) with percentages included between 14% (Lainhart et al., 1997),
18% (Davidovitch et al., 1996), 24% (Stevenson et al., 1997) and 37-‐42% (Bailey et al., 1993).
On the basis of these studies, it has been suggested that macrocephaly may represent a clinical
marker for grouping individuals with autism into homogeneous subgroups which can be
useful for genetic analysis (Carmichael et al., 1995; Maes et al., 1997; Silventoinen et al., 2000;
Losh et al., 2008).
More recently, different studies have signaled that macrocephaly, even if common in autism, is
not usually present at birth. For example a recent retrospective fetal ultrasound study of brain
size has suggested that head circumference was not abnormal during fetal development in
children subsequently diagnosed with an ASD (Hobbs et al., 2007). Because macrocephaly
seemed to develop after birth, regular observations of head circumference (HC) and of its
growth rate between seriate measurements during early stages of life, has become the object
of many studies (Fukumoto et al., 2008-‐2010; Elder et al., 2008; Gillberg et al., 2002; Hazlett et
al., 2005; Mills et al., 2007; Webb et al., 2007).
Courchesne (2003) arrived first in providing retrospective information about the course of
brain growth during the first year of life. This author has described the developmental course
of HC during infancy of 15 preschoolers with ASD compared to 15 healthy infants and he
27
found out a smaller HC at birth, followed by an accelerated growth such that by 6-‐14 months
53% of the sample was revealing macrocephaly. The finding of the early overgrowth, with a
subsequent decline in trajectory as from the second year of life, has now been replicated by
several independent research groups (Fukumoto et al., 2010; Dementieva et al., 2005
Dissanayake et al., 2006; Dawson et al., 2007; Deutsch et al., 2002). Also recent reports on
younger siblings of ASD patients, a population with an higher genetic risk of developing ASD
than typical children, have found an association between enlarged HC growth rate and early
emerging symptoms (Elder et al., 2008).
Nevertheless, some studies are in contrast with the report of an early increased HC growth in
ASD. For example, van Daalen (2007) concludes that in ASD there is a dysregulation of growth
in general, rather than a dysregulation limited to brain growth, while Rommelse
(2011) describes an accelerated growth of height not only in ASD children, but also in other
childhood psychiatric disorders. Other studies do not confirm either the finding of abnormally
small head size at birth (Lainhart et al., 1997; Gillberg et al., 2002; Dementieva et al., 2005;
Torrey et al., 2004; Mraz et al., 2007) or the positive association of HC overgrowth with
measures of autism symptom severity (Dementieva et al., 2005; Torrey et al., 2004). Thus,
research seems to indicate that head growth abnormalities are present in only a
subpopulation of ASD, both in terms of a larger head circumference and an atypical
acceleration of growth. It is possible that for this specific ASD group there is a peculiar growth
pattern (Hultman et al., 2002): at birth, they appear to have a normal, or even decreased, head
circumference and only after some months there is an increase in the rate of HC growth
(Stevenson et al., 1997; Courchesne et al., 2003; Dementieva et al., 2005; Amaral et al., 2008).
Nevertheless, cautions are warranted: first of all, we do not know yet how many children
undergo this abnormal brain growth trajectory since studies have analyzed differences only in
terms of groups; second there have been no published prospective data to assess its potential

28
predictive validity; third, not always correlation with body length and weight were
considered. Finally, there is still no consensus about when HC enlargement is first displayed.
Since during the first years of life HC correlates well with brain size, it has been suggested that
this phenomenon could reflect an abnormal acceleration of postnatal brain growth processes.
If this hypothesis will be confirmed by longitudinal MRI studies examining trajectories of
brain development from birth, an accelerated head growth could become an early biological
marker for ASD. Currently, the only longitudinal MRI data are related to toddlers from about
two years of age (Schumann et al., 2010), but future prospective studies on younger siblings of
ASD patients, followed from birth through multiple MRI scans, could shed light on the
neuropathological alterations at an early stage. In fact, although some authors have argued
that an excess of cortical neurons and/or glial cells (Courchesne et al., 2001) and alteration of
cell microcolumns (Casanova et al., 2002) causes early brain overgrowth, the exact
pathophysiology of this process remains to be established. Experimental studies have
documented that possible consequences of an early overgrowth of the brain could be an
alteration of connectivity (Ringo et al., 1991) resulting in an excess of short-‐distance cortical
connectivity and a reduction of long-‐distance connectivity (Courchesne et al., 2007). This
peculiar brain disconnection is hypothesized to be the neural substrate of ASD core
symptoms, as confirmed by some diffusion tensor imaging (DTI) studies on altered structural
connectivity in individuals with ASD (e.g. Barnea-‐Goraly et al., 2004; Lee et al., 2007;
Sundaram et al., 2008).
The present study aims to describe HC developmental course in the first 14 months of life in a
relatively large group of Italian children with ASD and to explore associations of this
developmental process with later symptom severity and cognitive impairment of children
(Lainhart et al., 1997; Deutsch et al., 2003; Lainhart et al., 2006).

29
3.2 Methods and Materials
Participants
Fifty preschoolers (mean age: 52 months, SD = 2.1 months) with idiopathic and non-‐
syndromic ASD (40 males and 10 females) were recruited consecutively between November
2007 and November 2009 among patients referred to the second level Centre for Autism at
the Stella Maris Scientific Institute in Pisa. Inclusion criteria were 1) normal term birth
(gestational age between 37-‐42 weeks) and 2) pediatric data records reporting head
circumference, height (H) and weight (W) measurements at four age periods: birth (T0); 1 to
2 months (T1); 3 to 5 months (T2) and 6 to 14 months (T3). All children met criteria for
Autistic Disorder (n=20) or Pervasive Developmental Disorder Not Otherwise Specified
(n=30) according to DSM-‐IV-‐TR (APA; 2000) and confirmed by the Autism Diagnostic
Observation Schedule (ADOS; Lord et al., 2002).
HC, H and W of ASD patients were compared to the same measurements of 100 healthy
children (mean age: 52 months, SD = 11.7 months). This sample included 80 males and 20
females and was a subset of an healthy pediatric population living in the metropolitan area of
Pisa (Tuscany). A non clinical Child Behaviour Checklist 1½-‐5 (CBCL; Achenbach et al., 2000)
Total Score < 50 was assumed as an index of typical behavioral development for this healthy
group. A detailed description of the two samples is presented in Table 3.1.
Table 3.1. Sample description Total sample ASD
(N=50) TD
(N=100) Gender (Male/Female) 40/10 (Ratio 4:1) 80/20 (Ratio 4:1) Age (Months) Mean: 52 (DS: 2.1) Mean: 52 (DS: 1.7) Diagnosis PDDNOS: n=30 (60%)
Autistic Disorder (AD): n=20 (40%)
Cognitive skills IQ>70: n=29 (58%) IQ<70: n=21 (42%)
ASD way of onset Regressive onset: n=11 (22%) Early onset: n=39 (78%)
ASD: Autism Spectrum Disorder; TD: Typical Development

30
Instruments
Cognitive development was assessed by the Leiter International Performance Scale – Revised
(Leiter-‐R; Roid & Miller, 1997) and/or Wechsler Scales (WWPSI, 1973; WISC-‐R,1986)
according to the patient’s age and linguistic level. On the basis of IQ subjects were divided into
two groups: IQ <70 and IQ >70.
Regressive onset of autistic symptoms was evaluated through the Italian version of the Early
Development Questionnaire (EDQ; Ozonoff et al., 2005).
This study was approved by the Institutional Review Board of Stella Maris Scientific Institute.
Statistical Analyses
Statistical analyses were performed using SPSS statistical software version 15 (SPSS Inc,
Chicago, III). HC, H and W measures were normalized across sex and age by converting to z
scores based on the CDC growth charts (National Center for Health Statistics; 2000). ASD
group was compared with TD group on HC, H and W at each considered period, using t-‐test.
Repeated-‐measures analyses of variance were carried out to analyze rate growth in HC, H and
W among the two groups. Bonferroni correction was used to control for multiple testing.
In order to analyze the association between HC and autistic symptomatology (on the basis of
ADOS-‐G values) we carried out a linear regression analysis.
In ASD group, t-‐test was used to compare HC between males and females, Autistic Disorder
(AD) and Pervasive Developmental Disorder Not Otherwise Specified (PDD-‐NOS) diagnosis, IQ
level, and type of onset (early vs regressive).
3.3 Results
Table 2 shows differences between ASD and TD at the different time points on HC, H and W.
Head Circumference
At birth (T0) there was no significant difference on HC size between ASD and TD groups. At
birth the ASD group is composed of 5/50 children (10%) with microcephaly (HC at 5th

31
percentile); 15/50 (30%) with HC between 5th and 25th percentile; 30/50 (60%) with HC
greater than 25th percentile. TD group is composed of 8/100 children (8%) with
microcephaly; 27/100 (27%) with HC between 5th and 25th percentile; 65/100 (65%) with
HC greater than 25th percentile.
At 1-‐2 months (T1) no significant difference in HC size was still present between ASD and TD
groups. At 3-‐5 months (T2) HC was significantly greater in ASD compared to TD (mean value
was located at 55th percentile in ASD group, and at 43th percentile in TD group).
At 6-‐14 months (T3) HC was still significantly greater in ASD group compared to healthy
infants (mean value was located at 75.8th percentile in ASD group, and at 65.5th percentile in
TD group). At T3, macrocephaly (HC>97th percentile) was present in 9/50 (18%) infants with
ASD and in 9/100 (9%) infants with TD. This difference doesn’t reaches significance (Chi 2 =
2.56 p = 0.110).
In ASD group, 10 infants (20%) had a not increasing developmental course of HC: 7 showed a
course similar to TD group, and 3 showed a decreasing course with HC values at T3 lower
than at T0.
ASD and TD groups did not show significant differences on HC growth when males and
females subgroups were compared (F=1.00, p=0.323).
Weight and Height
The height was not significantly different between ASD and TD in all four considered periods,
and no significant difference were found between the two groups (F=0.47, p=0.491) for the
rate of height growth.
While the weight was similar at T0, it was significantly smaller in ASD group compared to TD
at T1 (36.5th percentile vs 58th), at T2 (52.5 th percentile vs 65 th) and at T3 (51th percentile
vs 63th) (see Table 3.2). However, no difference was found in the rate of weight growth
(F=0.20, p=0.655) between the two groups.
32
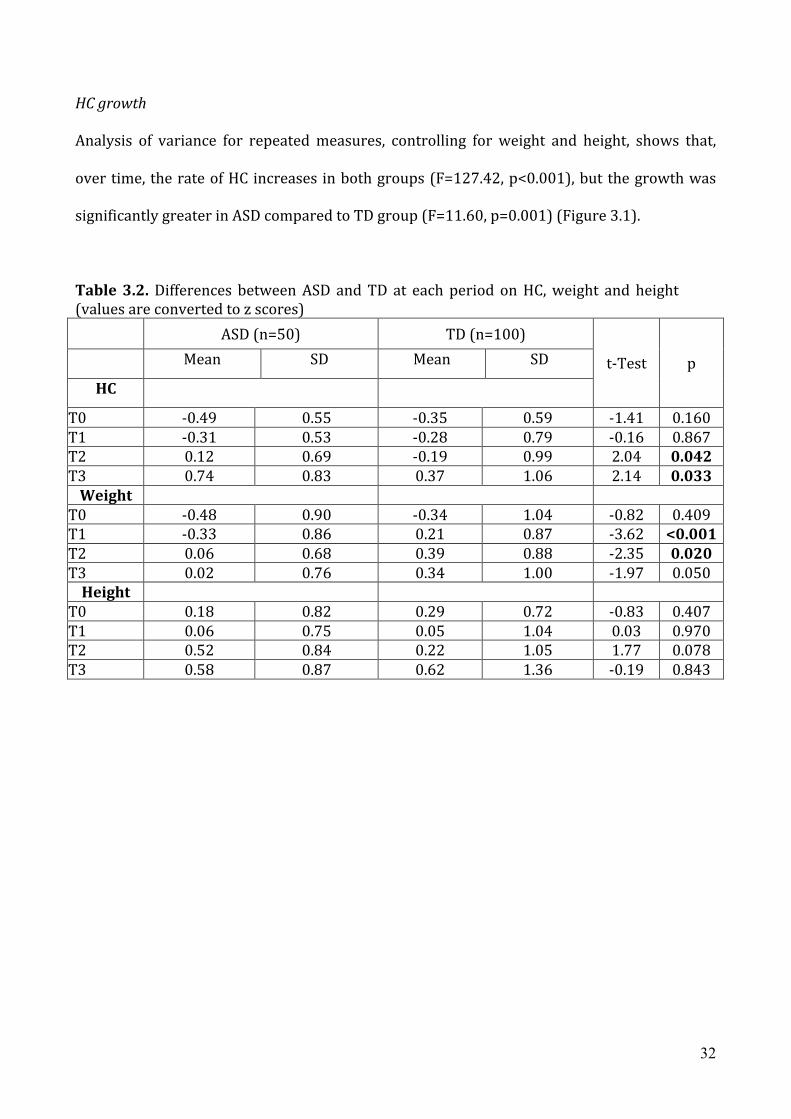
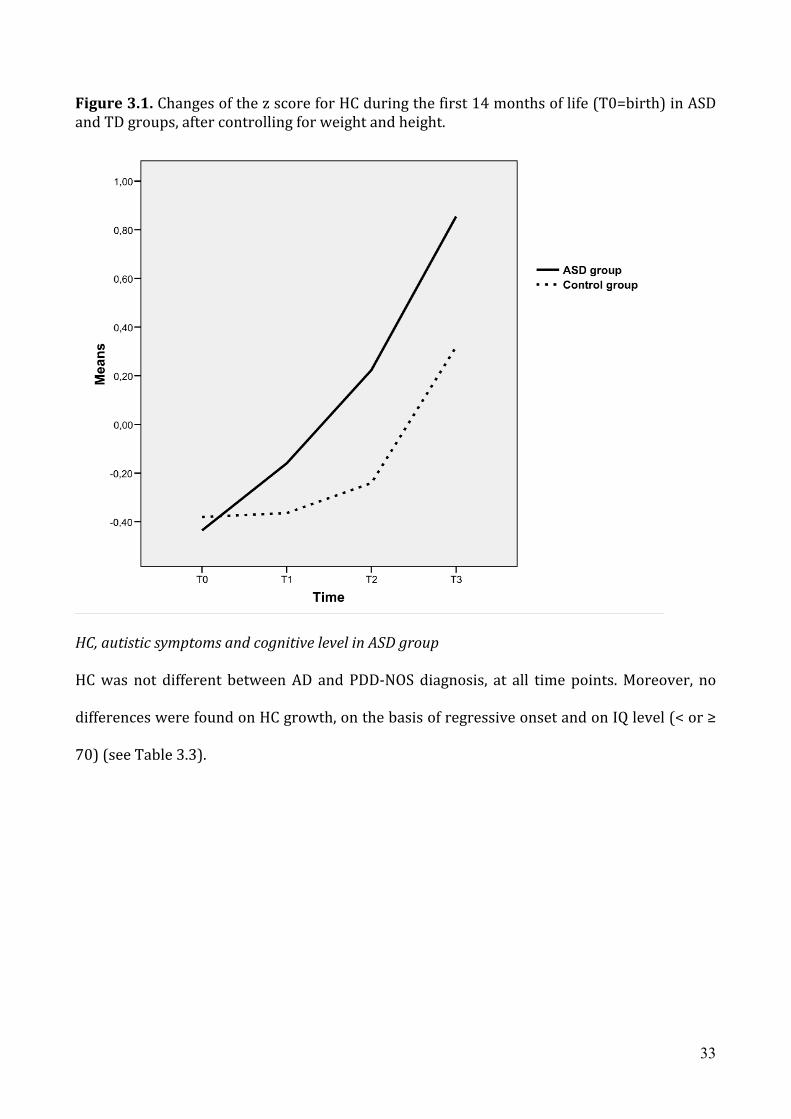
HC growth
Analysis of variance for repeated measures, controlling for weight and height, shows that,
over time, the rate of HC increases in both groups (F=127.42, p<0.001), but the growth was
significantly greater in ASD compared to TD group (F=11.60, p=0.001) (Figure 3.1).
Table 3.2. Differences between ASD and TD at each period on HC, weight and height (values are converted to z scores) ASD (n=50) TD (n=100)
t-‐Test p Mean SD Mean SD
HC
T0 -‐0.49 0.55 -‐0.35 0.59 -‐1.41 0.160 T1 -‐0.31 0.53 -‐0.28 0.79 -‐0.16 0.867 T2 0.12 0.69 -‐0.19 0.99 2.04 0.042 T3 0.74 0.83 0.37 1.06 2.14 0.033 Weight
T0 -‐0.48 0.90 -‐0.34 1.04 -‐0.82 0.409 T1 -‐0.33 0.86 0.21 0.87 -‐3.62 <0.001 T2 0.06 0.68 0.39 0.88 -‐2.35 0.020 T3 0.02 0.76 0.34 1.00 -‐1.97 0.050 Height
T0 0.18 0.82 0.29 0.72 -‐0.83 0.407 T1 0.06 0.75 0.05 1.04 0.03 0.970 T2 0.52 0.84 0.22 1.05 1.77 0.078 T3 0.58 0.87 0.62 1.36 -‐0.19 0.843
33
Figure 3.1. Changes of the z score for HC during the first 14 months of life (T0=birth) in ASD and TD groups, after controlling for weight and height.
HC, autistic symptoms and cognitive level in ASD group
HC was not different between AD and PDD-‐NOS diagnosis, at all time points. Moreover, no
differences were found on HC growth, on the basis of regressive onset and on IQ level (< or ≥
70) (see Table 3.3).

34
Table 3.3. ASD group: differences for gender, diagnosis, IQ level and type of onset, on HC at the four considered periods Subjects
(50)
T0
(birth)
T1
(1/2months)
T2
(3/5 months)
T3
(6/14 months)
Gender p
Males 40 -‐0.53±0.73 -‐0.22±0.90 0.20±1.09 0.78±1.23 0.323
Females 10 -‐0.19±0.35 -‐0.005±0.85 0.15±1.01 0.79±0.81
p 0.045 0.491 0.898 0.979
Diagnosis
AD 20 -‐0.56±0.68 -‐0.17±0.86 0.13±1.0 0.50±0.96 0.223
PDD-‐NOS 30 -‐0.40±0.70 -‐0.18±0.92 0.24±1.12 0.98±1.25
p 0.435 0.967 0.725 0.156
IQ Level
IQ>70 29 -‐0.42±0.64 0.02±0.66 0.18±0.86 0.86±0.96 0.745
IQ<70 21 -‐0.53±0.76 -‐0.46±1.08 0.21±1.32 0.68±1.40
p 0.585 0.073 0.930 0.609
Onset
Early 39 -‐0.40±0.67 0.09±0.91 0.28±1.09 0.95±1.13 0.246
Regressive 11 -‐0.67±0.73 0.49±0.78 -‐0.12±0.97 0.21±1.08
p 0.267 0.191 0.268 0.062
3.4 Discussion
The purpose of the present study was to supervise the timing of HC development in the first
year of life in Italian children with ASD. Our study confirms that the majority of children with
autism display an increased acceleration of HC growth during the first year of life. Because
some studies have suggested that an increase in the rate of head growth could be the result of
an overall increase in general body growth of autistic children (Fukumoto et al., 2008;
Dawson et al., 2007 van Daalen et al., 2007; Torrey et al., 2004), we have controlled HC for
weight and height. After this correction, HC begins to growth overmuch and quickly from 1-‐2
months to 3-‐5 months reaching at 6-‐14 months the 75,8th percentile. This result is slightly
35
different compared to first Courchesne study (2003) where the abnormal growth reached the
84th percentile, HC at birth was significantly smaller in ASD group compared to subjects with
typical development, and the acceleration last for all the first year of life. In contrast to
Courchesne study (2003), but in agreement with several other reports (Lainhart et al., 1997;
Dementieva et al., 2005; Torrey et al., 2004; Hultman et al., 2002), our ASD newborns show a
HC measurement similar to typical control. Second, our findings indicate that 0-‐6 months
represents the period at which the abnormal brain overgrowth (assuming that brain size is
correlated to HC) (Bartholomeusz et al., 2002) has his peak; during the second semester of life
the autistic brain continues to be significantly larger but without any other gain compared to
TD. It seems that something causing an abnormal growth occurs during the first semester of
life and not during the latter part of the first year as signalled by Elder (2008). Then, our
research proposes that the 0-‐6 months period should be considered a specific sensible period
for the starting of the disorder: not before when HC is not larger than in TD and not in the
slope from 6 to 12 months when the rate of growth is similar to TD. Evidences for the first six
months of life as a critical period for autistic onset come also from behavioural findings:
retrospective home videotape analysis (Maestro et al., 2001) of infants later diagnosed as
having autism reveals an incipient phase of developmental alteration which displays itself in
early differences in social attention. Literature indicates that an early abnormal brain growth
process precedes the full expression of the disorder and coincides with the first appearance of
subtle behavioral abnormalities (Courchesne; 2004). In fact, prospective studies on children
subsequently diagnosed as ASD agree that a clear expression of an altered social behavior is
not likely to be found before 12 months of age (Zwaigenbaum et al., 2005; Bryson et al., 2007;
Landa & Garrett-‐Mayer 2006).
We could suggest that combining measures of head circumference with behavioural (and/or
instrumental) tests for early social and non social attention might improve our capacity of

36
screening autism at an earlier age. In our study, the HC overgrowth was present in the whole
sample except 10 (20%) patients who did not present the growth acceleration regardless the
value of HC at birth and regardless the presence of regression. Then, even if HC has the
potential to be included in a check list for autism in infancy, we have to take in consideration
that it is not able to recognise all subjects at risk for autism (Lainhart; 2006). For the
subgroup of ASD without an early HC acceleration, we should imagine a different
pathophysiologic pathway that remains to be elucidated in future studies. According to
percentages reported in the recent literature (included between 14% and 34% of cases), we
have found macrocephaly (HC > 97th percentile) in 18% of the ASD sample at 6-‐14 months.
This condition is clinically, although no significantly, more present in ASD then in our control
sample composed of children with TD. We could suggest that this is another special group of
children with autism characterised by an accelerated growth of HC without reaching
macrocephaly. Thus, we can outline the presence in the autism spectrum of three groups of
children that differ as far as early abnormal HC growth and final macrocephaly are regarded:
1) abnormal early HC growth toward macrocephaly (18% of our cases); 2) abnormal HC
growth without final macrocephaly (68%); 3) without abnormal HC growth; this latter group
of children represents in our casistic only the 14% of children with autism. Further research
is needed to establish whether these different groups could delineate subtypes of ASD useful
for genetic and neurobiological studies.
We have also examined whether atypical great expansion in head size is associated with
severity of autistic symptoms. Previous reports indicate contrasting results: Dementieva
(2005) found a correlation between an increased rate of head growth and higher levels of
adaptive functioning, while in the Courchesne’s study (2003) HC at 6-‐14 months was
significantly greater in Autistic Disorder than in PDD-‐NOS. In the current study, we have not
found any significant difference between these two groups as far as HC at different point is

37
regarded. Furthermore, mean head circumference z scores were not significantly associated
with IQ or regressive onset.
Because this is the first paper on Italian children, we can hypothesize that some of the
differences between our and previous studies on HC could be related to this specific
population. First, the weight was significantly smaller in ASD; this finding is opposed to other
studies (Davidovitch et al., 1996; Fukumoto et al., 2008-‐2010; Mraz et al., 2007) reporting that
body weight, as well as HC, was significantly bigger in ASD. Second, our study has considered
males and females as a whole group because no difference was found between boys and girls
in HC; differently, Fukumoto (2008) pointed out that body weight was significantly increased
in boys with autism; but in his study Fukumoto (2008) considered boys and girls as two
different groups. Third, unlike Dissanayake (2006) and Torrey (2004) who reported a general
abnormal growth of the body sizes including the growth in stature, in our study mean length z
scores did not differ significantly from controls at any age interval.
For these different reasons we propose that in future studies it will be considered
appropriately HC together with body measures using similar ethnic group as we did.
In short, this study, while confirming the existence of an abnormal HC growth rate in the first
year of life in children with ASD, points out the sudden and excessive increase in head size
during the first six months of life. Second, it confirmed the association between ASD and
macrocephaly only in a limited number of ASD children. Finally, it corroborates the
importance to measure the HC in the first months of life of children because its abnormal rate
of growth, in addition to other behavioral signs, could contribute to the process of early ASD
identification.
38
Chapter 4 Structural magnetic resonance techniques
4.1 Voxel-‐based morphometry
The voxel-‐based morphometry (VBM) technique consists in a voxel-‐wise comparison of the
local volume or concentration of grey/white matter between two groups of subjects
(Ashburner & Friston, 2000). The procedure involves spatially normalizing high-‐resolution
images from all subjects in the study into the same stereotactic space. This is followed by the
segmentation of the grey/white matter from the spatially normalized images, and the
smoothing of the grey/white-‐matter segments. Voxel-‐wise parametric statistical tests, which
compare the smoothed grey/white-‐matter images from the two groups, are performed.
Corrections for multiple comparisons are made using the theory of Gaussian random fields.
VBM is crucially dependent on registration performance. The recently introduced
Diffeomorphic Anatomical Registration using Exponentiated Lie algebra (DARTEL) algorithm
implements several methodological advances to address this limitation (Ashburner, 2007). A
diffeomorphic warping is implemented to achieve an accurate inter-‐subject registration with
an improved realignment of small inner structures. Several ASD structural imaging studies to
date have used region-‐of-‐interest manual tracing methods that have the limitation of being
operator dependent and thus invalidated by a low inter-‐laboratory reliability. On the other
hand, automated VBM is more sensitive to subtle differences and can be standardized across
laboratories. For example, in a recent study (McAlonan, 2002) MRI data of the same Asperger
subjects were analyzed using both manual tracing and voxel-‐based analysis, revealing no
differences in regional brain volumes when is applied the first method and significant
alterations between groups in white matter as well as in grey matter when patients and
controls were compared through VBM.
39
4.2 Diffusion tensor imaging
Diffusion tensor imaging (DTI) is a magnetic resonance imaging (MRI) technique that allows
for the indirect assessment of the integrity of white matter tracts (Le Bihan, 2001) by means
of measurement of the extent and direction of water diffusion within the brain. When
unconstrained, water molecules diffuse randomly in all directions and thus exhibit isotropy.
Within white matter tracts, the movement of water molecules is physically constrained along
the direction of tracts by sheaths of myelin, a phenomenon referred to as anisotropy, which is
represented as an ellipsoid in tensor form (Basser, 1994-‐1996).
A basic understanding of the influence of various structural components on anisotropic water
diffusion is a prerequisite for interpreting alterations in diffusion and anisotropy as a result of
various disease processes or abnormal development. DTI provides three valuable parameters:
(1) the average extent of water diffusion (apparent diffusion constant—ADC) which provides
information on restriction and boundaries (high packing density of cells); (2) the fractional
anisotropy (FA) that is higher in dense and ordered structure; and (3) the orientation of the
ordered structure (color coded DTI).
FA is a scalar value that ranges between 0 and 1. Increasing FA values indicate a higher tensor
ellipsoid anisotropy. FA, with no other information, is a highly sensitive but fairly not specific
biomarker of neuropathology and microstructural architecture. This combination produces
challenges to the interpretation of DTI measurements for both diagnostic and therapeutic
applications. However, most agree that FA is a marker of white matter integrity. In fact,
reduced fractional anisotropy (FA), indicating more isotropic diffusion, is characteristic of
damaged and/or disorganized white matter tracts (Beaulieu, 2002).
Another simple and clinically useful scalar invariant is the the average of the eigenvalues. This
average is referred to as the mean diffusivity, or MD or Apparent Diffusion Coeffcient (ADC)
40
and it relates to the total amount of diffusion in a voxel, which is related to the amount of
water in the extracellular space.
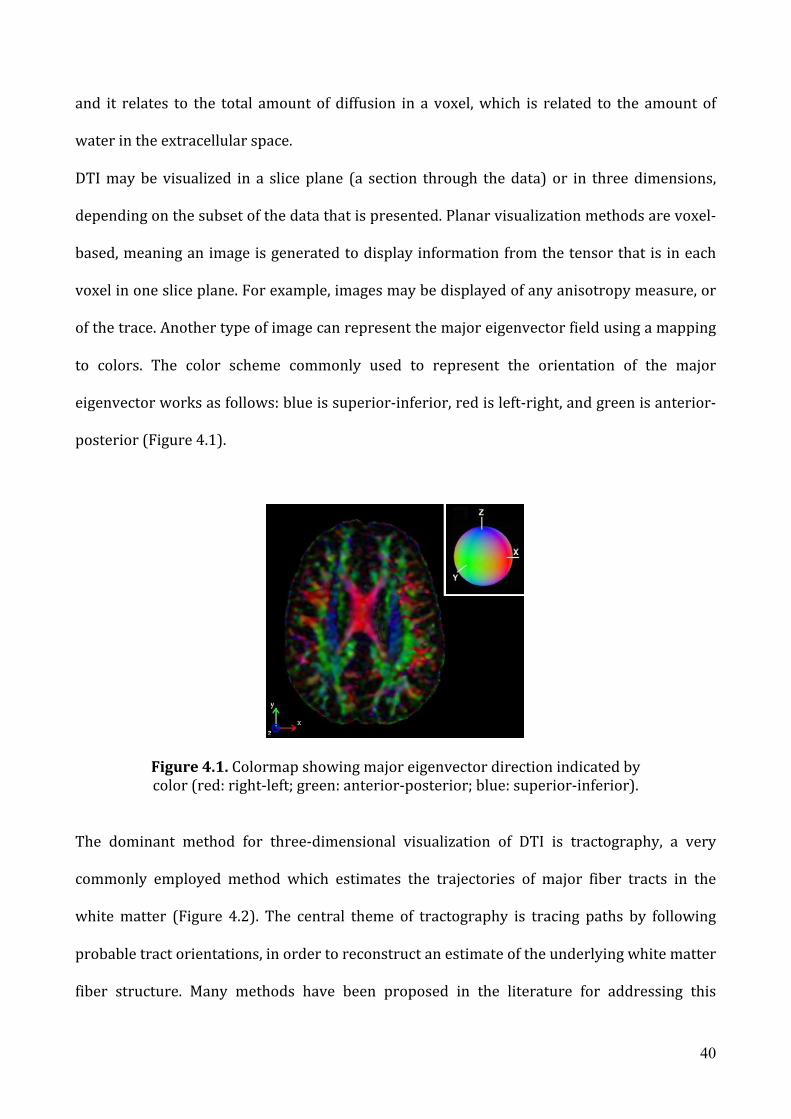
DTI may be visualized in a slice plane (a section through the data) or in three dimensions,
depending on the subset of the data that is presented. Planar visualization methods are voxel-‐
based, meaning an image is generated to display information from the tensor that is in each
voxel in one slice plane. For example, images may be displayed of any anisotropy measure, or
of the trace. Another type of image can represent the major eigenvector field using a mapping
to colors. The color scheme commonly used to represent the orientation of the major
eigenvector works as follows: blue is superior-‐inferior, red is left-‐right, and green is anterior-‐
posterior (Figure 4.1).
Figure 4.1. Colormap showing major eigenvector direction indicated by color (red: right-‐left; green: anterior-‐posterior; blue: superior-‐inferior).
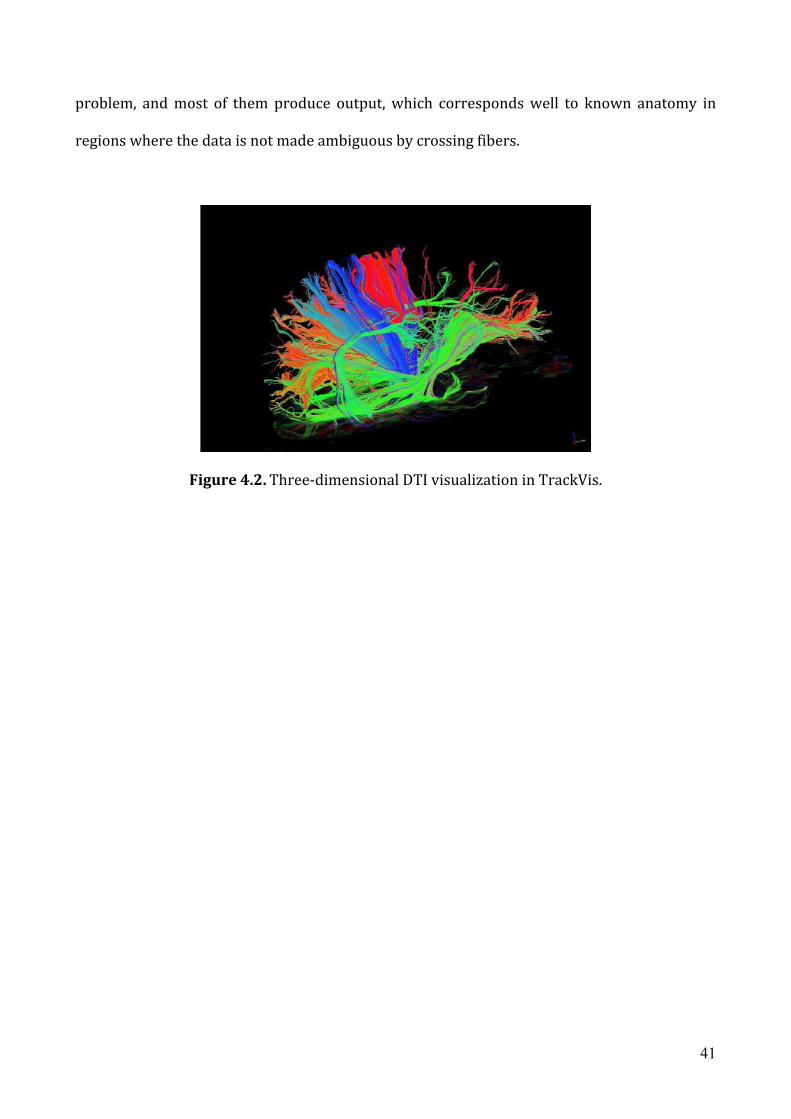
The dominant method for three-‐dimensional visualization of DTI is tractography, a very
commonly employed method which estimates the trajectories of major fiber tracts in the
white matter (Figure 4.2). The central theme of tractography is tracing paths by following
probable tract orientations, in order to reconstruct an estimate of the underlying white matter
fiber structure. Many methods have been proposed in the literature for addressing this
41
problem, and most of them produce output, which corresponds well to known anatomy in
regions where the data is not made ambiguous by crossing fibers.
Figure 4.2. Three-‐dimensional DTI visualization in TrackVis.

42
Chapter 5 A diffusion tensor imaging study in Autism Spectrum Disorder
5.1 Introduction
There are some studies in which diffusion tensor imaging indices have been analyzed in
Autism Spectrum Disorders (ASDs) subjects. Findings are conflicting: the age of subjects
analyzed is a prominent variable that influences results. In fact, studies on toddlers and young
children (Ben Bashat et al., 2007; Cheung et al., 2009; Kumar et al., 2009; Sundaram et al.,
2008) found increased FA, while literature concerning children, adolescents and adults with
ASD consistently reported reduced FA (Alexander et al., 2007; Barnea-‐Goraly et al., 2004;
Brito et al., 2009; Catani et al., 2008; Ke et al., 2009; Keller et al., 2007; Lee et al., 2007; Pardini
et al., 2009; Shukla et al., 2010; Thakkar et al., 2008). In particular, these studies have found
lower FA in individuals with autism, compared with controls, in the corpus callosum
(Alexander et al., 2007; Barnea-‐Goraly et al., 2004; Keller et al., 2007), the anterior cingulate,
ventromedial and subgenual prefrontal areas, temporoparietal junction, and in the superior
temporal gyrus (STG) white matter and temporal stem (Barnea-‐Goraly et al., 2004; Lee et al.,
2007). Recent studies that combined DTI with VBM on ASD children reporting a mixture of
increased and decreased white matter densities in different parts of the brain (Conturo et al.,
2008; Ke et al., 2009; Mengotti et al., 2010).
Studies that have employed Diffusion Tensor Tractogaphy (DTT) to examine the integrity of
specific WM tracts in individuals with autism relative to typically developing individuals have
focused primarily on intra-‐hemispheric tracts. For example, one study reported alterations in
the structural integrity of long-‐range fibers in the frontal cortex in children within the autism
spectrum (Sundaram et al., 2008), while another reported significant reductions in the micro-‐
structural integrity of the right superior cerebellar peduncle and short intra-‐cerebellar fibers
in adults with Asperger syndrome (Catani et al., 2008).

43
A more recent study revealed a significant increase in the number of streamlines (i.e. the lines
that depict the fibers in a tract) in bilateral inferior longitudinal fasciculus (ILF) and the
cingulum bundle, as well as a reduction in streamlines in the right uncinate fasciculus (UF)
(Pugliese et al., 2009). Importantly, these tracts are associated with behavioral functions that
are known to be impaired in autism. For example, the ILF and the inferior fronto-‐occipito
fasciculus (IFOF) are critical for higher-‐level visual and emotion processing (Rudrauf et al.,
2008; Thomas et al., 2010), domains atypical in individuals with autism (Behrmann et al.,
2006; Bertone et al., 2005; Humphreys et al., 2008; Lee et al., 2007). In summary, these
tractography studies reveal perturbations in intra-‐hemispheric WM tracts in individuals on
the autism spectrum, which may account for some of their difficulties in information
processing.
All these results are have been realized on late childhood subjects or on adults. More recent
studies investigated children under 3 years old. In 2007 Ben Bashat and colleagues (2007)
realized a DTI study on young children and found an FA increase in a lot of brain area (in
particular in left hemisphere and in frontal lobe). These results are in agreement with the
finding of abnormal brain and connections growth in the first years of life, but remains to
clarify if FA reduction is due to increase in number, size of axons or myelination processes, or
whether it is the result of reduced synaptic pruning early in development.
5.2 Materials and methods Participants
Twenty-‐two children (age range 2–11) with autism spectrum disorder were recruited from
our clinical autism research program at the IRCSS Stella Maris Institute and ten children (age
range 2–11) without developmental delay (noDD) (Table 5.1). NoDD subjects underwent an
MRI examination because of various reasons (including headache, head trauma, cataract,
single -‐i.e. not recurrent in the next two years-‐ unprovoked idiopathic seizure). Inclusion
criteria were: 1) a standardized evaluation of cognitive abilities 2) clinical data records
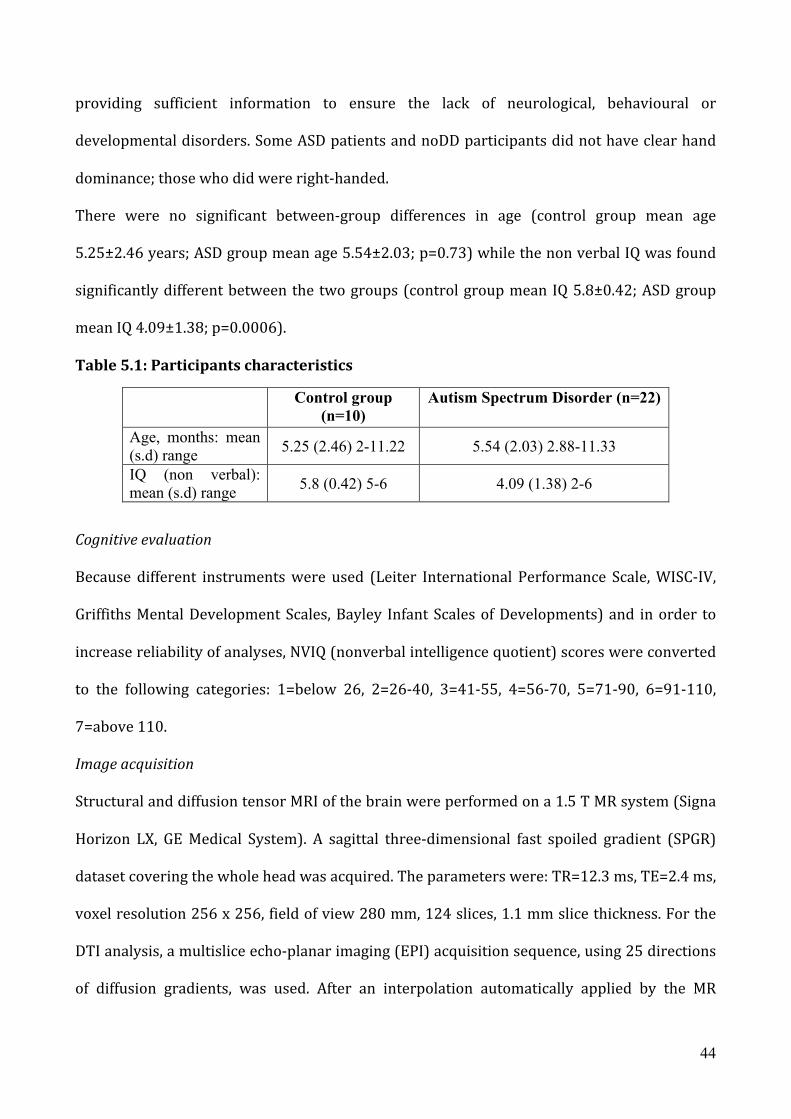
44
providing sufficient information to ensure the lack of neurological, behavioural or
developmental disorders. Some ASD patients and noDD participants did not have clear hand
dominance; those who did were right-‐handed.
There were no significant between-‐group differences in age (control group mean age
5.25±2.46 years; ASD group mean age 5.54±2.03; p=0.73) while the non verbal IQ was found
significantly different between the two groups (control group mean IQ 5.8±0.42; ASD group
mean IQ 4.09±1.38; p=0.0006).
Table 5.1: Participants characteristics
Control group (n=10)
Autism Spectrum Disorder (n=22)
Age, months: mean (s.d) range 5.25 (2.46) 2-11.22 5.54 (2.03) 2.88-11.33
IQ (non verbal): mean (s.d) range 5.8 (0.42) 5-6 4.09 (1.38) 2-6
Cognitive evaluation
Because different instruments were used (Leiter International Performance Scale, WISC-‐IV,
Griffiths Mental Development Scales, Bayley Infant Scales of Developments) and in order to
increase reliability of analyses, NVIQ (nonverbal intelligence quotient) scores were converted
to the following categories: 1=below 26, 2=26-‐40, 3=41-‐55, 4=56-‐70, 5=71-‐90, 6=91-‐110,
7=above 110.
Image acquisition
Structural and diffusion tensor MRI of the brain were performed on a 1.5 T MR system (Signa
Horizon LX, GE Medical System). A sagittal three-‐dimensional fast spoiled gradient (SPGR)
dataset covering the whole head was acquired. The parameters were: TR=12.3 ms, TE=2.4 ms,
voxel resolution 256 x 256, field of view 280 mm, 124 slices, 1.1 mm slice thickness. For the
DTI analysis, a multislice echo-‐planar imaging (EPI) acquisition sequence, using 25 directions
of diffusion gradients, was used. After an interpolation automatically applied by the MR
45
system the resolution is 0.7422mm x 0.7422mm x 3mm with a field of view 190mm x 190mm
and coverage of the whole brain (TE= 107 ms, TR=11000 ms, b-‐value 1000 s/mm).
DTI processing
Maps reconstruction
Images were processed using the FSL (FMRIB Software Library, FMRIB, Oxford, UK) (Smith et
al., 2004) software package. For each subject, all images including diffusion weighted and b0
images, were corrected for eddy current induced distortion and subject motion effect using
FDT (FMRIBs Diffusion Toolbox) (Behrens et al., 2003). Brain mask was created from the first
b0 image using BET (Brain extraction Tool) (Smith, 2002) and FDT was used to fit the tensor
model and to compute the FA, MD, axial diffusivity and radial diffusivity maps.
TBSS analysis
Voxelwise analysis was performed using TBSS (Smith et al., 2006). First the most
representative FA image was identified and all subjects' FA data were aligned to this target
image using the nonlinear registration tool FNIRT (Andersson 2007a, 2007b), which uses a b-‐
spline representation of the registration warp field (Rueckert 1999). Next, the mean FA image
was created and thinned to create a mean FA skeleton, which represents the centers of all
tracts common to the group. A threshold of FA > 0.25 was applied to the skeleton to include
only major fiber bundles. Each subject's aligned FA data was then projected onto this skeleton
and the resulting data fed into voxelwise cross-‐subject statistics.
Statistical analysis
Statistical analysis was performed voxel by voxel to detect regions of significant differences of
FA among the two groups of subject. The correlation of FA with age and with IQ was also
investigated introducing these parameters as covariate in the contrast matrix. Individual FA
maps were included in a non-‐parametric permutation-‐based group model using “randomize”
in FSL (Nichols and Holmes, 2002). The TFCE (Threshold-‐Free Cluster Enhancement) option
46
in randomize was used in order to avoid the need for the arbitrary initial cluster-‐forming
threshold. Both contrasts were computed using 5000 permutations. Results are reported at
corrected threshold p < 0.05.
Tractography
Tract reconstruction
Diffusion tensor vectors were computed using ExploreDTI software
(http://www.exploredti.com/). After the application of motion and distortion correction, a
deterministic tracking algorithm was applied. Tract data were then transformed in NifTi
format using an homemade MATLAB program including also information on length, FA and
MD of each tract. NifTi files were finally imported in TrackVis software
(http://www.trackvis.org/) for the reconstruction of the tracks of interest. White matter
areas that TBSS analysis showed to be significantly different in the groups were selected for
the analysis: the cingulum and the arcuate fasciculus (Catani & Thiebaut de Schotten, 2008).
The cingulum is a medial associative bundle that runs within the cingulate gyrus all around
the corpus callosum. It contains fibers of different length, the longest of which run from the
anterior temporal gyrus to the orbitofrontal cortex. The short U-‐shaped fibers connect the
medial frontal, parietal, occipital, and temporal lobes and different portions of the cingulate
cortex. The cingulum was dissected using a one-‐ROI approach. A single region was defined on
the top three slices. When the cingulum separated into two branches an anterior and
posterior region were defined on each slice. Artifactual (callosal) fibers were removed using
an exclusion ROI defined around the corpus callosum.
The arcuate fasciculus is a lateral associative bundle composed of long and short fibers
connecting the perisylvian cortex of the frontal, parietal, and temporal lobes. A three ROIs
approach was used to reconstruct the three segments of the arcuate fasciculus. The first ROI
was defined on the Broca’s area, in the frontal lobe selecting three coronal slices of brain. The
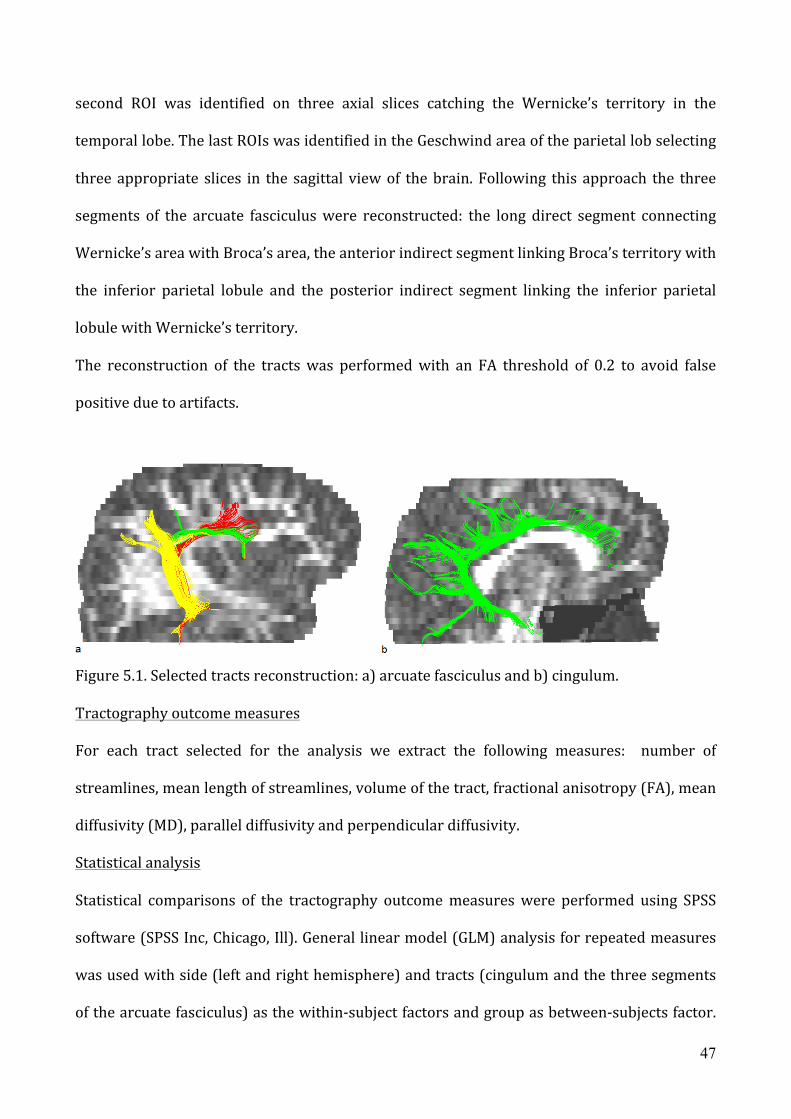
47
second ROI was identified on three axial slices catching the Wernicke’s territory in the
temporal lobe. The last ROIs was identified in the Geschwind area of the parietal lob selecting
three appropriate slices in the sagittal view of the brain. Following this approach the three
segments of the arcuate fasciculus were reconstructed: the long direct segment connecting
Wernicke’s area with Broca’s area, the anterior indirect segment linking Broca’s territory with
the inferior parietal lobule and the posterior indirect segment linking the inferior parietal
lobule with Wernicke’s territory.
The reconstruction of the tracts was performed with an FA threshold of 0.2 to avoid false
positive due to artifacts.
Figure 5.1. Selected tracts reconstruction: a) arcuate fasciculus and b) cingulum. Tractography outcome measures
For each tract selected for the analysis we extract the following measures: number of
streamlines, mean length of streamlines, volume of the tract, fractional anisotropy (FA), mean
diffusivity (MD), parallel diffusivity and perpendicular diffusivity.
Statistical analysis
Statistical comparisons of the tractography outcome measures were performed using SPSS
software (SPSS Inc, Chicago, Ill). General linear model (GLM) analysis for repeated measures
was used with side (left and right hemisphere) and tracts (cingulum and the three segments
of the arcuate fasciculus) as the within-‐subject factors and group as between-‐subjects factor.
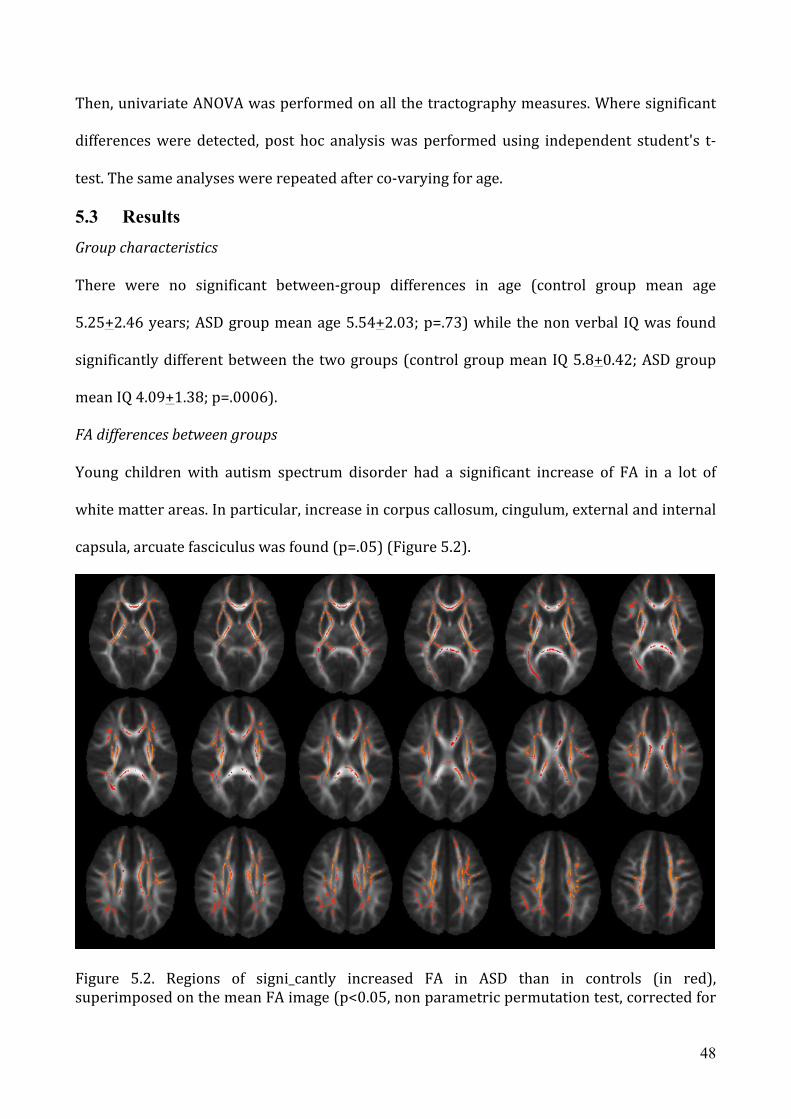
48
Then, univariate ANOVA was performed on all the tractography measures. Where significant
differences were detected, post hoc analysis was performed using independent student's t-‐
test. The same analyses were repeated after co-‐varying for age.
5.3 Results Group characteristics
There were no significant between-‐group differences in age (control group mean age
5.25+2.46 years; ASD group mean age 5.54+2.03; p=.73) while the non verbal IQ was found
significantly different between the two groups (control group mean IQ 5.8+0.42; ASD group
mean IQ 4.09+1.38; p=.0006).
FA differences between groups
Young children with autism spectrum disorder had a significant increase of FA in a lot of
white matter areas. In particular, increase in corpus callosum, cingulum, external and internal
capsula, arcuate fasciculus was found (p=.05) (Figure 5.2).
Figure 5.2. Regions of signi_cantly increased FA in ASD than in controls (in red), superimposed on the mean FA image (p<0.05, non parametric permutation test, corrected for
49
multiple comparisons). All images are in radiological convention, i.e. the right side of the subjects is on the left side of the images.
FA correlation with age
Positive correlation of FA with age was found for the control group and for the ASD groups
(p=.05).
Tract-‐specific measurements
Number, length and volume of streamlines The GLM showed a significant group-‐by-‐side-‐by-‐
tract interaction (p=.01) and tract-‐by-‐side-‐by-‐age (p=.03) interactions in the arcuate
fasciculus. Comparison of the individual tracts revealed a significant increase in the length of
streamlines bilaterally within the cingulum in ASD group (left cingulum: mean=88.7+14.2,
right cingulum: mean=77.7+10.4) than in controls (left cingulum: mean =69.2+17.6; p=.002,
right cingulum: mean=58.2+11.8; p=.0001). There was also a significant reduction in the
number of streamlines within the posterior indirect segment of the left arcuate fasciculus in
ASD group (mean=129.5+77.3) than in controls (mean=190.8+98.5; p=.06).
No significant difference in the volume of the analyzed tracts was found.
FA, MD, parallel and perpendicular diffusivity
FA was in ASD group was significantly increased bilaterally in the cingulum (left cingulum:
p=.002, right cingulum: p=.003) and in the fornix (p=.004). There was also an increase of MD
in ASD group in comparison to controls in the following areas: within the left cingulum
(p=.05), within the right indirect posterior (p=.02) and the right indirect anterior (p=.04)
segments of the fasciculus arcuate. Finally a significant increase in parallel diffusivity in the
ASD group was found in the right cingulum (p=.02).
5.4 Discussion
This study was one of the first study on young ASD children. The TBSS analysis showed a
significant increase of FA in ASDs with respects to control in corpus callosum, cingulum,

50
external and internal capsula, arcuate fasciculus. The increase of FA in young ASD children is
in agreement with the study of Ben-‐Bashat et al. (2007) who found increased restricted
di_usion in white matter in overall analysis as well as in selected ROIs in young children with
confirmed diagnosis of autism. This increase of FA might be a confirmation of accelerated
brain growth in autism in the years of life. The cingulum and the arcuate fasciculus were
selected for the reconstruction and the tractographic analysis. Significant differences in these
white matter tracts were found. The cingulum is the most prominent tract connecting limbic
system and cerebral cortex and is involved in higher-‐level cognitive processes like error
monitoring, attention, visuospatial and memory functions, abilities that are frequently
compromised in ASD subjects. On the other hand, the arcuate fasciculus is a fiber bundle
related to language, a function always impaired in ASD, at least from the qualitative point of
view. In particular the most significative result was the increase in the length of streamlines of
the cingulum in ASDs in comparison to controls. It is important to underline that the length
measure is a mean of all the streamlines so that if the number of short streamlines is higher
the mean is lower. This finding confirms the result found by Sundaram et al. (2008). These
researchers found that the fiber length of the long association fibers was higher in the ASD
group than in controls, although they said that it was unclear from their study which specific
long association tracts were involved. From the findings of the present study it seems that the
predominant long association fibers belong to the cingulum. The hypothesis of Sundaram and
collegues was that one of the mechanisms related to increased long range fiber length could
be altered serotonin. In fact, many previous studies have shown that serotonin acts as a
neurotrophic factor involved in axonal outgrowth during development. In vitro measures of
serotonin synthesis in animal models of autism could help to clarify the role of altered
serotonin in autism in white matter structural changes. Recently, Hadjikhani (2010) has
hypothesized that increased serotonemia during pregnancy due to frequent use of

51
antidepressants drugs such selective serotonin reuptake inhibitors (SSRI) could play a role in
ASD pathogenesis
Moreover further studies are needed in order to correlate these findings with behavioral
measures so that it would be possible to clarify the meaning and the clinical implications of
these results.

52
Chapter 6
A view into the brain of female children with autism spectrum disorder.
Morphometric regional alterations detected by structural MRI mass-‐
univariate and pattern classification analyses.
6.1 Introduction
From an epidemiological perspective, autism spectrum disorders (ASDs) are a common
disability, with a prevalence of 1:110 children in the U.S (Centers for Disease Control and
Prevention –CDC-‐, 2009) and a strong male preponderance, varying according to IQ. In fact,
the male to female ratio may range from 1.31:1 in patients with considerable intellectual
disability (Tsai and Beisler, 1983), to 10.8:1 and 15:1 in AS and high-‐functioning autism,
respectively (namely ASD individuals without mental retardation; Gillberg et al., 2006; Wing,
1981).
While some authors question the significance of male preponderance and ascribe it to a
greater under-‐diagnosis or wrong diagnosis of ASD females [ASDf; (Faherty, 2006; Nydén
2000)], others trace back the biased sex ratio to a genetic and/or sex-‐related hormones
pathogenesis. Genetic hypothesis declares that girls need a higher threshold of genetic
vulnerability to result in an affected phenotype (Tsai et al., 1981) and brings forward both
sex-‐linked (Skuse, 2000) and autosomal transmission (Stone 2004). On the other hand,
hormonal influences could play a role in modulating genetic factors. A general hypothesis on
ASD, the extreme male brain (EMB) theory of autism (Baron-‐Cohen, 2002), emphasises that
ASD can be interpreted as a far end of the typical male pattern with impaired empathizing
skills and enhanced systemizing abilities. The neurobiological mechanisms for this profile
could rely on prenatal exposure to elevated levels of testosterone that may cause alterations
in neural structure and function with the subsequent development, in its most pronounced
53
form, of ASD (Knickmeyer et al., 2005; Knickmeyer and Baron-‐Cohen, 2006; Auyeung et al.,
2009). In particular, Auyeung (2010) indicates that a hyper-‐masculinized profile is present in
ASD since infancy and is irrespective of sex.
Similarly, considering the neuroanatomical structures, the same authors (Baron-‐Cohen et al.
2005) argue that the brain of ASD patients represents an atypical extreme of typical male
brain. The validity of this hypothesis has been proved inasmuch as the overall brain is
concerned: studies have established that the mean total cerebral volume of typical young
males is, on average, 10% larger than the typical female one (Caviness, 1996; Reiss, 1996;
Lenroot, 2007; Giedd, 2009) and it is a well-‐replicated datum that ASD children have even
larger brains than typical males (Piven, 1992; Piven, 1995; Courchesne 2001; Courchesne
2003; Aylward 2002; Sparks 2002; Hazlett 2005; Schumann 2010). As to the volume of
specific brain subregions, results are less univocal (Amaral, 2008; Stanfield, 2008), also
because of differences in age and clinical features of the study samples.
Up to date few neuroimaging studies have focused on ASD females. Literature predominantly
concern samples of male subjects only (Piven 1995; Courchesne, 2001; Carper 2002; Herbert,
2003 Carper and Courchesne, 2005; Wassink, 2007; Hardan, 2009) or of males and females
together, without separate gender analyses (Aylward, 2002; Hazlett, 2005; Mosconi, 2009;
Zeegers 2009). This choice is explainable with the disproportionate rate between ASD males
and females, which is not sufficient to reach the statistical power needed to detect differences.
Since even in typical development there is an early sexual dimorphism of brain volumes
(Geary, 1998; Durston, 2001, Gilmore, 2007), it could be crucial to obtain information related
to gender effect. To our knowledge, only two studies (Bloss and Courchesne, 2007, Craig,
2007) are specifically addressed to the neuroanatomical structure in ASD females through
structural MRI investigation. The preliminary study of Bloss and Courchesne (2007) is
focused on 9 preschool ASDf and reveals statistically significant differences from typical girls,
54
consisting in the enlargement of whole brain, of frontal, temporal gray matter regions and of
cerebellar white matter, and in the reduction of cerebellar gray matter volume. Craig’s
contribution compares 14 high-‐functioning adult ASD females to typically developed women,
finding in the former’s brains a reduction both of grey and the white matter of specific
regions, and an enlargement of the white matter in certain cerebral structures and
cerebellum. However, it is difficult to compare these two works with each other, as they do
present substantial differences not only with regard to the sample age and clinical
characteristics, but also with regard to the methods of anatomic parcellation (manual tracing
and computer algorithms in Bloss study versus voxel-‐based morphometry analysis in Craig
paper). Previous studies exploring sex effect on brain ASD volume found no differences
between 9 ASDf and controls (Piven, 1996), and cerebral enlargement in 7 ASDf versus typical
development girls (Sparks, 2002). In the first longitudinal MRI study of brain volume growth
during early ASD childhood, Schumann (2010) accounted for the presence of a gender effect.
This analysis reveals that ASDf present an abnormal growth of whole brain and specific
anterior regions when compared to typical females and that this finding is more prominent
with respect to ASD males versus typical males. To summarize, studies investigating
volumetric brain differences between ASDf and controls suggest various and largely
unreplicated findings. However, the small sample size of females, the different ages and IQ
considered, as well as the variability of the analysis methodologies, prevent clear
interpretation and generalization of the results.
The present study aims to extend the knowledge on variability in the neuroanatomical
structures in ASDf children, using the voxel-‐based morphometry (VBM; Ashburner and
Friston, 2000) and the support vector machine (SVM) analytic approach (Vapnik, 1995).
While the VBM analysis is a well-‐established mass-‐univariate approach, the SVM multivariate
technique has been rarely implemented to investigate brain MR data of ASD subjects (Ecker et

55
al., 2010a; Ecker et al., 2010b). Whereas a mass-‐univariate approach does require correction
for multiple comparisons to avoid the occurrence of false positives, a multivariate technique
has the advantage of intrinsically taking into account inter-‐regional brain correlations.
Moreover, the SVM pattern recognition technique would allow investigations about the
predictive value of structural MRI scan (Ecker et al., 2010a; Ecker et al., 2010b). However,
both VBM and SVM approaches are implemented in the present study to validate the two
methods in detecting structural brain abnormalities in ASDf subjects with respect to controls.
In particular, the SVM classification capability to predict the class membership of undiagnosed
subjects is just exploited as a preliminary step of our algorithm allowing identifying possible
between-‐group structural differences.
6.2 Materials and methods
Subjects
The ASD sample included 38 female children (ASDf) and consists of 22 children with autistic
disorder (AD) and 16 children with pervasive developmental disorder – not otherwise
specified (PDD-‐NOS). These subjects were selected from a sample of 57 ASDf patients who
underwent a brain MRI examination in absence of a specific clinical indication, as a
completion of the diagnostic pathway with the aim of excluding brain abnormalities. The
sample had to satisfy these requirements: a diagnosis of idiopathic ASD according to the DSM-‐
IV-‐TR criteria coupled with clinical judgments and the absence of use of any psychotropic
medication. Diagnosis was made by a multidisciplinary team including a senior child
psychiatrist, an experienced clinically trained research child psychologist and a speech-‐
language pathologist during 10 days of extensive evaluation and confirmed by the Autism
Diagnostic Observation Schedule-‐Generic (ADOS-‐G; Lord et al., 2000) in 33 of 38 patients.
Exclusion criteria were: 1) anomalies detected by MRI; 2) a non verbal IQ, NVIQ< 40; 3) for
children under 48 months, lack of follow-‐up after 48 months of chronological age confirming
the clinical diagnosis of ASD; 4) infectious disorders; 5) neurological syndromes or focal

56
neurological signs; 6) dysmorphic features suggestive of a genetic syndrome; 7) significant
sensory disabilities; 8) anthropometric parameters (weight, height and head circumference)
lying outside two SD from the mean of normal subjects; 9) anamnesis of birth asphyxia,
premature birth, head injury or epilepsy; 10) insufficient image quality.
Consequently, 19 patients were excluded from the study because they had: non verbal IQ < 40
(2), seizures (2), microcephaly (2), macrocephaly (1), findings on brain MRI [enlargement of
subarachnoid spaces (1); arachnoid cyst (1); enlargement of the lateral ventricles (2),
asymptomathic Arnold-‐Chiari malformation type I (1); white matter reduction in temporal
lobe (1); hypoplasia of the corpus callosum (1)]; lack of follow-‐up after 48 months of age (3);
low quality scans (2).
Control female subjects were retrospectively selected from our database of clinical structural
MRI in order to match ASDf patients for age and NVIQ. This sample consists of 19 patients
with idiopathic developmental delay (DD) in whom ASD had been ruled out and 19 children
with NVIQ ≥ 70 (noDD).
As for ASD, the DD patients underwent structural MRI in absence of a specific clinical
indication, as a completion of the diagnostic pathway with the aim of excluding brain
alterations. The noDD subjects underwent an MRI examination because of various reasons
(including headache, head trauma, cataract, single -‐i.e. not recurrent in the next two years-‐
unprovoked idiopathic seizure). Inclusion criteria were: 1) a standardized evaluation of
cognitive abilities 2) clinical data records providing sufficient information to ensure the lack
of neurological, behavioural or developmental disorders.
The control group was selected so as to meet the same exclusionary criteria as the ASDf
(except the third criterion specified above) with the further requirements of no family history
of ASD and a score below 20 on the Childhood Autism Rating Scale (CARS; Schopler et al,
1988). CARS is a standardized clinical observation in which a trained observer rates child’s
57
behavior on each of 15 clinical features and has good psychometric properties to screen for
ASD (Magyar & Pandolfi, 2007).
ASD and DD patients performed also the recommended laboratory tests to rule-‐out medical
causes of ASD/DD, including audiometry, thyroid hormone disorders, high-‐resolution
karyotyping, DNA analysis of FRA-‐X and screening tests for inborn errors of metabolism
(plasma and urine aminoacid analysis, urine organic acid measurement, urine
mucopolysaccarides quantitation, plasma and urine creatine and guanidinoacetate analysis).
The diagnosis of idiopathic DD was performed after a 10 days multidisciplinary and thorough
evaluation when the mental retardation (IQ<70) remains of unknown etiology after an
exhaustive investigation (both clinical and laboratoristic) for underlying causes.
A number of well-‐standardized tests with valid and reliable psychometric properties were
used to assess intellectual abilities due to differences in the age, verbal skills and functioning
level of female children, as is common in clinical practice and research. These included: the
Leiter International Performance Scale -‐ Revised (Roid & Miller, 1997), the Griffiths Mental
Development Scale-‐Revised (Griffiths, 1996), the Italian version of Wechsler Preschool and
Primary Scale of Intelligence ((WPPSI, Wechsler, 1973) and Wechsler Intelligence Scales for
Children – Revised (WISC-‐R, Wechsler, 1986). As some of these tests provide only a global
cognitive score, separate verbal and nonverbal IQ scores were not available.
The characteristics of all samples (ASDf, DD and noDD) are reported in Tab. 6.1.
MRI data acquisition
MRI data were acquired using a GE 1.5 T Signa Neuro-‐optimized System (General Electric
Medical Systems) fitted with 40 mT/m high-‐speed gradients. The standard MR protocol for
children included FSE T2-‐wighted, FLAIR, DWI, SE T1-‐weighted sequences and a single voxel
1H MR spectrum. Moreover, a whole-‐brain fast spoiled gradient recalled acquisition in the
steady-‐state T1-‐weighted series (fSPGR) were collected in the axial plane with repetition time
58
12.4 ms, echo time 2.4 ms, inversion time 700 ms, flip angle=10°, yielding 124 contiguous 1.1
mm axial slices of 256 x 192 voxels with an in-‐plane resolution of 1.1×1.1 mm2.
All children were sedated with a general anaesthesia with a halogenated while spontaneously
breathing. All MRIs were performed between October 2003 and March 2010 and the written
informed consent from a parent or guardian of children participating in the study was
obtained.
The research protocol was approved by the Institutional Review Board of the Clinical
Research Institute for Child and Adolescent Neurology and Psychiatry.
VBM-‐DARTEL image preprocessing
We conducted a voxel-‐based morphometry (VBM) study (Ashburner and Friston, 2000) to
investigate the differences in the volumes of grey matter (GM) and white matter (WM)
between the autism and the control group. The T1-‐weighted volumetric images were analyzed
with SPM8 package (Statistical Parametric Mapping, Wellcome Department of Imaging
Neuroscience, London, UK, http://www.fil.ion.ucl.ac.uk/spm) using the VBM protocol with
modulation. We implemented the Diffeomorphic Anatomical Registration using
Exponentiated Lie algebra (DARTEL) algorithm (Ashburner, 2007), where a diffeomorphic
warping is implemented to achieve an accurate inter-‐subject registration with an improved
realignment of small inner structures (Yassa and Stark, 2009), and to generate a study-‐
specific template.
The VBM preprocessing included the following steps: (1) checking for scanner artifacts and
gross anatomical abnormalities for each subject; (2) setting the image origin to the anterior
commissure; (3) SPM default segmenting of brain tissues; (4) importing the parameter files
produced by the tissue segmentation in the DARTEL procedure to generate a study-‐specific
template, and to obtain the brain tissues segmented according to it; (5) affine transforming of
segmented brain tissues into the MNI space (Ashburner, 2007) according to the

59
normalize_DARTEL.m matlab script (McLaren et al., 2010; Canu et al., 2010); (5) checking for
homogeneity across the sample and using standard smoothing (i.e. with 8-‐mm isotropic
Gaussian kernel). After this preprocessing, we obtained smoothed modulated normalized data
(in the MNI space) to be used for the statistical analysis. The aim of the modulation step was
to render the final VBM statistics reflective of the “volume” differences rather than the
“concentration” differences in GM (Ashburner and Friston, 2000).
VBM Statistical analysis
Whole-‐brain volume comparison
Group differences were evaluated for the volumes of gray matter (GM), white matter (WM),
cerebrospinal fluid (CSF), and for total intracranial volume (TIV).
Estimates of the absolute GM, WM, and CSF volumes were obtained after the automatic brain
segmentation had been carried out in the VBM-‐DARTEL preprocessing. The TIV was
calculated as the sum of the volumes of GM, WM, and CSF. The analysis of variance (ANOVA)
was performed to identify any significant difference in global tissue volumes between ASDf
and control subjects.
Mass-‐univariate approach: VBM analysis
The regional GM and WM volumes were compared between the two groups using the VBM-‐
DARTEL analysis. The normalized modulated and smoothed GM/WM image segments in each
group were entered into a voxel-‐wise two-‐sample t-‐test analysis in SPM8. The conventional
VBM–type analysis was employed using the stringent significance threshold p<0.05, family-‐
wise error rate (FWE) corrected.
60
Pattern recognition approach: SVM classification
We followed the whole-‐GM classification approach with SVM proposed by Klöppel (2008) and
Ecker (2010a). In contrast to the mass-‐univariate VBM analysis, the pattern recognition
techniques, e.g. SVMs, are multivariate and thus take into account specific inter-‐regional
dependencies, using that information to help categorize scans (Lao et al., 2004; Fan et al.,
2005).
A SVM (Cortes and Vapnik, 1995) is a supervised classification method, i.e. it requires a
training set, where to learn the differences between the two groups, and a validation set to
evaluate the classification performance on previous unseen data. In our analysis, each image
is treated as a point in a high dimensional space, where the space dimension is equal to the
number of voxels in the SPM segmented GM. The input to the SVM are vectors of
features/voxels extracted from the two categories of patients and controls, labeled with “1”
and “-‐1”, respectively. As the number of features/voxels is very high, whereas the amount of
subjects considered in this study is rather limited, we considered only linear kernel SVM to
avoid the risk of overfitting data. Training an SVM is a minimization problem where the
largest margin hyperplane allowing for an optimal separation of the training examples is
identified. The separating hyperplane is defined by a weight vector and an offset, w • x + b = 0,
where the weight vector w is a linear combination of the support vectors and it is normal to
the hyperplane. The SVM is trained according to the leave-‐pair-‐out cross validation technique
(LPO-‐CV), which is usually implemented to estimate the performance of a classifier when a
rather limited dataset is available. The classification performance is evaluated according to
the receiver operating characteristic (ROC) curve (Metz, 1986), where the sensitivity (true
positive ratio, i.e. the percentage of ASD subjects correctly classified as ASD) is plotted against
the false positive ratio (i.e. the percentage of misclassified control subjects). Different ROC
curves are compared to each other in terms of the estimated areas under the curve (AUC). The
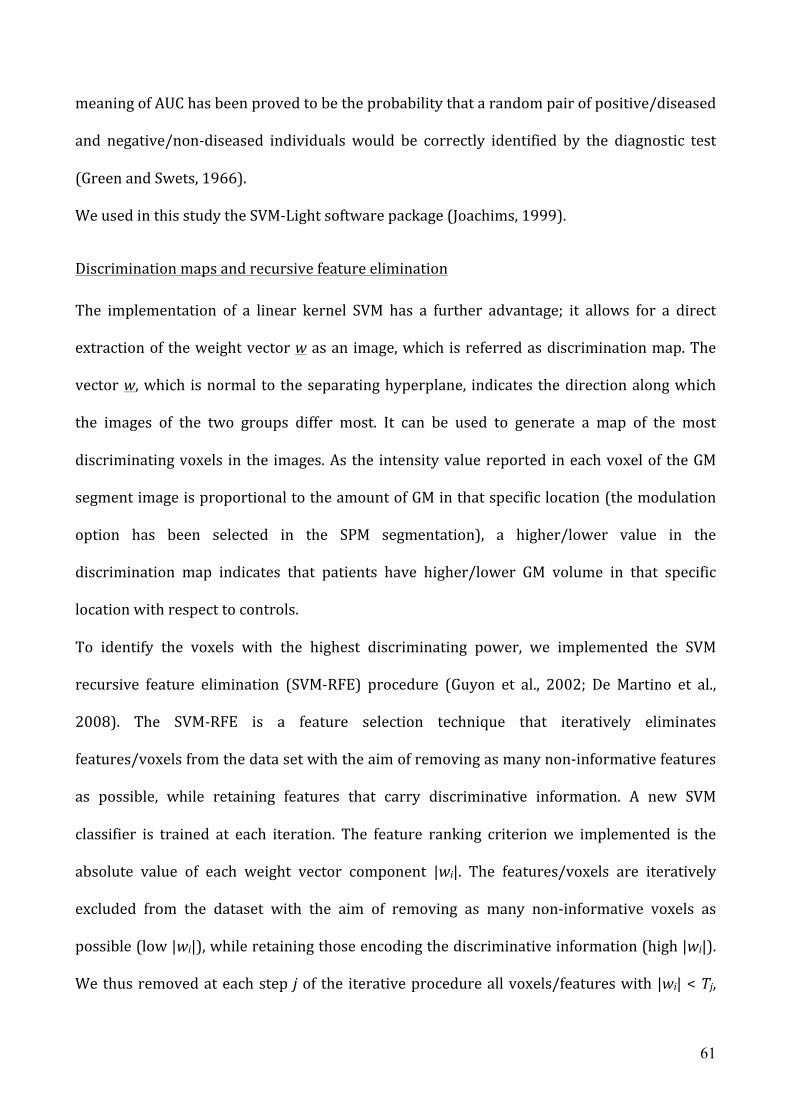
61
meaning of AUC has been proved to be the probability that a random pair of positive/diseased
and negative/non-‐diseased individuals would be correctly identified by the diagnostic test
(Green and Swets, 1966).
We used in this study the SVM-‐Light software package (Joachims, 1999).
Discrimination maps and recursive feature elimination
The implementation of a linear kernel SVM has a further advantage; it allows for a direct
extraction of the weight vector w as an image, which is referred as discrimination map. The
vector w, which is normal to the separating hyperplane, indicates the direction along which
the images of the two groups differ most. It can be used to generate a map of the most
discriminating voxels in the images. As the intensity value reported in each voxel of the GM
segment image is proportional to the amount of GM in that specific location (the modulation
option has been selected in the SPM segmentation), a higher/lower value in the
discrimination map indicates that patients have higher/lower GM volume in that specific
location with respect to controls.
To identify the voxels with the highest discriminating power, we implemented the SVM
recursive feature elimination (SVM-‐RFE) procedure (Guyon et al., 2002; De Martino et al.,
2008). The SVM-‐RFE is a feature selection technique that iteratively eliminates
features/voxels from the data set with the aim of removing as many non-‐informative features
as possible, while retaining features that carry discriminative information. A new SVM
classifier is trained at each iteration. The feature ranking criterion we implemented is the
absolute value of each weight vector component |wi|. The features/voxels are iteratively
excluded from the dataset with the aim of removing as many non-‐informative voxels as
possible (low |wi|), while retaining those encoding the discriminative information (high |wi|).
We thus removed at each step j of the iterative procedure all voxels/features with |wi| < Tj,
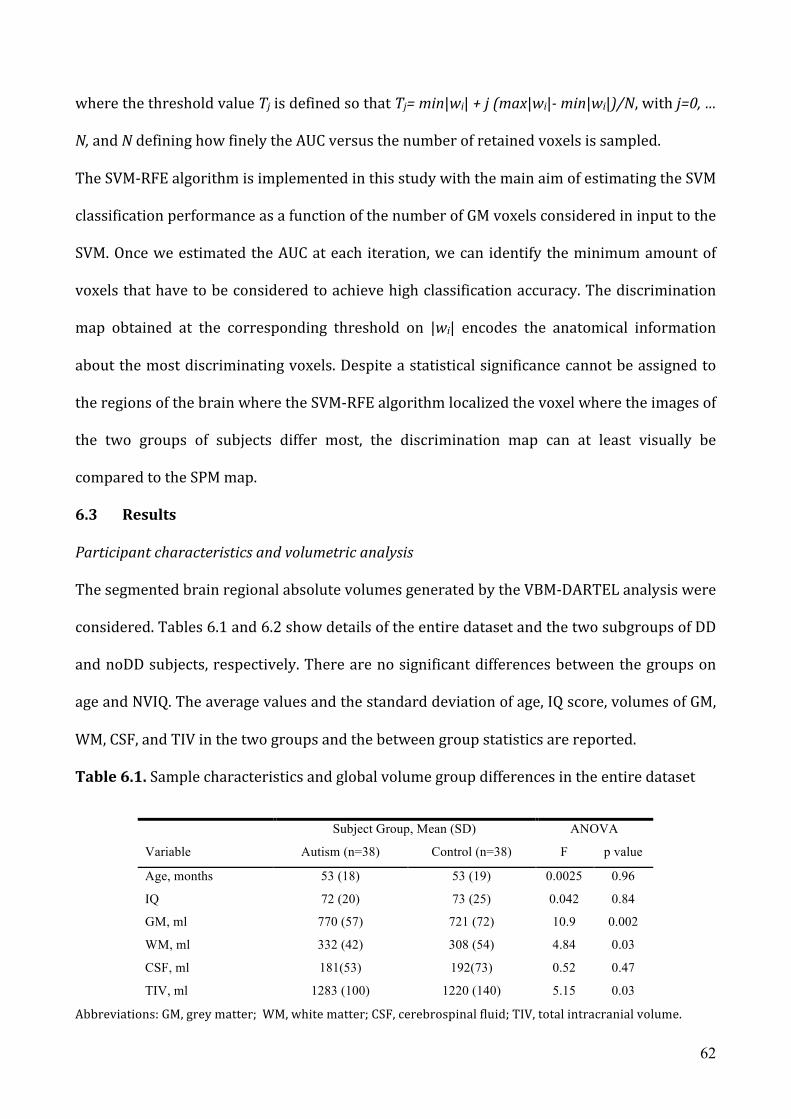
62
where the threshold value Tj is defined so that Tj= min|wi| + j (max|wi|-‐ min|wi|)/N, with j=0, …
N, and N defining how finely the AUC versus the number of retained voxels is sampled.
The SVM-‐RFE algorithm is implemented in this study with the main aim of estimating the SVM
classification performance as a function of the number of GM voxels considered in input to the
SVM. Once we estimated the AUC at each iteration, we can identify the minimum amount of
voxels that have to be considered to achieve high classification accuracy. The discrimination
map obtained at the corresponding threshold on |wi| encodes the anatomical information
about the most discriminating voxels. Despite a statistical significance cannot be assigned to
the regions of the brain where the SVM-‐RFE algorithm localized the voxel where the images of
the two groups of subjects differ most, the discrimination map can at least visually be
compared to the SPM map.
6.3 Results
Participant characteristics and volumetric analysis
The segmented brain regional absolute volumes generated by the VBM-‐DARTEL analysis were
considered. Tables 6.1 and 6.2 show details of the entire dataset and the two subgroups of DD
and noDD subjects, respectively. There are no significant differences between the groups on
age and NVIQ. The average values and the standard deviation of age, IQ score, volumes of GM,
WM, CSF, and TIV in the two groups and the between group statistics are reported.
Table 6.1. Sample characteristics and global volume group differences in the entire dataset
Subject Group, Mean (SD) ANOVA
Variable Autism (n=38) Control (n=38) F p value
Age, months 53 (18) 53 (19) 0.0025 0.96
IQ 72 (20) 73 (25) 0.042 0.84
GM, ml 770 (57) 721 (72) 10.9 0.002
WM, ml 332 (42) 308 (54) 4.84 0.03
CSF, ml 181(53) 192(73) 0.52 0.47
TIV, ml 1283 (100) 1220 (140) 5.15 0.03
Abbreviations: GM, grey matter; WM, white matter; CSF, cerebrospinal fluid; TIV, total intracranial volume.
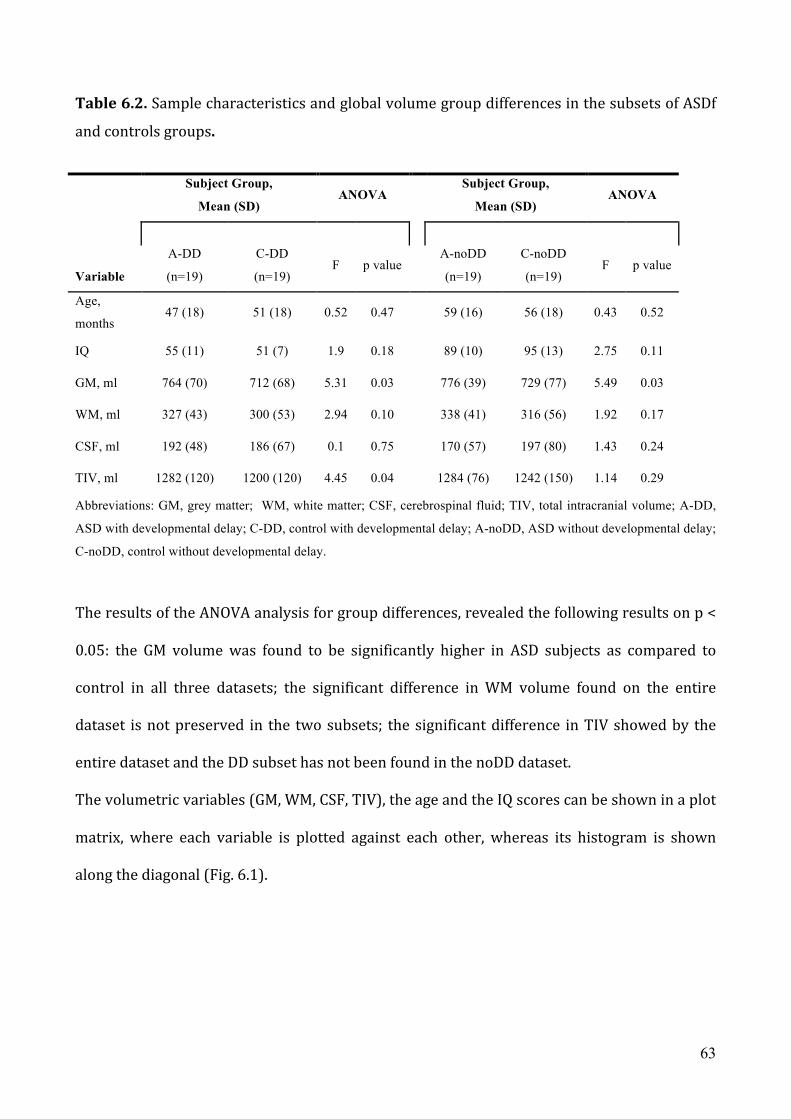
63
Table 6.2. Sample characteristics and global volume group differences in the subsets of ASDf
and controls groups.
Subject Group,
Mean (SD) ANOVA
Subject Group,
Mean (SD) ANOVA
Variable
A-DD
(n=19)
C-DD
(n=19) F p value
A-noDD
(n=19)
C-noDD
(n=19) F p value
Age,
months 47 (18) 51 (18) 0.52 0.47
59 (16) 56 (18) 0.43 0.52
IQ 55 (11) 51 (7) 1.9 0.18 89 (10) 95 (13) 2.75 0.11
GM, ml 764 (70) 712 (68) 5.31 0.03 776 (39) 729 (77) 5.49 0.03
WM, ml 327 (43) 300 (53) 2.94 0.10 338 (41) 316 (56) 1.92 0.17
CSF, ml 192 (48) 186 (67) 0.1 0.75 170 (57) 197 (80) 1.43 0.24
TIV, ml 1282 (120) 1200 (120) 4.45 0.04 1284 (76) 1242 (150) 1.14 0.29
Abbreviations: GM, grey matter; WM, white matter; CSF, cerebrospinal fluid; TIV, total intracranial volume; A-DD,
ASD with developmental delay; C-DD, control with developmental delay; A-noDD, ASD without developmental delay;
C-noDD, control without developmental delay.
The results of the ANOVA analysis for group differences, revealed the following results on p <
0.05: the GM volume was found to be significantly higher in ASD subjects as compared to
control in all three datasets; the significant difference in WM volume found on the entire
dataset is not preserved in the two subsets; the significant difference in TIV showed by the
entire dataset and the DD subset has not been found in the noDD dataset.
The volumetric variables (GM, WM, CSF, TIV), the age and the IQ scores can be shown in a plot
matrix, where each variable is plotted against each other, whereas its histogram is shown
along the diagonal (Fig. 6.1).

64
Figure 6.1. Single subject data on volumetric variables (GM, WM, CSF, TIV), age and IQ scores; the histogram of each variable is shown along the diagonal in arbitrary units.
Local GM/WM volume differences (VBM–DARTEL)
To detect possible regional between-‐group differences, we employed the conventional voxel-‐
wise two-‐sample t-‐test VBM analysis on normalized modulated and smoothed (8-‐mm FWHM
isotropic Gaussian kernel) GM and WM segments, using the stringent statistical threshold
p<0.05, FWE corrected, with an extent threshold of 10 voxels. An absolute threshold mask of
0.1 on both GM and WM was used to avoid possible edge effects around the border between

65
GM and WM. Age and IQ were entered as covariates in the statistical analysis, thus ending up
with 72 degrees of freedom.
Whereas no statistical significant difference has been detected in the WM volume, a significant
volumetric between-‐group difference has been found in the GM. As shown in Fig. 6.2A, a
significant increased GM volume is detected in the left superior frontal gyrus.
Support Vector Machine (SVM) classification of GM segments
The vectors of features given in input to the SVM are constituted by the sequence of the
intensity values of the GM segments obtained in the VBM preprocessing; the vector entries
represent the amount of GM in each voxel, as the modulation option has been selected in the
SPM segmentation.
Linear kernel SVMs have been implemented to reduce the risk of overfitting the data as the
number of features/voxels is very high (about 2.5×10⁵), whereas the number of pattern in the
dataset is limited to 76. The linear kernel SVM has only one parameter: the c value, that
controls the trade off between having zero training errors and allowing for misclassifications.
We used the default c values computed by the SVM-‐Light software through heuristics on the
training dataset. As each patient in our dataset is matched to a control with respect to both
age and IQ score, the SVMs have been trained according to the leave-‐pair-‐out cross validation
(LPO-‐CV), thus excluding one couple of matched subjects from the training set at each
iteration, and validating the trained SVM on it. The discrimination performance of SVM
trained with all features/voxels of the GM segment is quite poor: AUC=0.62.
Discrimination maps and SVM recursive feature elimination (RFE)
The SVM-‐RFE algorithm has been implemented as follows: for each threshold Tj on the |wi| the
LPO-‐CV is performed on the retained data to give an estimate of the classification
performance of the SVMs obtained with the reduced set of features/voxels. The behavior of

66
AUC versus the number of retained voxels reported in Fig. 3 shows that the SVM-‐RFE
procedure is very useful to optimize the classification performance leading to an
improvement in the value of AUC from 0.62 to a maximum value AUCmax=0.80.
Despite an AUC value of 0.80 obtained in LPO-‐CV is itself a very interesting result from the
point of view of the on-‐going debate about the predictive value of whole-‐brain structural MR
scans in ASD (Ecker et. al 2010a), it is behond the aim of the present study to set-‐up a
decision-‐making system on ASD data. We show here the behavior of AUC during the SVM-‐RFE
iterations to infer that an objective criterion to set the threshold Tj on the weights |wi| to be
shown on the discrimination maps could be defined for example as to choose Tj
corresponding to AUCmax.
As shown in Fig. 3, the AUC shows a plateau region where the relative difference between AUC
and AUCmax is less than 2%. The maximum value AUCmax is achieved by retaining about 200
voxels in the SVM classification (corresponding to less than 0.08% of the total amount of GM
voxels), whereas the plateau region for AUC extends from a percentage of retained voxels of
0.01% to 1% of the total amount of GM voxels.
To build the discrimination maps we computed the weight vector w using all data to train the
SVM. We reported in Fig. 2B the map obtained for the left extreme values of the plateau region
of AUC (see Fig. 3), i.e. with the most exiguous number of discriminating voxels (0.01% of GM
voxels with the highest |wi| values) retained in training the SVM, and leading to an AUC value
(AUC=0.79) within the 2% of relative difference from AUCmax.

67
Figure 6.2. Brain region showing larger local GM volumes in the autism disorder group compared to control subjects (yellow/red areas) are overlaid to a representative structural MR image normalized to the MNI space. A): VBM result with p<0.05, FWE corrected, with an extent threshold of 10 voxels. B): SVM-‐RFE discrimination maps obtained with about the 0.01% of retained voxels (left extreme of the plateau where AUC=0.79, as shown in fig. 3). The VBM and SVM-‐RFE procedures reveal the same cortical volume alteration in the left superior frontal gyrus (MNI coordinates: -‐19 44 23).
Figure 6.3. AUC versus the number of voxels with high |wi| values considered for the SVM classification of the GM segments. The maximum AUC value is obtained by considering about 200 voxels (0.08% of GM voxels) in the SVM training (AUCmax=0.80); a plateau region where AUC values are within 2% of relative difference from AUCmax is obtained for a percentage of retained GM voxels in the 0.01%–1% range.
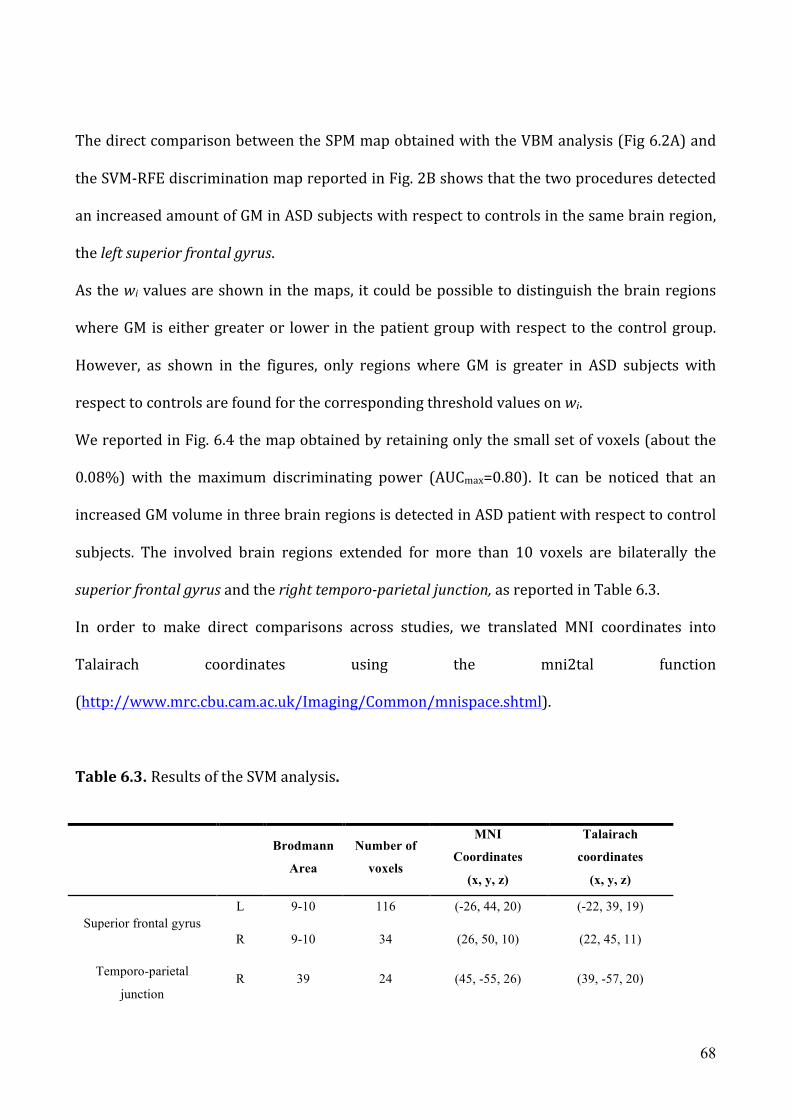
68
The direct comparison between the SPM map obtained with the VBM analysis (Fig 6.2A) and
the SVM-‐RFE discrimination map reported in Fig. 2B shows that the two procedures detected
an increased amount of GM in ASD subjects with respect to controls in the same brain region,
the left superior frontal gyrus.
As the wi values are shown in the maps, it could be possible to distinguish the brain regions
where GM is either greater or lower in the patient group with respect to the control group.
However, as shown in the figures, only regions where GM is greater in ASD subjects with
respect to controls are found for the corresponding threshold values on wi.
We reported in Fig. 6.4 the map obtained by retaining only the small set of voxels (about the
0.08%) with the maximum discriminating power (AUCmax=0.80). It can be noticed that an
increased GM volume in three brain regions is detected in ASD patient with respect to control
subjects. The involved brain regions extended for more than 10 voxels are bilaterally the
superior frontal gyrus and the right temporo-‐parietal junction, as reported in Table 6.3.
In order to make direct comparisons across studies, we translated MNI coordinates into
Talairach coordinates using the mni2tal function
(http://www.mrc.cbu.cam.ac.uk/Imaging/Common/mnispace.shtml).
Table 6.3. Results of the SVM analysis.
Brodmann
Area
Number of
voxels
MNI
Coordinates
(x, y, z)
Talairach
coordinates
(x, y, z)
Superior frontal gyrus L 9-10 116 (-26, 44, 20) (-22, 39, 19)
R 9-10 34 (26, 50, 10) (22, 45, 11)
Temporo-parietal
junction R 39 24 (45, -55, 26) (39, -57, 20)

69
Figure 6.4. Discrimination maps overlaid to a representative structural MR image. The voxels (about 0.08% of the total amount of GM voxels) with the highest discrimination power (AUCmax=0.80) correspond to three areas of the brain where GM is greater in the ASDf group with respect to the control group: the bilateral superior frontal gyrus [number of voxels (MNI coordinates): 116 (-‐26 44 20); 34 (26 50 10)], and the right temporo-‐parietal junction (TPJ) [24 (45 -‐55 26)].

70
6.4 Discussion
Findings from several MRI-‐based morphometric studies on “brain’s ASD children”, actually
refer to sample of “brain’s ASD males children” (Piven 1995; Courchesne 2003; Carper 2002;
Herbert 2003; Carper and Courchesne, 2005; Wassink, 2007; Hardan, 2009). When females
take part to the sample, they are often not enough to perform a reliable separate analysis by
sex (Courchesne, 2001, Aywlard, 2002; Kates 2004). Moreover, only high-‐functioning ASD
patients usually participated to a MRI study (Abell, 1999; Aywlard, 2002; Herbert 2003; Mc
Alonan, 2005, Salmond 2005) since they present a better compliance to complete the MRI
exam without sedation. Therefore, the extent to which conclusions can be applied to the
entire ASD population is limited.
This study attempts to fulfil part of this research lack by exploring brain volumes differences
in a group of female children with ASD as compared with a control group that includes both
female children with DD and without DD. The results provide three key findings.
First, the between-‐group whole-‐brain and brain-‐segment volume comparison revealed a total
intracranial volume enlargement approximately of 5 % in female children with ASD with
respect to age and IQ matched controls. The GM, WM and CSF segments were obtained during
the VBM preprocessing based on the DARTEL algorithm, where a diffeomorphic warping is
implemented to achieve an accurate inter-‐subject registration and a study specific template.
The total intracranial volume has thus been estimated as the sum of GM, WM and CSF.
These findings are consistent with the well-‐replicated result of an accelerated postnatal brain
growth in ASD samples of males or mixed subjects and with an attenuation of the difference
between patients and controls with increasing age (Courchesne, 2007). Conversely, MRI data
regarding early brain overgrowth in ASDf are inconclusive: Piven (1996) reports on an
increased total brain volume in ASD males, but not in females, Sparks (2002) demonstrates
71
similar enlargement of cerebral volume across gender, while Bloss and Courchesne (2007)
described an abnormal enlargement of whole brain, frontal cortex and temporal cortex
greater in females than in males with ASD. Although causes of early brain overgrowth and its
pathophysiology remains to be established (Amaral, 2008), possible consequences could be a
reduction of connectivity (Ringo, 1991) and, from the clinical point of view, an interference on
typical social behavior, as suggested by a murine model (Fatemi, 2002). Evidence for this
early enlargement comes from retrospective longitudinal studies on disproportional head
circumference size (Lainhart, 1997; Courchesne 2003; Torrey 2004), and are confirmed by an
increased brain volume in ASD structural MRI investigations on toddlers and children
(Hazlett, 2005; Courchesne 2001; Carper 2002; Sparks 2002). While some researchers argue
that abnormal brain enlargement is mainly explained by excessive increases in WM (Herbert,
2003, Courchesne, 2001 Hazlett, 2005), others think that GM is involved, alone or in
association to WM (Lotspeich, 2004; Palmen 2005; Schumann, 2010). In the present study, the
greater GM (p=0.0015) primarily accounted for overall brain volume enlargement in children
ASDf (p=0.0262) relative to control children; however, an atypical and excessive development
is also present in WM (p=0.0310) and CSF (p=0.4744).
Second, the conventional VBM analysis we implemented (smoothing with 8-‐mm FWHM
isotropic Gaussian kernel, voxel-‐wise two-‐sample t-‐test, stringent statistical threshold p<0.05,
family-‐wise error corrected, extent threshold of 10 voxels) highlighted an increased GM
volume in a specific region of the left superior frontal gyrus (lSFG; BA9/10) of ASDf. A
regional cortical volume alteration has been revealed by the SVM-‐RFE analysis obtained with
the most exiguous set of voxels (0.01% of the total GM voxels) and the results are extremely
consistent with the lSFG region identified by the VBM analysis.
According to an anteroposterior gradient of early brain enlargement in ASD, the frontal lobes
are the site of the peak of overgrowth and abnormalities (Carper 2002) as indicated also by an

72
excessive cortical folding, measured by the gyrification index (Hardan, 2004, Jou, 2010). Our
results are in agreement with an advanced analysis of frontal area which restricts the
enlargement to dorsal (which contains the SFG area) and mesial regions (Carper &
Courchesne, 2005). Indirect information regarding structural abnormalities in the lSFG
derives also from mapping of cortical sulcal patterns (Levitt 2003) revealing an anterior and
superior shifting of superior frontal sulcus in ASD children and adolescents compared to
controls. At the microscopic level, histologic studies provide evidence for disturbances in the
brain maturation process in this area, as indicated by alteration of cell microcolumn
morphology in BA 9 (Casanova, 2002, Buxhoeveden, 2006).
According to Amodio and Frith (2006), the SFG belongs to the anterior rostral region of the
medial frontal cortex (arMFC), an area activated by a wide range of tasks including executive
functions (Duncan & Owen, 2000), as well as evaluative judgment (Zysset, 2003), self-‐
knowledge, monitoring of one’s own emotional state, person perception, mentalizing (see
Amodio & Frith for a review). In particular, “mentalizing” (Frith et al., 1991) or “theory of
mind” (ToM; Premack and Woodruff, 1978) is the human ability to attribute mental states to
self and others and represents the ASD deficit that mainly explains the social and
communication impairment of these patients (Frith, 2001). While the typical anterior core
area in mentalizing system corresponds to the medial prefrontal cortex (Van Overwalle,
2011), our GM increased area is localized in a more lateral region and is implicated in at least
some aspects of ToM. For instance, the joint attention, one of the first manifestations, at about
18 months, of the mentalizing capacity is sustained by a neural network involving an area of
increased volume in lSFG (Waiter, 2004; Williams, 2005).
Ramnani and Owen (2004) argue that BA 10 is activated in high-‐level tasks requiring the
coordination and integrations of multiple related cognitive operations. A deficit in abilities
that need integration of information is also the characteristic neuropsychological profile of

73
ASD children, regardless of IQ (Williams, 2006). There is a large body of research
demonstrating that ASD patients have an altered activation in tasks requiring SFG
contribution, such inhibition of inappropriate responses/cognitive control (Minshew, 1999;
Solomon, 2009), self-‐referential processing (Lombardo, 2010) and reward achievement
(Schmitz; 2008).
Recent investigations on the macaque monkey (Petrides & Pandya, 2007) indicates that the
rostral prefrontal cortex, which contains the analogous of our increased GM density area in
SFG, projects to the multisensory processing region of the superior temporal sulcus. This area
is involved in an higher order level elaboration process, consisting in integration of
information coming from multiple sensory sources to reach an abstract interpretation and
elaboration of the experiences (Petrides & Pandya, 2007). Atypical responses to typical
sensory stimulation have been described as a common feature of ASD patients (Wing, 1969;
Baranek, 1997) and a possible explanation focuses on impairments in the cortical integration
of perceptual input (Gomot 2002). In addition, difficult to integrate sensory information in a
gestaltic manner lies at the bottom of the weak central coherence hypothesis of ASD (Frith
1989; Happé and Frith 2006). Therefore, it could be hypothesized that the structural
alteration in SFG interferes with the connections to superior tempotal sulcus determining, in
its turn, an altered activity of this area. The rostral prefrontal cortex is also connected with
amygdala, orbitofrontal and cingulate cortex, areas all involved in ToM and empathy tasks
processing (Völlm, 2006).
Third, the implementation of the SVM analysis on the GM segments obtained in the VBM-‐
DARTEL preprocessing revealed a more complex circuitry that discriminates ASDf from
control subjects. In fact, the GM volume excess previously limited to the lSFG, is now flanked
by a volume increase in the homologous area (MNI coordinates = 26 50 10) in the right
hemisphere, and, furthermore an increase of right temporo-‐parietal junction (rTPJ; MNI

74
coordinates = 45 -‐55 26). Abnormalities in GM temporal lobe of ASD subjects are reported by
several structural MRI investigations (Carper, 2002; Boddaert 2004; Waiter, 2004; Hazlett,
2005; Bonilha, 2008; Schumann, 2010) and are in agreement with neuropathologic findings
(Bauman & Kemper, 1985; Bailey, 1998; Casanova, 2002). Moreover, these subtle, but
significant GM alterations correspond closely to areas implicated in social cognitive function
in other studies. In particular TPJ is a fundamental neural substrate for ToM abilities (Saxe &
Kanwisher, 2003) and for attributions of representational mental states (e.g. beliefs) mainly
(Zaitchik, 2010), but it is also implicated in reasoning, human-‐like shape motion, goal-‐directed
action and moral judgments tasks (Van Overwalle, 2009). Neuroimaging studies in adult ASD
have contradictory reported weaker activation of ToM circuit involving TPJ (Castelli, 2002),
enhanced activations of these areas (Mason, 2008) or no differences between patients and
controls (Happé, 1996). On the other hand, a recent investigation on ToM network (Kana,
2009) correlates the TPJ alteration in ASD patients with a lower functional connectivity
between this region and frontal areas.
Approaches based on SVM and SVM-‐RFE classification have been implemented in the last few
years both on structural data of subjects with different pathologies, e.g schizophrenia (Fan et
al., 2005), Alzheimer’s disease (Kloppel et al., 2008) and also autism (Ecker et al., 2010a;
Ecker et al., 2010b), and to functional data to classify for example brain states (Mourão-‐
Miranda et al., 2005).
Some of those studies are voxel based, i.e. the SVM classifier works in an N dimensional space,
where N can be either the size of the whole image or of the ROI considered for the analysis
(Mourão-‐Miranda et al., 2005; Kloppel et al., 2008; Ecker et al., 2010a). The other studies
consist in feature-‐based analyses, where morphological (volumetric, geometrical) features are
first extracted from the data, and then classified by the SVM (Fan et al., 2005; Ecker et al.,
2010b).

75
The procedure we adopted in this study belongs to the voxel-‐based category, and can be
directly compared with the paper by Ecker et al. (2010b), which is focused on autism data as
well. A comparative discussion about the results is not possible as the sample characteristics
are totally different in the two studies: males, adults and high-‐functioning ASD in the Ecker’s
paper versus females, children, and high-‐ and also low-‐functioning individuals in the current
analysis. Ecker et al. found that SVM succeded to identify a spatially distributed networks able
to discriminate between adult ASD males and controls. These included the limbic, frontal-‐
striatal, fronto-‐temporal, fronto-‐parietal and cerebellar systems. However they didn't found
any consistency between SVM and VBM results. In particular, the VBM analysis they
performed did not revealed any significant region with enlarged GM in the autism group with
respect to the control group at the conventional stringent levels of statistical significance
(p<0.05, FWE corrected). As the authors suggest, this can be been explained in term of the
availability of a not enough populated dataset, thus not allowing achieving a sufficient
statistical power for VBM not implemented with the DARTEL algorithm.
By contrast, results from VBM-‐DARTEL and SVM-‐RFE analyses are extremely consistent in the
present study. The fact that SVM-‐RFE allowed us to considered two additional interesting
brain regions with respect to the VBM output can be explained as follows. The VBM analysis
implemented with the stringent settings for correction for multiple comparisons (FWE
correction, p<0.05) is a safe procedure allowing only 5% false-‐positive voxels in the SPM
output; however, it is unfortunately prone to miss a lot of true positives. SVM, which is a
multivariate approach, intrinsically takes into account inter-‐voxel correlation, and it does not
need to the multiple comparison correction procedure. Through the RFE algorithm, SVM
allows to identify and localize even very subtle differences in the brain anatomy between two
groups of subjects.

76
From the methodological point of view, whereas in Ecker’s study the SVM potential in
discriminating patients from healthy controls and the predictive value of whole-‐brain
structural MR scans have been investigated, the implementation of SVM in the present study
is finalized to the generation of the discrimination maps. In other words, The SVM approach
has not been implemented in this study with the main aim to partitioning subjects into the
patient and control categories, but as an effective alternative approach to localize the brain
regions possibly involved in or affected by the disease. In particular, the SVM-‐RFE procedure
has been used not to optimize the predictive accuracy of the SVM classifier, but to remove
non-‐informative features from the weight vector to represent only the most informative
voxels in the discrimination maps.
We showed the behavior of AUC during the SVM-‐RFE iterations to infer that an objective
criterion can be implemented to choose the most appropriate amount of voxels to be
displayed in the discrimination maps. Despite an AUC value of 0.80 obtained in LPO-‐CV is
itself a very interesting result from the point of view of the on-‐going debate about the
predictive value of whole-‐brain structural MR scans started some time ago (Lao et al, 2004;
Davatzikos, 2004), and more recently focused on autism data (Ecker et. al 2010a), it is beyond
the aim of the present study to set-‐up a decision-‐making system on autism data.
The systematic evaluation of the predictive power of structural MR scans, the comparison
with and the possible combination to the information extracted from DTI data, deserve to be
addressed in a future dedicated study.
The present study has several methodological advantages as well as important limitations that
should be carefully considered. The strengths of this study included the large number of
carefully selected, medication-‐naive ASDf subjects and the availability of a large database,
which allowed us to examine both a well-‐matched noDD comparison group and a group of
idiopathic DD patients. However, the retrospective nature of the study implies an incomplete

77
data assessment (lack of ADOS in 5 of 38 ASDf patients) and a non-‐homogeneous evaluation of
intellectual abilities. The focalization of this study on brain of children ASD females prevents
us to extend conclusions to males. Future research on a specific comparison of ASD male and
female children, matched for age and IQ, could address the issue if a sex difference in regions
of brain enlargement exists, and investigate its possible correlation with ASD phenotype.
6.5 Conclusions
This study suggests that brain enlargement is a hallmark of early ASD, independent of sex and
that GM could represent a fundamental component of the altered developmental process. The
VBM-‐DARTEL analysis localized a particular increase of the volume of the left superior frontal
gyrus. By integrating the VBM-‐DARTEL analysis with the SVM classification approach we can
identify a broader pattern that differentiate ASDf from control subjects. This altered circuit,
which includes the bilateral frontal gyrus and the right temporo-‐parietal junction, could have
a seminal role in ASD core dysfunction.
Current findings can shed light on the specific neuroanatomy of ASD females, including also
lower-‐functioning subjects often excluded from research projects on structural MRI in ASD.
This study could represent an initial step toward an ASD diagnosis that includes brain
endophenotype in addition to standard approaches currently used, exclusively based on
behavioral criteria.

78
Selected references
1. Muratori F., Narzisi A., Calderoni S., Cesari A., Grassi C., Pitanti A., Tancredi R. (2009).
A Community Screening Program to Detect 1-‐Year-‐Old Infants at Risk of Pdd’s:
preliminary results, 8th International Meeting For Autism Research (IMFAR) Chicago
(USA), published in Abstract Book.
2. Muratori F., Narzisi A., Calderoni S., Calugi S., Apicella F., Santocchi E., Tancredi.,
(2010) Head Circumference Growth and Autism, 57th Annual Meeting of the American
Academy of Child and Adolescent Psychiatry (AACAP), New York (USA) 25-‐31 Ottobre,
published in Abstract Book.
3. Muratori F., Narzisi A., Calderoni S., Calugi S., Saviozzi I., Tancredi R. (2010)
Applicability of the Preschool Form of Child Behavior Checklist in Children with Autism,
57th Annual Meeting of the American Academy of Child and Adolescent Psychiatry
(AACAP), New York (USA) 25-‐31 Ottobre, published in Abstract Book.
4. Billeci L., Calderoni S., Biagi L., Muratori F., Catani M., Tosetti M. Exploratory data
analysis of tractographic measures: a study of children with ASDs. Accepted to annual
meeting ISMRM (International Society for Magnetic Resonance in Medicine): 7-‐13 May
2011 Montreal, Quebec, Canada.
5. Calderoni S., Retico A., Biagi L., Tancredi R., Muratori F., Tosetti M. Mass-‐Univariate
and Pattern Classification Analysis on Structural MRI In Children with Autism Spectrum
Disorders: a Focus on Females. Accepted to 10th International Meeting For Autism
Research, 12-‐14 May 2011 San Diego (USA).
6. Retico A., Calderoni S., Biagi L., Tancredi R., Muratori F., Tosetti M. Anatomical brain abnormalities in Autism Spectrum Disorder female children detected with VBM and SVM.
Accepted to 17th Annual Meeting of Organization for Human Brain Mapping, June 26-‐
30, 2011 Quebec City (Canada).
7. Muratori F., Telleschi M., Santocchi E., Tancredi R., Igliozzi R., Parrini B., Apicella F.,
Narzisi A., Calderoni S. (2009) Sviluppo della circonferenza cranica precoce nei
bambini con autismo. Alla ricerca di sottotipi clinici. AUTISMO e disturbi pervasivi
dello sviluppo; 2:257-‐270.
8. Muratori F., Narzisi A., Calderoni S., Fulceri F., Apicella F., Tancredi R (2009)
Identificazione dei bambini con autismo ad un anno di età: uno studio con la forma
retrospettiva del First Year Inventory (FYI). AUTISMO e disturbi pervasivi dello
79
sviluppo; 3:339-‐356.
9. Muratori F., Narzisi A., Tancredi R., Calugi S., Saviozzi I., Santocchi E., Calderoni S. The
CBCL 1½-‐5 and the identification of preschoolers with autism in Italy. Epidemiology and
Psychiatry Sciences (EPS). In press.
10. Muratori F., Narzisi A., Calderoni S., Apicella F., Filippi T., Santocchi E., Calugi S.,
Tancredi R. Abnormal growth of head circumference in ASD is limited to the first six
months of life. Submitted to Early Human Development.
11. Calderoni S., Retico A., Biagi L., Tancredi R., Muratori F., Tosetti M. A view into the brain of female children with autism spectrum disorder. Morphometric regional
alterations detected by structural MRI mass-‐univariate and pattern classification
analyses. Submitted to Biological Psychiatry.

80
References
1. Abell F, Krams M, Ashburner J, Passingham R, Friston K, Frackowiak R, Happé F, Frith
C, Frith U. The neuroanatomy of autism: a voxel-‐based whole brain analysis of
structural scans. NeuroReport. 1999;10(8):1647-‐1651.
2. Achenbach TM, Rescorla L. Manual for the ASEBA Preschool Forms and Profiles: An
integrated system of multi-‐informant assessment. Burlington, VT: University of
Vermont Department of Psychiatry; 2000.
3. Alexander, A.L., Lee, J.E., Lazar, M., Boudos, R., DuBray, M.B., Oakes, T.R., et al. Diffusion
tensor imaging of the corpus callosum in Autism. Neuroimage, 2007;34, 61–73.
4. Altemeier WA., Altemeier LE. (2009), How can early, intensive training help a genetic
disorder? Pediatr Ann, 38: 167-‐170.
5. Amaral DG, Schumann CM, Nordahl CW. Neuroanatomy of autism. Trends Neurosci
2008;31(3):137–45.
6. American Academy of Pediatrics. (2006). Council on Sports Medicine and Fitness and
Council on School Health. Active healthy living: prevention of childhood obesity
through increased physical activity. Pediatrics,117:1834–1842.
7. American Psychiatric Association. Diagnostic and statistical manual of mental
disorders, 4th edition, text revision. Washington, DC: American Psychiatric Press;
2000.
8. Amodio DM, Frith CD. Meeting of minds: the medial frontal cortex and social cognition.
Nat Rev Neurosci. 2006;7(4):268-‐277.
9. Ashburner J and Friston KJ, NeuroImage 2000; 11, 805-‐21.
10. Ashburner J, NeuroImage 2007; 38, 95-‐113.
11. Auyeung, B., Baron-‐Cohen, S., Ashwin, E., Knickmeyer, R., Taylor, K., Hackett, G., 2009.
Fetal testosterone and autistic traits. Br. J. Psychol. 100, 1—22.
12. Auyeung B, Taylor K, Hackett G, Baron-‐Cohen S. Foetal testosterone and autistic traits
in 18 to 24-‐month-‐old children. Mol Autism. 2010 Jul 12;1(1):11.
13. Aylward EH, Minshew NJ, Field K, Sparks BF, Singh N. Effects of age on brain volume
and head circumference in autism. Neurology 2002;59(2):175–83.
14. Baghdadli A, Picot MC, Pascal C, Pry R, Aussilloux C. (2003). Relationship between age
of recognition of first disturbances and severity in young children with autism. Eur
Child Adolesc Psychiatry, 12: 122-‐127.

81
15. Bailey A, Luthert P, Bolton P, Le Couteur A, Rutter M, Harding B. Autism and
megalencephaly. Lancet 1993;341(8854):1225-‐6.
16. Bailey A, Luthert P, Dean A, Harding B, Janota I, Montgomery M, Rutter M, Lantos P. A
clinicopathological study of autism. Brain. 1998;121(Pt 5):889-‐905.
17. Bailey A, Phillips W, Rutter M, 1996. Autism: towards an integration of clinical, genetic,
neuropsychological, and neurobiological perspectives. J. Child Psychol. Psychiatry 37,
89–126.
18. Barbaro J, Dissanayake C. (2009). Autism spectrum disorders in infancy and
toddlerhood: a review of the evidence on early signs, early identification tools, and
early diagnosis. J Dev Behav Pediatr, 30: 447-‐459.
19. Barnea-‐Goraly N, Kwon H, Menon V, Eliez S, Lotspeich L, Reiss AL. White matter
structure in autism: Preliminary evidence from diffusion tensor imaging. Biol
Psychiatry 2004;55(3):323-‐6.
20. Baron-‐Cohen S., Allen J., Gillberg C. (1992). Can Autism be detected at 18 months ? The
needle, the haystack, and the CHAT. British Journal of Psychiatry, 161: 839-‐843.
21. Baron-‐Cohen, S. (2002). The extreme male brain theory of autism. Trends Cog. Sci., 6,
248–254
22. Baron-‐Cohen, S., Knickmeyer, R.C. Belmonte,M. K. (2005). Sex differences in the brain:
implications for explaining autism. Science, 310, 819-‐823.
23. Bartholomeusz HH, Courchesne E, Karns CM. Relationship between head
circumference and brain volume in healthy normal toddlers, children, and adults.
Neuropediatrics 2002;33(5):239-‐41.
24. Basser PJ, Mattiello J, LeBihan D. Estimation of the effective self-‐diffusion tensor from
the NMR spin echo. J Magn Reson B. 1994;103(3):247-‐254.
25. Basser PJ, Pierpaoli C. Microstructural and physiological features of tissues elucidated
by quantitative-‐diffusion-‐tensor MRI. J Magn Reson B. 1996;111(3): 209-‐219.
26. Basser PJ, Pajevic S, Pierpaoli C, Duda J, Aldroubi A. In vivo fiber tractography using
DT-‐MRI data. Magn Reson Med. 2000 Oct;44(4):625-‐32.
27. Bauman ML, Kemper TL. Histoanatomic observations of the brain in early infantile
autism. Neurology. 1985;35(6):866-‐874.
28. Beaulieu C. The basis of anisotropic water diffusion in the nervous system: a technical
review. NMR Biomed. 2002;15(7-‐8):435-‐455.
82
29. Behrens TE, Woolrich MW, Jenkinson M, Johansen-‐Berg H, Nunes RG, Clare S,
Matthews PM, Brady JM, Smith SM. Characterization and propagation of uncertainty in
diffusion-‐weighted MR imaging. Magn Reson Med. 2003;50(5):1077-‐88.
30. Behrmann M, Avidan G, Leonard GL, Kimchi R, Luna B, Humphreys K, Minshew N.
Configural processing in autism and its relationship to face processing.
Neuropsychologia. 2006;44(1):110-‐29.
31. Ben Bashat, D., Kronfeld-‐Duenias, V., Zachor, D.A., Ekstein, P.M., Hendler, T., Tarrasch,
R., et al. Accelerated maturation of white matter in young children with autism: A high
b value DWI study. Neuroimage, 2007;37, 40–47.
32. Bertone A, Mottron L, Jelenic P, Faubert J. Enhanced and diminished visuo-‐spatial
information processing in autism depends on stimulus complexity. Brain. 2005;128(Pt
10):2430-‐41.
33. Bird H., Canino G., Gould M., Ribera J., Rubio-‐Stipec M., Woodbury M., Huertas-‐
Goldman S., Sesman M. (1987). Use of the Child Behavior Checklist as a screening
instruments for epidemiological research in child psychiatry: results of a pilot study. J
Am Acad Child Adolesc Psychiatry 26: 207-‐213.
34. Bloss CS, Courchesne E. MRI neuroanatomy in young girls with autism: a preliminary
study. J Am Acad Child Adolesc Psychiatry. 2007;46(4):515-‐523.
35. Boddaert N, Chabane N, Gervais H, Good CD, Bourgeois M, Plumet MH, Barthélémy C,
Mouren MC, Artiges E, Samson Y, Brunelle F, Frackowiak RS, Zilbovicius M. Superior
temporal sulcus anatomical abnormalities in childhood autism: a voxel-‐based
morphometry MRI study. Neuroimage. 2004;23(1):364-‐369.
36. Bölte S., Dickhut H., Poustka F. (1999). Patterns of parent-‐reported problems
indicative in autism. Psychopathology, 32: 93-‐97.
37. Bonilha L, Cendes F, Rorden C, Eckert M, Dalgalarrondo P, Li LM, Steiner CE. Gray and
white matter imbalance-‐typical structural abnormality underlying classic autism?
Brain Dev. 2008;30(6)396-‐401.
38. Brereton AV., Tonge BJ., Einfeld SL. (2006). Psychopathology in children and
adolescents with autism compared to young people with intellectual disability. J
Autism Dev Disord, 36: 863–870.
39. Briggs-‐Gowan MJ., Carter AS. (2006). BITSEA Brief Infant-‐Toddler Social and Emotional
Assessment Examiner's Manual. San Antonio, TX: Harcourt Assessment.

83
40. Bristol MM., Cohen DJ., Costello EJ., Denckla M., Eckberg TJ., Kallen R., Kraemer HC.,
Lord C., Maurer R., McIlvane WJ., Minshew N., Sigman M., Spence MA. (1996). State of
the science in autism: report to the National Institutes Health. J Autism Dev Disord, 26:
121-‐154.
41. Bryson SE, Zwaigenbaum L, Brian J, Roberts W, Szatmari P, Rombough V et al. A
prospective case series of high-‐risk infants who developed autism. J Autism Dev
Disord 2007;37:12–24.
42. Buxhoeveden DP, Semendeferi K, Buckwalter J, Schenker N, Switzer R, Courchesne E.
Reduced minicolumns in the frontal cortex of patients with autism. Neuropathol Appl
Neurobiol. 2006;32(5):483-‐491.
43. Canu, E., McLaren, D.G., Fitzgerald, M.E., Bendlin, B.B., Zoccatelli, G., Alessandrini, F.,
Pizzini, F.B., Ricciardi, G.K., Beltramello, A., Johnson, S.C., Frisoni, G.B., 2010.
Microstructural diffusion changes are independent of macrostructural volume loss in
moderate to severe Alzheimer’s disease. J Alzheimers Dis. 19(3), 963–76.
44. Carmichael CM, McGue M. A cross-‐sectional examination of height, weight, and body
mass index in adult twins. J Gerontol A Biol Sci Med Sci 1995;50(4):B237-‐44.
45. Carper RA, Moses P, Tigue ZD, Courchesne E. Cerebral lobes in autism: early
hyperplasia and abnormal age effects. Neuroimage. 2002;16(4):1038-‐51.
46. Carper RA, Courchesne E. Localized enlargement of the frontal cortex in early autism.
Biol Psychiatry. 2005;57(2):126-‐33.
47. Carter AS., Briggs-‐Gowan M. (1999). Infant-‐Toddler Social and Emotional Assessment
(ITSEA) Manual. New Haven, CT: Yale University.
48. Casanova MF, Buxhoeveden DP, Switala AE, Roy E. Minicolumnar pathology in autism.
Neurology 2002;58(3):428-‐32.
49. Castelli, F, Frith C, Happé F, Frith U. Autism, asperger syndrome and brain mechanisms
for the attribution of mental states to animated shapes. Brain. 2002;125(Pt 8):1839-‐
1849.
50. Catani, M., Jones, D.K., Daly, E., Embiricos, N., Deeley, Q., Pugliese, L., et al. Altered
cerebellar feedback projections in Asperger syndrome. Neuroimage, 2008;41, 1184–
1191.
51. Catani M, Thiebaut de Schotten M. A diffusion tensor imaging tractography atlas for
virtual in vivo dissections. Cortex. 2008;44(8):1105-‐32.

84
52. Caviness VS Jr, Kennedy DN, Richelme C, Rademacher J, Filipek PA. The human brain
age 7–11 years: a volumetric analysis based on magnetic resonance images. Cereb
Cortex 1996;6:726–736.
53. Centers for Disease Control and Prevention (CDC). Autism and Developmental
Disabilities Monitoring Network Surveillance Year 2006 Principal Investigators;
Prevalence of autism spectrum disorders -‐ Autism and Developmental Disabilities
Monitoring Network, United States, 2006. MMWR Surveill Summ. 2009;58(10):1-‐20.
54. Chawarska K., Paul R., Klin A., Hannigen S., Dichtel LE., Volkmar F. (2007). Parental
recognition of developmental problems in toddlers with autism spectrum disorders. J
Autism Dev Disord 37: 62-‐72.
55. Conturo, T. E., Williams, D. L., Smith, C. D., Gultepe, E., Akbudak, E., & Minshew, N. J.
(2008). Neuronal fiber pathway abnormalities in autism: An initial MRI diffusion
tensor tracking study of hippocampo-‐fusiform and amygdalofusiform pathways.
Journal of the International Neuropsychological Society, 14(6), 933–946.
56. Coonrod E., Stone WL. (2004). Early concerns of parents of children with autistic and
non autistic disorder. Infants Young Child, 17: 258 –268.
57. Courchesne E, Karns C, Davis HR, Ziccardi R, Carper R, Tigue Z et al. Unusual brain
growth patterns in early life in patients with autistic disorder: an MRI study.
Neurology 2001;57(2):245-‐54.
58. Courchesne E, Carper R, Akshoomoff N. Evidence of brain overgrowth in the first year
of life in autism. JAMA 2003;290(3):337-‐44.
59. Courchesne E. Brain development in autism: early overgrowth followed by premature
arrest of growth. Ment Retard Dev Disabil Res Rev 2004;10(2):106-‐11.
60. Courchesne E, Pierce K, Schumann CM, Redcay E, Buckwalter JA, Kennedy DP et al.
Mapping early brain development in autism. Neuron 2007;56(2):399-‐413.
61. Cox A., Klein K., Charman T., Baird G., Baron-‐Cohen S., Swettenham J., Drew A.,
Wheelwright S. (1999). Autism spectrum disorders at 20 and 42 months of age:
stability of clinical and ADI-‐R Diagnosis. J Child Psychol Psychiatry 40: 719-‐732.
62. Craig MC, Zaman SH, Daly EM, Cutter WJ, Robertson DM, Hallahan B, Toal F, Reed S,
Ambikapathy A, Brammer M, Murphy CM, Murphy DG. Women with autistic-‐spectrum
disorder: magnetic resonance imaging study of brain anatomy. Br J Psychiatry.
2007;191:224-‐228.

85
63. Crijen A., Achenbach TM., Verhulst F. (1999). Problems reported by parents of
children in multiple cultures: the child behavior checklist syndrome constructs.
American Journal of Psychiatry, 156: 569-‐57.
64. Davidovitch M, Patterson B, Gartside P. Head circumference measurements in children
with autism. J Child Neurol 1996;11(5):389-‐93.
65. Davatzikos C. Why voxel-‐based morphometric analysis should be used with great
caution when characterizing group differences, NeuroImage. 2004;23(1):17-‐20.
66. Dawson G, Munson J, Webb SJ, Nalty T, Abbott R, Toth K. Rate of head growth
decelerates and symptoms worsen in the second year of life in autism. Biol Psychiatry
2007;61(4):458-‐64.
67. Dawson G., Rogers S., Munson J., Smith M., Winter J., Greenson J., Donaldson A., Varley
J. (2010). Randomized, controlled trial of an intervention for toddlers with autism: the
Early Start Denver Model. Pediatrics, 125: 17-‐23.
68. DeGangi GA., Poisson S., Sickel RZ., Wiener AS. (1995). The Infant–Toddler Symptom
Checklist. Tucson, AZ: Therapy Skill Builders.
69. De Giacomo A., Fombonne E. (1998). Parental recognition of developmental
abnormalities in autism. Eur Child Adolesc Psychiatry, 7: 131-‐136.
70. De Martino F, Valente G, Staeren N, Ashburner J, Goebel R, Formisano E. Combining
multivariate voxel selection and support vector machines for mapping and
classification of fMRI spatial patterns. NeuroImage. 2008;43(1):44-‐58.
71. Dementieva YA, Vance DD, Donnelly SL, Elston LA, Wolpert CM, Ravan SA, DeLong GR,
Abramson RK, Wright HH, Cuccaro ML. Accelerated head growth in early development
of individuals with autism. Pediatr Neurol 2005;32(2):102-‐8.
72. Deutsch CK, Joseph RM. Brief report: cognitive correlate of enlarged head
circumference in children with autism. J Autism Dev Disord 2003;33(2):209-‐15.
73. Dietz C., Swinkels S., van Daalen E., van Engeland H., Buitelaar JK. (2006). Screening for
autistic spectrum disorder in children aged 14-‐15 months. II: population screening
with the Early Screening of Autistic Traits Questionnaire (ESAT). Design and general
findings. J Autism Dev Disord, 36: 713-‐722.
74. Dissanayake C, Bui QM, Huggins R, Loesch DZ. Growth in stature and head
circumference in high-‐functioning autism and Asperger disorder during the first 3
years of life. Dev Psychopathol 2006;18(2):381-‐93.

86
75. Doig KB., Macias MM., Saylor CF., Craver JR., Ingram PE. (1999). The Child
Development Inventory: A developmental outcome measure for follow-‐up of the high-‐
risk infant. J. Pediatr, 135: 358–362.
76. Doussard-‐Roosvelt JA., Joe CM., Bazhenova OV. (2003). Mother child interaction in
autistic and non autistic children: characteristics of maternal approach behaviors and
child social responses. Development and Psychopathology, 15: 277-‐295.
77. Duarte CS., Bordin IAS., De Oliveira A., Bird H. (2003). The CBCL and the identification
of children with autism and related conditions in Brazil: pilot findings. J Autism Dev
Disord 33: 703-‐707.
78. Duncan J, Owen AM. Common regions of the human frontal lobe recruited by diverse
cognitive demands. Trends Neurosci. 2000;23(10):475-‐483.
79. Durston S, Hulshoff Pol HE, Casey BJ, Giedd JN, Buitelaar JK, van Engeland H.
Anatomical MRI of the developing human brain: what have we learned? J Am Acad
Child Adolesc Psychiatry. 2001 Sep;40(9):1012-‐20.
80. Ecker, C., Rocha-‐Rego, V., Johnston, P., Mourao-‐Miranda, J., Marquand, A., Daly, E.M.,
Brammer, M.J., Murphy, C., Murphy, D.G.; MRC AIMS Consortium (2010a).
Investigating the predictive value of whole-‐brain structural MR scans in autism: a
pattern classification approach. Neuroimage 49(1), 44–56.
81. Ecker C, Marquand A, Mourão-‐Miranda J, Johnston P, Daly EM, Brammer MJ, Maltezos
S, Murphy CM, Robertson D, Williams SC, Murphy DG. (2010b), Describing the brain in
autism in five dimensions-‐-‐magnetic resonance imaging-‐assisted diagnosis of autism
spectrum disorder using a multiparameter classification approach. J Neurosci.
30(32):10612-‐23.
82. Eisenhower AS., Baker BL., Blacher J. (2005). Preschool children with intellectual
disability; syndrome specificity, behaviour problems, and maternal wellbeing. Journal
of Intellectual Disability Research, 49: 657–671.
83. Elder LM, Dawson G, Toth K, Fein D, Munson J. Head circumference as an early
predictor of autism symptoms in younger siblings of children with autism spectrum
disorder. J Autism Dev Disord 2008;38(6):1104-‐11.
84. Faherty, C. (2006). Asperger’s syndrome in women: A different set of challenges? In
Asperger’s and girls. Arlington, TX: Future Horizons.
85. Fan Y, Shen D, Davatzikos C. Classification of structural images via high-‐dimensional
image warping, robust feature extraction, and SVM. Med Image Comput Comput Assist
Interv. 2005;8(Pt 1):1-‐8.

87
86. Fatemi SH, Earle J, Kanodia R, Kist D, Emamian ES, Patterson PH, Shi L, Sidwell R.
Prenatal viral infection leads to pyramidal cell atrophy and macrocephaly in
adulthood: implications for genesis of autism and schizophrenia. Cell Mol
Neurobiol. 2002;22(1):25-‐33.
87. Filipek PA., Accardo PJ., Baranek GT., Cook EH Jr., Dawson G., Gordon B., Gravel JS.,
Johnson CP., Kallen RJ., Levy SE., Minshew NJ., Ozonoff S., Prizant BM., Rapin I., Rogers
SJ., Stone WL., Teplin S., Tuchman RF., Volkmar FR. (1999). The screening and
diagnosis of autistic spectrum disorders. J Autism Dev Disord 29: 439-‐484.
88. Filipek PA., Accardo PJ., Ashwal S., Baranek GT., Cook EH Jr., Dawson G., Gordon B.,
Gravel JS., Johnson CP., Kallen RJ., Levy SE., Minshew NJ., Ozonoff S., Prizant BM., Rapin
I., Rogers SJ., Stone WL., Teplin SW., Tuchman RF., Volkmar FR. (2000). Practice
parameter: Screening and diagnosis of autism: report of the Quality Standards
Subcommittee of the American Academy of Neurology and the Child Neurology
Society. Neurology, 55: 468-‐479.
89. Fletcher RH., Fletcher SW., Wagner EH. (1996). Clinical Epidemiology. The Essentials,
3rd Edition, Baltimore, MD, William & Wilkins.
90. Fombonne E. Epidemiological surveys of autism and other pervasive developmental
disorders: an update. J. Autism Dev. Disord. 200333, 365-‐382.
91. Frazier JA, Biederman J, Bellorde CA, Garfield SB, Geller DA, Coffey BJ, Faraone SV.
Should the diagnosis of attention-‐deficit/hyperactivity disorder be considered in
children with pervasive developmental disorder? J Atten Disord, 2001; 4: 203–211.
92. Frigerio A, Cozzi P, Pastore V, Molteni M, Borgatti R, Montirosso R. (2006). La
valutazione dei problemi emotivo comportamentali in un campione italiano di
bambini in età prescolare attraverso la CBCL. Infanzia e Adolescenza, 12: 26-‐33.
93. Frith U. Autism: explaining the enigma. Oxford, England: Blackwell; 1989.
94. Frith U, Morton J, Leslie A. The cognitive basis of a biological disorder: autism. Trends
Neurosci. 1991;14(10):433-‐438.
95. Frith U, Soares I. (1993). Research into earliest detectable signs of autism: what
parents say. Communication, 27: 17-‐18.
96. Frith U. Mind blindness and the brain in autism. Neuron. 2001;32(6):969-‐979.
97. Fukumoto A, Hashimoto T, Ito H, Nishimura M, Tsuda Y, Miyazaki M, Mori K, Arisawa
K, Kagami S. Growth of head circumference in autistic infants during the first year of
life. J Autism Dev Disord 2008;38(3):411-‐8.

88
98. Fukumoto A, Hashimoto T, Mori K, Tsuda Y, Arisawa K, Kagami S. Head circumference
and body growth in autism spectrum disorders. Brain Dev 2010 Oct 8.
99. Gadow KD, Sprafkin J. (1997). Early Childhood Symptom Inventory – 4 Norms Manual.
Checkmate Plus, Stoney Brook, NY.
100. Gadow KD, Sprafkin J. (2000). Early Childhood Symptom Inventory – 4 Screening
Manual. Checkmate Plus, Stony Brook, NY.
101. Gadow KD, Devincent CJ, Pomeroy J, Azizian A. Comparison of DSM-‐IV
symptoms in elementary school-‐age children with PDD versus clinic and community
samples. Autism, 2005; 9:392-‐415.
102. Geary DC. (1998) Chapter 8: Sex differences in brain and cognition. In "Male,
Female: the Evolution of Human Sex Differences". American Psychological Association
Books.
103. Giedd JN, Lalonde FM, Celano MJ, White SL, Wallace GL, Lee NR, Lenroot RK.
Anatomical brain magnetic resonance imaging of typically developing children and
adolescents. J Am Acad Child Adolesc Psychiatry. 2009 May;48(5):465-‐470.
104. Gillberg C, de Souza L. Head circumference in autism, Asperger’s syndrome and
ADHD: a comparative study. Dev Med Child Neurol 2002;44(5):296-‐300.
105. Gillberg C, Cederlund M, Lamberg K, Zeijlon L: Brief report: "the autism epidemic".
The registered prevalence of autism in a Swedish urban area. J Autism Dev Disord
2006, 36:429-‐435.
106. Gilmore JH, Lin W, Prastawa MW, et al. Regional gray matter growth, sexual
dimorphism, and cerebral asymmetry in the neonatal brain. J Neurosci. 2007;27:255–
1260.
107. Glascoe FP. (1997). Parents' Evaluations of Developmental Status: A Method for
Detecting and Addressing Developmental and Behavioral Problems in Children.
Nashville, TN: Ellsworth & Vandermeer Press.
108. Gomot M, Giard MH, Adrien JL, Barthelemy C, Bruneau N. Hypersensitivity to
acoustic change in children with autism: electrophysiological evidence of left frontal
cortex dysfunctioning. Psychophysiology. 2002;39(5):577-‐584.
109. Gray KM, Tonge BJ, Sweeney DJ, Einfeld SL. Screening for autism in young
children with developmental delay: an evaluation of the developmental behaviour
checklist: early screen. J Autism Dev Disord 2008; 38: 1003-‐1010.
89
110. Green DM. Swets JA. Signal Detection Theory and Psychophysics. Wiley,
NewYork;1966.
111. Griffiths R. The abilities of young children. High Wycombe (UK): The Test Agency;
1996.
112. Guyon I, Weston J, Barnhill S, Vapnik V. Gene selection for cancer classification
using support vector machines. Mach. Learn. 2002;46(1-‐3): 389-‐422.
113. Hadjikhani N. Serotonin, pregnancy and increased autism prevalence: is there a
link? Med Hypotheses. 2010;74(5):880-‐3.
114. Happé F, Ehlers S, Fletcher P, Frith U, Johansson M, Gillberg C, Dolan R, Frackowiak
R, Frith C. Theory of mind' in the brain. Evidence from a PET scan study of asperger
syndrome. Neuroreport. 1996;8(1):197-‐201.
115. Happé F, Frith U. The weak coherence account: detail-‐focused cognitive style in
autism spectrum disorders. J Autism Dev Disord. 2006;36(1):5-‐25.
116. Hardan AY, Jou RJ, Keshavan MS, Varma R, Minshew NJ. Increased frontal cortical
folding in autism: a preliminary MRI study. Psychiatry Res. 2004;131(3):263-‐268.
117. Hardan AY, Libove RA, Keshavan MS, Melhem NM, Minshew NJ. A preliminary
longitudinal magnetic resonance imaging study of brain volume and cortical thickness
in autism. Biol Psychiatry. 2009 Aug 15;66(4):320-‐6
118. Harris S, Handleman J. Age and IQ at intake as predictors of placement for young
children with autism: A four-‐to-‐six year follow-‐up. J Autism Dev Disord, 2000; 30: 137-‐
142.
119. Hartley SL, Sikora DM, McCoy R. Prevalence and risk factors of maladaptive
behaviour in young children with Autistic Disorder. J Intellect Disabil Res 2008, 52:
819-‐829.
120. Hartley SL, Sikora DM. Sex Differences in Autism Spectrum Disorder: An
Examination of Developmental Functioning, Autistic Symptoms, and Coexisting
Behavior Problems in Toddlers. J Autism Dev Disord 2009; 39: 1715-‐1722.
121. Hazlett HC, Poe M, Gerig G, Smith RG, Provenzale J, Ross A, et al. Magnetic
resonance imaging and head circumference study of brain size in autism: Birth
through age 2 years. Arch Gen Psychiatry 2005;62(12):1366-‐76.
122. Hobbs K, Kennedy A, Dubray M, Bigler ED, Petersen PB, McMahon W, Lainhart
JE. A retrospective fetal ultrasound study of brain size in autism. Biol Psychiatry
2007;62(9):1048-‐55.

90
123. Hollingshead AB, Redlich FC. (1958). Social class and mental illness. Wiley, New
York.
124. Holtmann M, Bolte S, Poustka F. (2007). Attention deficit hyperactivity disorder
symptoms in pervasive developmental disorders: association with autistic behavior
domains and coexisting psychopathology. Psychopathology, 40: 172-‐177.
125. Horner RH, Diemer SM, Brazeau KC. (1992). Educational support for students
with severe problem behaviors in Oregon: a descriptive analysis from the 1987–88
school year. Journal of the Association for Persons with Severe Handicaps, 17: 154–
169.
126. Howlin P, Moorf A. (1997). Diagnosis in autism: a survey of over 1200 patients
in the UK. Autism, 1: 135-‐162.
127. Howlin P, Asgharian A. (1999). The diagnosis of autism and Asperger syndrome:
findings from a survey of 770 families. Developmental Medicine and Child Neurology,
41: 834-‐839.
128. Hultman CM, Sparen P, Cnattingius S. Perinatal risk factors for infantile autism.
Epidemiology 2002;13(4):417–23.
129. Humphreys K, Hasson U, Avidan G, Minshew N, Behrmann M Cortical patterns of
category-‐selective activation for faces, places and objects in adults with autism.
Autism Res. 2008;1(1):52-‐63.
130. Järbrink K, Knapp M. The economic impact of autism in Britain. Autism. 2001
Mar;5(1):7-‐22.
131. Joachims T. Making large-‐Scale SVM Learning Practical. In: Advances in Kernel
Methods -‐ MIT-‐Press;1999.
132. Johnson CP, Myers SM. (2007). American Academy of Pediatrics Council on
Children With Disabilities. Identification and evaluation of children with autism
spectrum disorders. Pediatrics, 120: 1183-‐1215.
133. Jou RJ, Minshew NJ, Keshavan MS, Hardan AY. Cortical gyrification in autistic and
asperger disorders: a preliminary magnetic resonance imaging study. J Child Neurol.
2010;25(12):1462-‐1467.
134. Kana RK, Keller TA, Cherkassky VL, Minshew NJ, Just MA. Atypical frontal-‐posterior
synchronization of theory of mind regions in autism during mental state attribution.
Soc Neurosci. 2009;4(2):135-‐152.

91
135. Kates WR, Burnette CP, Eliez S, Strunge LA, Kaplan D, Landa R, Reiss AL, Pearlson
GD. Neuroanatomic variation in monozygotic twin pairs discordant for the narrow
phenotype for autism. Am J Psychiatry. 2004;161(3):539-‐546.
136. Ke X, Tang T, Hong S, Hang Y, Zou B, Li H, et al. (2009). White matter
impairments in autism, evidence from voxel-‐based morphometry and diffusion tensor
imaging. Brain Research, 1265(C), 171–177.
137. Keller, T.A., Kana, R.K., & Just, M.A. A developmental study of the structural
integrity of white matter in autism. Neuroreport, 2007;18, 23–27.
138. Klöppel S, Stonnington CM, Chu C, Draganski B, Scahill RI, Rohrer JD, Fox NC, Jack Jr
CR, Ashburner J, Frackowiak RS. Automatic classification of MR scans in Alzheimer's
disease. Brain. 2008;131(Pt 3): 681-‐689.
139. Knickmeyer R, Baron-‐Cohen S, Raggatt P, Taylor K, 2005. Foetal testosterone, social
relationships, and restricted interests in children. J. Child Psychol. Psych. 46, 198—
210.
140. Knickmeyer RC, Baron-‐Cohen S, 2006. Fetal testosterone and sex differences in
typical social development and in autism. J. Child Neurol. 21, 825—845.
141. Krol NP, De Bruyn EF, Coolen JC, van Aarle EJ. (2006). From CBCL to DSM: a
comparison of two methods to screen for DSM-‐IV diagnoses using CBCL data. Journal
of Clinical Child & Adolescent Psychology, 35: 127-‐135.
142. Lainhart JE, Piven J, Wzorek M, Landa R, Santangelo SL, Coon H, Folstein SE.
Macrocephaly in children and adults with autism. J Am Acad Child Adolesc Psychiatry
1997;36(2):282-‐9.
143. Lainhart E. Advances in autism neuroimaging research for the clinician and
geneticist. Am J Med Genet C Semin Med Genet 2006;142C(1):33-‐9.
144. Lainhart JE, Bigler ED, Bocian M, Coon H, Dinh E, Dawson G, et al. Head
circumference and height in autism: A study by the collaborative program of
excellence in autism. Am J Med Genet 2006;140(21):2257-‐74.
145. Landa R, Garrett-‐Mayer E. Development in infants with autism spectrum
disorders: a prospective study. J Child Psychol Psychiatry 2006;47:629–638.
146. Landa RJ. (2008). Diagnosis of autism spectrum disorders in the first 3 years of
life. Nat Clin Pract Neurol, 4: 138-‐147.
147. Lao Z, Shen D, Xue Z, Karacali B, Resnick SM, Davatzikos C. Morphological
classification of brains via high-‐dimensional shape transformations and machine
learning methods. Neuroimage. 2004;21(1):46-‐57.

92
148. Le Bihan D, Mangin JF, Poupon C, Clark CA, Pappata S, Molko N, Chabriat H.
Diffusion tensor imaging: concepts and applications. J Magn Reson Imaging.
2001;13(4):534-‐546.
149. Lecavalier L, Leone S, Wiltz J. (2006). The impact of behaviour problems on
caregiver stress in young people with autism spectrum disorders. Intellect Disabil
Res., 50:172-‐183.
150. Lee JE, Bigler ED, Alexander AL, Lazar M, DuBray MB, Chung MK, et al. Diffusion
tensor imaging of white matter in the superior temporal gyrus and temporal stem in
autism. Neuroscience Letters 2007;424(2):127-‐32.
151. Lee PS, Foss-‐Feig J, Henderson JG, Kenworthy LE, Gilotty L, Gaillard WD, Vaidya
CJ. Atypical neural substrates of Embedded Figures Task performance in children with
Autism Spectrum Disorder. Neuroimage. 2007 Oct 15;38(1):184-‐93.
152. Lenroot RK, Gogtay N, Greenstein DK, Wells EM, Wallace GL, Clasen LS, Blumenthal
JD, Lerch J, Zijdenbos AP, Evans AC, Thompson PM, Giedd JN. Sexual dimorphism of
brain developmental trajectories during childhood and adolescence. Neuroimage
2007 15;36(4):1065-‐1073.
153. Levitt JG, Blanton RE, Smalley S, Thompson PM, Guthrie D, McCracken JT, Sadoun T,
Heinichen L, Toga AW. Cortical sulcal maps in autism. Cereb Cortex. 2003;13(7):728-‐
735.
154. Lombardo MV, Chakrabarti B, Bullmore ET, Sadek SA, Pasco G, Wheelwright SJ,
Suckling J; MRC AIMS Consortium, Baron-‐Cohen S. Atypical neural self-‐representation
in autism. Brain. 2010;133(Pt 2):611-‐624.
155. Lord C. (1995). Follow-‐up of two years old referred for possible autism. Journal
of Child Psychology and Psychiatry, 36: 1365-‐1382.
156. Lord C, Risi S, Lambrecht L, Cook E, Leventhal BL, DiLavore PC, Pickles A, Rutter
M. (2000). The autism diagnostic observation schedule-‐generic: A standard measure
of social and communication deficits associated with the spectrum of autism. J Autism
Dev Disord, 30: 205-‐223.
157. Lord C, Rutter M, Dilavore PC, Risi S. ADOS, Autism Diagnostic Observation
Schedule. Los Angeles: Western Psychological Services; 2002 (Italian version, 2005;
Florence:OS).
158. Losh M, Sullivan PF, Trembath D, Piven J. Current developments in the genetics
of autism: From phenome to genome. J Neuropathol Exp Neurol 2008;67(9):829-‐37.
93
159. Lotspeich LJ, Kwon H, Schumann CM, Fryer SL, Goodlin-‐Jones BL, Buonocore MH,
Lammers CR, Amaral DG, Reiss AL. Investigation of neuroanatomical differences
between autism and Asperger syndrome. Arch Gen Psychiatry. 2004;61(3):291-‐298.
160. Maes HHM, Neale MC, Eaves LJ. Genetic and environmental factors in relative
body weight and human adiposity. Behav Genet 1997;27(4):325-‐51.
161. Maestro S, Casella C, Milone A, Muratori F, Palacio-‐Espasa F. (1999). Study of the
onset of autism through home-‐movies. Psychopatology, 32: 292-‐300.
162. Maestro S, Muratori F, Barbieri F, Casella C, Cattaneo V, Cavallaro MC et al. Early
behavioral development in autistic children: the first 2 years of life through home
movies. Psychopathology 2001;34(3):147-‐52.
163. Magyar CI, Pandolfi V. Factor structure evaluation of the childhood autism rating
scale. J Autism Dev Disord. 2007;37(9):1787-‐94.
164. Mandell DS, Listerud J, Levy SE, Pinto-‐Martin JA. (2002). Race differences in the
age at diagnosis among medicaid-‐eligible children with autism. Journal of the
American Academy of Child and Adolescent Psychiatry,41: 1447 –1453.
165. Mandell DS., Walrath CM., Manteuffel B., Sgro G., Pinto-‐Martin J. (2005).
Characteristics of children with autistic spectrum disorders served in comprehensive
community based mental health settings. J Autism Dev Disord 35: 313-‐321.
166. Mason RA, Williams DL, Kana RK, Minshew N, Just MA. Theory of mind disruption
and recruitment of the right hemisphere during narrative comprehension in autism.
Neuropsychologia. 2008;46(1):269-‐280.
167. Matson JL. (2007). Determining treatment outcome in early intervention
programs for autism spectrum disorders: A critical analysis of measurement issues in
learning based interventions. Research in Developmental Disabilities, 28: 207-‐218.
168. Matson JL, Fodstad JC, Mahan S, Rojahn J. (2010), Cut-‐offs, norms and patterns
of problem behaviours in children with developmental disabilities on the Baby and
Infant Screen for Children with aUtIsm Traits (BISCUIT-‐Part 3). Dev Neurorehabil, 13:
3-‐9.
169. McAlonan GM, Cheung V, Cheung C, Suckling J, Lam GY, Tai KS, Yip L, Murphy DG,
Chua SE. Mapping the brain in autism. A voxel-‐based MRI study of volumetric
differences and intercorrelations in autism. Brain. 2005;128(Pt 2):268-‐276.
170. McAlonan GM, Daly E, Kumari V, Critchley HD, van Amelsvoort T, Suckling J,
Simmons A, Sigmundsson T, Greenwood K, Russell A, Schmitz N, Happe F, Howlin P,
94
Murphy DG. Brain anatomy and sensorimotor gating in Asperger's syndrome. Brain.
2002 Jul;125(Pt 7):1594-‐606.
171. McLaren DG, Kosmatka KJ, Kastman EK, Bendlin BB, Johnson SC. Rhesus Macaque
Brain Morphometry: A Methodological Comparison of Voxel-‐Wise Approaches.
Methods. 2010;50(3):157-‐165.
172. Meisels SJ. (1989). Can developmental screening tests identify children who are
developmentally at risk? Pediatrics, 83: 578-‐585.
173. Mengotti P, D'Agostini S, Terlevic R, De Colle C, Biasizzo E, Londero D, Ferro A,
Rambaldelli G, Balestrieri M, Zanini S, Fabbro F, Molteni M, Brambilla P. Altered white
matter integrity and development in children with autism: A combined voxel-‐based
morphometry and diffusion imaging study. Brain Res Bull. 2010 Dec 10.
174. Metz CE. ROC methodology in radiologic imaging. Invest Radiol. 1986;21(9):720–
733.
175. Mills JL, Hediger ML, Molloy CA, Chrousos GP, Manning-‐Courtney P, Yu KF et al.
Elevated levels of growth related hormones in autism and autism spectrum disorder.
Clin Endocrinol (Oxf) 2007;67(2):230–7.
176. Minshew N, Luna B, Sweeney J. Oculomotor evidence for neocortical systems but
not cerebellar dysfunction in autism. Neurology. 1999;52(5):917-‐922.
177. Mosconi MW, Cody-‐Hazlett H, Poe MD, Gerig G, Gimpel-‐Smith R, Piven J.
Longitudinal study of amygdala volume and joint attention in 2-‐ to 4-‐year-‐old children
with autism. Arch Gen Psychiatry. 2009;66(5):509-‐16.
178. Mourão-‐Miranda J, Bokde AL, Born C, Hampel H, Stetter M. Classifying brain states
and determining the discriminating activation patterns: support vector machine on
functional MRI data. Neuroimage. 2005;28(4):980-‐995.
179. Mraz KD, Green J, Dumont-‐Mathieu T, Makin S, Fein D. Correlates of head
circumference growth in infants later diagnosed with autism spectrum disorders. J
Child Neurol. 2007;22(6):700–13.
180. Nadig A, Ozonoff S, Young GS, Rozga A, Sigman M, Rogers SJ. A prospective study
of response-‐to-‐name in infants at risk for autism. Arch Pediatr Adolesc Med
2007;161:378–383.
181. National Center for Health Statistics. 2000 CDC growth charts: United States.
Available from: http://www.cdc.gov/growthcharts/

95
182. National Research Council, Committee on Interventions for Children With
Autism. Educating Children With Autism. Washington, DC: National Academies Press;
2001.
183. Nichols TE, Holmes AP. Nonparametric permutation tests for functional
neuroimaging: a primer with examples. Hum Brain Mapp. 2002;15(1):1-‐25.
184. Nydén A, Hjelmquist E, Gillberg C. Autism spectrum and attention-‐deficit disorders
in girls. Some neuropsychological aspects. Eur Child Adolesc Psychiatry. 2000;9:180-‐5.
185. Oberman LM, Pascual-‐Leone. Cortical plasticity: A proposed mechanism by
which genomic factors lead to the behavioral and neurological phenotype of autism
spectrum and psychotic-‐spectrum disorders. Behavioral Brain Sciences, 2008; 31:
276-‐277.
186. Oosterling IJ, Wensing M, Swinkels SH, van der Gaag RJ, Visser JC, Woudenberg
T, Minderaa R, Steenhuis MP, Buitelaar JK. (2009). Advancing early detection of autism
spectrum disorder by applying an integrated two-‐stage screening approach. J Child
Psychol Psychiatry, 51: 250-‐258.
187. Oslejsková H, Kontrová I, Foralová R, Dusek L, Némethová D. (2007). The course
of diagnosis in autistic patients: the delay between recognition of the first symptoms
by parents and correct diagnosis. Neuro Endocrinol Lett, 28: 895-‐900.
188. Ozonoff S, Williams BJ, Landa R. Parental report of the early development of
children with regressive autism: the delays-‐plus-‐regression phenotype. Autism
2005;9(5):461-‐86.
189. Ozonoff S, Heung K, Byrd R, Hansen R, Hertz-‐Picciotto I. The onset of autism:
patterns of symptom emergence in the first years of life. Autism Res 2008;1:320–328.
190. Ozonoff S., Young GS., Steinfeld MB., Hill MM., Cook I., Hutman T., Macari S.,
Rogers SJ., Sigman M. (2009). How early do parent concerns predict later autism
diagnosis? J Dev Behav Pediatr, 30: 367-‐375.
191. Palmen SJ, Hulshoff Pol HE, Kemner C, Schnack HG, Durston S, Lahuis BE, Kahn RS,
Van Engeland H. Increased gray-‐matter volume in medication naive high-‐functioning
children with autism spectrum disorder. Psychol Med. 2005;35(4):561-‐570.
192. Palomo R, Belinchon M, Ozonoff S. Autism and family home movies: a
comprehensive review. J Dev Behav Pediatr 2006;27:S59–S68.
193. Petrides M, Pandya DN. Efferent association pathways from the rostral prefrontal
cortex in the macaque monkey. J Neurosci. 2007;27(43):11573-‐11586.
96
194. Pierce K, Glatt SJ, Liptak GS, McIntyre LL. The power and promise of identifying
autism early: insights from the search for clinical and biological markers. Ann Clin
Psychiatry, 2009; 21: 132-‐147.
195. Pierpaoli C, Jezzard P, Basser PJ, Barnett A, Di Chiro G. Diffusion tensor MR
imaging of the human brain. Radiology. 1996 Dec;201(3):637-‐48.
196. Pinto-‐Martin JA., Young LM., Mandell DS., Poghosyan L., Giarelli E., Levy SE.
Screening strategies for autism spectrum disorders in pediatric primary care. J Dev
Behav Pediatr, 2008; 29: 345-‐350.
197. Piven J, Nehme E, Simon J, Barta P, Pearlson G, Folstein SE. Magnetic resonance
imaging in autism: measurement of the cerebellum, pons, and fourth ventricle. Biol
Psychiatry 1992;31(5):491–504.
198. Piven J, Arndt S, Bailey J, Havercamp S, Andreasen NC, Palmer P. An MRI study of
brain size in autism. Am J Psychiatry 1995;152(8):1145–9.
199. Piven J, Arndt S, Bailey J, Andreasen N. Regional brain enlargement in autism: a
magnetic resonance imaging study. J Am Acad Child Adolesc Psychiatry 1996;35:530–
536.
200. Premack D, Woodruff G. Does the chimpanzee have a theory of mind? Behav Brain
Sci. 1978;1(4):515-‐526.
201. Pugliese L, Catani M, Ameis S, Dell’Acqua F, Thiebaut de Schotten M, Murphy C,
et al. The anatomy of extended limbic pathways in Asperger syndrome: A preliminary
diffusion tensor imaging tractography study. Neuroimage, 2009;47, 427–434.
202. Ramnani N, Owen AM. Anterior prefrontal cortex: insights into function from
anatomy and neuroimaging. Nat Rev Neurosci. 2004;5(3):184-‐194.
203. Reichow B, Wolery M. Comprehensive synthesis of early intensive behavioral
interventions for young children with autism based on the UCLA young autism project
model. J Autism Dev Disord 2009; 39: 23-‐41.
204. Reiss AL, Abrams MT, Singer HS, Ross JL, Denckla MB. (1996). Brain development,
gender, and IQ in children. Brain, 119, 1763-‐1774.
205. Rescorla LA. (1988). Cluster Analytic Identification of Autistic Preschoolers. J
Autism Dev Disord, 18: 475-‐492.
206. Ringo JL. Neuronal interconnection as a function of brain size. Brain Behav Evol.
1991;38(1):1-‐6.

97
207. Rescorla LA. (2005). Assessment of young children using the Achenbach System
of Empirically Based Assessment (ASEBA). Mental Retardation and Developmental
Disabilities Research Review, 11: 226-‐237.
208. Reznick JS, Baranek GT, Reavis S, Watson LR, Crais ER. A parent-‐report
instrument for identifying one-‐year-‐olds at risk for an eventual diagnosis of autism:
the first year inventory. J Autism Dev Disord 2006; 37: 1691-‐1710.
209. Ringo JL. Neuronal interconnection as a function of brain size. Brain Behav Evol
1991;38(1):1-‐6.
210. Robins DL. The Modified Checklist for Autism in Toddlers: an initial study
investigative the early detection of autism and pervasive developmental disorders. J
Autism Dev Disord, 2001; 31: 131-‐144.
211. Robins DL, Dumont-‐Mathieu TM. Early screening for autism spectrum disorders:
update on the modified checklist for autism in toddlers and other measures. Dev
Behav Pediatr. 2006; Suppl 2, vol. 27: S111-‐9.
212. Roid GH, & Miller LJ. (1997). The Leiter international performance scale-‐revised
edition. Lutz, FL: Psychological Assessment Resources.
213. Rogers SL, Lewis H. An affective day treatment model for young children with
pervasive developmental disorders. Journal of the American Academy of Child and
Adolescent Psychiatry, 1989; 28: 207-‐214.
214. Rogers SJ., Vismara LA. Evidence-‐based comprehensive treatments for early
autism. J Clin Child Adolesc Psycho,. 2008; 37: 8-‐38.
215. Roid GH, Miller LJ. The Leiter international performance scale-‐revised edition.
Lutz, FL: Psychological Assessment Resources; 1997.
216. Rommelse NN, Peters CT, Oosterling IJ, Visser JC, Bons D, van Steijn DJ et al. A
pilot study of abnormal growth in autism spectrum disorders and other childhood
psychiatric disorders. J Autism Dev Disord 2011;41(1):44-‐54.
217. Rudrauf D, David O, Lachaux JP, Kovach CK, Martinerie J, Renault B, Damasio A.
Rapid interactions between the ventral visual stream and emotion-‐related structures
rely on a two-‐pathway architecture. J Neurosci. 2008 Mar 12;28(11):2793-‐803.
218. Rueckert D, Sonoda LI, Hayes C, Hill DL, Leach MO, Hawkes DJ. Nonrigid
registration using free-‐form deformations: application to breast MR images. IEEE
Trans Med Imaging. 1999 Aug;18(8):712-‐21.

98
219. Rutter M, Le Couteur A, Lord C. (2003). ADI-‐R: the autism diagnostic interview-‐
revised, Los Angeles, CA: Western Psychological Services.
220. Salmond CH, Ashburner J, Connelly A, Friston KJ, Gadian DG, Vargha-‐Khadem F. The
role of the medial temporal lobe in autistic spectrum disorders. Eur J Neurosci.
2005;22(3):764-‐772.
221. Saxe R, Kanwisher N. People thinking about thinking people. The role of the
temporo-‐parietal junction in "theory of mind". Neuroimage. 2003;19(4):1835-‐1842.
222. Scambler D., Rogers SJ., Wehner EA. (2001). Can the Checklist for Autism in
Toddlers Differentiate Young Children With Autism From Those With Developmental
Delays? Journal of the American Academy of Child and Adolescent Psychiatry, 40:
1457-‐1463.
223. Schmitz N, Rubia K, van Amelsvoort T, Daly E, Smith A, Murphy DG. Neural
correlates of reward in autism. Br J Psychiatry. 2008;192(1):19-‐24.
224. Schopler E, Reichler RJ, Rochen Renner BR. (1986). The Childhood Autism Rating
Scale for Diagnostic Screening and Classification of Autism. Irvington: New York.
225. Shattuck PT. The contribution of diagnostic substitution to the growing
administrative prevalence of autism in US special education. Pediatrics,
2006;117(4):1028-‐37.
226. Schumann CM, Bloss CS, Barnes CC, Wideman GM, Carper RA, Akshoomoff N et
al. Longitudinal magnetic resonance imaging study of cortical development through
early childhood in autism. J Neurosci 2010;30(12):4419-‐27.
227. Schopler E, Reichler RJ, Renner BR. The Childhood Autism Rating Scale. Los Angeles,
CA: Western Psychological Services; 1988.
228. Siegel B, Pliner C, Eschler J, Elliott GR. (1988). How children with autism are
diagnosed: difficulties in identification of children with multiple developmental
delays. J Dev Behav Pediatr, 9: 199–204.
229. Sikora DM, Hall TA, Hartley SL, Gerrard-‐Morris AE, Cagle S. (2008). Does parent
report of behavior differ across ADOS-‐G classifications: analysis of scores from the
CBCL and GARS. J Autism Dev Disord 38: 440-‐448.
230. Silventoinen K, Kaprio J, Lahelma E, Koskenvuo M. Relative effect of genetic and
environmental factors on body height: differences across birth cohorts among Finnish
men and women. Am J Public Health 2000;90(4):627-‐30.

99
231. Sinzig J, Walter D, Doepfner M. (2009). Attention deficit/hyperactivity disorder
in children and adolescent with autism spectrum disorder. Symptom or Syndrome ?
Journal of Attention Disorders, 20: 1-‐10.
232. Sivberg B. (2003). Parents’ detection of early signs in their children having an
autism spectrum disorder. Journal of Pediatric Nursing, 18: 433-‐439.
233. Skuse DH. (2000) Imprinting the X-‐chromosome, and the male brain: explaining sex
differences in the liability to autism. Pediatric Research, 47 (1), 9-‐16.
234. Smith SM. Fast robust automated brain extraction. Hum Brain Mapp. 2002
Nov;17(3):143-‐55
235. Smith SM, Jenkinson M, Woolrich MW, Beckmann CF, Behrens TE, Johansen-‐Berg H,
Bannister PR, De Luca M, Drobnjak I, Flitney DE, Niazy RK, Saunders J, Vickers J, Zhang
Y, De Stefano N, Brady JM, Matthews PM. Advances in functional and structural mr
image analysis and implementation as fsl. Neuroimage, 23 Suppl 1:S208-‐219, 2004.
236. Smith SM, Jenkinson M, Johansen-‐Berg H, Rueckert D, Nichols TE, Mackay CE,
Watkins KE, Ciccarelli O, Cader MZ, Matthews PM, Behrens TE. Tract-‐based spatial
statistics: voxelwise analysis of multi-‐subject diffusion data. Neuroimage. 2006
15;31(4):1487-‐505.
237. Solomon M, Ozonoff SJ, Ursu S, Ravizza S, Cummings N, Ly S, Carter CS. The neural
substrates of cognitive control deficits in autism spectrum disorders.
Neuropsychologia. 2009;47(12):2515-‐2526.
238. Sparks BF, Friedman SD, Shaw DW, Aylward EH, Echelard D, Artru AA, et al. Brain
structural abnormalities in young children with autism spectrum disorder. Neurology.
2002;59(2):184-‐192.
239. Stanfield AC, McIntosh AM, Spencer MD, Philip R, Gaur S, Lawrie SM. Towards a
neuroanatomy of autism: a systematic review and meta-‐analysis of structural
magnetic resonance imaging studies. Eur Psychiatry. 2008;23(4):289-‐299.
240. Stevenson RE, Schroer RJ, Skinner C, Fender D, Simensen RJ. Autism and
macrocephaly. Lancet 1997;349(9067):1744-‐5.
241. Stone WL, Lee EB, Ashford L, Brissie J, Hepburn SL, Coonrod EE, Weiss BH.
(1999). Can autism be diagnosed accurately in children under 3 years? J Child Psychol
Psychiatry, 40: 219-‐226.
242. Stone WL, Yoder PJ. (2001). Predicting spoken language level in children with
autism spectrum disorders. Autism, 5: 341–361.
100
243. Stone JL, Merriman B, Cantor RM, Yonan AL, Gilliam TC, Geschwind DH. et al.
(2004). Evidence for sexspecific risk alleles in autism spectrum disorder. American
Journal of Human Genetics, 75, 1117–1123.
244. Sundaram SK, Kumar A, Makki MI, Behen ME, Chugani, HT, Chugani DC.
Diffusion tensor imaging of frontal lobe in autism spectrum disorder. Cerebral Cortex
2008;18(11):2659-‐65.
245. Szatmari P, Bryson SE, Boyle MH, Streiner DL, Duku E. (2003). Predictors of
outcome among high functioning children with autism and Asperger syndrome. J Child
Psychol Psychiatry, 44: 520–528.
246. Swets JA, Pickett RM. (1982). Evaluation of Diagnostic Systems: Methods from
Signal Detection Theory. Academic Press.
247. Thomas C, Humphreys K, Jung KJ, Minshew N, Behrmann M. The anatomy of the
callosal and visual-‐association pathways in high-‐functioning autism: A DTI
tractography study. Cortex. 2010.
248. Torrey EF, Dhavale D, Lawlor JP, Yolken RH. Autism and head circumference in
the first year of life. Biol Psychiatry 2004;56(11):892–4.
249. Trottier G, Srivastava L, Walker CD. Etiology of infantile autism: a review of
recent advances in genetic and neurobiological research. J. Psychiatry Neurosci., 1999;
24:103–15.
250. Tsai LY, & Beisler JM. The development of sex differences in infantile autism.
The British Journal of Psychiatry, 1983; 142, 373–378.
251. Tsai L, Stewart MA, & August G. Implication of sex differences in the familial
transmission of infantile autism. J Autism Dev Disord, 1981; 11(2) 165– 173.
252. van Daalen E, Swinkels SHN, Dietz C, van Engeland H, Buitelaar JK. Body length
and head growth in the first year of the life in autism. Pediatr Neurol 2007;37(5):324–
30.
253. Van Overwalle F, Baetens K. Understanding others' actions and goals by mirror and
mentalizing systems: a meta-‐analysis. Neuroimage. 2009;48(3):564-‐584.
254. Van Overwalle F. A dissociation between social mentalizing and general reasoning.
Neuroimage. 2011;54(2):1589-‐1599.
255. Völlm BA, Taylor AN, Richardson P, Corcoran R, Stirling J, McKie S, Deakin JF, Elliott
R. Neuronal correlates of theory of mind and empathy: a functional magnetic
resonance imaging study in a nonverbal task. Neuroimage. 2006;29(1):90-‐98.
101
256. Waiter GD, Williams JH, Murray AD, Gilchrist A, Perrett DI, Whiten A. A voxel-‐based
investigation of brain structure in male adolescents with autistic spectrum disorder.
Neuroimage. 2004;22(2):619-‐625.
257. Wassink TH, Hazlett HC, Epping EA, Arndt S, Dager SR, Schellenberg GD, Dawson G,
Piven J. Cerebral cortical gray matter overgrowth and functional variation of the
serotonin transporter gene in autism. Arch Gen Psychiatry. 2007;64(6):709-‐717.
258. Webb SJ, Nalty T, Munson J, Brock C, Abbott R, Dawson G. Rate of head
circumference growth as a function of autism diagnosis and history of autistic
regression. J Child Neurol 2007;22(10):1182–90.
259. Wechsler D. Wechsler Preschool and Primary Scale of Intelligence (WWPSI).
Firenze (Italy): Organizzazioni Speciali; 1973.
260. Wechsler D. Wechsler Intelligence Scale for Children – Revised (WISC-‐R).
Firenze (Italy): Organizzazioni Speciali; 1986.
261. Werner E., Dawson G. Validation of the phenomenon of autistic regression using
home videotapes. Arch Gen Psychiatry, 2005; 62: 889–895.
262. Wetherby AM, Woods J, Allen L, Clearly J, Dickinson H, Lord C. Early indicators
of autism spectrum disorders in the second year of life. J Autism Dev Disord 2004, 34:
473-‐493.
263. Wiggins LD, Baio J, Rice C. Examination of the time between first evaluation and
first autism spectrum diagnosis in a population-‐based sample. Journal of
Developmental and Behavioral Pediatrics, 2006; 27: 79-‐87.
264. Williams JH, Waiter GD, Perra O, Perrett DI, Whiten A. An fMRI study of joint
attention experience. Neuroimage. 2005;25(1):133-‐140.
265. Williams DL, Goldstein G, Minshew NJ.Neuropsychologic functioning in children
with autism: further evidence for disordered complex information-‐processing. Child
Neuropsychol. 2006;12(4-‐5):279-‐298.
266. Wing, L. (1981) Sex ratios in early childhood autism and related conditions.
Psychiatry Research, 5,129-‐37.
267. Yassa MA, Stark CE. A quantitative evaluation of cross-‐participant registration
techniques for MRI studies of the medial temporal lobe. NeuroImage. 2009;44(2):319-‐
327.
268. Yirmiya N, Ozonoff S. The very early phenotype of autism. J Autism Dev Disord
2007;37:1–11.
102
269. Zeegers M, Pol HH, Durston S, Nederveen H, Schnack H, van Daalen E, Dietz C,
van Engeland H, Buitelaar J. No differences in MR-‐based volumetry between 2-‐ and 7-‐
year-‐old children with autism spectrum disorder and developmental delay. Brain Dev.
2009;31(10):725-‐730.
270. Zero to three (2005). Diagnostic classification of mental health and
developmental disorders of infancy and early chilhood, revised (DC:0-‐3R). Washington,
DC: Zero to Three Press.
271. Zwaigenbaum L, Bryson S, Rogers T, Roberts W, Brian J, Szatmari P. Behavioral
manifestations of autism in the first year of life. Int J Dev Neurosci 2005;23:143–152.
272. Zwaigenbaum L, Bryson S, Lord C, Rogers S, Carter A, Carver L, Chawarska K,
Constantino J, Dawson G, Dobkins K, Fein D, Iverson J, Klin A, Landa R, Messinger D,
Ozonoff S, Sigman M, Stone W, Tager Flusberg H, Yirmiya N. Clinical assessment and
management of toddlers with suspected autism spectrum disorder: insights from
studies of high-‐risk infants. Pediatrics, 2009; 123:1383-‐1391.
273. Zaitchik D, Walker C, Miller S, LaViolette P, Feczko E, Dickerson BC. Mental state
attribution and the temporoparietal junction: an fMRI study comparing belief,
emotion, and perception. Neuropsychologia. 2010;48(9):2528-‐2536.
274. Zysset S, Huber O, Samson A, Ferstl EC, von Cramon DY. Functional specialization
within the anterior medial prefrontal cortex: a functional magnetic resonance imaging
study with human subjects. Neurosci Lett. 2003;335(3):183-‐186.
Top Related