


Languages
Pages
Legal


1
LOCAL GOVERNMENT ANNUAL REPORTS: AUSTRALIAN EMPIRICALEVIDENCE ON RECIPIENTS
Janet MackSchool of Accountancy,
Queensland University of TechnologyBrisbane
Christine RyanSchool of Accountancy,
Queensland University of TechnologyBrisbane
Keitha DunstanSchool of Accounting and Commercial Law
Victoria University of WellingtonNew Zealand
Contact Address:
Janet Mack,School of Accountancy,Queensland University of Technology,2 George Street,BRISBANE. 4000
Email: [email protected]: 07 3864 2272

2
LOCAL GOVERNMENT ANNUAL REPORTS: AUSTRALIAN EMPIRICALEVIDENCE ON RECIPIENTS
ABSTRACT
In Australia, a common conceptual framework for general purpose financial reporting has
been adopted for use by both the private and public sectors. This framework is based on a
'user needs' model and emphasises the provision of information for users who are
dependent on general purpose financial reports for the purpose of decision making.
Critics of the framework, as it applies to the public sector, claim that it lacks empirical
substantiation and ignores the complexity and diversity of public sector institutions. This
paper addresses the identity of the users of local government annual reports by examining
the distribution lists of authorities within Queensland. The study confirms the existence
of the user groups that are defined in the conceptual framework but also finds additional
users groups not identified. Further, the study provides evidence that the distribution
patterns of local government authorities differ significantly depending on the type of
local government (urban or rural) and their size. The results of this research raise
important questions for public sector regulators regarding the appropriateness of
assuming that there exists a homogeneous set of users for all public sector entity types
and provides support for consideration of a differential reporting model within local
government.
KEY WORDS: public sector, users, annual reports, local government

3
INTRODUCTION
The last twenty years has seen an immense change in the nature of the public sector in
Australia. The reasons that these changes have occurred have been the subject of
discussion by researchers (see for example, Broadbent and Guthrie, 1992; Hood, 1991;
Wanna et. al., 1992; Emmy and Hughes, 1991). The result of the changes, however, is
that the public sector has had to adapt to new expectations that it operate in a more
commercial manner and that it be accountable not only for the money that it spends but
also for the effectiveness with which it spends those funds (Pollitt, 1990). This increased
emphasis on performance and accountability has lead to a greater awareness of
mechanisms to discharge accountability. In this respect, the role of the annual report in
the accountability chain, and as a means of discharging public accountability has received
increased prominence.
The presentation of annual reports is one stage in a cycle of accountability that begins
with the budget process and ends with the tabling of reports to parliament (English and
Guthrie, 2000). While it is acknowledged that the annual report does not report on the
total accountabilities of public sector agencies, it is statutorily required as the primary
medium of accountability (JCPA, 1989; PAEC, 1999). In an effort to improve the quality
of public sector annual reporting in the Commonwealth, States, territories, and local
government, regulations covering the content, quality and timeliness of annual reporting
have been developed and refined since the late 1980s (Milazzo, 1992; PAC, 1996; PAEC,
1999).
A public sector annual report comprises both descriptive information about the entity and
its activities, and the audited financial statements. In relation to the descriptive/non
financial information of public sector entities, there is a wide variation in the information
produced due to an absence of consistent guidelines (Milazzo, 1992). With regard to the
audited financial statements, public sector accounting standards have now been
introduced and most public sector agencies prepare financial statements on an accrual
basis in accordance with those standards (Micallef, 1997). The accounting profession,

4
through the Public Sector Accounting Standards Board (PSASB), has been a key
promoter of these changes (Chua and Sinclair, 1994; Ryan, 1998).
One of the first tasks of the PSASB was to commission the development of a conceptual
framework within which to develop public sector accounting standards (Sutcliffe, 1985).
The 1985 monograph Financial Reporting in the Public Sector – A Framework for
Analysis and Identification of Issues (Sutcliffe, 1985) published by the Australian
Accounting Research Foundation (AARF) laid down the fundamental principles, which
were to guide the production of accounting standards in the Australian public sector. This
document advocated the adoption of a common conceptual framework for both the
private and public sectors that was derived from a 'user needs' model of general purpose
financial reporting (Walker, 1989; English and Guthrie, 2000). The PSASB embraced
the recommendations of the monograph. The then Executive Director of the AARF,
Warren McGregor asserted that the decision to adopt the same conceptual approach to the
development of public sector accounting standards as private sector standards was
perhaps the most important decision made by the PSASB (McGregor, 1999). However,
the decision to make no distinction between private and public sector entities, did not
receive unanimous support. The differences between the sectors in terms of their
operating structure, sources of financing, operating motives and accountability
obligations has motivated others to criticise the decision (see for example, English, 1999;
English and Guthrie, 2000; Carnegie and Wolnizer, 1995; Guthrie 1998; Walker 1989).
Despite this controversy there exists little empirical evidence on the effects of this
decision.
The adoption of conceptual frameworks for general purpose financial reporting has been
pursued in various countries in the English speaking world. The central element of these
frameworks, has been the emphasis on 'user needs' (Rutherford, 1992; Van Peursem,
1990). Mignot and Dolley (1996) contend that a 'user needs' framework requires that the
information produced should be dependent on who requires the information and for what
purpose. They state:

5
The decision usefulness approach to standard settingrequires that the users are identified and that their decisiontasks, together with their information needs, can bespecified (Mignot and Dolley 1996, p2).
The first potential problem for the public sector arises from the lack of empirical
identification of users and their information needs. Despite the importance of the identity
of users to the veracity of the 'user needs' framework, there is a paucity of empirical
evidence regarding the users of annual reports and the financial statements contained
within them (Rutherford, 1992; Ma and Matthews, 1993). Pronouncements have been
premised on normative arguments. Statement of Accounting Concept 2 (SAC 2),
Objective of General Purpose Financial Reporting, (AARF, 1990b), one of the platform
documents within the conceptual framework normatively identifies three broad categories
of user; resource providers, recipients of goods and services and parties performing a
review or oversight function. These categories of users for public sector general purpose
financial reports are derived from those in the private sector. However, Mayston (1992)
challenges these categories, arguing that the accountability relationships in the public
sector are more complex and less well defined than those in the private sector and this has
contributed to difficulties in identifying users for public sector reports. Ma and Matthews
(1993) advance this argument by contending that it is this lack of empirical data on users
that has raised the possibility that the existing accounting standards which are premised
on the existence of users are inappropriate for public sector agencies.
A further potential problem to the public sector arises from the fact that SAC1 Definition
of the Reporting Entity (AARF, 1990a) and consequent public sector standards (AAS 27
Financial Reporting by Local Governments (AARF, 1991), AAS 29 Financial Reporting
by Government Departments (AARF, 1993), and AAS 31 Financial Reporting by
Governments (AARF, 1994)) state that all governments, government departments, and
local governments are regarded as reporting entities. For private sector entities, SAC 1
states that a reporting entity exists only when there is a significant separation of
ownership and management. This, in effect, introduces a differential reporting regime in
the private sector, and allows for the possibility that smaller entities may not need to

6
follow the same prescriptions as larger entities. However, a blanket decree that local
governments, government departments and governments are reporting entities mean no
concessions are made for the accountability relationships or individual characteristics of
different public sector entities. For example, all local government authorities, in spite of
their huge variations in terms of size, population and location, are presumed to have a
homogeneous set of users for their general purpose financial reports. Moreover,
Rutherford (1992) theorises that the needs of external users would be sufficiently diverse
that the highly aggregated nature of general purpose financial reports would not be
sufficient to satisfy their interests. Kloot and Martin (2000) provide evidence that the
perceptions of local government managers regarding accountabilities varied depending
on their geographic location and isolation. This raises the possibility that not all public
sector agencies have the same user profile and thus could benefit from the differential
reporting practices that exist in the private sector.
The objective of this paper is to address problems associated with applying the
conceptual framework in a local government situation. The first research issue of interest
is the identification of recipients of annual reports. This will provide empirical evidence
of the veracity of the categories of users as identified by SAC 2 in the context of local
governments within Queensland. The second research issue considered is the
composition of the user profiles within the local government sector. A cross sectional
analysis of recipients will be made to determine if there is any variation in the profile of
recipients. Any variations found in the user profiles will create doubt about the
assumption that all local governments are reporting entities that should apply the full
general purpose financial reporting framework.
Empirical data on who receives public sector annual reports will be useful in guiding
policy makers on further policy prescriptions, and to agencies when considering report
format and content. The paper proceeds as follows. The next section will review the
previous literature in the area. The research method and the results are then reported. The
paper concludes with its findings, areas for future research and limitations of the study.

7
INSIGHTS FROM PRIOR LITERATURE
Prior research concerned with identifying users of public sector general purpose financial
reports can be reported from two perspectives – the research methodology employed and
the findings/results obtained. Both of these perspectives will be examined here, as they
provide insights that are relevant for the current study.
There have been three primary methodologies employed to date each of which have
differing reliability and validity problems. One research method that has been used to
identify users is a theoretical (normative) approach. The seminal work in the area of users
of public sector financial reports is that by Anthony (1978). Anthony’s study theoretically
identified 5 categories of user; governing bodies, investors and creditors, resource
providers, oversight bodies and constituents. The majority of subsequent work has either
adopted these categories of users (Walker, 1995) or examined information needs issues
(see for example, CICA, 1980; Burton, 1980; Drebin et. al., 1981; Jones et. al.,1985; Hay,
1994). These studies have a validity problem in that the categories of users are not
empirically verified.
A second research methodology has been to solicit responses from users by means of
placing cards in annual reports. This approach aims to identify actual users of reports.
Users are requested to self identify by returning the card. Volunteer respondents are then
surveyed. A UK study by Butterworth et. al., (1989) used this approach. The researchers
attempted to identify users of annual reports by leaving a questionnaire in copies of a
local government’s annual report held in public libraries. A further study which adopted
this approach was a New Zealand study by Dixon et. al., (1997). This study examined the
users of tertiary education institutions annual reports, by asking recipients to identify
themselves. They requested that the users of the annual report return a card which had
been inserted into the annual reports distributed by the institution. Those who returned a
card were then surveyed by the researchers. Studies using this approach need to be
questioned about the reliability and validity of the approach. This method of data

8
collection cannot be considered to have captured a comprehensive set of all users because
it relies on respondent volunteers to self-identify.
A third research approach to identifying users was adopted by Atamian and Ganguli
(1991). They sought the views of account preparers. The researchers were concerned with
identifying the primary recipients of municipal financial reports in America. They
developed a questionnaire that requested descriptive information about the city and the
potential report recipients from the five user groups that had been identified in previous
literature – individuals, private businesses, private nonbusiness organisations, state and
local government institutions and federal government agencies. The questionnaire was
mailed to all municipalities with a population of over 50,000. The administrators in the
city bureaucracy were asked to indicate whether they sent their financial reports to the
potential recipients identified on the questionnaire and to add any other recipients not
appearing on the questionnaire. The primary problem with this methodology is that it is
reliant on third party judgements, which threatens the validity of any conclusions drawn
(Mignot and Dolley, 2000).
Further insights into the users of public sector financial reports is obtained from the
empirical literature. In the main, the findings of the empirical studies in relation to user
categories have challenged the completeness of theoretical user group profiles. Most
theoretical studies have identified potential user groups ranging in number from three to
seven (Taylor and Rosair, 2000). However, additional user categories have emerged from
empirical studies. These studies have been conducted in New Zealand and the United
States. The New Zealand study by Coy et. al., (1997) of tertiary institutions revealed 34%
of users were internal to the organisation, being employees of the institution, and 11% of
users came from other tertiary institutions. Thus the study revealed two categories of
users not previously identified by the regulators or prior theoretical/normative studies:
being internal users and other like organisations.
These results are confirmed in the US study by Atamian and Ganguli (1991) of users of
municipality annual reports. They identified city employees (internal users) as a
9
significant category of recipients as well as 'other municipalities'. Another important
finding of this research was that there was cross sectional variation in user profiles. They
found a non-uniformity in the recipients included on the mailing lists of US local
governments. They concluded that not all public sector entities even within the same
entity type (eg. municipalities) will necessarily have the same categories of users for their
financial reports.
In summary, there is scant empirical research regarding the identity of users of public
sector annual reports. That which does exist employs a variety of research methodologies.
Empirical studies both in the US and New Zealand have identified two categories of users
of general purpose financial reports not previously considered by the theorists or
regulators - internal users and other similar authorities in the same government sector.
Further, there is US evidence to support the conclusion that there is cross sectional
variation of user profile even within one sector.
RESEARCH METHOD
As discussed in the prior section, previous studies addressing the identification of users
have adopted different methodologies being: development of theoretical models; self
identification by user volunteers; and surveys of account preparers. All three of these
methods suffer from reliability and validity problems to varying degrees. This study takes
a different approach by relying on researcher inspection of the actual lists of recipients of
annual reports. It is argued that this method is a more objective/reliable source of
information regarding recipients because it is complete for each authority in that it is not
dependent on recipients responding and identifying themselves and thus there is no
chance of missing information. A further strength is that it provides data on actual
recipients, rather than third party judgements, that is, relying on the perceptions of report
preparers to identify users. In addition, as the recipient lists are created through a
combination of account preparers perceptions of users (based on normative model and
their own experience) and actual users who have requested to be added to the list, they
are likely to be more comprehensive. However there are two validity problems with
10
relying on recipient lists to identify user profiles; first, not all recipients who receive
reports will actually use the annual reports and second, there may exist users who gain
access to annual reports from sources other than directly from the agency, for example,
borrowing from a library or via the internet. Despite these limitations, and because of its
superiority to other methodological approaches, this research relies on recipient lists to
identify the recipients of local government general purpose financial reports.
The site of the study is Queensland. Queensland is one of the 8 jurisdictions in the
federation of Australia. This jurisdiction was chosen as the focus of this study initially
because of accessibility of data to the researchers. However as Greenall et. al., (1988)
argue there is no reason to suspect any cross-jurisdictional differences for local
government authorities, a view shared by Micallef et. al., (1994) in relation to
departments.
There are 125 local government authorities in Queensland. They vary markedly in terms
of physical size, population and revenue base. The Australian Classification of Local
Governments Classifications apply to all Councils receiving grants under the Local
Government (Financial Assistance) Acts 1995. The system classifies all local
governments Australia wide into 22 categories with each category having a three
character code (Institute of Municipal Management, 1999). Local governments are
initially categorised as being either urban (U) or rural (R). These broad categories are
then further subdivided. Urban local authorities are subdivided into Capital City (CC),
Fringe (F), Metropolitan (M) or Regional (R). Rural authorities are subdivided into
Agricultural (A), Remote (T) or Significant (S). These categories are then further
subdivided based on population size, with the classifications being Extra Small (X),
Small (S), Medium (M), Large (L) Very Large (V) and Growth (G).i Thus there are 13
possible categories of urban councils and nine possible categories of rural councils.
All local government authorities in Queensland were approached with a request to
participate in this study.ii A list of who had received the annual report for the 1998/99
financial year was obtained from the officer responsible for the distribution of the annual

11
report in each local authority.iii This included the names of anyone who asks for a report,
plus the names of anyone whom the local council thinks would be interested in the report
and those who are legislatively required to receive a report. Depending on the size of the
distribution list and the resources available within the authority the list was either
received over the telephone or in writing.
Table 1Response rate by Local Authority Type
Local authority classification Number ofauthorities
Number thatsupplied
information
Percentresponse
rateUrban Capital City 1 0 0.0Urban Metropolitan Small 0Urban Metropolitan Medium 1 1 100.0Urban Metropolitan Large 0Urban Metropolitan Very Large 1 1 100.0Urban Regional Small 4 4 100.0Urban Regional Medium 5 4 80.0Urban Regional Large 4 2 50.0Urban Regional Very Large 1 1 100.0Urban Fringe Small 1 1 100.0Urban Fringe Medium 3 2 66.7Urban Fringe Large 3 2 66.7Urban Fringe Very Large 1 1 100.0Subtotal urban 25 19Rural Agricultural Very Large 14 12 86.0Rural Agricultural Large 10 7 70.0Rural Agricultural Medium 5 4 80.0Rural Agricultural Small 6 6 100.0Rural Remote Large 24 17 71.0Rural Remote Medium 24 18 75.0Rural Remote Small 6 5 83.0Rural Remote Extra Small 2 1 50.0Rural Significant Growth 9 8 89.0Subtotal rural 100 78Total 125 97 78.0
Of the 125 local government authorities in Queensland 100 are classed as rural
authorities and 25 as urban authorities. Information was obtained from 97 local
authorities representing 77.6% of the population. The response rate for urban councils
was 76% (19 out of a possible 25) and for rural councils 78% (78 out of a possible 100).
Of the 28 authorities that did not supply the requested information, only one authority
refused to supply information, three were omitted from the research because of anomalies
in the manner in which they distributed their annual reports,iv a further council was

12
omitted because it had not produced an annual report for two years and the remainder,
whilst agreeing to provide the information failed to do so.v Table 1 illustrates the
response rate by local government type.
The first research issue of this study is concerned with the identification of recipients and
their applicability to the user groups identified by SAC 2. The identification of user
groups was made by examining prior literature. Two documents – SAC 2vi and the AARF
discussion paper “Financial Reporting by Local Governments”vii which preceded the
issue of AAS 27 “Financial Reporting by Local Governments” identified three user
groups for all public sector bodies – providers of resources, recipients of goods and
services and parties performing a review service. As a result, the original three categories
used by SAC 2 were used as the starting point to facilitate analysis of the lists.viii The
problem with this approach is that the same type of user commonly appears in one or
more if not all of the three overall categories suggested by SAC 2. For example
'councillors' and 'ratepayers' appear as an example of ‘providers of resources or their
representatives’, as ‘recipients of services or their representatives’ and as ‘parties
performing a review service’. Given that 'ratepayers' and 'councillors' appeared in each of
these categories they were given a separate category of their own. This resulted in five
categories of users which were synonymous to those in SAC 2. The categories thus
became: ‘ratepayers, taxpayers and residents’; ‘other resource providers’; ‘councillors’;
‘other recipients of services’ including local businesses; and ‘oversight bodies’ including
media, ratepayer and resident associations and Departments of Local Government.
The motivation underlying the analysis of user groups in this study is driven by an
attempt to obtain as exhaustive a list of users as possible. Consequently, further
refinement of the categories was made based on the results of previous empirical research.
The empirical research has identified two additional groups; being ‘internal users’ and
‘other similar authorities’. Consequently, both of these groups were included in the list.
The final user categories for the purposes of this research became;
• ratepayers, taxpayers and residents,
• other resource providers,

13
• councillors,
• other recipients of services,ix
• oversight bodies including media, ratepayer and resident associations and
Departments of Local Governments,
• internal users, and
• other councils.
RESULTS AND DISCUSSION
Research Issue 1 – Identification of Recipients of Annual Reports
The first research issue addressed in this study is the identification of the type of recipient
groups. Table 2x summarises the groups identifiable from the recipient lists of the whole
sample.xi
All seven categories of users used in the analysis were represented. Councillors
constitute the largest group – comprising 24.2% of users. The next most important group
are 'residents and taxpayers' (21.6%), followed by 'internal users' and ‘other councils’
which both constitute 14.0% of total recipients. These results are consistent with the
Australia wide research by Kloot and Martin (2000) who found that accountabilities to
ratepayers and to councillors was regarded as the 'most important' from the perspective of
the Chief Executive Officers of local governments.
The finding that all five of the categories of users identified in SAC 2 were present
provides some support for the applicability of these user categories in a public sector
setting. However, consistent with prior research ‘internal users’ and ‘other councils’ are
also well represented as recipients of annual reports. This suggests that the user focus set
out in SAC 2 may be too narrow to encompass the diversity of interests within public
sector entities. The identification of these 2 categories in an Australian context adds to
prior research findings in New Zealand (Dixon et. al, 1997) and in the US (Atamian and
Ganguli, 1991) regarding users in a public sector context.

14
Table 2Identification of user groups
Whole sample of 97 local government authorities
User Category n(%) Identified by SAC 2Ratepayers & residents 791 (21.6) YesOther resource providers 156 (4.2) YesCouncillors 885 (24.2) YesOther recipients of services 389 (10.6) YesOversight bodies 409 (11.2) YesInternal users 512 (14.0) NoOther councils 515 (14.0) NoTotal 3657(100.0)
Research Issue 2 –Cross-sectional variation in the user profile
Kloot and Martin (2000) argued that geographic location and isolation were important
determinants of variations in operating practices in local government. This suggests that
the importance of an annual report as an accountability tool may vary between entities
within the sector. A comparison is made between the recipient lists of the individual
authorities to determine if there are any cross-sectional variations in the distribution
patterns of annual reports within the Queensland local government sector.
The first step in the analysis involved splitting the sample between urban and rural
authorities as an easily identifiable distinction. Table 3 provides an overview of the
distribution patterns for the whole sample and a comparison between urban and rural
authorities on an average per council basis.
Table 3Annual report distribution on an average per council basis
User Category All Authoritiesn (%)
Urban Authoritiesn
Rural Authoritiesn
Ratepayers & residents 8.15 (22) 24.05 (26) 4.28 (18)Other resource providers 1.61 (4) 1.79 (2) 1.56 (6)Councillors 9.12 (24) 10.26 (11) 8.84 (36)Other recipients of services 4.01 (11) 18.68 (20) .44 (2)Oversight bodies 4.22 (11) 11.11 (12) 2.54 (10)Internal users 5.28 (14) 10.94 (12) 3.9 (16)Other councils 5.31 (15) 15.42 (17) 2.85 (12)Total 37.7 (100) 92.25 (100) 24.41 (100)

15
The average number of reports distributed by all authorities was 37.7. This varied from
an average of 92.25 for urban authorities to an average of 24.41 for rural authorities. The
finding that urban authorities have a much broader distribution base than rural authorities
is consistent with the fact that urban authorities are larger and therefore have a broader
base of constituents. The finding is also consistent with the research by Kloot and Martin
(2000) who argue that the annual report is only one mechanism available to local
governments to discharge public accountability, and rural communities are more likely to
use alternative means of communication as they are closer to their communities.
'Councillors' are the most predominant recipients for all authorities overall, with them
receiving on average 24% of the annual reports distributed per council. However, when
the sample is segmented into rural and urban components, differential patterns emerge.
For rural authorities 36% of annual reports distributed by those agencies, are sent to their
councillors, whereas for urban authorities the percentage of reports sent to councillors is
11%. Another notable difference is obvious for urban authorities, where 'ratepayers and
residents' emerge as the most significant recipient group, receiving an average of 26%.
The apparent differences between urban and rural authorities revealed in Table 3 are
investigated further through statistical testing for differences between the proportion of
reports distributed to each of the recipient groups for urban and rural authorities. These
results are reported in Table 4.Table 4
Tests for differences between the mean proportion of annual reports distributed to user categories byurban and rural authorities
User Group UrbanMean
Proportion
RuralMean
Proportion
Mann-Whitney UZ Statistic
Asymp.Sig(2-tailed)
Ratepayers & residents .24 .17 -2.728 .006
Other resource providers .03 .06 -2.685 .007
Councillors .18 .43 -5.361 .000
Other recipients of services .15 .01 -5.746 .000
Oversight bodies .12 .11 -.223 .824
Internal users .16 .16 -.400 .689
Other councils .13 .04 -3.334 .001

16
The analysis confirms that the proportions of annual reports distributed to the various
user categories by rural and urban authorities was significantly different for five out of
the seven user categories. The proportion of the total number of annual reports that was
distributed by urban authorities was higher than for rural authorities for three of the
categories; ‘other recipients of services’, ‘ratepayers and residents’ and ‘other councils’.
It could be argued that all of these groups are likely to be using these reports to determine
if they are getting value for money for their services. Kloot and Martin (2000) have
argued that urban councils are more likely to benchmark than rural councils, and this
being the case the annual report is usually a good source of benchmarking information
(Ryan et. al., 2001). In relation to each group individually, it is arguable that 'other
recipients of services' in urban areas may be interested in information from the local
government because they have far more potential to switch their consumption to other
councils, or indeed to lobby councils for changes in the level of council services. In
relation to 'ratepayers and residents', urban groups are likely to be a more educated and
mobile group who also will use information to change their consumption or living
preferences if motivated to do so (Zimmerman, 1977). A possible explanation for the
prevalence of 'other councils' as a user group of urban authorities could come from two
sources. First, other urban councils are likely to be interested because there is competition
between neighbouring urban councils in terms of the services they provide. Further, it is
also likely that rural councils are interested in the disclosures of urban councils because
of their economic significance and increased resources makes them an important model
for 'other councils' to emulate. This position was confirmed in a conversation with one
rural CEO who indicated that he liked to receive copies of the annual reports of larger
local authorities in part so that he could get some ideas for his own annual report.
Two of the user categories were more important for rural authorities than for urban
authorities, ‘councillors’ and ‘other resource providers’. The relative importance of these
two categories for rural councils may simply reflect the low number of recipients of
annual reports in the other five categories. For example, in the case of councillors it could
be argued that rural councils have virtually the same number of councillors as do urban
councils, and so given their smaller distribution base, councillors represent a greater

17
percentage of reports distributed. Further, although rural authorities provide a greater
proportion of their reports to 'other resource providers', the average number of reports to
these recipients is only 1.56 per council, which may be considered to be immaterial.
For 'oversight bodies', no significant difference was found for the proportion of annual
reports distributed by urban and rural authorities. However, interestingly when Table 3 is
reviewed the average number of annual reports sent to this group by urban authorities
was 11.11, whereas for rural authorities it was 2.54. There are three basic oversight
bodies, for local government authorities, Audit, the Local Government Association and
the Department of Local Government and Planning. For rural authorities, reports in most
instances were sent to these traditional oversight bodies with some authorities not
forwarding to the Local Government Association, hence the average being slightly less
than three. However, the fact that the average number of annual reports by urban
authorities exceeds three, indicates that they perceive they have accountabilities to a more
diverse constituent base and they use the annual report to discharge these obligations.
Closer examination of the destination of the annual reports of urban authorities reveals
that the majority of reports are sent to media outlets - TV, radio and newspapers. This
finding is consistent with that of Kloot and Martin (2000) who found that local
governments use the media to discharge their accountability obligations. However, the
results here, add to that research and provide a point of difference between urban and
rural authorities. Urban authorities use the formal annual report to discharge their
accountability obligations to the media, whereas rural authorities do not.
In summary, urban councils have a greater distribution base than do rural authorities for
their annual reports. In addition, the user profile is broader, with diverse groups being the
predominant recipients of annual reports. Using the rationale provided in SAC 1 and 2,
these types of recipients are more likely to be dependent on general purpose financial
reports to facilitate their decision making. In contrast, rural authorities distribute a low
number of reports with internal users such as councillors predominating. Internal users
(including councillors) could be argued to have special access to information and
therefore would not be dependent on special purpose reports. These results seem to

18
indicate support for a differential reporting framework based on type of authority, where
rural authorities could be exempted from general purpose financial reporting
requirements. However, within the rural and urban categories there is considerable
diversity in size that may impact on the profile of annual report recipients and provide a
point of refinement for any differential reporting model. This motivates further analysis
in Tables 5 and 6 based on the size of urban and rural authorities.
Table 5 further disaggregates the 78 rural authorities which provided data into the nine
sub-groups based on the Australian Local Government classification scheme.
Table 5Average numbers of annual reports distributed by rural authorities according to major
subcategories and size (overall average 24)
Ratepayers& residents
Otherresourceproviders
Councillors Otherrecipients of
services
O’sightbodies
Internalusers
Othercouncils
Total
AgriculturalLarge (7)
4.14 1.29 9.57 .71 2.29 4.42 22.43
AgriculturalMedium (4)
4.75 1.75 9.00 2.00 3.25 20.75
AgriculturalSmall (6)
2.83 0.67 7.33 1.83 2.17 14.83
AgriculturalVery Large(12)
5.08 1.33 10.08 1.75 2.67 5.83 1.83 28.58
RemoteExtra Small(1)
5.00 1.00 5.00 2.00 1.00 14.00
RemoteLarge (17)
4.76 1.88 8.65 .24 2.17 4.24 .59 22.53
RemoteMedium(18)
2.94 2.00 8.44 .11 2.16 3.00 7.28 25.94
RemoteSmall (5)
5.00 2.00 7.80 2.20 1.60 8.00 26.6
SignificantGrowth (8)
5.50 .875 9.87 .25 5.25 5.25 2.37 29.38
An initial inspection of this table indicates that two of the three small rural authorities
being Agricultural Small and Remote Extra Small distribute fewer reports than the other
rural authorities (an average distribution of 14 annual reports, compared to the overall
average for rural authorities of 24 reports). The third small category 'remote small'
19
distributed on average 27 annual reports, which seems anomalous to this size result.
However, further investigation of the data reveals that one council in the rural remote
small category distributes 30 annual reports to other councils. If this is removed from the
sample the average number of annual reports distributed for rural remote small becomes
17.5, which then brings this category in line with the other two small categories.
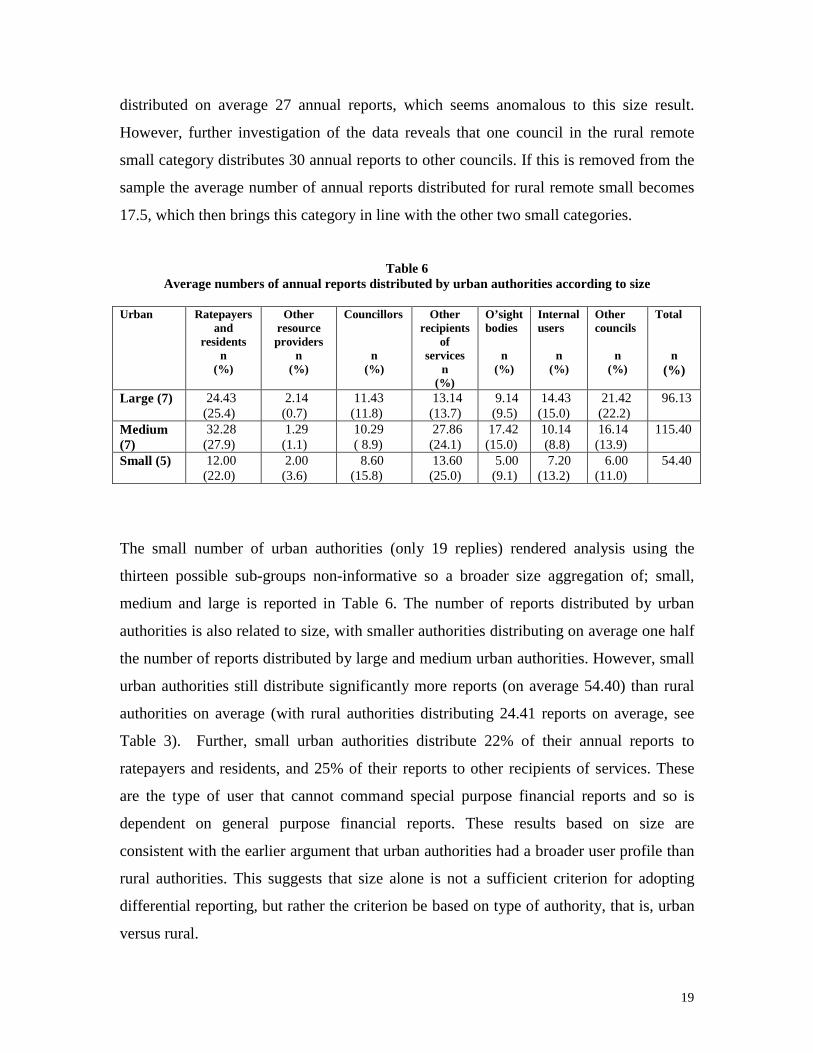
Table 6Average numbers of annual reports distributed by urban authorities according to size
Urban Ratepayersand
residentsn
(%)
Otherresourceproviders
n(%)
Councillors
n(%)
Otherrecipients
ofservices
n(%)
O’sightbodies
n(%)
Internalusers
n(%)
Othercouncils
n(%)
Total
n(%)
Large (7) 24.43 (25.4)
2.14 (0.7)
11.43 (11.8)
13.14 (13.7)
9.14 (9.5)
14.43(15.0)
21.42 (22.2)
96.13
Medium(7)
32.28 (27.9)
1.29 (1.1)
10.29 ( 8.9)
27.86 (24.1)
17.42(15.0)
10.14 (8.8)
16.14(13.9)
115.40
Small (5) 12.00 (22.0)
2.00 (3.6)
8.60 (15.8)
13.60 (25.0)
5.00 (9.1)
7.20(13.2)
6.00(11.0)
54.40
The small number of urban authorities (only 19 replies) rendered analysis using the
thirteen possible sub-groups non-informative so a broader size aggregation of; small,
medium and large is reported in Table 6. The number of reports distributed by urban
authorities is also related to size, with smaller authorities distributing on average one half
the number of reports distributed by large and medium urban authorities. However, small
urban authorities still distribute significantly more reports (on average 54.40) than rural
authorities on average (with rural authorities distributing 24.41 reports on average, see
Table 3). Further, small urban authorities distribute 22% of their annual reports to
ratepayers and residents, and 25% of their reports to other recipients of services. These
are the type of user that cannot command special purpose financial reports and so is
dependent on general purpose financial reports. These results based on size are
consistent with the earlier argument that urban authorities had a broader user profile than
rural authorities. This suggests that size alone is not a sufficient criterion for adopting
differential reporting, but rather the criterion be based on type of authority, that is, urban
versus rural.

20
CONCLUSIONS
Internationally, the decision has been made to adopt a conceptual framework for general
purpose financial reporting based on a 'user needs' model. However, this model has been
seen by some researchers to be problematic in its application to the public sector because
of the lack of consensus in identifying the users of general purpose reports and their
needs. Further, the assumption in Australia that all public sector agencies are reporting
entities means that no concessions are made for the individual characteristics of agencies,
in spite of their huge variations in size, population, location and accountability
relationships.
This study has found that all the categories of users identified by SAC 2 are in fact
recipients of the annual reports of Queensland local government authorities. However, it
also supports prior research in New Zealand and the US that has identified two additional
groups of recipients, 'internal users' and 'other local government authorities'. Further,
analysis based on type of authority, (urban versus rural), identified cross-sectional
variations in the user profiles. Urban authorities were found to have a greater distribution
base with a more diverse composition of user than rural authorities. These findings
suggest that the urban recipients may be more reliant on general purpose reports, whereas
the major rural recipients could be classified as internal users who are in a position to
command special purpose information.
The results of this study identify a broad set of internal users which have been neglected
by Australian standard setters in the development of their conceptual framework. This
Australian evidence, when taken together with similar evidence from New Zealand and
the US provides a consistent body of research that challenges the notion that the adoption
of the 'user needs' framework with its emphasis on external users is sufficient to
accommodate the multiplicity and diversity of accountability obligations that exist in the
public sector. These findings have implications for reporting and standard setting

21
throughout the public sector in the western world since they question the veracity of the
'user-needs' framework as presently applied.
Specifically, in relation to Australia, the analysis of users supports the contention that a
differential reporting framework based on type of authorityxii would be suitable for the
local government sector. This raises doubts regarding the assumption that all government
agencies are reporting entities that should provide general purpose reports. This evidence
supports a challenge to the blanket decree within SAC 1 and the Australian public sector
standards that all governments, government departments, local governments and statutory
bodies are regarded as reporting entities.
The major limitation of this research is that it has relied on the identification of recipients
of annual reports as a proxy for identifying actual users. While this would result in the
possibility of the inclusion and/or exclusion of some users, it has been argued that
recipient lists do reflect both the perception of preparers of users and those users who
have self-identified by requesting to be included on the recipient list. A further limitation
lies in the narrowing of the focus in the study to local government in Queensland. While
this impedes the generalisability of the findings, the study has identified problems in the
application of the 'user needs' framework in this one sector. Any one exception to a
model could be argued to provide sufficient basis for challenging its suitability.
The results of this research support the claims by previous researchers (Rutherford, 1992)
for further empirical work to be done to identify users of public sector annual reports.
Further research areas that could provide valuable information include the extension of
this research to determine if the same findings apply to other public sector entity types.
Moreover, the recipients of annual reports could be surveyed to determine which
particular information from the annual report they use - the descriptive/non financial
information, or the general purpose financial statements and the purposes to which they
put that information. However, Van Peursem (1990) suggests that even to focus on the
broader set of actual users' needs fails to acknowledges that these represent a subset of

22
the broader group of stakeholders to whom accountability is owed. This presents a further
challenge to future researchers.
NOTESi It should be noted that the population size classification varies depending on the previous twoclassifications. For example a small urban fringe authority does not have the same population as a smallrural remote authority.ii The authorities were promised that no specific individuals or entities would be identified in the research.iii In the case of rural authorities the officer was either the chief executive officer, the deputy chief executiveofficer or the chief executive officer’s secretary. For urban authorities the responsible officer was often amember of the public relations or communications department.iv For example one local authority placed an advertisement in the local paper to say that the annual reportswere available and only distributed annual reports by request (other than the legislatively requireddistribution) and did not maintain records of any requests. The authority indicated that very few requestswere received.v Two follow-up calls were made to each of these authorities, but the information was still not forthcoming.vi SAC 2 “Objectives of General Purpose Financial Reporting” was issued in 1990 to replace SAC 1“Objectives of Financial Reporting by Public Sector Entities”.vii “Financial Reporting by Local Governments” (Greenall, et. al.,1988), was the discussion paper releasedby AARF prior to the issuing of the accounting standard AAS 27- Financial Reporting by LocalGovernments in 1990.viii Resource recipients or their representatives - ratepayers, residents, other consumers of services andcouncillors;Resource suppliers or their representatives - ratepayers and councillors and as well lenders, creditors andsuppliers of funds, and local businesses;Oversight bodies - the media, councillors, resident associations and governmental oversight bodies.ix This group comprises groups who are not taxpayers or ratepayers, but who consume services (both fee-for-service or free).
xi A detailed break down of recipients for individual classifications of local government authorities isprovided as Appendix A.
xii Further analysis based on size, did not indicate that size of authority would be a useful criterion fordifferential reporting.

23
REFERENCES
Anthony, R.N. (1978). Financial Accounting in Nonbusiness Organizations: An Exploratory Study ofConceptual Issues, Financial Accounting Standards Board, Stamford. Atamian, R., and Ganguli, G. (1991).” The Recipients of Municipal Annual Financial Reports: ANationwide Survey”, The Government Accountants Journal, Fall pp3-21.
Australian Accounting Research Foundation (AARF) (1990a). Statement of Accounting Concepts SAC 1“Definition of the Reporting Entity”, Melbourne, Australian Accounting Research Foundation.
Australian Accounting Research Foundation (AARF) (1990b). Statement of Accounting Concepts SAC 2“Objective of General Purpose Financial Reporting”, Melbourne, Australian Accounting ResearchFoundation.
Australian Accounting Research Foundation (AARF),(1991). Australian Accounting Standard AAS 27“Financial Reporting by Local Governments”, Melbourne, Australian Accounting Research Foundation.
Australian Accounting Research Foundation (AARF) (1993). Australian Accounting Standard AAS 29“Financial Reporting by Government Departments”, Melbourne, Australian Accounting ResearchFoundation.
Australian Accounting Research Foundation (AARF) (1994). Australian Accounting Standard AAS 31“Financial Reporting by Governments”, Melbourne, Australian Accounting Research Foundation.
Broadbent, J., and Guthrie J. (1992). “Changes in the Public Sector: A Review of Recent “Alternative”Accounting Research”, Accounting Auditing & Accountability Journal, No. 2. pp. 3-31
Burton, John (1980). Public Reporting by Governmental Units: A Revised Financial Reporting Model forMunicipalities, Proceedings of the Arthur Young Professors’ Roundtable 1979. ed. David Solomon, TheCouncil of Arthur Young Professors, Reston International Center, Reston, VA
Butterworth, P., Gray, R.H., and Haslam, J. (1989). “Communication in UK Local Authority AnnualReports”, Financial Accountability & Management, Summer pp 73-87.
Carnegie, G., and Wolnizer, P. (1995). “The Financial Value of Cultural, Heritage and ScientificCollections: An Accounting Fiction”, Australian Accounting Review, Vol 5, No 1, pp31-47.
Canadian Institute of Chartered Accountants,(CICA) (1980). Financial Reporting by Governments, AResearch Study, CICA, Toronto.
Coy, D., Dixon, K., Buchanan, J.and Tower, G. (1997). "Recipients of Public Sector Annual Reports:Theory and an Empirical Study Compared", The British Accounting Review, Vol. 29, pp. 103-127.
Chua, W.F., and Sinclair, A. (1994). “Interests and the profession-state dynamic: explaining the emergenceof the Australian Public Sector Accounting Standards Board”, Business Finance and Accounting, Vol 21,No. 5, pp. 669-705.
Drebin, A., Chan, J.L., and Ferguson, L. C. (1981). Objectives of Accounting and Financial Reporting forGovernmental Units: A Research Study. NCGA Research Report Vol 1. Chicago, National Council onGovernmental Accounting.
Emy, Hugh V., & Hughes, Owen E. (1991). Australian Politics: Realities in Conflict, Second Edition,Macmillan, Melbourne.
24
English, L. (1999). “Unsubtle Differences, Editorial”, Australian Accounting Review, Vol 9, No1, p2.
English, L., and Guthrie J. (2000). Emasculating Accountability in the Name of Competition: Reform of StateAudit in Victoria, paper presented to Conference on Government Accountability and the Role of theAuditor-General, University of Alberta, Edmonton, Canada 15-16 September.
Greenall, D.T., Paul, J., and Sutcliffe, P. (1988). Financial Reporting by Local Governments, AustralianAccounting Research Foundation, Melbourne.
Guthrie, J. (1998). “Application of Accrual Accounting in the Australian Public Sector – Rhetoric orReality?”, Financial Accountability & Management, 14 (1) February, pp. 1-19.
Hay, D. (1994).“Who Uses Public Sector External Reports? An Exploration”, Accounting Forum, March,Vol.17 No. 4 pp. 47-65.
Hood, C. (1991). “A Public Management for All Seasons”, Public Administration, Vol. 69 Spring, pp. 3 –19.
Institute of Municipal Management website http://www.parklane.com.au/councils/6609000.htm
JCPA, (1989). Joint Committee of Public Accounts Guidelines for Departmental Annual Reports, Report304, Parliament of Australia, November.
Jones, D.B., Scott R.B., Kimbro, L., and Ingram, R. (1985). “The Needs of Users of GovernmentalFinancial Reports”, Government Accounting Standards Board.
Kloot, L. and Martin, J. (2000). Local Government Accountability: Explaining Differences, presented at theEuropean Accounting Conference, April, Munich.
McGregor, W. (1999). “The Pivotal Role of Accounting Concepts in the Development of Public SectorAccounting Standards”, Australian Accounting Review, Vol. 9, No. 1, pp 3 – 8. Ma, R., and Mathews R. (1993).“Financial Reporting by Government Departments: ED 55 – A DissentingView,” Australian Journal of Corporate Law, Vol. 3, No. 1. pp. 67 – 88.
Mayston, D. (1992). “ Financial Reporting in the Public Sector and the Demand for Information”,Financial Accountability & Management, Vol. 8, No. 4, Winter, pp. 317 – 324.
Micallef, F., Sutcliffe, P., and Dougherty, P. (1994). Financial Reporting by Governments”, AustralianAccounting Research Foundation, Melbourne.
Micallef, F. (1997). “Financial Reporting by governments: the big picture”, Charter, Vol. 68 No. 1 pp.50 –51.
Mignot, H., and Dolley C. (1996). “Public Sector Accounting Reform: Responses of Users to AAS 29”,Accounting Association of Australia and New Zealand Conference.
Mignot, H., and Dolley C. (2000). “Are AAS 29 Financial Statements Useful?" Accounting ResearchJournal, Vol. 13, No. 1 pp. 51-61.
Milazzo, C. (1992). ‘Annual Reports: Impediments to Their Effective Use as Instruments ofAccountability’, Australian Journal of Public Administration, Vol. 15(1), March, pp. 35-41.

25
PAC (Public Accounts Committee of NSW) 1996. The truth, the whole truth and nothing but the truth?Annual Reporting in the NSW Public Sector, NSW Government Printer, Report No. 95, March.
PAEC (Public Accounts and Estimates Committee) 1999. Report on the Inquiry into Annual Reporting inthe Victorian Public Sector, Government Printer for the State of Victoria, May.
Pollitt, C. (1990). Managerialism and the Public Services:The Anglo-American Experience, BasilBlackwell, London.
Rutherford, B.A. (1992). “ Developing a Conceptual Framework for Central Government FinancialReporting, intermediate Users and Indirect Control”, Financial Accountability and Management, Vol.8 No.4 Winter, pp. 265 –280.
Ryan, C. (1998). “The Introduction of Accrual Reporting Policy in the Australian Public Sector: AnAgenda-setting explanation”, Accounting, Auditing & Accountability, Vol. 11, Iss. 5 pp518-539.
Ryan, C., Stanley, T., and Nelson, M. (2001). "Accountability Disclosures by Queensland LocalGovernment Councils: 1997-1999", School of Accountancy working paper series, Queensland Universityof Technology, Brisbane.
Sinclair, A. (1995). "The Chameleon of Accountability: Forms and Discourses", Accounting, Organisationsand Society, Vol 20 No 2/3, pp 219-237.
Sutcliffe, P. (1985). Financial Reporting in the public sector- a framework for analysis and identificationof issues, AARF, Melbourne.
Taylor, D.W. and Rosair, M. (2000). The Effects of Participating Parties, the Public and Size onGovernment Departments’ Accountability Disclosures in Annual Reports”, Accounting Accountability &Performance, Vol. 6, No. 1, pp 77-97.
Van Peursem, K. (1990). A definition for public sector accountability, Discussion Paper No. 105,Department of Accountancy, Massey University, Palmerston North.
Walker, R.G. (1989). “Should there be common standards for the public and private sectors” AustralianSociety of Accountants Government Accounting Research Lecture, ASA, Melbourne.
Walker, R.G. (1995). “Public Sector Consolidated Financial Statements,” UNSW School of AccountingWorking Paper Series (Sydney).
Wanna, John, O’Faircheallaigh, Ciaran, and Weller, Patrick (1992). Public Sector Management inAustralia, Macmillan, Melbourne.
Zimmerman, J. (1977). "The Municipal Accounting Maze: An Analysis of Political Incentives", Journal ofAccounting Research, Supplement 1977, pp. 107-155.

26
APPENDIX A
Distribution of Annual Reports by Queensland Authorities
LocalGovernment
AuthorityType
Councillors
no
Internalusers
no
Otherresourceprovider
no
Otherrecipientsof services
no
O’sightbodies
no
Residents&
ratepayersno
Othercouncils
no
Total
no
Urban MetropolitanMedium
9 9 3 85 29 40 175
Urban MetropolitanVery Large
11 15 1 6 13 55 112 213
Urban RegionalSmall
38 31 10 67 23 52 30 251
Urban RegionalMedium
44 30 6 91 66 139 106 482
Urban RegionalLarge
21 38 11 14 17 38 139
Urban RegionalVery Large
15 12 6 22 4 22 81
Urban FringeSmall
5 5 1 2 8 21
Urban FringeMedium
19 32 19 27 47 7 151
Urban FringeLarge
19 22 4 11 27 27 110
Urban FringeVery Large
14 14 4 42 6 50 130
Total Urban 195 208 34 355 211 457 293 1753Rural AgriculturalVery Large
121 70 16 21 32 61 22 343
Rural AgriculturalLarge
67 31 9 5 16 29 157
Rural AgriculturalMedium
36 13 7 8 19 83
Rural AgriculturalSmall
44 13 4 11 17 89
Rural RemoteLarge
147 72 32 4 37 81 10 383
Rural RemoteMedium
152 54 36 2 39 53 131 467
Rural RemoteSmall
39 8 10 11 25 40 133
Rural Remote ExtraSmall
5 1 1 2 5 14
Rural SignificantGrowth
79 42 7 2 42 44 19 235
Total Rural 693 304 122 34 198 334 222 1904Total Urban &Rural 885 512 156 389 409 791 515 3657
Top Related