


Languages
Pages
Legal

2Q 2015 INVESTOR UPDATE
August 2015

Some of the statements in this presentation constitute “forward-looking statements” about Sunoco LP
(“SUN”), Energy Transfer Partners, L.P. (“ETP”) and their respective affiliates that involve risks,
uncertainties and assumptions, including, without limitation, our discussion and analysis of our financial
condition and results of operations. These forward-looking statements generally can be identified by
use of phrases such as “believe,” “plan,” “expect,” “anticipate,” “intend,” “forecast” or other similar words
or phrases in conjunction with a discussion of future operating or financial performance. Descriptions of
SUN’s, ETP’s and their respective affiliates’ objectives, goals, targets, plans, strategies, costs,
anticipated capital expenditures, expected cost savings and potential acquisitions are also forward-
looking statements.
These statements represent present expectations or beliefs concerning future events and are not
guarantees. Such statements speak only as of the date they are made, and we do not undertake any
obligation to update any forward-looking statement. Further, although we expect that ETP will contribute
further assets to SUN in the future, ETP is under no obligation to offer additional assets to SUN, and
there is no guarantee that either party will be able to agree to any future contributions on economically
acceptable terms or at all.
We caution that forward-looking statements involve risks and uncertainties and are qualified by
important factors that could cause actual events or results to differ materially from those expressed or
implied in any such forward-looking statements. For a discussion of these factors and other risks and
uncertainties, please refer to SUN’s and ETP’s filings with the Securities and Exchange Commission
(the “SEC”), including those contained in SUN’s 2014 Annual Report on Form 10-K and Quarterly
Reports on Form 10-Q which are available at the SEC’s website at www.sec.gov.
2
FORWARD-LOOKING STATEMENTS
This presentation includes certain non-GAAP financial measures as defined under SEC Regulation G.
A reconciliation of those measures to the most directly comparable GAAP measures is provided in the
appendix to this presentation. We define EBITDA as net income before net interest expense, income
tax expense and depreciation and amortization expense. Adjusted EBITDA further adjusts EBITDA to
reflect certain other non-recurring and non-cash items. Distributable cash flow represents Adjusted
EBITDA less cash interest expense, cash tax expense, maintenance capital expenditures, and other
non-cash adjustments.
This presentation also includes information regarding the consolidated retail marketing segment of
ETP, which includes the combined assets and operations of SUN, Sunoco, Inc. (R&M) (“Sunoco”) and
Susser Holdings Corporation (“Susser”). On July 14, 2015, SUN and certain affiliates of ETP entered
into a contribution agreement, pursuant to which SUN will acquire Susser. The transaction closed on
July 31, 2015. Although ETP has indicated it intends to contribute the retail and marketing assets of
Sunoco to SUN in a series of “drop down” transactions, ETP does not have a contractual obligation to
do so. SUN does not currently hold, or derive income or cash flows from, Sunoco’s assets and the
completion of any of proposed drop down transactions involving Sunoco’s assets remain subject to
market conditions, negotiations of terms and ETP and SUN board and special/conflicts committees’
approvals. There can be no assurances that such transactions will be completed within the timeframe
set forth herein or at all. Accordingly, statements referring to ETP’s business and operations on a
‘combined’ or ‘consolidated’ basis should be understood to refer to ETP’s retail marketing segment in
its entirety, rather than the assets, business or operations of SUN, individually.
3
NON-GAAP MEASURES AND EXPLANATORY NOTE REGARDING PRESENTATION SCOPE AND FORMAT
4
KEY INVESTMENT HIGHLIGHTS
Leading Position in
an Attractive
Industry
Strong Track Record
of Stable Cash
Flows
Diversified Business
and Geography
Mitigate Risk and
Volatility
Strong and
Experienced
Management Team
with a Proven Track
Record of Success
Supportive and
Dedicated General
Partner
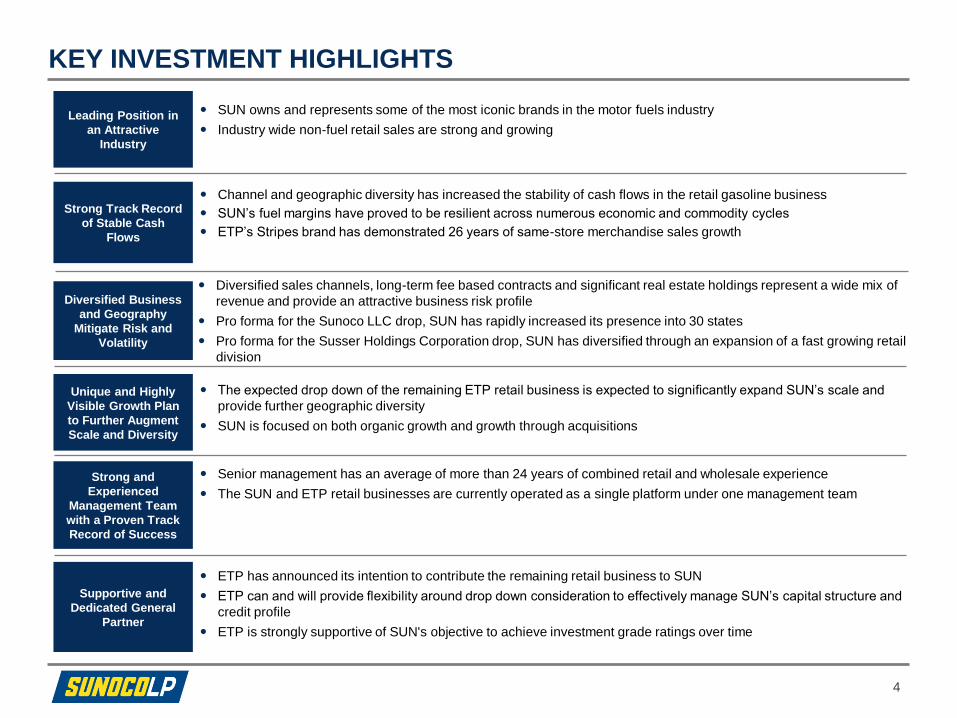
SUN owns and represents some of the most iconic brands in the motor fuels industry
Industry wide non-fuel retail sales are strong and growing
Channel and geographic diversity has increased the stability of cash flows in the retail gasoline business
SUN’s fuel margins have proved to be resilient across numerous economic and commodity cycles
ETP’s Stripes brand has demonstrated 26 years of same-store merchandise sales growth
Diversified sales channels, long-term fee based contracts and significant real estate holdings represent a wide mix of
revenue and provide an attractive business risk profile
Pro forma for the Sunoco LLC drop, SUN has rapidly increased its presence into 30 states
Pro forma for the Susser Holdings Corporation drop, SUN has diversified through an expansion of a fast growing retail
division
Senior management has an average of more than 24 years of combined retail and wholesale experience
The SUN and ETP retail businesses are currently operated as a single platform under one management team
ETP has announced its intention to contribute the remaining retail business to SUN
ETP can and will provide flexibility around drop down consideration to effectively manage SUN’s capital structure and
credit profile
ETP is strongly supportive of SUN's objective to achieve investment grade ratings over time
Unique and Highly
Visible Growth Plan
to Further Augment
Scale and Diversity
The expected drop down of the remaining ETP retail business is expected to significantly expand SUN’s scale and
provide further geographic diversity
SUN is focused on both organic growth and growth through acquisitions

THE SUN TRANSFORMATION IS WELL UNDERWAY
5
August 29, 2014: ETP acquired Susser Holdings (“Susser”), announced plan to drop
Susser and Sunoco Inc. businesses into SUN
September 25, 2014: SUN closed a new 5-year, $1.25 billion Credit Facility. April 10, 2015:
SUN amended its Credit Facility and expanded aggregate credit commitments from $1.25
billion to $1.5 billion
October 1, 2014: SUN acquired Mid-Atlantic Convenience Stores from ETP in the first of
the drop downs in a transaction valued at ~$768 million
October 21, 2014: SUN launched an equity offering of 9.1 million common units (incl.
underwriters’ overallotment option) raising a net $406 million
December 16, 2014: SUN acquired Honolulu-based Aloha Petroleum for approximately
$267 million in cash
April 1, 2015: SUN acquired a 31.58% equity interest in Sunoco LLC (the entity that owns
Sunoco’s legacy fuel distribution business) from ETP for ~$816 million, which was
primarily funded utilizing net proceeds from a $800 million senior notes offering
July 31, 2015: SUN acquired 100% of the outstanding capital stock of Susser Holdings
Corporation from ETP for ~$1.9 billion, funded through equity to ETP, borrowings under
its revolving credit facility and the proceeds of a senior notes offering

SUN (1) MACS /
Tigermarket
Aloha
Petroleum, Ltd.
31.58% of
Sunoco LLC
Susser Holdings
Corp
SUN Today
Date August 29,
2014
October 1,
2014
December 16,
2014
April 1, 2015 July 31, 2015
Description Wholesale fuel
distribution
Retail
network and
wholesale
fuel
distribution
Leading gasoline
retailer and c-
store chain in
Hawaii with a
wholesale fuel
distribution
business and 6
fuel terminals
Legacy
Sunoco
wholesale fuel
distribution
business
Retail convenience
store operator,
wholesale
consignment sales,
and transportation
operations business
Retail motor fuel,
wholesale fuel
distribution,
convenience stores,
supply & trading,
racing fuels and
terminals
Geography Primarily
Texas
Maryland,
DC Metro,
Virginia and
Nashville
Hawaii 26 states
across the
Eastern U.S.
Texas, Oklahoma, and
New Mexico
30 States from Maine
to Hawaii
Transaction GP of SUN (1)
was acquired
by ETP on
August 29,
2014
Drop down Third party
acquisition
Drop down Drop down
SIGNIFICANT DROP DOWN AND ACQUISITION ACTIVITY DRIVING STRATEGIC GROWTH AT SUN…
SUN successfully completed three drop downs from ETP and the acquisition of Aloha
Petroleum in the past 10 months
(1) The ticker symbol SUSP was changed to SUN on October 21, 2014.
6

Additional drop down inventory remaining at ETP consists of legacy Sunoco retail marketing and
68.42% of Sunoco LLC fuel distribution businesses expected to be dropped by end of 2016
(1) Based on year ended 12/31/14, pro forma results for combined SUN which includes 12 months of MACS, Aloha Petroleum and 31.58% of Sunoco LLC.
(2) Based on LTM 6/30/15, pro forma results for combined SUN which includes 12 months of MACS, Aloha Petroleum and 31.58% of Sunoco LLC.
(3) Includes company owned / company operated, company owned / dealer operated, dealer and distributor operated.
(4) Excludes affiliated sites supplied by SUN.
7
… WITH A DIVERSE PLATFORM FOR FUTURE GROWTH
LTM 6/30/15
Merchandise Sales ($MM):
Businesses: One of the Largest
and Most Diversified
Fuel Distribution and
Marketing Platforms
in the U.S.
Total Sites (6/30/15): (3) 6,762
Drop #3: Susser HoldingsCurrent SUN
LTM 6/30/15 Motor
Fuel Sales (MM Gallons):
Wholesale & Retail Motor Fuel
Convenience Stores
Supply & Trading
Racing Fuels
Terminals
Wholesale & Retail Motor Fuel
Convenience Stores
$208 (2)
2,403 (4) 764
2,957(2) 7,770
SUN Pro Forma
Locations: 30 States From Hawaii to Maine
$1,314 $2,073
1,234
FYE 12/31/14 Adjusted
EBITDA ($MM): $307 (1) $161 N/A
Wholesale & Retail
Motor Fuel
Convenience Stores
Supply & Trading
Racing Fuels
3,595
3,579
$551
--
Additional Potential
Future Growth
92%
8%
Retail Wholesale
30%
4%66%
Retail Fuel
Wholesale Fuel
Merch & Other C-Store
$1,142
$1,271
$ 1,437 $1,488
$1,540
$1,661
$1,792 $1,883
$1,970
$1,000
$1,200
$1,400
$1,600
$1,800
$2,000
2006 2007 2008 2009 2010 2011 2012 2013 2014
8
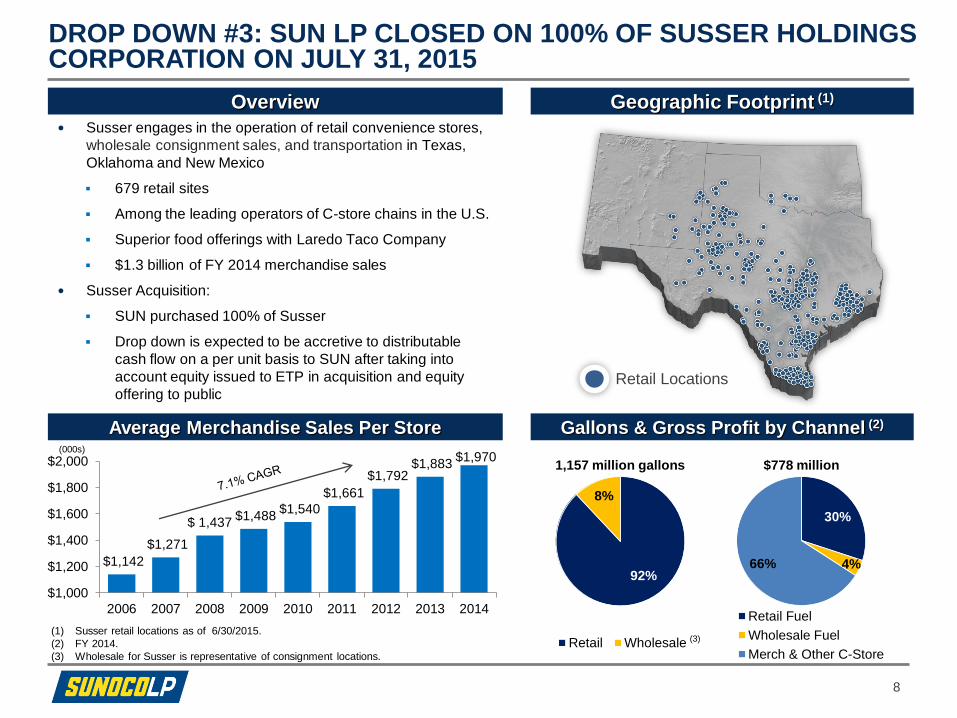
DROP DOWN #3: SUN LP CLOSED ON 100% OF SUSSER HOLDINGS CORPORATION ON JULY 31, 2015
Susser engages in the operation of retail convenience stores,
wholesale consignment sales, and transportation in Texas,
Oklahoma and New Mexico
679 retail sites
Among the leading operators of C-store chains in the U.S.
Superior food offerings with Laredo Taco Company
$1.3 billion of FY 2014 merchandise sales
Susser Acquisition:
SUN purchased 100% of Susser
Drop down is expected to be accretive to distributable
cash flow on a per unit basis to SUN after taking into
account equity issued to ETP in acquisition and equity
offering to public
Gallons & Gross Profit by Channel (2)Average Merchandise Sales Per Store
Geographic Footprint (1)Overview
(000s)
Retail Locations
(1) Susser retail locations as of 6/30/2015.
(2) FY 2014.
(3) Wholesale for Susser is representative of consignment locations.
1,157 million gallons $778 million
(3)

9
DROP DOWN #2: SUN LP CLOSED ON 31.6% OF SUNOCO LLC ON APRIL 1, 2015
Sunoco LLC is primarily engaged in the wholesale distribution of motor
fuels across more than 26 states throughout the East Coast and Southeast
regions of the U.S. from Maine to Florida and from Florida to Louisiana
Sunoco LLC’s business includes the distribution of motor fuels to:
Sunoco, Inc. (R&M) for resale at its approximately 440 company-
operated Sunoco and APlus branded convenience stores and other
retail fuel outlets
Approximately 870 Sunoco branded dealer locations
Wholesale distributors of branded fuel to an additional approximately
3,670 independently operated Sunoco-branded third party retail fuel
outlets
Sunoco LLC also supplies wholesale motor fuel to approximately 400
other commercial customers on a spot or short-term, contract basis
Current drop down plan:
SUN purchased 31.6% of Sunoco LLC
Closed on April 1, 2015
Drop down is accretive to distributable cash flow to SUN
Gross Profit by Channel (2)
(1) Reflects all sites supplied by Sunoco LLC, including those operated by Sunoco Inc.
(2) LTM 6/30/15 results for 31.6% of Sunoco LLC.
Gallons Sold by Customer (2)
21%
22%45%
12% Sunoco Inc. CompanyOperated
Contracted BrandedDealers
Branded WholesaleDistributor
Commercial Customers
Geographic Footprint (1)
89%
11%
Wholesale Fuel
Rent

10
Dealer / Distributor
Operated
Company Operated
Hawaii
6 SUN Terminals
Site Count as of June 30, 2015
SUN Sites
(SUN + MACS /
Tiger + Aloha +
31.58% Sunoco LLC)
SusserAssets Held at
ETP(1) Total
Coop 155 679 440 1,274
Third Party 2,248 85 3,155 5,488
Total Sites 2,403(2) 764 3,595 6,762
ETP has One of the Largest and Most Diversified Fuel Distribution and Marketing Platforms in the U.S.
(1) Includes 68.42% of Sunoco LLC and legacy Sunoco Retail (Company Operated) sites which represents future drop down inventory, currently part of ETP’s Retail Marketing
Segment.
(2) Does not include affiliated sites which are supplied by SUN.
SIGNIFICANT ADDITIONAL SCALE OPPORTUNITY FOR SUN
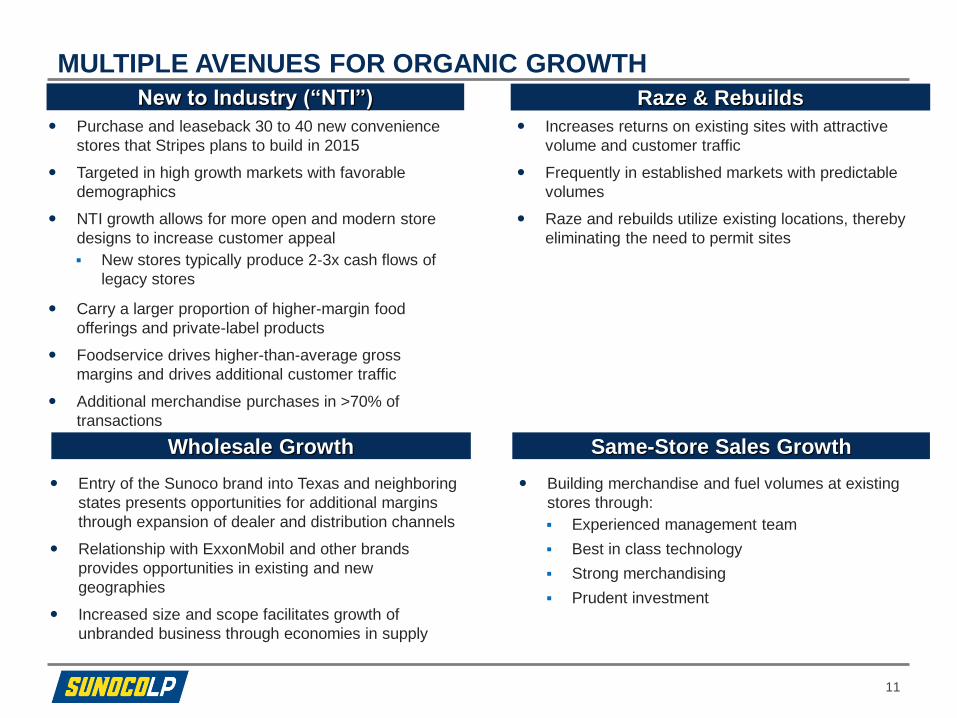
MULTIPLE AVENUES FOR ORGANIC GROWTH
Raze & Rebuilds
Same-Store Sales Growth
Building merchandise and fuel volumes at existing
stores through:
Experienced management team
Best in class technology
Strong merchandising
Prudent investment
Increases returns on existing sites with attractive
volume and customer traffic
Frequently in established markets with predictable
volumes
Raze and rebuilds utilize existing locations, thereby
eliminating the need to permit sites
Wholesale Growth
New to Industry (“NTI”)
Purchase and leaseback 30 to 40 new convenience
stores that Stripes plans to build in 2015
Targeted in high growth markets with favorable
demographics
NTI growth allows for more open and modern store
designs to increase customer appeal
New stores typically produce 2-3x cash flows of
legacy stores
Carry a larger proportion of higher-margin food
offerings and private-label products
Foodservice drives higher-than-average gross
margins and drives additional customer traffic
Additional merchandise purchases in >70% of
transactions
Entry of the Sunoco brand into Texas and neighboring
states presents opportunities for additional margins
through expansion of dealer and distribution channels
Relationship with ExxonMobil and other brands
provides opportunities in existing and new
geographies
Increased size and scope facilitates growth of
unbranded business through economies in supply
11

SUN WILL TARGET PRUDENT GROWTH VIA ACQUISITIONS
SUN will continue to look to opportunistically acquire strong performing retail and
wholesale businesses / assets in attractive markets
We evaluate potential acquisitions through the following criteria:
Financial hurdles
Geography
Market margin history
Supply opportunities / advantages
Quality of the operations / real estate
Opportunities for synergies with our existing business
C-store offerings, brand opportunities
Platform for additional growth opportunities
Attractive balance to underlying gasoline prices
12
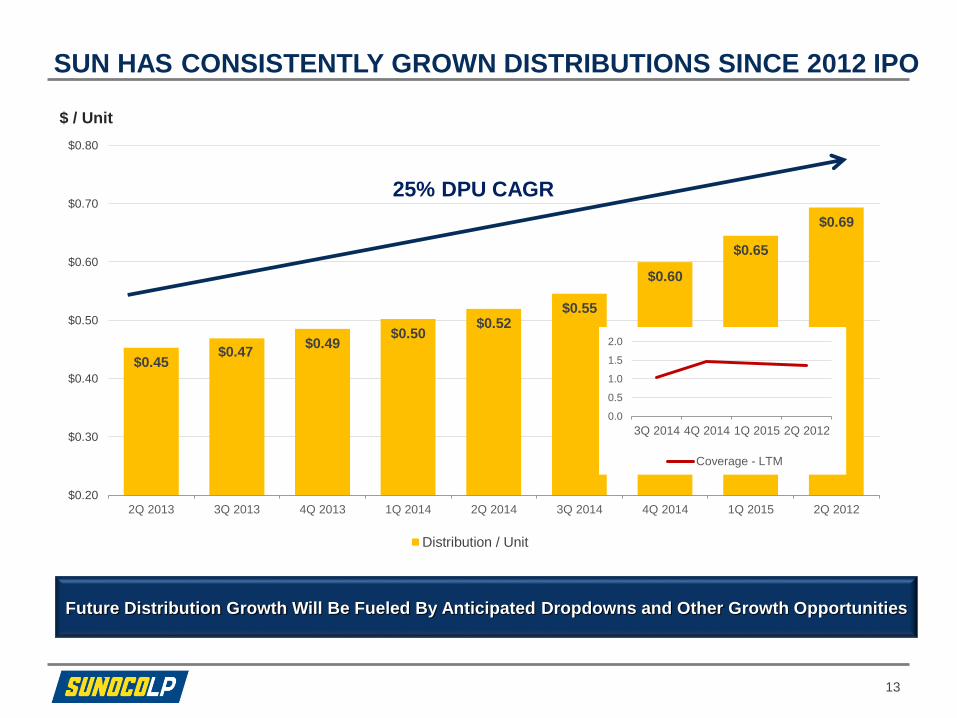
$0.45$0.47
$0.49$0.50
$0.52$0.55
$0.60
$0.65
$0.69
$0.20
$0.30
$0.40
$0.50
$0.60
$0.70
$0.80
2Q 2013 3Q 2013 4Q 2013 1Q 2014 2Q 2014 3Q 2014 4Q 2014 1Q 2015 2Q 2012
Distribution / Unit
SUN HAS CONSISTENTLY GROWN DISTRIBUTIONS SINCE 2012 IPO
13
Future Distribution Growth Will Be Fueled By Anticipated Dropdowns and Other Growth Opportunities
25% DPU CAGR
$ / Unit
0.0
0.5
1.0
1.5
2.0
3Q 2014 4Q 2014 1Q 2015 2Q 2012
Coverage - LTM

SUN LP CAPITAL STRUCTURE & LIQUIDITY
Historical 6/30/15 As Adjusted 6/30/15 (1)
Current capital structure designed to provide leverage-driven growth and access to
liquidity for M&A opportunities
14
Cash $ 63 $ 63
Debt
$1.5 Billion Revolver 725 886
6.375% Senior Notes Due 2023 800 800
5.5% Senior Notes Due 2020 - 600
Other Debt 183 183
Total Debt 1,708 2,470
Market Capitalization(2) 1,299 2,695
Total Capitalization 3,007 5,164
Net Debt 1,645 2,407
Total Liquidity $ 827 $ 663
Revolver Size $ 1,500 $ 1,500
Revolver Utilization (%) 49% 60%
2014 Pro Forma Adjusted EBITDA $ 307 $ 468
Net Debt / 2014 PF Adjusted EBITDA 5.4x 5.1x
Total Debt / Total Capitalization (%) 57% 48%
(1) As Adjusted reflects the drop down of Susser Holdings Corporation
(2) Based on 8/7/2015 closing price
($ in Millions)

30
50
70
90
110
130
150
0
5
10
15
20
25
30
SUN PRO FORMA WHOLESALE AND RETAIL MARGINS ARE RESILIENT THROUGH COMMODITY CYCLES
15
Note: Wholesale Margin includes Affiliated Margins and reflects existing SUN business pro forma for acquisition of 31.58% of Sunoco LLC. Pro Forma SUN Retail Margins
include Susser for all periods shown, and both MACS and Aloha Retail Margins for periods under ETP ownership.
WTI ($/bbl) Susser (cents/gal) Pro Forma SUN Retail Margins (cents/gal) Wholesale Margin (cents/gal)
2006 2007 2008 2009 2010 2011 2012 2013 2014
$/bblCents/gal

24%
27%
42%
7%
Gross Profit Contribution By Channel (LTM 6/30/15)
(1) Pro Forma results for combined SUN which includes twelve months of MACS, Aloha Petroleum, and 31.58% of Sunoco LLC.
(2) Pro Forma results for combined SUN which includes twelve months of MACS, Aloha Petroleum, 31.58% of Sunoco LLC, and Susser.
DIVERSIFIED LINES OF BUSINESS GENERATE A PORTFOLIO OF STABLE CASH FLOWS…
16
Total = $1,314 million
18%
59%
9%
13%
2%
Retail Fuel Wholesale Fuel Merch & Other C-Store Rent Other Fuel
Total = $582 million
Current SUN (1) SUN Pro Forma (2)
16%
58%
13%
13%
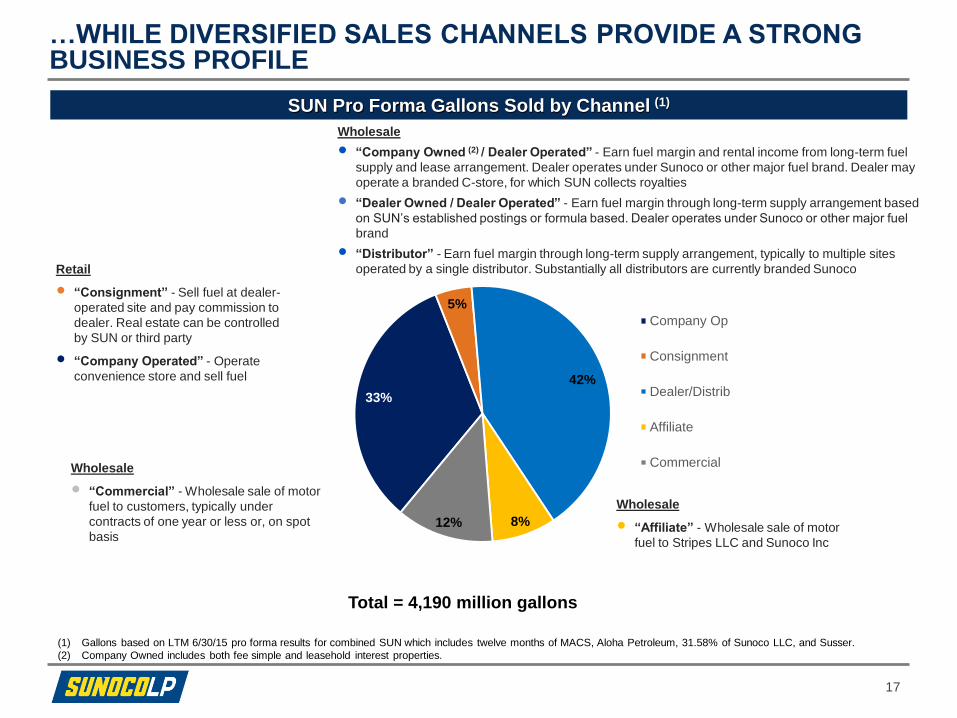
17
SUN Pro Forma Gallons Sold by Channel (1)
Wholesale
“Company Owned (2) / Dealer Operated” - Earn fuel margin and rental income from long-term fuel
supply and lease arrangement. Dealer operates under Sunoco or other major fuel brand. Dealer may
operate a branded C-store, for which SUN collects royalties
“Dealer Owned / Dealer Operated” - Earn fuel margin through long-term supply arrangement based
on SUN’s established postings or formula based. Dealer operates under Sunoco or other major fuel
brand
“Distributor” - Earn fuel margin through long-term supply arrangement, typically to multiple sites
operated by a single distributor. Substantially all distributors are currently branded Sunoco
(1) Gallons based on LTM 6/30/15 pro forma results for combined SUN which includes twelve months of MACS, Aloha Petroleum, 31.58% of Sunoco LLC, and Susser.
(2) Company Owned includes both fee simple and leasehold interest properties.
…WHILE DIVERSIFIED SALES CHANNELS PROVIDE A STRONG BUSINESS PROFILE
Retail
“Consignment” - Sell fuel at dealer-
operated site and pay commission to
dealer. Real estate can be controlled
by SUN or third party
“Company Operated” - Operate
convenience store and sell fuel
Wholesale
“Affiliate” - Wholesale sale of motor
fuel to Stripes LLC and Sunoco Inc
Wholesale
“Commercial” - Wholesale sale of motor
fuel to customers, typically under
contracts of one year or less or, on spot
basis
9%
Total = 4,190 million gallons
33%
5%
42%
8%12%
Company Op
Consignment
Dealer/Distrib
Affiliate
Commercial

24 3252
122
97
161
468
2011 2012 2013 Actual2014
Pro Forma 2014w/
MACS & Aloha, Sunoco LLC,
& Susser
679 679 679 679
656 656 656
1,666 1,666
1,157
1,335
3,001
4,158
2014Sun LP Only
Pro Forma 2014 w/MACS & Aloha
Pro Forma 2014 w/MACS & Aloha and
Sunoco LLC
Pro Forma 2014 w/MACS & Aloha,Sunoco LLC, &
Susser
Gallons Sold (MM)Adjusted EBITDA ($MM)
18
ORGANIC GROWTH, ACQUISITIONS AND DROP DOWNS HAVE MEANINGFULLY INCREASED CASH FLOW, SCALE AND DIVERSITY
(2)
(1) 2013 was first full year of SUN operations, prior results reflect predecessor operations.
(2) Based on actual FYE 2014 results which include four months of MACS and two weeks of Aloha Petroleum.
(3) Based on FYE 2014 pro forma results for combined SUN which includes twelve months of MACS, Aloha Petroleum, 31.58% of Sunoco LLC, and Susser.
(4) Reflects SUN third party dealer and commercial sales only.
(5) Based on FYE 2014 pro forma results for combined SUN which includes twelve months of MACS and Aloha Petroleum.
(6) Based on FYE 2014 pro forma results for combined SUN which includes twelve months of MACS, Aloha Petroleum, and 31.58% of Sunoco LLC.
(1) (3) (5) (6) (3)
SUN MACS & Aloha 31.58% Sunoco LLC Susser SUN MACS & Aloha 31.58% Sunoco LLC Susser
210
(4)
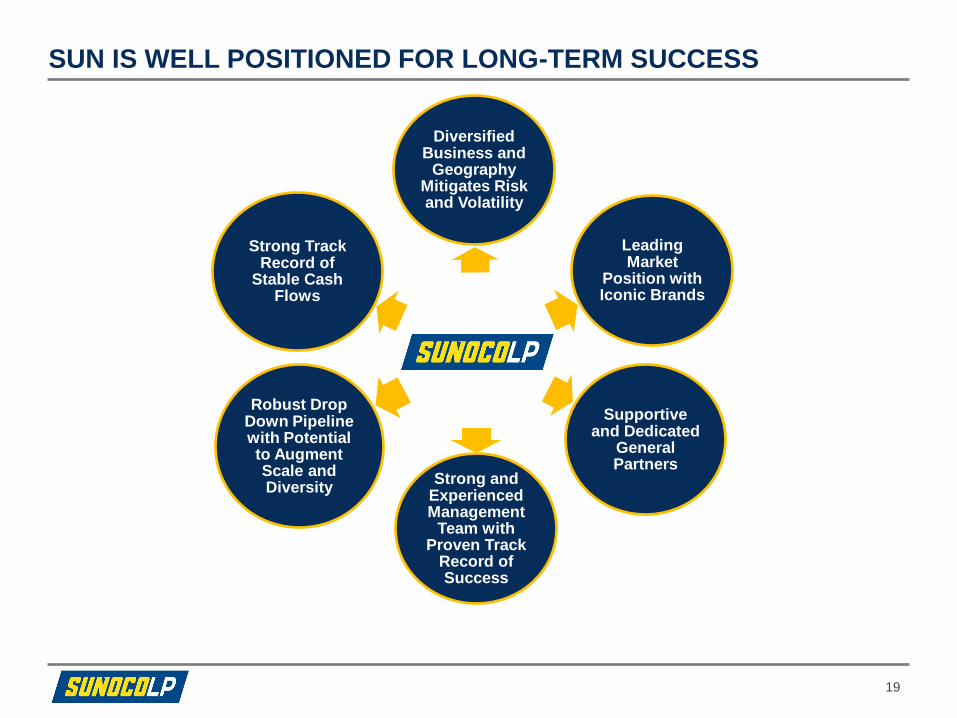
19
Diversified Business and
Geography Mitigates Risk and Volatility
Leading Market
Position with Iconic Brands
Supportive and Dedicated
General Partners
Strong and Experienced Management
Team with Proven Track
Record of Success
Robust Drop Down Pipeline with Potential to Augment Scale and Diversity
Strong Track Record of
Stable Cash Flows
SUN IS WELL POSITIONED FOR LONG-TERM SUCCESS
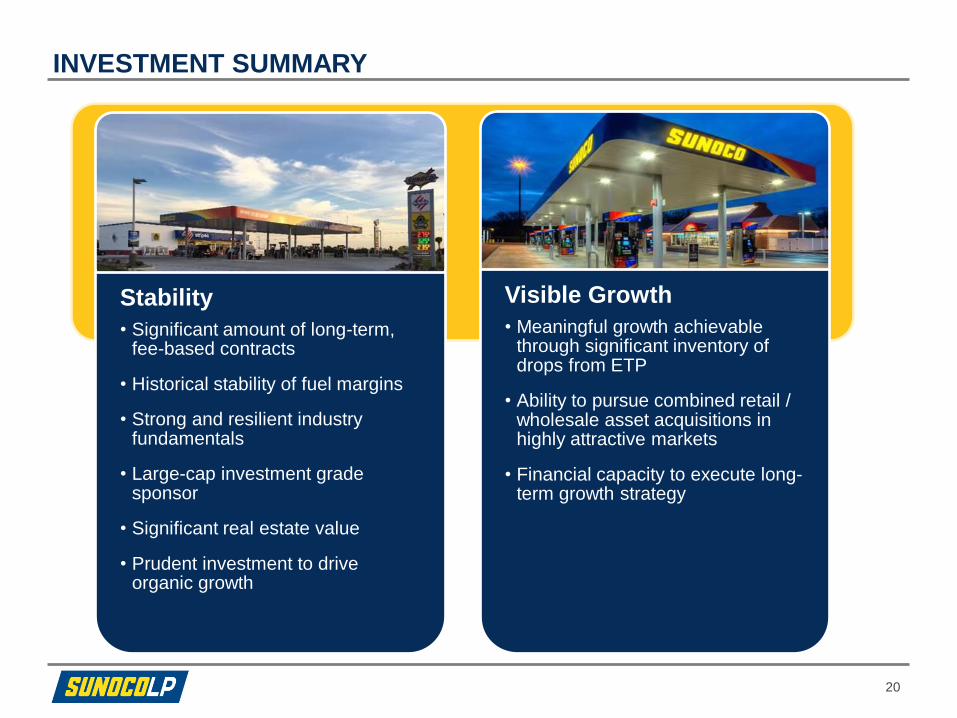
INVESTMENT SUMMARY
20
Stability
• Significant amount of long-term, fee-based contracts
• Historical stability of fuel margins
• Strong and resilient industry fundamentals
• Large-cap investment grade sponsor
• Significant real estate value
• Prudent investment to drive organic growth
Visible Growth
• Meaningful growth achievable through significant inventory of drops from ETP
• Ability to pursue combined retail / wholesale asset acquisitions in highly attractive markets
• Financial capacity to execute long-term growth strategy
APPENDIX
21
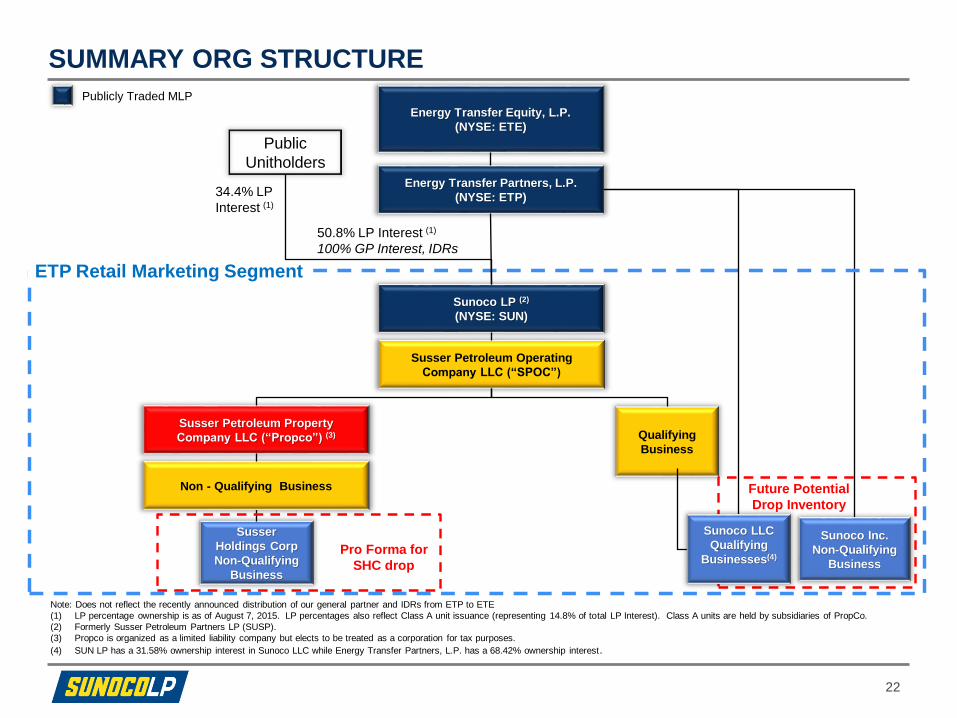
Energy Transfer Partners, L.P.
(NYSE: ETP)
Energy Transfer Equity, L.P.
(NYSE: ETE)
Publicly Traded MLP
Sunoco Inc.
Non-Qualifying
Business
Susser
Holdings Corp
Non-Qualifying
Business
Future Potential
Drop Inventory
Sunoco LP (2)
(NYSE: SUN)
50.8% LP Interest (1)
100% GP Interest, IDRs
Note: Does not reflect the recently announced distribution of our general partner and IDRs from ETP to ETE
(1) LP percentage ownership is as of August 7, 2015. LP percentages also reflect Class A unit issuance (representing 14.8% of total LP Interest). Class A units are held by subsidiaries of PropCo.
(2) Formerly Susser Petroleum Partners LP (SUSP).
(3) Propco is organized as a limited liability company but elects to be treated as a corporation for tax purposes.
(4) SUN LP has a 31.58% ownership interest in Sunoco LLC while Energy Transfer Partners, L.P. has a 68.42% ownership interest.
22
Susser Petroleum Operating
Company LLC (“SPOC”)
Susser Petroleum Property
Company LLC (“Propco”) (3) Qualifying
Business
Public
Unitholders
34.4% LP
Interest (1)
Non - Qualifying Business
ETP Retail Marketing Segment
SUMMARY ORG STRUCTURE
Pro Forma for
SHC drop
Sunoco LLC
Qualifying
Businesses(4)
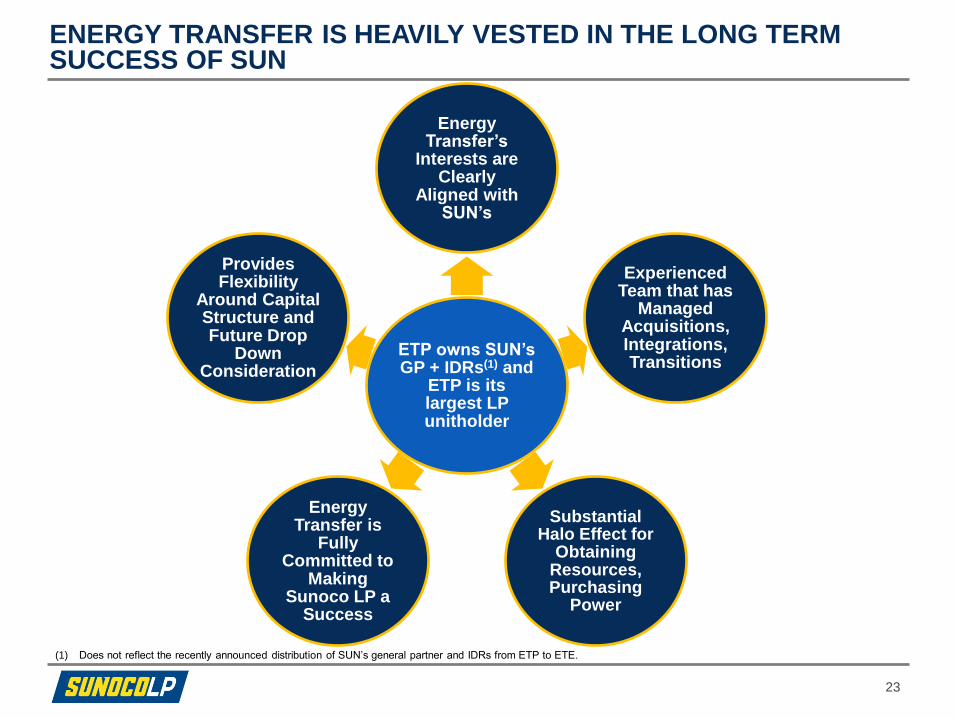
ENERGY TRANSFER IS HEAVILY VESTED IN THE LONG TERM SUCCESS OF SUN
23
ETP owns SUN’s GP + IDRs(1) and
ETP is its largest LP unitholder
Energy Transfer’s
Interests are Clearly
Aligned with SUN’s
Experienced Team that has
Managed Acquisitions, Integrations, Transitions
Substantial Halo Effect for
ObtainingResources, Purchasing
Power
Energy Transfer is
Fully Committed to
Making Sunoco LP a
Success
Provides Flexibility
Around Capital Structure and Future Drop
Down Consideration
(1) Does not reflect the recently announced distribution of SUN’s general partner and IDRs from ETP to ETE.
Q2 2015 UPDATE
24
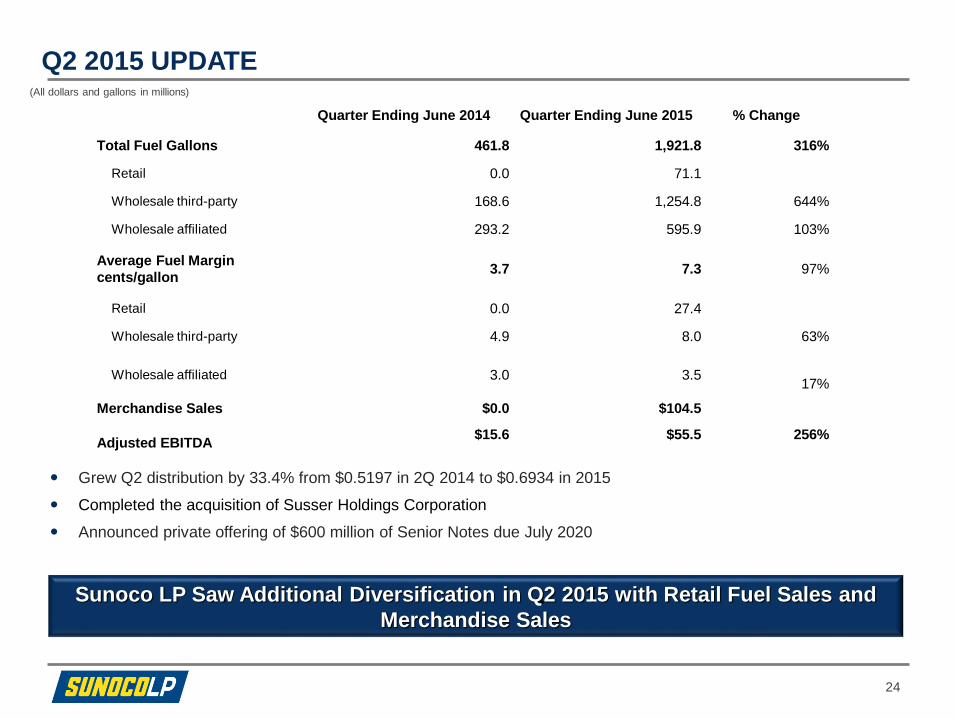
Grew Q2 distribution by 33.4% from $0.5197 in 2Q 2014 to $0.6934 in 2015
Completed the acquisition of Susser Holdings Corporation
Announced private offering of $600 million of Senior Notes due July 2020
(All dollars and gallons in millions)
Quarter Ending June 2014 Quarter Ending June 2015 % Change
Total Fuel Gallons 461.8 1,921.8 316%
Retail 0.0 71.1
Wholesale third-party 168.6 1,254.8 644%
Wholesale affiliated 293.2 595.9 103%
Average Fuel Margin
cents/gallon3.7 7.3 97%
Retail 0.0 27.4
Wholesale third-party 4.9 8.0 63%
Wholesale affiliated 3.0 3.517%
Merchandise Sales $0.0 $104.5
Adjusted EBITDA$15.6 $55.5 256%
Sunoco LP Saw Additional Diversification in Q2 2015 with Retail Fuel Sales and
Merchandise Sales
SUSSER HOLDINGS CORPORATION TRANSACTION OVERVIEW
25
On July 14, 2015 SUN entered into a contribution agreement with Energy Transfer Partners, L.P.
and certain of its subsidiaries (collectively, “ETP”) to acquire 100% of the outstanding capital stock
of Susser Holdings Corporation (“Susser”) (the “Susser Acquisition”)
Includes ~679 retail locations in Texas, New Mexico and Oklahoma operated under the
Stripes® and Sac-N-PacTM brands offering merchandise, food service, motor fuel and other
services
SUN funded the Susser Acquisition with 50% equity (1) and 50% cash. Cash portion was funded
through borrowings under SUN’s revolving credit facility and the proceeds from a senior notes
offering
The Susser Acquisition is highly accretive to Sunoco LP:
Significantly increased scale through the addition of ~679 retail locations
Diversification through an expansion of a fast growing retail division
Provides platform for attractive organic growth initiatives
Susser will be held in Propco (2); does not impact qualified income or MLP status
The Susser Acquisition closed on July 31, 2015
(1) Based on value of Class B units issued to ETP assuming the same value as common units and based on common unit price of $43.53 as of July 14, 2015.
(2) Susser Petroleum Property Company LLC, a wholly-owned subsidiary of SUN that will hold the Susser and SUN non-qualifying businesses.

Susser provides a platform for significant growth
Robust organic growth through new-to-industry store build program
Successful track record of acquiring growth
Trending towards larger, more profitable store layouts
Average store size is approximately 4,000 square feet
New larger store layout greater than 5,000 square feet generates 2-3x cash flow
In-house “land bank” of attractive retail store locations owned or under option, which provides pipeline for continued
store development and growth
Currently have 61 sites in the land bank which are scheduled to be built in 2016 and beyond
26
SUSSER: A PLATFORM FOR SIGNIFICANT GROWTH
Organic and Acquired Growth
Stripes Rolling Store Count
3-year cumulative annualized growth rate of Stripes locations projected to be 8.3% by year-end 2015
59% of growth is attributed to organic net new store builds
41% of growth is attributed to acquisitions
40 new locations forecasted in 2015
Represents year-over-year growth of 6.1%; highest organic growth in the business
New stores reach full cash flow run rate in 2-3 years
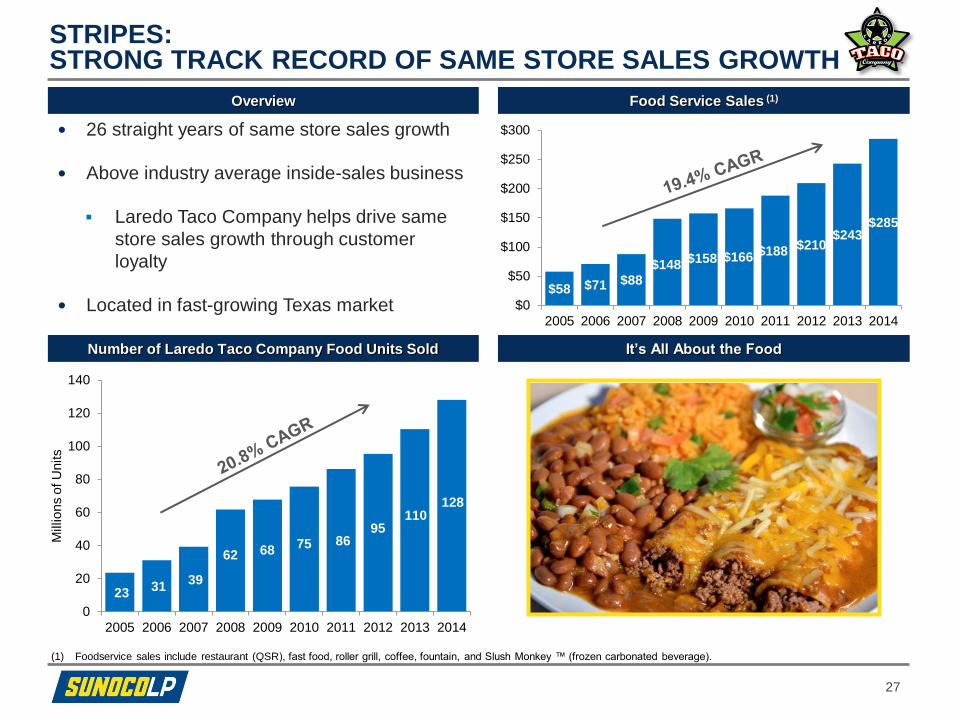
23 31
39
62 68 75 86
95 110
128
0
20
40
60
80
100
120
140
2005 2006 2007 2008 2009 2010 2011 2012 2013 2014
Millio
ns o
f U
nits
$58 $71 $88$148
$158 $166 $188 $210$243
$285
$0
$50
$100
$150
$200
$250
$300
2005 2006 2007 2008 2009 2010 2011 2012 2013 2014
STRIPES: STRONG TRACK RECORD OF SAME STORE SALES GROWTH
Overview
Number of Laredo Taco Company Food Units Sold
Food Service Sales (1)
(1) Foodservice sales include restaurant (QSR), fast food, roller grill, coffee, fountain, and Slush Monkey ™ (frozen carbonated beverage).
27
It’s All About the Food
26 straight years of same store sales growth
Above industry average inside-sales business
Laredo Taco Company helps drive same
store sales growth through customer
loyalty
Located in fast-growing Texas market
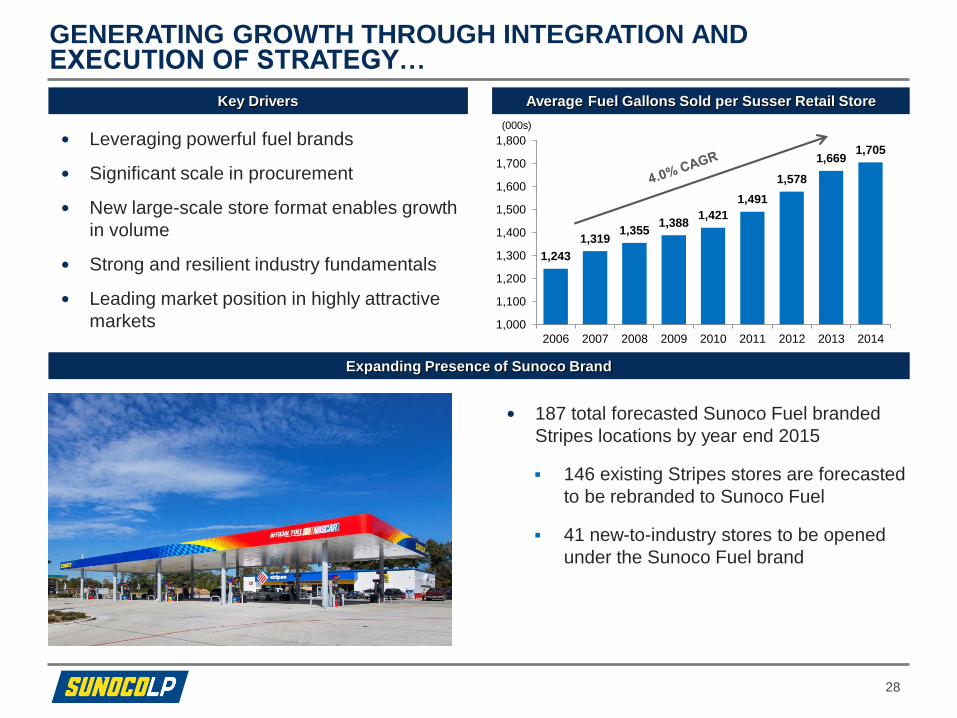
1,243
1,3191,355
1,3881,421
1,491
1,578
1,6691,705
1,000
1,100
1,200
1,300
1,400
1,500
1,600
1,700
1,800
2006 2007 2008 2009 2010 2011 2012 2013 2014
Leveraging powerful fuel brands
Significant scale in procurement
New large-scale store format enables growth
in volume
Strong and resilient industry fundamentals
Leading market position in highly attractive
markets
GENERATING GROWTH THROUGH INTEGRATION AND EXECUTION OF STRATEGY…
+3%
+2%
+2%
+5%
+6%
(000s)
+6%
+6%
Key Drivers Average Fuel Gallons Sold per Susser Retail Store
28
Expanding Presence of Sunoco Brand
187 total forecasted Sunoco Fuel branded
Stripes locations by year end 2015
146 existing Stripes stores are forecasted
to be rebranded to Sunoco Fuel
41 new-to-industry stores to be opened
under the Sunoco Fuel brand

3.2% 3.6%
5.6%
7.2%5.8%
8.0%6.6%
3.1%4.1%
5.5% 5.6%
7.8%
2.0%
-0.4%
2.0% 1.8%3.0%
4.5%
Q1 Q2 Q3 Q4 Q1 Q2 Q3 Q4 Q1 Q2 Q3 Q4 Q1 Q2 Q3 Q4 Q1 Q2
5.6% 5.8%
7.4%
5.0%
6.7%
8.0%
5.8% 5.8%
4.2%
2.2%3.4%
2.4% 1.9%
4.0% 4.4%
6.1%
3.9%3.1%
Q1 Q2 Q3 Q4 Q1 Q2 Q3 Q4 Q1 Q2 Q3 Q4 Q1 Q2 Q3 Q4 Q1 Q2
…RESULTING IN CONSISTENT GROWTH
Merchandise Same Store Sales Growth (1)
Average Retail Gallons Per Store Growth (1)
2011 2012 2013 2014 2015
29
Annual
Growth26.0% 29.0% 12.8% 22.0%
Annual
Growth21.0% 25.6% 25.0% 5.5%
2011 2012 2013 2014 2015
(1) Merchandise and retail growth representative of Susser locations

SUN LP POISED TO HOLD A LEADING POSITION IN A STABLE & THRIVING C-STORE INDUSTRY
Resilient industry growth ‒ 2014 marked the 12th consecutive year of industry-wide merchandise
sales growth
Increasing demand for convenience and improved foodservice offerings continues to drive
merchandise sales growth and profitability
Total U.S. C-Store Industry Sales and Growth
($ b
illio
ns)
Industry Stores (000s) 131 138 141 145 146 145 145 146 148 149 151
Motor Fuel SalesIn-Store / Merchandise Sales
’03–'14
CAGR
6.8%
7.4%
5.7%
30
Source: NACS 2014 State of the Industry Annual Report.
116 132 151 164 169 174 182 190 195 199 204 214
221263
344
406 409450
329386
487 501 492 483
$337
$395
$495
$569 $577
$624
$511
$576
$682$700 $696 $696
$0
$200
$400
$600
$800
2003 2004 2005 2006 2007 2008 2009 2010 2011 2012 2013 2014
153
’03 –’14 CAGR: 6.8%

Industry is highly fragmented with over
47,000 stores comprising chain operators
with greater than ten locations in their
portfolio
We continually evaluate acquisition
opportunities
Significant synergy opportunities:
Expanded buying power
Geographic synergies / diversification
G&A synergies
Capital and real estate optimization
can lead to higher returns
Platform for additional
organic/franchise growth
Leverage brand strength through
density in new markets
Ownership of ~ 128,000 Convenience
Stores Selling Fuel (1)
FRAGMENTED CONVENIENCE STORE INDUSTRY OFFERS
ATTRACTIVE ACQUISITION OPPORTUNITIES
(1)Source: NACS/Nielsen 2015 Convenience Industry Store Count.
1 Store58%
2 - 10 Stores4%
11 - 50 Stores
9%
51 - 200 Stores
5%
201 - 500 Stores
6%
501+ Stores17%
31
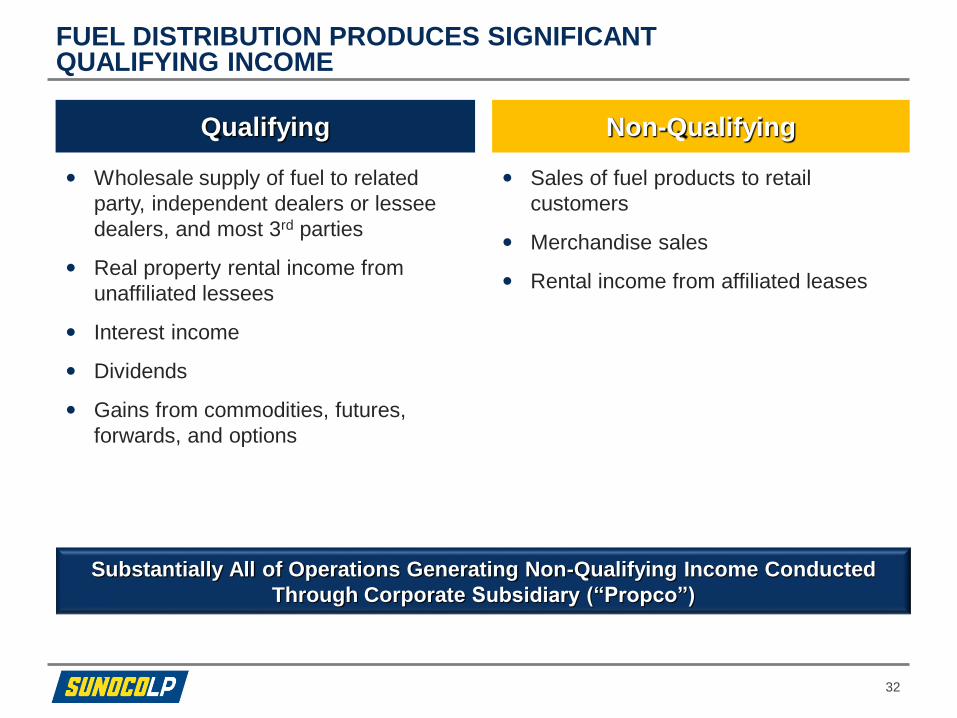
FUEL DISTRIBUTION PRODUCES SIGNIFICANT QUALIFYING INCOME
Wholesale supply of fuel to related
party, independent dealers or lessee
dealers, and most 3rd parties
Real property rental income from
unaffiliated lessees
Interest income
Dividends
Gains from commodities, futures,
forwards, and options
Qualifying
Sales of fuel products to retail
customers
Merchandise sales
Rental income from affiliated leases
Non-Qualifying
Substantially All of Operations Generating Non-Qualifying Income Conducted
Through Corporate Subsidiary (“Propco”)
32

($ in Thousands) Predecessor Successor Pro Forma Pro Forma
Fiscal Year
Ended
December 31,
2011
Fiscal Year
Ended
December 31,
2012
Fiscal Year
Ended
December 31,
2013
Combined Actual
Results for the
Twelve Months
Ended December
31, 2014
Combined
Results for the
Twelve Months
Ended December
31, 2014(1)
Fiscal Year
Ended December
31, 2014(2)
Net income (loss) $10,598 $17,570 $37,027 $57,786 $90,767 $123,215
Depreciation, amortization and accretion 6,090 7,031 8,687 26,955 57,467 108,014
Interest expense, net 324 809 3,471 14,329 28,306 77,452
Income tax expense 6,039 5,033 440 2,352 12,158 12,158
EBITDA 23,051 30,443 49,625 101,422 188,698 320,839
Non-cash unit based compensation 707 911 1,936 6,080 6,080 7,128
Unrealized gains on commodity derivatives -- -- -- (1,433) (1,433) (932)
Inventory fair value adjustments -- -- -- 13,613 13,613 189,818
Loss (gain) on disposal of assets and
impairment charge 221 341 324 2,631 3,167 717
Adjusted EBITDA $23,979 $31,695 $51,885 $122,313 $210,125 $517,570
EBITDA attributable to non-controlling interest -- -- -- -- -- (210,352)
Adjusted EBITDA attributable to Sunoco LP $23,979 $31,695 $51,885 $122,313 $210,125 $307,218
33
(1) Reflects Pro Forma results including full year of operations of MACS and Aloha Petroleum as reflected in SUN’s Current Report on Form 8-K filed March 2, 2015.
(2) Reflects Pro Forma results including full year of operations of MACS, Aloha Petroleum and Sunoco LLC.
SUN RECONCILIATION OF ADJUSTED EBITDA TO NET INCOME
34
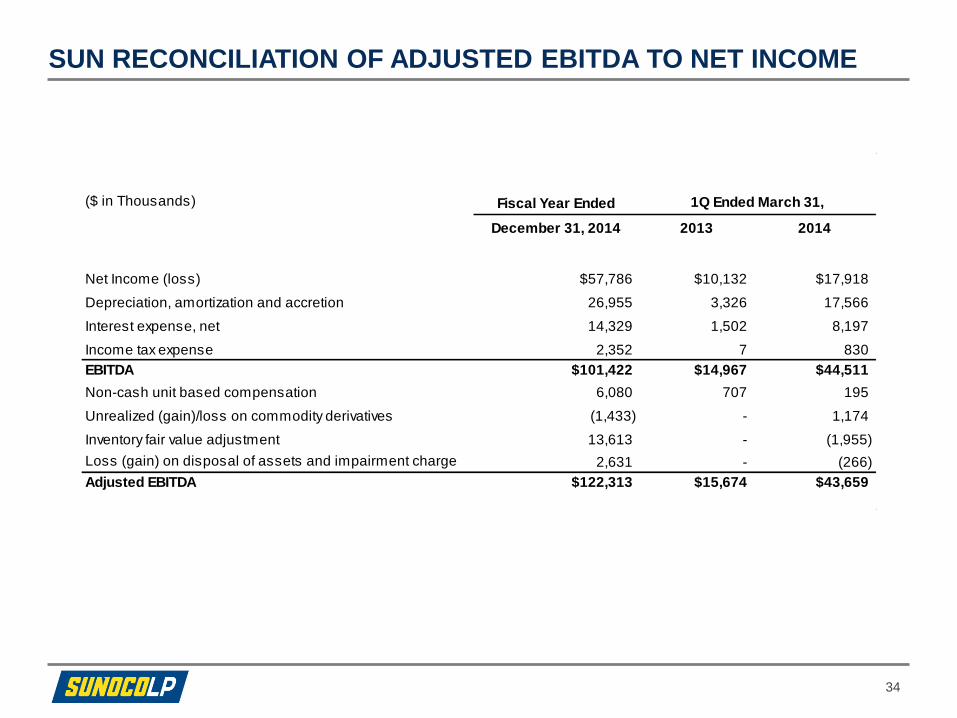
SUN RECONCILIATION OF ADJUSTED EBITDA TO NET INCOME
($ in Thousands) Fiscal Year Ended
December 31, 2014 2013 2014
Net Income (loss) $57,786 $10,132 $17,918
Depreciation, amortization and accretion 26,955 3,326 17,566
Interest expense, net 14,329 1,502 8,197
Income tax expense 2,352 7 830
EBITDA $101,422 $14,967 $44,511
Non-cash unit based compensation 6,080 707 195
Unrealized (gain)/loss on commodity derivatives (1,433) - 1,174
Inventory fair value adjustment 13,613 - (1,955)
Loss (gain) on disposal of assets and impairment charge 2,631 - (266)
Adjusted EBITDA $122,313 $15,674 $43,659
1Q Ended March 31,
35
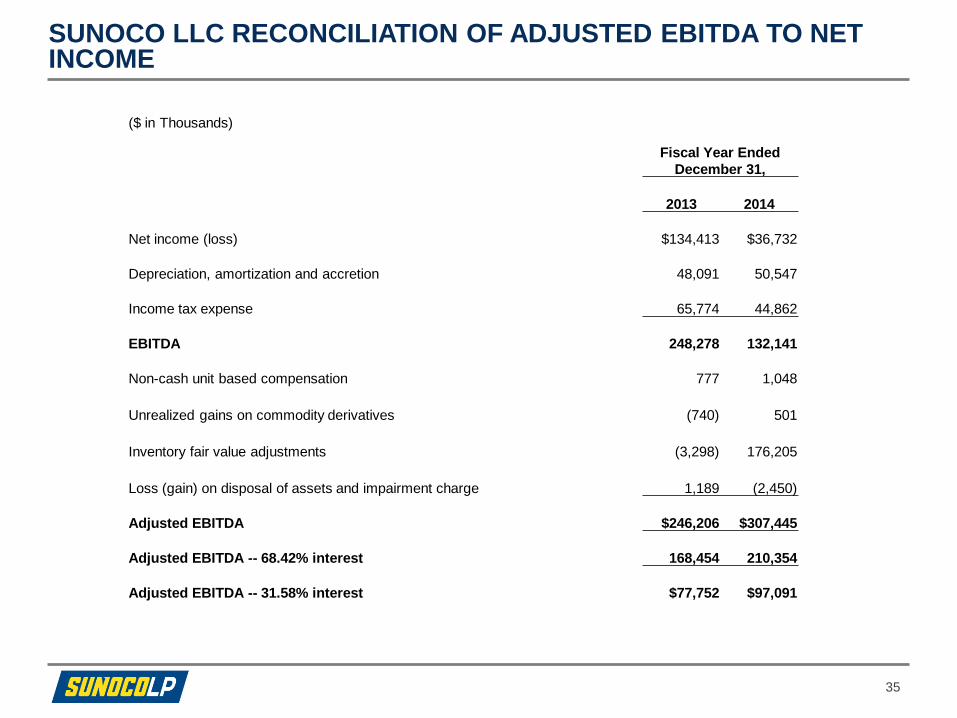
SUNOCO LLC RECONCILIATION OF ADJUSTED EBITDA TO NET INCOME
($ in Thousands)
Fiscal Year Ended
December 31,
2013 2014
Net income (loss) $134,413 $36,732
Depreciation, amortization and accretion 48,091 50,547
Income tax expense 65,774 44,862
EBITDA 248,278 132,141
Non-cash unit based compensation 777 1,048
Unrealized gains on commodity derivatives (740) 501
Inventory fair value adjustments (3,298) 176,205
Loss (gain) on disposal of assets and impairment charge 1,189 (2,450)
Adjusted EBITDA $246,206 $307,445
Adjusted EBITDA -- 68.42% interest 168,454 210,354
Adjusted EBITDA -- 31.58% interest $77,752 $97,091

(1) Reflects Pro Forma results including full year of operations of MACS and Aloha Petroleum as reflected in SUN’s Current Report on Form 8-K filed March 2, 2015.
SUNOCO LP RECONCILIATION OF NET INCOME TO ADJUSTED EBITDA
36
($ in Thousands)
Predecessor Successor Pro Forma
Fiscal Year Ended
Fiscal Year Ended
Fiscal Year Ended
Combined Actual Results
Combined Actual Results
December 31, December 31, December 31, for the Twelve Months for the Twelve Months
2011 2012 2013Ended December 31,
2014Ended December 31,
2014 (1)
Net income (loss) $10,598 $17,570 $37,027 $57,786 $90,767
Depreciation, amortization and accretion 6,090 7,031 8,687 26,955 57,467
Interest expense, net 324 809 3,471 14,329 28,306
Income tax expense 6,039 5,033 440 2,352 12,158
EBITDA 23,051 30,443 49,625 101,422 188,698
Non-cash unit based compensation 707 911 1,935 6,080 6,080
Unrealized gains on commodity derivatives -- -- -- (1,433) (1,433)
Inventory fair value adjustments -- -- -- 13,613 13,613
Loss (gain) on disposal of assets and impairment charge 221 341 324 2,631 3,167
Adjusted EBITDA $23,979 $31,695 $51,884 $122,313 $210,125

(1) Reflects combined results of the Predecessor and Successor period of Susser.
(2) To eliminate the eight months of SUN activity reflected in Susser's historical financial statements prior to September 1, 2014.
(3) To eliminate the intercompany transactions between SUN and Susser during the last four months of 2014 after the ETP Merger.
SUSSER RECONCILIATION OF NET INCOME TO ADJUSTED EBITDA
37
($ in Thousands)
Historical (1) Pro Forma Adjustments Pro Forma
Memo - EBITDA and DCF reconciliation Susser SUN (2) Adjustments (3) Susser
Fiscal Year Ended Fiscal Year Ended December 31,
2014
Fiscal Year Ended
December 31, December 31,
2014 2014
Net income 129,200 (22,510) (148,204) (41,514)
Depreciation, amortization and accretion 79,996 (10,457) (4,438) 65,101
Interest expense, net 15,194 (4,767) 32,629 43,056
Income tax expense 76,442 (218) (11,502) 64,722
EBITDA 300,832 (37,952) (131,515) 131,365
Unit compensation 20,218 - - 20,218
Loss (gain) on disposal of assets and impairment charge 1,614 39 - 1,653
Equity investee gain (129,092) - 129,092 -
Unrealized gains on commodity derivatives (8,294) - - (8,294)
Inventory fair value adjustments 15,859 - - 15,859
Adjusted EBITDA (consolidated) 201,137 (37,913) (2,423) 160,801
Adj EBITDA attributable to NCI - - - -
Adj EBITDA attributable to Sunoco LP 201,137 (37,913) (2,423) 160,801
Top Related