


Languages
Pages
Legal


ASSESSMENT OF THE PROPERTIES OF POLY (LACTIC ACID) SHEETS WITH DIFFERENT AMOUNTS
OF POST-CONSUMER RECYCLED POLY (LACTIC ACID)
By
Chaiyatas Chariyachotilert
A THESIS
Submitted to
Michigan State University
in partial fulfillment of the requirements
for the degree of
MASTER OF SCIENCE
Packaging
2011
ABSTRACT
ASSESSMENT OF THE PROPERTIES OF POLY (LACTIC ACID) SHEETS WITH DIFFERENT AMOUNTS
OF POST-CONSUMER RECYCLED POLY (LACTIC ACID)
By
Chaiyatas Chariyachotilert
The main objective of this research was to evaluate the properties of sheet containing
mechanically recycled post-consumer polylactic acid (PLA) bottle flakes blended with virgin PLA
resin. PLA bottles were flaked, cleaned, blended with virgin resin and then extruded and
thermoformed into trays. The molecular weight, physical, optical, thermal and mechanical
properties of sheet containing 0, 20, 40, 60, 80 and 100 wt.-% recycled content were evaluated.
Cleaning conditions were evaluated using response surface methodology, and conditions of 15
min, 85°C, 1 wt.-% NaOH, and 0.3 wt.-% surfactant were adopted for cleaning the PLA flake.
Virgin PLA sheet possessed superior properties to recycled sheet with statistically significant
differences at α=0.05. PLA sheets were darker and absorbed more UV light in the 260 to 285
nm range when 20% or more recycled content was added. At 40% recycled content, the sheet
had increased blue and red tones and the mechanical properties in the cross-machine direction
decreased. At 60% recycled content or above, reduction of weight average molecular weight
(Mw), tensile strength and tensile strength at yield in the machine direction (MD) were found.
At 80% recycled content, the melting temperature and modulus of elasticity in the MD
decreased. All of the sheet samples were successfully thermoformed into trays.

iii
Dedicated to my father and mother
iv
ACKNOWLEDGMENTS
I would like to acknowledge the individuals who have supported me to complete this
thesis. First, I would like to thank Dr. Rafael A. Auras for being an exceptional advisor. His
academic guidance, patient and encouragement helped me through my research. As well, I
would like to thank my co-advisor, Dr. Susan E. M. Selke. Her expertise in plastics packaging and
packaging waste methods helps me finish the thesis. I admire Dr. Auras and Dr. Selke’s
professionalism and work ethic. They have demonstrated me of how to achieve in academic
career.
I would like to thank Dr. Satish Joshi, my committee member. His professional advices
and recommendations helped me improving the quality of the thesis.
I would like to acknowledge Primo Water Corporation for the poly(lactic acid) bottles.
They are one of the most essential materials for my research. I would also like to thank
NatureWorks LLC for providing the PLA resin.
I would like to thank Dharmendra Mishara from the Statistical Consultant Center at MSU
for his support in helping me in design and run the analysis of the response surface
methodology of the cleaning processes.
I would like to recognize the support from my research group members, seniors and
friends at the School of Packaging for their advices, friendship and encouragement.
I am extremely lucky to have received the love and support from my family; especially
my mother, Sineenart Chariyachotilert, and my girlfriend, Pansa Ratanajan, for their
encouragement during my most difficult times during the research. I am also deeply grateful to

v
my uncle Lerwut Wongsarnpigoon and his family, and my cousins: Yodsanan and Jaturapon
Sanpavat for their care and support during my stay in the USA.
vi
TABLE OF CONTENTS
LIST OF TABLES .............................................................................................................................. viii
LIST OF FIGURES ............................................................................................................................... x
LIST OF ABBREVIATIONS OR SYMBOLS .......................................................................................... xii
CHAPTER 1
INTRODUCTION ............................................................................................................................... 1
Background ......................................................................................................................... 1
Objective ............................................................................................................................. 4
CHAPTER2
LITERATURE REVIEW ....................................................................................................................... 5
Poly (lactic acid), PLA .......................................................................................................... 5
PLA synthesis ....................................................................................................................... 6
Morphology and Properties .............................................................................................. 10
Industrial applications ....................................................................................................... 15
Polymer sheet extrusion ................................................................................................... 18
Polymer thermoforming ................................................................................................... 19
Degradation ...................................................................................................................... 20
Hydrolytic degradation ......................................................................................... 20
Thermal degradation ............................................................................................ 21
End of life of PLA ............................................................................................................... 22
Recycling ........................................................................................................................... 24
Raw material sources and management .............................................................. 25
Manufacturing ...................................................................................................... 28
Chemical recycling ................................................................................................ 29
Mechanical recycling ............................................................................................. 29
Markets and economics ........................................................................................ 30
Response surface methodology ........................................................................................ 30
CHAPTER 3
MATERIALS AND METHODS .......................................................................................................... 32
Introduction ...................................................................................................................... 32
Materials ........................................................................................................................... 34
Methods ............................................................................................................................ 34
Sample preparation - Flake preparation process ............................................................. 34
Experimental design for the cleaning process of the PLA flake........................................ 34
PLA sheet extrusion process ............................................................................................. 37
Sample analysis ................................................................................................................. 39
vii
Molecular weight properties ............................................................................................ 39
Physical properties ............................................................................................................ 39
Optical properties ............................................................................................................. 40
UV light .............................................................................................................................. 40
Color .................................................................................................................................. 40
Infrared ............................................................................................................................. 40
Thermal properties ........................................................................................................... 41
Heat deflection temperature ................................................................................ 41
Mechanical properties ...................................................................................................... 42
Thermoforming ................................................................................................................. 42
Statistical analysis ............................................................................................................. 42
CHAPTER 4
RESULTS AND DISCUSSION ........................................................................................................... 43
Properties of virgin resin and flake before cleaning process ........................................... 43
Thermal and molecular weight properties ........................................................... 43
Experimental design of the cleaning process for the PLA flake ....................................... 44
Extruded sample analysis .................................................................................................. 46
Molecular weight properties ............................................................................................ 46
Physical properties ............................................................................................................ 48
Density .............................................................................................................................. 48
Optical properties ............................................................................................................. 49
UV light .............................................................................................................................. 49
Color .................................................................................................................................. 52
Infrared properties ............................................................................................................ 56
Thermal properties ........................................................................................................... 61
Heat deflection temperature ................................................................................ 63
Mechanical properties ...................................................................................................... 65
Thermoforming ................................................................................................................. 67
Dimensions ........................................................................................................................ 68
CHAPTER 5
CONCLUSIONS AND RECOMMENDATIONS ................................................................................... 71
Conclusions ....................................................................................................................... 71
Future work ....................................................................................................................... 72
APPENDIX ...................................................................................................................................... 73
Molecular weight data for RSM ........................................................................................ 73
Color properties for RSM .................................................................................................. 76
REFERENCES .................................................................................................................................. 79
viii
LIST OF TABLES
Table2-1: General properties of PLA, adapted from [1] ............................................................... 12
Table2-2: Properties of IngeoTM
biopolymer 2003D PLA resin for fresh food packaging and food
service ware from NatureWorks LLC , adapted from [2] .............................................. 14
Table2-3: Properties for IngeoTM
biopolymer 7001D PLA resin for injection blow molded bottles
from NatureWorks LLC , adapted from [3] ................................................................... 15
Table2-4: Types of PLA resin from NatureWorks LLC for different applications and products ... 17
Table 2-5: Energy values for combusting MSW materials at 1000oC, adapted from [4].............. 23
Table 2-6: Residues and volatiles released during PLA combustion, adapted from [4] ............... 24
Table 3-1: Factor levels for each cleaning parameter .................................................................. 36
Table 3-2: Experimental design treatment conditions for PLA flake cleaning process ................ 36
Table 3-3: Ratios of PLA virgin resin and flake for sheet extrusion samples ................................ 38
Table 3-4: Standard and actual temperature profile for PLA extrusion ....................................... 38
Table 4-1: Thermal properties of PLA resin and PLA bottle flakes before the cleaning process . 43
Table 4-2: Molecular weights of PLA resin and PLA bottle flakes before cleaning process ......... 44
Table 4-3: Overall response surface model looking at Mn as response value ............................. 45
Table 4-4: Mn, Mw and PDI for PLA resin, flake and extruded sheet with varying percent of
virgin and recycled PLA content................................................................................... 47
Table 4-5: Density of PLA extruded sheets ................................................................................... 48
Table 4-6: Percent transmittance of UV spectra at wavelength 260,275 and 290 nm ................ 52
Table4-7: The L*, a* and b* values for PLA sheets with varying degree of percent of virgin and
recycled PLA contents .................................................................................................. 56
ix
Table 4-8: Infrared spectroscopy data with peak band assignments for PLA infrared spectra,
adapted from Auras et al [5] ........................................................................................ 57
Table 4-9: Thermal properties of PLA sheets with varying percent of virgin and recycled PLA
content ......................................................................................................................... 63
Table 4-10: Loss modulus, tan delta and onset of rubbery plateau ............................................. 65
Table4-11: Mechanical properties of PLA sheets with varying percent of virgin and recycled PLA
contents in machine direction .................................................................................... 66
Table4-12: Mechanical properties of PLA sheets with varying percent of virgin and recycled PLA
contents in cross machine direction .......................................................................... 67
Table 4-13: Thickness of PLA tray with varying percent of virgin and recycled PLA content ....... 69
Table 4-14: Dimensions of PLA tray with varying percent of virgin and recycled PLA contents .. 70
Table A-1: Molecular weight for each cleaning condition of recycling PLA flakes ....................... 73
TableA-2: L*,a* and b* values for each cleaning condition of recycling PLA flakes .................... 76
x
LIST OF FIGURES
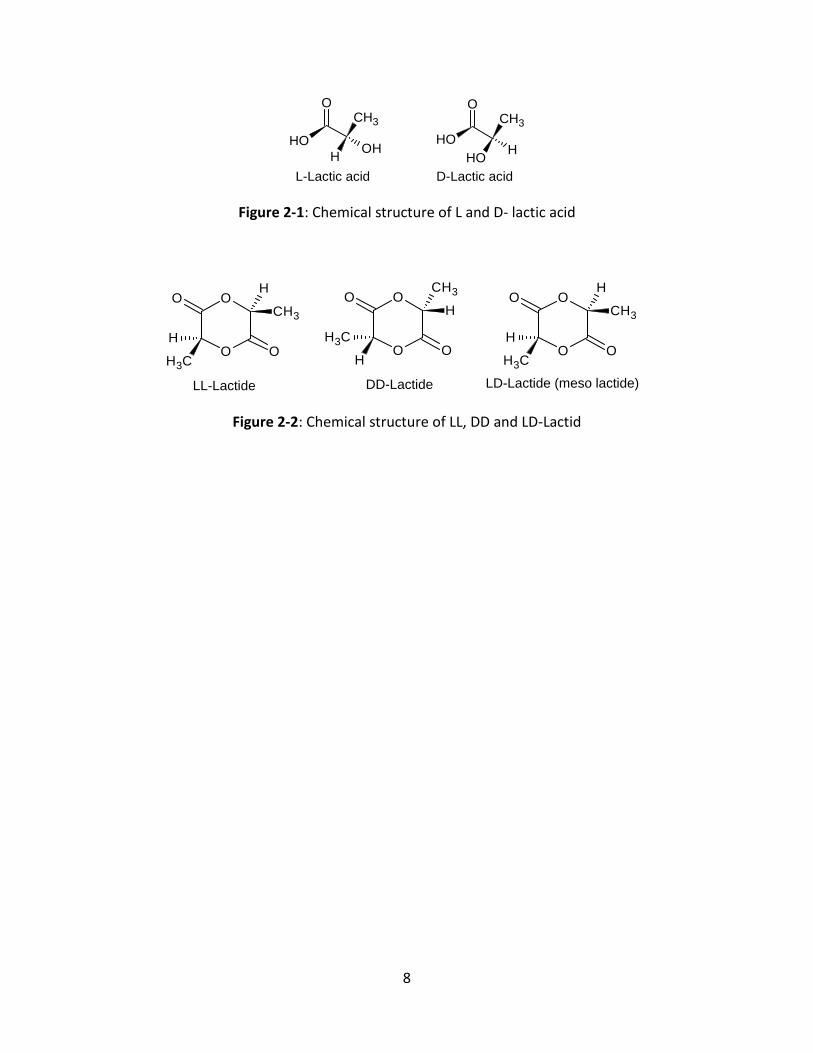
Figure 2-1: Chemical structure of L and D- lactic acid .................................................................... 8
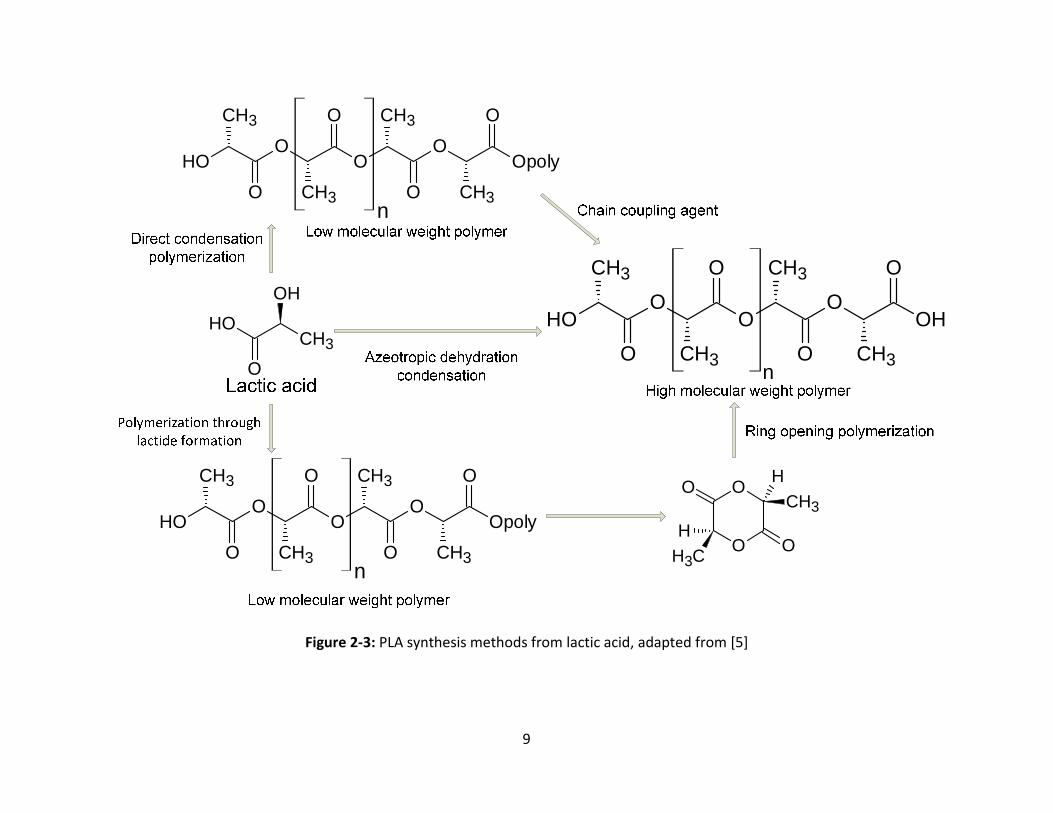
Figure 2-2: Chemical structure of LL, DD and LD-Lactid ................................................................. 8
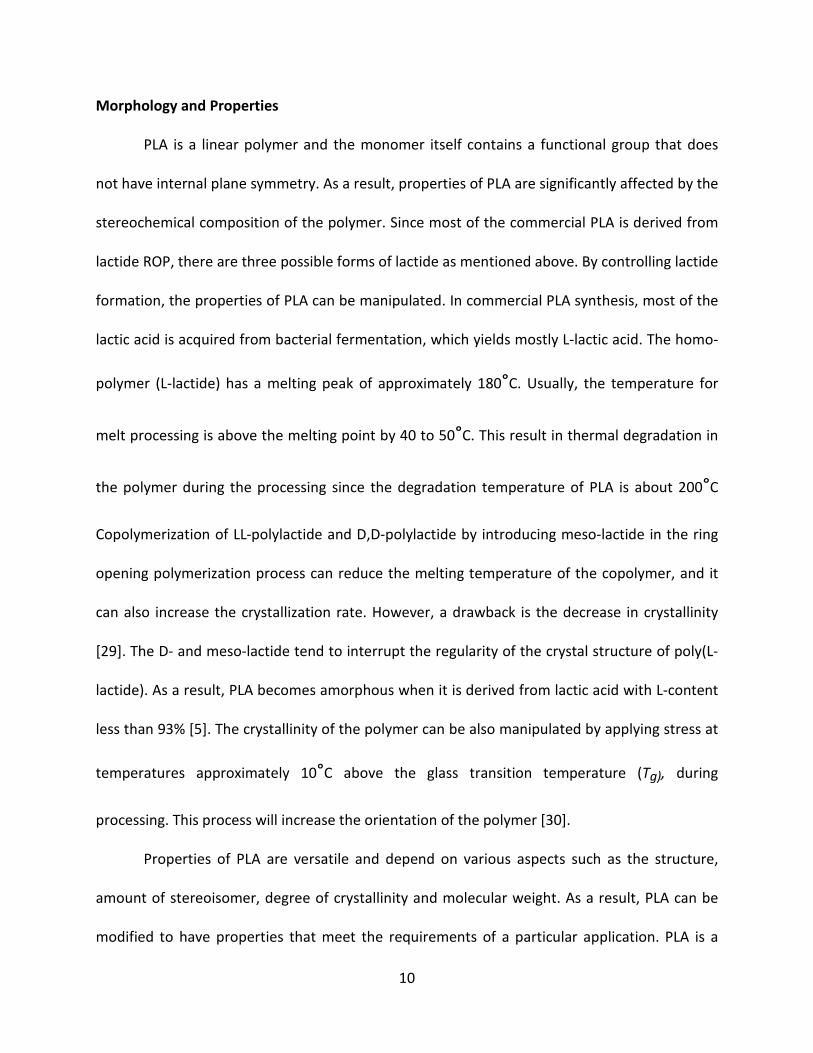
Figure 2-3: PLA synthesis methods from lactic acid, adapted from [5] ......................................... 9
Figure2-4: Total MSW generated in 2009 sorted by materials (243 million tons), adapted from
[6] .................................................................................................................................................. 27
Figure 2-5: Total MSW generation and per capita rates from 1960 to 2009, adapted from [6] . 28
Figure 3-1: Project experimental flow chart ................................................................................. 33
Figure 4-1: UV spectra of 100% virgin PLA sheet sample ............................................................. 50
Figure 4-2: UV spectra of varying PLA sheets with varying amounts of recycled contents
between 250 and 300 nm ........................................................................................... 51
Figure 4-3: L* value for the PLA sheet samples with different amounts of recycled PLA flakes . 53
Figure 4-4: a* value for the PLA sheet samples with different amounts of recycled PLA
flakes. .......................................................................................................................... 54
Figure4-5: b* value for the PLA sheet samples with different amounts of recycled PLA flakes
....................................................................................................................................... 55
Figure 4-6: FTIR spectrum of 100% virgin PLA sheet samples ...................................................... 58
Figure 4-7: FTIR spectra of PLA sheet samples from 100V, 60V and 100R .................................. 59
Figure 4-8: FTIR spectrum of 100V, 60V and 100R from 1850 to 1650 cm-1
, showing -C=O
carbonyl stretch peak at 1748 cm-1
............................................................................ 60
Figure 4-9: FTIR spectrum of 100V, 60V and 100R from 1300 to 900 cm-1
, showing -C-O- stretch
peaks at 1194, 1130 and 1094 cm-1
and –OH bend peak at 1047 cm-1
....................... 61

xi
Figure 4-10: DMA curve of 100V PLA sheet sample shown storage modulus, loss modulus and
tan delta as a function of temperature ........................................................................................ 64
Figure 4-11: Sketch of a PLA thermoformed tray (not to scale) ................................................... 68
xii
KEY TO SYMBOLS OR ABBREVIATIONS
ABBREVIATIONS
ANOVA Analysis of variance
ASTM American Society for Testing and Materials
ATR Attenuated total reflectance
CD Cross machine direction
CFR Code of federal regulations
DSC Differential scanning calorimeter
EPA US Environmental Protection Agency
FTIR Fourier transform infrared spectroscopy
HSD Honestly significant difference
HDPE High density polyethylene
IR Infrared
LSD Least significant difference
MD Machine direction
MFR Melt flow rate
MSW Municipal solid waste
NIR Near-infrared sorting system
PET Polyethylene terephthalate
PLA Poly (lactic acid)

xiii
PHBV Poly-3-hydroxy butyrate-co-3hydroxyvalerate
PBAT Polybutylene adipate-co-terephthlate
PS Polystyrene
PDI Polydispersity index
RSM Response surface methodology
ROP Ring open polymerization
THF Tetrahydrofuran
WRAP Waste Resources Action Program
xiv
SYMBOLS
100V 100% virgin PLA
80V 80% virgin PLA, 20% recycled PLA
60V 60% virgin PLA, 40% recycled PLA
40V 40% virgin PLA, 60% recycled PLA
20V 20% virgin PLA, 80% recycled PLA
100R 100% recycled PLA
α alpha (Mark–Houwink constant)
a* Radii of chromaticity
b* Radii of chromaticity
Eact Average energy of activation
∆� Color difference
ΔHc Enthalpy of crystallization
ΔH0
m Enthalpy of 100% crystalline
ΔHm Enthalpy of melting
K K (Mark–Houwink constant)
L* Lightness variable in the CIELAB system
Mw Weight average molecular weight
Mn Number average molecular weight ()
xv
Tg Glass transition temperature
Tm Melting point
Td,0 Initial decomposition temperature
χc Crystallinity
1
CHAPTER 1 INTRODUCTION
Background
Plastics are used in many applications across the world such as building and
construction materials, electronic goods, furniture, fabrics and packaging applications. Their
versatile properties such as light weight, high durability and ease of shaping are reasons for the
high demand for plastics. There are many types of plastics, and they can be modified to meet
the requirements of the end-products. Packaging applications are the largest business for
plastics. In 2009, 32% of thermoplastic resins market sales were in packaging applications
(23,391 million pounds) [7]. One of the reasons for using plastics in packaging is their light
weight (low density). It reduces the energy necessary for the distribution of packaged products.
In general, plastics are safe enough to use as a food contact packaging and in medical
applications [8]. The wide use of plastics requires a proper method for their end of life
management.
According to the EPA, plastics in municipal solid waste (MSW) within the USA increased
from less than 1% in 1960 to approximately 12% in the year 2009. Thirty million tons of plastic
wastes were generated in 2009, with the largest portion of plastic wastes categorized as
packaging containers (13 million tons) [9]. The low density of plastics (high volume but very low
weight) fills the valuable space in the landfill very quickly. In general, petroleum-based plastics
have high durability and they are non-biodegradable, making them stay intact for a very long
period of time in a landfill.
2
An alternate waste management method such as recovery is used for reducing the
wastes in the landfill. In 2008, one third of the MSW management in the US was done by
recovery, which consisted of composting or recycling the waste. According to EPA, “the
recycling rate with composting in the USA has increased from below 10 percent in 1980 to more
than 33 percent of MSW generated in 2008”. This resulted in a decrease of MSW discarded in
landfills from 89 percent of total MSW generated in 1980 to 54 percent in 2008 [10].
Composting is a method to convert organic materials into a soil-like substance or
compost by microorganisms. The compost products - humus - can be used as a nutrient
replenishment for soils and for covering the surface of landfills. Also, composting can take some
biodegradable wastes out of the landfill and increase the space for handling other MSW [11].
On the other hand, recycling is a process to transform non-valuable or non-usable waste into
new products. The function of the new valuable goods may be the same or different. Recycling
is another proper way to manage MSW. It also reduces utilization of raw materials, some of
which are obtained from non-renewable resources [10].
If MSW is sorted by product category, packaging applications are the biggest proportion
of generated MSW by weight (almost 30 percent). In 2009, approximately 48 percent of waste
in packaging and containers was recovered. Due to the wide variety of plastic types, around
14% of plastic packaging was recycled. Most of them were HDPE and PET bottles with recycling
rates of 29 and 28%, respectively. There is a large market demand for both post-consumer
resins. For example, recycled PET is a raw material for fiber, cloth, carpet and textiles and HDPE
can be recycled into new bottles. The demands for recycled post-consumer products now
exceed the available plastic waste recovered from the waste stream [9, 12].
3
Most petroleum based plastic packaging is engineered to have high durability, and good
microbial and water resistance. So, normal plastic packaging is not appreciably decomposed by
microorganisms in reasonable time frames and ends up in the landfill. Biodegradable polymers
must be able to completely degrade by microorganisms in proper environmental conditions in a
reasonably short period of time. The byproduct of this process must also be compatible with
soil, plants and animals. Biodegradable plastics also have some comparable properties with
synthetic petroleum-based plastics.
There are several biodegradable polymers such as polylactic acid (PLA), starch based
thermoplastic, poly-3-hydroxy butyrate-co-3hydroxyvalerate (PHBV) and polybutylene adipate-
co-terephthlate (PBAT) [13]. One of the promising biodegradable plastics for packaging
applications is PLA, which can be produced from renewable resources and is considered a bio-
based polymer. The base structure of PLA consists of lactic acid monomers. It can be derived
from agricultural crops such as corn, sugar cane and starch. Initially, PLA production cost was
high and it was mainly used in medical applications. However, now with the lactide ring opening
polymerization technology, PLA can be synthesized with lower cost and the resin price has
become more affordable for packaging applications. PLA is a stiff and brittle polymer that is
compostable. It has mechanical properties similar to PS. PLA is safe and can be used as food
contact packaging such as fresh produce containers or disposable cups and utensils. It can also
be fabricated into sheet and film. PLA consumption is increasing in packaging applications.
Waste management for PLA is not limited to biodegradation. PLA is also recyclable by
chemical recycling methods [14]. In chemical recycling, the post-consumer or post-industrial
4
PLA wastes are hydrolyzed at high temperature and yield lactic acid [15]. The drawbacks of
chemical recycling for PLA are that it requires expensive and complicated processes.
Mechanical recycling involving regrinding plastic wastes and reprocessing them by
conventional melt process is generally easier and cheaper than chemical recycling. However,
little is known about mechanical recycling of PLA.
Objectives
The main goal of this thesis was to compare the properties of extruded virgin PLA sheet
with PLA sheet contained varying recycled content obtained by mechanical recycling. The
following are the specific objectives:
• Evaluation of the optimal cleaning conditions to obtain clean PLA flakes from post-
consumer PLA packages.
• Evaluation of the properties of PLA sheet incorporating different proportions of
mechanically recycled PLA.
• Evaluation of the thermoformability of recycled content PLA sheet.
5
CHAPTER 2 LITERATURE REVIEW
Poly (lactic acid), PLA
The history of PLA can be traced back to 1932 when a scientist from Du Pont, Wallace
Carothers, heated lactic acid under vacuum and successfully fabricated a low molecular weight
PLA [16]. With an additional improvement, this process was patented by Du Pont in 1954 [17].
Then in 1988, Cargill Inc. planned to develop PLA to be a new commercialized product.
Eventually with a joint venture of Cargill Inc. and Dow Chemical Company, Cargill Dow LLC was
formed in 1997 and PLA was commercialized under the trade name of NatureWorksTM
,
nowadays IngeoTM
[18].
PLA polymer did not have many applications until a couple of decades ago due to
limited molecular weight, low accessibility and high cost compared with other commercial
plastics. However, PLA has good compatibility with the human body. As a result, PLA was mainly
used in medical applications such as implant parts and controlled drug release applications.
With modern polymer synthesis technology, ring open polymerization (ROP), PLA can be
produced at much lower cost [5, 16, 17, 19]. At present, PLA is used in a wide range of
applications from fabrics to dinnerware [20].
PLA is an aliphatic polyester. It is a compostable and biodegradable plastic, which is
derived from renewable resources. Normally, PLA is produced from carbohydrate based
agricultural products such as corn, potato, and cassava. In the USA, corn is used as the raw
material to produce PLA because it is cheap and abundant [18].
6
In addition to NatureWorks LLC’s PLA manufacturing plant with 140,000 metric ton
capacity in Blair, Nebraska, USA, Futerro opened a bioplastic production plant with a capacity of
producing 1,500 tons per year of PLA in April, 2010 [21]. Also Purac and Indorama Ventures PLC
plan to set up a PLA production plant in Thailand with initial capacity of 10,000 metric tons and
a maximum potential of 100,000 metric tons [22].
PLA synthesis
PLA is produced from lactic acid (2-hydroxy propionic acid). It possess two optical
isomers which are L(+) and D(-) lactic acid. It can be derived from either fermentation of
carbohydrates or chemical synthesis. In PLA synthesis, lactic acid is mainly derived from
bacterial fermentation. Corn is the main raw material for this process in the USA. The
fermentation process begins with separation of the starch from the cooked corn by grinding
and screening. Starch is then changed to sugar and bacteria such as lactobacillus are used to
converted sugar into lactic acid [5, 19, 23].
There are three major routes to produce PLA, which are direct condensation
polymerization, azeotropic dehydrative condensation and polymerization through lactide
formation or ROP [5, 19]. In direct condensation polymerization, PLA is derived by using solvent
under high vacuum and temperature. It is the least expensive method and has fewer processing
steps. However, it is not easy to produce high molecular weight polymer with this method due
to the presence of water and other byproducts [5, 18, 24, 25].
Azeotropic dehydrative condensation can provide high molecular weight PLA. This
method was commercialized by Mitsui Toatsu Chemicals in Japan. The general concept of this

7
process involves removing water from lactic acid by reducing the distillation pressure in the
vessel for 2-3 hours at 130°C. Then catalyst and diphenyl ester are added and a molecular sieve
tube is connected to the vessel. The solvent is then refluxed through the sieve for 30 – 40 hrs at
130°C. After the process, the catalyst is removed and the polymer is then passed through a
purification process [5, 26-28].
Polymerization through lactide formation or ring opening polymerization is the method
that NatureWorks LLC uses to produce commercial PLA. This method was developed by DuPont
in 1954 [28]. In this process, lactic acid is polymerized into PLA pre-polymer with low molecular
weight. Then the pre-polymer is depolymerized using a catalyst under low pressure and is
transformed to lactide. Since there are two optically active isomers for lactic acid, lactide, which
is a cyclic dimer, has three stereoisomer forms: L-L-lactide (consisting of two L-lactic acids), D-D-
lactide (consisting of two D-lactic acids) and meso-lactide (consisting of L-lactic acid and D-lactic
acid). After lactide is sorted into a low D-lactide stream, and a high D-lactide and meso-lactide
stream, high molecular weight PLA is produced by using ring opening of L-lactide. According to
Auras et al, the ring opening polymerization can be cationic using methyl
trifluoromethanesulfonic acid or trifluoromethanesulfonic acid, or anionic using the
nucleophilic reaction of an anion with the carbonyl and subsequent acyl-oxygen cleavage [5,
28].
8
OH
CH3
H
O
OH
L-Lactic acid
H
CH3
OH
O
OH
D-Lactic acid
Figure 2-1: Chemical structure of L and D- lactic acid
O O
O O
H
CH3
CH3
H
O O
O O
H
CH3
CH3
H
O O
O O
CH3
H
H
CH3
LL-Lactide DD-Lactide LD-Lactide (meso lactide)
Figure 2-2: Chemical structure of LL, DD and LD-Lactid
9
CH3OH
OH
O
OpolyO
O
O
O
O
OOH
CH3
CH3
CH3O
CH3
n
O O
O O
H
CH3
CH3
H
OHO
O
O
O
O
OOH
CH3
CH3
CH3O
CH3
n
OpolyO
O
O
O
O
OOH
CH3
CH3
CH3O
CH3
n
Figure 2-3: PLA synthesis methods from lactic acid, adapted from [5]
10
Morphology and Properties
PLA is a linear polymer and the monomer itself contains a functional group that does
not have internal plane symmetry. As a result, properties of PLA are significantly affected by the
stereochemical composition of the polymer. Since most of the commercial PLA is derived from
lactide ROP, there are three possible forms of lactide as mentioned above. By controlling lactide
formation, the properties of PLA can be manipulated. In commercial PLA synthesis, most of the
lactic acid is acquired from bacterial fermentation, which yields mostly L-lactic acid. The homo-
polymer (L-lactide) has a melting peak of approximately 180°C. Usually, the temperature for
melt processing is above the melting point by 40 to 50°C. This result in thermal degradation in
the polymer during the processing since the degradation temperature of PLA is about 200°C
Copolymerization of LL-polylactide and D,D-polylactide by introducing meso-lactide in the ring
opening polymerization process can reduce the melting temperature of the copolymer, and it
can also increase the crystallization rate. However, a drawback is the decrease in crystallinity
[29]. The D- and meso-lactide tend to interrupt the regularity of the crystal structure of poly(L-
lactide). As a result, PLA becomes amorphous when it is derived from lactic acid with L-content
less than 93% [5]. The crystallinity of the polymer can be also manipulated by applying stress at
temperatures approximately 10°C above the glass transition temperature (Tg), during
processing. This process will increase the orientation of the polymer [30].
Properties of PLA are versatile and depend on various aspects such as the structure,
amount of stereoisomer, degree of crystallinity and molecular weight. As a result, PLA can be
modified to have properties that meet the requirements of a particular application. PLA is a
11
transparent thermoplastic polymer. It is stiff and brittle. Similar to other thermoplastic
polymers, at temperatures above Tg it can be deformed. As mentioned above, the
stereochemistry affects the developed crystalline structure in the polymer [31]. PLA can be
either an amorphous or a semicrystalline polymer. The Tg of semi-crystalline PLA is
approximately 50 to 60°C and the Tm ranges from 130 to 180°C, depending on the degree of
crystallinity of the polymer and the molecular weight. Commercial PLA is normally a poly(L-
lactic acid) and poly(D,L-lactic acid) copolymer and has a semicrystalline structure with high
molecular weight (above 100 kDa) [19]. It possesses mechanical and barrier properties
comparable with polystyrene (PS) but slightly inferior to polyethylene terephthalate (PET) [1, 5].
The main problem with the mechanical properties of PLA is its brittleness, resulting in poor
impact resistance, but this can be improved by using some additives. PLA can be processed by
most conventional processing methods. However, the thermal stability is inferior to
conventional polymers used for thermoplastic applications [31]. PLA suffers from low melt
strength and tends to experience sagging and necking during extrusion. Therefore, it is difficult
to obtain PLA films through extrusion blow molding. This problem can be solved by using
additives or blending with high molecular weight polymer to increase the chain entanglement.
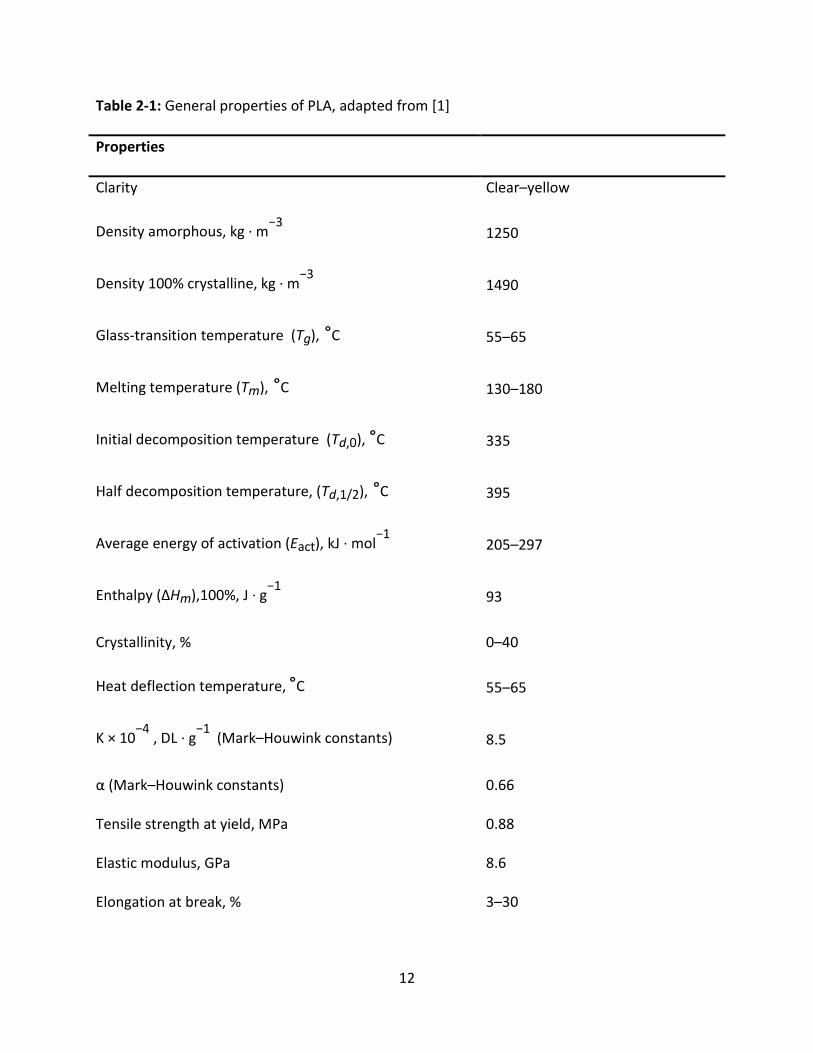
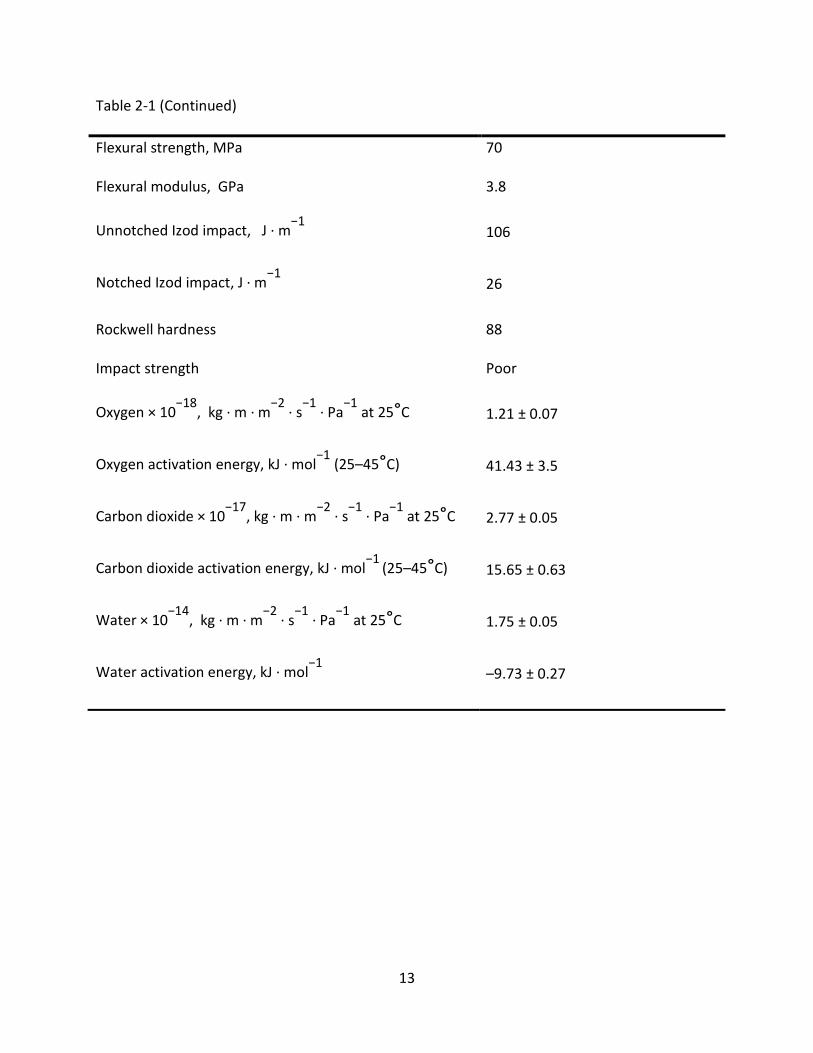
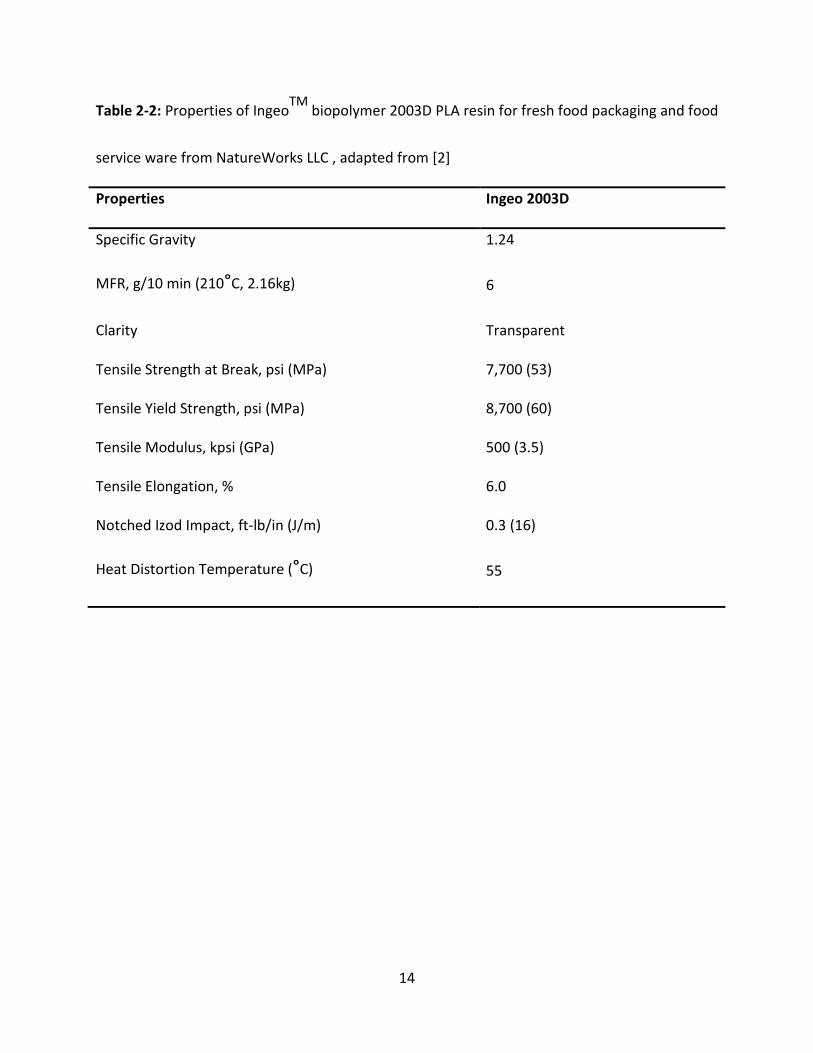
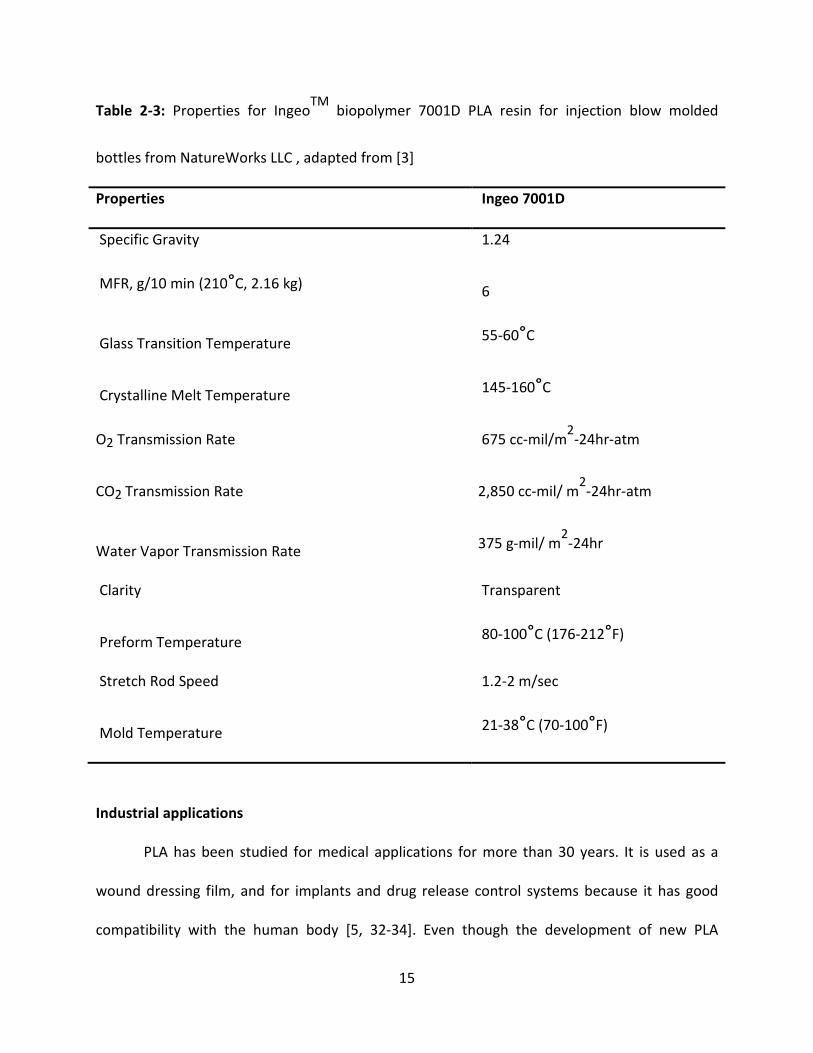
The properties of PLA have been extensively studied [1, 5, 19, 25, 28, 30, 31]. The general
properties of PLA are shown in Table 2-1, and the properties of commercial PLA resins are
shown in Table 2-2 and Table 2-3.
12
Table 2-1: General properties of PLA, adapted from [1]
Properties
Clarity Clear–yellow
Density amorphous, kg · m−3
1250
Density 100% crystalline, kg · m−3
1490
Glass-transition temperature (Tg), °C 55–65
Melting temperature (Tm), °C 130–180
Initial decomposition temperature (Td,0), °C 335
Half decomposition temperature, (Td,1/2), °C 395
Average energy of activation (Eact), kJ · mol−1
205–297
Enthalpy (ΔHm),100%, J · g−1
93
Crystallinity, % 0–40
Heat deflection temperature, °C 55–65
K × 10−4
, DL · g−1
(Mark–Houwink constants) 8.5
α (Mark–Houwink constants) 0.66
Tensile strength at yield, MPa 0.88
Elastic modulus, GPa 8.6
Elongation at break, % 3–30
13
Table 2-1 (Continued)
Flexural strength, MPa 70
Flexural modulus, GPa 3.8
Unnotched Izod impact, J · m−1
106
Notched Izod impact, J · m−1
26
Rockwell hardness 88
Impact strength Poor
Oxygen × 10−18
, kg · m · m−2
· s−1
· Pa−1
at 25°C 1.21 ± 0.07
Oxygen activation energy, kJ · mol−1
(25–45°C) 41.43 ± 3.5
Carbon dioxide × 10−17
, kg · m · m−2
· s−1
· Pa−1
at 25°C 2.77 ± 0.05
Carbon dioxide activation energy, kJ · mol−1
(25–45°C) 15.65 ± 0.63
Water × 10−14
, kg · m · m−2
· s−1
· Pa−1
at 25°C 1.75 ± 0.05
Water activation energy, kJ · mol−1
–9.73 ± 0.27
14
Table 2-2: Properties of IngeoTM
biopolymer 2003D PLA resin for fresh food packaging and food
service ware from NatureWorks LLC , adapted from [2]
Properties Ingeo 2003D
Specific Gravity 1.24
MFR, g/10 min (210°C, 2.16kg) 6
Clarity Transparent
Tensile Strength at Break, psi (MPa) 7,700 (53)
Tensile Yield Strength, psi (MPa) 8,700 (60)
Tensile Modulus, kpsi (GPa) 500 (3.5)
Tensile Elongation, % 6.0
Notched Izod Impact, ft-lb/in (J/m) 0.3 (16)
Heat Distortion Temperature (°C) 55
15
Table 2-3: Properties for IngeoTM
biopolymer 7001D PLA resin for injection blow molded
bottles from NatureWorks LLC , adapted from [3]
Properties Ingeo 7001D
Specific Gravity 1.24
MFR, g/10 min (210°C, 2.16 kg) 6
Glass Transition Temperature 55-60°C
Crystalline Melt Temperature 145-160°C
O2 Transmission Rate 675 cc-mil/m2-24hr-atm
CO2 Transmission Rate 2,850 cc-mil/ m2-24hr-atm
Water Vapor Transmission Rate 375 g-mil/ m
2-24hr
Clarity Transparent
Preform Temperature 80-100°C (176-212°F)
Stretch Rod Speed 1.2-2 m/sec
Mold Temperature 21-38°C (70-100°F)
Industrial applications
PLA has been studied for medical applications for more than 30 years. It is used as a
wound dressing film, and for implants and drug release control systems because it has good
compatibility with the human body [5, 32-34]. Even though the development of new PLA
16
synthesis methods enables production of high molecular weight PLA at a reasonably
economical cost, PLA resin is still more expensive than high density polyethylene (HDPE) or PET
[35]. However, current commodity plastics are derived from crude oil, which is a limited
resource. With the high demand for energy resources, oil prices have had high fluctuations
since 2007 [36]. Some countries need to import petroleum resources from foreign countries to
produce energy and products. On the other hand, PLA, which is produced from renewable
resources and generally produced from domestic renewable resources, can be an alternative
plastic for a number of applications. PLA is also used by many companies to claim a carbon
footprint reduction [35].
More recently, other European countries, Japan and the USA have started to use PLA for
fresh produce packaging, disposable containers, cups, packaging film, and blister packaging. PLA
is also used in agriculture film and yard bags since it is biodegradable and compostable [5, 18].
PLA is used in many types of processes such as sheet or film extrusion, injection blow molding
and thermoforming. The methods involve heating PLA either between Tg and Tm or above its
melting point. In any of these methods, a shape of softened or molten polymer is formed and
then it is cooled down to retain the polymer dimensions. In addition, each fabrication process
requires PLA with different properties so selecting the proper PLA resin for each processing
technique is also important. As mentioned, commercial PLA resin is a copolymer of LL-
polylactide and D,L-polylactide. The concentration of LL-lactide affects the properties of the
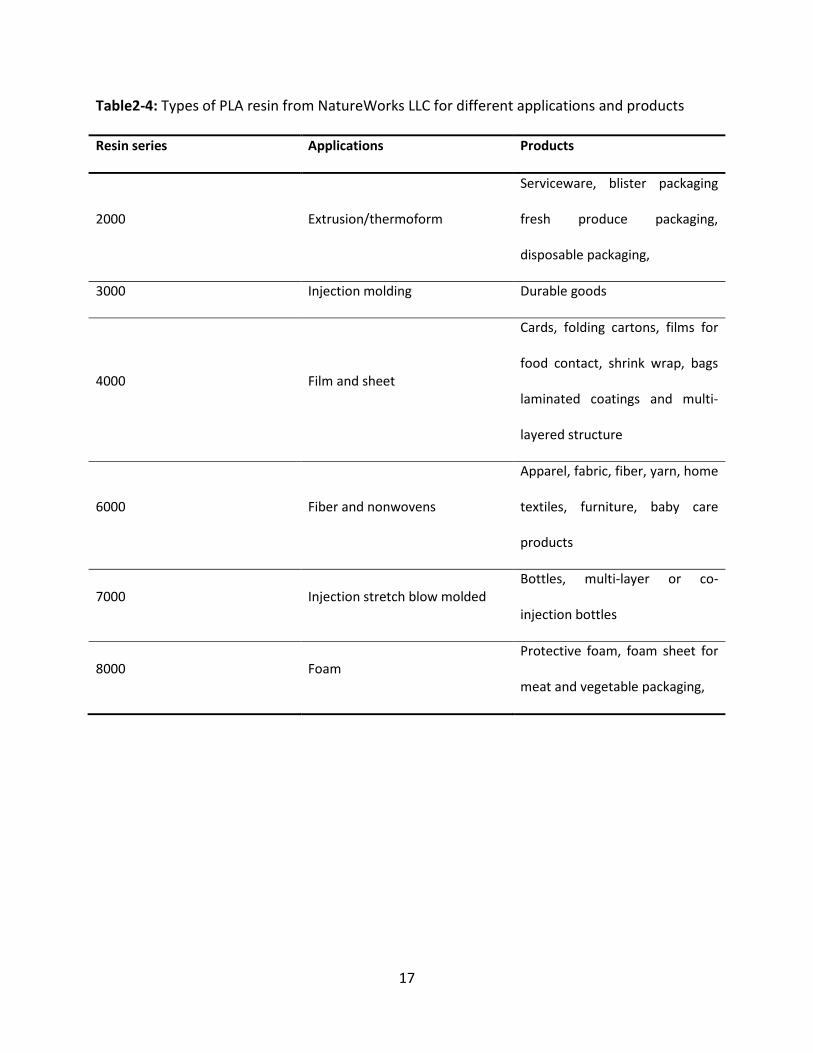
resin. Examples of NatureWorks LLC PLA resin types for each type of application are listed in
table Table2-4.
17
Table2-4: Types of PLA resin from NatureWorks LLC for different applications and products
Resin series Applications Products
2000 Extrusion/thermoform
Serviceware, blister packaging
fresh produce packaging,
disposable packaging,
3000 Injection molding Durable goods
4000 Film and sheet
Cards, folding cartons, films for
food contact, shrink wrap, bags
laminated coatings and multi-
layered structure
6000 Fiber and nonwovens
Apparel, fabric, fiber, yarn, home
textiles, furniture, baby care
products
7000 Injection stretch blow molded
Bottles, multi-layer or co-
injection bottles
8000 Foam
Protective foam, foam sheet for
meat and vegetable packaging,
18
Polymer sheet extrusion
The beginning of plastic packaging processes usually involves transforming the solid
plastic into desired shapes by using melt processing. Normally, an extruder is used to convert
plastic resins into a homogeneous melt by heating them above the melting point. The melt then
passes through a die to form a film or a sheet, or it can be delivered to other equipment such as
blow molding or injection molding machines. The basic single screw extruder usually consists of
a feeding port, an extruder barrel with a screw inside and a shaping part, which in sheet
extrusion is a die.
Plastic pellets are fed through a hopper and get into the extruder barrel via the feeding
port. The hopper can be equipped with an auger or a stirrer to help force the materials into the
extruder barrel. Some extruders contain more than one feeding port, for example for adding
fillers into a molten plastic. The extruder barrel is where the melting of the pellets takes place
[8, 37].
The barrel is hollow with a helical screw inside. The function of the screw is to melt the
plastics and to pump molten solution to the die. The screw can be divided into three sections:
the solids feeding section, the melting or compression section and the metering section. In the
solid feeding section, plastic pellets are received from the feeding port and transferred further
inside the barrel to the second part of the screw for melting. In the compression section, the
screw channels are gradually decreased to compress the pellets and also force them against the
barrel wall. The friction between the plastic and the barrel and the shearing between pellets
provide the heat for melting. An external heater and a cooling system are commonly provided
to control the processing temperature. The last part of the screw is the metering section where
19
the flight depth of the screw is shallow and constant. This section is designed to deliver a
uniform stream of molten polymer to the shaping device at the desired rate [8, 37].
The extrusion processes for plastic film and sheet are identical. In general, the molten
polymer is pumped through a slit-shaped die. The extruded product is rectangular in shape and
the width of the products is greater than the thickness. Usually the plastic sheets are more than
0.25 mm in thickness and the films are less than 0.076 mm. The die gap for sheet or film
extruding is normally set at 10% greater than the desired product thickness [8, 37].
Polymer thermoforming
Thermoforming is a method to form products from plastic sheets by using heat and
pressure. The heating process is not intended to fully melt the plastic, but instead, the sheets
are heated until they are soft enough to form into a shape with molds. Usually thermoforming
is used to form simple shaped products such as trays, cups and blister packaging. In general, the
thermoforming process is inexpensive. The machine and the processing method are quite
simple when compared with injection molding. It can use a single-surface mold to form
products. The drawbacks of this process are the difficulty of producing products with uniform
thicknesses or with complicated shapes [8].
There are several thermoforming methods, for example drape forming, vacuum
forming, pressure forming, plug-assist thermoforming, matched mold forming and skin
packaging. During the molding, heated plastic is stretched to form a shape. As the stretching
continues, the thickness of the sheet is also decreasing until it touches the mold surface. The
thickest part of the product is where the first contact between the plastic sheet and the mold
20
takes place. This can vary depending on the type of mold. For example, drape forming uses a
convex shape (positive) single-face mold so the bottom of the product is the thickest part and
the thinnest part is the rim. On the other hand, vacuum forming uses a concave shape
(negative) mold and as a result, the thickest part of the product is on the rim and the thinnest
part is the bottom of product [8].
Degradation
Hydrolytic degradation
PLA is vulnerable to degradation from hydrolysis. The reaction rate and mechanism
depend on both material properties such as structure, crystalline character and molecular
weight, and also environmental factors such as temperature, humidity, time and catalysts. The
mechanism of hydrolysis in neutral conditions is initiated by the presence of water. Generally,
the polymer is degraded by random chain scissions of ester groups in the structure. The
location of the chain cleavage is usually on the surface where the water is in contact, resulting
in surface erosion. On the other hand, bulk erosion, erosion in which the degradation occurs
throughout in the material, dominates if the diffusion rate of water in the PLA is rapid.
Amorphous regions are more highly susceptible to hydrolysis than crystalline structures since
water cannot diffuse through crystal structures in order to hydrolyze the polymer chains inside.
Chain cleavage in amorphous structures produces water-soluble oligomers and monomers.
Hydrolysis of PLA is also affected by the surrounding medium. The hydroxide ions in an alkaline
environment increase the degradation rate as do elevated temperatures. At temperatures
above Tg, the diffusion rate of water molecules increases due to the flexibility of the
21
amorphous regions. Also, hydrolysis can occur homogenously and rapidly in the polymer
structure when the surrounding temperature is above Tm [1, 5, 38].
Thermal degradation
Thermal degradation of PLA is mainly caused by random chain scission and unzipping
depolymerization reactions and usually occurs during melt processing of PLA. [37, 39]. Thermal
degradation mechanisms are complicated as has been reported in many studies. For example,
Kopinke et al. reported “five degradation mechanisms occurring at temperature above 200°C:
intra- and intermolecular ester exchange, cis-elimination, radical and concerted nonradical
reactions, radical reaction and Sn-catalyzed depolymerization” [40]. Also, McNeill and Leiper
reported the byproducts of degradation of PLA: at 230°C, lactide, acetaldehyde and carbon
monoxide are formed; at 270°C, carbon dioxide is generated; and at 320°C or above,
methylketene with a small amount of methane is formed. They proposed the mechanism of
thermal degradation in PLA as “a non-radical, backbiting ester interchange reaction involving
the OH chain ends” [41]. Residual polymerization catalysts increase the degradation of PLA by
reverse depolymerization and cause molecular weight loss, which impact the mechanical
properties of PLA. Jamshidi et al. reported a significantdifference in Mw between purified PLLA
and unpurified PLLA with catalyst. [42]
22
End of life of PLA
Landfilling, incineration and recycling are common waste management processes for
petroleum–based plastics. PLA has an additional option for its end of life. Being a bio-based and
biodegradable polymer, PLA can be composted in composting facilities in a reasonably short
period of time. The disposal of PLA is not limited only to composting. PLA can also be managed
by conventional waste disposal methods [14, 43, 44].
Biodegradation of PLA begins with hydrolysis. The molecular weight is reduced by
random chain scission of the ester groups. The byproducts of the hydrolysis reaction such as
low molecular weight PLA, oligomers and lactic acid are then decomposed by microorganisms.
The products of the biodegradation are H2O, CO2 and humus [5, 14, 45]. Biodegradability of
PLA is affected by many factors, such as material properties of the polymer and the
environmental conditions. High humidity and temperature (50-60°C) are suitable to initiate
rapid hydrolysis in PLA structures [30, 46, 47]. PLA is quite stable under normal environmental
condition. Ho et al, reported the biodegradation of PLA in soil and compost rows. In soil
conditions, the degradation rate resulted in no visible degradation of PLA until after six months
of soil burial. On the other hand, PLA degradation in compost rows takes only around 2 – 3
weeks [48]. Ohkita and Lee also reported similar results [49].
Almost 12% of MSW is managed by using combustion with energy recovery. The
facilities can be managed by private organizations or local government, and they are regulated
by 40 CRF part 60 subchapter C. In the US, more than 20 percent of Incineration facilities can
separate recyclable wastes out of MSW before burning. Incineration can be considered as
23
another end of life for PLA [4]. At a combustion temperature of 1000°C, 1 lb of PLA provides
8,338 BTU compared to 7,300 BTU/lb
and 5400 BTU/lb for wood and average MSW,
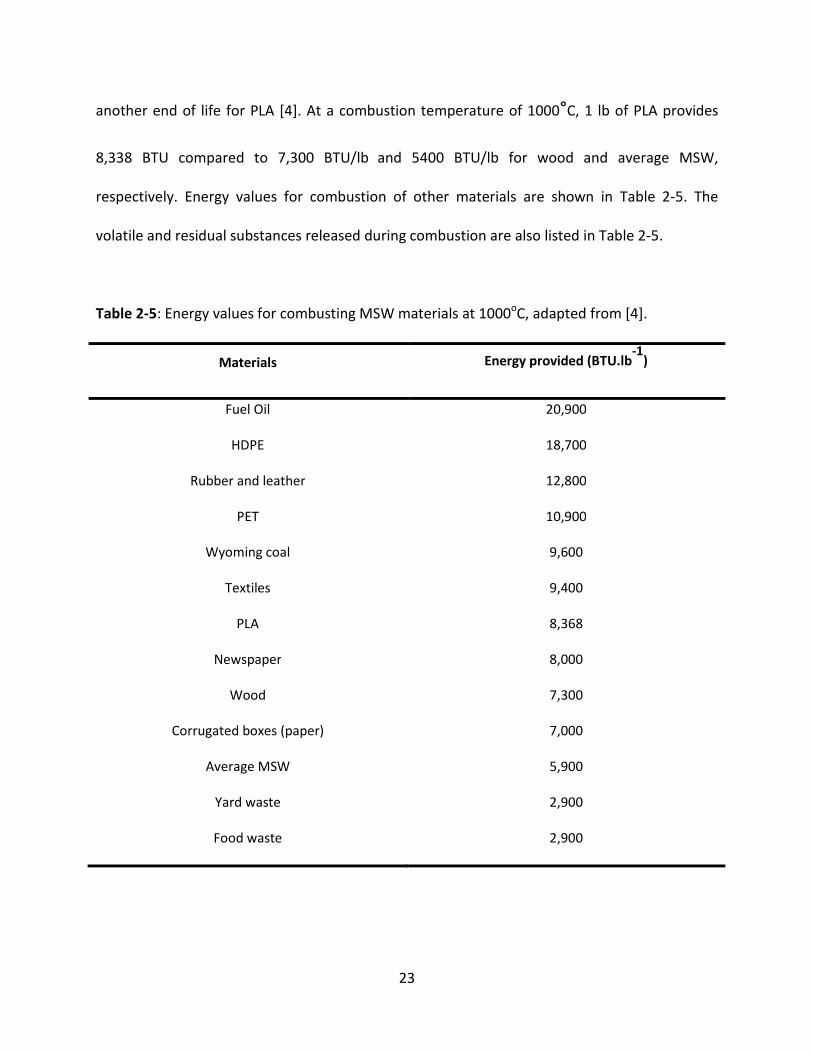
respectively. Energy values for combustion of other materials are shown in Table 2-5. The
volatile and residual substances released during combustion are also listed in Table 2-5.
Table 2-5: Energy values for combusting MSW materials at 1000oC, adapted from [4].
Materials Energy provided (BTU.lb-1
)
Fuel Oil 20,900
HDPE 18,700
Rubber and leather 12,800
PET 10,900
Wyoming coal 9,600
Textiles 9,400
PLA 8,368
Newspaper 8,000
Wood 7,300
Corrugated boxes (paper) 7,000
Average MSW 5,900
Yard waste 2,900
Food waste 2,900

24
Table 2-6: Residues and volatiles released during PLA combustion, adapted from [4].
Compounds Amount released, mg.g-1
carbon monoxide <0.1
carbon dioxide 2020
water >260
volatiles < 0.001
semi-volatiles < 0.01
residue 0.01
Recycling
Recycling involves producing a new product from an old, unwanted or waste material.
The end-product can be either the same or different functionality, for example recycling an old
glass bottle into a new one or recycling a plastic bottle into fabric, respectively. EPA claims that
recycling provides many benefits to the nation such as increasing job opportunities, reducing
greenhouse gases and pollution from producing new materials, decreasing burdens in landfill
and incineration, and preserving energy and natural resources [10]. In contrast to reuse,
recycled waste materials are reprocessed by converting the material to a basic structure. The
processes differ for each recyclable material, for example breaking down paper to fiber, de-
polymerizing plastic to monomer or re-melting glass or metal. The end-products of the process
are used to manufacture new items. The recycling process is not limited to reprocessing the
waste material, but also includes gathering, sorting and separating types of waste, and
25
manufacturing and marketing of the recycled products. An inability to accomplish any element
will result in ineffective recycling.
Raw material sources and management
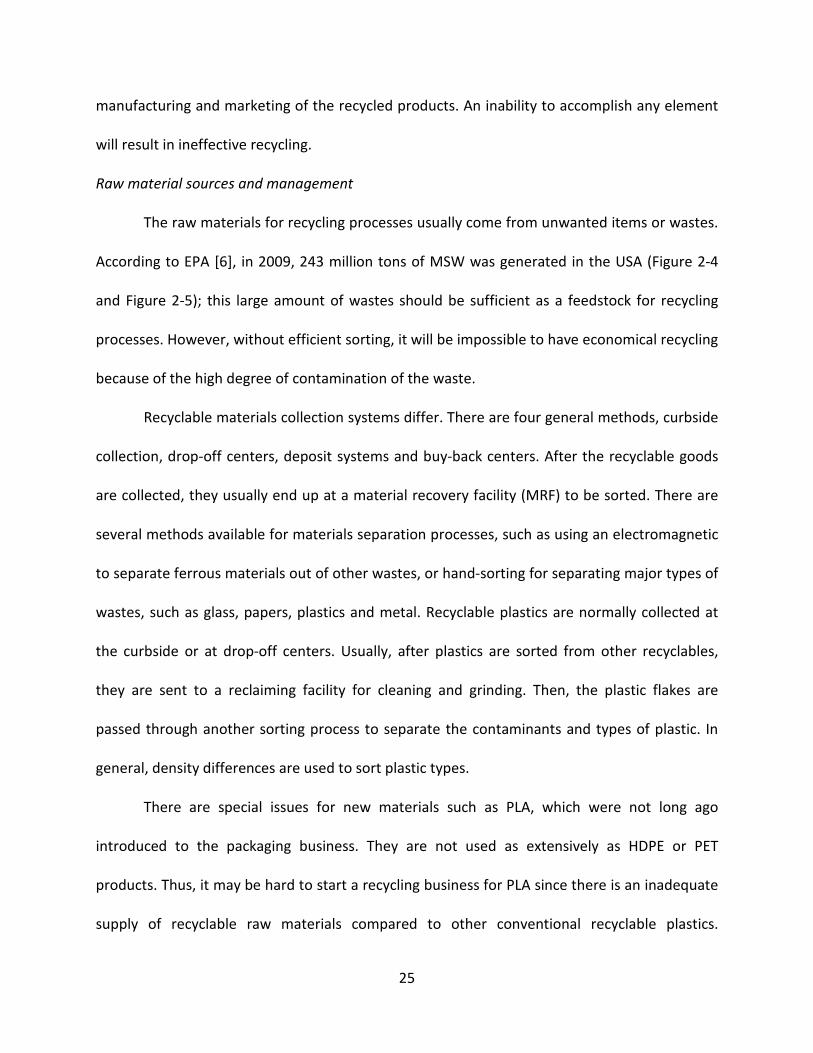
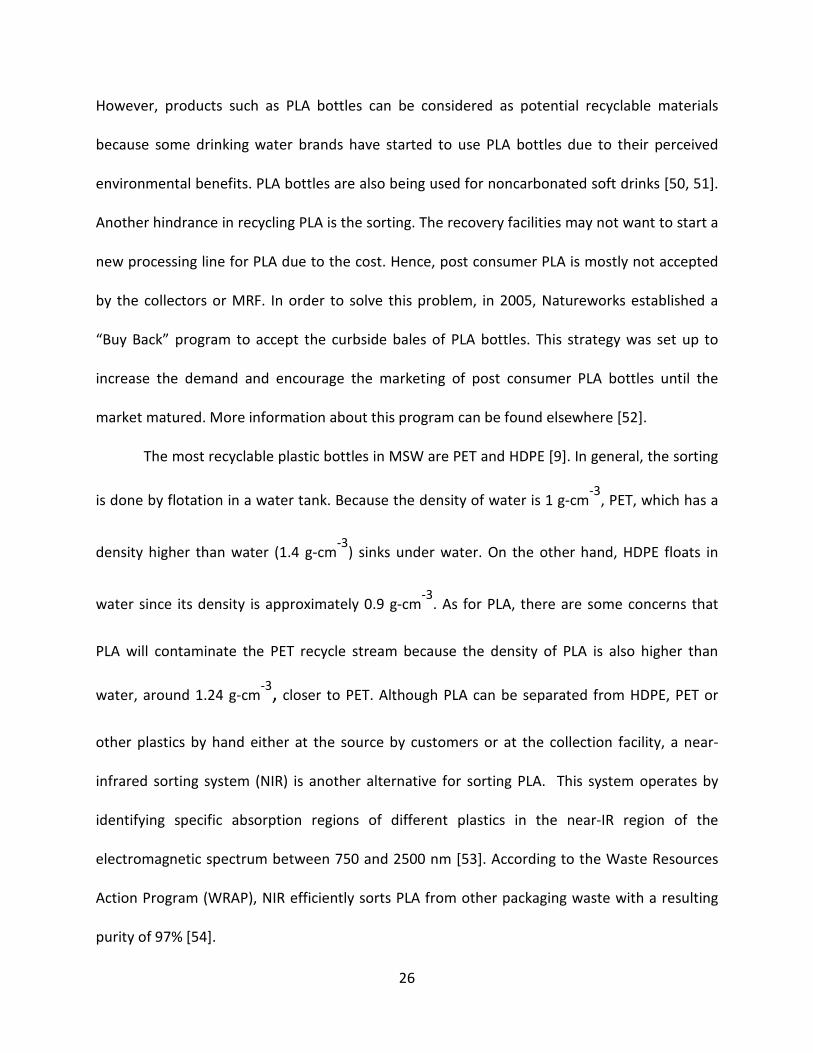
The raw materials for recycling processes usually come from unwanted items or wastes.
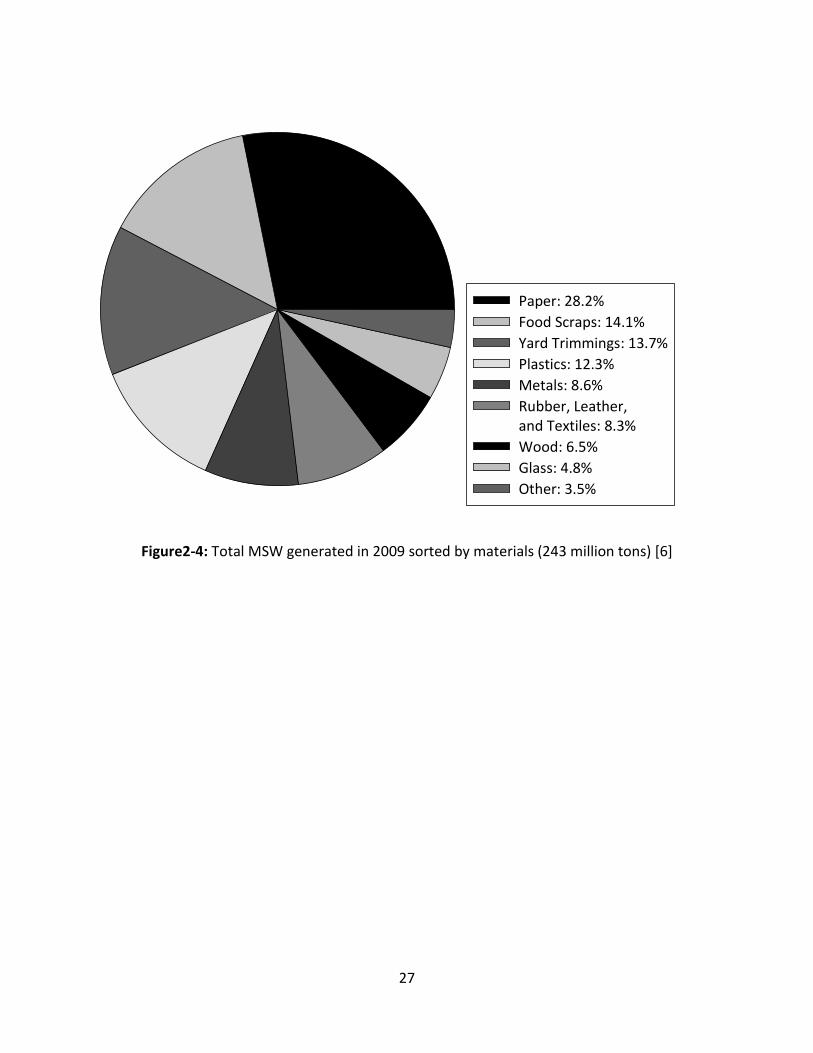
According to EPA [6], in 2009, 243 million tons of MSW was generated in the USA (Figure 2-4
and Figure 2-5); this large amount of wastes should be sufficient as a feedstock for recycling
processes. However, without efficient sorting, it will be impossible to have economical recycling
because of the high degree of contamination of the waste.
Recyclable materials collection systems differ. There are four general methods, curbside
collection, drop-off centers, deposit systems and buy-back centers. After the recyclable goods
are collected, they usually end up at a material recovery facility (MRF) to be sorted. There are
several methods available for materials separation processes, such as using an electromagnetic
to separate ferrous materials out of other wastes, or hand-sorting for separating major types of
wastes, such as glass, papers, plastics and metal. Recyclable plastics are normally collected at
the curbside or at drop-off centers. Usually, after plastics are sorted from other recyclables,
they are sent to a reclaiming facility for cleaning and grinding. Then, the plastic flakes are
passed through another sorting process to separate the contaminants and types of plastic. In
general, density differences are used to sort plastic types.
There are special issues for new materials such as PLA, which were not long ago
introduced to the packaging business. They are not used as extensively as HDPE or PET
products. Thus, it may be hard to start a recycling business for PLA since there is an inadequate
supply of recyclable raw materials compared to other conventional recyclable plastics.
26
However, products such as PLA bottles can be considered as potential recyclable materials
because some drinking water brands have started to use PLA bottles due to their perceived
environmental benefits. PLA bottles are also being used for noncarbonated soft drinks [50, 51].
Another hindrance in recycling PLA is the sorting. The recovery facilities may not want to start a
new processing line for PLA due to the cost. Hence, post consumer PLA is mostly not accepted
by the collectors or MRF. In order to solve this problem, in 2005, Natureworks established a
“Buy Back” program to accept the curbside bales of PLA bottles. This strategy was set up to
increase the demand and encourage the marketing of post consumer PLA bottles until the
market matured. More information about this program can be found elsewhere [52].
The most recyclable plastic bottles in MSW are PET and HDPE [9]. In general, the sorting
is done by flotation in a water tank. Because the density of water is 1 g-cm-3
, PET, which has a
density higher than water (1.4 g-cm-3
) sinks under water. On the other hand, HDPE floats in
water since its density is approximately 0.9 g-cm-3
. As for PLA, there are some concerns that
PLA will contaminate the PET recycle stream because the density of PLA is also higher than
water, around 1.24 g-cm-3
, closer to PET. Although PLA can be separated from HDPE, PET or
other plastics by hand either at the source by customers or at the collection facility, a near-
infrared sorting system (NIR) is another alternative for sorting PLA. This system operates by
identifying specific absorption regions of different plastics in the near-IR region of the
electromagnetic spectrum between 750 and 2500 nm [53]. According to the Waste Resources
Action Program (WRAP), NIR efficiently sorts PLA from other packaging waste with a resulting
purity of 97% [54].
27
Paper: 28.2%
Food Scraps: 14.1%
Yard Trimmings: 13.7%
Plastics: 12.3%
Metals: 8.6%
Rubber, Leather,
and Textiles: 8.3%
Wood: 6.5%
Glass: 4.8%
Other: 3.5%
Figure2-4: Total MSW generated in 2009 sorted by materials (243 million tons) [6]
28
year
1960 1970 1980 1990 2000 2010
Tot
al M
SW
gen
erat
ion
(mill
ion
tons
)
60
80
100
120
140
160
180
200
220
240
260
280
Per
cap
ita g
ener
atio
n (lb
s / p
erso
n / d
ay)
2
4
6
8
10
Total MSW generationPer capita generation
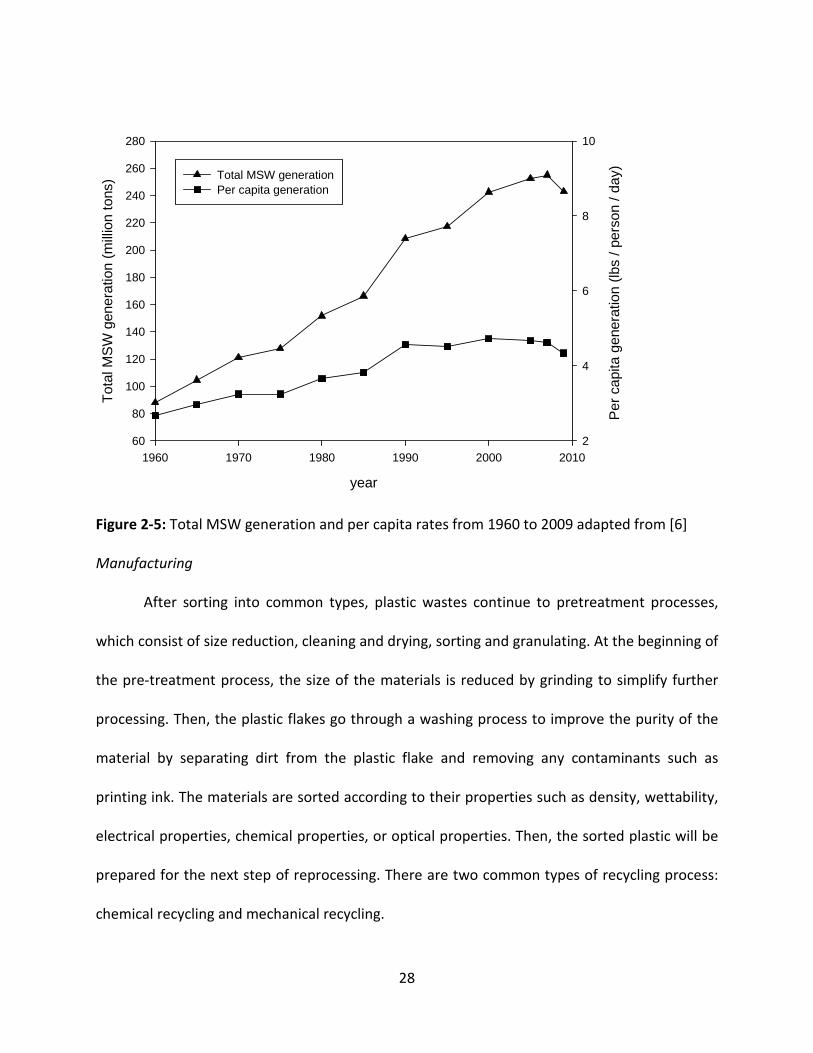
Figure 2-5: Total MSW generation and per capita rates from 1960 to 2009 adapted from [6]
Manufacturing
After sorting into common types, plastic wastes continue to pretreatment processes,
which consist of size reduction, cleaning and drying, sorting and granulating. At the beginning of
the pre-treatment process, the size of the materials is reduced by grinding to simplify further
processing. Then, the plastic flakes go through a washing process to improve the purity of the
material by separating dirt from the plastic flake and removing any contaminants such as
printing ink. The materials are sorted according to their properties such as density, wettability,
electrical properties, chemical properties, or optical properties. Then, the sorted plastic will be
prepared for the next step of reprocessing. There are two common types of recycling process:
chemical recycling and mechanical recycling.
29
Chemical recycling
The basis of plastic chemical recycling involves breaking down the polymer molecules by
using chemical and/or thermal processes. The methods may cause main chain scission,
degradation or de-polymerization of the polymer, and yield a basic structure (monomer). Then
the materials will be able to be fed back to the polymerization process to produce new polymer
[55-58]. The chemical recycling process may have an end product quality that is superior to
mechanical recycling due to the chemical purification. However, it is considered more
expensive, difficult and may produce more environmental burdens compared to mechanical
recycling [58].
Chemical recycling for PLA can be done by hydrolysis to break the chain structure into
lactic acid. Another procedure is depolymerizing of PLA to lactide (cyclic dimer of lactic acid).
The end product of recycling can be lactic acid, lactide or PLA [15, 44]. Tsuji et al. reported an
efficient way of recycling by hydrolyzing PLA at high temperature without a catalyst. This
process required only a short time (10 – 20 min), and a high yield of lactic acid (90%) was
obtained at 250°C [15].
Mechanical recycling
The process of mechanical recycling is less complicated than chemical recycling. After
the plastic flake is cleaned in the pre-treatment process, it is extruded and pelletized. Then it
will be prepared for further product processing. The concerns about this process are
contaminants in the polymer and degradation of the polymer during manufacturing. Usually the
processing equipment is equipped with a filtration system for screening the impurity particles.
In some cases, impurities can damage the equipment and also reduce the quality and
30
properties of the polymer [59]. Degradation during the reprocessing, such as hydrolysis and
thermal degradation, can cause chain cleavage at ester groups. The degradation causes a
reduction in molecular weight and changes polymer properties. These are the main drawbacks
of the method [39, 59]. However, mechanical recycling is not as complicated as chemical
recycling and is also inexpensive.
Market and Economics
As an individual, sorting PET or HDPE bottles at the recycling bin is not enough for
helping recycle the wastes. Without using and buying recycled products, those bottles will be
left in storage and will eventually be disposed as wastes again. The recycle loop will be
completed when there are markets for recycled products. A high demand for recyclable
products by customers may induce the manufacturers to pay more attention to this market
niche and try to develop more recycled base products. The recycling of PLA may have not yet
become successful. However, there is an opportunity for this business to grow. The Belgian
lactic acid producer, Galactic, is building a 1,000 metric ton lactic acid production plant. Galactic
is collaborating with Natureworks to collect both post consumer and post industrial PLA bottles
as a feedstock for producing lactic acid. The chemical recycling process will be used to break
down PLA back to lactic acid [14].
Response surface methodology
Experiments are part of the scientific method to obtain results and draw conclusions.
Outputs of experiments are influenced by many variables. To have an economical and
reasonable time frame for experiments, planning and designing of the experiments are needed.

31
RSM is a mathematical and statistical method used to determine the optimum conditions for
the experiment. For example, the degradation of a plastic is affected by the level of exposure
time (x1) and temperature (x2). The degree of degradation is the response value (y). The
functions of level of x1 and x2 that yields the result y can be expressed by
� � ����, �� �
where � is the experimental error in y. Usually, the relationship between y and x1 and x2 is
unknown. The first step for RSM is to determine a proper approximation of the relationship
between y and x1 and x2 by using a first-order model:
� � �� � ���� � �� �· · · � ���� � �
A higher degree polynomial is required for a response surface with curvature, such as the
second-order model:
� � �� � � ���� � �
���� ����� �
�
���� � ������� � �
���
Usually, RSM uses one of these models, but sometimes it can also use both of them. After the
data for the approximation of the polynomials is collected, the method of least squares is used
to estimate the parameters of the model. The analysis of the response surface is done by a
design for fitting the surface called the response surface design. After fitting the surface, the
region with optimal response is identified [60].
32
CHAPTER 3 MATERIALS AND METHODS
Introduction
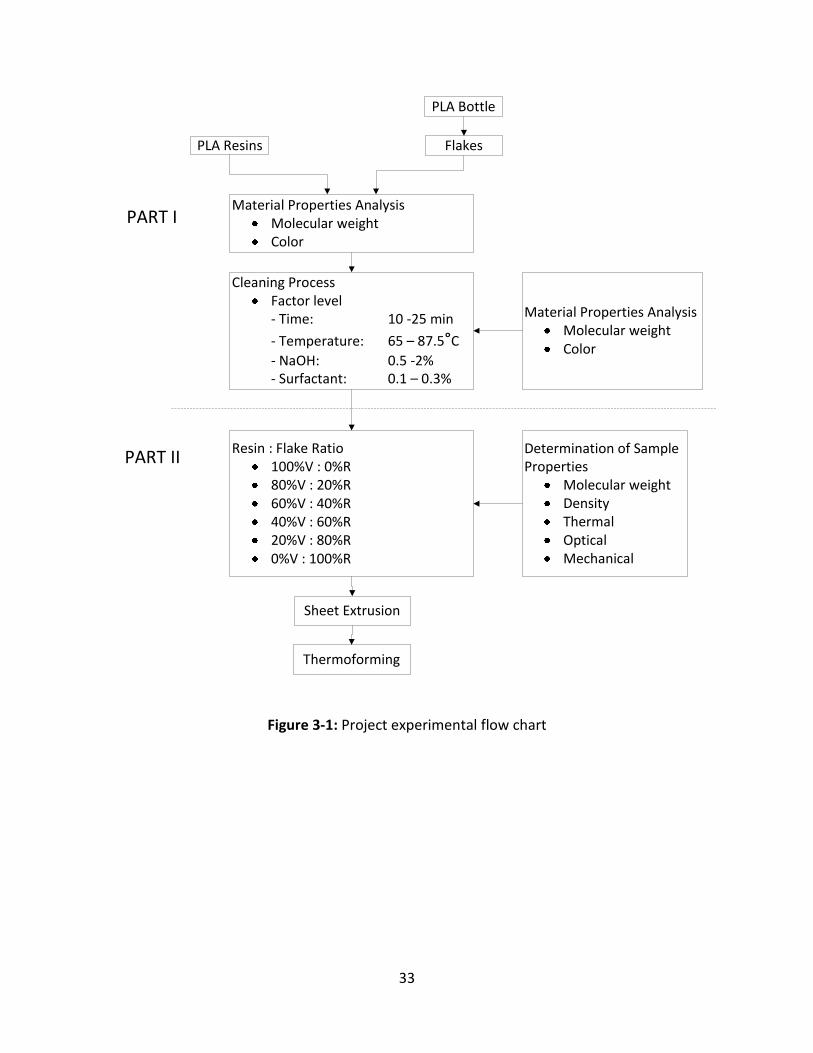
This study is divided in two main parts. The first part is the cleaning and preparation of the raw
material to obtain the clean recycled flakes. The second part concentrates on the comparison between
the properties of varying contents of posted-consumer and virgin PLA sheets as shown in Figure
3-1.
33
PLA Bottle
FlakesPLA Resins
Cleaning Process
Factor level
- Time: 10 -25 min
- Temperature: 65 – 87.5°C
- NaOH: 0.5 -2%
- Surfactant: 0.1 – 0.3%
Resin : Flake Ratio
100%V : 0%R
80%V : 20%R
60%V : 40%R
40%V : 60%R
20%V : 80%R
0%V : 100%R
Sheet Extrusion
Thermoforming
Material Properties Analysis
Molecular weight
Color
Determination of Sample
Properties
Molecular weight
Density
Thermal
Optical
Mechanical
Material Properties Analysis
Molecular weight
Color
PART I
PART II
Figure 3-1: Project experimental flow chart
34
Materials
Post-consumer PLA 500 ml water bottles were provided by Primo Water Corporation
(Winston Salem, NC). Virgin PLA resin (PLA 2002D) was obtained from NatureWorks®IngeoTM
.
Nonionic octylphenol biodegradable surface-active agent (Triton® X-100) and NaOH were
procured from a local store.
Methods
Sample preparation - Flake preparation process
Bottle caps, rings and labels were removed by hand before grinding the post-consumer
PLA water bottles. After that each bottle was cut into 3 large pieces and placed into the grinder,
B.P.T. granulator machine from Polymer Machinery® (Berlin, CT). Bottles were ground into
small pieces by two rotating steel blades inside the machine. The size was 3.35 to 4.7 mm [59].
Experimental design for the cleaning process of the PLA flake
The cleaning procedure was divided into two steps: cleaning with caustic solution
(NaOH) and rinsing with water. Since there is no standard commercial cleaning condition for
post consumer PLA plastic, the cleaning method used for PET recycled plastic was adapted to
use in this process. To determine the optimal cleaning conditions for the flakes, an
experimental design was conducted by using response surface methodology (RSM). Four main
factors from the cleaning conditions used for recycling PET were selected: a) cleaning
temperature, b) time, c) concentration of sodium hydroxide, and d) surfactant. The maximum
35
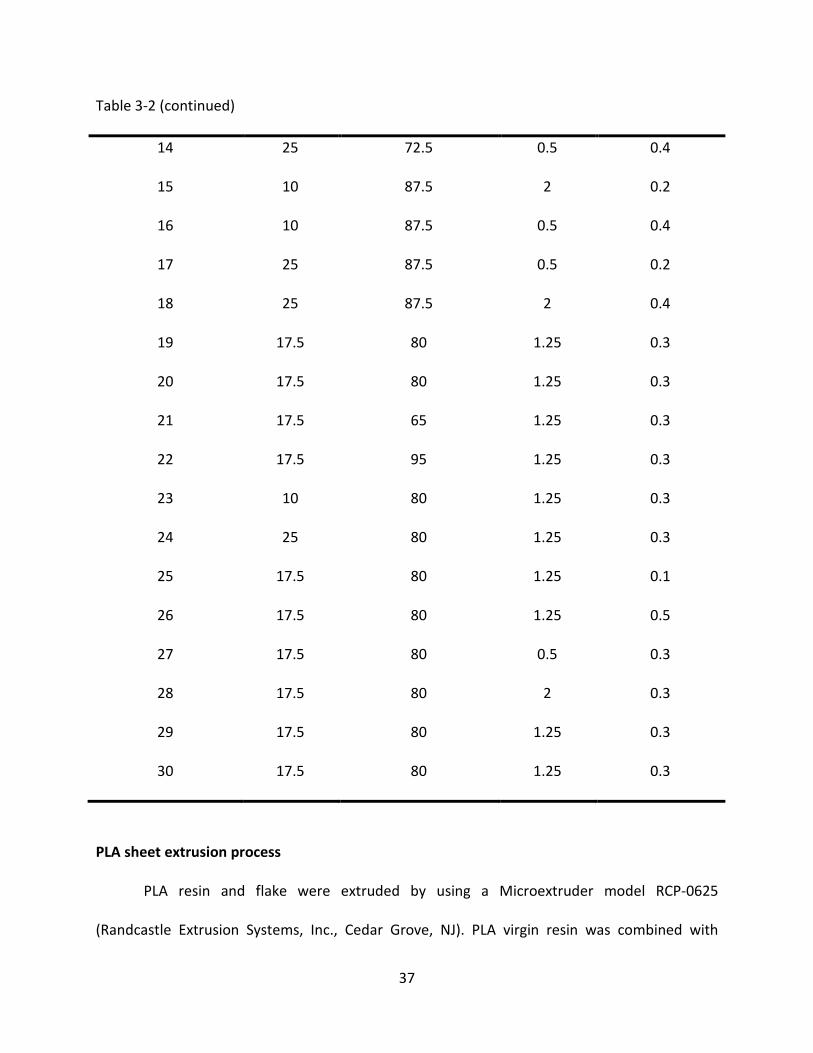
and minimum values of each factor were assigned as indicated in Table 3-1. In order to
construct a response surface, 30 cleaning condition treatments were selected as shown in Table
3-2.
The caustic solution for cleaning consisted of 0.5 to 2% sodium hydroxide (NaOH)
solution with 0.1 to 0.3% surfactant. The cleaning solution was preheated to the desired
temperature. The solution was stirred at approximately 800 rpm by a CompactDigital Stirrer
BDC2002 agitato, (Caframo, Wiarton, Ontario, Canada). When the solution reached the
temperature shown in Table 3-2, the flakes were introduced for the established period of time.
At the end of the specified time, the NaOH and surfactant were drained off, and the flakes were
rinsed with water at room temperature and stirred at 800 rpm for 5 min. Finally, the flakes
were removed from the water and allowed to dry at 23°C and 50% relative humidity for 24
hours.
The cleaned flake from each treatment condition was vacuum dried at 90°C for four
hours before the molecular weight and color properties were determined. The values of these
properties were used in the RSM to determine the optimum cleaning condition. After the
optimum cleaning condition was determined, all the remained flakes were cleaned under this
condition.

36
Table 3-1: Factor levels for each cleaning parameter
Levels Time (min) Temperature (°C) NaOH (%) Surfactant (%)
Highest 25 95 2 1
Middle 15 85 1 0.3
Lowest 5 65 0.5 0.1
Table 3-2: Experimental design treatment conditions for PLA flake cleaning process
Treatment Time (min) Temperature (°C) NaOH (%) Surfactant (%)
1 10 72.5 2 0.2
2 10 72.5 0.5 0.4
3 25 72.5 0.5 0.2
4 25 72.5 2 0.4
5 10 87.5 0.5 0.2
6 10 87.5 2 0.4
7 25 87.5 2 0.2
8 25 87.5 0.5 0.4
9 17.5 80 1.25 0.3
10 17.5 80 1.25 0.3
11 10 72.5 0.5 0.2
12 10 72.5 2 0.4
13 25 72.5 2 0.2
37
Table 3-2 (continued)
14 25 72.5 0.5 0.4
15 10 87.5 2 0.2
16 10 87.5 0.5 0.4
17 25 87.5 0.5 0.2
18 25 87.5 2 0.4
19 17.5 80 1.25 0.3
20 17.5 80 1.25 0.3
21 17.5 65 1.25 0.3
22 17.5 95 1.25 0.3
23 10 80 1.25 0.3
24 25 80 1.25 0.3
25 17.5 80 1.25 0.1
26 17.5 80 1.25 0.5
27 17.5 80 0.5 0.3
28 17.5 80 2 0.3
29 17.5 80 1.25 0.3
30 17.5 80 1.25 0.3
PLA sheet extrusion process
PLA resin and flake were extruded by using a Microextruder model RCP-0625
(Randcastle Extrusion Systems, Inc., Cedar Grove, NJ). PLA virgin resin was combined with
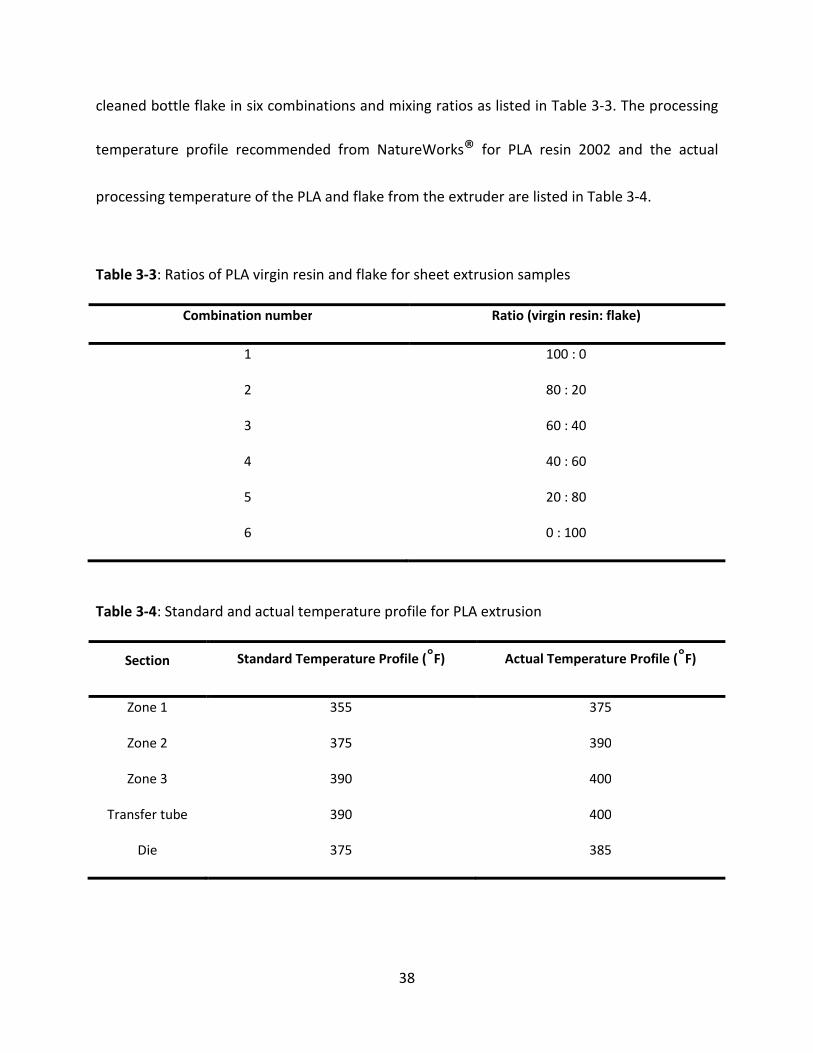
38
cleaned bottle flake in six combinations and mixing ratios as listed in Table 3-3. The processing
temperature profile recommended from NatureWorks® for PLA resin 2002 and the actual
processing temperature of the PLA and flake from the extruder are listed in Table 3-4.
Table 3-3: Ratios of PLA virgin resin and flake for sheet extrusion samples
Combination number Ratio (virgin resin: flake)
1 100 : 0
2 80 : 20
3 60 : 40
4 40 : 60
5 20 : 80
6 0 : 100
Table 3-4: Standard and actual temperature profile for PLA extrusion
Section Standard Temperature Profile (°F) Actual Temperature Profile (°F)
Zone 1 355 375
Zone 2 375 390
Zone 3 390 400
Transfer tube 390 400
Die 375 385
39
Sample analysis
Molecular weight properties
Molecular weight properties (i.e., weight average molecular weight (Mw), number
average molecular weight (Mn) and molecular weight distribution or polydispersity index (PDI))
of the PLA resin and bottle flakes were analyzed by gel permeation chromatography (GPC) with
equipment from Waters Inc. (Milford, MA). The system consisted of a Waters 1515 isocratic
pump, a Waters 717 autosampler, a Waters 2414 refractive index detector, and a set of three
columns (HR-2, HR-3 and HR-4 also from Waters) interfaced with Waters Breeze software, all
from Waters, Inc. For each PLA specimen, three samples of 20 mg each were cut from the sheet
and dissolved in 10 ml of HPLC grade tetrahydrofuran (THF). Then 100 μL from each sample was
withdrawn and injected into the system with a flow rate of 1 cm3-min
-1 for 45 min at 25°C.
Physical properties
Densities of the extruded PLA sheets were determined by using a density gradient
method in accordance with ASTM D 1505 Method C in section X 2.3 [61]. A solution of water
and calcium nitrate was used to create a density-gradient scale between 0.90 and 1.3 g-cm-3
.
Samples of 5 mm in diameter were cut and submerged in the density gradient column. Three
samples were tested from each PLA sheet specimen.

40
Optical properties
UV light
Ultraviolet and visible light transmission of PLA sheet samples were measured by using a
Perkin-Elmer Lambda 25 (Waltham, MA). Three samples from each PLA sheet were scanned
over the range 190 to 800 nm at 480 nm min-1
.
Color
A LabScan XE from HunterLab (Reston, VA) was use to identify the color differences
among PLA sheets. The result was reported in the CIE L*a*b* system. The 100% virgin PLA
sheet was assigned as the control for color comparisons between 100% virgin samples and the
samples with varying recycled contents. The color difference can be calculated from equation
(3.1). Three samples for each PLA sheet condition were tested.
∆� � ��∆��� � �∆��� � �∆����� (3.1)
where
∆�� � �!"#$%#&%� ' �!#()*+�
∆�� � �!"#$%#&%� ' �!#()*+�
∆�� � �!"#$%#&%� ' �!#()*+�
Infrared
Fourier transform infrared spectroscopy (FTIR) was used to determine any changes in
functional groups in the PLA sheets. Three samples from each PLA sheet were scanned using a
Shimadzu IR-Prestige 21 (Columbia, MD) from 4000 to 650 cm-1
.
41
Thermal properties
Glass transition temperature, melting temperature, enthalpy of fusion and crystallinity
The glass transition (Tg) and melting (Tm) temperatures were determined by a
differential scanning calorimeter (DSC) Q100 from Thermal Analysis Inc (New Castle, DE) in
accordance with ASTM D 3418 [62]. Three cycles of heat-cool-heat were performed: heating
from 25 to 185°C, then isothermal for 5 minutes, cooling from 185 to 25°C, and heating back to
185°C, all at a ramping rate of 10oC min
-1 under a nitrogen atmosphere. Three samples of 6 to
10 mg each were tested for each PLA specimen. The crystallinity (χc) was determined using
equation (3.2):
,-�./%� � 100 3 ∆456∆47∆458
(3.2)
where ΔHm is the enthalpy of melting, ΔHc is the enthalpy of crystallization and ΔH0
m is the
enthalpy of 100% crystalline PLA, which is 93 J g-1
[19].
Heat deflection temperature
The thermo mechanical properties of the PLA sheets were analyzed by using a dynamic
mechanical analyzer (DMA) Q800 from Thermal Analysis Inc (New Castle, DE) in tension mode,
with a clamp preload of 0.01 N. The tests were conducted in the temperature range of 0 to
140oC at 5
oC min
-1 heating rate under DMA-multi-frequency strain mode. Three samples of 5
mm width and 20 mm length were used for each PLA sheet.
42
Mechanical properties
Tensile strength, percentage of elongation at break, modulus of elasticity and tensile
strength at yield were measured using a Universal Testing Machine 5560 series from Instron,
Inc. (Norwood, MA) in accordance with ASTM D882 [63]. The initial grip separation was 125 mm
(5 in) and the rate of grip separation was 12.5 mm min-1
(0.5 inch min-1
). Three samples for
each specimen were tested.
Thermoforming
A Hydro Trim thermoformer model 1620 from Hydrotrim, (W. Nyack, NY) with
aluminum thermoforming molds were used to thermoform virgin PLA sheet and PLA sheet with
varying percentages of recycled content. The temperature for the top and bottom heaters was
set at 110oC and the heating time and the forming time were set to 10 seconds. At least two
PLA sheets from each specimen were thermoformed.
Statistical Analysis
Analysis of variance (ANOVA) with Fisher’s least significant difference (LSD) or Tukey's
honestly significant difference (HSD) were conducted to compare the samples at α=0.05. The
tests were conducted using the R program (http://www.r-project.org/).
43
CHAPTER 4 RESULTS AND DISCUSSION
Properties of virgin resin and flake before cleaning process
Thermal and molecular weight properties
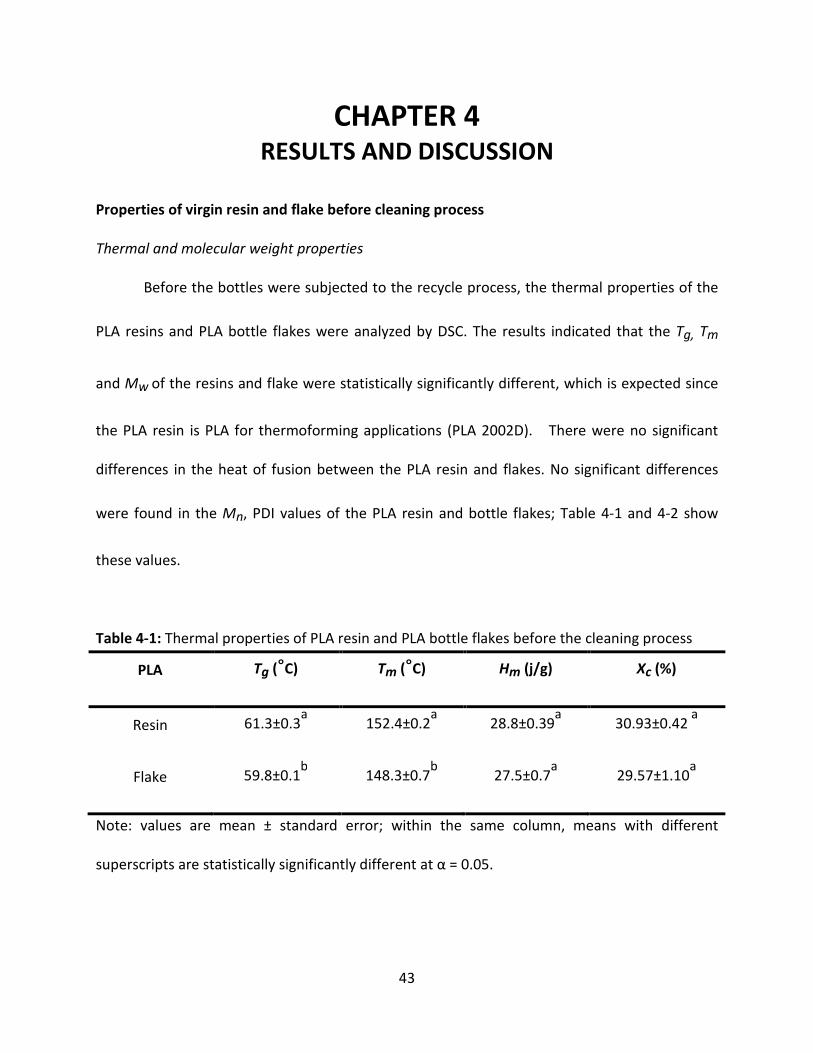
Before the bottles were subjected to the recycle process, the thermal properties of the
PLA resins and PLA bottle flakes were analyzed by DSC. The results indicated that the Tg, Tm
and Mw of the resins and flake were statistically significantly different, which is expected since
the PLA resin is PLA for thermoforming applications (PLA 2002D). There were no significant
differences in the heat of fusion between the PLA resin and flakes. No significant differences
were found in the Mn, PDI values of the PLA resin and bottle flakes; Table 4-1 and 4-2 show
these values.
Table 4-1: Thermal properties of PLA resin and PLA bottle flakes before the cleaning process
PLA Tg (°C) Tm (°C) Hm (j/g) Xc (%)
Resin 61.3±0.3a
152.4±0.2a
28.8±0.39a
30.93±0.42 a
Flake 59.8±0.1b
148.3±0.7b
27.5±0.7a
29.57±1.10a
Note: values are mean ± standard error; within the same column, means with different
superscripts are statistically significantly different at α = 0.05.
44
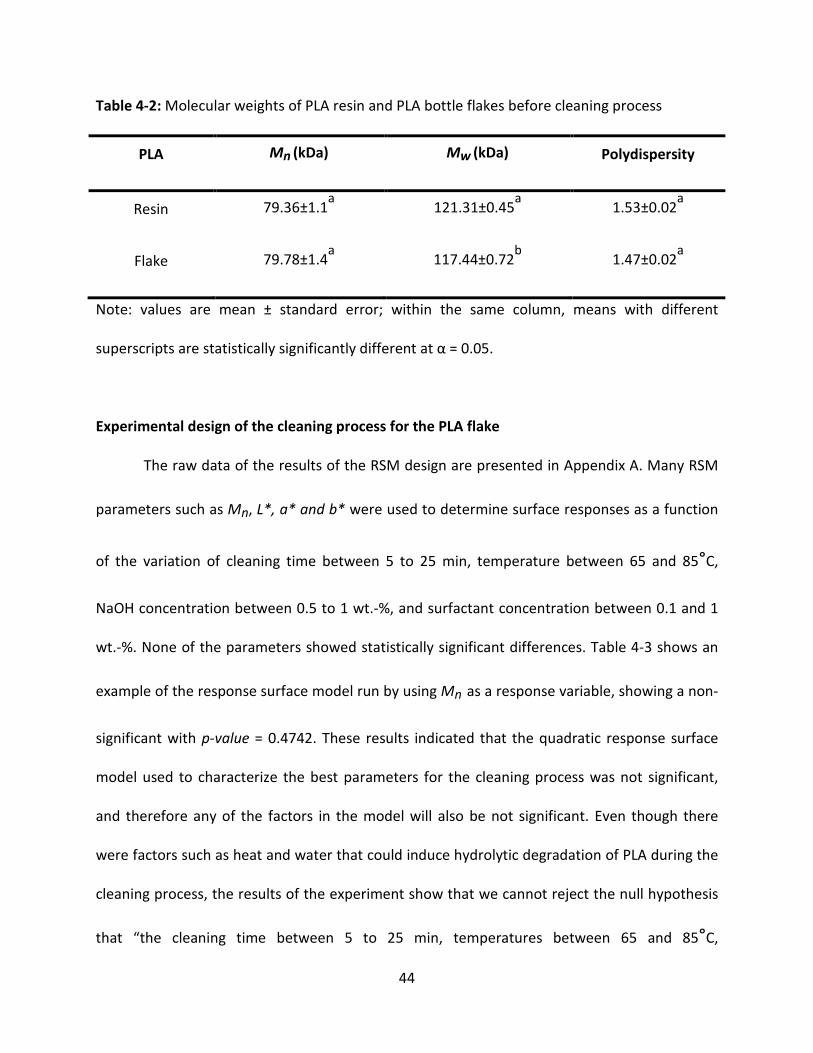
Table 4-2: Molecular weights of PLA resin and PLA bottle flakes before cleaning process
PLA Mn (kDa) Mw (kDa) Polydispersity
Resin 79.36±1.1a
121.31±0.45a
1.53±0.02a
Flake 79.78±1.4a
117.44±0.72b
1.47±0.02a
Note: values are mean ± standard error; within the same column, means with different
superscripts are statistically significantly different at α = 0.05.
Experimental design of the cleaning process for the PLA flake
The raw data of the results of the RSM design are presented in Appendix A. Many RSM
parameters such as Mn, L*, a* and b* were used to determine surface responses as a function
of the variation of cleaning time between 5 to 25 min, temperature between 65 and 85°C,
NaOH concentration between 0.5 to 1 wt.-%, and surfactant concentration between 0.1 and 1
wt.-%. None of the parameters showed statistically significant differences. Table 4-3 shows an
example of the response surface model run by using Mn as a response variable, showing a non-
significant with p-value = 0.4742. These results indicated that the quadratic response surface
model used to characterize the best parameters for the cleaning process was not significant,
and therefore any of the factors in the model will also be not significant. Even though there
were factors such as heat and water that could induce hydrolytic degradation of PLA during the
cleaning process, the results of the experiment show that we cannot reject the null hypothesis
that “the cleaning time between 5 to 25 min, temperatures between 65 and 85°C,
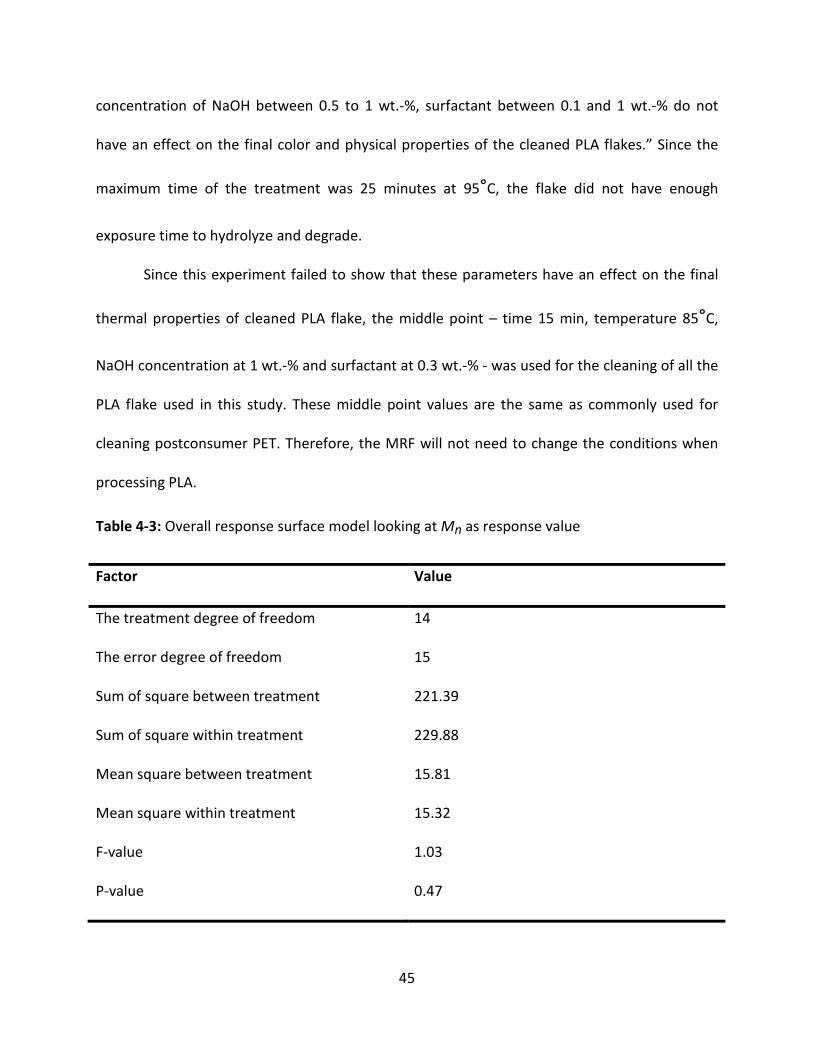
45
concentration of NaOH between 0.5 to 1 wt.-%, surfactant between 0.1 and 1 wt.-% do not
have an effect on the final color and physical properties of the cleaned PLA flakes.” Since the
maximum time of the treatment was 25 minutes at 95°C, the flake did not have enough
exposure time to hydrolyze and degrade.
Since this experiment failed to show that these parameters have an effect on the final
thermal properties of cleaned PLA flake, the middle point – time 15 min, temperature 85°C,
NaOH concentration at 1 wt.-% and surfactant at 0.3 wt.-% - was used for the cleaning of all the
PLA flake used in this study. These middle point values are the same as commonly used for
cleaning postconsumer PET. Therefore, the MRF will not need to change the conditions when
processing PLA.
Table 4-3: Overall response surface model looking at Mn as response value
Factor Value
The treatment degree of freedom 14
The error degree of freedom 15
Sum of square between treatment 221.39
Sum of square within treatment 229.88
Mean square between treatment 15.81
Mean square within treatment 15.32
F-value 1.03
P-value 0.47
46
Extruded sample analysis
The thickness of PLA extruded sheets varied from 14 to 17 mil due to the rolling speed
fluctuation of the roller.
Molecular weight properties
Table 4-4 displays the molecular weight of the extruded PLA samples. There were no
statistically significant differences of Mn and PDI for the PLA resin, bottle flake and the six PLA
extruded sheet samples at α < 0.05. However, there were differences in Mw results among
samples 100V, 80V and 60V and 20V and 100R. PLA extruded sheet samples 100V, 80V and 60V
were not significantly different than the PLA resin since these three samples contained a high
percentage of virgin material. However, sample 20V and 100R exhibited lower Mw compared
with 100V, 80V and 60V, which can be attributed to the high amount of recycled content in the
final PLA extruded sheets. PLA samples exposed to a recycling cycle were thermally abused
twice; therefore, increased chain scission and degradation can be expected due to the second
polymer extrusion process. PLA samples exposed to more than one extrusion cycle have shown
lower Mw [39, 64, 65]
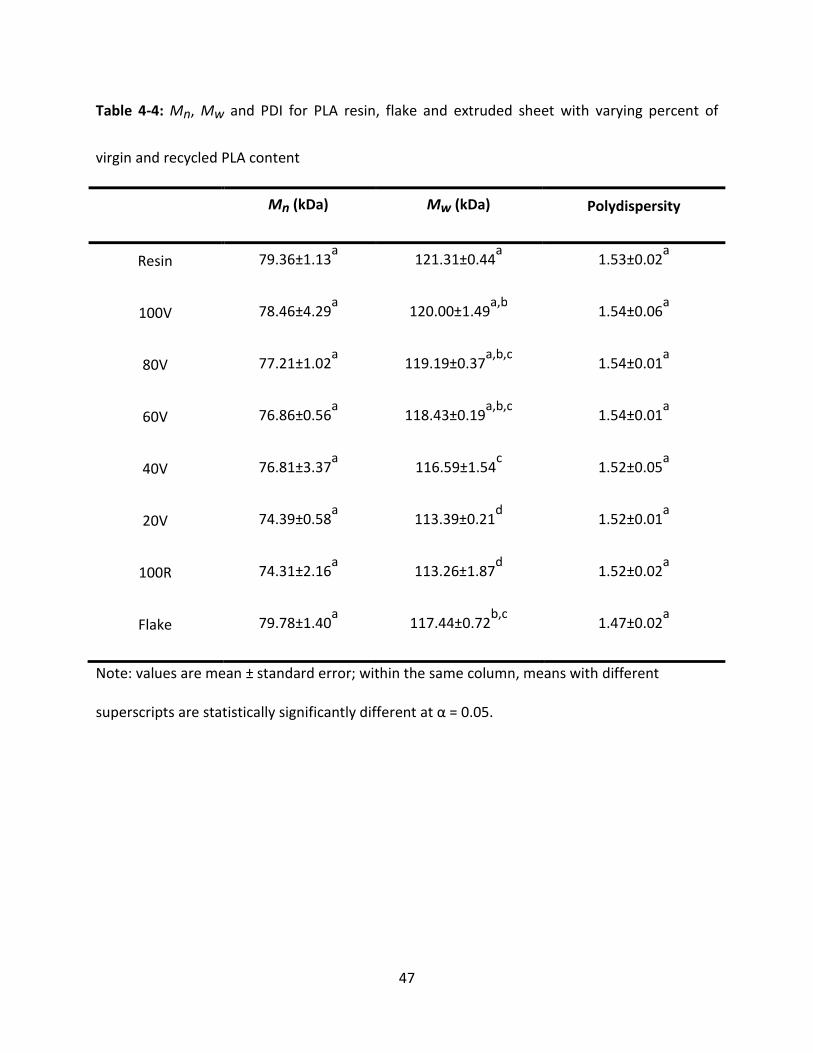
47
Table 4-4: Mn, Mw and PDI for PLA resin, flake and extruded sheet with varying percent of
virgin and recycled PLA content
Mn (kDa) Mw (kDa) Polydispersity
Resin 79.36±1.13a
121.31±0.44a
1.53±0.02a
100V 78.46±4.29a
120.00±1.49a,b
1.54±0.06a
80V 77.21±1.02a
119.19±0.37a,b,c
1.54±0.01a
60V 76.86±0.56a
118.43±0.19a,b,c
1.54±0.01a
40V 76.81±3.37a
116.59±1.54c
1.52±0.05a
20V 74.39±0.58a
113.39±0.21d
1.52±0.01a
100R 74.31±2.16a
113.26±1.87d
1.52±0.02a
Flake 79.78±1.40a
117.44±0.72b,c
1.47±0.02a
Note: values are mean ± standard error; within the same column, means with different
superscripts are statistically significantly different at α = 0.05.
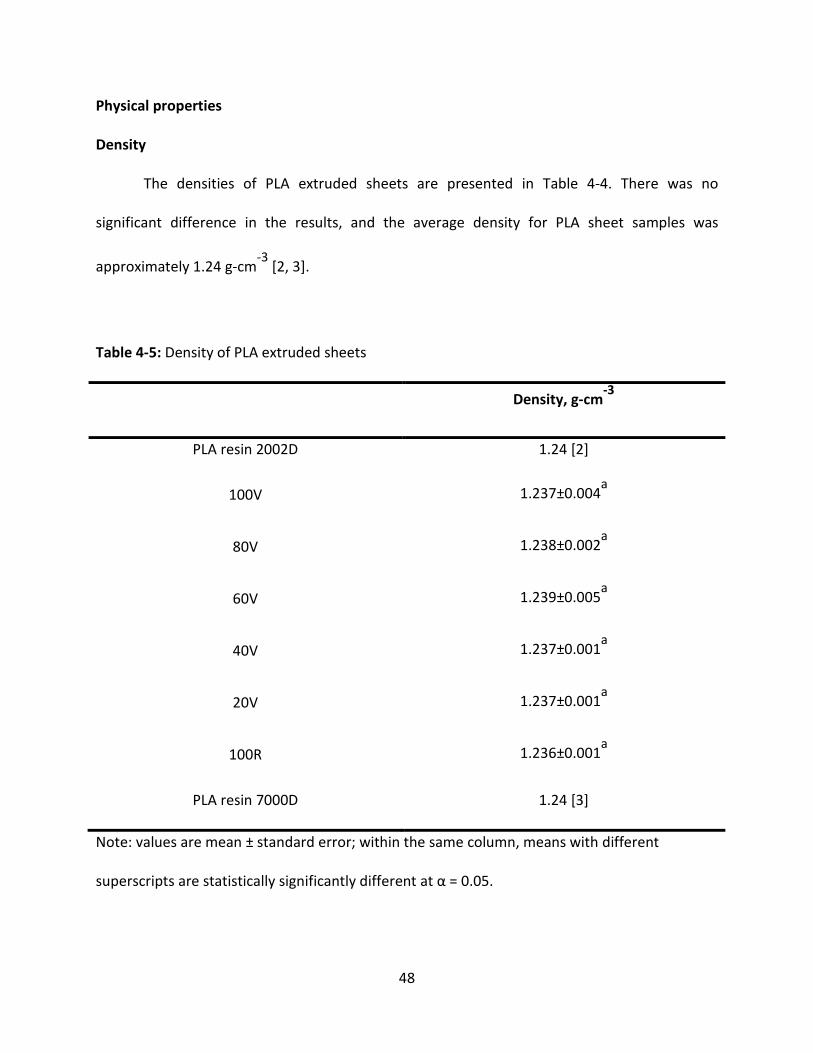
48
Physical properties
Density
The densities of PLA extruded sheets are presented in Table 4-4. There was no
significant difference in the results, and the average density for PLA sheet samples was
approximately 1.24 g-cm-3
[2, 3].
Table 4-5: Density of PLA extruded sheets
Density, g-cm-3
PLA resin 2002D 1.24 [2]
100V 1.237±0.004a
80V 1.238±0.002a
60V 1.239±0.005a
40V 1.237±0.001a
20V 1.237±0.001a
100R 1.236±0.001a
PLA resin 7000D 1.24 [3]
Note: values are mean ± standard error; within the same column, means with different
superscripts are statistically significantly different at α = 0.05.
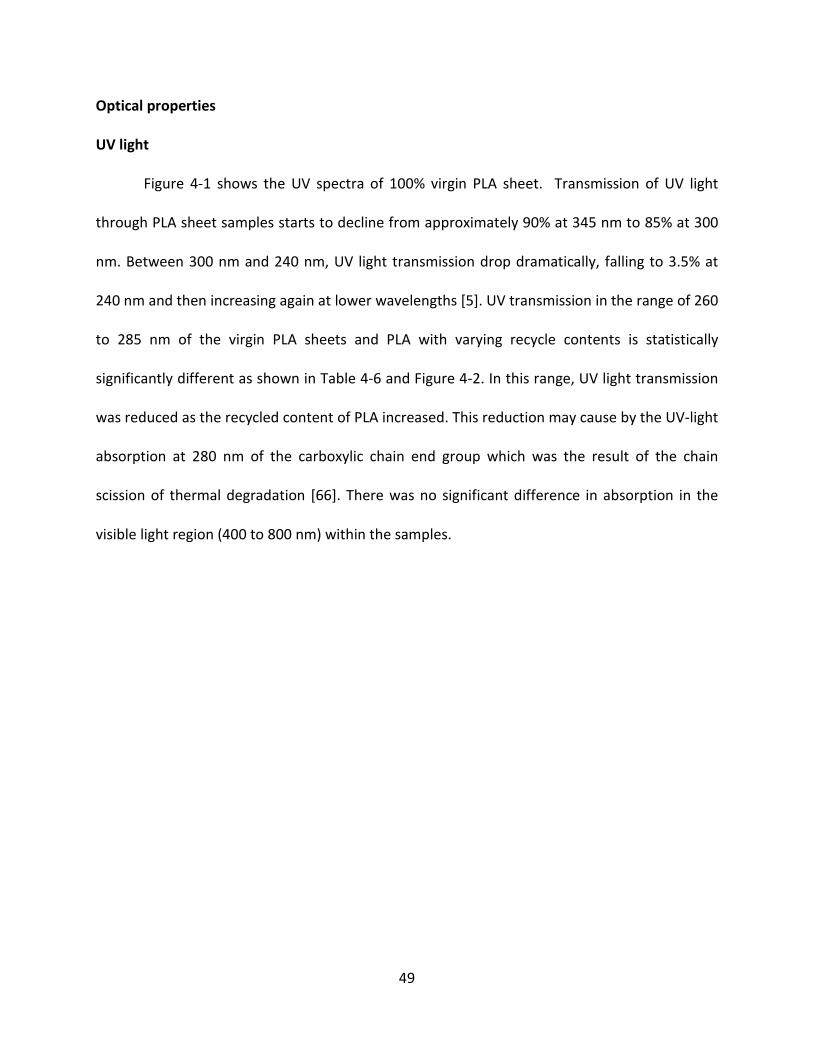
49
Optical properties
UV light
Figure 4-1 shows the UV spectra of 100% virgin PLA sheet. Transmission of UV light
through PLA sheet samples starts to decline from approximately 90% at 345 nm to 85% at 300
nm. Between 300 nm and 240 nm, UV light transmission drop dramatically, falling to 3.5% at
240 nm and then increasing again at lower wavelengths [5]. UV transmission in the range of 260
to 285 nm of the virgin PLA sheets and PLA with varying recycle contents is statistically
significantly different as shown in Table 4-6 and Figure 4-2. In this range, UV light transmission
was reduced as the recycled content of PLA increased. This reduction may cause by the UV-light
absorption at 280 nm of the carboxylic chain end group which was the result of the chain
scission of thermal degradation [66]. There was no significant difference in absorption in the
visible light region (400 to 800 nm) within the samples.

50
nm
200 300 400 500 600 700 800
Tra
nsm
ittan
ce (
%)
0
20
40
60
80
100
Figure 4-1: UV spectra of 100% virgin PLA sheet sample
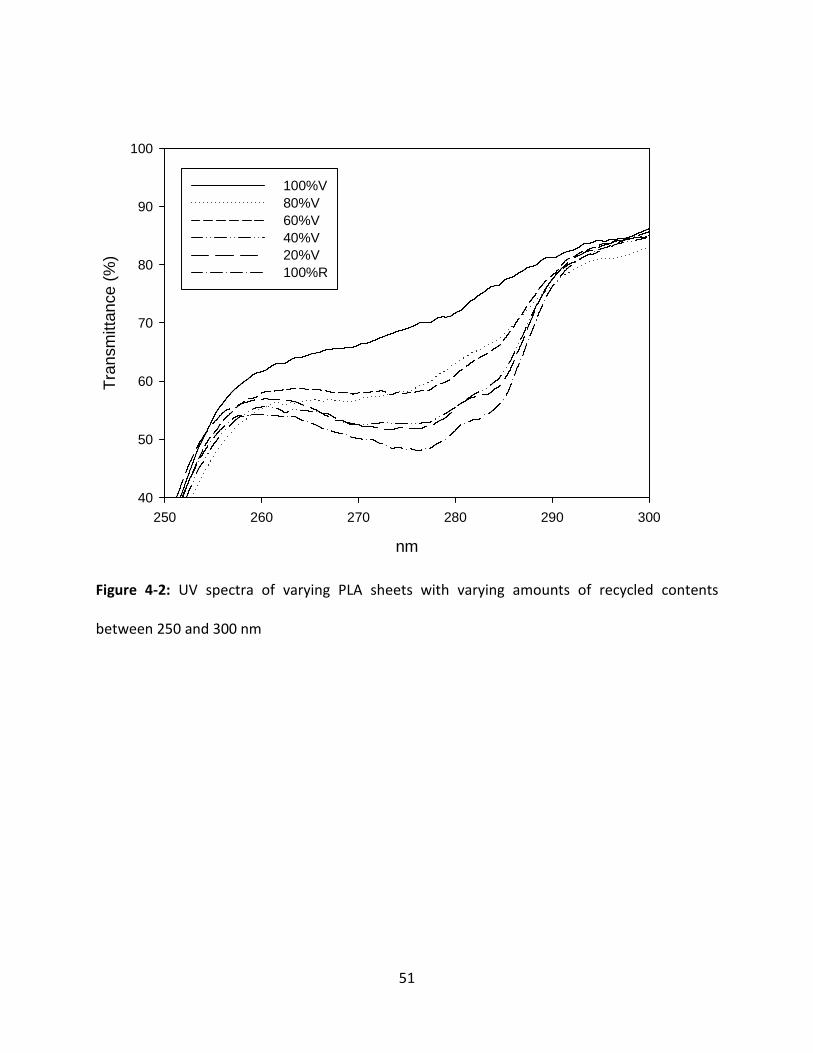
51
nm
250 260 270 280 290 300
Tra
nsm
ittan
ce (
%)
40
50
60
70
80
90
100
100%V80%V60%V40%V20%V100%R
Figure 4-2: UV spectra of varying PLA sheets with varying amounts of recycled contents
between 250 and 300 nm
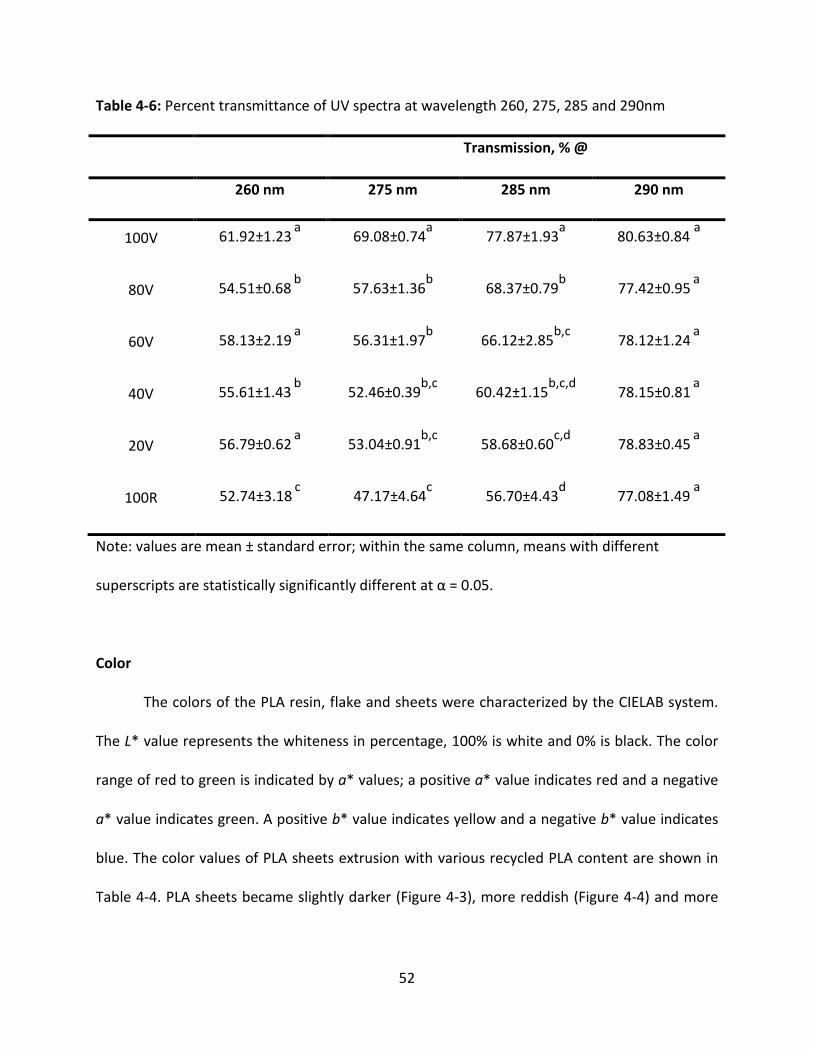
52
Table 4-6: Percent transmittance of UV spectra at wavelength 260, 275, 285 and 290nm
Transmission, % @
260 nm 275 nm 285 nm 290 nm
100V 61.92±1.23 a
69.08±0.74a
77.87±1.93a 80.63±0.84
a
80V 54.51±0.68 b
57.63±1.36b
68.37±0.79b 77.42±0.95
a
60V 58.13±2.19 a
56.31±1.97b
66.12±2.85b,c
78.12±1.24 a
40V 55.61±1.43 b
52.46±0.39b,c
60.42±1.15b,c,d
78.15±0.81 a
20V 56.79±0.62 a
53.04±0.91b,c
58.68±0.60c,d
78.83±0.45 a
100R 52.74±3.18 c
47.17±4.64c
56.70±4.43d 77.08±1.49
a
Note: values are mean ± standard error; within the same column, means with different
superscripts are statistically significantly different at α = 0.05.
Color
The colors of the PLA resin, flake and sheets were characterized by the CIELAB system.
The L* value represents the whiteness in percentage, 100% is white and 0% is black. The color
range of red to green is indicated by a* values; a positive a* value indicates red and a negative
a* value indicates green. A positive b* value indicates yellow and a negative b* value indicates
blue. The color values of PLA sheets extrusion with various recycled PLA content are shown in
Table 4-4. PLA sheets became slightly darker (Figure 4-3), more reddish (Figure 4-4) and more
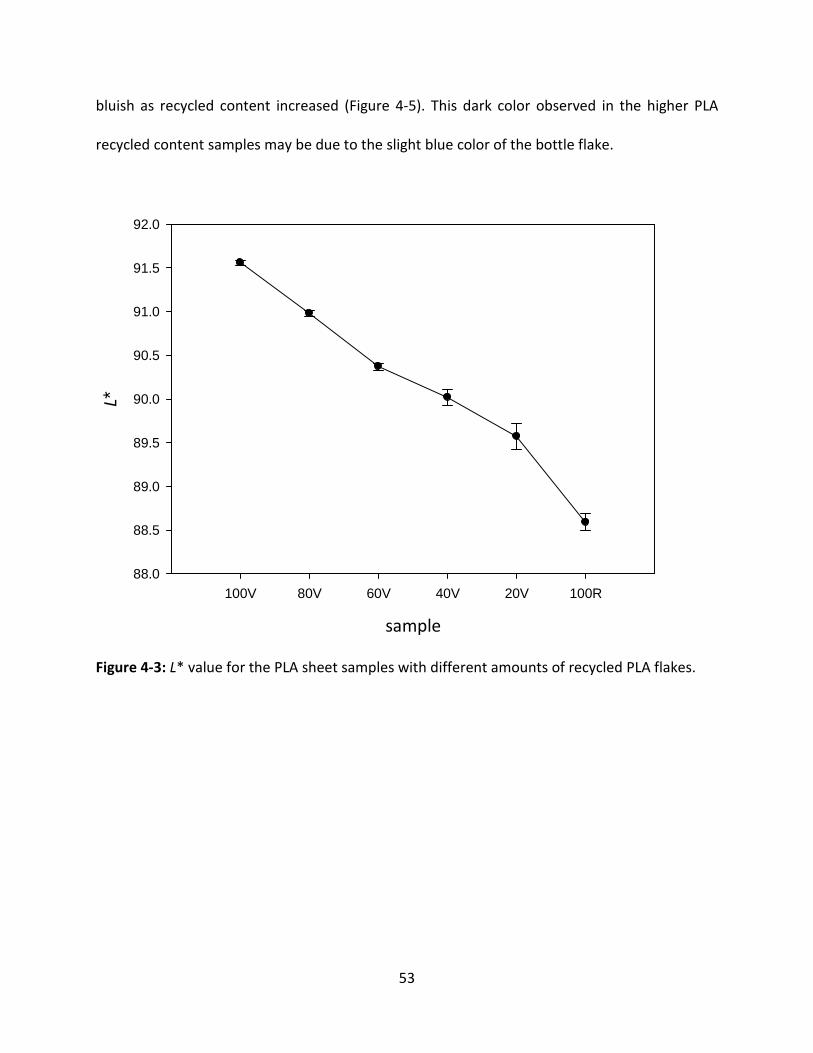
53
bluish as recycled content increased (Figure 4-5). This dark color observed in the higher PLA
recycled content samples may be due to the slight blue color of the bottle flake.
sample
100V 80V 60V 40V 20V 100R
L *
88.0
88.5
89.0
89.5
90.0
90.5
91.0
91.5
92.0
Figure 4-3: L* value for the PLA sheet samples with different amounts of recycled PLA flakes.

54
Sample
100V 80V 60V 40V 20V 100R
a*
-1.10
-1.05
-1.00
-0.95
-0.90
-0.85
Figure 4-4: a* value for the PLA sheet samples with different amounts of recycled PLA flakes.

55
sample
100V 80V 60V 40V 20V 100R
b*
1.0
1.1
1.2
1.3
1.4
1.5
1.6
Figure4-5: b* value for the PLA sheet samples with different amounts of recycled PLA flakes.
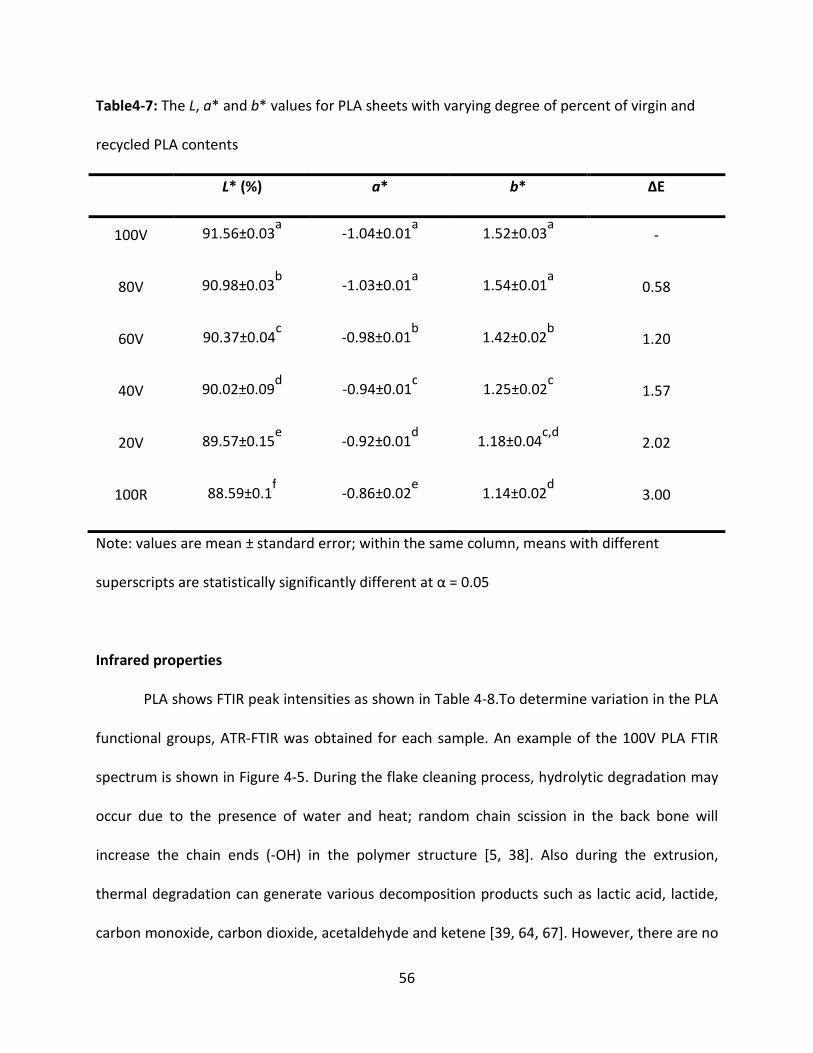
56
Table4-7: The L, a* and b* values for PLA sheets with varying degree of percent of virgin and
recycled PLA contents
L* (%) a* b* ΔE
100V 91.56±0.03a
-1.04±0.01a
1.52±0.03a
-
80V 90.98±0.03b
-1.03±0.01a
1.54±0.01a
0.58
60V 90.37±0.04c
-0.98±0.01b
1.42±0.02b
1.20
40V 90.02±0.09d
-0.94±0.01c
1.25±0.02c
1.57
20V 89.57±0.15e
-0.92±0.01d
1.18±0.04c,d
2.02
100R 88.59±0.1f
-0.86±0.02e
1.14±0.02d
3.00
Note: values are mean ± standard error; within the same column, means with different
superscripts are statistically significantly different at α = 0.05
Infrared properties
PLA shows FTIR peak intensities as shown in Table 4-8.To determine variation in the PLA
functional groups, ATR-FTIR was obtained for each sample. An example of the 100V PLA FTIR
spectrum is shown in Figure 4-5. During the flake cleaning process, hydrolytic degradation may
occur due to the presence of water and heat; random chain scission in the back bone will
increase the chain ends (-OH) in the polymer structure [5, 38]. Also during the extrusion,
thermal degradation can generate various decomposition products such as lactic acid, lactide,
carbon monoxide, carbon dioxide, acetaldehyde and ketene [39, 64, 67]. However, there are no

57
visible new peaks appearing in the sample 60V and 100R spectra (Figure 4-6). Degradation in
these samples may occur in such a small amount that the FTIR cannot detect the absorption
from the degradation products. Also, the rough surface quality of the samples disrupts the
infrared absorption and results in low peak intensity. There are some slight decreases of peak
intensity between the 100V, 60V and 100R samples for the –C=O bond (Figure 4-7) and -C-O
and -OH bending bonds (Figure 4-8). Further investigation would be required to determine
whether these differences are significant.
Table 4-8: Infrared spectroscopy data with peak band assignments for PLA infrared spectra,
adapted from Auras et al [5]
Assignment Peak position, cm-1
-OH stretch (free) 3571
-CH- stretch 2997 (asym), 2946 (sym), 2877
-C=O carbonyl stretch 1748
-CH3 bend 1456
-CH- deformation including symmetric and
asymmetric
1382, 1365
-C=O bend 1225
-C-O- stretch 1194, 1130, 1093
-OH bend 1047
-CH3 rocking modes 956, 921
-C-C- stretch 926,868
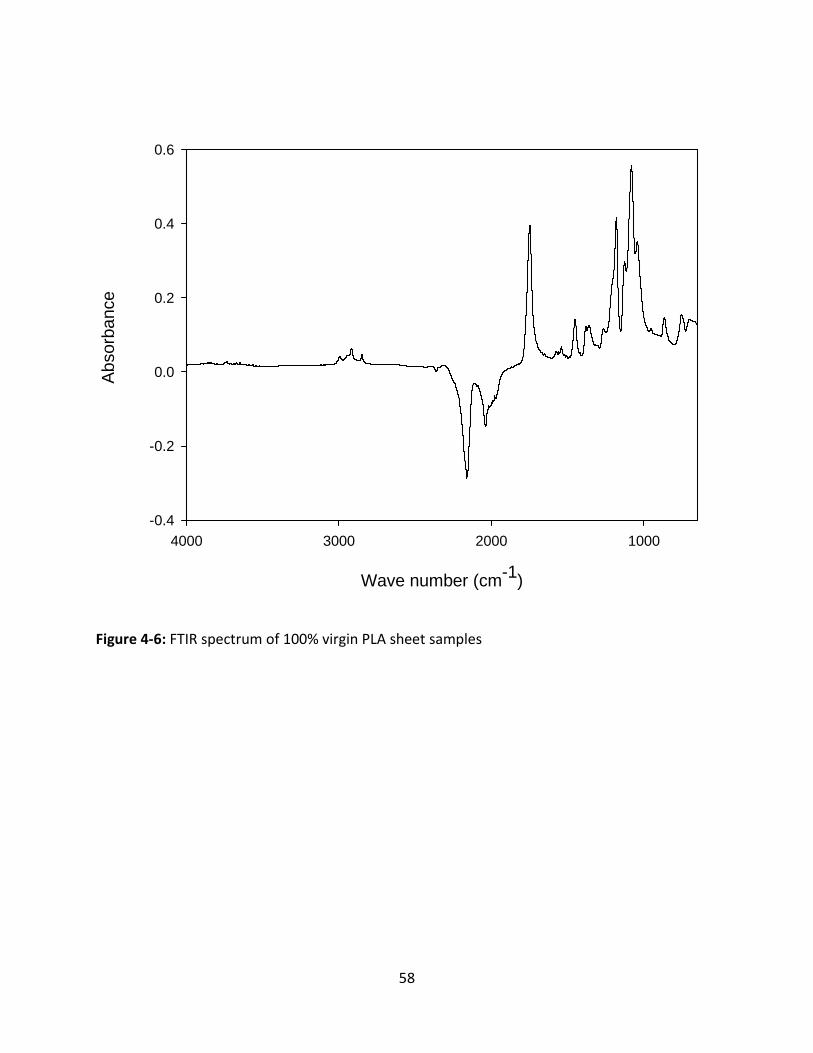
58
Wave number (cm-1)
1000200030004000
Abs
orba
nce
-0.4
-0.2
0.0
0.2
0.4
0.6
Figure 4-6: FTIR spectrum of 100% virgin PLA sheet samples
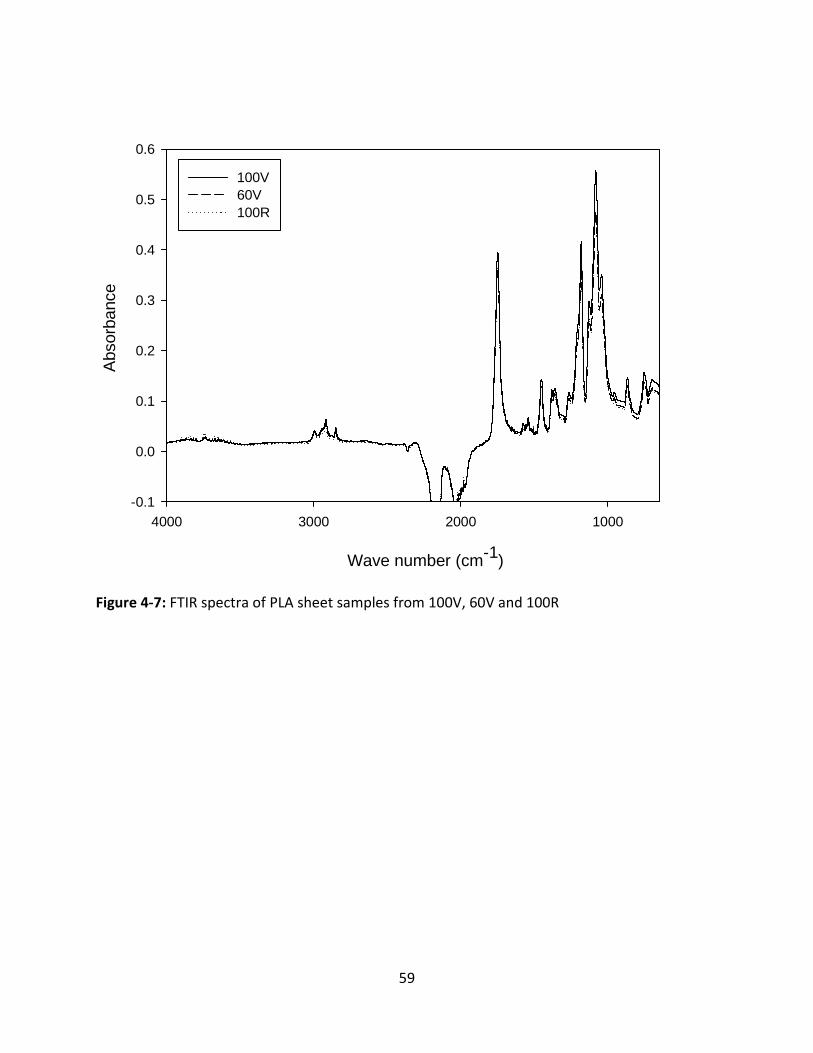
59
1000200030004000
Abs
orba
nce
-0.1
0.0
0.1
0.2
0.3
0.4
0.5
0.6
100V60V100R
Wave number (cm-1)
Figure 4-7: FTIR spectra of PLA sheet samples from 100V, 60V and 100R
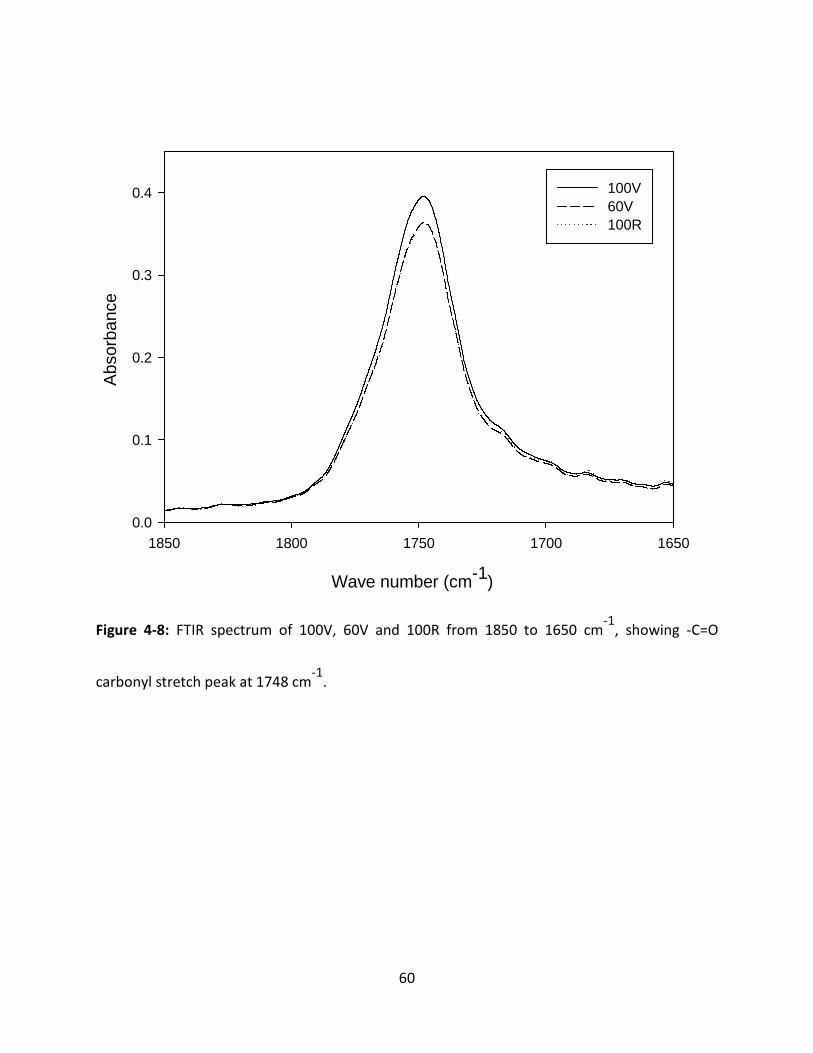
60
Wave number (cm-1)
16501700175018001850
Abs
orba
nce
0.0
0.1
0.2
0.3
0.4 100V60V100R
Figure 4-8: FTIR spectrum of 100V, 60V and 100R from 1850 to 1650 cm-1
, showing -C=O
carbonyl stretch peak at 1748 cm-1
.

61
Wave number (cm-1)
9001000110012001300
Abs
orba
nce
0.0
0.1
0.2
0.3
0.4
0.5
0.6
100V60V100R
Figure 4-9: FTIR spectrum of 100V, 60V and 100R from 1300 to 900 cm-1
, showing -C-O- stretch
peaks at 1194, 1130 and 1094 cm-1
and –OH bend peak at 1047 cm-1
Thermal properties
Glass transition temperature, melting temperature, enthalpy of fusion and crystallinity
Glass transition temperatures were determined from the second heating cycle during the DSC
run. The Tg for each sample is shown in Table 4-9. Statistically significant differences were
found between 100R (lowest Tg = 59.6 °C) and 100V (highest Tg = 60.7
°C). A high amount of
62
PLA recycled flake content may reduce the Tg of the final extruded PLA sheets. The recycled
PLA may introduce low molecular weight plasticizer or impurities, which lowers the final Tg of
PLA sheets containing recycled PLA amounts. The melting point of the samples shows similar
characteristics. The 100V samples showed the highest Tm (150.4 °C) and the lowest 100R (149.2
°C). Recycled PLA flakes may introduce irregularities in the highly ordered 100V samples.
However, no statistically significant differences were found in the enthalpy of fusion and
crystallinity of the samples.
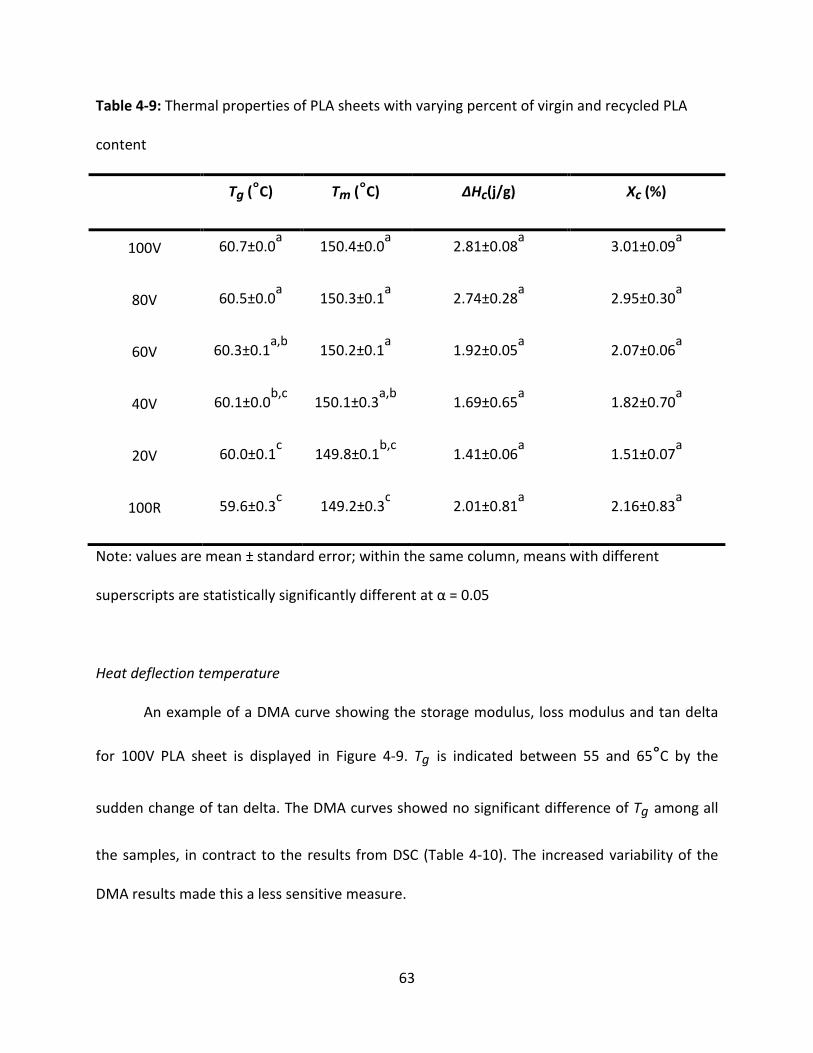
63
Table 4-9: Thermal properties of PLA sheets with varying percent of virgin and recycled PLA
content
Tg (°C) Tm (°C) ΔHc(j/g) Xc (%)
100V 60.7±0.0a
150.4±0.0a
2.81±0.08a
3.01±0.09a
80V 60.5±0.0a
150.3±0.1a
2.74±0.28a
2.95±0.30a
60V 60.3±0.1a,b
150.2±0.1a
1.92±0.05a
2.07±0.06a
40V 60.1±0.0b,c
150.1±0.3a,b
1.69±0.65a
1.82±0.70a
20V 60.0±0.1c
149.8±0.1b,c
1.41±0.06a
1.51±0.07a
100R 59.6±0.3c
149.2±0.3c
2.01±0.81a
2.16±0.83a
Note: values are mean ± standard error; within the same column, means with different
superscripts are statistically significantly different at α = 0.05
Heat deflection temperature
An example of a DMA curve showing the storage modulus, loss modulus and tan delta
for 100V PLA sheet is displayed in Figure 4-9. Tg is indicated between 55 and 65°C by the
sudden change of tan delta. The DMA curves showed no significant difference of Tg among all
the samples, in contract to the results from DSC (Table 4-10). The increased variability of the
DMA results made this a less sensitive measure.
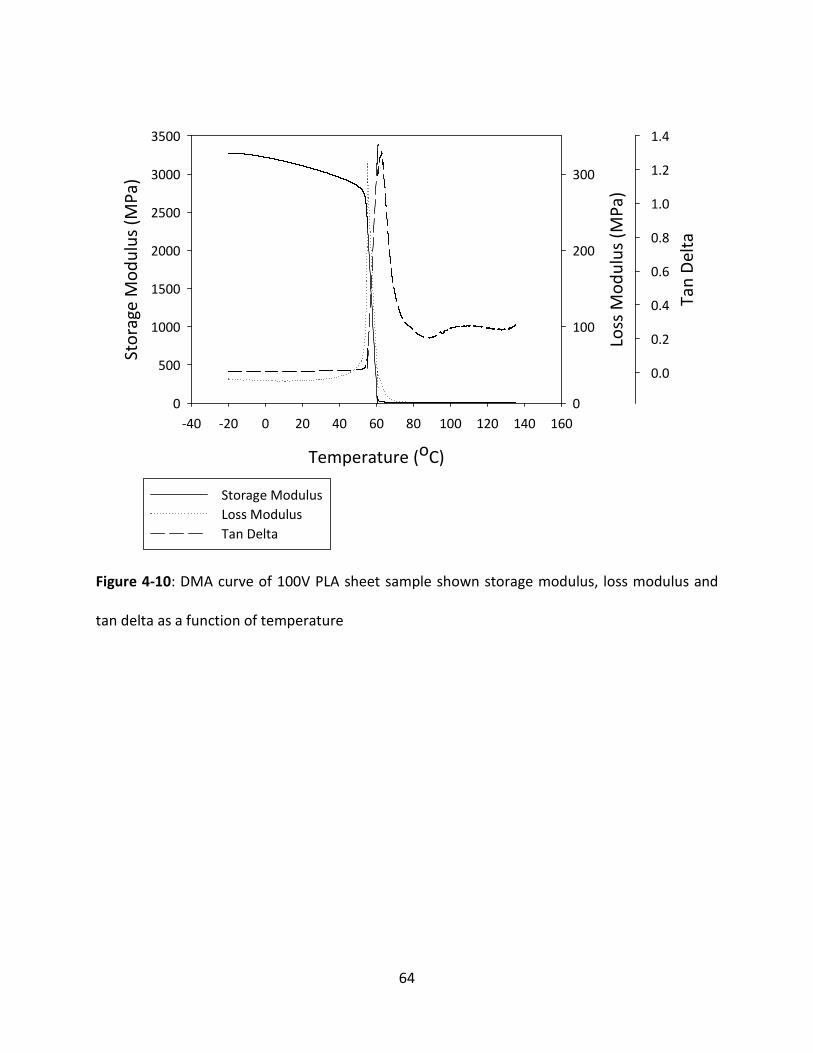
64
Temperature (oC)
-40 -20 0 20 40 60 80 100 120 140 160
Sto
rag
e M
od
ulu
s (M
Pa
)
0
500
1000
1500
2000
2500
3000
3500
Loss
Mo
du
lus
(MP
a)
0
100
200
300
Ta
n D
elt
a
0.0
0.2
0.4
0.6
0.8
1.0
1.2
1.4
Storage Modulus
Loss Modulus
Tan Delta
Figure 4-10: DMA curve of 100V PLA sheet sample shown storage modulus, loss modulus and
tan delta as a function of temperature
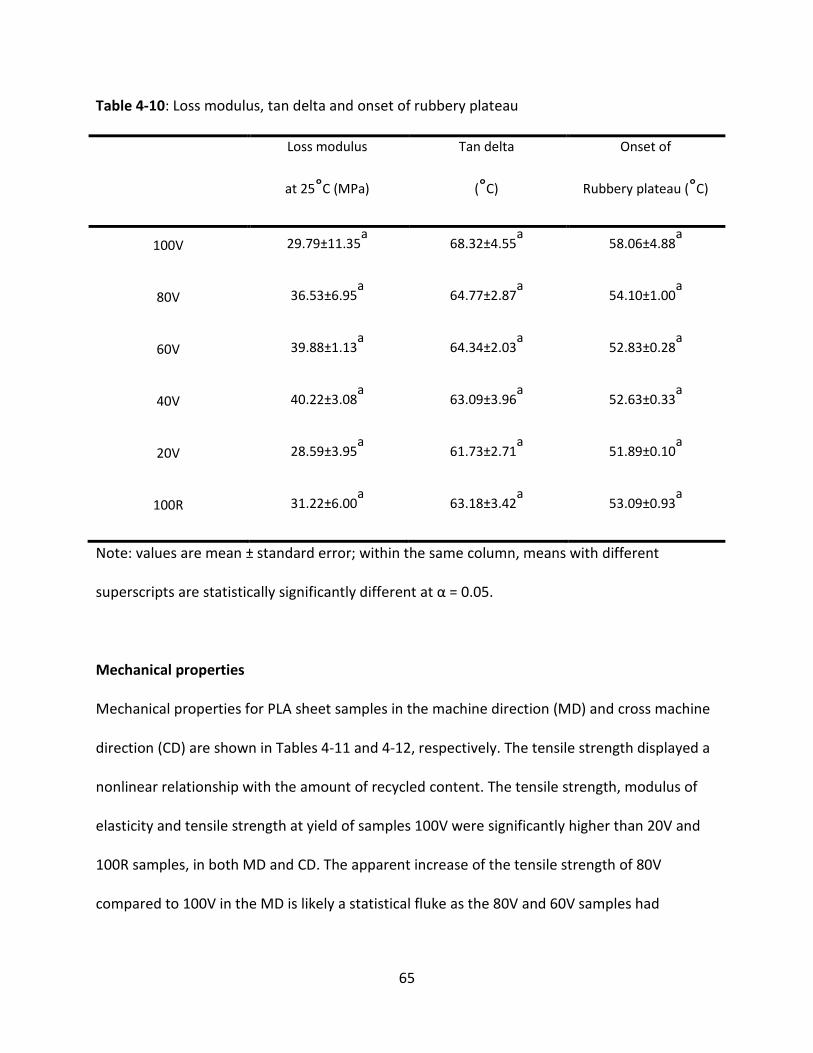
65
Table 4-10: Loss modulus, tan delta and onset of rubbery plateau
Loss modulus
at 25°C (MPa)
Tan delta
(°C)
Onset of
Rubbery plateau (°C)
100V 29.79±11.35a
68.32±4.55a 58.06±4.88
a
80V 36.53±6.95a 64.77±2.87
a 54.10±1.00
a
60V 39.88±1.13a 64.34±2.03
a 52.83±0.28
a
40V 40.22±3.08a 63.09±3.96
a 52.63±0.33
a
20V 28.59±3.95a 61.73±2.71
a 51.89±0.10
a
100R 31.22±6.00a 63.18±3.42
a 53.09±0.93
a
Note: values are mean ± standard error; within the same column, means with different
superscripts are statistically significantly different at α = 0.05.
Mechanical properties
Mechanical properties for PLA sheet samples in the machine direction (MD) and cross machine
direction (CD) are shown in Tables 4-11 and 4-12, respectively. The tensile strength displayed a
nonlinear relationship with the amount of recycled content. The tensile strength, modulus of
elasticity and tensile strength at yield of samples 100V were significantly higher than 20V and
100R samples, in both MD and CD. The apparent increase of the tensile strength of 80V
compared to 100V in the MD is likely a statistical fluke as the 80V and 60V samples had
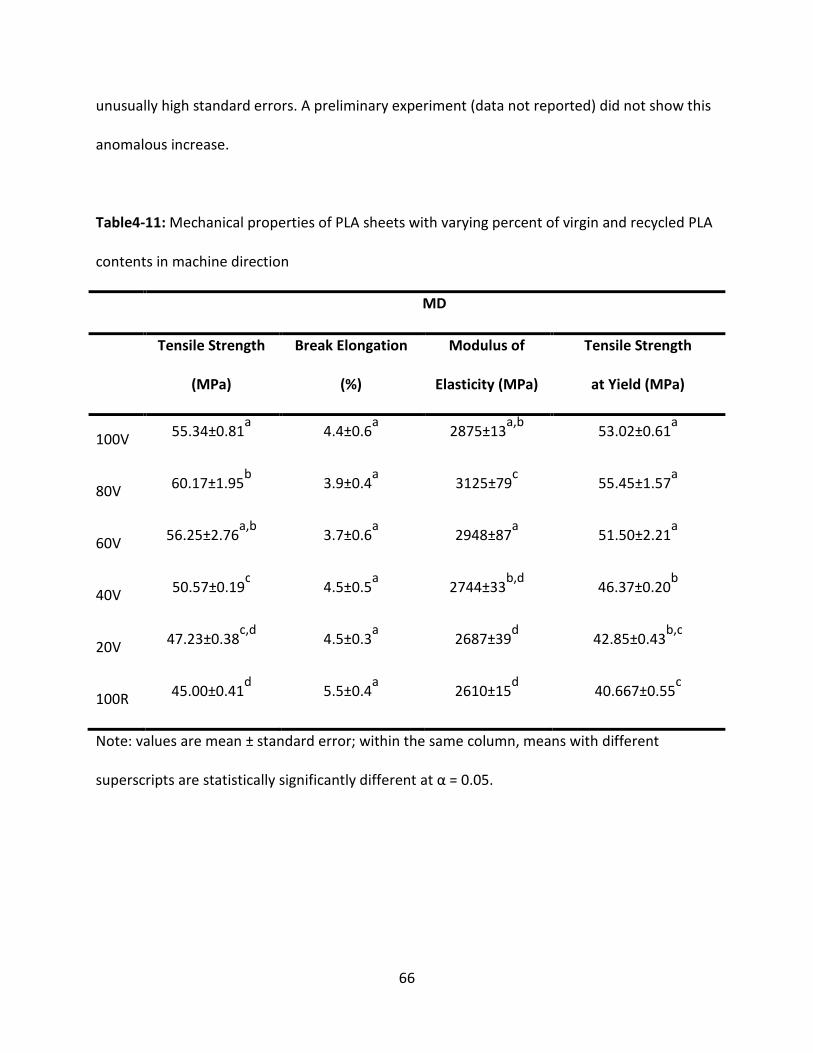
66
unusually high standard errors. A preliminary experiment (data not reported) did not show this
anomalous increase.
Table4-11: Mechanical properties of PLA sheets with varying percent of virgin and recycled PLA
contents in machine direction
MD
Tensile Strength
(MPa)
Break Elongation
(%)
Modulus of
Elasticity (MPa)
Tensile Strength
at Yield (MPa)
100V 55.34±0.81
a 4.4±0.6
a 2875±13
a,b 53.02±0.61
a
80V 60.17±1.95
b 3.9±0.4
a 3125±79
c 55.45±1.57
a
60V 56.25±2.76
a,b 3.7±0.6
a 2948±87
a 51.50±2.21
a
40V 50.57±0.19
c 4.5±0.5
a 2744±33
b,d 46.37±0.20
b
20V 47.23±0.38
c,d 4.5±0.3
a 2687±39
d 42.85±0.43
b,c
100R 45.00±0.41
d 5.5±0.4
a 2610±15
d 40.667±0.55
c
Note: values are mean ± standard error; within the same column, means with different
superscripts are statistically significantly different at α = 0.05.
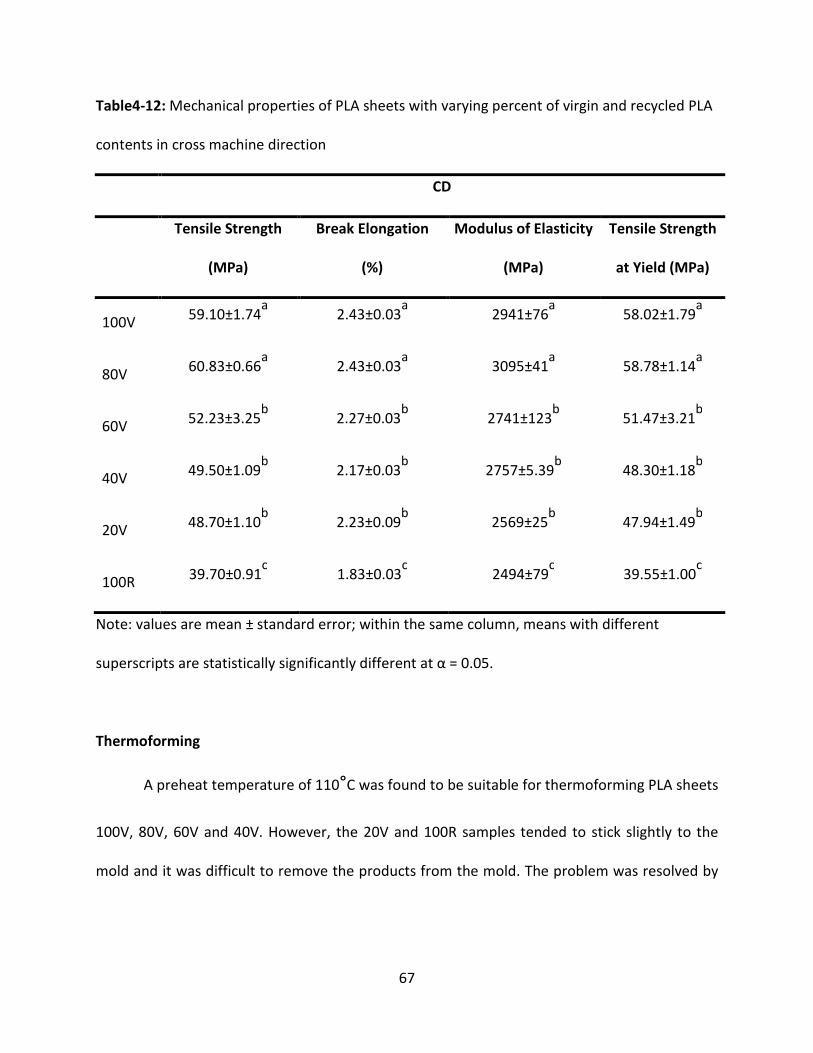
67
Table4-12: Mechanical properties of PLA sheets with varying percent of virgin and recycled PLA
contents in cross machine direction
CD
Tensile Strength
(MPa)
Break Elongation
(%)
Modulus of Elasticity
(MPa)
Tensile Strength
at Yield (MPa)
100V 59.10±1.74
a 2.43±0.03
a 2941±76
a 58.02±1.79
a
80V 60.83±0.66
a 2.43±0.03
a 3095±41
a 58.78±1.14
a
60V 52.23±3.25
b 2.27±0.03
b 2741±123
b 51.47±3.21
b
40V 49.50±1.09
b 2.17±0.03
b 2757±5.39
b 48.30±1.18
b
20V 48.70±1.10
b 2.23±0.09
b 2569±25
b 47.94±1.49
b
100R 39.70±0.91
c 1.83±0.03
c 2494±79
c 39.55±1.00
c
Note: values are mean ± standard error; within the same column, means with different
superscripts are statistically significantly different at α = 0.05.
Thermoforming
A preheat temperature of 110°C was found to be suitable for thermoforming PLA sheets
100V, 80V, 60V and 40V. However, the 20V and 100R samples tended to stick slightly to the
mold and it was difficult to remove the products from the mold. The problem was resolved by
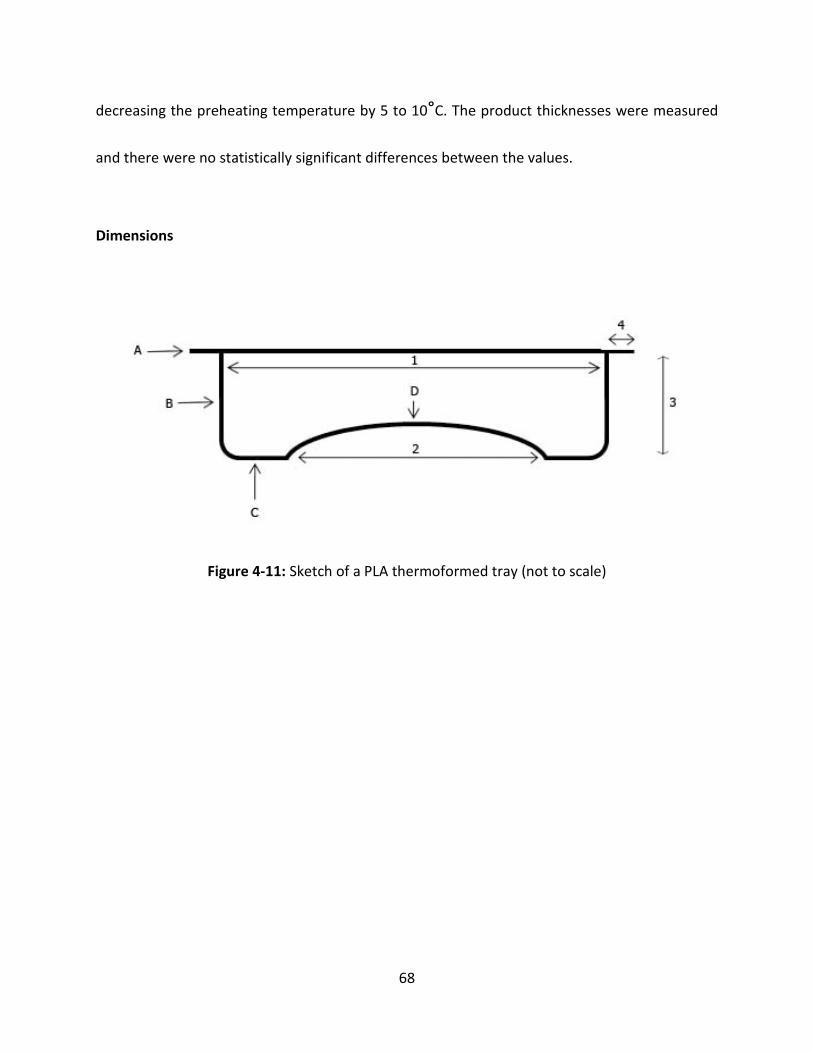
68
decreasing the preheating temperature by 5 to 10°C. The product thicknesses were measured
and there were no statistically significant differences between the values.
Dimensions
Figure 4-11: Sketch of a PLA thermoformed tray (not to scale)
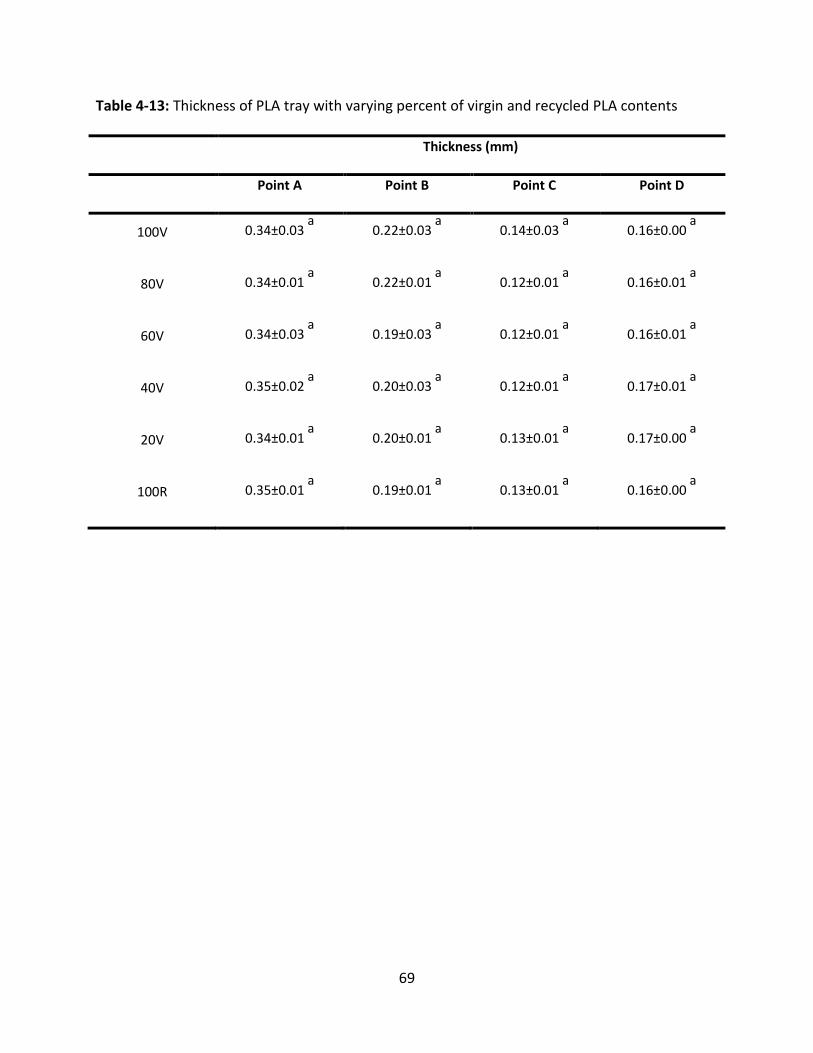
69
Table 4-13: Thickness of PLA tray with varying percent of virgin and recycled PLA contents
Thickness (mm)
Point A Point B Point C Point D
100V 0.34±0.03 a
0.22±0.03 a
0.14±0.03 a
0.16±0.00 a
80V 0.34±0.01 a
0.22±0.01 a
0.12±0.01 a
0.16±0.01 a
60V 0.34±0.03 a
0.19±0.03 a
0.12±0.01 a
0.16±0.01 a
40V 0.35±0.02 a
0.20±0.03 a
0.12±0.01 a
0.17±0.01 a
20V 0.34±0.01 a
0.20±0.01 a
0.13±0.01 a
0.17±0.00 a
100R 0.35±0.01 a
0.19±0.01 a
0.13±0.01 a
0.16±0.00 a
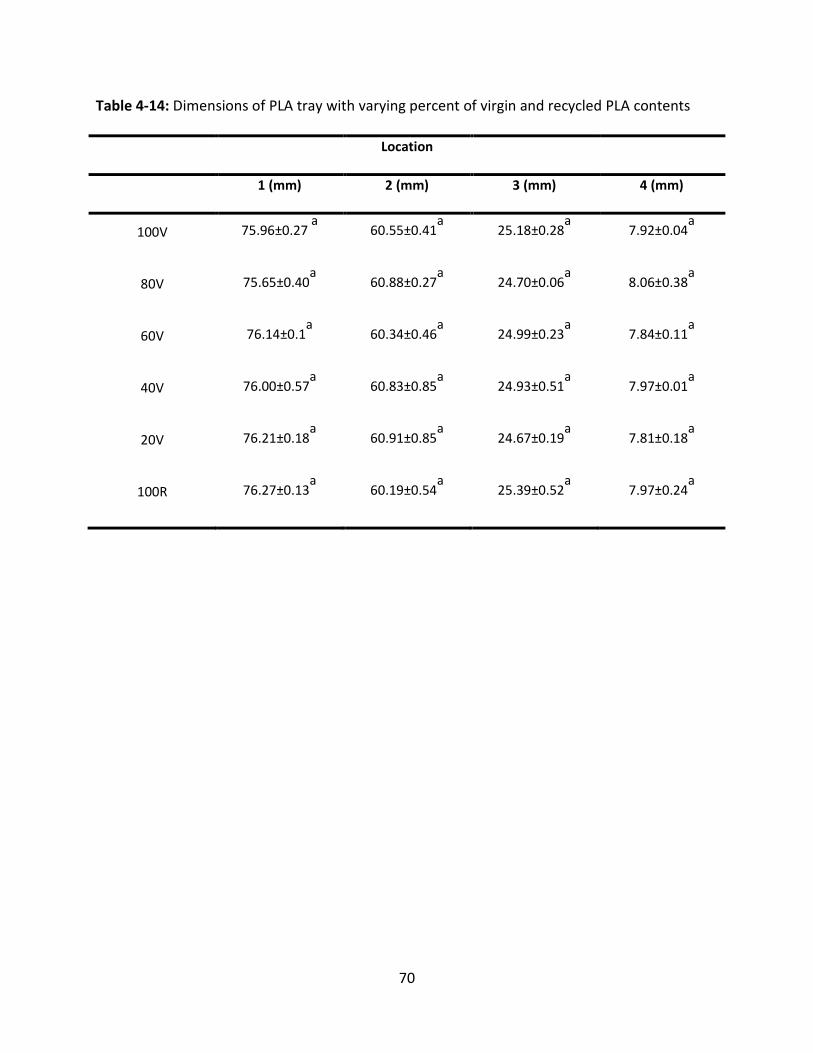
70
Table 4-14: Dimensions of PLA tray with varying percent of virgin and recycled PLA contents
Location
1 (mm) 2 (mm) 3 (mm) 4 (mm)
100V 75.96±0.27 a
60.55±0.41a 25.18±0.28
a 7.92±0.04
a
80V 75.65±0.40a
60.88±0.27a 24.70±0.06
a 8.06±0.38
a
60V 76.14±0.1a 60.34±0.46
a 24.99±0.23
a 7.84±0.11
a
40V 76.00±0.57a 60.83±0.85
a 24.93±0.51
a 7.97±0.01
a
20V 76.21±0.18a 60.91±0.85
a 24.67±0.19
a 7.81±0.18
a
100R 76.27±0.13a 60.19±0.54
a 25.39±0.52
a 7.97±0.24
a
71
CHAPTER 5 CONCLUSIONS AND RECOMMENDATIONS
Conclusions
Poly(lactide) PLA bottle flakes were subject to a mechanical recycling process, and later
blended with virgin PLA resin to fabricate PLA sheet for thermoforming. The midpoint of
recycled flake cleaning conditions with time of 15 min, temperature of 85 °C, NaOH
concentration 1 wt.-% and surfactant 0.3 wt.-% (adapted from the typical cleaning process for
recycling PET) was determined to be an appropriate cleaning condition for the PLA flakes. The
thicknesses of the produced sheet varied from 0.35 to 0.41 mm. The properties of PLA sheet
samples with various recycled contents were determined and compare with the properties of
the 100% virgin PLA sheet.
No statistically significant differences (α = 0.05) were found in density, Mn, PDI, ΔHc,
percentage of elongation at break and the Tg results from the DMA as a function of recycle
content. However, at 20% or more recycled content, the PLA sheets became darker. The sheet
generally absorbed more UV light in the 265 to 285 nm range. Further study is required to
determine the cause of this absorption. At 40% recycled content or higher, the color of the PLA
sheet became more bluish (b* decreased) and reddish (a* increased), but the color change for
the blue tone was predominant. All of the mechanical properties in the cross-machine direction
(tensile strength, percentage of elongation at break, modulus of elasticity and tensile strength
at yield) decreased. Recycled content of 60% or more resulted in a reduction of Mw, Tg, tensile
72
strength and tensile strength at yield in the MD direction. At 80% (sample 20V) recycled
content the Tm and machine direction modulus of elasticity of the PLA sheets decreased.
There was not enough evidence to confirm hydrolytic and thermal degradation since
peaks associated with degradation products were not visible in the FTIR spectra of 60V and
100R. The inferior properties of recycled samples indicated the existence of some degradation
from the recycling process. Nevertheless, all sample sheets were successfully thermoformed
into the trays without significant differences in the final dimensions.
Future work
This study provided information about the general properties and comparisons of the
virgin and recycled PLA extruded sheet. However, there were some limitations, and further
studies should be conducted in the future.
- Future study is needed to determine the properties of the thermoforming tray
- The biodegradability of the post-consumer recycled PLA.
- Other analysis techniques should be used to identify the mechanisms of degradation
and formation of byproducts during the mechanical recycling process.
- Other manufacturing processes for producing recycled PLA products should be
studied such as injection molding, blow molding, etc.
- Other aspects involving products with recycled PLA content should be studied such
as the limitations of mechanical recycling for PLA, target audiences and potential
markets for the products, comparative cost effectiveness of the use of recycled
versus virgin PLA, and evaluation of environmental effects of using recycled PLA.
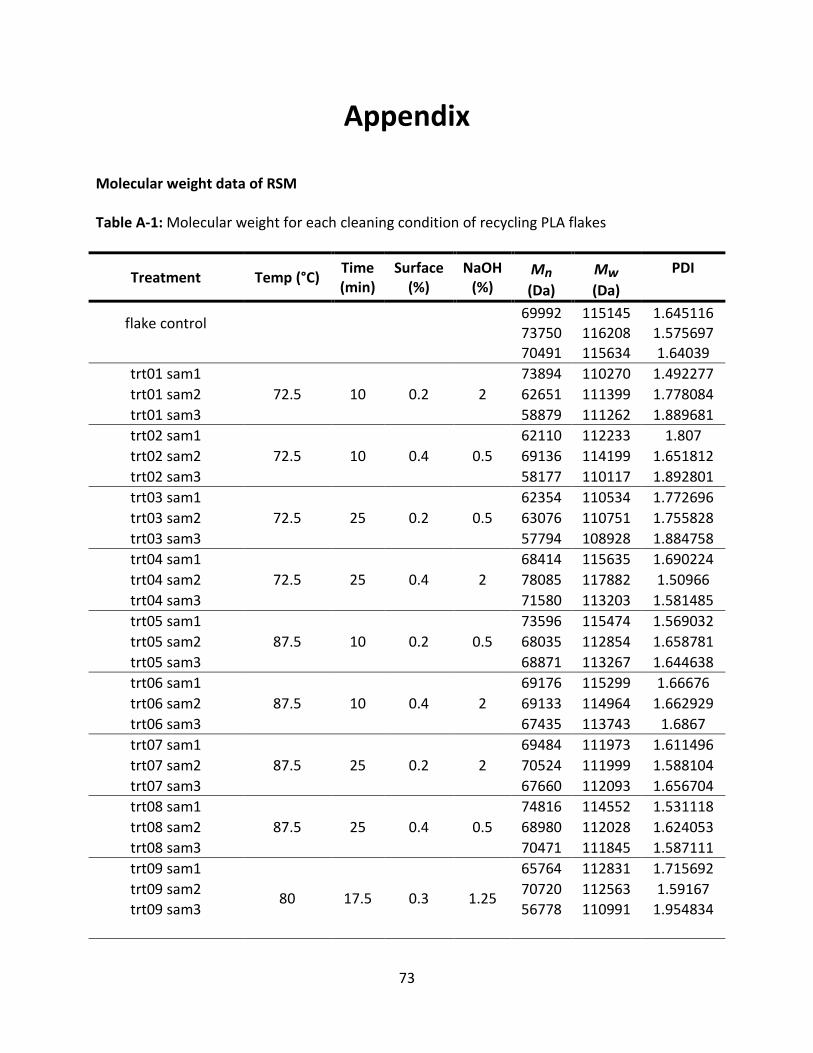
73
Appendix
Molecular weight data of RSM
Table A-1: Molecular weight for each cleaning condition of recycling PLA flakes
Treatment Temp (°C) Time
(min)
Surface
(%)
NaOH
(%) Mn
(Da)
Mw
(Da)
PDI
flake control
69992 115145 1.645116
73750 116208 1.575697
70491 115634 1.64039
trt01 sam1
72.5 10 0.2 2
73894 110270 1.492277
trt01 sam2 62651 111399 1.778084
trt01 sam3 58879 111262 1.889681
trt02 sam1
72.5 10 0.4 0.5
62110 112233 1.807
trt02 sam2 69136 114199 1.651812
trt02 sam3 58177 110117 1.892801
trt03 sam1
72.5 25 0.2 0.5
62354 110534 1.772696
trt03 sam2 63076 110751 1.755828
trt03 sam3 57794 108928 1.884758
trt04 sam1
72.5 25 0.4 2
68414 115635 1.690224
trt04 sam2 78085 117882 1.50966
trt04 sam3 71580 113203 1.581485
trt05 sam1
87.5 10 0.2 0.5
73596 115474 1.569032
trt05 sam2 68035 112854 1.658781
trt05 sam3 68871 113267 1.644638
trt06 sam1
87.5 10 0.4 2
69176 115299 1.66676
trt06 sam2 69133 114964 1.662929
trt06 sam3 67435 113743 1.6867
trt07 sam1
87.5 25 0.2 2
69484 111973 1.611496
trt07 sam2 70524 111999 1.588104
trt07 sam3 67660 112093 1.656704
trt08 sam1
87.5 25 0.4 0.5
74816 114552 1.531118
trt08 sam2 68980 112028 1.624053
trt08 sam3 70471 111845 1.587111
trt09 sam1
80 17.5 0.3 1.25
65764 112831 1.715692
trt09 sam2 70720 112563 1.59167
trt09 sam3
56778
110991
1.954834
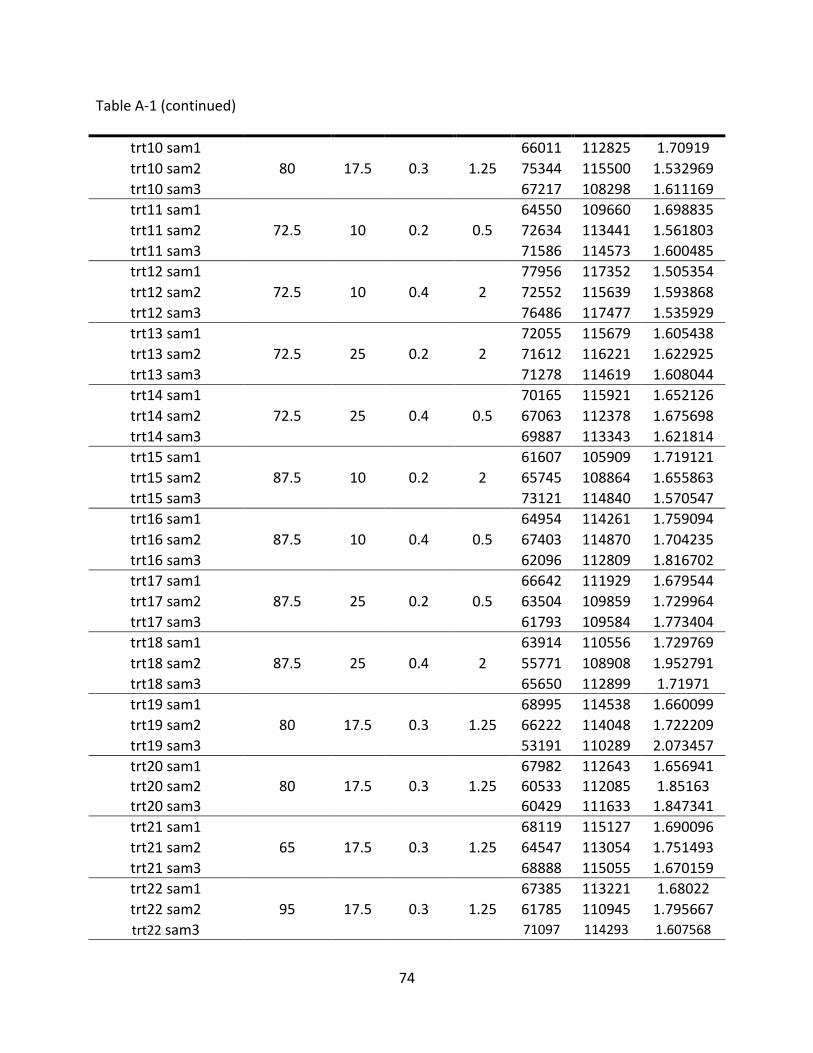
74
Table A-1 (continued)
trt10 sam1
80 17.5 0.3 1.25
66011 112825 1.70919
trt10 sam2 75344 115500 1.532969
trt10 sam3 67217 108298 1.611169
trt11 sam1
72.5 10 0.2 0.5
64550 109660 1.698835
trt11 sam2 72634 113441 1.561803
trt11 sam3 71586 114573 1.600485
trt12 sam1
72.5 10 0.4 2
77956 117352 1.505354
trt12 sam2 72552 115639 1.593868
trt12 sam3 76486 117477 1.535929
trt13 sam1
72.5 25 0.2 2
72055 115679 1.605438
trt13 sam2 71612 116221 1.622925
trt13 sam3 71278 114619 1.608044
trt14 sam1
72.5 25 0.4 0.5
70165 115921 1.652126
trt14 sam2 67063 112378 1.675698
trt14 sam3 69887 113343 1.621814
trt15 sam1
87.5 10 0.2 2
61607 105909 1.719121
trt15 sam2 65745 108864 1.655863
trt15 sam3 73121 114840 1.570547
trt16 sam1
87.5 10 0.4 0.5
64954 114261 1.759094
trt16 sam2 67403 114870 1.704235
trt16 sam3 62096 112809 1.816702
trt17 sam1
87.5 25 0.2 0.5
66642 111929 1.679544
trt17 sam2 63504 109859 1.729964
trt17 sam3 61793 109584 1.773404
trt18 sam1
87.5 25 0.4 2
63914 110556 1.729769
trt18 sam2 55771 108908 1.952791
trt18 sam3 65650 112899 1.71971
trt19 sam1
80 17.5 0.3 1.25
68995 114538 1.660099
trt19 sam2 66222 114048 1.722209
trt19 sam3 53191 110289 2.073457
trt20 sam1
80 17.5 0.3 1.25
67982 112643 1.656941
trt20 sam2 60533 112085 1.85163
trt20 sam3 60429 111633 1.847341
trt21 sam1
65 17.5 0.3 1.25
68119 115127 1.690096
trt21 sam2 64547 113054 1.751493
trt21 sam3 68888 115055 1.670159
trt22 sam1
95 17.5 0.3 1.25
67385 113221 1.68022
trt22 sam2 61785 110945 1.795667
trt22 sam3 71097 114293 1.607568
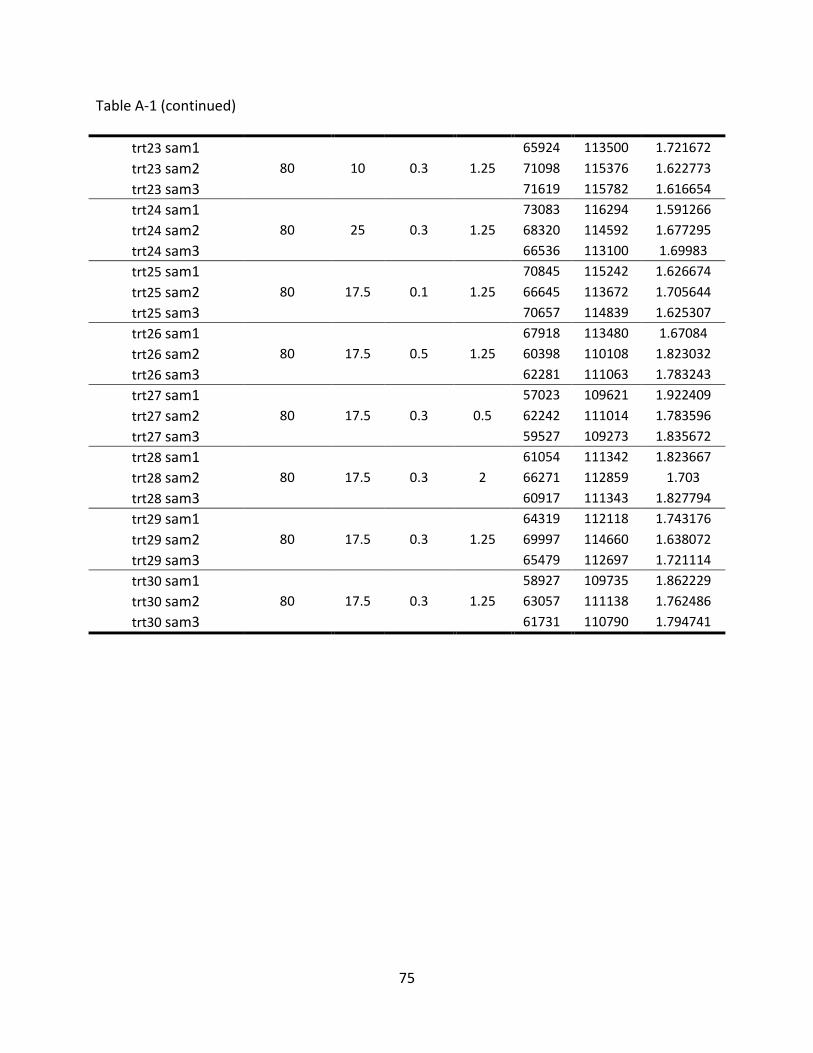
75
Table A-1 (continued)
trt23 sam1
80 10 0.3 1.25
65924 113500 1.721672
trt23 sam2 71098 115376 1.622773
trt23 sam3 71619 115782 1.616654
trt24 sam1
80 25 0.3 1.25
73083 116294 1.591266
trt24 sam2 68320 114592 1.677295
trt24 sam3 66536 113100 1.69983
trt25 sam1
80 17.5 0.1 1.25
70845 115242 1.626674
trt25 sam2 66645 113672 1.705644
trt25 sam3 70657 114839 1.625307
trt26 sam1
80 17.5 0.5 1.25
67918 113480 1.67084
trt26 sam2 60398 110108 1.823032
trt26 sam3 62281 111063 1.783243
trt27 sam1
80 17.5 0.3 0.5
57023 109621 1.922409
trt27 sam2 62242 111014 1.783596
trt27 sam3 59527 109273 1.835672
trt28 sam1
80 17.5 0.3 2
61054 111342 1.823667
trt28 sam2 66271 112859 1.703
trt28 sam3 60917 111343 1.827794
trt29 sam1
80 17.5 0.3 1.25
64319 112118 1.743176
trt29 sam2 69997 114660 1.638072
trt29 sam3 65479 112697 1.721114
trt30 sam1
80 17.5 0.3 1.25
58927 109735 1.862229
trt30 sam2 63057 111138 1.762486
trt30 sam3 61731 110790 1.794741
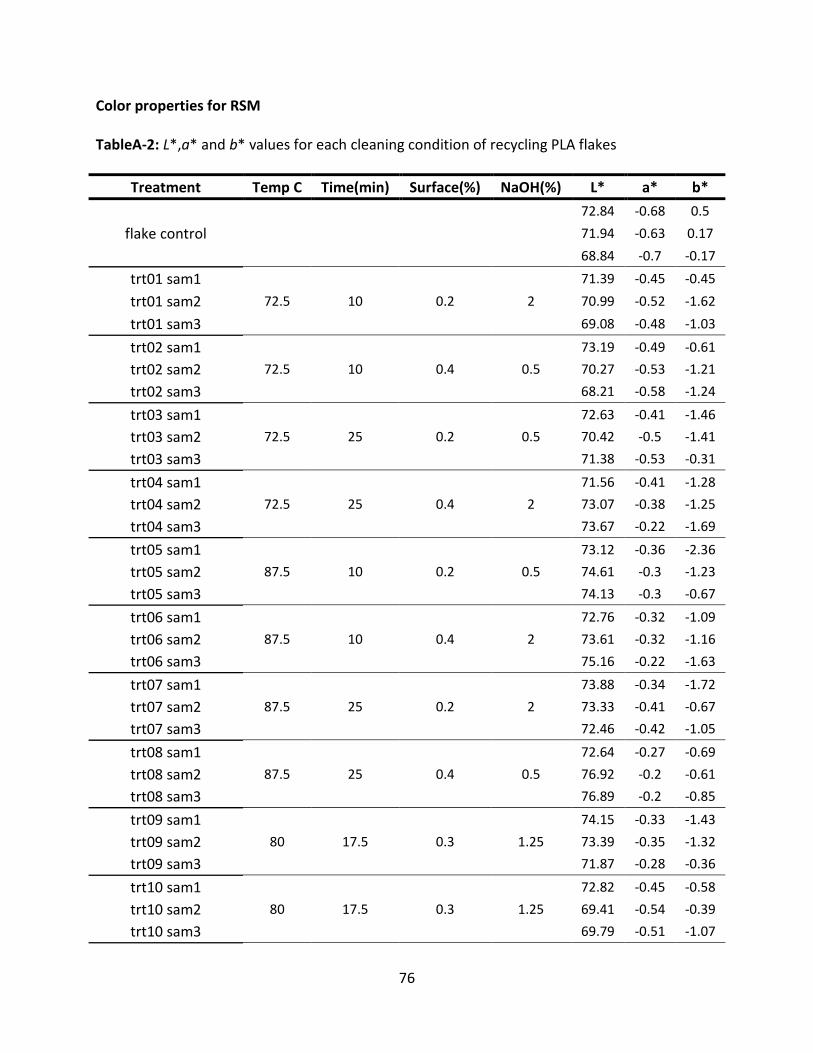
76
Color properties for RSM
TableA-2: L*,a* and b* values for each cleaning condition of recycling PLA flakes
Treatment Temp C Time(min) Surface(%) NaOH(%) L* a* b*
flake control
72.84 -0.68 0.5
71.94 -0.63 0.17
68.84 -0.7 -0.17
trt01 sam1
72.5 10 0.2 2
71.39 -0.45 -0.45
trt01 sam2 70.99 -0.52 -1.62
trt01 sam3 69.08 -0.48 -1.03
trt02 sam1
72.5 10 0.4 0.5
73.19 -0.49 -0.61
trt02 sam2 70.27 -0.53 -1.21
trt02 sam3 68.21 -0.58 -1.24
trt03 sam1
72.5 25 0.2 0.5
72.63 -0.41 -1.46
trt03 sam2 70.42 -0.5 -1.41
trt03 sam3 71.38 -0.53 -0.31
trt04 sam1
72.5 25 0.4 2
71.56 -0.41 -1.28
trt04 sam2 73.07 -0.38 -1.25
trt04 sam3 73.67 -0.22 -1.69
trt05 sam1
87.5 10 0.2 0.5
73.12 -0.36 -2.36
trt05 sam2 74.61 -0.3 -1.23
trt05 sam3 74.13 -0.3 -0.67
trt06 sam1
87.5 10 0.4 2
72.76 -0.32 -1.09
trt06 sam2 73.61 -0.32 -1.16
trt06 sam3 75.16 -0.22 -1.63
trt07 sam1
87.5 25 0.2 2
73.88 -0.34 -1.72
trt07 sam2 73.33 -0.41 -0.67
trt07 sam3 72.46 -0.42 -1.05
trt08 sam1
87.5 25 0.4 0.5
72.64 -0.27 -0.69
trt08 sam2 76.92 -0.2 -0.61
trt08 sam3 76.89 -0.2 -0.85
trt09 sam1
80 17.5 0.3 1.25
74.15 -0.33 -1.43
trt09 sam2 73.39 -0.35 -1.32
trt09 sam3 71.87 -0.28 -0.36
trt10 sam1
80 17.5 0.3 1.25
72.82 -0.45 -0.58
trt10 sam2 69.41 -0.54 -0.39
trt10 sam3 69.79 -0.51 -1.07
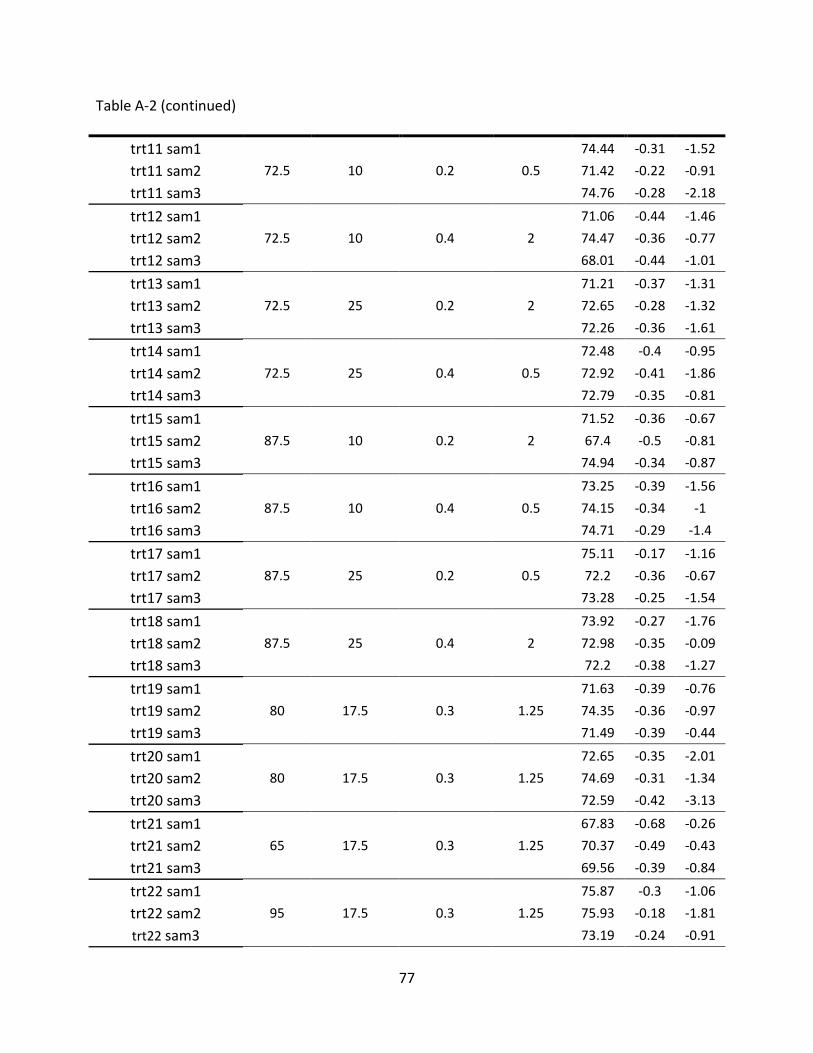
77
Table A-2 (continued)
trt11 sam1
72.5 10 0.2 0.5
74.44 -0.31 -1.52
trt11 sam2 71.42 -0.22 -0.91
trt11 sam3 74.76 -0.28 -2.18
trt12 sam1
72.5 10 0.4 2
71.06 -0.44 -1.46
trt12 sam2 74.47 -0.36 -0.77
trt12 sam3 68.01 -0.44 -1.01
trt13 sam1
72.5 25 0.2 2
71.21 -0.37 -1.31
trt13 sam2 72.65 -0.28 -1.32
trt13 sam3 72.26 -0.36 -1.61
trt14 sam1
72.5 25 0.4 0.5
72.48 -0.4 -0.95
trt14 sam2 72.92 -0.41 -1.86
trt14 sam3 72.79 -0.35 -0.81
trt15 sam1
87.5 10 0.2 2
71.52 -0.36 -0.67
trt15 sam2 67.4 -0.5 -0.81
trt15 sam3 74.94 -0.34 -0.87
trt16 sam1
87.5 10 0.4 0.5
73.25 -0.39 -1.56
trt16 sam2 74.15 -0.34 -1
trt16 sam3 74.71 -0.29 -1.4
trt17 sam1
87.5 25 0.2 0.5
75.11 -0.17 -1.16
trt17 sam2 72.2 -0.36 -0.67
trt17 sam3 73.28 -0.25 -1.54
trt18 sam1
87.5 25 0.4 2
73.92 -0.27 -1.76
trt18 sam2 72.98 -0.35 -0.09
trt18 sam3 72.2 -0.38 -1.27
trt19 sam1
80 17.5 0.3 1.25
71.63 -0.39 -0.76
trt19 sam2 74.35 -0.36 -0.97
trt19 sam3 71.49 -0.39 -0.44
trt20 sam1
80 17.5 0.3 1.25
72.65 -0.35 -2.01
trt20 sam2 74.69 -0.31 -1.34
trt20 sam3 72.59 -0.42 -3.13
trt21 sam1
65 17.5 0.3 1.25
67.83 -0.68 -0.26
trt21 sam2 70.37 -0.49 -0.43
trt21 sam3 69.56 -0.39 -0.84
trt22 sam1
95 17.5 0.3 1.25
75.87 -0.3 -1.06
trt22 sam2 75.93 -0.18 -1.81
trt22 sam3 73.19 -0.24 -0.91
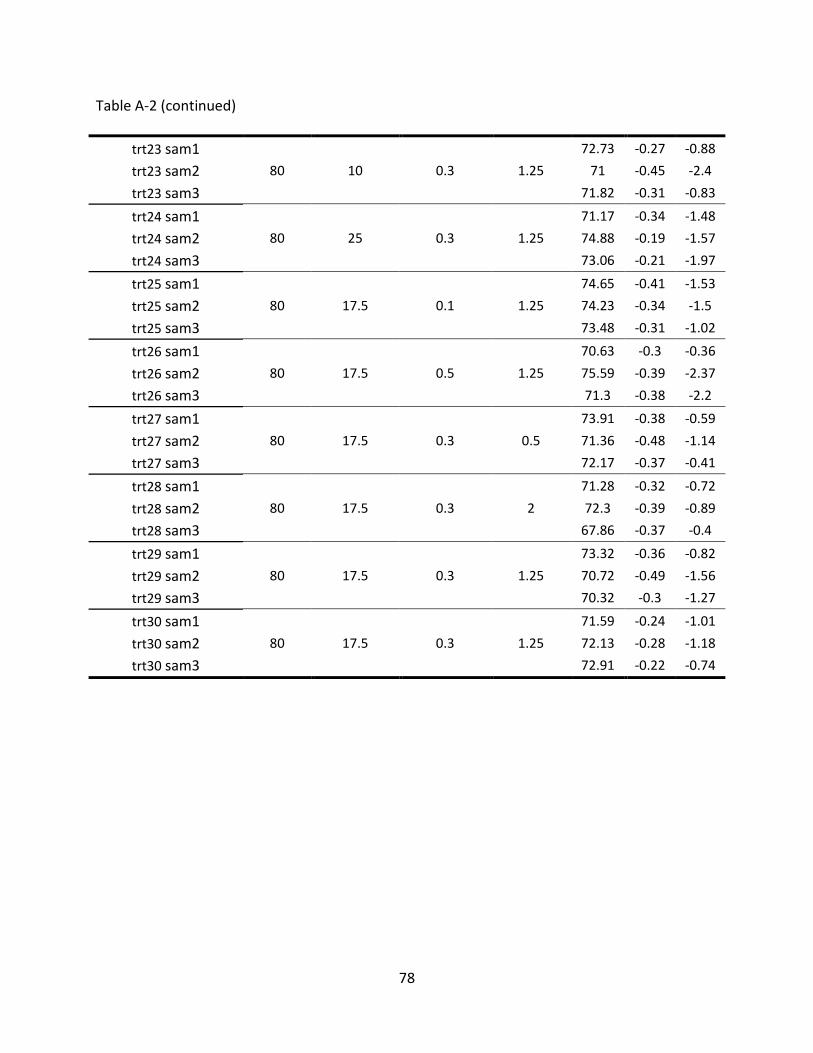
78
Table A-2 (continued)
trt23 sam1
80 10 0.3 1.25
72.73 -0.27 -0.88
trt23 sam2 71 -0.45 -2.4
trt23 sam3 71.82 -0.31 -0.83
trt24 sam1
80 25 0.3 1.25
71.17 -0.34 -1.48
trt24 sam2 74.88 -0.19 -1.57
trt24 sam3 73.06 -0.21 -1.97
trt25 sam1
80 17.5 0.1 1.25
74.65 -0.41 -1.53
trt25 sam2 74.23 -0.34 -1.5
trt25 sam3 73.48 -0.31 -1.02
trt26 sam1
80 17.5 0.5 1.25
70.63 -0.3 -0.36
trt26 sam2 75.59 -0.39 -2.37
trt26 sam3 71.3 -0.38 -2.2
trt27 sam1
80 17.5 0.3 0.5
73.91 -0.38 -0.59
trt27 sam2 71.36 -0.48 -1.14
trt27 sam3 72.17 -0.37 -0.41
trt28 sam1
80 17.5 0.3 2
71.28 -0.32 -0.72
trt28 sam2 72.3 -0.39 -0.89
trt28 sam3 67.86 -0.37 -0.4
trt29 sam1
80 17.5 0.3 1.25
73.32 -0.36 -0.82
trt29 sam2 70.72 -0.49 -1.56
trt29 sam3 70.32 -0.3 -1.27
trt30 sam1
80 17.5 0.3 1.25
71.59 -0.24 -1.01
trt30 sam2 72.13 -0.28 -1.18
trt30 sam3 72.91 -0.22 -0.74

79
REFERENCES
80
REFERENCES
1. Auras, R., Poly(lactic acid). Encyclopedia of Polymer Science and Technology. 2002: John
Wiley & Sons, Inc.
2. NatureWorks. 2000 Series for Extrusion / Thermoforming. 2011 [cited 2011 April 30,];
Available from: http://www.natureworksllc.com/Technical-Resources/2000-Series.aspx.
3. NatureWorks. 7000 Series for ISBM Bottles. 2011 [cited 2011 April 30,]; Available from:
http://www.natureworksllc.com/Technical-Resources/7000-Series.aspx.
4. NatureWorks. Incineration. 2011 [cited 2011 May 1,]; Available from:
http://www.natureworksllc.com/The-Ingeo-Journey/End-of-Life-
Options/Incineration.aspx.
5. Auras, R., B. Harte, and S. Selke, An Overview of Polylactides as Packaging Materials.
Macromolecular Bioscience, 2004. 4(9): p. 835-864.
6. EPA. Waste; Text Version of Municipal Solid Waste Charts. 2011 [cited 2011 April 27,];
Available from: http://www.epa.gov/wastes/facts-text.htm#chart1.
7. American Chemistry Council, P.I.P.S.G., 2009 Percentage Distribution of Thermoplastic
Resins Sales & Captive Use by Major Market. 2010, American Chemistry Council.
8. Selke, S.E.M., J.D. Culter, and R.J. Hernandez, Plstics Packaging Properties, Processing,
Applications and Regulations. 2000: Hanser Gardner Publications, Inc. 6915 Valley
Avenue, Cincinnati, Ohio 455244-3029, USA.
9. EPA, Municipal Solid Waste inThe United States. 2010, United States Environmental
Protection Agency Office of Solid Waste (5306P).
10. EPA, Wastes - Resource Conservation - Reduce, Reuse, Recycle. 2011, U.S. Environmental
Protection Agentcy.
81
11. EPA, Wastes - Resource Conservation - Reduce, Reuse, Recycle - Composting. 2011, U.S.
Environmental Protection Agency.
12. Association of Postconsumer Plastic Recyclers, 2009 UNITED STATES NATIONAL
POSTCONSUMER PLASTICS BOTTLE RECYCLING REPORT. 2010, American Chemistry
Council.
13. Auras, R.A., Investigation of Polylactide as Packaging Material, in School of Packaging.
2004, Michigan State University: East Lansing.
14. NatureWorks, Renewing Ingeo: End-of-Life Options. 2011.
15. Tsuji, H., H. Daimon, and K. Fujie, A New Strategy for Recycling and Preparation of Poly(l-
lactic acid):� Hydrolysis in the Melt. Biomacromolecules, 2003. 4(3): p. 835-840.
16. Lunt, J. and R.L. SHAFER, Polylactic Acid Polymers from Corn. Applications in the Textiles
Industry. Journal of Industrial Textiles, 2000. Volume 29: p. 191 - 205
17. Balkcom, M., B. Welt, and K. Berger, Notes from the Packaging Laboratory: Polylactic
Acid -- An Exciting New Packaging Material. 2002(ABE339).
18. Vink, E.T.H., et al., Applications of life cycle assessment to NatureWorks(TM) polylactide
(PLA) production. Polymer Degradation and Stability, 2003. 80(3): p. 403-419.
19. Lim, L.T., R. Auras, and M. Rubino, Processing technologies for poly(lactic acid). Progress
in Polymer Science, 2008. 33(8): p. 820-852.
20. NatureWorks. Products and Applications. 2011 [cited 2011 March]; Available from:
http://www.natureworksllc.com/.
21. chemicals-technology.com. Futerro Bioplastics Production Plant. 2011 [cited 2011 April,
2011]; Available from: http://www.chemicals-
technology.com/projects/futerrobioplasticspi/.
22. Purac. Press Release. 2011 [cited 2011 April, 2011]; Available from:
http://www.purac.com/EN/About_us/News/Press-release-Indorama-Venture-
Collaboration.aspx.
82
23. Datta, R., et al., Technological and economic potential of poly(lactic acid) and lactic acid
derivatives. FEMS Microbiology Reviews, 1995. 16(2-3): p. 221-231.
24. Cheng, Y., et al., Polylactic acid (PLA) synthesis and modifications: a review. Frontiers of
Chemistry in China, 2009. 4(3): p. 259-264.
25. Drumright, R.E., P.R. Gruber, and D.E. Henton, Polylactic Acid Technology. Advanced
Materials, 2000. 12(23): p. 1841-1846.
26. Belgacem, M.N. and A. Gandini, Monomers, Polymers and Composites from Renewable
Resources, ed. A.G. Mohamed N. Belgacem. 2008: Elsevier Ltd., The Boulevard, Langford
Lane, Kidlington, Oxford OX5 1GB, UK.
27. Ajioka, M., et al., Aliphatic polyesters and their copolymers synthesized through direct
condensation polymerization. Polymer Degradation and Stability, 1998. 59(1-3): p. 137-
143.
28. Garlotta, D., A Literature Review of Poly(Lactic Acid). Journal of Polymers and the
Environment, 2001. 9(2): p. 63-84.
29. Kolstad, J.J., Crystallization kinetics of poly(L-lactide-co-meso-lactide). Journal of Applied
Polymer Science, 1996. 62(7): p. 1079-1091.
30. Lunt, J., Large-scale production, properties and commercial applications of polylactic
acid polymers. Polymer Degradation and Stability, 1998. 59(1-3): p. 145-152.
31. Sinclair, R.G., The Case for Polylactic Acid as a Commodity Packaging Plastic. Journal of
Macromolecular Science, Part A: Pure and Applied Chemistry, 1996. 33(5): p. 585 - 597.
32. Bendix, D., Chemical synthesis of polylactide and its copolymers for medical applications.
Polymer Degradation and Stability, 1998. 59(1-3): p. 129-135.
33. Kricheldorf, H.R., Syntheses and application of polylactides. Chemosphere, 2001. 43(1):
p. 49-54.
34. Kricheldorf, H.R., et al., Polylactides - synthesis, characterization and medical
application. Macromolecular Symposia, 1996. 103(1): p. 85-102.
83
35. Verespej, M. NatureWorks doubling Ingeo PLA resin capacity 2009 [cited 2011 April
28,]; Available from: http://plasticsnews.com/headlines2.html?id=1245938177.
36. Oil-price.net. Crude Oil and Commodity Prices. 2011 [cited 2011 April 30,]; Available
from: http://www.oil-price.net/.
37. Lim, L.-T., K. Cink, and T. Vanyo, Processing of Poly(Lactic Acid). Poly(Lactic Acid). 2010:
John Wiley & Sons, Inc. 189-215.
38. Tsuji, H., Hydrolytic Degradation. Poly(Lactic Acid). 2010: John Wiley & Sons, Inc. 343-
381.
39. Nishida, H., Thermal Degradation. Poly(Lactic Acid). 2010: John Wiley & Sons, Inc. 401-
412.
40. Kopinke, F.D., et al., Thermal decomposition of biodegradable polyesters--II. Poly(lactic
acid). Polymer Degradation and Stability, 1996. 53(3): p. 329-342.
41. McNeill, I.C. and H.A. Leiper, Degradation studies of some polyesters and
polycarbonates--2. Polylactide: Degradation under isothermal conditions, thermal
degradation mechanism and photolysis of the polymer. Polymer Degradation and
Stability, 1985. 11(4): p. 309-326.
42. Jamshidi, K., S.H. Hyon, and Y. Ikada, Thermal characterization of polylactides. Polymer,
1988. 29(12): p. 2229-2234.
43. Glasbrenner, B., NatureWorks® PLA – Commercial Development of Biopolymers on a
World Scale. GPEC 2005, 2005.
44. Vink, E.T.H., et al., The Sustainability of NatureWorks™ Polylactide Polymers and Ingeo™
Polylactide Fibers: an Update of the Future. Macromolecular Bioscience, 2004. 4(6): p.
551-564.
45. Calabia, B.P., et al., Biodegradation. Poly(Lactic Acid). 2010: John Wiley & Sons, Inc. 423-
430.

84
46. Ghorpade, V.M., A. Gennadios, and M.A. Hanna, Laboratory composting of extruded
poly(lactic acid) sheets. Bioresource Technology, 2001. 76(1): p. 57-61.
47. Tokiwa, Y. and B. Calabia, Biodegradability and biodegradation of poly(lactide). Applied
Microbiology and Biotechnology, 2006. 72(2): p. 244-251.
48. Ho, K.-L.G., et al., Degradation of Polylactic Acid (PLA) Plastic in Costa Rican Soil and
Iowa State University Compost Rows. Journal of Polymers and the Environment, 1999.
7(4): p. 173-177.
49. Ohkita, T. and S.-H. Lee, Thermal degradation and biodegradability of poly (lactic
acid)/corn starch biocomposites. Journal of Applied Polymer Science, 2006. 100(4): p.
3009-3017.
50. NatureWorks. Significant Years for Ingeo Natural Plastic Bottles Made From Plants, Not
Oil. 2009 [cited 2011 May 1,]; Available from: http://www.csrwire.com.
51. NatureWorks. Ingeo News: Volume 5, Issue1. 2008 [cited 2011 May 1,]; Available from:
http://www.natureworksllc.com/news-and-events/ingeonews.
52. NatureWorks. Buy Back Program 2011 [cited 2011 May 1,]; Available from:
http://www.natureworksllc.com/The-Ingeo-Journey/End-of-Life-Options/Feedstock-
Recycling/Buy%20Back%20Program.aspx.
53. Scott, D.M., A two-colour near-infrared sensor for sorting recycled plastic waste
Measurement Science and Technology, 1995. 6: p. 156.
54. Foster, S., Domestic Mixed Plastics Packaing Waste Management Options, in An
assessment of the technical, environmental and economic viability of recycling domestic
mixed plastics packaging waste in the UK. 2008, WARP.
55. Spychaj, T. and D. Paszun, New trends in chemical recycling of poly(ethylene
terephthalate). Macromolecular Symposia, 1998. 135(1): p. 137-145.
56. Kaminsky, W., Chemical recycling of mixed plastics of pyrolysis. Advances in Polymer
Technology, 1995. 14(4): p. 337-344.

85
57. Paszun, D. and T. Spychaj, Chemical Recycling of Poly(ethylene terephthalate). Industrial
& Engineering Chemistry Research, 1997. 36(4): p. 1373-1383.
58. Achilias, D.S., et al., Chemical recycling of plastic wastes made from polyethylene (LDPE
and HDPE) and polypropylene (PP). Journal of Hazardous Materials, 2007. 149(3): p. 536-
542.
59. Brandrup, J., et al., Recycling and Recovery of Plastics. 1995: Hanser/ Gardner
Publications, Inc. 6600 Clough Pike, Cincinnati, Ohio 45244-4090, USA.
60. Montgomery, D.C., Design and Analysis of Experiment. fifth ed. 2001, New York: John
Wiley & Sons, Inc., 605 Third Ave., New York, NY, 10158-0012.
61. ASTM standard D1505, "Standard Test Method for Density of Plastics by the Density-
Gradient Technique". 2003, ASTM International: West Conshohocken, PA, DOI:
10.1520/D1505-03, www.astm.org.
62. ASTM Standard D3418, "Transition Temperatures and Enthalpies of Fusion and
Crystallization of Polymers by Differential Scanning Calorimetry". 2003, ASTM
International,: West Conshohocken, PA, DOI: 10.1520/D3418-03, www.astm.org.
63. ASTM Standard D882, "Tensile Properties of Thin Plastic Sheeting". 2002, ASTM
International, : West Conshohocken, PA, DOI: 10.1520/D0882-02, www.astm.org.
64. Fan, Y., et al., Pyrolysis kinetics of poly(-lactide) with carboxyl and calcium salt end
structures. Polymer Degradation and Stability, 2003. 79(3): p. 547-562.
65. Signori, F., M.-B. Coltelli, and S. Bronco, Thermal degradation of poly(lactic acid) (PLA)
and poly(butylene adipate-co-terephthalate) (PBAT) and their blends upon melt
processing. Polymer Degradation and Stability, 2009. 94(1): p. 74-82.
66. Gupta, M.C. and V.G. Deshmukh, Thermal oxidative degradation of poly-lactic acid.
Colloid & Polymer Science, 1982. 260(5): p. 514-517.
67. Fan, Y., et al., Thermal degradation behaviour of poly(lactic acid) stereocomplex.
Polymer Degradation and Stability, 2004. 86(2): p. 197-208.
Top Related