


Languages
Pages
Legal


Assessment of the PCDD/F fate from MSWI residue
used in road construction in France
Rabia Badreddine, Denis Francois
To cite this version:
Rabia Badreddine, Denis Francois. Assessment of the PCDD/F fate from MSWI residueused in road construction in France. Chemosphere, Elsevier, 2009, 74 (3), pp 363-369.<10.1016/j.chemosphere.2008.09.028>. <hal-00425414>
HAL Id: hal-00425414
https://hal.archives-ouvertes.fr/hal-00425414
Submitted on 12 Feb 2014
HAL is a multi-disciplinary open accessarchive for the deposit and dissemination of sci-entific research documents, whether they are pub-lished or not. The documents may come fromteaching and research institutions in France orabroad, or from public or private research centers.
L’archive ouverte pluridisciplinaire HAL, estdestinee au depot et a la diffusion de documentsscientifiques de niveau recherche, publies ou non,emanant des etablissements d’enseignement et derecherche francais ou etrangers, des laboratoirespublics ou prives.
1
Assessment of the PCDD/F fate from MSWI residues used 1
in road construction in France 2
3
R. BADREDDINE1, D. FRANÇOIS2 4 1INERIS, DRC/DESP, Parc Technologique Alata BP 2, 60550 Verneuil-en-Halatte, France 5 ²Laboratoire Central des Ponts-et-Chaussées, centre de Nantes, Route de Bouaye, BP 6
4129, 44341 Bouguenais cedex, France 7
8
9
10
11
12
13
Corresponding author: 14
Rabia BADREDDINE 15
DESP/DRC INERIS 16
Parc Technologique Alata 17
B.P. 2 18
60550 Verneuil-en-Halatte 19
FRANCE 20
Fax : 03 44 55 65 56 21
E-mail. [email protected] 22
23
24
25
26
27
28
29
2
Abstract 30
MSWI fly ash is susceptible to contain high amount of dioxins (PCDD) and furans 31
(PCDF). However, the use of MSWI residues for road construction started in France 32
at period when the mixture of MSWI Bottom Ash with MSWI fly ash was used. From 33
four old road sites, MSWI residues, road soils, reference soils and geo-textiles were 34
sampled and their PCDD/F contents were analyzed. MSWI residues show a great 35
heterogeneity but also high amounts of PCDD/F between 14 and 2960 ng I-TEQ.kg-1 36
DM. Road soils show less heterogeneity and contents between 0.57 et 7.23 ng I-37
TEQ.kg-1 DM lower than ordinary soils. Moreover, the specific analysis of the 17 toxic 38
PCDD/F congeners (notably the 2,3,7,8-TetraCDD) indicates the very low 39
noxiousness of road soils. The study also allows to assert the relation between the 40
MSWI residue particle size and the PCDD/F content. 41
42
Keywords: incineration, ash, road, dioxin, furan, particle 43
44
45
46
47
48
49
50
51
52
3
1 Introduction 53
In many areas across the world where the high demand of construction materials 54
compared to the availability of natural materials, as well as the lack of available 55
space for waste disposal, are a problem, the use of by-products and wastes for road 56
construction has been seen for a long time as an appropriate solution to reduce the 57
amount of disposed materials and to provide at the same time alternative materials 58
for construction. A typical case of these alternative materials is that of the Municipal 59
Solid Waste Incinerator (MSWI) residue which is produced from the household 60
wastes combustion and used for road and car-park construction. 61
In France, the use of MSWI residue in road construction is supervised since the 90’s 62
through an order (1991) and a memorandum (1994) both from the ministry of 63
Environment. The environmental assessment of MSWI bottom ash is based on the 64
measurement of its unburned fraction and the leaching potential of some heavy 65
metals, arsenic, sulfate and total organic carbon. Yet, MSWI residues may contain 66
persistent organic pollutants (POP) such as polychlorinated dibenzo-dioxins (PCDD) 67
and polychlorinated dibenzo-furans (PCDF). PCDD/F molecules are poorly water 68
soluble and leaching tests are known for not being relevant toward them, 69
nonetheless, the affinity of PCDD/F molecules for particles is also known, and such 70
affinity may be higher toward the finest particles. As a consequence, one wonders if 71
under the effect of rainwater infiltration into the road body, the washing of the MSWI 72
residue layer may induce the transfer, downward, of PCDD/F molecules bound to the 73
finest particles of the material. In such a case, on road sites, compared to some 74
reference soils, an increase of the PCDD/F content in the soil underlying the road 75
(called the road soil), may be observed. 76

4
In order to answer to this question, PCDD/F contents of MSWI residues sampled into 77
old road structures, were analyzed (including an assessment of their noxiousness). 78
The relation between the dimension of MSWI residue particles and the PCDD/F 79
content was studied. Then MSWI residue PCDD/F contents were compared to those 80
measured in the road soil and in neighbouring soils (local references). 81
As before the enforcement of the 1991 order – thus PCDD/F compounds - MSWI 82
residues were susceptible to contain higher amounts of fly ash, the present study 83
was focused on pre-1991 constructions. At the same time, this allows to assess the 84
medium-term state of road soils. 85
2 Context of the study 86
2.1 Production of PCDD/F during household waste incineration 87
As a result of incomplete combustion, incineration of household waste produces 88
several organic compounds such as chlorinated species (polychlorinated biphenyls 89
(PCB), polychlorinated dibenzodioxins (PCDDs), and polychlorinated dibenzofurans 90
(PCDFs)). Two temperature ranges are responsible for the production of persistent 91
organic pollutant (POP). The first one (200 to 400°C) which results from a catalysed 92
reaction taking places on the ash particles present in combustion systems. The 93
second one (500 to 800°C) is the result of a rearrangement of chlorinated precursors 94
such as chlorophenols and chlorobenzenes in the gas phase (Stanmore, 2004). 95
Dioxin air emissions from incinerators have decreased in the last decade due to 96
improvements in the pollution control technology and to the regulation 97
implementation and enforcement. Two orders of 20 September, one for hazardous 98
waste and another one for non hazardous waste, both limit the level of PCDD/F 99
emission to 0.1 ng.m-3. 100

5
2.2 Use of MSWI residues for road construction in France 101
The use of MSWI residue started in France during the 1950’s in the area of Paris and 102
spread all over the country during the 1980’ – 1990’s, a period during which many 103
incinerators were built (AGHTM, 1994). 104
As for some other alternative materials (coal fly ash, blast furnace slag…), the use of 105
MSWI residue was codified by the ministry for public works and transports, allowing 106
its assimilation to one of the various kinds of natural materials considered for the 107
classical road structure design (MELT, 1997; SETRA and LCPC, 2000). The analogy 108
is based on geo-technical responses of the MSWI residue sample to a set of usual 109
standard mechanical tests (resistance to fragmentation and wear, sand equivalent, 110
surface cleanliness, compactibility…). 111
Until the 1990’s the environmental question about the use of MSWI residue was not 112
seen as a major concern. In 1991, an order required from the 1st of December 1992, 113
the separating of MSWI residue into bottom ash (the fraction of the incineration 114
residue which is collected from the incinerator grate) and fly ash (the fraction made of 115
fine particles carried away by the flux of combustion gas which is later captured by 116
dust collectors). While the production of MSWI bottom ash is around 250 kg per ton 117
of incinerated residue, the production of fly ash is 20 kg per ton (AGHTM, 1994; 118
Autret et al., 2007). Due to its high pollutant potential (notably high content in 119
chlorides, arsenic, lead, zinc, mercury, cadmium and organic compounds), MSWI fly 120
ash was classified as hazardous waste and has to be directed toward specific 121
landfills for hazardous waste. Usually, the MSWI bottom ash fraction is classified as 122
non-hazardous waste and is authorized in non-hazardous waste landfill, or also 123
potentially authorized for road construction under specific conditions. Indeed, in 124
1994, a memorandum from the Ministry in charge of the Environment (French 125
6
Environment Ministry, 1994) provided recommendations for the use of MSWI bottom 126
ash in road construction (embankment, capping layers, subgrades….). The use of 127
MSWI bottom ash depends on its unburned fraction and on its leaching potential 128
controlled through a standard batch leaching test (NF X 31-210, 1992). The 1994 129
memorandum sets maximum limit values related to the leachate: its global soluble 130
fraction (total dissolved solids), plus specific limit values for seven chemical 131
parameters: arsenic, cadmium, chromium VI, lead, mercury, sulfate and total organic 132
carbon. 133
2.3 Knowledge about the PCDD/F fate in the road environment 134
The 1994 memorandum did not set any particular recommendation regarding dioxins 135
and furans. Since the 1990’s, MSWI residue (and more specifically MSWI bottom 136
ash) has been extensively studied in France and worldwide from the environmental 137
point of view. This was essentially carried out with relation to its heavy metal leaching 138
potential and poorly with relation to its organic pollutants, notably regarding PCDD/F 139
content and release risk (Chandler et al., 1997, Bartet et al., 2001). Consequently, as 140
opposite to heavy metals for which laboratory, lysimeter and some field studies have 141
provided leaching data (Silvestre and Rampignon, 1995; Adam et al., 1996; 142
Drouadaine et al., 1997; Paris et al., 1997; Drouadaine and Badreddine, 2003), very 143
little knowledge exists today regarding the fate of PCDD/F, notably possible transfer 144
of PCDD/F to the open environment from the use of MSWI residues in road 145
infrastructures. 146
In the French context, this issue is essentially related to the effect of pre-1991 MSWI 147
residues, as at that time bottom and fly ashes were not separated. Considering on 148
the one hand the long term potential effect of PCDD/F, and on the other hand the 149
infiltration of rainfall through road surface (van Ganse, 1978) and the permeability of 150

7
the MSWI residue layers (i.e. 10-5 to 10-4 m.s-1) (François et al., 2003), understanding 151
the fate of PCDD/F hold into old MSWI residues used in road structures has became 152
a necessity. Indeed, due to its relatively poor mechanical properties, MSWI residue 153
has primarily been used by road engineers mainly in the deeper layers of the road 154
structure (SETRA and LCPC, 2000), where mechanical constraints are the lowest, 155
immediately above the underlying natural soil. The latter (called road soil), due to its 156
direct contact with the MSWI layer and to its ability to retain pollutants represents a 157
major target to be considered in the context of alternative material use in road 158
construction (Jullien and François, 2006). 159
3 Materials 160
3.1 Road site identification 161
In order to take advantage of the longest possible period of contact between the 162
MSWI residue layer and the road soil, road sites for study were chosen as old as 163
possible. However, due to of the lack of written records for the oldest roads, it was 164
only possible to go back in time as early as 20 years ago, thanks to the memory of 165
the people who took part to the construction. For more recent sites (around 10 years 166
old), more data was available. 167
The road body is a multi-layer structure. The pavement layers (surface course, base 168
course, sub-base) are built on the pavement foundation, consisting of the natural 169
ground after earthworks (scrapped and compacted) called the subgrade, generally 170
topped with a capping layer in the French design technique (SETRA and LCPC, 171
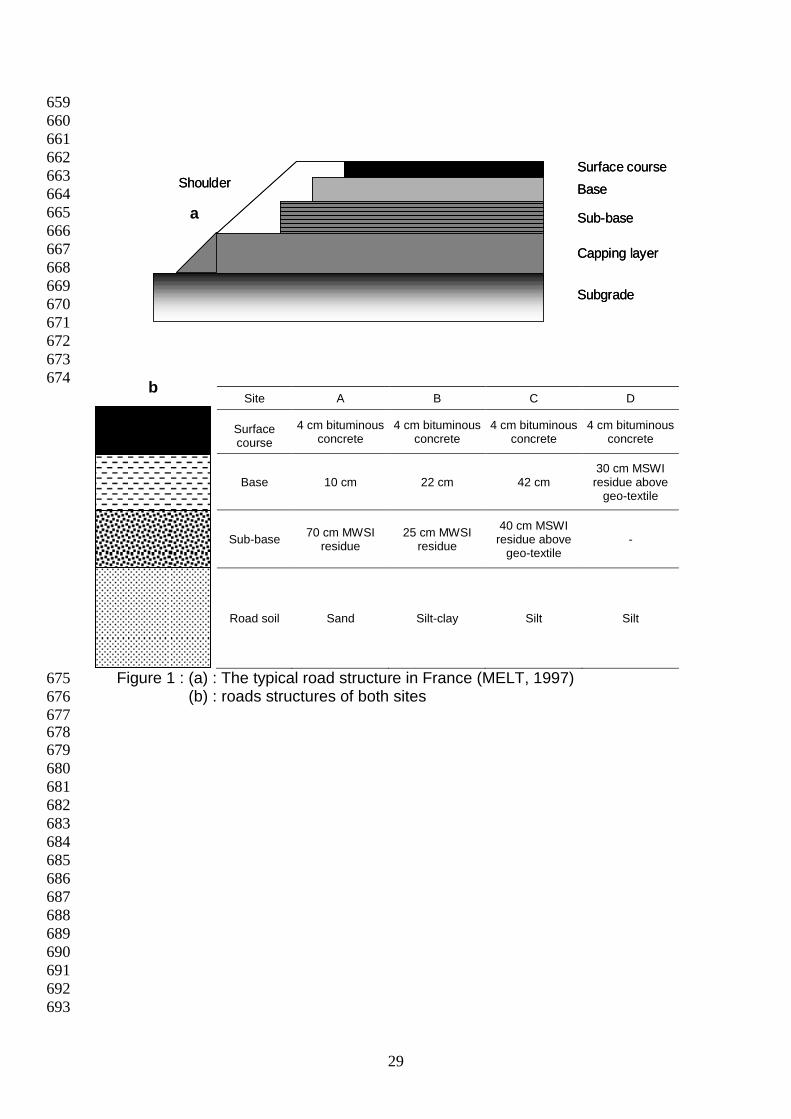
2000). Figure 1a presents the different road layers of a complete structure. In 172
practice, depending on the physical stress expected on the road body during its use 173

8
(load due to traffic, climatic agents) and on the properties of the road materials, the 174
number of layers in the structure and their thickness can vary. 175
When the natural soil on which the road structure is built contains too many fine 176
particles, this may induce a transfer of fine particles from the road soil to the upper 177
layer. This phenomenon can induce an increase of the upper layer sensitivity to 178
moisture variation, detrimental to its bearing capacity. This risk is usually avoided 179
using a geo-textile; such a geo-textile was found in two of the investigated sites. 180
Four sites (noted A, B, C and D) were investigated from various regions in France. 181
Sites A and B were built in the second half of the 1970’s, while sites C and D were 182
built between 1991 and 1994. Their structure is described in Figure 1b. In both site, 183
MSWI residues were used as 0-31.5 mm unbound graded aggregates. 184
Site A is the private road of a MSW incinerator plant, which essentially bears a heavy 185
lorry traffic. The structure corresponds to a flexible pavement in which the MSWI 186
residue was used in a thick sub-base layer (70 cm). The road soil is sandy. Built in 187
1978, site A was sampled at the age of 20. 188
Site B is an urban pavement which only undergoes light vehicle traffic. The structure 189
is that of a flexible pavement in which the MSWI residue was used in the sub-base 190
layer (25 cm). The underlying soil is silty. Built in 1976, Site B was sampled at the 191
age of 22. 192
Site C is another urban pavement which undergoes light traffic. The structure 193
corresponds to a semi-rigid pavement in which the MSWI residue was used in a quite 194
thick sub-base layer (40 cm), topped with a bound layer made of blast furnace slag 195
and coal fly ash. Due to the silt nature of the road soil, a geo-textile was laid by the 196

9
road constructor below the MSWI residue layer in order to prevent fine particles lifting 197
towards the sub-base layer. Built in 1992, site C was sampled at the age of 9. 198
Site D is a public car park platform. The uncovered structure (a simple 1 cm-thick 199
gravelling) is unusual for traditional car parks but is sometime chosen for 200
occasionally used ones. The MSWI ash is used in the base layer (30 cm). Due to the 201
silty nature of the road soil, a geo-textile was also laid by the road constructor below 202
the MSWI residue layer in order to prevent fine particles lifting towards the base 203
layer. Built in 1994, site D was sampled at the age of 9. 204
3.2 Material sampling 205
3.2.1 Sampling 206
On each site, the sampling operation starts by digging a trench in the pavement, 207
down to the top of the MSWI residue layer. For safety reasons, on circulated roads, 208
the trench is dug on the road edge side. No such consideration had to be taken into 209
account regarding the car park. In all case, beforehand, information is collected 210
regarding the location of buried networks (water, gas, electricity…). 211
Usually, the thickness of the MSWI residue layer is not known exactly; on one site it 212
can vary by few centimeters from one point to another, which makes preferable, 213
when possible, to dig more than one trench. A core sampler is used to collect at once 214
the MSWI residue layer and the road soil. Then, the real thickness of the MSWI 215
residue layer at the sampling point is measured on the core sample. The thickness of 216
the sampled underlying soil is also measured. The core sample can then be cut in 217
different sub-layers in order to assess the contaminant content at different depths. 218
The upper sub-sample of the road soil, just below the MSWI residue layer, is always 219
rather thin (usually 5 cm thick). Samples for analysis are collected in the middle of 220
10
the core section. This is a precaution avoiding peripheral contamination from the 221
upper levels to the lower ones, as while the core sampler is pushed in, particles can 222
move along its internal wall. 223
When the road site makes it easy to obtain a reference situation of the soil away from 224
the MSWI residue road layer influence, reference samples are collected with the core 225
sampler for analysis and comparison with the road soil. Providing data on the 226
surrounding situation regarding PCDD/F influence on the site, the so-call reference 227
soil makes it possible to have a view of the net impact on the road soil. For all 228
materials, before analysis, all samples were stored in plastic bags and drums, 229
hermetically closed. 230
3.2.2 Samples 231
Table 1 provides an overview of the set of samples that were analyzed, together with 232
their codification, the numbering is for the trench (1, 2 or 3). Soil samples were 233
collected at different depths in order to detect any vertical content variation. Depth of 234
sampling was conditioned by the soil own-thickness. 235
For sites A, B and C it was possible to identify a reference soil, but not for site D. In 236
site A, four AR samples were collected for PCDD/F content analysis (0-20 cm, 20-40 237
cm, 40-60 cm and 80-95 cm). In sites B, two samples were collected: 0-20 cm and 238
60-80 for BR,. In site C, the reference soil (CR) was not sampled as deep as the two 239
others: 0-5 cm and 5-15 cm. 240
Regarding MSWI residues, in site A, two trenches were dug into the road structure. 241
Only one sample was collected in the first trench (AM1) because at that point the 242
MSWI residue layer was thin (12 cm). In the second trench (AM2), the layer thickness 243
was greater (65 cm) and four samples were collected in the MSWI residue (AM2/14-29; 244
11
AM2/35-45; AM2/45-65 and AM2/65-85). In site B, one trench was dug, providing one sample 245
(BM1) of MSWI residue (35-60 cm). Similarly for site C (CM1), only one sample was 246
collected (50-88 cm). Lastly, in site D three trenches were dug providing each one a 247
sample (DM1, DM2 and DM3) with the same geometrical characteristics (10-30 cm). 248
Regarding road soils, in site A, three samples were collected in the sandy road soil of 249
trench T1 (AS1) (32-37 cm, 37-42 cm and 42-52 cm). Three road soil samples were 250
also collected at trench T2 (AS2) (29-35 cm, 85-90 cm and 95-105 cm). Sample AS2/29-251
35 taken from trench T2 is a thin sand layer which accidentally slid on the MSWI 252
residue during the road work; it was not removed and has remained inserted in the 253
MSWI residue layer since then. In site B (BS1), two samples were collected in the silty 254
road soil (BS1/60-70 and BS1/70-80). In site C, a single road soil sample (silty) was 255
collected (CS1/88-93). In site D, three silty road soil samples were collected in trench T1 256
(DS1/30-35; DS1/35-45 and DS1/93-103); two in trench T2 (DS2/30-35 and DS2/35-45); and a single 257
sample in trench T3 (DS3/30-35). 258
In sites C and D, during construction geo-textiles were laid between the MSWI 259
residue layer and the road soil. One sample of geo-textile was collected in the trench 260
of site C (CG1) and two geo-textile samples were collected at site D, one from trench 261
T1 (DG1), the second from trench T2 (DG2). 262
4 Methods 263
4.1 Grading of materials 264
The total sample, dried at 105°C, is sieved at 2 mm. The fraction below 2 mm is 265
sieved in a dried phase in a stainless steel sieve to separate the fractions below 1 266
mm and 0.5 mm. The particle size distribution of the fraction below 0.5 mm is 267
achieved using the laser diffraction technique (Mastersizer, Malvern Instrument). 268

12
4.2 PCDD/F analysis 269
Determination of dry matter content was achieved by drying subsamples at 105°C 270
following the standard EN ISO 11465. 271
The samples were beforehand dried at room temperature. The dried samples were 272
treated and digested with chlorydric acid. Materials (MSWI residues and soil 273
samples) were prepared using an accredited method, based on the standard 274
EN 1948-2 and EN 1948-3, which consists in extracting the analyzed components 275
with mixture of toluene and acetone. This step is followed with several stages of 276
clean-up by chromatography on columns filled with absorbents using solvents or 277
various elution strength. After filtration, the dioxin measurement requires a solid/liquid 278
extraction followed with a cleaning up step. The purified extracts are reduced to a 279
minimum volume and then mixed in a solvent compatible with the final analysis by 280
gas chromatography. 281
The total eluate was prepared following the same methodology as the one used for 282
MSWI residues. 283
Analyses of PCDD/F were carried out by means of a High Resolution Mass 284
Spectrometry coupled with a High Resolution Gas Chromatography (HRMS/HRGC) 285
VG/AutoSpec. 286
The analysis consisted in measuring 17 toxic congeners (7 congeners for PCDD and 287
10 congeners for PCDF). The seven dioxin congeners are 2,3,7,8-TetraCDD; 288
1,2,3,7,8-PentaCDD; 1,2,3,4,7,8-HexaCDD; 1,2,3,6,7,8-HexaCDD; 1,2,3,7,8,9-289
HexaCDD; 1,2,3,4,6,7,8-HeptaCDD and OctaCDD. The ten furan congeners are 290
2,3,7,8-TetraCDF; 1,2,3,7,8-/1,2,3,4,8-PentaCDF; 2,3,4,7,8-PentaCDF, 1,2,3,4,7,8-291
/1,2,3,4,7,9-HexaCDF; 1,2,3,6,7,8-HexaCDF; 1,2,3,7,8,9-HexaCDF; 1,2,3,4,6,7,8-292

13
HeptaCDF; 1,2,3,4,7,8,9-HeptaCDF and OctaCDF. Interferences with the other 193 293
non toxic congeners and some other components such as Polychlorobiphenyls 294
(PCBs), Polychloroterphenyls (PCTs), or Polychloronaphtalens (PCNs) are 295
eliminated. The determination of congeners was realized by the isotopic dilution 296
method using isotope as interne markers for congeners identification and 297
quantification. 298
The concentration of one PCDD or PCDF congener can be converted into an 299
International Toxic Equivalent Quantity (I-TEQ), with a Detection Limit (DL) of 1.22 300
nanogram I-TEQ.kg-1 of dry material (noted DM) and an accuracy of 4.7% on the 301
Toxic Equivalent value. The model used for determining the I-TEQ is NATO (1998). 302
4.3 Leaching 303
Regarding the geo-textiles found on two sites, before chemical analyses, the 304
recovery of particles was realized by means of leaching, intended to wash the geo-305
textile. The operation was renewed until the complete extraction. 306
Regarding MSWI residues, as PCDD/F are not water soluble compounds (Sakai et 307
al., 2000a), the purpose of the test was not to assess their solubility but their possible 308
residual release associated to very fine particle extraction (namely below 0.45 µm in 309
the condition of the test due to the filter size) under the effect of water flushing. The 310
leaching test was performed for MSWI residues from sites B and D following the EN 311
12457-2 standard protocol (2002). Determination of the dry matter content was made 312
after drying of test portion at 105°C, according to the international standard ISO 313
11465 (1994). The liquid/solid separation is performed by means of filtration on a 314
0.45 µm membrane filter using a pressure filtration device. The eluate obtained after 315
filtration was analyzed to determine PCDD/F compounds’ nature and quantity. 316

14
317
5 Results 318
Results concerning old MSWI residues are first presented. Then are those of geo-319
textiles, road soils and reference soils. All material samples are defined in relation to 320
their depth from the surface (expressed in centimeters) and all PCDD/F contents are 321
expressed in nanogram of I-TEQ per kilogram of dry matter (noted ng I-TEQ.kg-1 322
DM). 323
The PCDD/F congener with the greatest toxic potential, and for which the greatest 324
amount of toxicological data is available, is 2,3,7,8-TetraCDD (Mac Kay, 2002). Its 325
content in all material samples is provided (in ng.kg-1 DM). 326
Additionally, in order to assess the distribution of the different PCDD/F compounds in 327
the different materials the sum of the seven PCDD congeners and that of the ten 328
PCDF congeners was calculated (in ng.kg-1 DM). 329
5.1 MSWI residues’ characteristics 330
5.1.1 PCDD/F contents in MSWI residues 331
Results are presented in Table 2. In site A, the only one showing values below 100 332
ng I-TEQ.kg-1 DM, the PCDD/F content for the MSWI residue in trench T1 (AM1) is 333
14.0 ng I-TEQ.kg-1 DM. In trench T2 (AM2), it increases from the upper sample to the 334
third one (from 35.7 to 227 ng I-TEQ.kg-1 DM) and decreases in the lower sample 335
(63.2 ng I-TEQ.kg-1 DM). 336
In site B (BM1), the PCDD/F content for the MSWI residue is 721 ng I-TEQ.kg-1 DM, 337
three time higher than the maximum value measured in site A. 338

15
In site C (CM1), the PCDD/F content is similar to the maximum value found in site A 339
(235 ng I-TEQ.kg-1 DM). 340
The three trenches of site D (DM1, DM2 and DM3) show, by far, the highest PCDD/F 341
contents. These contents are respectively 1960, 2160 and 1640 ng I-TEQ.kg-1 DM. 342
5.1.2 Relation between PCDD/F amount and particle size 343
A sample with a high PCDD/F content (DM1), was chosen in order to assess the 344
possible relation between the particle size distribution of MSWI residues and their 345
PCDD/F load. PCDD/F contents related to fractions < 0.1 mm; 0.1-0.5 mm; 0.5-1 346
mm; 1-2 mm; 2-10 mm; 10-31.5 mm of the material are presented in Figure 2. 347
The PCDD/F contents of fractions between 2 and 31.5 mm are similar, comprised 348
between 733 ng I-TEQ.kg-1 and 888 ng I-TEQ.kg-1. The finest fractions and 349
particularly the one below 0.1 mm is 7 times higher, reaching 6590 ng I-TEQ.kg-1. 350
5.1.3 Leaching of MSWI residues 351
The leaching test was carried out in order to detect the proportion of PCDD/F 352
particles inferior to 0.45 µm. For both sites (B and D), leaching results (Table 3) show 353
that leachates contain a small amount of PCDD/F: 2.19 pg I-TEQ.l-1 for sample 354
BM1/35-60; and 4.4.1 pg I-TEQ.l-1 for sample DM1/10-30. Brought to the mass of dry 355
material involved in the leaching test, such releases are respectively equal to 0.019 356
ng I-TEQ. kg-1 DM for the first sample, and 0.041 ng I-TEQ. kg-1 DM for the second. 357
5.2 Geo-textiles’ load of PCDD/F 358
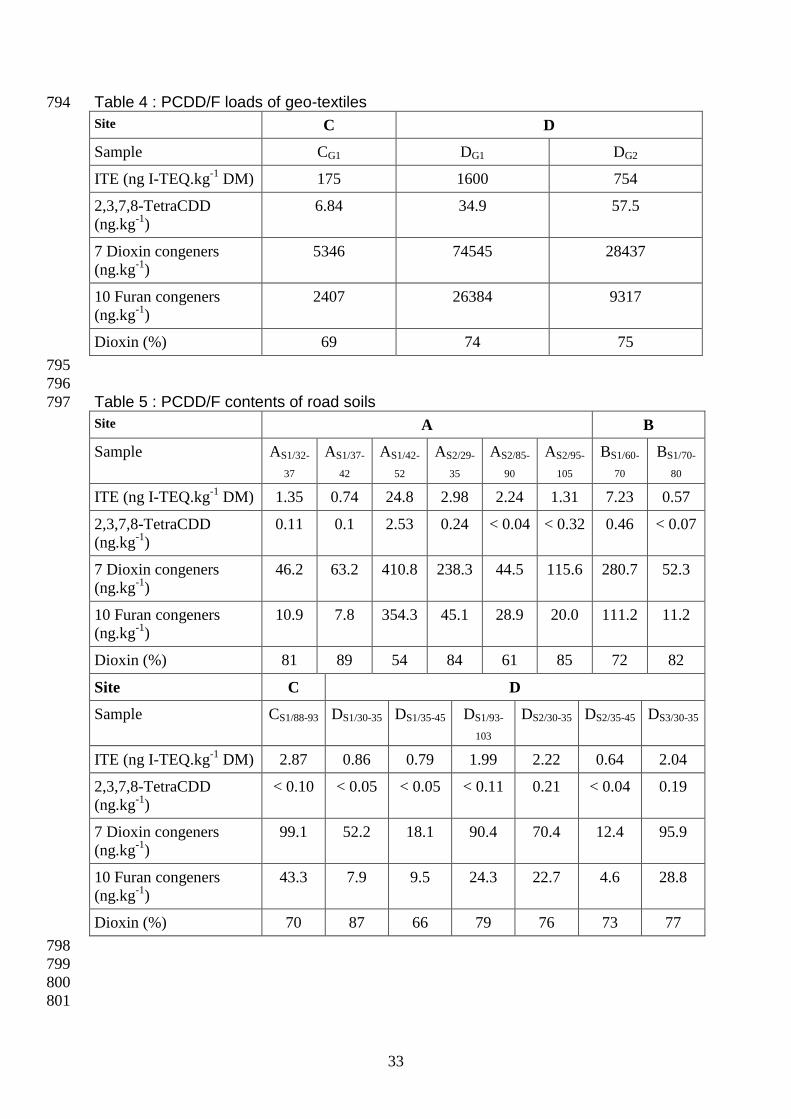
The load of PCDD/F on the geo-textile from site C (CG1) is 175 ng I-TEQ.kg-1 DM 359
(Table 4). Site D geo-textile samples show far higher values : 754 ng I-TEQ.kg-1 DM 360
in trench T1 (DG1), and 1600 ng I-TEQ.kg-1 DM in trench T2 (DG2). The latter value is 361
close to the content of the MSWI residue layer above. 362
16
5.3 PCDD/F contents in road soils 363
For site B (BS1), it varies from 7.23 to 0.57 ng I-TEQ.kg-1 DM from the upper to the 364
lower sample. In site C (CS1/88-93), the single sample value is 2.87 ng I-TEQ.kg-1 DM. 365
In site D, from the top to the bottom of the investigated thickness in trench T1 (DS1), 366
the three values are respectively 0.86, 0.79 and 1.99 ng I-TEQ.kg-1 DM. In trench T2 367
(DS2), the values are of the same order (2.22 and 0.64 ng I-TEQ.kg-1 DM). Lastly, 368
trench T3 sample (D (DS3) PCDD/F content is 2.04 ng I-TEQ.kg-1 DM (Table 5). 369
Site A presents a contrasted situation regarding its two trenches. In trench T2 (AS2), 370
the PCDD/F contents of the three samples are in the range of the previous cases B, 371
C and D, with values evolving from 2.98 to 2.24 and 1.31 ng I-TEQ.kg-1 DM, from the 372
upper to the lower sample. On the other hand, in trench T1 (AS1), whereas the two 373
first samples present low values (1.35 and 0.74 ng I-TEQ.kg-1 DM), the deeper 374
sample shows a content of 24.8 ng I-TEQ.kg-1 DM, which is relatively high in 375
comparison with the content of the MSWI residue layer located just above (i.e. 14.0 376
ng I-TEQ.kg-1 DM). As a consequence, this values (AS1/42-52) is very uncertain and will 377
not be considered in the interpretation. 378
5.4 PCDD/F contents in reference soils 379
Results are presented in the Table 6. In site A (AR), the PCDD/F content of the 380
reference soil decreases from 9.4 to 0.30 ng I-TEQ.kg-1 DM, from the surface to the 381
deeper sample. The top sample value can be related to the atmospheric 382
contamination in the vicinity of the incineration plant, from the chimney, at a time (the 383
1970’s) when fume de-pollution by means of old dust separators was not as efficient 384
as the nowadays air pollution control systems (Chandler et al., 1997) 385
17
In site B (BR), contents are homogeneous and low (1.05 and 0.79 ng I-TEQ.kg-1 DM). 386
Contrary to site A, it seems that no particular source of pollution has an effect on the 387
vertical profile of content. 388
Site C (CR) shows intermediate values between the two previous ones i.e. 5.40 and 389
6.49 ng I-TEQ.kg-1 DM for the upper and the lower samples respectively. Site C is not 390
located in the vicinity of a particular source of PCDD/F, but it is however located in a 391
large urban area with several potential sources. 392
5.5. Distribution of PCDD/F congeners in the road structure 393
Results related to the distribution of the different PCDD/F congeners (Tetra, Penta, 394
Hexa, Hepta and Octa) in the MSWI residues, on geo-textiles samples, and in the 395
road soils, for all sites, are illustrated by the example of site A trench T2 (Figure 3) 396
and site C (Figure 4). 397
For site A, regarding the MSWI residue (AM2/14-29; AM2/35-45; AM2/45-65; AM2/65-85) they 398
show the predominance of OctaCDD, and the secondary importance of HeptaCDD 399
and HeptaCDF. For site C, they show the predominance of OctaCDD and OctaCDF 400
in the MSWI residue and the secondary importance of HeptaCDD. The geo-textile of 401
site C also show the predominance of OctaCDD and the secondary importance of 402
HeptaCDD. 403
For MSWI residues, the distribution between dioxin and furan congeners is provided 404
in Table 2. The proportion of dioxin congeners is of 50% for CM1 but it is higher for 405
other samples: 73% for BM1; 74 to 79% for DM and 57 to 97% for AM. 406
The distribution between dioxin and furan congeners is provided in Table 4 for geo-407
textiles. In the geo-textile from site D, the proportion of dioxin congeners (74-75%) is 408

18
equivalent to that of the above MSWI residue. For site C, it is higher (69%) to that of 409
the MSWI residue. 410
The distribution between dioxin and furan congeners is provided in Table 5 for road 411
soils. For road soils, the proportion of dioxin congeners for all sites, ranges from 54 to 412
89%. For sites A, B and D it is comparable to the distribution observed for the MSWI 413
residue. For site C, it is higher. 414
The distribution between dioxin and furan congeners is provided in Table 6 for 415
reference soils. It is comparable to that of the respective road soils, 85% for BR; 72% 416
for CR; 69 to 90 for AR. 417
The toxicity of PCDD/F varies substantially depending on the different congeners. It 418
is generally agreed that only 17 out of the 210 dioxin and furans congeners are toxic. 419
The examination of is 2,3,7,8-TetraCDD content in the different samples of MSWI 420
residue samples, geo-textiles, road soils and reference soils, reveals that its amount 421
in road soils is very low. 422
For road soils (Table 5), contents range from less than 0.04 ng.kg-1 (samples AS2/85-90 423
and DS2/35-45) to 2.35 ng.kg-1 (sample AS1/42-52), not very different from those of 424
reference soils (Table 6), ranging from less than 0.01 ng.kg-1 (samples BR/0-20 and 425
CR/0-5) to less than 0.9 ng.kg-1 (sample AR/0-20). 426
As a matter of comparison, for MSWI residues (Table 2), the 2,3,7,8-TetraCDD 427
content is below 1.5 ng.kg-1 for site A, and ≤ 50 ng.kg-1 for sites B, C and samples 428
DM1 and DM3. Sample DM2 content is 190 ng.kg-1. For geo-textiles (Table 4), contents 429
are from 6.8 to 57.5 ng.kg-1. 430
6 Discussion 431
6.1 Characterization of MSWI residues 432
19
6.1.1 PCDD/F contents 433
A great heterogeneity of MSWI residue PCDD/F contents, i.e. a factor 154 from 14.0 434
(AM1) to 2160 ng I-TEQ.kg-1 DM (DM2) is observed between sites. A great 435
heterogeneity can also be observed in a site such as A (a factor 16 between 14.0 436
and 227 ng I-TEQ.kg-1 DM). 437
The lowest recorded value (14.0 ng I-TEQ.kg-1 DM for AM1-12-24) is in the middle of the 438
range of values reported by Damien (1997) for bottom ash produced by recent 439
incinerators in France in the 1990’s (4.0 to 20.6 ng I-TEQ.kg-1 DM). All other contents 440
are two times to 100 times above the maximum value recorded by Damien Such 441
results are also well above the contents reported by Badreddine and Drouadaine 442
(2006) on MSWI bottom ash from recent incineration and treatment facilities (i.e. 443
around 10 ng I-TEQ.kg-1 DM) (Figure 5). Highest values (MD) are even above the 444
highest value (i.e. 1500 10 ng I-TEQ.kg-1 DM) reported by Sakai et al. (2000b) for 445
Japan. A comparison showing difference between MSWI residue from the old and 446
from recent site was proposed in figure 5. 447
6.1.2 Importance of the fine fraction 448
The analyses of size distribution of MSWI residues have shown an important 449
proportion of the fine fraction. 450
The possible relation between the particle size and the PCDD/F content was 451
postulated in an earlier study (Badreddine et al., 2003). The good relation between 452
the PCDD/F content and the particle size demonstrates that the fine fraction is 453
enriched with PCDD/F compounds. The sub-sample with the finest fraction (< 0.1 454
mm) shows by far a higher PCDD/F content (6590 ng I-TEQ.kg-1), 7 times above the 455
other particle fractions. As the fraction below 0.1 mm represents less than 10% of the 456

20
all graded aggregate (MSWI residue), this means that at least 659 ng I-TEQ.kg-1 (i.e. 457
33%) of the 1960 ng I-TEQ.kg-1 of the whole material (sample DM1/30-60), are included 458
in the finest fraction. 459
These results confirm the assumption of the relation between the high value of the 460
PCDD/F and the presence of fly ash mixed with bottom ash before 1991 in France. 461
Indeed, the PCDD/F levels in fly ash are generally much higher than in bottom ash 462
(Mac Kay, 2002). Chang and Chung (1998) reported values between 41 ng.g-1 and 463
703 ng.g-1 DM for MSWI fly ash). 464
Considering on one hand the range figures provided by Damien (1997) for MSWI 465
bottom ash (39 to 648 ng I-TEQ.kg-1) and for MSWI fly ash (765 to 4815 ng I-TEQ.kg-466
1), and on the other hand the ratio of production between bottom ash (250 kg.ton-1) 467
and fly ash (20 kg.ton-1) from incineration, one reaches the range of 67 to 814 ng I-468
TEQ.kg-1 for a theoretical mixture of bottom and fly ash. PCDD/F contents observed 469
for MSWI residues from site A trench T2 (AM2), from site B (BM1) and site C (CM1) are 470
in this range. The sample from site A trench T1 is below, but those from site D are 471
two times above the highest value of the theoretical range. 472
6.1.3 Mobility of PCDD/F 473
Very low PCDD/F releases were assert (0.0219 and 0.0441 ng I-TEQ.kg-1). 474
Compared to the total content of PCDD/F compounds in the respective MSWI 475
residue samples (i.e. 721 ng I-TEQ.kg-1 DM for BM1/35-60 and 1960 ng I-TEQ.kg-1 DM 476
DM1/10-30), the released fractions are respectively 0.003 and 0.002% of the total 477
PCDD/F amount. 478
The low value recorded can be linked to the low solubility of the PCDD/F and the 479
presence of the PCDD/F in the particles superior to 0.45 µm (Badreddine et al., 480
21
2003). Depending on congeners, solubility values are comprised between 0.74 10-7 481
and 3.75 10-3 for PCDD (Inserm, 2000) and between 4.19 10-4 and 1.16 10-6 for 482
PCDF (OMS, 1997). 483
6.2 Assessment of PCDD/Ffate 484
6.2.1 PCDD/F contents of road soil 485
The heterogeneity among all road soil PCDD/F contents, i.e. a factor 9 between 0.74 486
(AS1) and 7.23 ng I-TEQ.kg-1 DM (BS1) is far lower than among MSWI residues. Such 487
values are low in comparison to those reported by Nominé (1999) for soils of urban 488
areas in the absence of neighbouring sources of pollution (from <1 to more than 30 489
ng.kg-1 I-TEQ.kg-1 DM), for soils nearby MSW incineration plants (more than 1000 490
ng.kg-1 I-TEQ.kg-1 DM), and even to those of soils of pasture in Europe (from <1 to 43 491
ng.kg-1 I-TEQ.kg-1 DM). 492
6.2.2 Comparison to reference soils’ contents 493
In order to assess the state of road soils, comparison can be made with their 494
respective reference soils. Depending on the context (more or less potential sources 495
of pollution in the area), the difference between them is negative (site B), negligible 496
(site A), or even positive (site C where pollution sources affect the reference soil). 497
Indeed, regarding Site B, the ratio between the average contents in road soil (3.9 ng 498
I-TEQ.kg-1 DM) and the reference soil (0.92 ng I-TEQ.kg-1 DM) is around 4. 499
Regarding Site A, depending on the consideration of sample AR/0-20 or not in the 500
comparison, one can consider that the PCDD/F content in the road soil is lower (9 501
times) or slightly higher (1.04 ng I-TEQ.kg-1 DM in average for road soil vs 0.44 ng I-502
TEQ.kg-1 DM in average for reference soil) in trench T1. Considering trench T2, the 503

22
conclusion is the same, i.e. respectively 4 times lower, or slightly higher (2.17 ng I-504
TEQ.kg-1 DM in average for road soil vs 0.44 ng I-TEQ.kg-1 DM). 505
In the case of Site C, the content in the road soil sample (CS1/88-93) is 2 times lower 506
than in the reference soil (5.94 ng I-TEQ.kg-1 DM in average). Located in a large 507
urban area, references soil of Site C can have been affected for years by several 508
sources, which can lead to a situation similar as for Site A. 509
6.2.3 Comparison to MSWI residues’ contents 510
Some vertical profiles of PCDD/F contents in road soils (sites A and B) show 511
decreasing values from the upper sample, downward, indication of a possible contact 512
effect of the MSWI residue layer. Contents in the road soil are however low and the 513
transition with the MSWI residue layer with high contents, is very well marked. 514
For sites A and B, where the influence of the geo-textile is not susceptible to 515
interfere, the ratio between the road soil upper sample content and the MSWI residue 516
layer content can serve as an indicator. Regarding Site A trench T1, this ratio (1.35 517
vs 14.0 ng I-TEQ.kg-1 DM) is 9.6%, and for trench T2 (2.98 vs 101 ng I-TEQ.kg-1 DM 518
in average) it is 2.9% (the MSWI residue content is 101 ng I-TEQ.kg-1 DM in 519
average). Regarding Site B, the ratio (7.23 vs 721 ng I-TEQ.kg-1 DM) is only 1.0%. 520
For sites with geo-textiles, such ratios are 1.2% for site C (2.87 vs 235 ng I-TEQ.kg-1 521
DM), or lower for site D, i.e. 0.04% for trench T1 (0.86 vs 1960 ng I-TEQ.kg-1 DM) 522
and 0.1% for trench T2 (2.22 vs 2160 ng I-TEQ.kg-1 DM). 523
6.3. Role of geo-textiles 524
The PCDD/F load of geo-textiles compared to the content of the MSWI residue 525
located just above is equal to 74% of the latter in the case of site C (CG1/CM1). For 526
23
site D, such ratios are equal to 86% in the case of trench T1 (DG1/DM1) but only 35% 527
in the case of trench T2 (DG2/DM2). 528
In order to assess the role of geo-textiles toward the possible PCDD/F transfer, their 529
load can also be compared to the content of the road soil upper sample. In the case 530
of site C, Such ratio is 61 (CG1/CS1), and it is higher in the case of site D, 1860 for 531
trench T1 (DG1/DS1), and 339 for trench T2 (DG2/DS2). 532
The role of the geo-textile inserted between the MSWI residue layer and the road soil 533
should be clarified : may be it acts as a filter toward the transfer of fine particles 534
downward. But may be the porosity of the road soil in itself is low enough to act as a 535
filter, which would explain the slightly higher PCDD/F contents in some road soil 536
upper samples. 537
7 Conclusion 538
This study shows that some MSWI residues used for road construction before the 539
enforcement of the 1991 order can contain very high amount of PCDD/F compared to 540
the MSWI bottom ash produced and used afterward. The heterogeneity between 541
MSWI residues can be great from one road site to another but also on a single site. 542
The important contribution of the fraction below 0.1 mm to the MSWI residue total 543
contents of PCDD/F was asserted. Crossed with leaching test results, this indicates 544
that the fraction between 0.45 and 100 m should be investigated in more detail in 545
order to specify the most loaded particle sizes. 546
As a whole, road soils PCDD/F contents are below the contents recorded for ordinary 547
urban or rural soils, and consequently, no significant difference is observed with local 548
24
reference soils. This indicate the absence of transfer of MSWI residue to the road 549
soil. 550
In addition, thanks to the very low proportion of the 2,3,7,8-TetraCDD congener, the 551
noxiousness of road soils is reduced. In the presence of geo-textile or not, the 552
PCDD/F content reduction between the MSWI residue and the road soil is great. The 553
role of the geo-textile inserted between the MSWI residue layer and the road soil 554
should be clarified. 555
Considering the improvements brought by the enforcement of the 1991 order 556
regarding the fate of MSWI fly ash and those brought by the more recent air pollution 557
control systems, the diagnosis achieved thanks to this study provides a rather 558
positive and reassuring insight concerning the effect of today produced and used 559
MSWI bottom ash in road construction. 560
References 561
- Adam, P., Dony, Y., Vincot, Y., 1996. Valorisation des mâchefers d’incinération en 562
technique routière : Evaluation de leur comportement en condition réelle d’utilisation, 563
Déchets Sciences et Techniques 4, 11-14. 564
- AGHTM, 1994. Politique de gestion des déchets en France: Etat de l’art de 565
l’incinération. Techniques Sciences et Méthodes 9, 475-510. 566
- Association Française de Normalisation (AFNOR), 1994. NF ISO 11465 standard, 567
Soil quality - Determination of dry matter and water content on a mass basis – 568
Gravimetric method. 569
- Association Française de Normalisation (AFNOR), 1992. NF X 31-210 standard, 570
Waste – Leaching of waste. 571

25
- Association Française de Normalisation (AFNOR), 2002. NF EN 12457-2 standard. 572
Characterization of waste – Leaching – Compliance test for leaching of granular 573
waste materials and sludges – Part 2: one stage batch test at a liquid to solid ratio of 574
10 l/kg for materials with particle size below 4 mm. 575
- Autret, E., Berthier F., Luszezanec, A., Nicolas, F., 2007. Incineration of municipal 576
and assimilated wastes in France : Assessment of latest energy and material 577
recovery performances, Journal of Hazardous Materials, B139, 569-574. 578
- Badreddine, R., Bartet, B., François, D,. Pepin, G., 2003. Impact sur les sols des 579
dioxines de MIOM utilisés en technique routière. Déchets Sciences et Techniques 580
29, 16-21. 581
- Badreddine, R., Drouadaine, I., 2006. Evaluation du transfert des composés 582
organiques des MIOM utilisés en sous-couche routière dans des ouvrages de 583
construction récente. Déchets Sciences et Techniques 43, 21-26. 584
- Bartet, B., Pépin, G., Nominé, M., 2001. Dioxine dans les MIOM : Teneurs 585
observées et étude préliminaire de leur potentiel de transfert vers l’environnement. 586
In : BRGM and ADEME (Eds). Quel avenir pour les MIOM ?, BRGM, Orléans, 587
France, pp. 118-123. 588
- Chandler, A.J., Eighmy, T.T., Hartlén, J., Hjelmar, O., Kosson, D.S., Sawell, S.E., 589
van der Sloot, H.A., Vehlow, J., 1997, Municipal Solid Waste Incinerator Residues, 590
Studies in Environmental Science, vol. 67. Elsevier, Amsterdam, The Netherlands. 591
- Chang, M.-B, Chung, Y.-T., 1998. Dioxin contents in fly ashes of MSW Incineration. 592
Chemosphere 36-9, 1959-1968. 593

26
- Damien, A., 1997. Etude des caractéristiques intrinsèques de certains déchets des 594
usines d’incinération d’ordures ménagères et de déchets industriels spéciaux. 595
Ministère de l’Environnement and TIRU, Paris. 596
- Drouadaine, I., Seignerie C., Jozon C., 1997. Etude de l’impact environnemental de 597
la valorisation des mâchefers d’incinération en technique routière, Techniques 598
Sciences et Méthodes 10, 48-54. 599
- Drouadaine, I., Badreddine, R., 2003. Valorisation des MIOM en technique routière: 600
Evaluation de leur impact sur l'environnement par la réalisation d'une chaussée 601
expérimentale. Déchets Sciences et Techniques, N° spécial "Les MIOM (Mâchefers 602
d'Incinération d'Ordures Ménagères)", 4e trimestre 2003, 32-38. 603
- François, D., Auzizeau, J., Raimbault, G., 2003. Hydrodynamic characterization of 604
municipal solid waste incinerator bottom ashes used in road construction, Revue 605
Française de Géotechnique 103, 25-32. 606
- French ministry for Environment, 1991. Departmental order related to urban waste 607
incineration facilities. Paris. 608
- French ministry for Environment, 1994. Memorandum related to the disposal of 609
urban waste incineration bottom ash. Paris. 610
- French ministry for Public Works and Transports (MELT), 1997. French design 611
manual for pavement structures. SETRA and LCPC, Paris. 612
- Jullien, A., François, D., 2006. Soil indicators used in road environmental impact 613
assessments, Resour. Conserv. Recy. 48, 101-124. 614
- Mac Kay, G., 2002. Dioxin characterisation, formation and minimisation during 615
municipal solid waste (MSW) incineration: review. Chem. Eng. J. 86 343-368. 616
27
- Nominé, M., 1999. Méthodologie pour l’évaluation de la contamination par les 617
dioxines au voisinage d’une source fixe. Study report. INERIS, Verneuil-en-Halatte. 618
- Paris, I., Hubscher V., Leroy M.J.F., 1997. Etude du comportement de mâchefers 619
de DIS utilisés en technique routière – Comparaison avec des mâchefers d’OM. 620
Techniques Sciences et Méthodes 4, 27-34. 621
- Sakai, S., Urano, S., Takatsuki, H., 2000a. Leaching behaviour of PCBs and 622
PCDDs/Dfs from waste materials, Waste Management 20, 241-247. 623
- Sakai, S., Mizutani, S., Uchida, T., Yoshida, T., 2000b. Substance flow analysis of 624
persistent toxic substances in the recycling process of municipal solid waste 625
incineration residues, Waste Management Series, vol. 1, Waste Materials in 626
Construction Wascon 2000 - Proceedings of the International Conference on the 627
Science and Engineering of Recycling for Environmental Protection, Harrogate, 628
England, pp. 893-903. 629
- Service d’Etudes Techniques des Routes et Autoroutes (SETRA) and Laboratoire 630
Central des Ponts et Chaussées (LCPC), 2000. Réalisation des remblais et des 631
couches de formes (Construction of embankments and capping layers), SETRA, 632
Paris, France. 633
- Silvestre P., Rampignon, J.P., 1995. Valorisation en structure routière du mâchefer 634
d’incinération d’ordures ménagères de l’usine de Lyon-Sud, Techniques Sciences et 635
Méthodes 5, 427-430. 636
- Stanmore, B.R., 2004. The formation of dioxins in combustion systems. Combust. 637
Flame 136. 398-427. 638

28
- van Ganse, R., 1978. Les infiltrations dans les chaussées : évaluations 639
prévisionelles. In Proceedings of the International Symposium on Road Drainage. 640
Federal Office of Highways and Rivers, Bern, Switzerland, pp. 176-192. 641
642
List of Figures: 643
Figure 1a: The typical road structure in France 644
Figure 1b: Road structures of both sites 645
Figure 2: Relation between particle size and PCDD/F content 646
Figure 3: PCDD/F congeners distribution in materials from site A (trench T2) 647
Figure 4: PCDD/F congeners distribution in materials from site C 648
Figure 5 : PCDD/F content variation with age of MSWI residue production 649
650
List of Tables 651
Table 1 : Overview of the set of samples 652
Table 2 : PCDD/F contents of MSWI residues 653
Table 3 : PCDD/F contents from eluates 654
Table 4 : PCDD/F loads of geo-textiles 655
Table 5 : PCDD/F contents of road soils 656
Table 6 : PCDD/F contents of reference soils 657
658
29
659
660
661
662
663
664
665
666
667
668
669
670
671
672
673
674
Site A B C D
Surface course
4 cm bituminous concrete
4 cm bituminous concrete
4 cm bituminous concrete
4 cm bituminous concrete
Base 10 cm 22 cm 42 cm 30 cm MSWI
residue above geo-textile
Sub-base 70 cm MWSI
residue 25 cm MWSI
residue
40 cm MSWI residue above
geo-textile -
Road soil Sand Silt-clay Silt Silt
Figure 1 : (a) : The typical road structure in France (MELT, 1997) 675
(b) : roads structures of both sites 676
677 678 679
680
681
682
683
684
685
686
687
688
689
690
691
692
693
b
Surface course
Base
Sub-base
Capping layer
Subgrade
Shoulder
Surface course
Base
Sub-base
Capping layer
Subgrade
Shoulder
a

30
694
695
696
697
698
699
700
701
702
703
704
705
706
707
708
709
710
711
712
Figure 2 : relation between particle size and PCDD/F content 713
714
715
716
717
718
719
720
721
722
723
724
725
726
727
728
729
730
731
732
733
Figure 3 : PCDD/F congeners distribution in materials from site A (trench T2) 734
735
736
737
738
739
740
741
0
1000
2000
3000
4000
5000
6000
7000
(31.5-10)(10-2)(2-1)(1-0.5)(0.5-0.1)(<0.1)
Particles sizes (mm)
PC
DD
/F c
on
ten
t (n
g I-T
EQ
/kg
DM
)
0 1000 2000 3000 4000 5000 6000 7000 8000 9000
AS2(95-105 cm)
AS2(85-90 cm)
AM2(65-85cm)
AM2(45-65 cm)
AM2(35-45cm)
AS2(29-35cm)
AM2(14-29 cm)
Congener concentration (ng/kg DM)
TCDF
PCDF
HxCDF
HpCDF
OCDF
TCDD
PCDD
HxCDD
HpCDD
OCDD

31
742
743
744
745
746
747
748
749
750
751
752
753
754
755
756
757
758
759
Figure 4 : PCDD/F congeners distribution in materials from site C 760
761
762
763
764
765
766
767
768
769
770
771
772
773
774
775
776
777
778
779
780
Figure 5 : PCDD/F content variation with age of MSWI residue production 781
782
1
10
100
1000
10000
BM
1
AM
1 (
12
-24
)
AM
2 (
14
-29
)
AM
2 (
35
-45
)
AM
2 (
45
-65
)
AM
2 (
65
-85
)
CM
1
DM
1(1
0-3
0)
DM
2(1
0-3
0)
DM
3(1
0-3
0)
II-M
1(0
-60
)
II-M
2(0
-60
)
I-M
1(0
-30
)
I-M
1(3
0-1
20
)
I-M
2(0
-30
)
PC
DD
/PC
DF
conte
nt (n
g I-T
EQ
/kg D
M)
1
10
100
1000
10000
BM
1
AM
1 (
12-2
4)
AM
2 (
14-2
9)
AM
2 (
35-4
5)
AM
2 (
45-6
5)
AM
2 (
65-8
5)
CM
1
DM
1(1
0-3
0)
DM
2(1
0-3
0)
DM
3(1
0-3
0)
II-M
1(0
-60)
II-M
2(0
-60)
I-M
1(0
-30)
I-M
1(3
0-1
20)
I-M
2(0
-30)
PC
DD
/PC
DF
conte
nt (n
g I-T
EQ
/kg D
M)
Old sites
Recent sites
0 2000 4000 6000 8000 10000 12000 14000
CS 93-103
CS 88-93
CG
CM 50-88
Congener concentration (ng/kg DM)
TCDF
PCDF
HxCDF
HpCDF
OCDF
TCDD
PCDD
HxCDD
HpCDD
OCDD

32
Table 1 : Overview of the set of samples 783
Site A B C D
Material (M) AM1 , AM2 BM1 CM1 DM1 , DM2, DM3
Geo-textile (G) - - CG1 DG1 , DG2
Road soil (S) AS1 , AS2 BS1 CS1 DS1 , DS2 , DS3
Reference soil
(R)
AR BR CR -
784
785
Table 2 : PCDD/F contents of MSWI residues 786
Site A
Sample AM1/12-24 AM2/14-19 AM2/35-45 AM2/45-65 AM2/65-85
ITE (ng I-TEQ.kg-1
DM) 14.0 35.7 78.7 227 63.2
2,3,7,8-TetraCDD
(ng.kg-1
)
0.79 1.46 < 0.33 < 2.15 < 0.15
7 Dioxin congeners
(ng.kg-1
)
691 8176 1643 3436 1257
10 Furan congeners
(ng.kg-1
)
94 211 830 2576 670
Dioxin (%) 88 97 66 57 65
Site B C D
Sample BM1/35-60 CM1/50-88 DM1/10-30 DM2/10-30 DM3/10-30
ITE (ng I-TEQ.kg-1
DM) 721 235 1960 2160 1640
2,3,7,8-TetraCDD
(ng.kg-1
)
21.6 9.16 49.6 190 51.2
7 Dioxin congeners
(ng.kg-1
)
25152 5864 95852 81009 91743
10 Furan congeners
(ng.kg-1
)
9121 5825 31853 21904 31822
Dioxin (%) 73 50 75 79 74
787
788
Table 3 : PCDD/F contents from eluates 789
Site B D
Sample BM1/35-60 DM1/10-30
ITE (pg I-TEQ.l-1
) 2.19 4.41
790
791
792
793
33
Table 4 : PCDD/F loads of geo-textiles 794
Site C D
Sample CG1 DG1 DG2
ITE (ng I-TEQ.kg-1
DM) 175 1600 754
2,3,7,8-TetraCDD
(ng.kg-1
)
6.84 34.9 57.5
7 Dioxin congeners
(ng.kg-1
)
5346 74545 28437
10 Furan congeners
(ng.kg-1
)
2407 26384 9317
Dioxin (%) 69 74 75
795
796
Table 5 : PCDD/F contents of road soils 797
Site A B
Sample AS1/32-
37
AS1/37-
42
AS1/42-
52
AS2/29-
35
AS2/85-
90
AS2/95-
105
BS1/60-
70
BS1/70-
80
ITE (ng I-TEQ.kg-1
DM) 1.35 0.74 24.8 2.98 2.24 1.31 7.23 0.57
2,3,7,8-TetraCDD
(ng.kg-1
)
0.11 0.1 2.53 0.24 < 0.04 < 0.32 0.46 < 0.07
7 Dioxin congeners
(ng.kg-1
)
46.2 63.2 410.8 238.3 44.5 115.6 280.7 52.3
10 Furan congeners
(ng.kg-1
)
10.9 7.8 354.3 45.1 28.9 20.0 111.2 11.2
Dioxin (%) 81 89 54 84 61 85 72 82
Site C D
Sample CS1/88-93 DS1/30-35 DS1/35-45 DS1/93-
103
DS2/30-35 DS2/35-45 DS3/30-35
ITE (ng I-TEQ.kg-1
DM) 2.87 0.86 0.79 1.99 2.22 0.64 2.04
2,3,7,8-TetraCDD
(ng.kg-1
)
< 0.10 < 0.05 < 0.05 < 0.11 0.21 < 0.04 0.19
7 Dioxin congeners
(ng.kg-1
)
99.1 52.2 18.1 90.4 70.4 12.4 95.9
10 Furan congeners
(ng.kg-1
)
43.3 7.9 9.5 24.3 22.7 4.6 28.8
Dioxin (%) 70 87 66 79 76 73 77
798
799
800
801

34
Table 6 : PCDD/F contents of reference soils 802
Site A B C
Sample AR/0-20 AR/20-
40
AR/40-
60
AR/80-
95
BR/0-20 BR/60-80 CR/0-5 CR/5-15
ITE (ng I-TEQ.kg-1
DM) 9.4 0.67 0.36 0.30 1.05 0.79 5.40 6.49
2,3,7,8-TetraCDD
(ng.kg-1
)
< 0.9 0.05 < 0.02 < 0.03 < 0.01 < 0.19 < 0.01 < 0.18
7 Dioxin congeners
(ng.kg-1
)
216.8 58.5 41.9 50.0 109.3 35.2 240.0 200.0
10 Furan congeners
(ng.kg-1
)
98.7 7.3 7.1 5.8 17.5 6.6 82.3 86.0
Dioxin (%) 69 89 86 90 86 84 74 70
803
Top Related