


Languages
Pages
Legal


Assessment of the biological effectiveness of newly constructed fishways on the Murray
Barrages, South Australia, 2015–2017
C. M. Bice, B. P. Zampatti and J. Fredberg
SARDI Publication No. F2016/000452-2 SARDI Research Report Series No. 952
SARDI Aquatics Sciences PO Box 120 Henley Beach SA 5022
June 2017

Bice, C.M. et al. (2017) Fishway effectiveness on the Murray Barrages
Assessment of the biological effectiveness of newly constructed fishways on the Murray
Barrages, South Australia, 2015–2017
C. M. Bice, B. P. Zampatti and J. Fredberg
SARDI Publication No. F2016/000452-2 SARDI Research Report Series No. 952
June 2017

Bice, C.M. et al. (2017) Fishway effectiveness on the Murray Barrages
I
This publication may be cited as: Bice, C. M., Zampatti, B. P. and Fredberg, J. (2017). Assessment of the biological effectiveness of newly constructed fishways on the Murray Barrages, South Australia, 2015–2017. South Australian Research and Development Institute (Aquatic Sciences), Adelaide. SARDI Publication No. F2016/000452-2. SARDI Research Report Series No. 952. 65pp. South Australian Research and Development Institute SARDI Aquatic Sciences 2 Hamra Avenue West Beach SA 5024 Telephone: (08) 8207 5400 Facsimile: (08) 8207 5406 http://www.pir.sa.gov.au/research
DISCLAIMER The authors warrant that they have taken all reasonable care in producing this report. The report has been through the SARDI internal review process, and has been formally approved for release by the Research Chief, Aquatic Sciences. Although all reasonable efforts have been made to ensure quality, SARDI does not warrant that the information in this report is free from errors or omissions. SARDI does not accept any liability for the contents of this report or for any consequences arising from its use or any reliance placed upon it. The SARDI Report Series is an Administrative Report Series which has not been reviewed outside the department and is not considered peer-reviewed literature. Material presented in these Administrative Reports may later be published in formal peer-reviewed scientific literature.
© 2017 SARDI This work is copyright. Apart from any use as permitted under the Copyright Act 1968 (Cth), no part may be reproduced by any process, electronic or otherwise, without the specific written permission of the copyright owner. Neither may information be stored electronically in any form whatsoever without such permission.
Printed in Adelaide: July 2017 SARDI Publication No. F2016/000452-2 SARDI Research Report Series No. 952
Author(s): C. M. Bice, B. P. Zampatti and J. Fredberg Reviewer(s): G. Giatas and J. Nicol Approved by: Q. Ye Science Leader – Inland Waters & Catchment Ecology Signed: Date: 7 June 2017 Distribution: SAASC Library, SARDI Waite Executive Library, Parliamentary Library,
State Library and National Library Circulation: Public Domain

Bice, C.M. et al. (2017) Fishway effectiveness on the Murray Barrages
II
TABLE OF CONTENTS
ACKNOWLEDGEMENTS ........................................................................................................ VII
EXECUTIVE SUMMARY ........................................................................................................... 1
1. INTRODUCTION ................................................................................................................ 5
1.1. Background.................................................................................................................. 5
1.2. Objectives .................................................................................................................... 6
2. METHODS .......................................................................................................................... 8
2.1. Study site ..................................................................................................................... 8
2.2. Fishways ...................................................................................................................... 9
2.3. Fishway sampling .......................................................................................................21
2.4. Data analysis ..............................................................................................................23
3. RESULTS ..........................................................................................................................25
3.1. Environmental conditions ............................................................................................25
3.2. Catch summary ...........................................................................................................27
3.3. Fishway use comparison 2015/16 ...............................................................................30
3.4. Fishway effectiveness .................................................................................................31
4. DISCUSSION ....................................................................................................................46
4.1. General catch and variability in fishway use ................................................................46
4.2. Fishway effectiveness .................................................................................................48
4.3. Overall fish passage at the Murray Barrages ..............................................................53
5. CONCLUSION AND RECOMMENDATIONS .....................................................................61
REFERENCES .........................................................................................................................64

Bice, C.M. et al. (2017) Fishway effectiveness on the Murray Barrages
III
LIST OF FIGURES
Figure 1. Map of the Coorong and Lower Lakes at the terminus of the River Murray, southern
Australia, with the Murray Barrages presented as bold lines. The positioning of fishways
constructed under the CLLMM Program are presented in green circles, namely: Goolwa large
vertical-slot 2 (GVS2, constructed 2015), Goolwa small vertical-slot (GSVS, to be constructed in
2016), Mundoo dual vertical-slot (MVS, constructed 2016), Boundary Creek vertical-slot (BVS,
constructed 2015), Ewe Island dual vertical-slot (EVS, constructed 2015) and Tauwitchere
trapezoidal (TT, to be constructed 2016, subject to funding). The positioning of pre-existing
fishways are indicated by red circles, namely: Goolwa large vertical-slot (GVS), Hunters Creek
vertical-slot (Hunters), Tauwitchere vertical-slot (TVS), Tauwitchere small vertical-slot (TSVS)
and Tauwitchere rock ramp (TRR). ............................................................................................ 8
Figure 2. a) Plan and b) side views of the newly constructed Goolwa large vertical-slot 2 (GVS2)
fishway. Entrance and exit trapping locations are indicated in the plan view, whilst vertical-slot
aperture configuration is indicated in the side view. ..................................................................12
Figure 3. Plan view of the Goolwa small vertical-slot fishway with indication of the entrance, exit,
adjustable gate and auxiliary flow system. ................................................................................14
Figure 4. Plan view of the newly constructed Mundoo dual vertical-slot fishway and indication of
entrance, and exit, trapping locations. .......................................................................................15
Figure 5. Plan view of the newly constructed Boundary Creek vertical-slot fishway and indication
of entrance, and exit, trapping locations. ...................................................................................17
Figure 6. Plan view of the newly constructed Ewe Island dual vertical-slot fishway and indication
of entrance, and exit, trapping locations. ...................................................................................18
Figure 7. a) Plan of the newly constructed Tauwitchere trapezoidal (TT) fishway and b) front
views of baffles 1 and 2. ............................................................................................................20
Figure 8. Fishway traps deployed at the exits of the a) Goolwa large vertical-slot (GVS2) and b)
Boundary Creek small vertical-slot (BCVS). Note chains and lifting hook of mobile crane attached
to GVS2 trap. ............................................................................................................................21
Figure 9. Discharge (ML.day-1) and head loss data from the Murray Barrages in spring/summer
2015/16, specifically: a) total barrage daily discharge; b) daily discharge (black solid line), and
daily minimum (blue dotted line) and maximum head loss (red dotted lined) at Goolwa Barrage;
c) daily discharge (black solid line), and daily minimum (blue dotted line) and maximum head loss
(red dotted lined) at Boundary Creek Barrage; and d) daily discharge (black solid line), and daily
minimum (blue dotted line) and maximum head loss (red dotted lined) at Ewe Island Barrage.
Arrows indicate sampling season at each barrage and associated fishway. ..............................26
Bice, C.M. et al. (2017) Fishway effectiveness on the Murray Barrages
IV
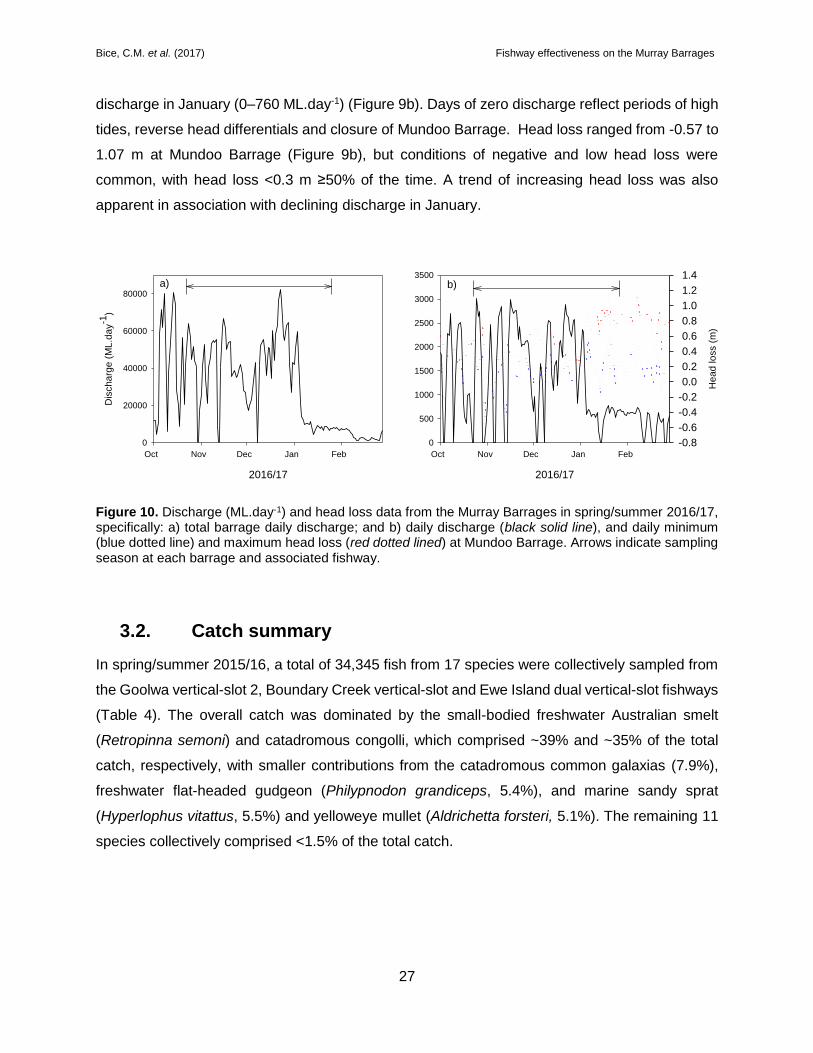
Figure 10. Discharge (ML.day-1) and head loss data from the Murray Barrages in spring/summer
2016/17, specifically: a) total barrage daily discharge; and b) daily discharge (black solid line),
and daily minimum (blue dotted line) and maximum head loss (red dotted lined) at Mundoo
Barrage. Arrows indicate sampling season at each barrage and associated fishway. ...............27
Figure 11. Non-metric multi-dimensional scaling (MDS) ordination of fish assemblages (entrance
and exit samples pooled) sampled at the Goolwa large vertical-slot 2 (GVS2, solid triangles), Ewe
Island dual vertical-slot (EVS, open triangles) and Boundary creek vertical-slot (BVS, open
circles). .....................................................................................................................................30
Figure 12. Comparison of mean relative abundance (number of fish.hour-1.trap event-1) of the
most common species sampled at the entrance (shaded bar) and exit (open bar) of the new
Goolwa large vertical-slot 2 fishway in spring/summer 2015/16. Significant differences between
entrance and exit abundance are indicated by asterisks. ..........................................................32
Figure 13. Length-frequency distributions of a) congolli, b) common galaxias, c) flat-headed
gudgeon and d) Australian smelt captured from the entrance (black bar) and exit (shaded bar) of
the new Goolwa large vertical-slot fishway in spring/summer 2015/16. Sample sizes represent the
number of fish measured for length, and those in brackets, represent the total number of fish
sampled for each species. ........................................................................................................33
Figure 14. Relationship between the total fish abundance (fish.hour-1, all species pooled) sampled
at the new Goolwa large vertical-slot 2 a) entrance and b) exit, and minimum head loss (m)
experienced during trapping. .....................................................................................................34
Figure 15. Comparison of mean relative abundance (number of fish. hour-1.trap event-1) of the
most common species sampled at the entrance (shaded bar) and exit (open bar) of the Ewe Island
dual vertical-slot fishway in spring/summer 2015/16. Significant differences between entrance and
exit abundance indicated by asterisks. ......................................................................................35
Figure 16. Length-frequency distributions of a) congolli, b) common galaxias, c) flat-headed
gudgeon and d) Australian smelt captured from the entrance (black bar) and exit (shaded bar) of
the Ewe Island dual vertical-slot fishway in spring/summer 2015/16. Sample sizes represent the
number of fish measured for length, and those in brackets, represent the total number of fish
sampled for each species. ........................................................................................................36
Figure 17. Relationship between the total fish abundance (fish . hour-1, all species pooled)
sampled at the Ewe Island dual vertical-slot a) entrance and b) exit, and minimum head loss (m)
experienced during trapping ......................................................................................................37
Figure 18. Comparison of mean relative abundance (number of fish.hour-1.trap event-1) of the
most common species sampled at the entrance (shaded bar) and exit (open bar) of the Boundary

Bice, C.M. et al. (2017) Fishway effectiveness on the Murray Barrages
V
Creek vertical-slot fishway in spring/summer 2015/16. Significant differences between entrance
and exit abundance indicated by asterisks. ...............................................................................39
Figure 19. Length-frequency distributions of a) congolli, b) common galaxias, c) flat-headed
gudgeon and d) Australian smelt captured from the entrance (black bar) and exit (shaded bar) of
the Boundary Creek vertical-slot fishway in spring/summer 2015/16. Sample sizes represent the
number of fish measured for length, and those in brackets, represent the total number of fish
sampled for each species. ........................................................................................................40
Figure 20. Relationship between the total fish abundance (fish.hour-1, all species pooled) sampled
at the Boundary Creek vertical-slot a) entrance and b) exit, and minimum head loss (m)
experienced during trapping. .....................................................................................................41
Figure 21. Comparison of mean relative abundance (number of fish.hour-1.trap event-1) of the
most common species sampled at the entrance (shaded bar) and exit (open bar) of the Mundoo
dual vertical-slot fishway in spring/summer 2016/17..................................................................43
Figure 22. Length-frequency distributions for a) congolli (total length, TL); b) common galaxias
(fork length, FL); c) flat-headed gudgeon (TL); d) Australian smelt (FL); e) bony herring (FL) and
f) redfin perch (FL), sampled from the entrance (black bar, n = 8) and exit (white bar, n = 8) of the
Mundoo dual vertical-slot fishway in spring/summer 2016/17. Sample sizes represent the number
of fish measured for length, and those in brackets, represent the total number of fish sampled for
each species. ............................................................................................................................44
Figure 23. Relationship between the total fish abundance (fish.hour-1, all species pooled) sampled
at the Mundoo dual vertical-slot a) entrance and b) exit, and minimum head loss (m) experienced
during trapping. .........................................................................................................................45
LIST OF TABLES
Table 1. Ecological objectives for fish passage and resulting overall passage requirements
determined for each of the Murray Barrages. ............................................................................10
Table 2. List of all current and ‘to be constructed’ fishways on the Murray Barrages, as of June
2016. Details include the barrage on which the fishways are situated, fishway design, abbreviation
used throughout, construction year and hydraulic design parameters. ......................................11
Table 3. Definitions of fish ‘estuarine use’ categories and guilds represented by fishes of the
Coorong, following the approach of Potter et al. (2015). Examples of representative species from
the Coorong are presented for each guild. ................................................................................22

Bice, C.M. et al. (2017) Fishway effectiveness on the Murray Barrages
VI
Table 4. Species, total number and length range of fish collected from the entrances and exits of
the newly constructed Goolwa large vertical-slot 2, Boundary Creek vertical-slot and Ewe Island
dual vertical-slot in spring/summer 2015/16. Species are grouped using the life history categories
of Potter et al. (2015) ................................................................................................................28
Table 5. Matrix adopted for determining fishway effectiveness. Fishway effectiveness is
considered a product of ‘relative attraction’ and ‘passage efficiency’ and is categorised as
ineffective, sub-optimal or optimal. ............................................................................................54
Table 6. Qualitative statements on fish migration and function of fishways on Goolwa Barrage for
small-bodied (<100 in length) and large-bodied (>100 mm in length) fish under low flow and high
flow scenarios, including: 1) Biomass: the likely biomass of fish accumulated below the barrage
and attempting to migrate upstream (low, moderate, high); 2) Relative attraction: the relative
proportion of fish attempting to migrate able to locate the entrance of the fishway (low, moderate,
high); 3) Passage efficiency: the proportion of fish able to enter the fishway that are able to
successfully ascend (based on empirical data from assessments, low (<25%), moderate (25–
75%) or high (>75%)); and 4) Effectiveness: the product of ‘relative attraction’ and ‘passage
efficiency’ following Table 4. ......................................................................................................55
Table 7. Qualitative statements on fish migration and function of fishways on Boundary Creek
and Ewe Island barrages for small-bodied (<100 in length) and large-bodied (>100 mm in length)
fish under low flow and high flow scenarios, including: 1) Biomass: the likely biomass of fish
accumulated below the barrage and attempting to migrate upstream (low, moderate, high); 2)
Relative attraction: the relative proportion of fish attempting to migrate able to locate the entrance
of the fishway (low, moderate, high); 3) Passage efficiency: the proportion of fish able to enter the
fishway that are able to successfully ascend (based on empirical data from assessments, low
(<25%), moderate (25–75%) or high (>75%)); and 4) Effectiveness: the product of ‘relative
attraction’ and ‘passage efficiency’ following Table 4. ...............................................................57
Table 8. Qualitative statements on fish migration and function of fishways on Tauwitchere Barrage
in regards to small-bodied (<100 in length) and large-bodied (>100 mm in length) fish passage
under low flow and high flow scenarios, including: 1) Biomass: the likely biomass of fish
accumulated below the barrage and attempting to migrate upstream (low, moderate, high); 2)
Relative attraction: the relative proportion of fish attempting to migrate able to locate the entrance
of the fishway (low, moderate, high); 3) Passage efficiency: the proportion of fish able to enter the
fishway that are able to successfully ascend (based on empirical data from assessments, low
(<25%), moderate (25–75%) or high (>75%)); and 4) Effectiveness: the product of ‘relative
attraction’ and ‘passage efficiency’ following Table 4. ...............................................................60
Bice, C.M. et al. (2017) Fishway effectiveness on the Murray Barrages
VII
ACKNOWLEDGEMENTS
Thank you to Stephen Madigan, Jason Higham, Carina Staer, Paul McEvoy, Rebecca Quin and
Adam Watt (Department of Environment, Water and Natural Resources, Coorong, Lower Lakes
and Murray Mouth Program) for facilitating funding and managing this project, and for ongoing
support of aquatic ecosystem research in the Coorong and Lower Lakes. Thanks also to John
Howard and Kat Ryan (DEWNR), Ben Dyer and Paul Sureda (Murray-Darling Basin Authority,
MDBA), and Michael Shelton, Leigh Angus and Ian George (SA Water) for planning and guiding
construction of fishways under the current project. Martin Mallen-Cooper (Fishway Consulting
Services) played a pivotal role in fishway conceptual designs. To Ray Maynard, Bryce
Buchannan, Greg Bald, Dave Bishop, Arron Strawbridge, Ian Magraith and George Giatas, and
all the other SA Water Barrage and SARDI staff who braved four seasons in one day to set and
retrieve traps, and assist in processing fish, thanks for all your efforts. Insightful comments on a
draft of this report were provided by Adam Watt (DEWNR), Gavin Begg, Jason Nicol and George
Giatas (SARDI).

Bice, C.M. et al. (2017) Fishway effectiveness on the Murray Barrages
1
EXECUTIVE SUMMARY
Fishways are used to reinstate connectivity in fragmented river systems and partially mitigate the
impact of barriers to fish movement. The Murray Barrages, at the terminus of Australia’s longest
river system, the Murray-Darling Basin (MDB), separate the estuarine waters of the Coorong and
the freshwaters of the Lower Lakes, and represent significant barriers to movement of fishes
between these environments. Recognition of the importance of fish movement at the Murray
Barrages led to the construction of five fishways (varying vertical-slot and rock ramp designs) at
Goolwa and Tauwitchere Barrages, and the Hunters Creek causeway, between 2003 and 2009.
Whilst these fishways enhanced fish passage and promoted connectivity, assessments of their
biological effectiveness and improved knowledge of fish migration at the Murray Barrages,
indicated that additional fishways were needed to meet the movement requirements of fishes
across the 7.6 km barrage network.
Under the Coorong Lower Lakes and Murray Mouth (CLLMM) Recovery Project, construction of
a further six technical fishways across the Murray Barrages was proposed from 2015 to 2017.
This included inaugural fishways on Mundoo, Boundary Creek and Ewe Island barrages, and
further fishways on Goolwa and Tauwitchere barrages. The fishway designs were varied and
tailored for target species, locations and hydrology in order to meet defined fish passage
requirements at the Murray Barrages. The primary objective of the current project was to assess
the biological effectiveness of these fishways, but due to issues with construction, was limited to
the assessment of four fishways. This included: 1) Goolwa large vertical-slot 2 (at median water
levels: max velocity 1.5 m.s-1, turbulence 23 W.m-3, discharge 35 ML.day-1); 2) Boundary Creek
small vertical-slot (maximum velocity 0.92 m.s-1, turbulence 20 W.m-3, discharge 2.2 ML.day-1); 3)
Ewe Island dual vertical-slot (maximum velocity 1.7 m.s-1, turbulence 40 W.m-3, discharge 16
ML.day-1); and 4) Mundoo dual vertical-slot (maximum velocity 1.7 m.s-1, turbulence 32 W.m-3,
discharge 16 ML.day-1). Specifically, the project aimed to:
1. Undertake ‘entrance and exit trapping’ of each fishway and compare fish species
composition, abundance and length distributions between entrance and exit samples to
determine passage efficiency against fishway-specific objectives and design
specifications;
2. Determine the influence of head loss on relative attraction and passage efficiency, and
thus, biological effectiveness;
Bice, C.M. et al. (2017) Fishway effectiveness on the Murray Barrages
2
3. Qualitatively compare biological effectiveness (i.e. the species and size classes for
which passage is facilitated) between the newly constructed fishways and with existing
fishways on the Murray Barrages;
4. Provide comment on the contribution of the CLLMM fishway construction program to
improving overall fish passage at the site;
5. Make recommendations for fishways still to be constructed; and
6. Make recommendations on future barrage/fishway operation in light of results of the
current project and previous fishway assessments.
The Goolwa large vertical-slot 2, Boundary Creek small vertical-slot and Ewe Island dual vertical-
slot fishways were assessed from 24 November 2015 to 4 March 2016, and the Mundoo dual
vertical slot from 25 October 2016 to 20 January 2017. Over 16 paired-day samples of the fishway
entrances and exits, 21,691 fish (14 species) were sampled from the Goolwa large vertical-slot 2,
9935 fish (15 species) from the Boundary Creek small vertical-slot, 2719 fish (9 species) from the
Ewe Island dual vertical-slot, and 62,987 fish (14 species) from the Mundoo dual vertical-slot. The
catch at all fishways was dominated by small-bodied fishes (i.e. length <100 mm), particularly the
freshwater Australian smelt (Retropinna semoni), and juveniles of the catadromous congolli
(Pseudaphritis urvillii) and common galaxias (Galaxias maculatus), but total and species-specific
abundances varied between years, driven by hydrology. Assessment of the first three fishways
occurred during low discharge conditions, whilst assessment at Mundoo occurred during high
discharge conditions, resulting in greater total fish abundance (all species pooled). In 2015/16,
species composition was similar among fishways, but total fish and species-specific abundance
varied, likely as a result of varying discharge among the barrages; discharge at Ewe Island was
typically lower (≤5 ML.day-1) than at Goolwa and Boundary Creek Barrages (often ≥300 ML.day-1),
likely resulting in the attraction of fewer fish to the associated fishway.
At the Goolwa large vertical-slot 2 fishway, the abundances of the most common sampled species
(congolli, common galaxias, Australian smelt and flat-headed gudgeon Philypnodon grandiceps)
were significantly greater at the entrance than at the exit of the fishway, whilst a greater proportion
of small (<40 mm in length) congolli and common galaxias were sampled at the entrance than at
the exit. This indicates some obstruction of the passage of small-bodied fishes at this fishway;
nonetheless, overall passage efficiency (~25%) at this fishway in 2015/16 was up to five times
greater than at the original Goolwa large vertical-slot fishway during assessment in 2005/06
(~5%). Additionally, the mean number of fish sampled from the exit (20.2 ± 11.4 fish.hour-1) was
only marginally lower than that at the exit of the Boundary Creek small vertical-slot fishway (31.2
Bice, C.M. et al. (2017) Fishway effectiveness on the Murray Barrages
3
± 10.5 fish.hour-1), suggesting comparable absolute fish passage between these fishways in
2015/16. Furthermore, low flows during sampling in 2015/16 resulted in generally high head loss
(>0.5 m 60% of the time) across the fishway. These conditions promote internal hydraulics in the
fishway that may be unsuitable for the passage of small fish. Because of its design, greater
passage efficiency is expected at this fishway under conditions of higher flow and lower head
loss.
At the Boundary Creek small vertical-slot fishway, abundances of congolli, common galaxias and
Australian smelt were similar between entrance and exit samples, whilst flat-headed gudgeon
were significantly more abundant from the entrance, although this species was generally
uncommon in the fishway (n = 121). Slightly greater proportions of small size classes (<40 mm)
of common galaxias were sampled at the entrance (~40%) than the exit (~17%), but length
distributions were generally similar between the entrance and exit for other species. As such, this
fishway exhibited high passage efficiency for the species sampled. Although statistically not
significant, there was an apparent trend of increasing minimum head loss during trapping events
and greater total fish abundance in entrance samples. This suggests that during times of greater
head loss and higher fishway discharge and velocities, greater numbers of fish are attracted into
the fishway; this result is consistent with a head loss–abundance relationship previously observed
at the Tauwitchere small vertical-slot fishway, which has a similar design.
At the Ewe Island dual vertical-slot fishway, the abundance of congolli, common galaxias and
Australian smelt were similar between entrance and exit samples, but flat-headed gudgeon was
more abundant at the entrance. Furthermore, length-frequency distributions were generally
similar between entrance and exit samples, with the exception of a slightly greater proportion of
small (<40 mm in length) common galaxias at the entrance. As such, this fishway exhibited high
passage efficiency for the species sampled. Although statistically not significant, there was an
apparent trend of decreasing total fish abundance in exit samples and increasing minimum head
loss during trapping events. This suggests greatest passage efficiency for small-bodied fishes
during periods of relatively low head loss.
At the Mundoo dual vertical-slot fishway, the abundance of all species sampled in adequate
numbers were similar between entrance and exit samples. Furthermore, length-frequency
distributions were generally similar between entrance and exit samples, with the exception of a
slightly greater proportion of small (<45 mm in length) common galaxias and Australian smelt at
the entrance. As such, this fishway exhibited high passage efficiency for the species sampled. In

Bice, C.M. et al. (2017) Fishway effectiveness on the Murray Barrages
4
addition, low numbers of large-bodied fishes (>200 mm length), namely golden perch (Macquaria
ambigua ambigua), freshwater catfish (Tandanus tandanus), common carp (Cyprinus carpio) and
redfin (Perca fluviatilis) were detected using the fishway, which likely reflect the conditions of high
discharge under which sampling was conducted. Although statistically not significant, there was
an apparent trend of decreasing total fish abundance in exit samples and increasing minimum
head loss during trapping events. This suggests greatest passage efficiency for small-bodied
fishes during periods of relatively low head loss.
The current fishway construction program has improved overall fish passage at the Murray
Barrages. The fishways on Mundoo, Boundary Creek and Ewe Island barrages have re-instated
migratory pathways providing further locations across the barrage network for fish to access the
Lower Lakes from the Coorong. These fishways, together with the Goolwa large vertical-slot 2
fishway, unassessed Goolwa small vertical-slot and to-be-completed Tauwitchere trapezoidal,
have resulted in the provision of fish passage on every barrage within the network, improved the
geographical spread of migration pathways and increased the capacity of the fishway network to
pass a high biomass of fish, under all flow conditions
The key conclusions/recommendations of this report are:
Each of the assessed fishways are operating to biological design objectives;
Physical alterations to the new fishways are likely not required, but will be dependent upon
wet commissioning to determine hydraulic characteristics;
The assessment of the Goolwa small vertical-slot and Tauwitchere trapezoidal fishways
remains a future priority; and
The year-round operation of all fishways, but particularly June–January, and barrage
operation that maximises attraction to fishway entrances (i.e. operation of barrage gates
adjacent fishways), is recommended.

Bice, C.M. et al. (2017) Fishway effectiveness on the Murray Barrages
5
1. INTRODUCTION
1.1. Background
The obstruction of fish movement by dams, weirs, barrages and other regulating structures is
among the greatest threats to freshwater and diadromous fish populations globally (Lucas and
Baras 2001). Instream barriers restrict access to spawning, nursery and feeding habitats, and
prevent dispersal and recolonisation (Gehrke et al. 1995). Fishways are commonly used to
reinstate connectivity in regulated river systems and partially mitigate the impacts of instream
barriers (Clay 1995).
At the terminus of Australia’s longest river system, the Murray-Darling, a series of low-level
(~1.5 m above sea level) barrages separate the Coorong and Lower Lakes, regulate freshwater
discharge to the Coorong and obstruct the movement of fishes between marine, estuarine and
freshwater environments. A growing appreciation of the importance of fish movement at the
Murray Barrages prompted the construction of three experimental fishways (two vertical-slot
fishways and one rock ramp) in 2004 under the Murray-Darling Basin Authority’s The Sea to
Hume Program (Barrett and Mallen-Cooper 2006). Due to a paucity of scientific data on fish
movement in the region, fishway designs were informed by local knowledge (e.g. anecdotal
evidence from commercial fishers). Perceived importance of the movement of large-bodied
species, including black bream (Acanthopagrus butcherii) and mulloway (Argyrosomus
japonicus), resulted in the vertical-slot fishways on Goolwa and Tauwitchere Barrages being
designed to pass large-bodied fish (i.e. >150 mm total length; TL), whilst the rock ramp fishway
at Tauwitchere was designed to facilitate the passage of small-bodied fish (i.e. 40–150 mm TL).
Assessment of the effectiveness of the three experimental fishways from 2004–2006 (Stuart et
al. 2005, Jennings et al. 2008) and long-term monitoring of fishway entrances from 2006–2016
(see Bice and Zampatti 2015) suggested the migratory fish assemblage was substantially different
from that originally proposed from local ecological knowledge and used to inform original fishway
design. Indeed, small-bodied fish (<100 mm TL), including young-of-the-year catadromous
congolli (Pseudaphritis urvillii) and common galaxias (Galaxias maculatus), typically represented
>95% of fish sampled at these fishways in any given year, with limited use of the fishways by
large-bodied species, particularly black bream and mulloway. Assessment of the effectiveness of
the vertical-slot fishways suggested the passage of small-bodied fish (<100 mm) was largely
obstructed, particularly during years of low discharge from the barrages and consequently
conditions of predominantly high head loss (the difference between water levels between

Bice, C.M. et al. (2017) Fishway effectiveness on the Murray Barrages
6
upstream and downstream), whilst the rock-ramp fishway had a limited operational window (Lake
Alexandrina water level >0.65 m Australian Height Datum (AHD) and Coorong water level
>0.18 m AHD) due to the high variability in headwater and tailwater levels typical of the Murray
Barrages.
An improved model of fish movement at the Murray Barrages, supported by scientific data, and
enhanced knowledge of fishway function (Zampatti et al. 2010, 2012, Bice and Zampatti 2015),
highlighted the need to improve fish passage on the Murray Barrages, particularly for small-bodied
species. This prompted the construction of the Tauwitchere small vertical-slot and Hunters Creek
vertical-slot fishway, which were both specifically designed (i.e. low velocity and turbulence) to
facilitate the passage of small-bodied fishes. Additionally, alterations were made to the slot
dimensions of the original Goolwa large vertical-slot fishway (i.e. reduced slot width and overall
aperture) with the intention of reducing internal turbulence and thus, improving passage for small-
bodied fishes. The Tauwitchere small vertical-slot and Hunters Creek vertical-slot were found to
be effective at passing small-bodied fishes, whilst passage at the Goolwa large vertical-slot was
improved (Zampatti et al. 2012; Bice et al. 2017).
Despite the construction of new fishways and improved function of the Goolwa large vertical-slot
fishway, fish passage was still not provided at three barrages, namely Mundoo, Boundary Creek
and Ewe Island. Furthermore, the large extent of both Goolwa and Tauwitchere Barrages, and
contemporary operation of the Murray Barrages that prioritises discharge to these structures,
suggests high biomasses of fish are likely to attempt to migrate at these barrages. Further
fishways were considered necessary to meet the movement requirements of fishes in this region.
Under the Coorong Lower Lakes and Murray Mouth (CLLMM) Recovery Project, construction of
a further six fishways across the Murray Barrages was proposed for 2015–2017. This included
fishways on Mundoo, Boundary Creek and Ewe Island Barrages, and further fishways on Goolwa
and Tauwitchere Barrages. The fishway designs were varied and tailored for target species,
locations and hydrology in order to holistically meet fish passage requirements at the Murray
Barrages. Fundamental to any fishway construction is assessment of the biological effectiveness
of fishways against their design criteria. Such assessment can inform modifications required to
improve passage and future fishway design.
1.2. Objectives
The primary objective of the current project was to assess the biological effectiveness of four of
the newly constructed fishways on the Murray Barrages: Goolwa large vertical-slot 2; Mundoo

Bice, C.M. et al. (2017) Fishway effectiveness on the Murray Barrages
7
dual vertical-slot; Boundary Creek small vertical-slot; and Ewe Island dual vertical-slot. Two
further fishways, the Goolwa small vertical-slot and Tauwitchere trapezoidal fishway were not
completed by spring/summer 2016/17 and thus, could not be assessed. Specifically, the project
aimed to:
1. Undertake ‘entrance and exit trapping’ of each fishway and compare fish species
composition, abundance and length distributions between entrance and exit samples to
determine passage efficiency against fishway-specific objectives and design
specifications;
2. Determine the influence of head loss on relative attraction and passage efficiency, and
thus, biological effectiveness;
3. Qualitatively compare biological effectiveness (i.e. the species and size classes for
which passage is facilitated) between the newly constructed fishways and with existing
fishways on the Murray Barrages;
4. Provide comment on the contribution of the CLLMM fishway construction program to
improving overall fish passage at the site; and
5. Make recommendations on future barrage/fishway operation in light of results of the
current project and previous fishway assessments.
The current report presents data on the assessment of the Goolwa large vertical-slot 2 fishway,
Boundary Creek small vertical-slot fishway and Ewe Island dual vertical-slot fishway in
spring/summer 2015/16, and assessment of the Mundoo dual vertical-slot fishway in
spring/summer 2016/17.
Bice, C.M. et al. (2017) Fishway effectiveness on the Murray Barrages
8
2. METHODS
2.1. Study site
This study was conducted at the Murray Barrages, the physical interface between the Coorong
and Lower Lakes of the River Murray, in southern Australia (Figure 1). A series of five tidal
barrages (Goolwa, Mundoo, Boundary Creek, Ewe Island and Tauwitchere), cumulatively
spanning 7.6 km, separate the freshwater Lower Lakes (lakes Alexandrina and Albert) from the
remnant Murray estuary and the Southern Ocean. Constructed in the 1930s, the barrages
maintain a freshwater storage upstream by preventing saltwater intrusion and regulate freshwater
discharge to the Murray estuary. Under natural conditions, mean annual discharge was
~12,233 GL, but there was strong inter-annual variation (Puckridge et al. 1998). Under regulated
conditions, an average of ~4,723 GL.y-1 reaches the sea (CSIRO 2008).
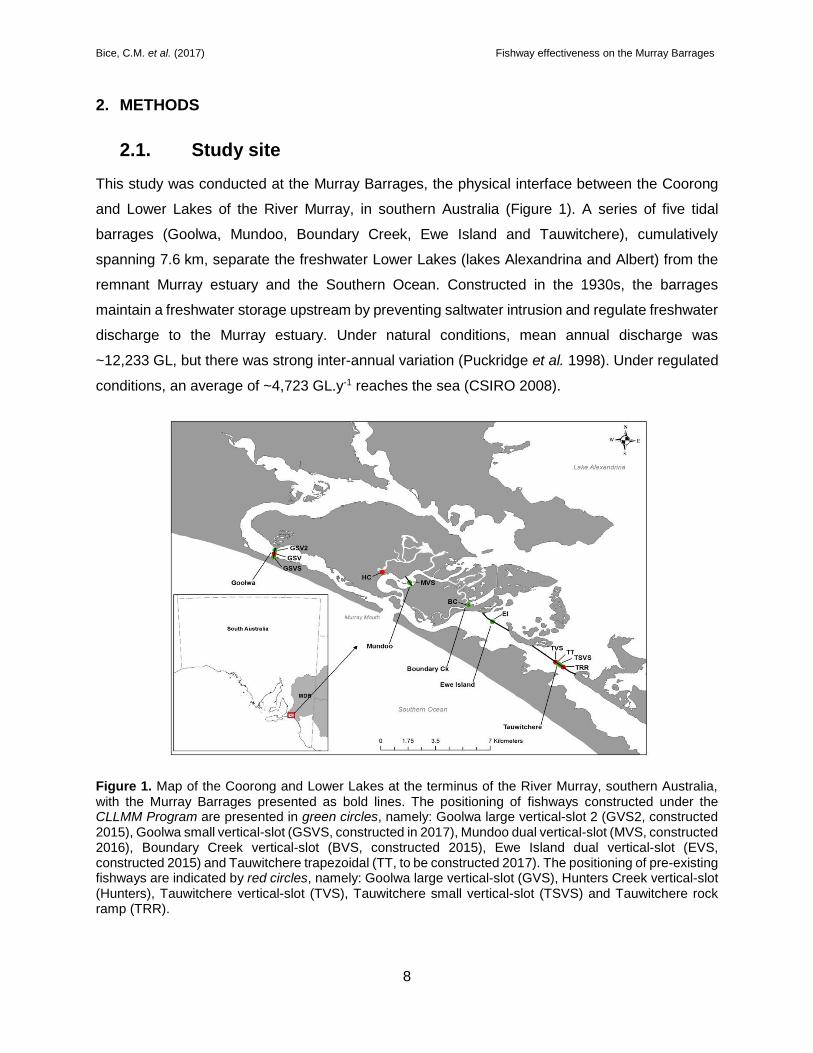
Figure 1. Map of the Coorong and Lower Lakes at the terminus of the River Murray, southern Australia, with the Murray Barrages presented as bold lines. The positioning of fishways constructed under the CLLMM Program are presented in green circles, namely: Goolwa large vertical-slot 2 (GVS2, constructed 2015), Goolwa small vertical-slot (GSVS, constructed in 2017), Mundoo dual vertical-slot (MVS, constructed 2016), Boundary Creek vertical-slot (BVS, constructed 2015), Ewe Island dual vertical-slot (EVS, constructed 2015) and Tauwitchere trapezoidal (TT, to be constructed 2017). The positioning of pre-existing fishways are indicated by red circles, namely: Goolwa large vertical-slot (GVS), Hunters Creek vertical-slot (Hunters), Tauwitchere vertical-slot (TVS), Tauwitchere small vertical-slot (TSVS) and Tauwitchere rock ramp (TRR).

Bice, C.M. et al. (2017) Fishway effectiveness on the Murray Barrages
9
Water levels both upstream and downstream of the Murray Barrages exhibit hourly–seasonal
fluctuations. The large surface area of Lake Alexandrina (~650 km2) results in water levels
upstream of the barrages being influenced by wind seiche as well as riverine flow. Downstream,
water level is influenced by tide, freshwater inflows and wind seiche. In concert, these factors
result in temporally variable head loss across the Murray Barrages, which typically range from 0
to 0.9 m, with occasional reverse (negative) head loss. The constricted nature of the river mouth,
which connects the Coorong and Southern Ocean, means that during times of high river flow (e.g.
>300 GL.month-1), downstream water levels are generally elevated and tidal fluctuations are
dampened, resulting in relatively low head loss (i.e. 0–0.5 m). Conversely, during times of low
river flow, tidal fluctuation is maximised, resulting in variable head loss, but a greater frequency
of periods with relatively high head loss (up to 1.1 m).
More than 80 species of fish have been recorded in the vicinity of the Murray Barrages
representing freshwater, diadromous, estuarine and marine life history categories. A total of 33
species have been recorded attempting to migrate through the original vertical-slot fishways
constructed on Goolwa and Tauwitchere Barrages (Zampatti et al. 2010, 2011, Bice et al. 2012),
including two catadromous (congolli and common galaxias) and two anadromous species (short-
headed lamprey, Mordacia mordax, and pouched lamprey, Geotria australis).
2.2. Fishways
Prior to the current construction program, five fishways existed on the Murray Barrages,
specifically at Goolwa and Tauwitchere barrages, and the Hunters Creek Causeway, comprising
rock ramp and varying vertical-slot designs (Figure 1). All of these fishways have previously been
assessed for biological effectiveness (Stuart et al. 2005, Jennings et al. 2008, Zampatti et al.
2012, Bice et al. 2017). As part of the current construction program, an expert working group –
the ‘Construction of Fishways Inter-agency Working Group’ – comprised of fish ecologists,
engineers, natural resource managers and river operators assessed the specific fish passage
requirements on each of the Murray Barrages, with respect to the biomass and size classes of
fish (i.e. small-bodied (<100 mm TL) and/or large-bodied (>100 mm TL) species) attempting to
move at each structure, and the need for passage during periods of low discharge. Where
possible, fish passage requirements were based on empirical data from previous fishway
sampling (Stuart et al. 2005, Jennings et al. 2008, Zampatti et al. 2010, 2012, Bice and Zampatti
2015, Bice et al. 2017) and broader fish sampling within the Coorong (Noell et al. 2009, Ye et al.

Bice, C.M. et al. (2017) Fishway effectiveness on the Murray Barrages
10
2014, 2015) or otherwise based on expert opinion. Passage requirements were integrated with
knowledge of function and effectiveness of existing fishways to determine new fishway designs
likely to best meet passage requirements at individual structures and holistically across the
barrage network.
Table 1. Ecological objectives for fish passage and resulting overall passage requirements determined for each of the Murray Barrages.
Barrage Ecological objectives Overall passage requirement
Estimated overall
biomass1
Small-bodied fish passage2
Large-bodied
fish passage2
Requirement for passage at low
flows3
Goolwa High Yes Yes High Small and large-bodied fishes over range of flows, and
specifically small-bodied fish under low flows
Mundoo Moderate Yes Yes Moderate Small and large-bodied fishes over range of flows
Boundary Creek
Low Yes No Moderate Small-bodied fishes over range of flows
Ewe Island Moderate Yes Yes Moderate Small and large-bodied fishes over range of flows
Tauwitchere High Yes Yes High Small and large-bodied fishes over range of flows, and
specifically small-bodied fish under low flows
1Overall biomass was suggested to be either low/moderate/high. 2A specific requirement for the passage of small- and large-bodied species was categorised as yes/no or ‘potentially’ where limited data existed. 3Requirement for passage at low flows was categorised as high/moderate/low and based on typical operation of the barrages under such conditions (i.e. freshwater discharge is typically prioritised to Goolwa and Tauwitchere Barrages, followed by Boundary Creek, during conditions of low discharge).
Under the current program, up to six new fishways were planned for construction across Goolwa,
Mundoo, Boundary Creek, Ewe Island and Tauwitchere Barrages. Each fishway design considers
the physical nature and typical operation of individual barrages, as well as predetermined fish
passage ecological objectives at individual barrages and the site more broadly (Table 1). Three
fishways were completed by November 2015 (i.e. Goolwa large vertical-slot 2, Boundary Creek
vertical-slot and Ewe Island dual vertical-slot) and were subsequently sampled in spring/summer
2015/16, whilst the Mundoo dual vertical-slot was completed in March 2016 and sampled in
spring/summer 2016/17 (Table 2). The Goolwa small vertical-slot was completed in January 2017
and the Tauwitchere trapezoidal fishway is planned for completion by June 2017. At the
conclusion of the construction program, 11 fishways will be in operation on the Murray Barrages.

Bice, C.M. et al. (2017) Fishway effectiveness on the Murray Barrages
11
Table 2. List of all current and to-be-constructed fishways on the Murray Barrages, as of June 2017. Details include the barrage on which the fishways are situated, fishway design, abbreviation used throughout, construction year and hydraulic design parameters (at median headwater levels).
Fishway type Abbrev. Year constructed Max velocity (m.s-1)
Turbulence (W.m-3)
Discharge (ML.day-1)
Goolwa Barrage
Vertical-slot (large) GVS 2004 1.7 26 40
Vertical-slot (large) GVS2 2015 1.5 23 35
Vertical-slot (small) GSVS 2017 1.0 20 10 (50)*
Hunters Creek causeway
Vertical-slot (small) Hunters 2009 1.1 25 3
Mundoo Barrage
Dual vertical-slot MDVS 2016 1.7 32 16
Boundary Creek Barrage
Vertical-slot (small) BCVS 2015 0.92 20 2.2
Ewe Island Barrage
Dual vertical-slot EDVS 2015 1.7 40 16
Tauwitchere Barrage
Vertical-slot (large) TVS 2004 2.0 95 31
Rock ramp TRR 2004 - - 30
Vertical-slot (small) TSVS 2009 1.0 26 2.4
Trapezoidal TT 2017 - - -
*Including auxiliary flow.
Goolwa large vertical-slot 2 fishway (GVS2)
The Goolwa large vertical-slot 2 fishway was designed with the objective of passing both small-
bodied and large-bodied fishes. The design is expected to work optimally for large-bodied fishes
during both low flow and high flow conditions, but sub-optimally for small-bodied fishes under low
flow, and optimally under high flows.
This fishway is located towards the northern end of Goolwa Barrage in bay 99. The fishway
consists of four precast vertical-slot baffles installed within the piers of the barrage bay, resulting
in three pools with dimensions 2.7 m long x 3.6 m wide (Figure 2). Baffle height is 3.6 m and mean
water depth in the fishway is ~2.8 m. Vertical-slot widths are 200 mm and the hydraulic gradient
of the fishway is created by decreasing slot height across the baffles from upstream to
downstream (Figure 2b). At median headwater levels, the fishway discharges ~35 ML.day-1 and

Bice, C.M. et al. (2017) Fishway effectiveness on the Murray Barrages
12
head loss is 0.15 m between consecutive cells, resulting in a maximum velocity of 1.5 m.s-1 and
average turbulence of 23 W.m-3 (calculated with a Coefficient of Discharge [Cd] of 0.7).
a)
b)
Figure 2. a) Plan and b) side views of the newly constructed Goolwa large vertical-slot 2 (GVS2) fishway. Entrance and exit trapping locations are indicated in the plan view, whilst vertical-slot aperture configuration is indicated in the side view.
The depth of this fishway necessitated the use of a ‘double trap’ configuration to sample fish, with
two traps ~3.2 m long x ~1.9 m wide x ~1.8 m high, connected together one atop the other. A
double cone-shaped entrance configuration was used on the ‘top trap’ (cone 1: 0.65 m high x
0.15 m wide, cone 2: 0.35 m high x 0.15 m wide) and a single cone-shaped entrance configuration
Pier
downstream upstream
entrance exit
stop log
flow
traptrap
flow
downstream upstream
baffle 1 baffle 4baffle 3baffle 2
1300 1150 1000 850
500
500
50 150 250 350
50 200 350 500
Downstream Upstream
Entrance Exit
Flow
Bice, C.M. et al. (2017) Fishway effectiveness on the Murray Barrages
13
used on the ‘bottom trap’ (1.15 m high x 0.15 m wide). The traps were clad with a combination of
3 mm perforated aluminum sheet and 6 mm knotless mesh. The same traps were used to sample
the exit of the fishway.
Goolwa small vertical-slot fishway (GSVS)
The Goolwa small vertical-slot fishway was designed with the specific objective of passing small-
bodied fishes. The design is expected to work optimally for small-bodied fishes under low flows
and sub-optimally under high flows. It is expected to work sub-optimally for large-bodied species,
particularly individuals >350 mm TL, under all flow conditions due to narrow slot widths (110 mm).
This fishway, located towards the southern end of Goolwa Barrage, is a reinforced concrete
channel, rectangular in cross-section, divided into 13 pools by 14 vertical-slot baffles, comprising
five resting/turning pools 0.93 m wide x 2.67 m long, six regular pools 1.17 m wide x 1.24 m long
and two rectangular pools (i.e. the first and final pools) 0.93 m wide x 1.24 m long (Figure 3). Slot
widths are 110 mm and the hydraulic gradient of the fishway is created by decreasing slot height
across the baffles from upstream to downstream. At median headwater levels the fishway
discharges ~10 ML.day-1 and head loss is ~0.06 m between consecutive cells, resulting in a
maximum velocity of 1.0 m.s-1 and average turbulence of 20 W.m-3 (calculated with a Coefficient
of Discharge [Cd] of 0.7). Average turbulence of 30 W.m-3 may be experienced during periods of
high head loss. This fishway incorporates an auxiliary attraction flow system that comprises an
‘attraction flow pipe’ and ‘weir’ (Figure 3). The attraction flow pipe is designed to discharge ~40
ML.d-1 and the weir is used to dissipate the energy of the flow. Ultimately, this system was included
to improve attraction of fish to the fishway entrance whilst maintaining benign hydraulics within
the fishway.
The effectiveness of this fishway was not assessed as part of this project due to its completion
date (January 2017) precluding sampling during the peak upstream migration period for
diadromous fishes (October–January) and design features (i.e. framework above entrance and
exit cells) that hinder trapping of the fishway. The assessment of the effectiveness of this fishway
remains a priority for the future.

Bice, C.M. et al. (2017) Fishway effectiveness on the Murray Barrages
14
Figure 3. Plan view of the Goolwa small vertical-slot fishway with indication of the entrance, exit, adjustable gate and auxiliary flow system.
Mundoo dual vertical-slot fishway (MDVS)
This fishway was designed with the objective of passing both small- and large-bodied fishes under
a range of flows. The design is expected to work optimally for large-bodied fishes during both low
flow and high flow conditions, but optimally for small-bodied fishes under high flow, and sub-
optimally under low flows.
This fishway is located in Bay 2 at the western end of Mundoo Barrage. The fishway is a reinforced
concrete channel, separated into four pools of equal dimension (3.08 m wide 2.83 m long) by five
dual vertical-slot baffles (Figure 4). Slot widths are 150 mm and the hydraulic gradient of the
fishway is created by decreasing slot height across the baffles from upstream to downstream. At
median headwater levels (0.75 m AHD), the fishway discharges ~16 ML.day-1 and head loss of
~0.15 m between consecutive cells, resulting in a maximum velocity of 1.7 m.s-1 and average
Pier
downstream upstream
entrance exit
stop log
flow
flow
downstream upstream
flow
attraction flow pipe
adjustable gate
attraction flow weir and outfall

Bice, C.M. et al. (2017) Fishway effectiveness on the Murray Barrages
15
turbulence of 32 W.m-3 (calculated with a Coefficient of Discharge [Cd] of 0.7). The sill of the
vertical-slot on the most upstream baffle is set at 0.4 m AHD, meaning the fishway ceases to
function at Lake Alexandrina levels <0.4 m AHD.
Two separate traps were constructed to sample the left- and right-hand side entrances of the
fishway (Figure 4). The traps were mirror images of one another and approximately cuboid in
shape, ~0.94 m long x ~0.6 m wide x ~1.9 m high. Double cone-shaped entrance configurations
were used on both traps (each cone 0.66 m high x 0.11 m wide). The traps were clad with a
combination of 3 mm perforated aluminum sheet and 6 mm knotless mesh. These traps were also
used to sample the exit of the fishway.
Figure 4. Plan view of the newly constructed Mundoo dual vertical-slot fishway and indication of entrance, and exit, trapping locations.
Boundary Creek vertical-slot fishway
This fishway was designed with the specific objective of passing small-bodied fishes. The design
is expected to work optimally for small-bodied fishes under low flows and sub-optimally under
high flows. It is expected to work sub-optimally for large-bodied species, particularly individuals
>350 mm TL, under all flow conditions due to narrow slot widths (100 mm).
pier
downstream upstream
entrance exit
stop log
flow
trap
trap
flow
trap
trap
flow

Bice, C.M. et al. (2017) Fishway effectiveness on the Murray Barrages
16
This fishway is located in Bay 2 of Boundary Creek Barrage. The fishway is a reinforced concrete
channel, rectangular in cross-section, divided into 15 pools by 16 vertical-slot baffles, comprising
six resting/turning pools (1.04 m wide x 2.35 m long) and nine regular pools (1.1 m wide x 1.1 m
long) (Figure 5). Slot widths are 100 mm and the hydraulic gradient of the fishway is created by
decreasing slot height across the baffles from upstream to downstream. At a design depth of
0.4 m, the fishway discharges ~2.2 ML.day-1 and head loss is ~0.043 m between consecutive
pools, resulting in a maximum velocity of 0.92 m.s-1 and average turbulence of 20 W.m-3
(calculated with Coefficient of Discharge [Cd] of 0.7). The fishway has three different exits that
can be manually ‘engaged’ with the aim of maintaining optimal velocity and turbulence.
Nonetheless, only exit one was used in the current study. A specific ‘attraction gate’ was also
manufactured and installed adjacent the fishway (Figure 5). This gate may be used to regulate
discharge and thus, optimise entrance conditions and fish attraction.
A cuboid trap was used to sample both the entrance and exit of this fishway (Figure 5). The trap
was 1.25 m high x 0.95 m long x 0.84 m wide and used a single cone-shaped entrance
configuration 0.75 m high x 0.11 m wide. The trap was clad with a combination of 3 mm perforated
aluminum sheet and 6 mm knotless mesh.

Bice, C.M. et al. (2017) Fishway effectiveness on the Murray Barrages
17
Figure 5. Plan view of the newly constructed Boundary Creek vertical-slot fishway and indication of entrance, and exit, trapping locations.
Ewe Island dual vertical-slot fishway (EDVS)
This fishway was designed with the objective of passing both small- and large-bodied fishes under
a range of flows. The design is expected to work optimally for large-bodied fishes during both low
flow and high flow conditions, but optimally for small-bodied fishes under high flow, and sub-
optimally under low flows.
This fishway is located in Bay 2 at the western end of Ewe Island Barrage. The fishway is a
reinforced concrete channel, separated into three pools of equal dimension (3.39 m wide 3.25 m
long) by four dual vertical-slot baffles (Figure 6). Slot widths are 145 mm and the hydraulic
gradient of the fishway is created by decreasing slot height across the baffles from upstream to
downstream. At median headwater levels (0.75 m AHD), the fishway discharges ~15 ML.day-1
and head loss of ~0.15 m between consecutive cells, resulting in a maximum velocity of 1.7 m.s-1
and average turbulence of 40 W.m-3 (calculated with a Coefficient of Discharge [Cd] of 0.7). At
entrance
exit 1
flow
downstream upstream
attraction gate
flow
trap
trap flow
exit 2
exit 3
pier

Bice, C.M. et al. (2017) Fishway effectiveness on the Murray Barrages
18
Lake Alexandrina levels of 0.7 m AHD, turbulence is reduced to 30 W.m-3. The sill of the vertical-
slot on the most upstream baffle is set at 0.4 m AHD, meaning the fishway ceases to function at
Lake Alexandrina levels <0.4 m AHD.
Two separate traps were constructed to sample the left- and right-hand side entrances of the
fishway (Figure 6). The traps were mirror images of one another and approximately cuboid in
shape, ~0.9 m long x ~0.6 m wide x ~1.5 m high. Single cone-shaped entrance configurations
were used on both traps (1.06 m high x 0.11 m wide). The traps were clad with a combination of
3 mm perforated aluminum sheet and 6 mm knotless mesh. These traps were also used to sample
the exit of the fishway.
Figure 6. Plan view of the newly constructed Ewe Island dual vertical-slot fishway and indication of entrance, and exit, trapping locations.
Tauwitchere trapezoidal fishway (TT)
This fishway was designed with the objective of passing both small- and large-bodied fishes under
a range of flows. Benign internal hydraulics for the passage of small-bodied fishes are expected
under all flow scenarios, whilst the fishway is also design to pass substantial volumes of water to
maximise attraction during high flow conditions.
pier
downstream upstream
entrance exit
stop log
flow
trap
trap
flow
trap
trap
flow
Bice, C.M. et al. (2017) Fishway effectiveness on the Murray Barrages
19
This fishway, to be located at the western end of Tauwitchere Barrage, will comprise a reinforced
concrete channel, separated into ten pools of equal dimension (3.46 m wide x 1 m long) by 11
trapezoidal baffles (Figure 7a). Each trapezoidal baffle consists of two vertical-slots (100 mm), on
either extremity of the baffle, and a central trapezoid-shaped cut-out through which the bulk of
flow will pass (Figure 7b). Each consecutive baffle will be slightly offset from the last to limit
carryover water velocities from upstream baffles. The hydraulic gradient of the fishway is created
by decreasing slot height across the baffles from upstream to downstream. At median headwater
levels (0.75 m AHD), the fishway discharges ~50 ML.day-1 and head loss of ~0.60 m between
consecutive cells. The effectiveness of this fishway was not assessed as part of this project due
to its proposed completion date (mid–late 2017) precluding sampling during the peak upstream
migration period for diadromous fishes (October–January) within the current project scope. The
assessment of the effectiveness of this fishway remains a priority for the future.

Bice, C.M. et al. (2017) Fishway effectiveness on the Murray Barrages
20
a)
b)
Figure 7. a) Plan of the newly constructed Tauwitchere trapezoidal (TT) fishway and b) front views of baffles 1 and 2.
pier
downstream upstream
entrance exit
stop log
flow
flow
Baffle 1 Baffle 2

Bice, C.M. et al. (2017) Fishway effectiveness on the Murray Barrages
21
2.3. Fishway sampling
Fish were sampled from the fishways over two spring/summer periods from 24 November 2015
to 4 March 2016 (Goolwa large vertical-slot 2, Boundary Creek vertical-slot and Ewe Island dual
vertical-slot) and 25 October 2016 to 20 January 2017 (Mundoo dual vertical-slot). Assessment
occurred during the austral spring/summer as this is the peak upstream migration period for
juvenile catadromous fishes at the Murray Barrages (Zampatti et al. 2010). During each sampling
event (Monday–Friday) the entrance and exits of the fishways were sampled consecutively,
overnight for a period of ~24 hours; as such, entrances and exits were each sampled twice within
each sampling week. A minimum of eight sampling events were conducted for the entrance and
exit of each fishway and these sampling events are treated as replicates for subsequent statistical
analyses.
At the Goolwa large vertical-slot 2 and Mundoo dual vertical-slot fishways, the cage traps were
deployed and retrieved with a mobile crane and the assistance of SA Water staff (Figure 8a). At
the Boundary Creek vertical-slot and Ewe Island dual vertical-slot fishways, cage traps were
deployed and retrieved by hand (Figure 8b). All fish sampled were identified to species and
enumerated, and length measurements (fork length (FL) or total length (TL) depending on tail
morphology) taken for up to 50 individuals per species per trapping event. The estuarine use life
history guilds of Potter et al. (2015) are adopted throughout (Table 3)
a) b)
Figure 8. Fishway traps deployed at the exits of the a) Goolwa large vertical-slot (GVS2) and b) Boundary Creek small vertical-slot (BCVS). Note chains and lifting hook of mobile crane attached to GVS2 trap.
Bice, C.M. et al. (2017) Fishway effectiveness on the Murray Barrages
22
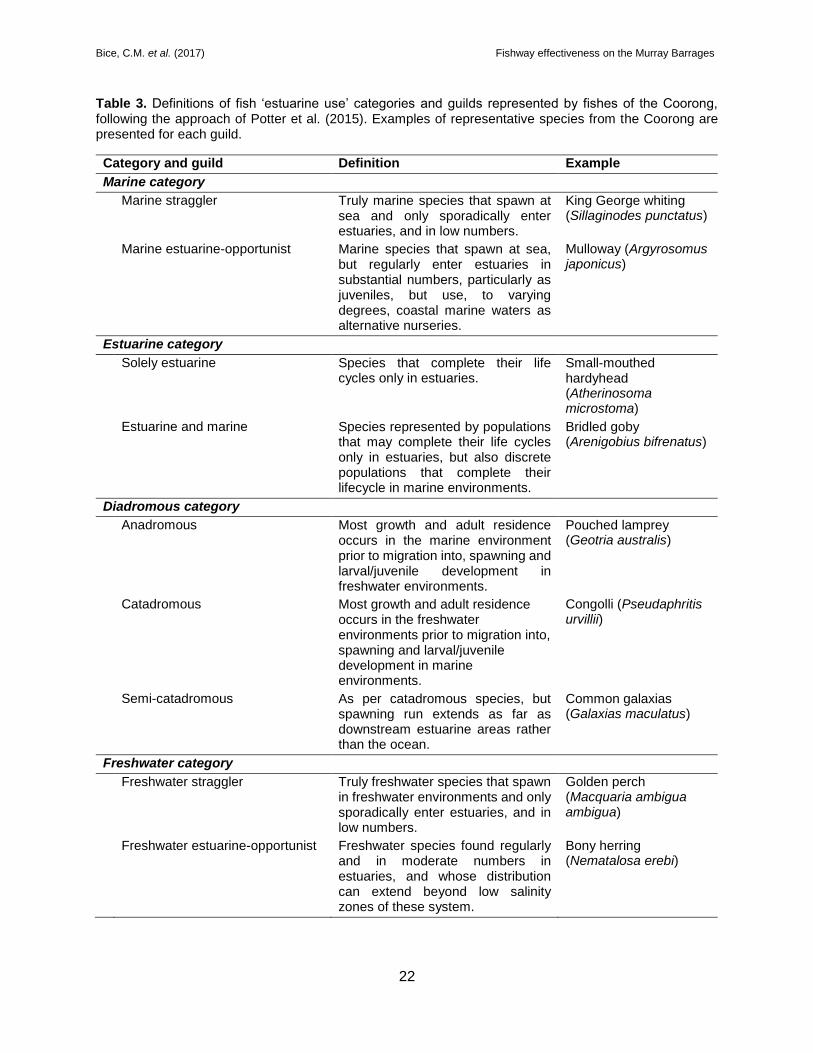
Table 3. Definitions of fish ‘estuarine use’ categories and guilds represented by fishes of the Coorong, following the approach of Potter et al. (2015). Examples of representative species from the Coorong are presented for each guild.
Category and guild Definition Example
Marine category
Marine straggler Truly marine species that spawn at sea and only sporadically enter estuaries, and in low numbers.
King George whiting (Sillaginodes punctatus)
Marine estuarine-opportunist Marine species that spawn at sea, but regularly enter estuaries in substantial numbers, particularly as juveniles, but use, to varying degrees, coastal marine waters as alternative nurseries.
Mulloway (Argyrosomus japonicus)
Estuarine category
Solely estuarine Species that complete their life cycles only in estuaries.
Small-mouthed hardyhead (Atherinosoma microstoma)
Estuarine and marine Species represented by populations that may complete their life cycles only in estuaries, but also discrete populations that complete their lifecycle in marine environments.
Bridled goby (Arenigobius bifrenatus)
Diadromous category
Anadromous Most growth and adult residence occurs in the marine environment prior to migration into, spawning and larval/juvenile development in freshwater environments.
Pouched lamprey (Geotria australis)
Catadromous Most growth and adult residence occurs in the freshwater environments prior to migration into, spawning and larval/juvenile development in marine environments.
Congolli (Pseudaphritis urvillii)
Semi-catadromous As per catadromous species, but spawning run extends as far as downstream estuarine areas rather than the ocean.
Common galaxias (Galaxias maculatus)
Freshwater category
Freshwater straggler Truly freshwater species that spawn in freshwater environments and only sporadically enter estuaries, and in low numbers.
Golden perch (Macquaria ambigua ambigua)
Freshwater estuarine-opportunist Freshwater species found regularly and in moderate numbers in estuaries, and whose distribution can extend beyond low salinity zones of these system.
Bony herring (Nematalosa erebi)

Bice, C.M. et al. (2017) Fishway effectiveness on the Murray Barrages
23
2.4. Data analysis
2.4.1. Fishway use
Differing use of the three fishways sampled in 2015/16, in regards to species identity and
abundance (fish.hour-1.trap event-1, entrance and exit samples pooled), was investigated using
multidimensional scaling (MDS) ordination and PERMANOVA (Permutational Anova), performed
on Bray-Curtis similarity matrices, in the software package PRIMER v. 6.12 (Clarke and Gorley
2006) and PERMANOVA+ (Anderson et al. 2008). Similarity percentage (SIMPER) analysis was
used to determine the species that contributed substantially to differences in fishway use. An
arbitrary 60% cumulative contribution cut-off was applied. Data from the Mundoo vertical-slot
could not be used in this analysis due to the different sampling year and vastly different
hydrological conditions.
2.4.2. Passage efficiency
Passage efficiency at each fishway was assessed by comparing the relative abundance
(fish.hour-1.trap event-1) of the most abundant species (i.e. where >200 individuals were sampled
over the study period) sampled at each fishway between entrance and exit samples using uni-
variate, single-factor PERMANOVA, performed on Euclidean Distance similarity matrices. Fish
relative abundance data were fourth-root transformed prior to all analyses. The size distribution
of the most common species (i.e. >25 individuals sampled at both the entrance and exit) were
compared between entrance and exit trapping events to determine if smaller fish, with
correspondingly poorer swimming abilities, were unable to ascend the fishways. A two-tailed
Kolmogorov-Smirnov ‘goodness-of-fit’ test was used to determine differences in length frequency
distributions between entrance and exit samples (pooled over the study period) at each fishway.
2.4.3. Influence of head loss on fishway effectiveness
The influence of head loss (the difference in water level between the entrance and exit of each
fishway) on fish attraction to the fishways was assessed by investigating the relationship between
total fish abundance (fish.hr-1, all species pooled) at the entrance and exit of the fishways and the
minimum head loss experienced during each trapping event. Whilst we did not specifically assess
attraction of individual fish from the areas immediately below the fishways (ideally done using
telemetry, Cooke and Hinch 2013), the abundance of fish in entrance samples was considered to
represent relative attraction (i.e. greater relative abundance in a given entrance sample is taken
to signify greater relative attraction), whilst abundance in exit samples was considered to

Bice, C.M. et al. (2017) Fishway effectiveness on the Murray Barrages
24
represent passage efficiency (i.e. greater relative abundance in a given exit sample is taken to
signify greater relative passage efficiency).
Water level upstream and downstream of the barrages is recorded hourly by remote logging
stations (DEWNR 2013) and hourly head loss for each fishway was calculated by subtracting
downstream water level from upstream water level, and the minimum value determined for the
course of each trapping event. Both linear and sigmoidal regression models were fitted to
Log10(x + 1) transformed total fish abundance and minimum head loss data, with the relative
support for each assessed by calculating Akaike’s Information Criteria (AIC), corrected for small
sample sizes (AICc) (Burnham and Anderson 1998). AICc values were rescaled as the difference
between the two models. The likelihood of the models given the data was calculated as:
𝑃(𝑀𝑘|𝑦) = 𝑒(−0.5𝑎) [∑ 𝑒(−0.5𝑎)10
𝑘=1] − 1
where P (Mk|y) if the likelihood of model Mk given data y (Hoeting et al. 1999) and a is ΔAICck.
The model (i.e. linear or sigmoidal) with the greatest likelihood was selected as the most
appropriate for explaining the total fish abundance/minimum head loss relationships and
assessed for significance using analysis of variance (ANOVA, α = 0.05). Significant relationships
would suggest minimum head loss during trapping was influencing (negatively or positively)
relative attraction and/or relative passage efficiency, and thus, fishway effectiveness.

Bice, C.M. et al. (2017) Fishway effectiveness on the Murray Barrages
25
3. RESULTS
3.1. Environmental conditions
3.1.1. 2015/16
Annual freshwater discharge from the Murray Barrages in 2015/16 (562 GL) was considerably
less than the long-term post-regulation average (~4723 GL). Over the spring/summer sampling
season, total barrage discharge peaked at ~3000 ML.day-1 in mid-November, before declining to
<100 ML.day-1 throughout December and January, and gradually increasing to 2000–
3000 ML.day-1 through late-February and early-March (Figure 9a). Temporal patterns of
discharge varied among Goolwa, Boundary Creek and Ewe Island barrages (Figure 9b–d).
Discharge at Goolwa and Boundary Creek barrages was approximately 300 ML.day-1 at the
initiation of trapping in November, but all gates were shut and discharge confined to the fishways
by the start of December and for the remainder of the study (Figure 9b and c). Discharge at Ewe
Island was ≤5 ML.day-1 throughout the study, reflecting the absence of gate opening and
confinement of discharge to the fishway (Figure 9d). Increases in ‘total barrage discharge’ in
February and March reflected increased discharge from Tauwitchere Barrage, which is not
presented here.
Head loss ranged from -0.35 to 1.08, -0.46 to 1.02 and -0.47 to 1.03 m at Goolwa, Boundary
Creek and Ewe Island barrages, respectively (Figure 9 b–c). Nonetheless, conditions of negative
and low head loss (i.e. ≤0.2 m) were rare, with head loss ranging from 0.2 to 0.9 m for ≥90% of
the time at all barrages. A trend of slightly decreasing head loss through spring/summer was also
apparent at all barrages.

Bice, C.M. et al. (2017) Fishway effectiveness on the Murray Barrages
26
Figure 9. Discharge (ML.day-1) and head loss data from the Murray Barrages in spring/summer 2015/16, specifically: a) total barrage daily discharge; b) daily discharge (black solid line), and daily minimum (blue dotted line) and maximum head loss (red dotted lined) at Goolwa Barrage; c) daily discharge (black solid line), and daily minimum (blue dotted line) and maximum head loss (red dotted lined) at Boundary Creek Barrage; and d) daily discharge (black solid line), and daily minimum (blue dotted line) and maximum head loss (red dotted lined) at Ewe Island Barrage. Arrows indicate sampling season at each barrage and associated fishway.
3.1.2. 2016/17
Annual freshwater discharge from the Murray Barrages in 2016/17 (6,200 GL up to March 2017)
was greater than the long-term post-regulation average (~4723 GL). Total daily barrage discharge
of >40,000 ML.day-1 was experienced throughout much of October, November and December,
with peaks of approximately 80,000 ML.day-1 in October and December (Figure 10a). Discharge
declined rapidly in early January and was 6,000–10,000 ML.day-1 for the remainder of the month.
The pattern of discharge from Mundoo Barrage mirrored that of total discharge, with variable, but
often high daily discharge (0–3,000 ML.day-1) through October–December, declining to lower
Dis
ch
arg
e (
ML.d
ay-1
)
0
1000
2000
3000
4000
0
100
200
300
400
500
600
Head loss (
m)
-0.6
-0.4
-0.2
0.0
0.2
0.4
0.6
0.8
1.0
1.2
DischargeMin HL Max HL
Nov Dec Jan Feb Mar Apr
Dis
ch
arg
e (
ML.d
ay-1
)
0
100
200
300
400
500
-0.6
-0.4
-0.2
0.0
0.2
0.4
0.6
0.8
1.0
1.2
Nov Dec Jan Feb Mar Apr
0
1
2
3
4
5
6
Head loss (
m)
-0.6
-0.4
-0.2
0.0
0.2
0.4
0.6
0.8
1.0
1.2
2015/16 2015/16
a) b)
c) d)
Bice, C.M. et al. (2017) Fishway effectiveness on the Murray Barrages
27
discharge in January (0–760 ML.day-1) (Figure 9b). Days of zero discharge reflect periods of high
tides, reverse head differentials and closure of Mundoo Barrage. Head loss ranged from -0.57 to
1.07 m at Mundoo Barrage (Figure 9b), but conditions of negative and low head loss were
common, with head loss <0.3 m ≥50% of the time. A trend of increasing head loss was also
apparent in association with declining discharge in January.
Figure 10. Discharge (ML.day-1) and head loss data from the Murray Barrages in spring/summer 2016/17, specifically: a) total barrage daily discharge; and b) daily discharge (black solid line), and daily minimum (blue dotted line) and maximum head loss (red dotted lined) at Mundoo Barrage. Arrows indicate sampling season at each barrage and associated fishway.
3.2. Catch summary
In spring/summer 2015/16, a total of 34,345 fish from 17 species were collectively sampled from
the Goolwa vertical-slot 2, Boundary Creek vertical-slot and Ewe Island dual vertical-slot fishways
(Table 4). The overall catch was dominated by the small-bodied freshwater Australian smelt
(Retropinna semoni) and catadromous congolli, which comprised ~39% and ~35% of the total
catch, respectively, with smaller contributions from the catadromous common galaxias (7.9%),
freshwater flat-headed gudgeon (Philypnodon grandiceps, 5.4%), and marine sandy sprat
(Hyperlophus vitattus, 5.5%) and yelloweye mullet (Aldrichetta forsteri, 5.1%). The remaining 11
species collectively comprised <1.5% of the total catch.
2016/17
Oct Nov Dec Jan Feb
Dis
ch
arg
e (
ML
.da
y-1
)
0
20000
40000
60000
80000
2016/17
Oct Nov Dec Jan Feb
0
500
1000
1500
2000
2500
3000
3500
He
ad
lo
ss (
m)
-0.8
-0.6
-0.4
-0.2
0.0
0.2
0.4
0.6
0.8
1.0
1.2
1.4a) b)

Bice, C.M. et al. (2017) Fishway effectiveness on the Murray Barrages
28
Table 4. Species, total number and length range of fish collected from the entrances and exits of the newly constructed Goolwa large vertical-slot 2, Boundary Creek
vertical-slot and Ewe Island dual vertical-slot in spring/summer 2015/16. Species are grouped using the life history categories of Potter et al. (2015)
Boundary Creek Ewe Island vertical-slot Goolwa large vertical-slot 2 Total
Common name Scientific Name entrance exit Length range
entrance exit Length range
entrance exit Length range
Sampling events
No. of species
8
13
8
7
8
8
8
8
10
14
8
8
Freshwater species
Australian smelt Retropinna semoni 990 279 20–69 43 327 27–71 9251 2651 20–68 13,541
Bony herring Nematalosa erebi 62 0 25–125 5 181 26–95 1 0 24 249
Flat-headed gudgeon
Philypnodon grandiceps
110 21 17–81 318 72 15–67 1272 68 12–72 1,861
Dwarf flat-headed gudgeon
Philypnodon macrostomus
1 0 31 0 0 - 2 0 16–19 3
Carp gudgeon Hypseleotris spp 1 1 22–29 0 0 - 0 0 - 2
Common carp Cyprinus carpio* 0 11 467–640 0 0 - 0 0 - 11
Redfin perch Perca fluviatilis* 0 5 89–136 0 20 57–90 12 14 44–132 51
Eastern gambusia
Gambusia holbrooki*
1 0 25 0 0 - 0 0 - 1
Catadromous species
Common galaxias
Galaxias maculatus
188 90 29–97 232 287 28–101 1349 576 22–76 2,722
Congolli
Pseudaphritis urvillii
3248 4891 27–67 902 311 26–131 2436 303 28–159 12,091
Estuarine species
Small-mouthed hardyhead
Atherinosoma microstoma
17 0 32–48 0 0 - 4 0 31–38 21
Tamar River goby
Afurcagobius tamarensis
2 0 27–32 5 3 18–32 4 1 21–56 15
Blue-spot goby
Pseudogobius olorum
9 0 28–43 2 0 31–38 3 0 30–36 14
Lagoon goby
Tasmanogobius lasti
7 0 21–43 5 6 21–38 78 0 17–26 96
River garfish
Hyperhamphus regularis
0 0 - 0 0 - 1 0 22 1
Marine species
Yelloweye mullet Aldrichetta forsteri 0 0 - 0 0 - 1757 1 17–63 1,758
Sandy sprat
Hyperlophus vittatus
1 0 38 0 0 - 1903 4 20–56 1,908
Total 4637 5298 1512 1207 18,073 3618 34,345
*Denotes non-native species

Bice, C.M. et al. (2017) Fishway effectiveness on the Murray Barrages
29
In spring/summer 2016/17, a total of 62,987 fish from 14 species were sampled from the Mundoo
dual vertical-slot fishway (Table 5). The overall catch was dominated by the catadromous congolli
(50%) and freshwater Australian smelt (39%), with smaller contributions from the catadromous
common galaxias (6%), and freshwater bony herring (Nematalosa erebi; 4%) and redfin perch
(Perca fluviatilis; 1%). The remaining nine species comprised ~1% of the catch.
Table 5. Species, total number and length range of fish collected from the entrance and exit of the newly constructed Mundoo dual vertical-slot in spring/summer 2016/17. Species are grouped using the life history categories of Potter et al. (2015).
Common name Scientific Name entrance exit Length range
Total
Sampling events
No. of species
8
13
8
11
Freshwater species
Australian smelt Retropinna semoni 10,707 13,789 24–89 24,496
Bony herring Nematalosa erebi 224 2,078 36–321 2,302
Flat-headed gudgeon
Philypnodon grandiceps 227 190 24–92 417
Dwarf flat-headed gudgeon
Philypnodon macrostomus
2 9 41–66 11
Carp gudgeon Hypseleotris spp 2 - 36–37 2
Golden perch
Macquaria ambigua ambigua
3 16 130–456 19
Freshwater catfish
Tandanus tandanus - 1 320 1
Common carp Cyprinus carpio* 61 23 241–522 84
Redfin perch Perca fluviatilis* 553 207 56–393 760
Goldfish Carassius auratus* 1 - 186 1
Catadromous species
Common galaxias
Galaxias maculatus 2,361 1,195 28–124 3,556
Congolli Pseudaphritis urvillii 12,372 18,926 26–196 31,298
Estuarine species
Small-mouthed hardyhead
Atherinosoma microstoma
14 - 57–73 14
Lagoon goby Tasmanogobius lasti 2 24 23–48 26
Total 26,529 36,458 62,987
*Denotes non-native species

Bice, C.M. et al. (2017) Fishway effectiveness on the Murray Barrages
30
3.3. Fishway use comparison 2015/16
The number of species and total number of fish sampled from the Ewe Island dual vertical-slot (9
species, 2719 fish) was considerably lower than that sampled from both the Boundary Creek
vertical-slot (15 species, 9935 fish) and Goolwa large vertical-slot 2 fishways (14 species, 21,691
fish). MDS ordination of fish assemblage data suggested weak grouping of trapping events by
fishway and the ordination exhibited poor stress (0.22) (Figure 11). Nonetheless, PERMANOVA,
indicated assemblages were significantly different among fishways (Pseudo-F2, 49 = 4.11,
p < 0.001). Pairwise comparisons indicated fish assemblages were significantly different between
each fishway (p < 0.05 for all comparisons).
Figure 11. Non-metric multi-dimensional scaling (MDS) ordination of fish assemblages (entrance and exit samples pooled) sampled at the Goolwa large vertical-slot 2 (GVS2, solid triangles), Ewe Island dual vertical-slot (EVS, open triangles) and Boundary creek vertical-slot (BVS, open circles).
Nine species were sampled from all three fishways, but species-specific abundance varied
substantially. SIMPER indicated differences in fishway use between the Goolwa large vertical-
slot 2 and Ewe Island dual vertical-slot were primarily driven by greater relative abundance of the
freshwater Australian smelt and flat-headed gudgeon, and the catadromous congolli and common
galaxias at the Goolwa large vertical-slot 2, but greater abundance of bony herring at the Ewe
GVS2
EVS
BVS
2D Stress: 0.22

Bice, C.M. et al. (2017) Fishway effectiveness on the Murray Barrages
31
Island dual vertical-slot. Similarly, differences between the Goolwa large vertical-slot 2 and
Boundary Creek vertical-slot were driven by greater abundance of Australian smelt, flat-headed
gudgeon and common galaxias at Goolwa, but greater abundance of congolli at Boundary Creek.
Differences between assemblages at Ewe Island and Boundary Creek were driven by greater
abundance of flat-headed gudgeon and bony herring at Ewe Island, but greater abundance of
Australian smelt and congolli at Boundary Creek.
3.4. Fishway effectiveness
3.4.1. Goolwa large vertical-slot 2
Passage efficiency
A total of 14 species were sampled from the entrance of this fishway and 8 from the exit (Table
4). Fishes that did not successfully ascend the fishway included the freshwater bony herring and
dwarf flat-headed gudgeon (Philypnodon macrostomus), and the estuarine species small-
mouthed hardyhead (Atherinosoma microstoma), blue-spot goby (Pseudogobius olorum) and
river garfish (Hyperhamphus regularis), but all were sampled in low numbers at the entrance (n ≤
4). Conversely, the estuarine lagoon goby (Tasmanogobius lasti) (n = 78), yelloweye mullet (n =
1757) and marine sandy sprat (n = 1903) were sampled in high abundance from the entrance of
the fishway, but few from the fishway exit (n = 0–4).
Numbers of fish entering the fishway ranged from 9 to 130 fish.hour-1 (mean ± SE = 81.5 ±
15.3 fish.hour-1), whilst numbers of fish successfully ascending the fishway ranged from 1 to
84 fish.hour-1 (mean ± SE = 20.2 ± 15.3 fish.hour-1). This resulted in an overall passage efficiency
(the abundance of fish that successfully ascended as a proportion of those that attempted to
ascend the fishway) across the sampling period of ~25%. Comparison of abundance between
entrance and exit trapping events for the most abundant species indicated no significant
difference for common galaxias (Pseudo-F1, 17 = 3.97, p = 0.071), but significantly higher
abundances of congolli (Pseudo-F1, 17 = 14.56, p < 0.001), flat-headed gudgeon (Pseudo-F1, 17
= 12.38, p = 0.006) and Australian smelt (Pseudo-F1, 17 = 5.26, p = 0.040) at the entrance than at
the exit of the fishway (Figure 12).

Bice, C.M. et al. (2017) Fishway effectiveness on the Murray Barrages
32
Figure 12. Comparison of mean relative abundance (number of fish.hour-1.trap event-1) of the most common species sampled at the entrance (shaded bar) and exit (open bar) of the new Goolwa large vertical-slot 2 fishway in spring/summer 2015/16. Significant differences between entrance and exit abundance are indicated by asterisks.
Fish sampled at the entrance of this fishway ranged from 12 to 159 mm in length, whilst those
that successfully ascended the fishway ranged from 16 to 133 mm in length. Length-frequency
distributions were significantly different between entrance and exit samples for congolli (D440, 197
= 0.162, p = 0.001), common galaxias (D336, 184 = 0.276, p < 0.001) and flat-headed gudgeon (D409,
66 = 0.206, p = 0.014). Greater proportions of congolli and common galaxias <40 mm, and flat-
headed gudgeon <20 mm TL, were sampled from the entrances of the fishways (Figure 13a–c).
Length-frequency distributions were similar for Australian smelt (D414, 165 = 0.078, p = 0.461).
Au
str
alia
n s
me
lt
Fla
t-h
ea
de
d g
ud
ge
on
Co
mm
on
ga
laxia
s
Co
ng
olli
Fis
h . h
ou
r-1 . tra
p-1
0
10
20
30
40
50
60 entrance (n = 10) exit (n = 8)
*
* *

Bice, C.M. et al. (2017) Fishway effectiveness on the Murray Barrages
33
Figure 13. Length-frequency distributions of a) congolli, b) common galaxias, c) flat-headed gudgeon and d) Australian smelt captured from the entrance (black bar) and exit (shaded bar) of the new Goolwa large vertical-slot fishway in spring/summer 2015/16. Sample sizes represent the number of fish measured for length, and those in brackets, represent the total number of fish sampled for each species.
Influence of head loss on fishway effectiveness
Based on change in AICC, linear models received more support (>95%) than sigmoidal models
for explaining the relationship between head loss and total fish abundance at the entrance and
exit of the fishway. Nonetheless, these relationships were non-significant at the entrance (F =
0.253, p =0.628) and exit (F = 0.033, p =0.862), suggesting variation in head loss had little
influence on relative attraction and passage efficiency over the range of head loss experienced
(Figure 14).
0 20 40 60 80 100 120 140 160
Pro
port
ional fr
equency (
%)
0
5
10
15
20
25
30
entrance n = 439 (2436)exit n = 196 (303)
0 20 40 60 80 100
0
10
20
30
40
entrance n = 335 (1349) exit n = 183 (576)
Fork length (mm)
0 10 20 30 40 50 60 70
0
10
20
30
40
50
entrance n = 413 (9251) exit n = 164 (2651)
Total length (mm)
0 10 20 30 40 50 60 70 80
Pro
port
ional fr
equency (
%)
0
10
20
30
40
50
60
entrance n = 408 (1272) exit n = 65 (68)
a) b)
c) d)
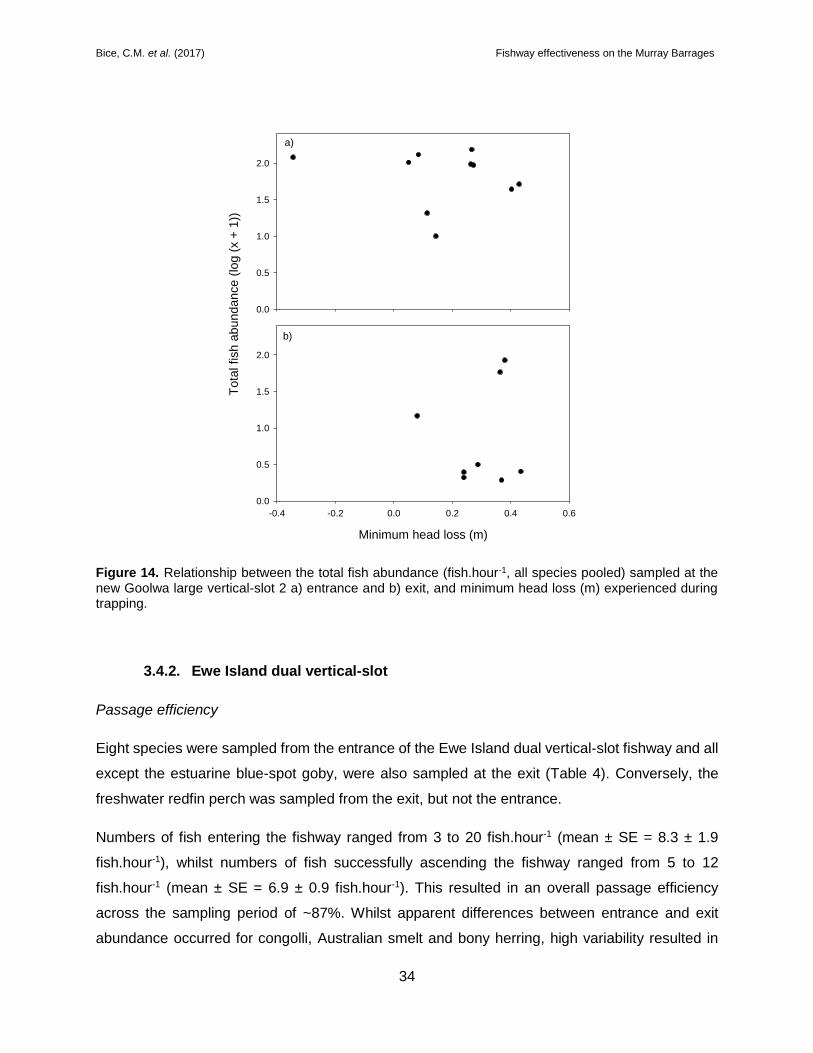
Bice, C.M. et al. (2017) Fishway effectiveness on the Murray Barrages
34
Figure 14. Relationship between the total fish abundance (fish.hour-1, all species pooled) sampled at the new Goolwa large vertical-slot 2 a) entrance and b) exit, and minimum head loss (m) experienced during trapping.
3.4.2. Ewe Island dual vertical-slot
Passage efficiency
Eight species were sampled from the entrance of the Ewe Island dual vertical-slot fishway and all
except the estuarine blue-spot goby, were also sampled at the exit (Table 4). Conversely, the
freshwater redfin perch was sampled from the exit, but not the entrance.
Numbers of fish entering the fishway ranged from 3 to 20 fish.hour-1 (mean ± SE = 8.3 ± 1.9
fish.hour-1), whilst numbers of fish successfully ascending the fishway ranged from 5 to 12
fish.hour-1 (mean ± SE = 6.9 ± 0.9 fish.hour-1). This resulted in an overall passage efficiency
across the sampling period of ~87%. Whilst apparent differences between entrance and exit
abundance occurred for congolli, Australian smelt and bony herring, high variability resulted in
0.0
0.5
1.0
1.5
2.0
Minimum head loss (m)
-0.4 -0.2 0.0 0.2 0.4 0.6
Tota
l fish
ab
un
da
nce
(lo
g (
x +
1))
0.0
0.5
1.0
1.5
2.0
a)
b)
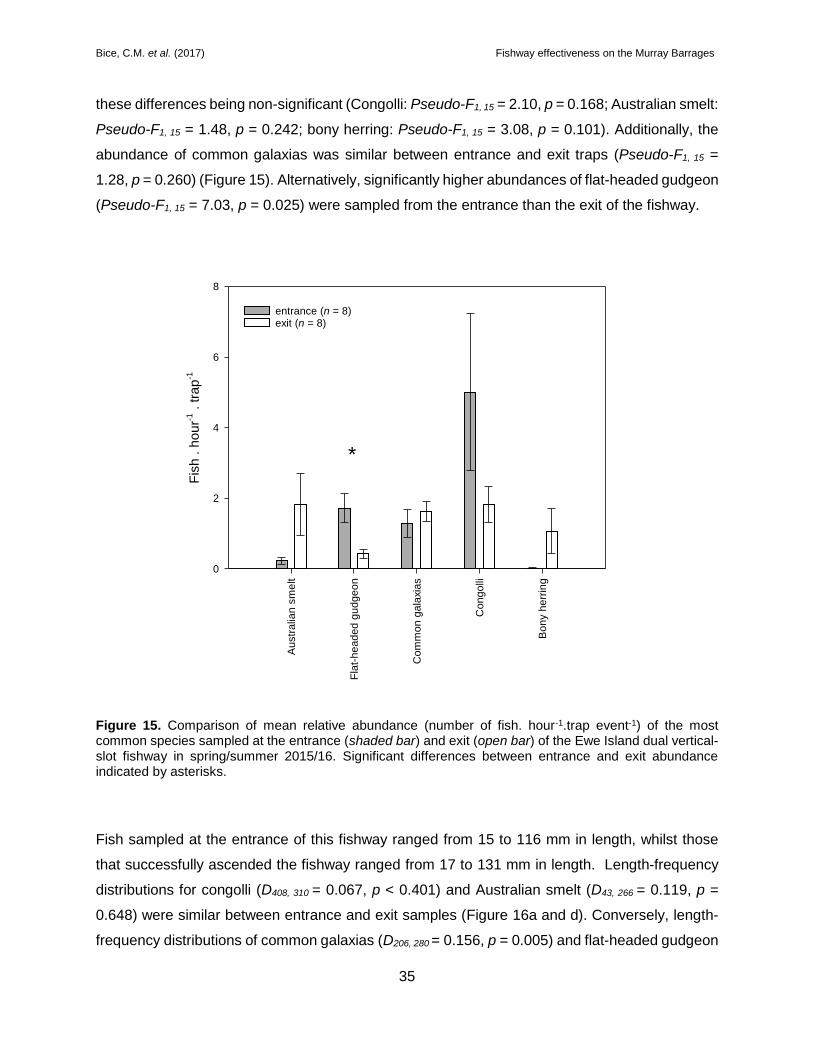
Bice, C.M. et al. (2017) Fishway effectiveness on the Murray Barrages
35
these differences being non-significant (Congolli: Pseudo-F1, 15 = 2.10, p = 0.168; Australian smelt:
Pseudo-F1, 15 = 1.48, p = 0.242; bony herring: Pseudo-F1, 15 = 3.08, p = 0.101). Additionally, the
abundance of common galaxias was similar between entrance and exit traps (Pseudo-F1, 15 =
1.28, p = 0.260) (Figure 15). Alternatively, significantly higher abundances of flat-headed gudgeon
(Pseudo-F1, 15 = 7.03, p = 0.025) were sampled from the entrance than the exit of the fishway.
Figure 15. Comparison of mean relative abundance (number of fish. hour-1.trap event-1) of the most common species sampled at the entrance (shaded bar) and exit (open bar) of the Ewe Island dual vertical-slot fishway in spring/summer 2015/16. Significant differences between entrance and exit abundance indicated by asterisks.
Fish sampled at the entrance of this fishway ranged from 15 to 116 mm in length, whilst those
that successfully ascended the fishway ranged from 17 to 131 mm in length. Length-frequency
distributions for congolli (D408, 310 = 0.067, p < 0.401) and Australian smelt (D43, 266 = 0.119, p =
0.648) were similar between entrance and exit samples (Figure 16a and d). Conversely, length-
frequency distributions of common galaxias (D206, 280 = 0.156, p = 0.005) and flat-headed gudgeon
Au
str
alia
n s
me
lt
Fla
t-h
ea
de
d g
ud
ge
on
Co
mm
on
ga
laxia
s
Co
ng
olli
Bo
ny h
err
ing
Fis
h . h
ou
r-1 . tra
p-1
0
2
4
6
8
entrance (n = 8) exit (n = 8)
*

Bice, C.M. et al. (2017) Fishway effectiveness on the Murray Barrages
36
(D284, 72 = 0.310, p < 0.001) were significantly different between entrance and exit samples (Figure
16b and c). For flat-headed gudgeon, a greater proportion of fish 20–24 mm TL were sampled
from the exit (~58%) than the entrance (~28%), whilst the reverse was true for fish 25–29 mm TL
(entrance ~35%, exit ~8%) (Figure 16c). For common galaxias, a greater proportion of fish <40
mm FL were sampled from the entrance (~12%) than the exit (~3%) (Figure 16b).
Figure 16. Length-frequency distributions of a) congolli, b) common galaxias, c) flat-headed gudgeon and d) Australian smelt captured from the entrance (black bar) and exit (shaded bar) of the Ewe Island dual vertical-slot fishway in spring/summer 2015/16. Sample sizes represent the number of fish measured for length, and those in brackets, represent the total number of fish sampled for each species.
0 20 40 60 80 100 120 140
Pro
port
ional fr
equency (
%)
0
5
10
15
20
25
30
entrance n = 407 (902)exit n = 309 (311)
0 20 40 60 80 100
0
5
10
15
20
25
30
35
entrance n = 205 (232) exit n = 279 (287)
Total length (mm)
0 10 20 30 40 50 60 70
Pro
port
ional fr
equency (
%)
0
10
20
30
40
50
60
entrance n = 283 (318) exit n = 71 (72)
Fork length (mm)
0 10 20 30 40 50 60 70 80
0
10
20
30
40
50
entrance n = 42 (43) exit n = 265 (327)
a) b)
c) d)

Bice, C.M. et al. (2017) Fishway effectiveness on the Murray Barrages
37
Influence of head loss on fishway effectiveness
Based on change in AICC, linear models received more support (≥97%) than sigmoidal models
when applied to head loss–total fish abundance data for both entrance and exit trapping events.
At the entrance of the fishway, total fish abundance was similar across the range of head loss
experienced and the linear relationship was non-significant (F = 0.003, p = 0.957) (Figure 17a).
The linear relationship between total fish abundance and minimum head loss at the exit was also
non-significant (F = 0.067, p = 0.805), but this relationship may be influenced by two outliers.
Relatively low total fish abundance was observed during sampling events with minimum head
loss 0.1–0.2 m (Figure 13b); if these data points were removed a trend of decreasing total fish
abundance with increasing minimum head loss becomes apparent.
Figure 17. Relationship between the total fish abundance (fish . hour-1, all species pooled) sampled at the Ewe Island dual vertical-slot a) entrance and b) exit, and minimum head loss (m) experienced during trapping
0.4
0.6
0.8
1.0
1.2
1.4
Minimum head loss (m)
0.0 0.1 0.2 0.3 0.4 0.5 0.6
Tota
l fish a
bu
nd
an
ce (
log (
x +
1))
0.4
0.6
0.8
1.0
1.2
1.4
a)
b)

Bice, C.M. et al. (2017) Fishway effectiveness on the Murray Barrages
38
3.4.3. Boundary Creek vertical-slot
Passage efficiency
A total of 13 species were sampled from the entrance of the Boundary Creek vertical-slot fishway
compared to seven from the exit (Table 4). The freshwater dwarf flat-headed gudgeon and
eastern gambusia (Gambusia holbrooki), the estuarine species small-mouthed hardyhead, blue-
spot goby, Tamar River goby (Afurcagobius tamarensis) and lagoon goby, and the marine sandy
sprat were sampled in low numbers from the entrance (n = 1–17), but were absent from exit
trapping. Additionally, the freshwater bony herring was sampled in moderate numbers from the
entrance (n = 62), but was absent from exit trapping, although 85% of the fish sampled at the
entrance were captured during a single trapping event. Alternatively, common carp and redfin
perch were only sampled from the exit of the fishway.
Numbers of fish entering the fishway ranged from 3 to 60 fish.hour-1 (mean ± SE = 25.6 ±
8.1 fish.hour-1), whilst numbers of fish successfully ascending the fishway ranged from 1 to
82 fish.hour-1 (mean ± SE = 31.2 ± 10.5 fish.hour-1). This resulted in an overall passage efficiency
across the sampling period of 100%. Comparison of abundance between entrance and exit
trapping events for the most abundant species suggested no significant difference for common
galaxias (Pseudo-F1, 15 = 2.04, p = 0.179), congolli (Pseudo-F1, 15 = 0.27, p = 0.597) and Australian
smelt (Pseudo-F1, 15 = 0.82, p = 0.386), but significantly higher abundances of flat-headed
gudgeon (Pseudo-F1, 15 = 11.11, p = 0.006) at the entrance than the exit of the fishway (Figure
18).
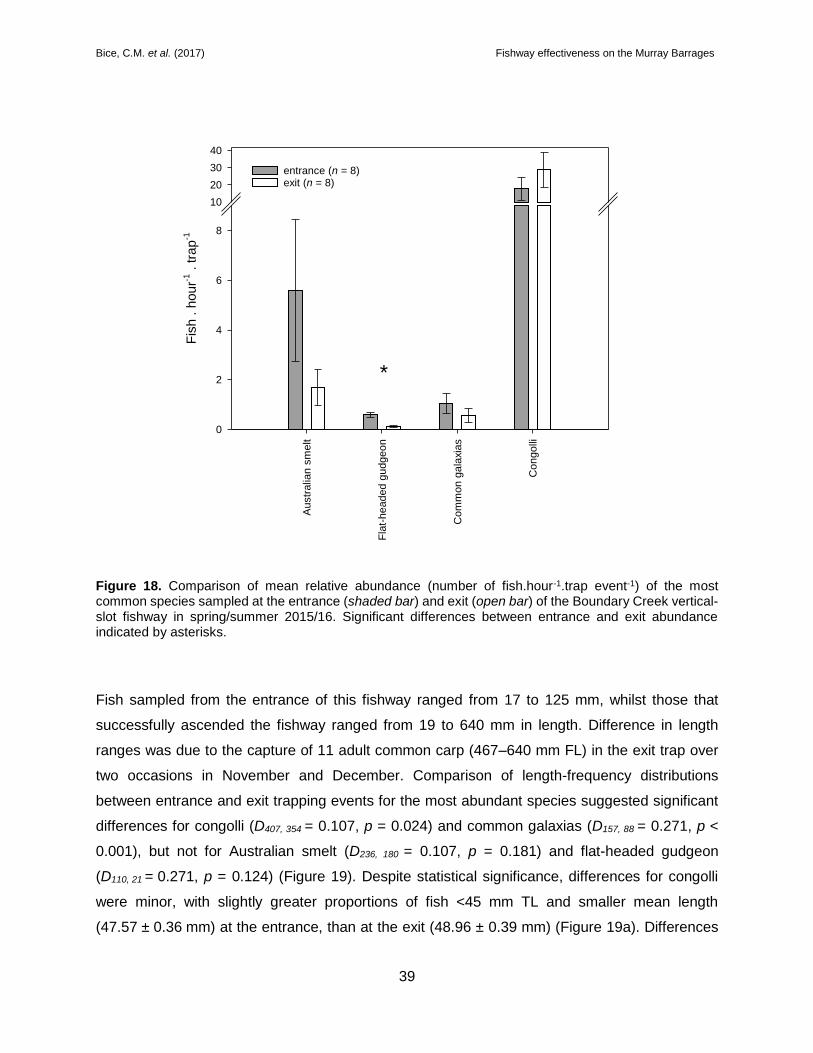
Bice, C.M. et al. (2017) Fishway effectiveness on the Murray Barrages
39
Figure 18. Comparison of mean relative abundance (number of fish.hour-1.trap event-1) of the most common species sampled at the entrance (shaded bar) and exit (open bar) of the Boundary Creek vertical-slot fishway in spring/summer 2015/16. Significant differences between entrance and exit abundance indicated by asterisks.
Fish sampled from the entrance of this fishway ranged from 17 to 125 mm, whilst those that
successfully ascended the fishway ranged from 19 to 640 mm in length. Difference in length
ranges was due to the capture of 11 adult common carp (467–640 mm FL) in the exit trap over
two occasions in November and December. Comparison of length-frequency distributions
between entrance and exit trapping events for the most abundant species suggested significant
differences for congolli (D407, 354 = 0.107, p = 0.024) and common galaxias (D157, 88 = 0.271, p <
0.001), but not for Australian smelt (D236, 180 = 0.107, p = 0.181) and flat-headed gudgeon
(D110, 21 = 0.271, p = 0.124) (Figure 19). Despite statistical significance, differences for congolli
were minor, with slightly greater proportions of fish <45 mm TL and smaller mean length
(47.57 ± 0.36 mm) at the entrance, than at the exit (48.96 ± 0.39 mm) (Figure 19a). Differences
Au
str
alia
n s
me
lt
Fla
t-h
ea
de
d g
ud
ge
on
Co
mm
on
ga
laxia
s
Co
ng
olli
Fis
h . h
ou
r-1 . tra
p-1
0
2
4
6
8
10
20
30
40
entrance (n = 8)exit (n = 8)
*

Bice, C.M. et al. (2017) Fishway effectiveness on the Murray Barrages
40
between entrance and exit trapping events were more marked for common galaxias, with a
greater proportion of fish ≤39 mm FL sampled from the entrance (~40%) than the exit (~17%),
and a shorter mean length (entrance = 43.15 ± 0.81 mm, exit = 47.19 ±1.20 mm) (Figure 19b).
Figure 19. Length-frequency distributions of a) congolli, b) common galaxias, c) flat-headed gudgeon and d) Australian smelt captured from the entrance (black bar) and exit (shaded bar) of the Boundary Creek vertical-slot fishway in spring/summer 2015/16. Sample sizes represent the number of fish measured for length, and those in brackets, represent the total number of fish sampled for each species.
0 20 40 60 80 100 120
Pro
port
ional fr
equency (
%)
0
5
10
15
20
25
30
35
entrance n = 406 (3248)exit n = 353 (4891)
0 20 40 60 80 100
0
10
20
30
40
50
entrance n = 156 (188) exit n = 87 (90)
Total length (mm)
0 20 40 60 80 100
Pro
port
ional fr
equency (
%)
0
5
10
15
20
25
30
35
entrance n = 109 (110) exit n = 20 (21)
Fork length (FL)
0 10 20 30 40 50 60 70 80
0
10
20
30
40
50
entrance n = 235 (990) exit n = 179 (279)
a) b)
c) d)
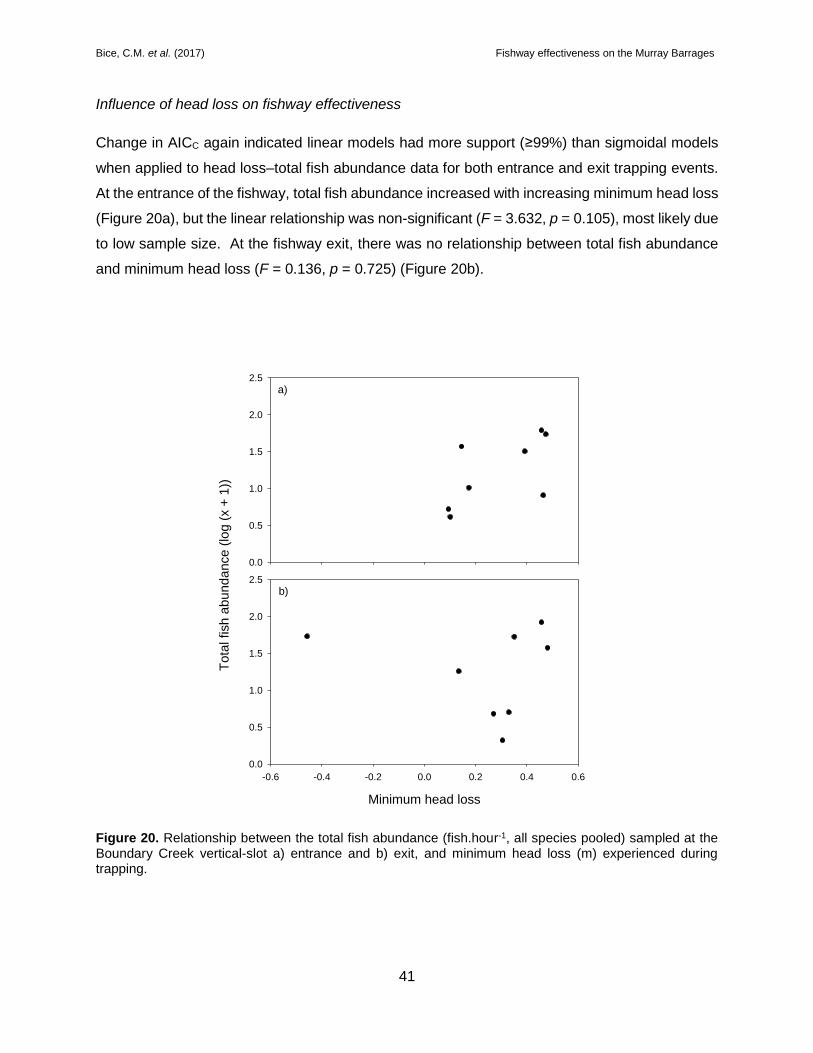
Bice, C.M. et al. (2017) Fishway effectiveness on the Murray Barrages
41
Influence of head loss on fishway effectiveness
Change in AICC again indicated linear models had more support (≥99%) than sigmoidal models
when applied to head loss–total fish abundance data for both entrance and exit trapping events.
At the entrance of the fishway, total fish abundance increased with increasing minimum head loss
(Figure 20a), but the linear relationship was non-significant (F = 3.632, p = 0.105), most likely due
to low sample size. At the fishway exit, there was no relationship between total fish abundance
and minimum head loss (F = 0.136, p = 0.725) (Figure 20b).
Figure 20. Relationship between the total fish abundance (fish.hour-1, all species pooled) sampled at the Boundary Creek vertical-slot a) entrance and b) exit, and minimum head loss (m) experienced during trapping.
0.0
0.5
1.0
1.5
2.0
2.5
Minimum head loss
-0.6 -0.4 -0.2 0.0 0.2 0.4 0.6
To
tal fish
ab
un
da
nce (
log (
x +
1))
0.0
0.5
1.0
1.5
2.0
2.5
a)
b)

Bice, C.M. et al. (2017) Fishway effectiveness on the Murray Barrages
42
3.4.4. Mundoo dual vertical-slot
Passage efficiency
A total of 13 species were sampled from the entrance of the Mundoo dual vertical-slot fishway
compared to eleven from the exit (Table 5). The freshwater carp gudgeon (Hypseleotris spp.) and
goldfish (Carassius auratus), and the estuarine small-mouthed hardyhead were sampled in low
numbers from the entrance (n = 1–14), but were absent from exit trapping. Additionally, a single
freshwater catfish (Tandanus tandanus) was sampled from the exit, but the species was absent
from entrance trapping. The remaining 10 species were sampled from both the entrance and exit
of the fishway.
Numbers of fish entering the fishway ranged from 10 to 390 fish.hour-1 (mean ± SE = 152 ±
52.73 fish.hour-1), whilst numbers of fish successfully ascending the fishway ranged from 45 to
487 fish.hour-1 (mean ± SE = 220.3 ± 54.8 fish.hour-1). This resulted in an overall passage
efficiency across the sampling period of 100%. Comparison of abundance between entrance and
exit trapping events for the most abundant species indicated no significant difference (α = 0.05)
for congolli (Pseudo-F1, 15 = 0.91, p = 0.32), common galaxias (Pseudo-F1, 15 = 0.09, p = 0.83),
flat-headed gudgeon (Pseudo-F1, 15 = 0.28, p = 0.28), Australian smelt (Pseudo-F1, 15 = 1.39, p =
0.25) or redfin perch (Pseudo-F1, 15 = 0.20, p = 0.66) (Figure 21). Comparison of abundances was
also non-significant for bony herring (Pseudo-F1, 15 = 1.09, p = 0.34), despite a substantially
greater total number of fish at the exit than the entrance.

Bice, C.M. et al. (2017) Fishway effectiveness on the Murray Barrages
43
Figure 21. Comparison of mean relative abundance (number of fish.hour-1.trap event-1) of the most common species sampled at the entrance (shaded bar) and exit (open bar) of the Mundoo dual vertical-slot fishway in spring/summer 2016/17.
Fish sampled from the entrance of the fishway ranged 24–380 mm in length, whilst those that
successfully ascended the fishway ranged 23–522 mm in length. Length-frequency distributions
were significantly different between entrance and exit trapping events for Australian smelt (D686,
803 = 0.16, p < 0.001), common galaxias (D634, 645 = 0.12, p < 0.001), bony herring (D224, 419 = 0.18,
p < 0.001) and redfin perch (D195, 207 = 0.34, p < 0.001). A greater proportion of common galaxias
and Australian smelt <45 mm FL were sampled from the entrance than the exit (Figure 3);
nonetheless, these differences were relatively minor and individuals <60 mm in length comprised
a large proportion of fish that successfully ascended the fishway for both species. Differences in
length-frequency distributions for bony herring appear related to greater relative proportions of
fish 80–85 mm FL at the entrance than the exit (Figure 3). Similarly, differences in length-
frequency distributions for redfin perch appear related to greater relative proportions of fish 70–
89 mm FL at the exit (Figure 3). Length-frequency distributions were statistically similar between
Austr
alia
n s
melt
flat-
headed g
udgeon
bony
herr
ing
redfin p
erc
h
com
mon g
ala
xia
s
congolli
Fis
h .
hr-1
. t
rap
-1
0
5
10
15
20
25
40
60
80
100
120
140
160
entrance (n = 8)exit (n = 8)
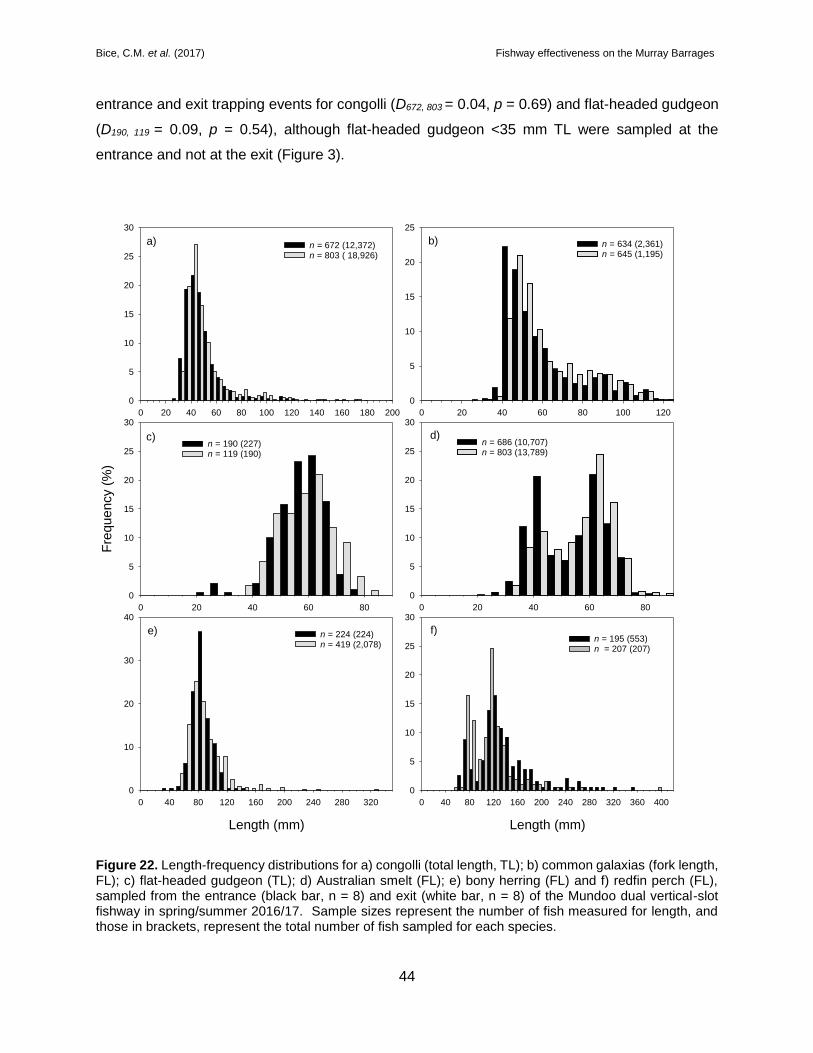
Bice, C.M. et al. (2017) Fishway effectiveness on the Murray Barrages
44
entrance and exit trapping events for congolli (D672, 803 = 0.04, p = 0.69) and flat-headed gudgeon
(D190, 119 = 0.09, p = 0.54), although flat-headed gudgeon <35 mm TL were sampled at the
entrance and not at the exit (Figure 3).
Figure 22. Length-frequency distributions for a) congolli (total length, TL); b) common galaxias (fork length, FL); c) flat-headed gudgeon (TL); d) Australian smelt (FL); e) bony herring (FL) and f) redfin perch (FL), sampled from the entrance (black bar, n = 8) and exit (white bar, n = 8) of the Mundoo dual vertical-slot fishway in spring/summer 2016/17. Sample sizes represent the number of fish measured for length, and those in brackets, represent the total number of fish sampled for each species.
0 20 40 60 80 100 120
0
5
10
15
20
25
n = 634 (2,361)n = 645 (1,195)
0 20 40 60 80 100 120 140 160 180 200
0
5
10
15
20
25
30
n = 672 (12,372)n = 803 ( 18,926)
Length (mm)
0 20 40 60 80
0
5
10
15
20
25
30
n = 686 (10,707)n = 803 (13,789)
Length (mm)
0 40 80 120 160 200 240 280 320 360 400
0
5
10
15
20
25
30
n = 195 (553)n = 207 (207)
a)
d)c)
b)
0 20 40 60 80
Fre
que
ncy (
%)
0
5
10
15
20
25
30
n = 190 (227)n = 119 (190)
Length (mm)
0 40 80 120 160 200 240 280 320
0
10
20
30
40
n = 224 (224)n = 419 (2,078)
c)
e) f)

Bice, C.M. et al. (2017) Fishway effectiveness on the Murray Barrages
45
Influence of head loss on fishway effectiveness
Change in AICC indicated linear models had more support (~99%) than sigmoidal models when
applied to head loss–total fish abundance data for both entrance and exit trapping events. At the
entrance of the fishway, minimum head loss varied 0.06–0.36 m and abundance varied widely
(Figure 23a), and as such, the linear relationship was non-significant (F = 0.610, p = 0.464).
During exit sampling, minimum head loss was more variable, ranging -0.07–0.62 m, and
abundance appeared to decline with increasing minimum head loss (Figure 23b). Nonetheless,
the linear head loss–abundance relationship was non-significant (F = 4.597, p = 0.076), most
likely due to low sample size.
Figure 23. Relationship between the total fish abundance (fish.hour-1, all species pooled) sampled at the Mundoo dual vertical-slot a) entrance and b) exit, and minimum head loss (m) experienced during trapping.
1.0
1.5
2.0
2.5
3.0
Minimum head loss (m)
-0.2 0.0 0.2 0.4 0.6 0.8
To
tal fish
ab
un
da
nce
(lo
g (
x +
1))
1.0
1.5
2.0
2.5
3.0
a)
b)
Bice, C.M. et al. (2017) Fishway effectiveness on the Murray Barrages
46
4. DISCUSSION
Since 2003, the Murray Barrages have been the subject of substantial investment in fish passage.
Most recently, under the Coorong Lower Lakes and Murray Mouth (CLLMM) Recovery Project,
construction of a series of six technical fishways across the Murray Barrages was proposed for
2015–2017. This included new fishways on all five of the Murray Barrages (i.e. Goolwa, Mundoo,
Boundary Creek, Ewe Island and Tauwitchere). The fishway designs were varied and tailored for
target species, location and hydrology in order to complement existing fishways and holistically
meet fish passage requirements. Fundamental to the construction program, is assessment of the
biological effectiveness of the fishways against their design criteria.
The aim of the current study was to assess the biological effectiveness of the new fishways. Three
fishways were completed and assessed in spring/summer 2015/16 and a further fishway
assessed in spring/summer 2016/17, whilst two remaining fishways could not be assessed. The
effectiveness of these fishways is discussed in the context of previous assessments of existing
fishways and overall improvements to fish passage at the barrages. Ultimately, this work will
inform future operation of the barrages and fishways, and the contribution of the CLLMM fishway
construction program to overall fish passage objectives in the region.
4.1. General catch and variability in fishway use
A total of 20 species were sampled from the fishways collectively across 2015/16 and 2016/17,
representing most species that are expected to use fishways on the Murray Barrages based on
previous sampling (Stuart et al. 2005, Jennings et al. 2008, Zampatti et al. 2010, 2012, Bice and
Zampatti 2015). A notable exception was the absence of the anadromous short-headed and
pouched lamprey; peak upstream migration of these species occurs in winter/early spring, which
was prior to the commencement of monitoring in the current study. Nevertheless, targeted winter
monitoring in 2016 detected pouched lamprey using the Goolwa vertical-slot 2 fishway and
Boundary Creek small vertical-slot fishways (SARDI unpublished data). Together with previous
monitoring of existing vertical-slot fishways on Goolwa and Tauwitchere Barrages (Bice and
Zampatti 2015), this suggests all new fishways are likely to be used by lampreys during their
migration season.
The overall catches of fish using the fishways in 2015/16 and 2016/17 were dominated by small-
bodied freshwater species (Australian smelt, flat-headed gudgeon and juvenile bony herring) and
juvenile upstream migrants of catadromous species (i.e. congolli and common galaxias), but

Bice, C.M. et al. (2017) Fishway effectiveness on the Murray Barrages
47
overall abundance was far greater in 2016/17, as was the number of large-bodied fishes using
the fishways. Freshwater discharge in 2016/17 (~6,200 GL up to March 2017) was ten-fold that
of 2015/16 (~600 GL) and correspondingly salinity in the Murray estuary downstream of Mundoo
Barrage was consistently lower (<2 g.L-1 for 90% of the sampling period) than at the other fishways
in 2015/16 (i.e. 20–35 g.L-1). Greater discharge in 2016/17 likely resulted in greater downstream
transport of freshwater fishes from the Lower Lakes, and lower salinity may have potentially
facilitated greater residence within the Murray estuary, resulting in greater numbers of freshwater
fishes including large-bodied species like golden perch, freshwater catfish, common carp and
redfin perch. Similar patterns of overall abundance and assemblage structure have been
observed during previous low-flow (e.g. 2006/07) and high-flow conditions (e.g. 2010/11) (Bice et
al. 2016).
Young-of-the-year congolli and common galaxias were sampled from all of the fishways in high
abundances relative to previous sampling (Jennings et al. 2008, Zampatti et al. 2010, Bice and
Zampatti 2015). In particular, congolli was the second most abundant species in 2015/16 and
most abundant species in 2016/17, likely reflecting consistent increases in the abundance of this
species over the past six years, coincident with prolonged connectivity between the Lower Lakes,
Coorong and Southern Ocean over this period (Bice et al. 2016). Connectivity between these
environments is critical in the life history of catadromous fishes and, subsequently, fishway
construction on the barrages has emphasised the passage of these species. The capture of high
abundances of these species is encouraging in regards to the ecological function of the fishways
and provides a positive indication of population status.
In 2015/16, total fish and species-specific abundances differed among fishways, likely due to
varying discharge from the different barrages and habitat downstream, and upstream, of the
structures. Throughout sampling, freshwater discharge from Ewe Island Barrage was limited to
the fishway (≤5 ML.day-1, i.e. no discharge through gate openings) and likely resulted in lower
attraction of fish, and subsequent lower species richness and total fish abundance, than at
Boundary Creek and Goolwa Barrages, where freshwater discharge was occasionally greater
(300–500 ML.day-1). Differences between catches at the Goolwa and Boundary Creek vertical-
slot fishways were driven by greater abundance of freshwater species and the catadromous
common galaxias at Goolwa, but greater abundance of the catadromous congolli at Boundary
Creek. Goolwa Barrage is commonly a site with a high biomass of migrating fish, relative to other
barrages, particularly pelagic species like Australian smelt and common galaxias, but also congolli
(Bice and Zampatti 2015). High relative abundances of congolli from the Boundary Creek vertical-

Bice, C.M. et al. (2017) Fishway effectiveness on the Murray Barrages
48
slot, and dominance of overall catches at this fishway (>80% of total catch), suggest the
construction of this fishway has potentially reinstated an important migratory pathway for this
species.
4.2. Fishway effectiveness
4.2.1. Goolwa large vertical-slot 2
A total of eight species successfully ascended the Goolwa large vertical-slot 2 fishway comprising
of freshwater, catadromous, estuarine and marine life histories. Nevertheless, lower numbers of
fish were sampled from the exit than the entrance of the Goolwa large vertical-slot 2 fishway
suggesting a degree of obstruction of passage under the conditions assessed and/or potential
differences in migratory motivation among species. The four most abundant species had
catadromous (congolli and common galaxias) and freshwater life histories (Australian smelt and
flat-headed gudgeon) and were likely undertaking motivated obligate upstream migrations to
freshwater habitats, with all but common galaxias, sampled in significantly greater abundance at
the entrance of the fishway, suggesting partially obstructed passage. Fish <20 mm in length
successfully ascended the fishway, but the passage of small size-classes of congolli (<40 mm),
common galaxias (<40 mm) and flat-headed gudgeon (<20 mm) was partially obstructed, likely
due to insurmountable internal hydraulics.
Migrations of estuarine and marine species into freshwater habitats is often viewed as a
facultative process and thus, migration through fishways may occur with less motivation than for
catadromous and freshwater species, which may account for low passage efficiency for several
species from these guilds in the current study. The presence of high abundances of these species,
namely lagoon goby, yelloweye mullet and sandy sprat at the fishway entrance but low abundance
or absence of these species ascending the fishway may be a result of incidental occurrence in
the lower part of the fishway, likely coincident with reverse/low head loss conditions, and/or may
indicate that passage through the fishway was often aborted. These species may show
behavioural aversion to the rapid changes in salinity (35 g.L-1 to <1 g.L-1 over distances of <5 m)
that often occur at fishways on the Murray Barrages during periods of low discharge. Contrary to
the results of the current study, lagoon goby were recorded moving through fishways on
Tauwitchere Barrage in considerable numbers during conditions of high discharge and minimal
change in salinity between the Coorong and Lower Lakes (Bice et al. 2017), suggesting such
conditions may be more conducive to movement of these species.
Bice, C.M. et al. (2017) Fishway effectiveness on the Murray Barrages
49
Despite restricted passage efficiency at this fishway, absolute passage, as indicated by the
number of fish that successfully ascended the fishway and were captured during exit trapping
events (mean = 20.2 ± 11.4 fish.hour-1), was similar to that at the Boundary Creek vertical-slot
(mean = 31.2 ± 10.5 fish.hour-1), and greater than that at the Ewe Island dual vertical-slot (6.9 ±
0.9 fish.hour-1). Furthermore, passage efficiency was substantially greater than at the original
Goolwa large vertical-slot prior to slot modifications (Jennings et al. 2008). Assessment of the
original vertical-slot fishway at Goolwa in 2005/06, under conditions of similar discharge and head
loss to the current study, found this fishway to be largely ineffective for small-bodied fishes, with
overall passage efficiency (the abundance of fish that successfully ascended as a proportion of
those that attempted to ascend the fishway) of ~5% (Jennings et al. 2008). Pre-fabricated
aluminium inserts were subsequently added to the fishway to reduce slot widths (from 300 to 200
mm) and overall slot aperture, and thus, reduce internal turbulence (from 54 to 30 W.m-3).
Trapping of the fishway in 2010/11, whilst unable to quantify passage efficiency, suggested
enhanced passage of small-bodied fish relative to the previous configuration (Zampatti et al.
2012). Excepting shallower depth, the new Goolwa large vertical-slot 2 fishway has the same pool
dimensions as the original Goolwa large vertical-slot fishway, and similar aluminium inserts were
applied to the vertical-slots; correspondingly overall passage efficiency was ~25%, whilst fish <20
mm in length, at times, successfully ascended the fishway.
Analyses of head loss–total fish abundance relationships (ANOVA) suggested the range of head
loss experienced in the current study had no influence on relative attraction and passage
efficiency. We propose, however, that passage efficiency at this fishway would be greater during
periods of high discharge and generally lower head loss. Previous analysis of head loss–fish
abundance relationships at the original Tauwitchere large vertical-slot fishway showed a
significant negative sigmoidal relationship between total fish abundance at the exit and head loss,
with relative passage efficiency greater at lower head loss (Bice et al. 2017). We suggest such a
relationship likely exists at the new Goolwa large vertical-slot 2 fishway, but was not detected due
to low sample size (n = 8) and predominating conditions of high head loss throughout sampling
(e.g. >0.5 m >60% of the time).
Despite some limitation to passage efficiency, the Goolwa large vertical-slot 2 fishway could be
considered to be operating to design specifications. Considerable abundances of small-bodied
fish, particularly 40–80 mm in length, were able to ascend the fishway, and whilst large-bodied
fishes were uncommon, successful passage could be assumed considering smaller fish with
weaker swimming abilities were able to ascend. Overall passage of small-bodied fishes during

Bice, C.M. et al. (2017) Fishway effectiveness on the Murray Barrages
50
conditions of low discharge and generally high head loss should be improved at this barrage upon
the construction of the Goolwa small vertical-slot fishway in 2016, whilst the large vertical-slot
should pass greater numbers of small-bodied fish under conditions of higher discharge.
4.2.2. Ewe Island dual vertical-slot
All species detected at the entrance of this fishway, with the exception of the estuarine blue-spot
goby, ascended the fishway, although slightly lower numbers of fish at the exit than the entrance
of the fishway suggest a level of restricted passage efficiency. Flat-headed gudgeon, in particular,
were sampled in significantly greater abundance from the entrance. Abundances of congolli were
also higher at the fishway entrance, but not significantly greater (α = 0.05) than at the fishway
exit. Similar abundances of common galaxias were sampled from the entrance and exit, but fish
<40 mm were partially restricted. Alternatively, abundances of bony herring and Australian smelt
were greater at the exit, albeit without statistical significance, whilst length-frequency distributions
were similar. Whilst this likely indicates optimal passage efficiency for these species, it also may
indicate aversion to entering the fishway when the entrance trap was in place. Similar trap
‘shyness’ during entrance trapping of fishways has been observed for other species in the MDB,
although this is more typical of large-bodied species like silver perch (Bidyanus bidyanus)
(Baumgartner and Harris 2007).
The head loss–fish abundance relationship at the fishway exit was non-significant, but there was
a trend of decreasing passage efficiency with increasing minimum head loss. Similar to the large
vertical-slot fishways at Goolwa and Tauwitchere, and dual vertical-slot at Mundoo, a degree of
reduced passage efficiency at high head loss was expected. At head loss >0.6 m, turbulence in
this fishway may increase to ~50 W.m-3, which would likely preclude many small-bodied fishes.
Nonetheless, this effect was minor when compared to the large vertical-slot fishway at
Tauwitchere (Bice et al. 2017). Also as expected, the head loss–fish abundance relationship at
the fishway entrance was non-significant. This dual vertical-slot fishway, and the dual vertical-slot
at Mundoo, were designed to discharge relatively large volumes of water (>15 ML.day-1), and
therefore provide a high degree of fish attraction across a range of head loss conditions, whilst
retaining relatively benign hydraulics for the passage of small-bodied fish. Based on the results
of assessment of the Mundoo dual vertical-slot in 2016/17, this fishway is expected to operate
well in regards to both relative attraction and passage efficiency during high discharge. No
improvements to this fishway are currently recommended, but will be subject to wet
commissioning (i.e. analyses of fishway hydraulics).
Bice, C.M. et al. (2017) Fishway effectiveness on the Murray Barrages
51
4.2.3. Boundary Creek vertical-slot
A total of seven species successfully ascended this fishway, comprising species with freshwater
and catadromous life histories. Six estuarine or marine species were also detected in low numbers
at the fishway entrance and not at the fishway exit, indicating poor passage for these species or
their incidental presence in the fishway entrance. Abundances of Australian smelt, congolli and
common galaxias were similar between the fishway entrance and exit, with only minor differences
in length-frequency distributions, indicating optimal passage efficiency for these species. Bony
herring were sampled in greater numbers from the entrance, but this was largely the result of one
relatively large catch of bony herring from the entrance. Given the strong swimming ability of bony
herring, it is unlikely that passage is impeded at this fishway. The design of the Boundary Creek
small vertical-slot fishway was modelled on the Tauwitchere small vertical-slot fishway, and as
expected, similar results were yielded from the assessment of these fishways (Bice et al. 2017).
Both were specifically designed to facilitate the passage of small-bodied fishes and are
characterised by benign internal hydraulics (i.e. low velocity and turbulence), and both exhibited
high passage efficiency.
The capture of common carp up to 640 mm FL at the exit of the fishway was somewhat
unexpected given the narrow slot widths (100 mm) at this fishway. This capture coincided with
closure of barrage gates and increasing salinity downstream of the fishway, likely prompting
common carp to return to freshwater habitats. These data suggests large-bodied fishes may use
small vertical-slot fishways when undertaking motivated migrations.
Whilst the head loss–fish abundance relationship at the entrance of the Boundary Creek vertical-
slot was non-significant, there was a trend of greater relative attraction to this fishway with
increasing minimum head loss, which has also been demonstrated at the Tauwitchere small
vertical-slot fishway (Bice et al. 2017). As such, these fishways operate optimally under conditions
of low barrage discharge and high head loss, when fishway discharge and velocity is maximised
and relative attraction enhanced. Alternatively, conditions of high discharge and generally low
head loss, may result in lower fishway discharge and velocity, and thus, lower relative attraction.
We propose, however, that this effect is likely to be less at Boundary Creek Barrage than
Tauwitchere Barrage, owing to the smaller size of Boundary Creek Barrage and typically lower
volumes of freshwater discharge. In essence, discharge through the fishway at Boundary Creek
represents a greater proportion of total barrage discharge than discharge through the small
vertical-slot at Tauwitchere, and subsequently, there should be less ‘masking’ of fishway
discharge by total barrage flows. Additionally, the incorporation of an attraction gate and the
Bice, C.M. et al. (2017) Fishway effectiveness on the Murray Barrages
52
capacity to ‘fine-tune’ entrance conditions should support greater attraction. The operation of
alternate exit gates that ‘shorten’ the fishway, increasing head loss across the fishway and water
velocities, should partially improve attraction at both the Boundary Creek and Tauwitchere small
vertical-slot fishways under low head loss conditions, but this was not assessed in the current
study. Ultimately, guidelines for engaging alternate exits need to be determined and incorporated
into operational guidelines for barrage operators (SA Water). No improvements to this fishway
are currently recommended, but will be subject to wet commissioning (i.e. analyses of fishway
hydraulics).
4.2.4. Mundoo dual vertical-slot
A total of 11 species successfully ascended this fishway and those only detected at the entrance
(i.e. carp gudgeon, goldfish and small-mouthed hardyhead), were sampled in low numbers.
Comparison of overall and species-specific abundances between entrance and exit samples
suggest high levels of passage efficiency during the sampling period. Length-frequency
distributions were generally similar between the entrance and exit with only small individuals of
common galaxias (<45 mm FL), Australian smelt (<45 mm FL) and flat-headed gudgeon
(<35 mm TL) exhibiting minor discrepancies between entrance and exit that may indicate size-
related passage obstruction. Similar to the Ewe Island dual vertical-slot in 2015/16, abundance of
bony herring was greater at the exit, albeit without statistical significance, which may indicate
aversion to entering the fishway when the entrance trap was in place.
Large-bodied fishes (>200 mm length) including golden perch, freshwater catfish, common carp
and redfin perch were detected using this fishway, which contrasted sampling of the similar Ewe
Island dual vertical-slot fishway in 2015/16, when no large-bodied fishes were sampled. This is
likely a result of the high discharge conditions experienced in 2016/17, but importantly, indicates
that this fishway design type is indeed suitable for attracting and passing large-bodied fishes
under high flow conditions.
The head loss–fish abundance relationship at the fishway exit was non-significant, but there was
a trend of decreasing passage efficiency with increasing minimum head loss. Similar to the large
vertical-slot fishways at Goolwa and Tauwitchere, and dual vertical-slot at Ewe Island, a degree
of reduced passage efficiency at high head loss was expected. At head loss >0.6 m, turbulence
in this fishway may increase to ~50 W.m-3, which would likely preclude many small-bodied fishes.
Nonetheless, this effect was minor when compared to the large vertical-slot fishway at
Tauwitchere (Bice et al. 2017). Also as expected, the head loss–fish abundance relationship at
Bice, C.M. et al. (2017) Fishway effectiveness on the Murray Barrages
53
the fishway entrance was non-significant. This dual vertical-slot fishway, and the dual vertical-slot
at Ewe Island, were designed to discharge relatively large volumes of water (>15 ML.day-1), and
therefore provide a high degree of fish attraction across a range of head loss conditions, whilst
retaining relatively benign hydraulics for the passage of small-bodied fish. As such, this fishway,
as expected provided high relative attraction and passage efficiency during high discharge. No
improvements to this fishway are currently recommended, but will be subject to wet
commissioning (i.e. analyses of fishway hydraulics).
4.3. Overall fish passage at the Murray Barrages
The construction of new fishways on the Murray Barrages has improved opportunities for fish
passage at individual structures and collectively across the barrage network. Here we compile
qualitative statements on the effectiveness of each of the new and pre-existing fishways for both
small- (<100 mm length) and large-bodied (>100 mm length) fishes, to present a measure of
overall effectiveness of fish passage on each barrage under scenarios of low and high barrage
discharge. Quantitative comparisons are not possible due to individual fishways being assessed
in different years and are thus subject to variability in the migratory fish assemblage present in
any given year.
Under low discharge (e.g. total barrage discharge <10,000 ML.day-1), water level in the Coorong
is dictated by weather and tide, resulting in frequent periods of high head loss (>0.5 m) across
the barrages. This maximises fishway discharge, which in turn represents a large proportion or at
times, 100% of barrage discharge. Alternatively, during high discharge (e.g. total barrage
discharge >10,000 ML.day-1), high water levels in the Coorong are maintained and tidal fluctuation
is dampened, resulting in generally lower head loss across the barrages. This reduces fishway
discharge, which consequently represents a small proportion of total barrage discharge.
Qualitative statements are provided in regards to: 1) the biomass of fish potentially migrating (low,
moderate, high); 2) relative attraction of fish to each fishway (low, moderate, high); 3) passage
efficiency of each fishway (the ability of fish to ascend the fishway once the entrance is located;
low (<25%), moderate (25–75%), high (80–100%); and 4) the effectiveness of each fishway. The
effectiveness of each fishway under each scenario is assessed by combining both relative
attraction and passage efficiency, and is categorised as ineffective, sub-optimal or optimal (Table
6). Qualitative statements on biomass, relative attraction, passage efficiency and effectiveness
are based upon empirical data from monitoring of sites adjacent the Murray Barrages (Bice and
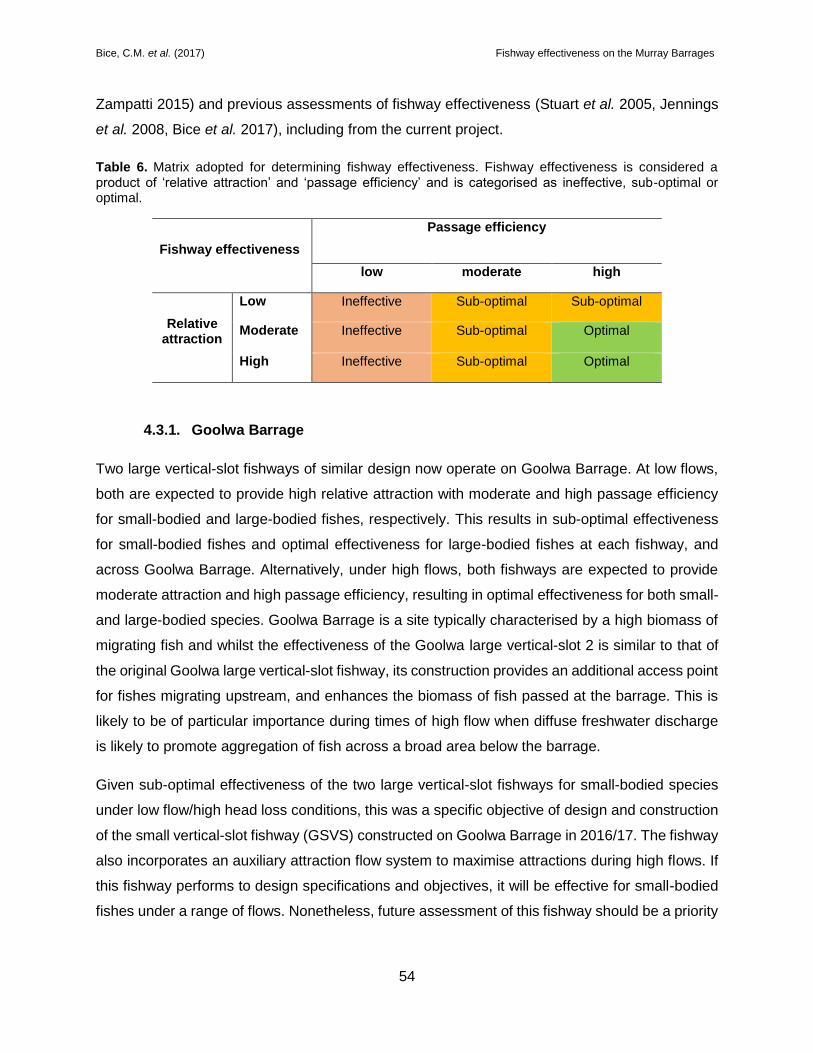
Bice, C.M. et al. (2017) Fishway effectiveness on the Murray Barrages
54
Zampatti 2015) and previous assessments of fishway effectiveness (Stuart et al. 2005, Jennings
et al. 2008, Bice et al. 2017), including from the current project.
Table 6. Matrix adopted for determining fishway effectiveness. Fishway effectiveness is considered a product of ‘relative attraction’ and ‘passage efficiency’ and is categorised as ineffective, sub-optimal or optimal.
Fishway effectiveness
Passage efficiency
low moderate high
Relative attraction
Low Ineffective Sub-optimal Sub-optimal
Moderate Ineffective Sub-optimal Optimal
High Ineffective Sub-optimal Optimal
4.3.1. Goolwa Barrage
Two large vertical-slot fishways of similar design now operate on Goolwa Barrage. At low flows,
both are expected to provide high relative attraction with moderate and high passage efficiency
for small-bodied and large-bodied fishes, respectively. This results in sub-optimal effectiveness
for small-bodied fishes and optimal effectiveness for large-bodied fishes at each fishway, and
across Goolwa Barrage. Alternatively, under high flows, both fishways are expected to provide
moderate attraction and high passage efficiency, resulting in optimal effectiveness for both small-
and large-bodied species. Goolwa Barrage is a site typically characterised by a high biomass of
migrating fish and whilst the effectiveness of the Goolwa large vertical-slot 2 is similar to that of
the original Goolwa large vertical-slot fishway, its construction provides an additional access point
for fishes migrating upstream, and enhances the biomass of fish passed at the barrage. This is
likely to be of particular importance during times of high flow when diffuse freshwater discharge
is likely to promote aggregation of fish across a broad area below the barrage.
Given sub-optimal effectiveness of the two large vertical-slot fishways for small-bodied species
under low flow/high head loss conditions, this was a specific objective of design and construction
of the small vertical-slot fishway (GSVS) constructed on Goolwa Barrage in 2016/17. The fishway
also incorporates an auxiliary attraction flow system to maximise attractions during high flows. If
this fishway performs to design specifications and objectives, it will be effective for small-bodied
fishes under a range of flows. Nonetheless, future assessment of this fishway should be a priority

Bice, C.M. et al. (2017) Fishway effectiveness on the Murray Barrages
55
in the future, but is contingent on resolving access issues related to the public walkway on Goolwa
Barrage and the superstructure of the fishway.
Table 7. Qualitative statements on fish migration and function of fishways on Goolwa Barrage for small-bodied (<100 mm in length) and large-bodied (>100 mm in length) fish under low flow and high flow scenarios, including: 1) Biomass: the likely biomass of fish accumulated below the barrage and attempting to migrate upstream (low, moderate, high); 2) Relative attraction: the relative proportion of fish attempting to migrate able to locate the entrance of the fishway (low, moderate, high); 3) Passage efficiency: the proportion of fish able to enter the fishway that are able to successfully ascend (based on empirical data from assessments, low (<25%), moderate (25–75%) or high (>75%)); and 4) Effectiveness: the product of ‘relative attraction’ and ‘passage efficiency’ following Table 6
Goolwa Barrage
Biomass Relative attraction
Passage efficiency
Effectiveness
Lo
w f
low
GVS 1
Small-bodied fish High High Moderate Sub-optimal
Large-bodied fish Low High High Optimal GVS 2
Small-bodied fish High High Moderate Sub-optimal
Large-bodied fish Low High High Optimal
GSVS*
Small-bodied fish High - - -
Large-bodied fish Low - - -
Overall
Small-bodied fish Sub-optimal
Large-bodied fish Optimal
Hig
h f
low
^
GVS 1
Small-bodied fish High Moderate High Optimal
Large-bodied fish Moderate Moderate High Optimal
GVS 2
Small-bodied fish High Moderate High Optimal
Large-bodied fish Moderate Moderate High Optimal
GSVS*
Small-bodied fish High - - -
Large-bodied fish Moderate - - -
Overall
Small-bodied fish Optimal
Large-bodied fish Optimal
*denotes a fishway for which assessments have not been conducted. ^denotes conditions under which assessments have not been conducted and fishway characteristics are inferred.

Bice, C.M. et al. (2017) Fishway effectiveness on the Murray Barrages
56
4.3.2. Mundoo Barrage
The Mundoo dual vertical-slot fishway is the first fishway to be constructed on this barrage, and
as such has generally improved fish passage at Mundoo Barrage; however, fishway function is
likely to vary with hydrology. Relative attraction of fish to the Mundoo dual vertical-slot fishway is
likely to be high under both low and high flow conditions due to the considerable volumes of water
discharged by the fishway. Passage efficiency for small- and large-bodied species was high under
high flow conditions in 2016/17, but this fishway has not been sampled under low flow conditions
when head loss is typically greater and thus, internal velocities and turbulence greater.
Nonetheless, sampling at the similarly designed Ewe Island dual vertical-slot under low flow
conditions in 2015/16 indicated high passage efficiency, suggesting similar passage efficiency is
likely at the Mundoo dual vertical-slot under these conditions. Consequently, the effectiveness of
this fishway could be viewed as optimal under both low and high flows (Table 8).
4.3.3. Boundary Creek Barrage
The Boundary Creek small vertical-slot fishway is the first fishway to be constructed on this
barrage, and as such has generally improved fish passage at Boundary Creek. At low flows, it
provides high relative attraction with high and moderate passage efficiency for small- and large-
bodied fishes, respectively (Table 8). Passage efficiency is deemed to be moderate for large-
bodied species due to the narrow slot widths (100 mm) potentially precluding some large-bodied
fishes (e.g. >350 mm length). This results in optimal effectiveness for small-bodied species and
sub-optimal effectiveness for large-bodied species. Nonetheless, the biomass of large-bodied
fishes migrating at this barrage is likely to be low, and the fishway was specifically designed with
the objective of facilitating passage of small-bodied fishes at low flows.
Whilst this fishway has not been assessed under high flow conditions, inferences are made based
upon expert opinion and function of the similar Tauwitchere small vertical-slot. At high flows,
relative attraction at the Boundary Creek small vertical-slot is likely to be reduced (from high to
moderate), due to masking of low volume fishway discharge (~2 ML.day-1) by diffuse barrage
discharge. Nonetheless, reductions in relative attraction are likely to be less than at the
Tauwitchere small vertical-slot due to the small size of Boundary Creek Barrage and thus, greater
proportion of overall barrage flow that is passed through the fishway. Under such conditions, high
and moderate passage efficiency can be expected for small- and large-bodied fishes, resulting in
optimal and sub-optimal fishway effectiveness.

Bice, C.M. et al. (2017) Fishway effectiveness on the Murray Barrages
57
Table 8. Qualitative statements on fish migration and function of fishways on Mundoo, Boundary Creek and Ewe Island barrages for small-bodied (<100 mm in length) and large-bodied (>100 mm in length) fish under low flow and high flow scenarios, including: 1) Biomass: the likely biomass of fish accumulated below the barrage and attempting to migrate upstream (low, moderate, high); 2) Relative attraction: the relative proportion of fish attempting to migrate able to locate the entrance of the fishway (low, moderate, high); 3) Passage efficiency: the proportion of fish able to enter the fishway that are able to successfully ascend (based on empirical data from assessments, low (<25%), moderate (25–75%) or high (>75%)); and 4) Effectiveness: the product of ‘relative attraction’ and ‘passage efficiency’ following Table 6.
Biomass Relative attraction Passage efficiency Effectiveness
Mundoo Barrage
Lo
w
flo
w^ MDVS
Small-bodied fish Moderate High High Optimal
Large-bodied fish Low High High Optimal
Hig
h
flo
w MDVS
Small-bodied fish High High High Optimal
Large-bodied fish Moderate High High Optimal
Boundary Creek
Lo
w
flo
w BCVS
Small-bodied fish Moderate High High Optimal
Large-bodied fish Low High Moderate Sub-optimal
Hig
h
flo
w^ BCVS
Small-bodied fish High Moderate High Optimal
Large-bodied fish Moderate Moderate Moderate Sub-Optimal
Ewe Island Barrage
Lo
w
flo
w EIDVS
Small-bodied fish Moderate High High Optimal
Large-bodied fish Low High High Optimal
Hig
h
flo
w^
EIDVS
Small-bodied fish High High High Optimal
Large-bodied fish Moderate High High Optimal
^denotes conditions under which assessments have not been conducted and fishway characteristics are inferred.
4.3.4. Ewe Island Barrage
The Ewe Island dual vertical-slot fishway is the first fishway to be constructed on this barrage,
and as such has generally improved fish passage at Ewe Island Barrage. Relative attraction of
fish to the fishway is likely to be high under both low and high flow conditions due to the
considerable volumes of water discharged by the fishway. Furthermore, passage efficiency for
small-bodied species was high under low flow conditions, and based on results from the Mundoo
vertical-slot, could be expected to be high under high flow conditions when head loss is minimal,

Bice, C.M. et al. (2017) Fishway effectiveness on the Murray Barrages
58
and therefore internal turbulence and velocity, are reduced. Whilst few large-bodied species were
sampled during assessment in 2015/16, attraction and passage of large-bodied fishes at the
Mundoo dual vertical-slot, suggest large-bodied fish passage efficiency to be high. Consequently,
the effectiveness of this fishway could be viewed as optimal under both low and high flows (Table
8).
4.3.5. Tauwitchere Barrage
Currently, under low flow conditions, high relative attraction is exhibited by all three existing
fishways, but passage efficiency, and thus effectiveness, varies (Table 9). The large vertical-slot
fishway exhibits low passage efficiency for small-bodied fishes (Stuart et al. 2005, Jennings et al.
2008), suggesting that it is ineffective for these species, whilst passage efficiency is high for large-
bodied species, resulting in optimal effectiveness (Table 9). Passage efficiency at the rock ramp
is considered to be moderate and low for small- and large-bodied fishes, respectively. The
construction of the Tauwitchere small vertical-slot fishway in 2009 necessitated the partial
disassembly of this fishway, resulting in a concrete sill obstructing upstream fish passage during
periods of low tailwater levels. Additionally, in its original configuration, passage efficiency was
partially limited for all species due to the limited operating window of this fishway (Lake
Alexandrina water level >0.65 m AHD, Coorong water level > 0.2 m AHD), and further limited for
large-bodied fishes under low flows, as the physical construction of the fishway likely limits
passage of larger individuals (e.g. >350 mm length) (Jennings et al. 2008). As such, under low
flows, at least one fishway provides optimal effectiveness for small- or large-bodied fishes.
Nonetheless, given the large size of Tauwitchere Barrage and high biomass of small-bodied
fishes that undertake migrations at this structure (Bice and Zampatti 2015), a further fishway will
better meet passage requirements during low flows at this structure.
Under conditions of high flow, water levels in the Coorong are typically elevated and head loss
across the barrage reduced, resulting in substantially different relative attraction, passage
efficiency and effectiveness (Table 9). Relative attraction likely remains high at both the large
vertical-slot and rock ramp fishways, but is reduced (to low) at the small vertical-slot due to the
comparatively lower volumes of water discharged. Lower head loss across the large vertical-slot
fishway results in more benign internal hydraulics (i.e. lower velocities and turbulence) and
consequently, high passage efficiency and effectiveness for small-bodied fishes (Bice et al. 2017).
At the rock ramp fishway, passage efficiency is improved for both small-bodied (i.e. from moderate
to high) and large-bodied fishes (i.e. low to moderate), as the fishway is generally within its

Bice, C.M. et al. (2017) Fishway effectiveness on the Murray Barrages
59
operational window due to relatively high water levels upstream and downstream of the barrage,
whilst higher tail water levels, relative to low flow, likely facilitate greater movement of large fish
through the structure (Jennings et al. 2008). Alternatively, whilst passage efficiency remains
unchanged, relative to low flows, at the small vertical-slot fishway, relative attraction is hindered
due to the low volume of discharge from this fishway as a proportion of overall barrage discharge
(Bice et al. 2017). These changes in attraction and passage efficiency result in optimal
effectiveness for small-bodied fishes at the large vertical-slot and rock ramp fishways, but sub-
optimal effectiveness at the small vertical-slot fishway, whilst for large-bodied fishes, effectiveness
is optimal at the large vertical-slot fishway, and sub-optimal at both the small vertical-slot and rock
ramp fishways. As such, under high flows, at least one fishway provides optimal effectiveness for
small- or large-bodied fishes, but as per low flow conditions, given the large size of Tauwitchere
Barrage and high biomass of small-bodied fishes that undertake migrations at this structure (Bice
and Zampatti 2015), a further fishway will better meet passage requirements. The trapezoidal
fishway planned for Tauwitchere Barrage is designed to facilitate the passage of both small- and
large-bodied fishways under a range of flows, and maintain high levels of relative attraction during
high flow conditions. It is expected to be completed by mid-2017 and future assessment of the
effectiveness of this fishway should be viewed as a priority.

Bice, C.M. et al. (2017) Fishway effectiveness on the Murray Barrages
60
Table 9. Qualitative statements on fish migration and function of fishways on Tauwitchere Barrage in regards to small-bodied (<100 mm in length) and large-bodied (>100 mm in length) fish passage under low flow and high flow scenarios, including: 1) Biomass: the likely biomass of fish accumulated below the barrage and attempting to migrate upstream (low, moderate, high); 2) Relative attraction: the relative proportion of fish attempting to migrate able to locate the entrance of the fishway (low, moderate, high); 3) Passage efficiency: the proportion of fish able to enter the fishway that are able to successfully ascend (based on empirical data from assessments, low (<25%), moderate (25–75%) or high (>75%)); and 4) Effectiveness: the product of ‘relative attraction’ and ‘passage efficiency’ following Table 6.
Tauwitchere Barrage
Biomass Relative attraction
Passage efficiency
Effectiveness
Lo
w f
low
TVS
Small bodied fish High High Low Ineffective Large bodied fish Low High High Optimal TRR
Small bodied fish High High Moderate Sub-optimal
Large bodied fish Low High Low Ineffective
TSVS
Small bodied fish High High High Optimal
Large bodied fish Low Moderate Moderate Sub-optimal
TT
Small bodied fish High - - -
Large bodied fish Low - - -
Overall Small bodied fish Optimal Large bodied fish Optimal
Hig
h f
low
TVS
Small bodied fish High High High Optimal
Large bodied fish Moderate High High Optimal
TRR
Small bodied fish High High High Optimal
Large bodied fish Moderate High Moderate Sub-optimal
TSVS
Small bodied fish High Low High Sub-optimal
Large bodied fish Moderate Low Moderate Sub-optimal
TT
Small bodied fish High - - -
Large bodied fish Moderate - - -
Overall
Small bodied fish Optimal
Large bodied fish Optimal

Bice, C.M. et al. (2017) Fishway effectiveness on the Murray Barrages
61
5. CONCLUSION AND RECOMMENDATIONS
This study aimed to assess the biological effectiveness of six fishways recently constructed
(2015–2017) on the Murray Barrages under the Coorong Lower Lakes and Murray Mouth
Recovery (CLLMM) Project. The project also aimed to compare effectiveness with existing
fishways, to provide a measure of overall fish passage at the Murray Barrages, and the
contribution of the CLLMM program in meeting fish passage objectives. Ultimately, the project
aims to inform future barrage and fishway operation. Two of the fishways could not be assessed
under the current project due to delays in construction. The current report details the assessment
of four of the new fishways, and evaluation of the objectives above.
Each of the assessed fishways are considered to be operating to ecological objectives. As such,
physical alterations to these structures are unlikely to be needed. Nonetheless, wet
commissioning of all fishways is still required to determine that hydraulic characteristics of the
constructed fishways meet design criteria.
The current fishway construction program has contributed greatly to overall fish passage at the
Murray Barrages. The fishways at Mundoo, Boundary Creek and Ewe Island have re-instated
migratory pathways through these barrages, providing further locations across the barrage
network for fish to access the Lower Lakes from the Coorong. All three fishways were found to be
effective in facilitating the passage of small-bodied species, which dominate the migratory fish
assemblage at the Murray Barrages. These fishways, together with the Goolwa large vertical-slot
2 fishway, have resulted in the provision of fish passage on every barrage within the network,
improved the geographical spread of migration pathways and increased the capacity of the
fishway network to pass a high biomass of fish, under all flow conditions.
The effectiveness of each of the fishways on the Murray Barrages is influenced by barrage
operations. The upstream movements of migrating fish are guided by rheotactic (i.e. movement
in response to water current) and salinity cues, amongst others, and consequently, to maximise
fishway effectiveness, freshwater must be discharged through barrage gates in a way that
maximises attraction to fishway entrances. Typically, this involves confining discharge to gates
immediately adjacent to fishways; whereas discharge of water through barrage gates that are
removed from fishway locations will result in attraction and accumulation of fishes at positions on
the barrage where passage is not facilitated, compromising the effectiveness of fishways.

Bice, C.M. et al. (2017) Fishway effectiveness on the Murray Barrages
62
The provision of fishways on every barrage provides for flexibility in barrage operation in the
future. Prior to the current construction program, barrage operation in regards to maximising fish
passage and reducing the risk of fish accumulations, has prioritised discharge to barrages with
fishways that provide effective fish passage (i.e. Goolwa and Tauwitchere; Bice and Zampatti
2015). Water may now be discharged from any of the five barrages with minimal risk of fish
accumulations, if fishways and adjacent gates are operated effectively.
An allied project that has monitored fish migration at the Murray Barrages since 2006, provides
evidence of peak seasons for movement and passage that should inform prioritisation of releases
and fishway operations (Bice et al. 2016). We suggest year-round operation of all fishways on the
Murray Barrages, but in particular from June–January to: 1) allow for upstream migrations of
pouched lamprey, and downstream spawning migrations of congolli and common galaxias from
June to August; 2) allow for upstream migrations of short-headed lamprey from August to
November; and 3) allow for the upstream migrations of young-of-the-year congolli and common
galaxias (and other species) from October to January. In addition to fishway operation, the
operation of barrage gates, particularly in winter, is likely to better facilitate downstream spawning
migrations of catadromous species, and attraction of anadromous species.
The current program has included the construction of fishways that discharge only low volumes
of water (e.g. Boundary Creek, <3 ML.day-1). Subsequently, under dry conditions and limited
water availability for freshwater releases from the barrages, such fishways may provide the
opportunity to maintain connectivity between the Coorong and Lower Lakes, whilst discharging
little water. Whilst we support the continuous operation of all fishways, a prioritisation scheme for
the closure of high-discharge fishways, but maintenance of low-discharge structures, may be
developed as a contingency.
Ultimately, upon the completion and biological assessment of the remaining two fishways, an
operating plan should be developed for the Murray Barrages that enhances opportunities for fish
migration. Such a plan would not dictate barrage operations, but provide a guide, that when
considered with other objectives of barrage operations (e.g. Murray Mouth scouring, salt export
from the Goolwa Channel), would maximise fish passage at the Murray Barrages under all
hydrological conditions.
The CLLMM fishway construction program has greatly improved connectivity and the capacity for
fishes to move freely between the Coorong and Lower Lakes. Such movements are critical in the

Bice, C.M. et al. (2017) Fishway effectiveness on the Murray Barrages
63
life history of many native species and as such, fishway construction is contributing greatly to the
sustainability of fish populations in the region.
To summarise, the key conclusions/recommendations of this report are:
Each of the assessed fishways are operating to biological design objectives;
Physical alterations to the new fishways are likely not required, but will be dependent upon
wet commissioning to determine hydraulic characteristics;
The assessment of the Goolwa small vertical-slot and Tauwitchere trapezoidal fishways
remains a future priority; and
The year-round operation of all fishways, but particularly June–January, and barrage
operation that maximises attraction to fishway entrances (i.e. operation of barrage gates
adjacent fishways), is recommended.

Bice, C.M. et al. (2017) Fishway effectiveness on the Murray Barrages
64
REFERENCES
Barrett, J. and M. Mallen-Cooper (2006). The Murray River's 'Sea to Hume Dam' fish passage program: Progress to date and lessons learned. Ecological Management and Restoration 7: 173-
183.
Baumgartner, L. J. and J. H. Harris (2007). Passage of non-salmonid fish through a Deedler lock on a lowland river. River Research and Applications 23: 1058-1069.
Bice, C. M. and B. P. Zampatti (2015). Fish assemblage structure, movement and recruitment in the Coorong and Lower Lakes in 2014/15, South Australian Research and Development Institute (Aquatic Sciences), Adelaide. SARDI publication No. F2011/000186-5. SARDI Research Report Series No. 862. 64 pp.
Bice, C. M., B. P. Zampatti and J. F. Fredberg (2016). Fish assemblage structure, movement and recruitment in the Coorong and Lower Lakes in 2015/16 South Australian Research and Development Institute (Aquatic Sciences), Adelaide. SARDI Publication No. F2011/000186-6. SARDI Research Report Series No. 921. 77 pp.
Bice, C. M., B. P. Zampatti and M. Mallen-Cooper (2017). Paired hydraulically distinct vertical-slot fishways provide complementary fish passage at an estuarine barrier. Ecological Engineering 98: 246-256.
Clarke, K. R. and R. N. Gorley (2006). PRIMER v6: User manual/tutorial, PRIMER-E Ltd, Plymouth, UK.
Clay, C. H. (1995). Design of fishways and other fish facilities. Boca Raton, Lewis.
Cooke, S. J. and S. G. Hinch (2013). Improving the reliability of fishway attraction and passage efficiency estimates to inform fishway engineering, science and practice Ecological Engineering 58: 123-132.
CSIRO (2008). Water availability in the Murray-Darling Basin., Report to the Australian Government from the CSIRO Murray-Darling Basin Sustainable Yields Project. CSIRO, Australia, 67pp: 67.
Gehrke, P. C., P. Brown, C. B. Schiller, D. B. Moffat and A. M. Bruce (1995). River regulation and fish communities in the Murray-Darling River system, Australia. Regulated Rivers: Research & Management 11: 363-375.

Bice, C.M. et al. (2017) Fishway effectiveness on the Murray Barrages
65
Jennings, P., B. Zampatti, I. G. Stuart and L. J. Baumgartner (2008). Fish passage at the Murray barrages. The sea to Lake Hulme: Restoring fish passage in the Murray River, Murray-Darling Basin Commission, Canberra. MDBC publication No. 32/08: 62-77.
Lucas, M. and E. Baras (2001). Migration of Freshwater Fishes, Blackwell Sciences, Oxford.
Noell, C. J., Q. Ye, D. A. Short, L. B. Bucater and N. R. Wellman (2009). Fish assemblages of the Murray Mouth and Coorong region, South Australia, during an extended drought period, CSIRO: Water for a Healthy Country National Research Flagship and South Australian Research and Development Institute (Aquatic Sciences), Adelaide.
Potter, I. C., J. R. Tweedley, M. Elliott and A. K. Whitfield (2015). The ways in which fish use estuaries: a refinement and expansion of the guild approach. Fish and Fisheries 16: 230-239.
Puckridge, J. T., F. Sheldon and K. F. Walker (1998). Flow variability and the ecology of large rivers. Marine and Freshwater Research 49: 55-72.
Stuart, I. G., Q. Ye, J. Higham and T. O'Brien (2005). Fish Migration at Tauwitchere Barrage: new options for fish passage, Murray-Darling Basin Commission, Canberra, 33pp.
Ye, Q., L. Bucater and D. Short (2014). Fish response to flow in the Murray estuary and Coorong during 2013/14, South Australian Research and Development Institute (Aquatic Sciences), Adelaide. SARDI Publication No. F2013/000486-1. SARDI Research Report Series No. 732. 95pp.
Ye, Q., L. Bucater and D. Short (2015). Coorong fish condition monitoring 2008-2014: black bream (Acanthopagrus butcheri), greenback flounder (Rhombosolea tapirina) and smallmouthed hardyhead (Atherinosoma microstoma) populations, South Australian Research and Development Institute (Aquatic Sciences), Adelaide. SARDI Publication No. F2011/000471-4. SARDI Research Report Series No. 836. 105 pp.
Zampatti, B. P., C. M. Bice and P. R. Jennings (2010). Temporal variability in fish assemblage structure and recruitment in a freshwater deprived estuary: The Coorong, Australia. Marine and Freshwater Research 61: 1298-1312.
Zampatti, B. P., C. M. Bice and P. R. Jennings (2012). Fish assemblage response and fishway effectiveness at Goolwa, Tauwitchere and Hunters Creek Barrages in 2010/11, South Australian Research and Development Institute (Aquatic Sciences), Adelaide. SARDI Publication No. F2011/000186-2. SARDI Research Report Series No. 605. 66pp.
Top Related