


Languages
Pages
Legal


ORIGINAL ARTICLE
Assessment of hydro-geochemistry and groundwater qualityof Rajshahi City in Bangladesh
M. G. Mostafa1 • S. M. Helal Uddin1 • A. B. M. H. Haque2
Received: 9 June 2015 / Accepted: 2 October 2017 / Published online: 23 October 2017
� The Author(s) 2017. This article is an open access publication
Abstract The study was carried out to understand the
hydro-geochemistry and ground water quality in the Raj-
shahi City of Bangladesh. A total of 240 groundwater
samples were collected in 2 years, i.e., 2009 and 2010
covering the pre-monsoon, monsoon and post-monsoon
seasons. Aquifer soil samples were collected from 30
locations during the monsoon in 2000. All the samples
were analyzed for various physicochemical parameters
according to standard methods of analysis, these includes
pH, electrical conductivity, total dissolved solids, total
hardness, and total alkalinity, major cations such as Na?,
K?, Ca2?, Mg2?, and Fe2?, major anions such as HCO3-,
NO3-, Cl-, and SO4
2- and heavy metals such as Mn, Zn,
Cu, As, Cd and Pb. The results illustrated that the
groundwater was slightly acidic to neutral in nature, total
hardness observed in all samples fall under the hard to a
very hard category. The bicarbonate and calcium concen-
tration in the groundwater exceeded the permissible limits
may be due to the dissolution of calcite. The concentration
of calcium, iron, manganese, arsenic and lead were far
above the permissible limit in most of the shallow tube well
samples. The study found that the major hydrochemical
facies was identified to be calcium-bicarbonate-type
(CaHCO3). A higher concentration of metals including Fe,
Mn, As and Pb was found indicating various health haz-
ards. The rock–water interaction was the major geochem-
ical process controlling the chemistry of groundwater in the
study area. The study results revealed that the quality of the
groundwater in Rajshahi City area was of great concern
and not suitable for human consumption without adequate
treatment.
Keywords Physicochemical � Groundwater �Geochemistry � Rajshahi City � Tube well
Introduction
Recently, the provision of safe drinking water remains a
major target for both the developed and developing coun-
tries. In the past three decades, excessive installation of
rural groundwater supplies through tube wells have led to
increasing contamination in groundwater. A detailed geo-
chemical study of groundwater is used to understand the
role of various elements in groundwater aquifer, including
all the major ions such as Na, K, Ca, Mg, Fe, Mn, Zn, Cu,
Pb, As, Cd and how the elemental fluxes are exchanged
through atmospheric, terrestrial and aquatic interactions.
Geochemical studies of groundwater provide a better
understanding of possible changes in quality as develop-
ment progress (Sreedevi 2004; Jalali 2006; Subba Rao
2006; Gupta et al. 2009). In the past three decades,
excessive installation of rural groundwater supplies
through tube wells have led to increasing contamination in
groundwater of Bangladesh. Geochemistry is the science
that uses the tools and principles of chemistry to explain
the mechanisms behind major geological systems such as
the Earth’s crust and its oceans (Albarede and Francis
2003). Geochemistry of groundwater is an important factor
in determining its use for various purposes such as
domestic, irrigation and industrial uses. It depends on a
number of factors, such as general geology, the degree of
& M. G. Mostafa
1 Institute of Environmental Science, University of Rajshahi,
Rajshahi 6205, Bangladesh
2 Department of Chemistry, University of Rajshahi, Rajshahi,
Bangladesh
123
Appl Water Sci (2017) 7:4663–4671
https://doi.org/10.1007/s13201-017-0629-y

chemical weathering of various rock types, quality of
recharge water and inputs from sources of other than
water–rock interaction (Hem 1986). The geochemistry is
the science that uses the tools and principles of chemistry
to explain the mechanisms behind major geological sys-
tems such as the Earth’s crust and its oceans (Albarede and
Francis 2003). Geochemistry of groundwater is an impor-
tant factor in determining its use for various purposes such
as domestic, irrigation and industrial uses. It depends on a
number of factors, such as general geology, the degree of
chemical weathering of various rock types, quality of
recharge water and inputs from sources of other than
water–rock interaction (Hem 1986). In the past three dec-
ades, excessive installation of rural groundwater supplies
through tube wells have led to increasing contamination in
groundwater of Bangladesh.
Geochemical process, occurring within the groundwater
and their reactions with the aquifer materials, are respon-
sible for changes in groundwater chemistry and quality
(Drever 1988; Hem 1991; Subba Rao and Surya Rao 2009).
Therefore, it is impossible to control the dissolution of
undesirable constituents in the waters once they enter into
the ground (Johnson 1979; Sastri 1994). Many naturally
occurring major, minor and trace elements in drinking
water can have a significant effect on human health either
through deficiency or excessive intake (Frengstad et al.
2001). Therefore, the fundamental knowledge of process
control of groundwater chemistry is a pre-requisite condi-
tion for rational management of water resources. Ground-
water is an important natural resource for domestic,
industrial, commercial and irrigation purpose in Bangla-
desh. Safe drinking water is absolutely essential for healthy
living. About 96% of the total population in Bangladesh
has access to drinking water from tubewells (WHO
Regional Office for South-East Asia 2002). It is the single
largest source of drinking water in most of the developing
countries and estimated that approximately one-third of the
world’s population is depending on groundwater where the
general assumption of groundwater is being safe to drink
(Nickson et al. 2005). Report (2015) showed that about
87% of the population had access to ‘‘improved water’’
there were still around 21 million lacking access to ‘‘im-
proved’’ water in Bangladesh (Wikipedia 2015). It is per-
ceived to be a safer source of drinking water with adequate
protection and excellent microbial and chemical quality
that requires minimum treatment. Groundwater resources
in arid and semi-arid regions play a vital role on the
socioeconomic development.
A few reports were found in the study area mainly
confining in analysis and arsenic contamination of
groundwater. An understanding of geochemical evaluation
of groundwater is important for a sustainable development
of groundwater resources in the study area that few
researches have been conducted with the aim of assessing
the chemical components of groundwater and limited
information exists on vulnerability of the aquifer to pol-
lution in Rajshahi City. Thus, a comprehensive study on
hydro-geochemistry and groundwater quality assessment in
the study area is imperative. The objective of this study is
to determine the hydro-geochemical process controlling the
water quality variations and to determine the water type of
the groundwater to ascertain the suitability of water for
drinking purposes.
Materials and methods
Study area
The study area was Rajshahi City in Bangladesh, which is
the divisional headquarter as well as the administrative
district (Fig. 1). It lies between latitudes 24�210N and
24�250N and longitudes 88�320 and 88�400 east. RajshahiCity is located in the north-west of the country with a
population of about 646,716 (male 52.4%, female 47.6%).
According to the Population Census 2001, the city has a
density of 6689 people per km2 (Banglapedia 2006). It
consists of 30 wards with a total area of 93.47 km2 and is
situated on the northern banks of the river Padma (the
downstream of the Ganges River in India). The climate of
the city is generally marked by monsoons, high tempera-
ture, considerable humidity and moderate rainfall. It has a
mean annual rainfall of below 1524 mm compared to a
national average of 2540 mm (BBS 2005).
Sample collection, preparation and analysis
A total of 30 soil samples were collected at various depths
(10–45 m) during borehole drilling in 2010 and stored in
plastic bags and transported to the laboratory for physical
and chemical analysis. 0.5 g of dry soil sample was
weighed and poured into a graduated test tube and mixed
with 2 mL of aqua regia 1:3 (1 Conc. HCl:3 Conc. HNO3)
for the major heavy metals analysis such as Fe, Cu, Zn, As,
Cd and Pb. The mixture was digested on a hot plate at
95 �C for 1 h and allowed to cool at room temperature. The
sample was then diluted to 10 mL using double distilled
water and allowed to settle overnight. The supernatant was
filtered and analyzed using AAS as stated by Adams
(1991). 240 Representatives groundwater samples, of them
180 shallow tube wells and 60 deep tube wells samples
were collected from 40 locations in Rajshahi City during
the pre-monsoon, monsoon and post-monsoon season
covering 2 years to evaluate the seasonal variations in
chemical compositions and assess water quality. The
samples were collected in 1 L plastic bottles, labeled,
4664 Appl Water Sci (2017) 7:4663–4671
123

sealed and transported to the laboratory and stored in a
refrigerator at a temperature of about 4 �C until the anal-
ysis was done. All the samples were analyzed according to
the standard procedures as stated in American Public
Health Association (APHA 2005). For microbial analysis,
samples were collected in 250 mL glass bottles. All anal-
yses were conducted in triplicate to ensure accuracy and
precision. All reagents used in this study were analytical
grade chemicals.
Results and discussion
The minerals characteristic of groundwater derives from
reactions between rainwater and the host rock over a time
scale of days, months, or years during percolation. The
current study focused on the factors controlling the
groundwater composition, soil chemistry and water type in
the Rajshahi City area aquifer system.
Physicochemical parameters of aquifer soil
Physicochemical characteristics of shallow aquifer soil
samples collected during the monsoon in 2010 are shown
in Table 1. The maximum, minimum and mean values of
electrical conductivity of the samples were 2928, 1040 and
1800.18 lS/cm indicating the presence of a moderate
amount of ions (Table 1). The concentration of Ca was
found to be highest (220 mg/L) in shallow aquifers as
compared to other cations, where Cd concentration was the
lowest (0.02 mg/L) indicating Ca dominance in aquifer soil
(Table 1). Among anions, HCO3- and NO3
- showed the
highest and lowest concentrations and the values were 580
and 3.87 mg/kg, respectively (Table 1). The mean con-
centration of Zn, Cu, As and Cd were consistently low at
all samples compared to the rest of the heavy metal ions. A
report showed that the mean values of Zn, Cu, Cd and Pb
were found to be 60, 30, 0.15 and 15 mg/kg in the Puebla
aquifer system in Mexico (Jaime Garfias and Arroyo 2010)
and these values were far above compared to the present
study results, except Cd concentration.
The analysis results showed that the mean concentration
of cations and anions were observed in the order:
Ca2?[Mg2 ?[Na?[K?[Fe3?[Mn2?[ Pb2?[Zn2?
[Cu2?[As (total)[Cd2? and HCO3-[Cl-[
SO42-[NO3
-, respectively (Table 1). It is well estab-
lished that natural metal loadings to groundwater reflect the
Fig. 1 Map of Locations of
tube well water samples in
Rajshahi City area
Table 1 Characteristics of shallow aquifer soil samples during
monsoon season in 2010
Parameter Minimum Maximum Mean ± SD
EC (lS/cm) 1040.0 2928.0 1800 ± 461
HCO3- (mg/kg) 187.3 580.0 325.5 ± 97
Cl- (mg/kg) 36.04 121.78 76.8 ± 19.5
NO3- (mg/kg) 3.87 13.65 8.74 ± 2.5
SO42- (mg/kg) 38.73 89.60 55.2 ± 11.1
Na (mg/kg) 38.76 81.01 54.9 ± 10.0
K (mg/kg) 7.23 20.44 13.5 ± 4.2
Mg (mg/kg) 6.39 166.80 86.8 ± 34.9
Ca (mg/kg) 109.36 220.00 166.1 ± 30.3
Fe (mg/kg) 5.93 11.86 8.79 ± 1.64
Mn (mg/kg) 2.20 11.43 6.35 ± 2.46
Zn (mg/kg) 0.08 1.600 0.76 ± 0.40
Cu (mg/kg) 0.12 1.60 0.75 ± 0.40
As (mg/kg) 0.05 0.85 0.32 ± 0.24
Cd (mg/kg) 0.02 0.38 0.13
Pb (mg/kg) 0.09 4.01 0.73
Appl Water Sci (2017) 7:4663–4671 4665
123
chemical composition of local bedrock (Piispanen and
Nykyri 1997; Loukola-Ruskeeniemi et al. 1998, 2003). In
general, water composition mostly depends on the aquifer
soil with rainwater pattern reaction condition.
Physicochemical and microbial parameters
of groundwater
The mean and standard deviation of water quality param-
eters of shallow and deep tube wells during the pre-mon-
soon, monsoon and post-monsoon seasons in Rajshahi City
are shown in Table 2.
The mean temperature of shallow and deep tube wells
water samples measured 27.39 and 27.187 �C, respectively(Table 2). The results showed that a small variation in
temperature was observed to be in both the shallow and
deep tube wells water collected in three seasons (not shown
in Table 2) due to temperature variations of the earth. The
pH of the shallow and deep tube wells water samples was
with a mean of 6.90 and 6.98, respectively. Most of the
groundwater samples pH were within the permissible limit
as prescribed by WHO (2008) and Bangladesh drinking
standard (2003). The results of this study indicate that the
water was slightly acidic to neutral pH. Though pH has no
direct effect on human health, it shows close relations with
some other chemical constituents of water (Pitt et al. 1999).
Electrical conductivity (EC) values signify the amount
of total dissolved salts and indicate the inorganic pollution
strength of water. Water conductivity in the study area in
shallow and deep tube wells water sample was found to be
445.44 and 454.98 lS/cm, respectively (Table 2). EC
values of all the samples were bellowed the standard value
(1500 lS/cm) of WHO.
TDS of shallow and deep tube wells were 257.43 and
241.65 mg/L, respectively (Table 2). According to WHO
(2008), the maximum acceptable concentration of TDS in
groundwater for domestic purposes is 500 mg/L. All the
groundwater samples have TDS values well within the
permissible limit of WHO (2008). On the other hand, as per
the TDS classification (Fetter 1990), the collected all
groundwater samples belonged to fresh water
(TDS\ 1000 mg/L) categories.
Average total hardness was 304.23 and 302.281 mg/L
for shallow and deep tube wells, respectively (Table 2).
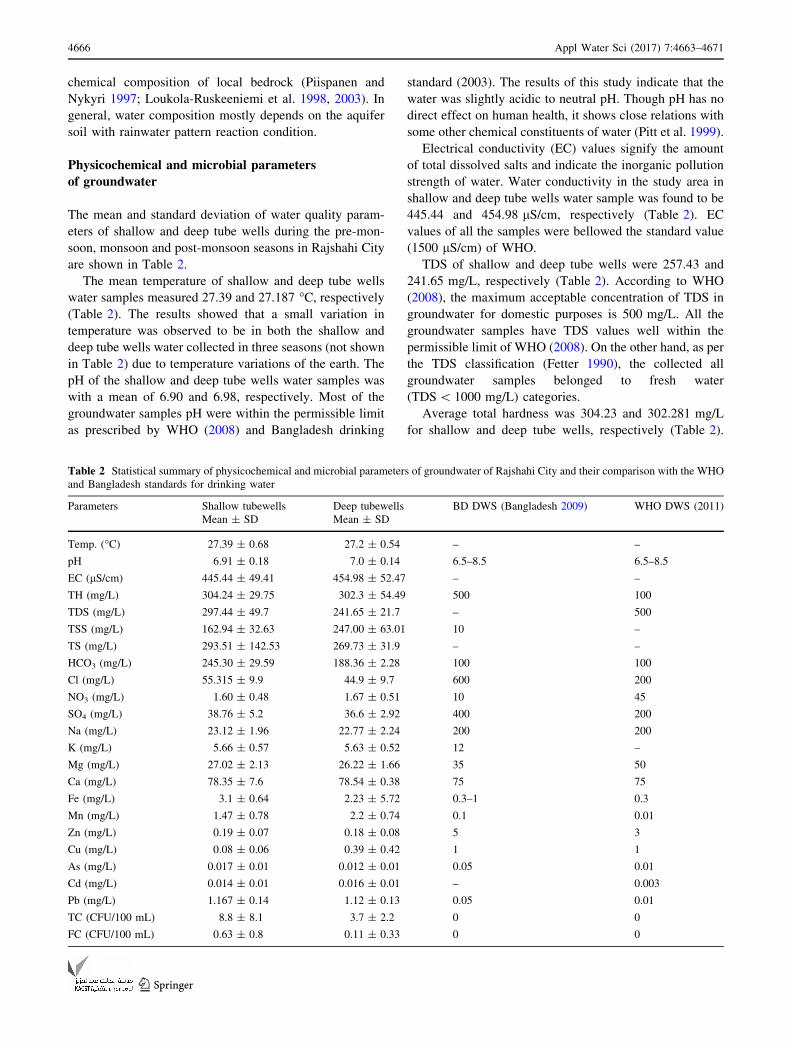
Table 2 Statistical summary of physicochemical and microbial parameters of groundwater of Rajshahi City and their comparison with the WHO
and Bangladesh standards for drinking water
Parameters Shallow tubewells Deep tubewells BD DWS (Bangladesh 2009) WHO DWS (2011)
Mean ± SD Mean ± SD
Temp. (�C) 27.39 ± 0.68 27.2 ± 0.54 – –
pH 6.91 ± 0.18 7.0 ± 0.14 6.5–8.5 6.5–8.5
EC (lS/cm) 445.44 ± 49.41 454.98 ± 52.47 – –
TH (mg/L) 304.24 ± 29.75 302.3 ± 54.49 500 100
TDS (mg/L) 297.44 ± 49.7 241.65 ± 21.7 – 500
TSS (mg/L) 162.94 ± 32.63 247.00 ± 63.01 10 –
TS (mg/L) 293.51 ± 142.53 269.73 ± 31.9 – –
HCO3 (mg/L) 245.30 ± 29.59 188.36 ± 2.28 100 100
Cl (mg/L) 55.315 ± 9.9 44.9 ± 9.7 600 200
NO3 (mg/L) 1.60 ± 0.48 1.67 ± 0.51 10 45
SO4 (mg/L) 38.76 ± 5.2 36.6 ± 2.92 400 200
Na (mg/L) 23.12 ± 1.96 22.77 ± 2.24 200 200
K (mg/L) 5.66 ± 0.57 5.63 ± 0.52 12 –
Mg (mg/L) 27.02 ± 2.13 26.22 ± 1.66 35 50
Ca (mg/L) 78.35 ± 7.6 78.54 ± 0.38 75 75
Fe (mg/L) 3.1 ± 0.64 2.23 ± 5.72 0.3–1 0.3
Mn (mg/L) 1.47 ± 0.78 2.2 ± 0.74 0.1 0.01
Zn (mg/L) 0.19 ± 0.07 0.18 ± 0.08 5 3
Cu (mg/L) 0.08 ± 0.06 0.39 ± 0.42 1 1
As (mg/L) 0.017 ± 0.01 0.012 ± 0.01 0.05 0.01
Cd (mg/L) 0.014 ± 0.01 0.016 ± 0.01 – 0.003
Pb (mg/L) 1.167 ± 0.14 1.12 ± 0.13 0.05 0.01
TC (CFU/100 mL) 8.8 ± 8.1 3.7 ± 2.2 0 0
FC (CFU/100 mL) 0.63 ± 0.8 0.11 ± 0.33 0 0
4666 Appl Water Sci (2017) 7:4663–4671
123

Dufor and Becker (1964) classification, about 93.6% of
samples belong to very hard type and the rest of hard type
water. The hardness of 150–300 mg/L and above may
cause kidney problems and kidney stone formation, as it
causes unpleasant taste and reduces the ability of soap to
produce lather (Jain 1998).
The concentration of bicarbonate in shallow and deep
tube wells was found with an average of 245.30 and
188.36 mg/L, respectively (Table 2). In general, HCO3-
has no adverse health effects on human health; even it
exceeds 300 mg/L in the drinking water. However, it
should not exceed 300 mg/L in the potable water, as it may
lead to kidney stones in the presence of the higher con-
centration of Ca, especially in dry climatic regions. The
elevated values suggest that the groundwater system was
open to soil CO2, resulting from the decay of organic
matter and root respiration, which in turn, combines with
rainwater to form bicarbonate (Matthess and Harvey 1982).
The chloride mean concentration was 55.315 and
44.901 mg/L, respectively for shallow and deep tube wells
(Table 2). It is the second most abundant element after
HCO3- ion. The concentration of Cl- in groundwater
samples from 17.43 to 111 mg/L (not shown in Table 2),
may be attributed to industrial, domestic wastes, poor
sanitary conditions, leaching from upper soil layers in dry
climates, natural geochemical activities.
The average concentrations of SO42- were found to be
38.75 and 36.60 mg/L for shallow and deep tube wells,
respectively (Table 2). The lower sulfate content indicates
that the study area was not an industrial city as the high
content of sulfate indicates anthropogenic sources and
industrial process, etc.
NO3– was present with a mean of 1.598 and 1.665 mg/L
for shallow and deep tube wells, respectively (Table 2).
The concentration of NO3– was found at a slightly higher
range in the deep tube wells compared to the shallow wells
and both were bellowed the guideline (WHO 2011). In
natural conditions, the concentration of NO3– does not
exceed 10 mg/L in the water (Cushing et al. 1973).
Another researcher, Chauhan et al. (2009) illustrated the
lower concentration of NO3–, indicates the lack of bacterial
mediated reactions in the study.
Major cations in groundwater
The mean concentration of Na? in the area was found with
an average of 23.11 and 22.76 mg/L for shallow and deep
tube wells, respectively (Table 2). There is no standard set
for sodium in water. However, USEPA (1994) has rec-
ommended that sodium levels in drinking water not exceed
20 milligrams per liter (mg/L). Groundwater of the area
was safe for drinking with reference to the mean concen-
tration of Na?. Tripathi et al. (2007) illustrated that the
Ganges alluvial sediments consist of feldspars in the range
from 6 to 12 at different locations along its course. The
results suggest that Na? was derived from weathering of
halite and feldspar rocks sources in this area.
The analysis results show that concentration of K? in
shallow and deep tube wells were found with a mean 5.66
and 5.626 mg/L, respectively (Table 2) and all samples
were within the permissible limit.
The analysis results show that Ca2? concentration of the
shallow and deep tube wells was with a mean of 78.35 and
78.54 mg/L, respectively (Table 2). Kozisek (2004) stated
that about 70% of groundwater samples exceeded the
maximum permissible limit (300 mg/L). The results illus-
trate that Mg2? concentration in the shallow and deep tube
wells water samples with a mean value were 27.02 and
26.22 mg/L, respectively (Table 2). All of the samples
were within the permissible limit for WHO (2011) and
Bangladesh standard.
Heavy metals in groundwater
The average iron concentration in the shallow and deep
tube wells of the area were 3.1 and 2.23 mg/L, respectively
(Table 2). Maximum samples contained high iron con-
centration than the permissible limit (0.3–1.0 mg/L) of
(Bangladesh Standard). The average iron concentration of
the groundwater (shallow and deep) samples was found to
be 2.66 mg/L, which was about 9 and 3 times higher than
the WHO and Bangladesh drinking water standard,
respectively. Hem (1991) illustrated that a high iron con-
centration in groundwater may be due to the presence of
iron minerals in the soils and/or weathered materials
favorable for reduction of ferric iron into ferrous iron in the
circulating groundwater. The higher presence of iron
drinking water causes harm and makes the teeth and nail
black, and weak, stickiness of hair.
The study results show that Mn concentrations of shal-
low and deep tube wells were found with a mean of 1.47
and 2.2 mg/L, respectively (Table 2). All the samples
exceed the permissible limit 0.10 mg/L for Bangladesh
Drinking Water Standard (BD DWS) and 0.01 mg/L for
WHO standard. Similar results were reported by the
National Hydro-geochemical Survey where the report
illustrated that three-quarters of the 3534 wells surveyed in
61 out of 64 districts exceeded the BD DWS (0.1 mg/L) for
Mn (BGS and WaterAid 2001). A report showed that Mn
produced a brownish color in laundered clothing, left black
particles on fixtures, and with iron affecting the taste of
beverages, including coffee and tea. High intakes of Mn
through both inhalational exposure and drinking water
have been shown to be toxic (IMFNB 2002).
Average concentrations of Pb in shallow and deep tube
wells water sample were 1.167 and 1.122 mg/L,
Appl Water Sci (2017) 7:4663–4671 4667
123

respectively (Table 2) which exceeds the permissible limit
(0.05 mg/L). An average of high Pb concentration was
found in aquifer soil samples indicating the reason of Pb in
shallow and deep tube wells water. The analysis results
illustrate that Pb presence in the groundwater of Rajshahi
City follows in the order: post-monsoon[monsoon[ pre-
monsoon season (not shown in Table). Pb ion is toxic and
also considered a probable human carcinogen. Thus, Pb
intake via drinking water involves a potential health hazard.
The concentrations of Zn, Cu and Cd in the shallow tube
wells water sample with a mean ionic concentration were
0.189, 0.076 and 0.013 mg/L, respectively. An average of
Zn, Cu and Cd in deep tube wells water sample was 0.176,
0.393 and 0.016 mg/L (Table 2). Zn, Cu and Cd concen-
trations were found to be low in three seasons and were not
exceeded the WHO and BD DWS due to low content of
these minerals in the aquifer soil in the area (data were not
shown in Table 2). The amount of highly toxic metals Cd
was found well below the prescribed limits for both types
of water samples.
AS concentration in the shallow and deep tube wells
water samples were with an average of 0.017 and
0.012 mg/L, respectively (Table 2). Most of the post-
monsoon water samples exceeded the WHO permissible
limits of 0.01 mg/L, and a few samples exceeded the
Bangladesh permissible limits of 0.05 mg/L. Acute expo-
sure of As can cause nausea, vomiting, diarrhea, muscle
cramps, salivation, sensory disturbances, liver injury, renal
failure and kidney disease. Ingesting arsenic increases the
risk of skin cancer and tumors of the bladder, kidney, liver
and lung (Smith et al. 1992). The study results showed that
the water quality of the deep tube wells was comparatively
better than that of the shallow tube wells suggesting for use
as drinking water in the study area.
Total coliform (TC) and fecal coliform (FC)
in groundwater
The total coliform (TC) bacteria were found with a mean of
8.8 ± 8.1 and 0.63 ± 0.8 CFU/100 mL for the shallow
and deep tube wells, respectively. Whereas the fecal col-
iform (FC) bacteria for both water was 3.7 ± 2.2 and
0.11 ± 0.33 CFU/100 mL, respectively (Table 2). Ele-
vated concentrations of TC were found in most of the
ground water samples, but few samples exceeded FC val-
ues for the WHO and Bangladesh drinking water standard.
Hydrogeochemical facies and water types
The piper diagram shows a graphical representation of the
concentrations of ions in a water sample and the separate
ternary plots shown the cations and anions (Piper 1944).
The major cations and anions were plotted in the two base
triangles of the Piper diagram, and they show the relative
concentrations of the major cations (Ca2?, Mg2?, Na? and
K?) and anions (HCO3-, Cl-, NO3
- and SO42-) (Piper
1944). The ternary anion diagram relating HCO3-, SO4
2-
and Cl- shows that most of the groundwater samples
contained a high amount of HCO3- and plotted points
cluster toward the alkalinity apex with secondary trended
toward Cl- and SO42-. The proportion of HCO3
- and
SO42- in the water reflected the relative dominance of the
two major sources of protons (carbonation and sulfide
oxidation) during chemical weathering. Pandey et al.
(2001) suggested that a carbonic acid weathering process
was the major proton producer in waters where a relatively
high ratio of HCO3-/(HCO3
- ? SO42-) was found. In this
study, the ratio of HCO3-/(HCO3
- ? SO42-) was very
high (0.94) which indicates that a mostly carbonic acid
weathering process involved in the groundwater geo-
chemistry. Therefore, most of the shallow and deep tube
wells water samples analyzed during the pre-monsoon,
monsoon and post-monsoon fall in the field of CaHCO3
type for in the quadrilateral diagram (Fig. 2).
Geo-chemistry of ground water
1. Groundwater geochemical processes
The abundance and distribution of elemental ions such as
Ca, Mg, Na, K, HCO3-, SO4
2- and Cl- in the water are
dependent on erosion and chemical weathering of the rocks
in the catchments or source area. Water soluble Na? and
K? ions are considered to be generated from weathering of
Feldspar and montmorillonite. The mineralogical origin in
the Ganges alluvium is the main reason for higher con-
centrations of the above cations in the groundwater (Vinod
2012). Moreover, several reports illustrated that cation
exchange processes and industrial activities also contribute
to high Ca, Mg, Na and K ions concentrations in the study
area (Naidu et al. 1985; Singh et al. 1997, 2006). On the
one hand, the silicate minerals that comprise most rocks
did not react readily with most groundwater. On the other
hand, carbonate minerals did react quite readily with water,
and they played an important role in the evolution of many
ground waters.
2. Carbonate weathering and dissolution
The study results illustrate that Ca and Mg ions were
dominant among the cations. Most of the samples found
below the ratio line 2 and above 1.5, indicating the pres-
ence of calcite weathering (Fig. 3) as stated by Maya and
Loucks (1995). Only a few samples that lie above the ratio
line 2 indicated the effect of silicate minerals. The study
results illustrate that the overall chemical composition of
4668 Appl Water Sci (2017) 7:4663–4671
123
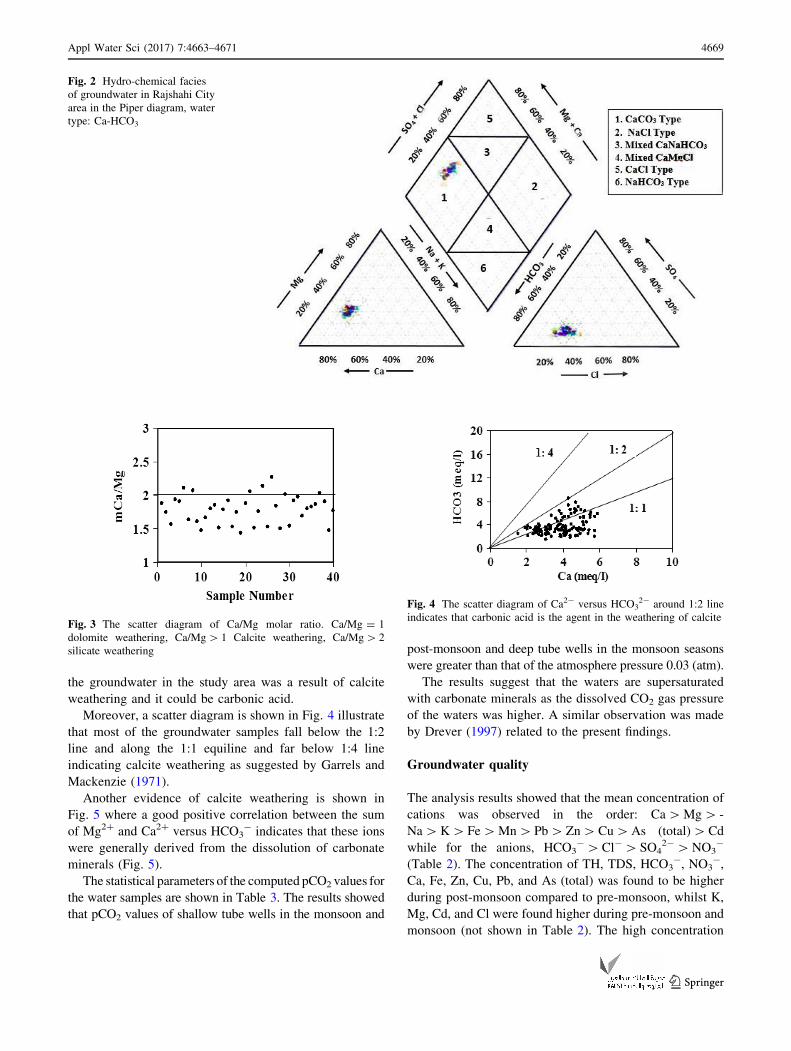
the groundwater in the study area was a result of calcite
weathering and it could be carbonic acid.
Moreover, a scatter diagram is shown in Fig. 4 illustrate
that most of the groundwater samples fall below the 1:2
line and along the 1:1 equiline and far below 1:4 line
indicating calcite weathering as suggested by Garrels and
Mackenzie (1971).
Another evidence of calcite weathering is shown in
Fig. 5 where a good positive correlation between the sum
of Mg2? and Ca2? versus HCO3- indicates that these ions
were generally derived from the dissolution of carbonate
minerals (Fig. 5).
The statistical parameters of the computed pCO2 values for
the water samples are shown in Table 3. The results showed
that pCO2 values of shallow tube wells in the monsoon and
post-monsoon and deep tube wells in the monsoon seasons
were greater than that of the atmosphere pressure 0.03 (atm).
The results suggest that the waters are supersaturated
with carbonate minerals as the dissolved CO2 gas pressure
of the waters was higher. A similar observation was made
by Drever (1997) related to the present findings.
Groundwater quality
The analysis results showed that the mean concentration of
cations was observed in the order: Ca[Mg[ -
Na[K[ Fe[Mn[Pb[Zn[Cu[As (total)[Cd
while for the anions, HCO3-[Cl-[ SO4
2-[NO3-
(Table 2). The concentration of TH, TDS, HCO3-, NO3
-,
Ca, Fe, Zn, Cu, Pb, and As (total) was found to be higher
during post-monsoon compared to pre-monsoon, whilst K,
Mg, Cd, and Cl were found higher during pre-monsoon and
monsoon (not shown in Table 2). The high concentration
Fig. 2 Hydro-chemical facies
of groundwater in Rajshahi City
area in the Piper diagram, water
type: Ca-HCO3
Fig. 3 The scatter diagram of Ca/Mg molar ratio. Ca/Mg = 1
dolomite weathering, Ca/Mg[ 1 Calcite weathering, Ca/Mg[ 2
silicate weathering
Fig. 4 The scatter diagram of Ca2- versus HCO32- around 1:2 line
indicates that carbonic acid is the agent in the weathering of calcite
Appl Water Sci (2017) 7:4663–4671 4669
123

of heavy metals in the water has a serious threat to human
health. An elevated level of Pb and Mn concentrations
were found in almost all of the analyzed samples indicating
unsuitability for drinking and cooking purposes.
Conclusions
The analysis results revealed that the groundwater of the
studied area was hard to very hard, slightly alkaline to
neutral pH in nature. The TDS falls under fresh water
categories. The HCO3- concentration exceeded the per-
missible limit. The concentration of Na, K, Mg, Cu, Zn
ions were below the detectable limit in most of the wells
samples but Ca, Fe, Mn, As, Pb ions exceeded the safe
limit. The major hydrochemical facies was a CaHCO3 type
identified using the Piper trilinear diagram. The analysis
results indicated that the carbonate weathering due to cal-
cite dissolution was the major geochemical process con-
tributing to the cations and anions of the aquifer water. The
concentration of calcium, iron, manganese, arsenic and
lead ions were found far above the permissible limit in
most of the shallow tube wells water samples. The analysis
results show that the mean concentration of cations and
anions followed the order: Ca[Mg[Na[K[Fe[Mn[ Pb[Zn[Cu[As (total)[Cd and
HCO3-[Cl-[ SO4
2-[NO3-, respectively. The con-
centration of most of the physic–chemical parameters was
found to be higher during the post-monsoon compared to
the pre-monsoon, whilst K, Mg, Cd, and Cl were found
higher during the pre-monsoon and monsoon. The con-
centration of physicochemical constituents in the water
samples were compared with the WHO and Bangladesh
Drinking Standards to know the drinking water suitability
of the study area. The study results revealed that the water
quality of the area was moderately contaminated with
heavy metals and is threatening human health. The overall
results of the study reveal that the groundwater was not
suitable for human consumption without adequate treat-
ment, especially for Pb, Mn and As to ensure the quality
required for safe drinking water.
Open Access This article is distributed under the terms of the Creative
Commons Attribution 4.0 International License (http://
creativecommons.org/licenses/by/4.0/), which permits unrestricted
use, distribution, and reproduction in any medium, provided you give
appropriate credit to the original author(s) and the source, provide a link
to the Creative Commons license, and indicate if changes were made.
References
Adams VD (1991) Water and Wastewater examination manual. Lewis
Publishers Inc, USA
Albarede F (2003) Geochemistry: an introduction. Cambridge
University Press, Cambridge, P.1. ISBN 0-521-81468-5
APHA (2005) Standard methods for the examination of water and
wastewater, 21st edn. American Public Health Association/
American Water Works Association/Water Environment Feder-
ation, Washington
Bangladesh (2009) Bangladesh National Drinking Water Quality
Survey of 2009. Bangladesh Bureau of Statistic, Planning
Division, Ministry of Planning, Government of Bangladesh.
Website: https://www.unicef.org/bangladesh/BNDWQS_2009_
web.pdf
Banglapedia (2006) National encyclopedia of Bangladesh. http://en.
wikipedia.org/wiki/Rajshahi. Accessed 25 May 2017
Fig. 5 Ca? Mg versus HCO3-
indicate these ions are generally
derived from the dissolution of
carbonate minerals
Table 3 Partial pressure of CO2 (determine by Aquachem Software)
PCO2 (atm) Shallow tubewells Deep tubewells Atmospheric CO2
Pre-monsoon Monsoon Post-monsoon Pre-monsoon Monsoon Post-monsoon
0.0112 0.05173 0.08655 0.0041 0.04581 0.013 0.03
4670 Appl Water Sci (2017) 7:4663–4671
123
BBS (Bangladesh Bureau of Statistics) (2005) Compendium of
environment statistics of Bangladesh. Government of the Peo-
ple’s Republic of Bangladesh, Dhaka
BGS and WaterAid (2001) Groundwater quality: Bangladesh. British
Geological Survey and WaterAid Bangladesh
Chauhan VS, Nickson RT, Chauhan D, Iyengar L, Sankararamakr-
ishnan N (2009) Ground water geochemistry of Ballia district,
Uttar Pradesh, India and mechanism of arsenic release. Chemo-
sphere 75(2009):83–91. doi:10.1016/j.chemosphere.2008.11.065
Cushing EM, Kantrowitz IH, Taylor KR (1973) Water resources of
the Delmarva Peninsular. US Geol Surv Prof Pap 822:58
Drever JI (1988) The geochemistry of natural waters, 2nd edn.
Prentice Hall Englewood Cliff, New York, p 437
Drever JI (1997) The geochemistry of natural waters, 2nd edn.
Prentice-Hill, New York, p 379
Dufor CN, Becker E (1964) Public water supplies of the 100 largest
cities in the US. Geol Surv Water Supply Pap 1812:364
Fetter CW (1990) Applied hydrogeology. Mirril Publ. Co., USA
Frengstad B, Banks D, Siewers U (2001) The chemistry of Norwegian
groundwater. IV. The pH-dependence of element concentrations in
crystalline bedrock groundwaters. Sci Total Environ 227:101–117
Garrels RM, Mackenzie FT (1971) Evolution of sedimentary rocks.
WW Norton, New York
Gupta S, Dandele PS, Verma MB, Maithani PB (2009) Geochemical
assessment of groundwater around Macherla-Karempudi area,
Guntur District, Andhra Pradesh. J Geol Soc India 73:202–212
Hem JD (1986) Study and interpretation of the chemical character-
istics of natural water: U.S. Geological Survey Water-Supply
Paper 2254, p 263
Hem JD (1991) Study and interpretation of the chemical character-
istics of natural waters, book 2254, 3rd edn. Scientific Publish-
ers, Jodhpur
IMFNB (Institute of Medicine Food and Nutrition Board) (2002)
Dietary reference intakes: vitamin A, vitamin K, arsenic, boron,
chromium, copper, iodine, iron, manganese, molybdenum,
nickel, silicon, vanadium and zinc. National Academy Press,
Washington
Jaime Garfias N, Arroyo R Aravena (2010) Hydrochemistry and
origins of mineralized waters in the Puebla aquifer system,
Mexico. Environ Earth Sci 59(8):1789–1805
Jain PK (1998) Hydrology and quality of groundwater around Hirapur
district—a case study of protozoic rocks. Pollut Res 17(1):91–94
Jalali M (2006) Chemical characteristics of groundwater in parts of
mountainous region, Alvand, Hamadan, Iran. Environ Geol
51:433–446
Johnson CC (1979) Land application of water-an accident waiting to
happen. Groundwater
Kozisek F (2004) Health risks from drinking demineralised water.
World Health Organization, Geneva, 2004. Available from:
http://www.who.int/water_sanitation_health/dwq/
nutrientschap12.pdf. Accessed 27 May 2017
Loukola-Ruskeeniemi K, Uutela A, Tenhola M, Paukola T (1998)
Environmental impact of metalliferous black shales at Talvi-
vaara in Finland, with indication of lake acidification 9000 years
ago. J Geochem Explor 64:395–407
Loukola-Ruskeeniemi K, Kantola M, Halonen T, Seppanen K,
Henttonen P, Kallio E (2003) Mercury bearing black shales
and human Hg intake in eastern Finland: impact and mecha-
nisms. Environ Geol 43:283–297
Matthess G, Harvey JC (1982) The properties of groundwater. Wiley,
New York
Maya AL, Loucks MD (1995) Solute and isotopic geochemistry and
groundwater flow in the Central Wasatch Range, Utah. J Hydrol
172:31–59
Naidu AS, Mowati TC, Somayajulu BL, Rao KS (1985) Character-
istics of clay minerals in the bed loads of major river of India.
Mitteilungen aus dem Geologische-Palaontologischen Instituts
der Universitat Hamburg 58:559–568
Nickson RT, McArthur JM, Shrestha B, Kyaw-Nyint TO, Lowry D
(2005) Arsenic and other drinking water quality issues, Muzaf-
fargarh District. Pak Appl Geochem pp 55–68
Pandey SK, Singh AK, Hasnain SI (2001) Hydrochemical character-
istics of melt water draining from Pindari glacier, Kumon
Himalaya. J Geol Soc India 57:519–527
Piispanen R, Nykyri T (1997) Acidification of groundwater in water-
filled gravel pits—a new environmental and geomedical threat.
Environ Geochem Health 19:111–126
Piper AM (1944) A graphic procedure in the geochemical interpre-
tation of water analyses. Trans Am Geophys Union 25:914–928
Pitt R, Clark S, Field R (1999) Groundwater contamination potential
from storm water infiltration practices. Urban Water 1:217–236
Sastri JCV (1994) Groundwater chemical quality in river basins,
hydrogeochemical modeling. Lecture notes-Refresher course,
School of Earth Sciences, Bharathidasan Univ., Tiruchirappalli,
Tamil Nadu, India
Singh M, Ansari AA, Muller G, Singh IB (1997) Heavy metals in the
freshly deposited sediments of the Gomati river (a tributary of
the Ganga river): effect of human activities. Environ Geol
29:246–252
Singh KP, Malik A, Mohan D, Singh VK, Sinha S (2006) Evaluation
of groundwater quality in Northern Indo-Gangetic alluvium
region. Environ Monit Assess 112:211–230
Singh VK, Bikundia DS, Sarswat A, Mohan D (2012) Groundwater
quality assessment in the village of Lutfullapur Nawada, Loni,
District Ghaziabad, Uttar Pradesh, India. Environ Monit Assess
184:4473–4488. doi:10.1007/s10661-011-2279-0
Smith AH, Hopenhayn-Rich C, Bates M, Goeden HM, Hertz-
Picciotto I, Duggan HM, Wood R, Kosnett MJ, Smith MT
(1992) Cancer risks from arsenic in drinking water. Environ
Health Perspect 97:259–267
Sreedevi PD (2004) Groundwater quality of Pageru River basin,
Cuddapah District, Andhra Pradesh. J Geol Soc India 64:619–636
Subba Rao N (2006) Seasonal variation of groundwater quality in a
part of Guntur district, Andhra Pradesh, India. J Environ Geol
49:413–429
Subba Rao N, Surya Rao P (2009) Major ion chemistry of
groundwater in a river basin: a study from India. Environ Earth
Sci 61(4):757–775
Tripathi JK, Ghazanfari P, Rajamani V, Tandon SK (2007) Geochem-
istry of sediments of the Ganges alluvial plains: evidence
of large-scale sediment recycling. Quatern Int 159:119–130
USEPA (1994) Healthy drinking waters. https://ag.umass.edu/sites/
ag.umass.edu/files/fact-sheets/pdf/sodium.pdf
WHO (2008) Guidelines for drinking-water quality, 3rd edn, Incor-
porating the First and Second, Addenda, Vol 1, Recommenda-
tions. Internet website: http://www.who.int/water_sanitation_
health/dwq/gdwq3rev/en/. Accessed 12 July 2011
WHO (2011) Guidelines for drinking-water quality, 4th Edition.
ISBN 978 92 4 154815 1. Website: http://apps.who.int/iris/
bitstream/10665/44584/1/9789241548151_eng.pdf
WHO, Regional Office for South-East Asia (2002) Country health
system profile: Bangladesh. Available from: http://www.who.int/
gho/countries/bgd/country_profiles/en/. Accessed 25, 27May 2017
Wikipedia (2015) Water supply and sanitation in Bangladesh.
Website: https://en.wikipedia.org/wiki/Water_supply_and_
sanitation_in_Bangladesh. Last access 27 May 2017
Publisher’s Note
Springer Nature remains neutral with regard to jurisdictional claims in
published maps and institutional affiliations.
Appl Water Sci (2017) 7:4663–4671 4671
123
Top Related