


Languages
Pages
Legal


ASSESSMENT OF COASTAL SCOUR OF SANDWIP CHANNEL FOR
DESIGN OF A JETTY
M. A. Matin1*
, M. Z. Abedin2 & A. N. Mowrin
3
1Department Water Resources Engineering, Bangladesh University of Engineering and Technology,
Dhaka, Bangladesh 2Department Civil Engineering, Bangladesh University of Engineering and Technology, Dhaka,
Bangladesh 3Department of Civil engineering, Stamford University, Bangladesh
*Corresponding Author: [email protected]
ABSTRACT
Hydrographic survey chart supplied by BIWTA has been utilized to assess the available navigable
draft in the vicinity of a proposed jetty location. It has been seen that the jetty end at distance 360 m
from the vicinity of existing shore line. According to the BIWTA hydrographic survey chart, the
depth range at the shore line is about 3.4 m to 3.7 m. However at the Jetty end the available low
water depth ranges from 4.7m to 5.25 m. The depths have been added to tidal range that found to
vary between 3.0 m to 5.0 m. Assessment of scour has been done using Herbich et al. method. Local
scour and total scour for various wave length and wave period have been computed. Variation of
dimensionless scour depth (Ds/H) for various dimensionless wave heights (Hs/H) has been generated.
It is seen that total scour depth (Ds) is much higher as compared to local scour for a given pile
diameter and bottom velocity. For BIWTA Jetty at Sandwip local the scour at pile of diameter 1.5 m
was found to be approximately5.22 m. Using the same method, the estimated total scour depth has
been calculated as 12 m.
Keywords: Coastal scour; hydrographic chart; Sandwip channel; total scour; jetty pile
INTRODUCTION
The characteristics of the coastal morphology of the study area might be better understood if the
morphological processes that govern the long-term natural and/or human induced changes at the
coastal part are known. Due to scarcity of historical geological and morphological data at the vicinity
of the project location, historical morphological changes have not always been analysed.
The subject of scour (and siltation) at coastal structures continues to receive much interest in the
consulting and research fields. Coastal structures can be categorized as having four functions, either
(1) to provide permanent protection against flooding (e.g. dykes and seawalls), (2) water level control
during storm surges (e.g. barriers) or (3) benefits in coastal management such as preventing shoreline
erosion (e.g. seawalls, breakwaters, groynes), or (4) for other industrial or economic functions such as
harbour breakwaters and jetties, outfalls/intakes, and wind farms. As such, the topic of scour at
coastal structures can be said to cover structures built on the shoreline as well as structures built in
tens of metres of water, and waves and currents operate in varying combinations and relative
magnitudes (Jiang, et al. 2004). In engineering projects scour needs to be considered in two phases,
the installation/construction phase and the operational phase. The limiting case for design may require
consideration of the erosion of seabed soils adjacent to the completed foundation. However, it is also
important to evaluate what kind of scour might develop during installation as it might have a direct
bearing on the stability of the structure that is being built, or on the construction methodology that is
adopted. In most of the cases, the main issue for design relates to the target scour development that
can be expected under design conditions, i.e. location, depth and extent, but knowing the time
development is also important in some cases. A general approach for assessing the mobility of the sea
bed soil at a structure was presented by Whitehouse (1998). This requires input data on waves,
currents and water depth (chart depth plus water level variation). These inputs may be determined
from modeling or analysis of field measurements made over a sufficiently long time, with analysis for
Proceedings of 3rd International Conference on Advances in Civil Engineering, 21-23 December 2016, CUET, Chittagong, Bangladesh Islam, Imam, Ali, Hoque, Rahman and Haque (eds.)
803
relevant return period conditions. The input data are combined at a point A to produce a set of robust
inputs and once combined with information on the soil characteristics obtained from the site
investigation they are analysed to provide information on the bed shear stress and the critical value of
bed shear stress for erosion of the soil. An experimental study on scour around a pile subject to
combined wave and current is given by Sumer and Fredsøe, (2001). Irregular waves were used in the
experiments carried out both for codirectional waves and for waves propagating perpendicular to the
current. The measured scour depth is plotted as a function of Ucw = Uc/(Uc + Um) in which Uc is the
undisturbed current velocity and Um is the maximum value of the undisturbed orbital velocity at the
sea bottom.
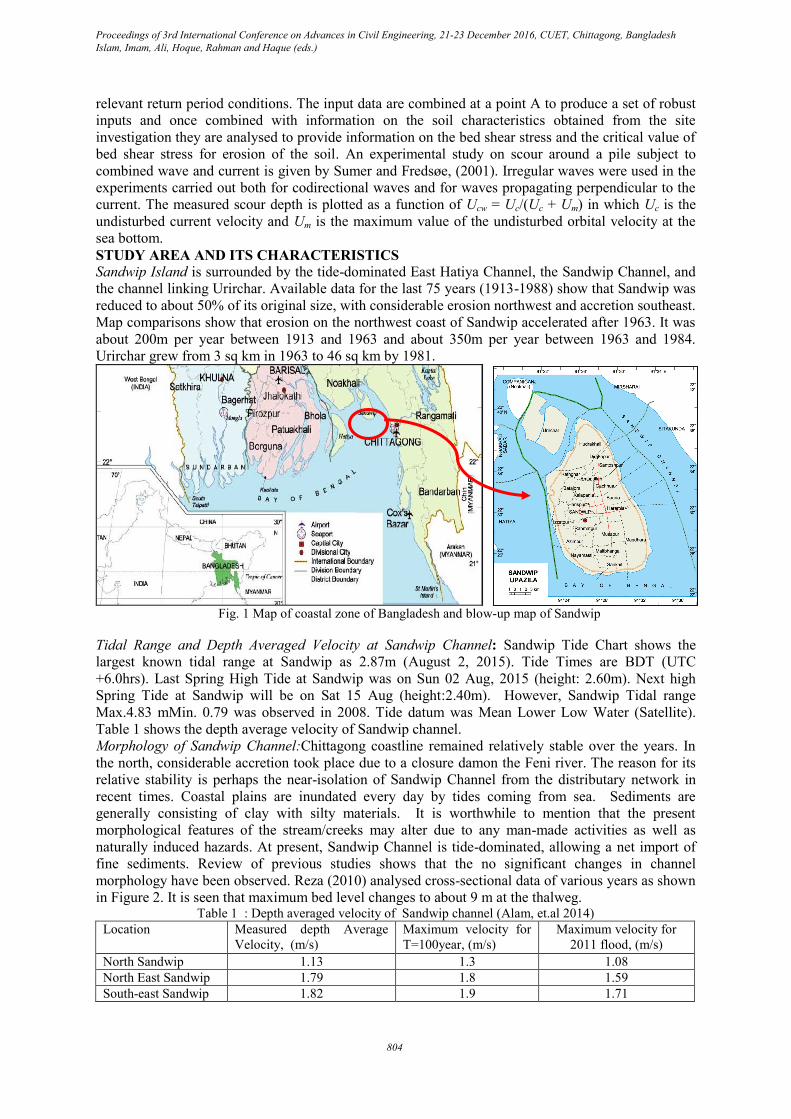
STUDY AREA AND ITS CHARACTERISTICS
Sandwip Island is surrounded by the tide-dominated East Hatiya Channel, the Sandwip Channel, and
the channel linking Urirchar. Available data for the last 75 years (1913-1988) show that Sandwip was
reduced to about 50% of its original size, with considerable erosion northwest and accretion southeast.
Map comparisons show that erosion on the northwest coast of Sandwip accelerated after 1963. It was
about 200m per year between 1913 and 1963 and about 350m per year between 1963 and 1984.
Urirchar grew from 3 sq km in 1963 to 46 sq km by 1981.
Fig. 1 Map of coastal zone of Bangladesh and blow-up map of Sandwip
Tidal Range and Depth Averaged Velocity at Sandwip Channel: Sandwip Tide Chart shows the
largest known tidal range at Sandwip as 2.87m (August 2, 2015). Tide Times are BDT (UTC
+6.0hrs). Last Spring High Tide at Sandwip was on Sun 02 Aug, 2015 (height: 2.60m). Next high
Spring Tide at Sandwip will be on Sat 15 Aug (height:2.40m). However, Sandwip Tidal range
Max.4.83 mMin. 0.79 was observed in 2008. Tide datum was Mean Lower Low Water (Satellite).
Table 1 shows the depth average velocity of Sandwip channel.
Morphology of Sandwip Channel:Chittagong coastline remained relatively stable over the years. In
the north, considerable accretion took place due to a closure damon the Feni river. The reason for its
relative stability is perhaps the near-isolation of Sandwip Channel from the distributary network in
recent times. Coastal plains are inundated every day by tides coming from sea. Sediments are
generally consisting of clay with silty materials. It is worthwhile to mention that the present
morphological features of the stream/creeks may alter due to any man-made activities as well as
naturally induced hazards. At present, Sandwip Channel is tide-dominated, allowing a net import of
fine sediments. Review of previous studies shows that the no significant changes in channel
morphology have been observed. Reza (2010) analysed cross-sectional data of various years as shown
in Figure 2. It is seen that maximum bed level changes to about 9 m at the thalweg. Table 1 : Depth averaged velocity of Sandwip channel (Alam, et.al 2014)
Location Measured depth Average
Velocity, (m/s)
Maximum velocity for
T=100year, (m/s)
Maximum velocity for
2011 flood, (m/s)
North Sandwip 1.13 1.3 1.08
North East Sandwip 1.79 1.8 1.59
South-east Sandwip 1.82 1.9 1.71
Proceedings of 3rd International Conference on Advances in Civil Engineering, 21-23 December 2016, CUET, Chittagong, Bangladesh Islam, Imam, Ali, Hoque, Rahman and Haque (eds.)
804

Fig. 2: Superimposed cross-sections of various years of Sandwip Channel
(source: Reza, 2010)
METHODOLOGY
Available formula for the computation of coastal scour has been analysed. As a thumb rule, local
scour around a pile has been estimated as 2 to 3 times of pile diameter. However, some formula
calculates the local scour due to current action and wave. Nearshore coastal piles are always
vulnerable to both wave and current action. For a more complete description of scour prediction
methods for scour at vertical piles can be found in Einstein and Weigel, (1970) and Herbich et al.
(1984). Based on test results from a laboratory study, they made tests run to examine effects of
waves, currents, and the combination of the two. Herbich et al. concluded that scour at the base of
vertical piles caused by wave action alone is insignificant when the piles are in relatively deeper
locations. They proposed a procedure consists of number of empirical (laboratory based) equationsto
estimateboth local and total scours. The procedure has been adopted for present scour calculation.
Hydraulic data used in this analysis were collected from secondary sources (Hydrographical data
collected from BIWTA). Field visit has also been made in September 2014to observe the tidal and
morphological characteristics at Sandip channel at the vicinity of proposed site whereBIWTA jetty
would be constructed. BIWTA constructed a landing Jetty at Swandip channel in early year 2000 to
facilitate inland passengers and cargoes and they cross the channel to Sandip headquarters from
Kumira (Shitakunda). Unfortunately this jetty has not been operational in last 15 years due to
considerable damage immediately after its construction. Reasons of such damage of jetty have not
been explored, but it can be anticipated that proper design and constructional procedure might not
been maintained. Some recent photographs (Photo:1 to Photo: 4) are shown to observe the condition
of the old jetty at Sandwip side.
Photo:1 Damaged BIWTA Jetty at Sandwip side at high tide
(September, 2014)
Photo: 2Ferry vessel of BIWTA has beenanchored
away from jetty at Sandwip (Sept. 2014)
Proceedings of 3rd International Conference on Advances in Civil Engineering, 21-23 December 2016, CUET, Chittagong, Bangladesh Islam, Imam, Ali, Hoque, Rahman and Haque (eds.)
805
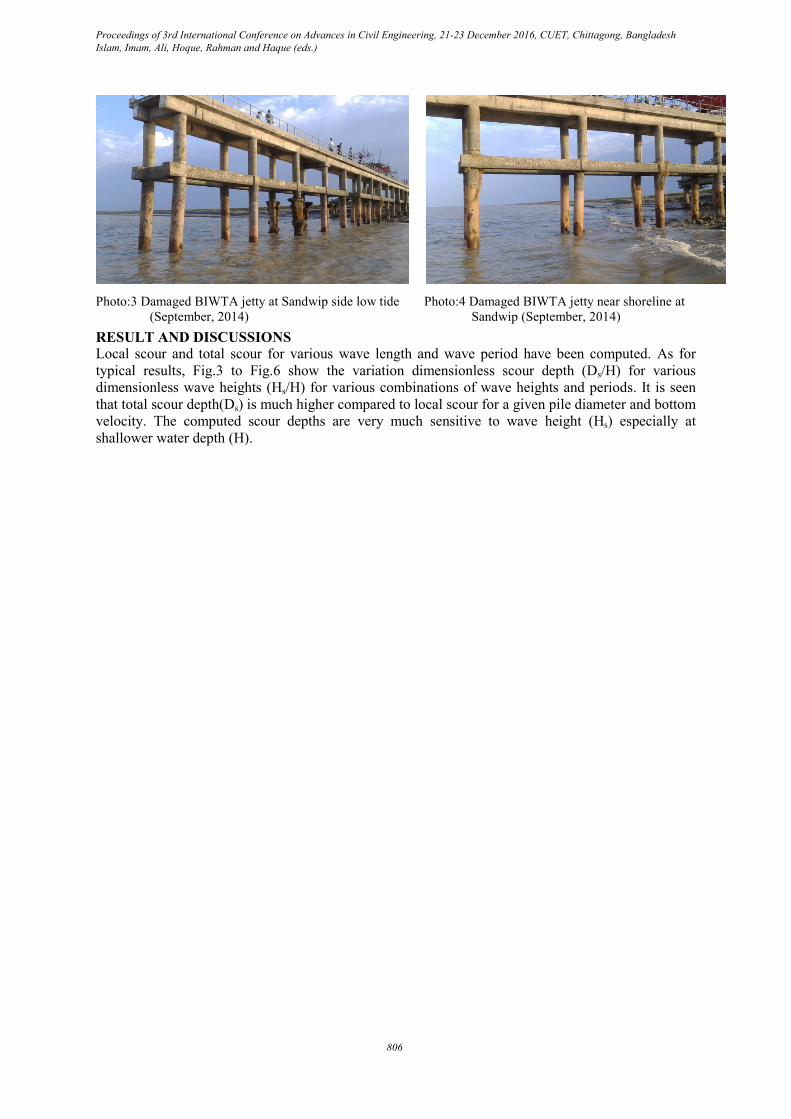
Photo:3 Damaged BIWTA jetty at Sandwip side low tide
(September, 2014)
Photo:4 Damaged BIWTA jetty near shoreline at
Sandwip (September, 2014)
RESULT AND DISCUSSIONS
Local scour and total scour for various wave length and wave period have been computed. As for
typical results, Fig.3 to Fig.6 show the variation dimensionless scour depth (Ds/H) for various
dimensionless wave heights (Hs/H) for various combinations of wave heights and periods. It is seen
that total scour depth(Ds) is much higher compared to local scour for a given pile diameter and bottom
velocity. The computed scour depths are very much sensitive to wave height (Hs) especially at
shallower water depth (H).
Proceedings of 3rd International Conference on Advances in Civil Engineering, 21-23 December 2016, CUET, Chittagong, Bangladesh Islam, Imam, Ali, Hoque, Rahman and Haque (eds.)
806

Fig. 3: Scour depths ratios ( Ds/H) Vs. (Hs/H) for
Hs=1m, T=1s
Fig. 4: Scour Depths ratios ( Ds/H) Vs. (Hs/H for
Hs=2m, T=2 s
Fig. 5: Scour depths ratios ( Ds/H) Vs. (Hs/H) for
Hs=3 m, T=3s
Fig. 6: Scour Depths ratios ( Ds/H) Vs. (Hs/H for
Hs=7m, T=3 s,
The hydraulic and bed material parameters provided in Table 2 have been used to estimate the bed
scour. The local scour at pile of diameter D= 1.5 m was found to be about Dsl=5.22 m. Using the same
method the estimated total scour depth has been calculated as Dst=12 m (BIWTA, 2016).
Table 2: Data used for scour calculation and scour values
Pile diameter (m) D= 1.5
Wave height (m) Hs= 2.0
Wave Period (s) T= 4.5
Depth (m) H= 8.0
Grain size (mm) Dg= 0.15
Rel. Density ∆ = 1.65
K. Viscosity(m2/s) ν = 0.0000011
Bottom vel.(m/s) vb= 0.67
Design scour depth curves for various input values such as, velocity, depth, pile size and bed material
size have also been generated for the users. In order to avoid any adverse effect in the vicinity of jetty
piles, regular monitoring of river bank and bed condition in the vicinity of the bridge site and around
the piers is recommended. A water level gauge should be installed with the jetty piles for regular
monitoring of water level at the jetty site. Regular monitoring of scour at the vicinity of piles and at
Proceedings of 3rd International Conference on Advances in Civil Engineering, 21-23 December 2016, CUET, Chittagong, Bangladesh Islam, Imam, Ali, Hoque, Rahman and Haque (eds.)
807
the piles is recommended so that any adverse scour can be monitored for emergency protective
measures.
CONCLUSIONS
Proper understanding of the coastal morphology and thus assessment of local scour for any
intervention of coastal line is vital importance. Design of coast line Jetty structures requires scour
depth for adequate pile length and size. In such cases, morpho-dynamics of the site need to be
assessed. It has been estimated that local scour in Sandwip channel for a near shore pile of 1.5 m
diameter is about 5.22 m. Using the same method the estimated total scour depth has been estimated
as12 m for the given pile size. Number of curves showing the scour depth for various input values can
also be generated for design purposes. Post-construction suggestions have to be made so that
countermeasure can be taken for any adverse impact on bed morphology.
ACKNOWLEDGMENTS
The authors are grateful to the BIWTA officials for providing the opportunity of the work, and for
supplying hydrographical data of Sandip channel at the vicinity of proposed Jetty area.
REFERENCES
Alam, R;Islam, MS; Hasib, MR and Khan. MZH. 2014. Characteristics of Hydrodynamic Processes
in the Meghna Estuary due to Dynamic Whirl Action, International organization of Scientific
Research, 4(6) 39-50
BIWTA. 2016. Design of proposed BIWTA Jetty at Sandip, Final design Report, April. BUET, 2016
Einstein, H. A., and Wiegel, R. L. 1970 (Feb). "A Literature Review on Erosion and Deposition
of Sediment Near Structures in the Ocean (U)," Final Report HEL-21-6, US Naval Civil
Engineering Laboratory, Port Hueneme, CA.
Herbich, John B;Schiller, Robert E; Jr., Dunlap;Wayne A and Watanabe, Ronald K.1984. Seafloor
Scour; Design Guidelines for Ocean-Founded Structures," Marine Technology Society.
Reza, I. 2010. An Assessment of water level and bed level change of Lower Meghna, M. Engg. Thesis,
Dept. of WRE, BUET, September. 2010, p. 178,
Sumer, B. and Fredsøe, J. 2001. Scour around Pile in Combined Waves and Current. J. Hydraul. Eng.,
10.1061/(ASCE)0733-9429(2001)127:5(403), 403-411.
Jiang, J, Ganju, NK and Mehta, AJ. 2004. Estimation of contraction scour in riverbed using SERF.
Journal of Waterway, Port, Coastal, and Ocean Engineering, 130, 215-218.
Whitehouse, RJS. 1998. Scour at Marine Structures. Thomas Telford. 216 pp.
Proceedings of 3rd International Conference on Advances in Civil Engineering, 21-23 December 2016, CUET, Chittagong, Bangladesh Islam, Imam, Ali, Hoque, Rahman and Haque (eds.)
808
Top Related