


Languages
Pages
Legal

Policy Research Working Paper 6211
Assessing the Investment Climate for Climate Investments
A Comparative Framework for Clean Energy Investments in South Asia in a Global Context
Muthukumara Mani
The World BankSouth Asia RegionDisaster Risk Management and Climate ChangeSeptember 2012
WPS6211P
ublic
Dis
clos
ure
Aut
horiz
edP
ublic
Dis
clos
ure
Aut
horiz
edP
ublic
Dis
clos
ure
Aut
horiz
edP
ublic
Dis
clos
ure
Aut
horiz
ed

Produced by the Research Support Team
Abstract
The Policy Research Working Paper Series disseminates the findings of work in progress to encourage the exchange of ideas about development issues. An objective of the series is to get the findings out quickly, even if the presentations are less than fully polished. The papers carry the names of the authors and should be cited accordingly. The findings, interpretations, and conclusions expressed in this paper are entirely those of the authors. They do not necessarily represent the views of the International Bank for Reconstruction and Development/World Bank and its affiliated organizations, or those of the Executive Directors of the World Bank or the governments they represent.
Policy Research Working Paper 6211
One of the strong messages that came out of the recent United Nations Climate Change conference in Durban was that the private sector has to play an important role if we are to globally move toward a low carbon, climate resilient—or “climate compatible”—future. However, private investment will only flow at the scale and pace necessary if it is supported by clear, credible, and long-term policy frameworks that shift the risk-reward balance in favor of less carbon-intensive investment. The private sector also needs information on where to invest in clean energy in emerging markets, and it needs policy support to lower investment risk. Barriers to low carbon investments often include unclear and inconsistent energy policies, monopoly structures for existing producers,
This paper is a product of the Disaster Risk Management and Climate Change, South Asia Region. It is part of a larger effort by the World Bank to provide open access to its research and make a contribution to development policy discussions around the world. Policy Research Working Papers are also posted on the Web at http://econ.worldbank.org. The author may be contacted at [email protected].
stronger incentives for conventional energy than clean energy, and a domestic financial sector not experienced in new technologies. With the long-term goal of promoting and accelerating the implementation of climate mitigation technologies, this study aims to facilitate development of a policy framework for promoting sustainable investment climates for clean energy investments in South Asia and elsewhere. A key aspect of the study is also the pilot construction of the Climate Investment Readiness Index for several countries. The index is a tool to objectively evaluate the enabling environment for supporting private sector investment in select climate mitigation or low carbon technologies.

Assessing the Investment Climate for Climate Investments
A Comparative Framework for Clean Energy Investments in South Asia in a Global
Context
Muthukumara S. Mani12
Key Words: Climate Change, Renewable Energy, Energy Efficiency, Investment Climate,
South Asia
Sector Boards: Environment, Energy
JEL Codes: Q43, Q48, Q54
1 Senior Environmental Economist, Disaster Risk Management and Climate Change, South Asia Sustainable
Development Department. I would like to thank Mahesh Sugathan, R.V. Anuradha and Narasimhan Santhanam for
their contributions and Vivien Foster, Kirk Hamilton, Sudeshna Ghosh Banerjee and Maria Vagliasindi for their
excellent comments and suggestions. This paper is a summary of a broader study undertaken by the South Asia
Sustainable Development Department on ―Assessing Investment Climate for Climate Investments: A Comparative
Clean Energy Framework for South Asia in a global Context,‖ that will be disseminated separately. The financial
support of USAID is gratefully acknowledged.
2 The author can be contacted at [email protected], World Bank-SASDC.

2
Assessing the Investment Climate for Climate Investments
A Comparative Framework for Clean Energy Investments in South Asia in a Global
Context
1. Introduction
Climate risk management is fundamental for preserving and enhancing development progress in many
developing countries. Successful mitigation efforts by the global community will reduce the burden of
adaptation. At the same time, adaptation to aggravating climate risks, and low-carbon growth options, are
often directly linked to national development priorities such as energy efficiency (EE), renewable energy
(RE), sustainable livelihoods, and environmental protection; as well as to business opportunities such as
strengthening the resilience of infrastructure to climate variability.
The South Asia Region (SAR) is highly vulnerable to climate change, due in large part to the highest
absolute number of people at risk and the highest incidence of poverty in the world. Climate threats are
made all the more severe by a degrading resource base (e.g., damaged and depleted aquifers, degrading
forests and soils). While vulnerability to climate change is high, the region has also recently emerged as a
contributor to greenhouse gas emissions. Increased energy consumption, fueled by a relatively high
economic growth, has been accompanied by rising greenhouse gas emissions (GHG). On average,
emissions have risen at about 3.3 percent annually in the region since 1990 – more rapidly than in any
other region except the Middle East.
With economic growth a priority in all SAR countries, climate action can result in multiple commercial,
developmental, and environmental benefits. Lessons from the Clean Energy Investment Framework and
many longstanding World Bank and International Finance Corporation (IFC) engagements show that the
best entry points for client dialogue and program development on climate change arise from the synergies
between development progress and opportunities to invest in EE, renewable energy, and other low-carbon
projects. The scope for cost-effective, pro-development investments in EE and, increasingly, RE—
especially against the background of impending energy crisis—is particularly broad. The Government of
India, for example, is beginning to shift its economic growth strategy to include technology and
management options that will reduce GHG generation while maintaining social and economic
development objectives.
The magnitude of the resources needed to finance access to and implementation of environmentally sound
technologies and processes, is such that the bulk must be provided through private sources, with donors
and the public sector serving in a catalytic and/or facilitating role. The success of these efforts is highly
dependent on countries establishing an enabling environment for private sector investment in climate-
friendly technologies and services, and on the development of endogenous capacities to adopt, operate,
and maintain these technologies. The private sector will be a key driver of the transition to climate-
friendly technologies; and both foreign and domestic investors will base their decisions on their
assessment of how risky or difficult it will be to make an investment in a given country using a given
technology, and how these risks or difficulties will add to their costs.

3
2. Barriers to Clean Energy Investments
Generic Investment Barriers
One overarching challenge to attracting private investment in clean technologies is a strong and
believable government commitment to changing the trajectory of carbon emissions. Investors also look
for political and macroeconomic stability, an educated workforce, adequate infrastructure (transportation,
communications, energy), a functioning bureaucracy, rule of law, and a strong financial sector (Cosbey
(2008)). Investors also need ready markets for their products and services. If a country restricts foreign
investment in its power sector, this will likely affect investments in renewable power generation as well.
General economic and trade openness is also important to clean technology investors, who may depend,
like investors in many other sectors, on supply chains for goods and services that are globally dispersed.
Enabling power producers to access goods and services rapidly, at world market prices, will have an
impact on the costs of investment and ultimately on energy costs. A World Bank study (World Bank,
2008) suggests that liberalizing trade can significantly increase the diffusion of clean technologies in
developing countries.
While liberalization policies may help in gaining access to international technology, the success of
technology diffusion in general depends on a range of other enabling factors, particularly the capacity to
absorb and improve technologies in the host countries. Trade facilitation measures that help speed up the
movement of goods at customs will also favorably impact the clean energy sectors. The presence of
sound policies and institutions to promote competition and curb anti-competitive practices, while
beneficial to private investment in general, particularly benefit renewable energy investors, as access to
networks and the degree of buying power exercised by utilities are important for grid-connected power.
Annex I presents some of the key technical and economic drivers of and constraints to private sector
investment in the solar, wind, biomass, and small hydro sectors, based on worldwide experience.
Clean Energy-specific Investment Barriers
There are also a number of barriers specific to clean energy investment. These may include market
conditions such as prices for electricity and fossil fuels, or the presence of carbon and energy-related
taxes. Market failure both in the innovation as well as diffusion sides to development, deployment and
diffusion have been well-documented (See for instance Mallett, Sheridan and Sorrell,S.(2010), Barton
(2007) and Kofoed-Wiuff, Sandholt and Marcus-Møller,C (2006)). Countries with binding GHG
emissions targets and norms may provide a more favorable and predictable investment environment for
RE and EE, as both will be required to meet emissions-related targets, particularly in rapidly growing
economies.
However, a recent World Bank study (Avato and Coony, 2009) suggests renewed efforts in this area may
face significant barriers that impact the ability to develop and deploy promising clean energy options such
as (a) uncertain future value of CO2 emissions abatement; (b) provision of a public good being hampered
by free-riding across space—countries that free-ride on the mitigation efforts of others; (c) the ―Valley of
Death,‖ phenomenon which occurs when promising technologies languish between public and private
sector research, development and demonstration (RD&D) efforts in innovation; (d) intellectual property

4
rights (IPRs) issues where the large RD&D investments needed for technical advances in certain clean
energy technologies will be undermined by uncertain global IPR protection; (e) subsidies for conventional
energy products at both the retail and production levels reduce to below-cost the price with which new
energy technologies must compete; and (f) deployment of clean energy and energy efficient technologies
is often hampered by trade barriers.
The types of such barriers will differ from country to country, a function of the many factors that shape
national energy policies, including history, politics, and geography. The opportunities and obstacles will
also vary significantly from country to country, and diagnostic studies could help to identify the full range
of potential actions that are needed to help make clean energy investment more attractive to both domestic
and foreign investors (Figure 1 provides an illustration of differences between generic investments
barriers and those that are more specific to climate investments).
With the long-term goal of promoting and accelerating the implementation of climate mitigation
technologies, this study aims to facilitate development of a policy framework for promoting sustainable
investment climates for climate friendly investments in South Asia and elsewhere. The objective is
twofold:
Systematic evaluation and comparison of the enabling environments in SAR countries for
supporting private sector investment in climate mitigation technologies.3
Creation of a climate investment readiness index (CIRI) for South Asian countries and
comparison with other countries globally. CIRI is an attempt to benchmark countries in terms of
their preparedness and maturity to move into the arena of climate-friendly investments. The CIRI
goes beyond the more country-focused investment climate assessments and first such initiative
that covers both renewable energy as well as energy efficiency.4
While the opportunities and obstacles will vary significantly from country to country, the new policy
framework and CIRI will help country-level policymakers to identify the full range of actions needed to
make clean energy investment more attractive to both domestic and foreign investors.
The index will also help these policymakers understand the institutional, regulatory, and legislative
systems that need strengthening; how deficiencies in these systems may impede the flow of private
investment in climate-friendly technologies; and the potential impact of various actions. The index will
also aid countries in assessing their progress toward a low-energy/carbon growth path, and inform
assistance and cooperative efforts.
3 While a number of other sectors such as transportation, agriculture, and forestry are also crucial from the
perspective of attracting climate-friendly investments, the study focuses on the RE and EE sectors, because these are
the sectors where private sector investment activity is particularly strong. Further investments in these sectors could
also improve the investment climate for, e.g., clean transportation technologies such as electric vehicles.
4 There are other similar initiatives underway that attempt to capture/benchmark countries progress towards climate
mitigation or clean energy policies and measures. Notable among them are IADB/Bloomberg‘s ClimateScope,
American Council for an Energy-Efficient Economy (ACEE) report ranking countries on energy efficiency and
World Energy Congress (WEC) Energy Policy Index, and EBRD‘s CLIM Index.

5
Figure 1. Determinants of Climate Investments (Renewable Power and Energy Efficiency) vs. Other
Investments
GENERIC DETERMINANTS
Climate Investments Power Investments Other Investments
Overall Political and Macroeconomic Variables
Political and macroeconomic stability; Availability and quality of infrastructure; Ready markets and availability
of skilled labor; Pro-competition regulation; Coordinated and streamlined licensing and permitting; Ease of
entry and exit; Generally applicable tax holidays and incentives.
Electricity and Energy Market Variables
Electricity market prices; provisions that allow entry of IPPs; Un-
bundling of transmission and distribution functions; Clear and
transparent rules for grid access; Provisions to facilitate grid access;
Ability to sell to more than one buyer (open access); Markets for
power trading.
Energy-related Environmental Regulation
Energy taxes on fossil-fuels; CO2 tax; Binding GHG emission targets.
PRIs specific to renewable
energy and energy efficiency
(including to reduce revenue
and cost risk): RE targets, Feed-
in tariffs, RPOs, Energy-efficiency
standards, RE tax and fiscal
incentives and subsidies.
Facilitating operations in RE
and EE project cycle (speedy
and streamlined): Procedures
and agencies required for
clearances, access to finance.

6
Further, the quantitative data and benchmarking provided by the index can help to stimulate policy
debate, by exposing potential challenges and identifying where policymakers might look for lessons and
good practices. These data also could provide a basis for analyzing how different policy approaches and
reforms could contribute to broader desired outcomes in addition to climate mitigation, such as
competitiveness, growth, and greater employment and incomes.
The framework for promoting climate investment will:
1. provide valuable information to help guide and target private sector investment in clean energy
and energy efficiency in developing countries;
2. help developing country policymakers to better understand the key elements of their enabling
environments, as well as barriers to investment that need to be addressed.
The study lays out the findings for SAR—India, Pakistan, Sri Lanka, Bangladesh, Nepal, and Maldives—
including a review of the policy landscape (policies, regulations, and incentives) for renewable energy
and energy efficiency in the countries as well as key issues and challenges highlighted during the
consultations with private sector actors in the region. CIRI index scores for select South Asian countries,
based on the presence or absence of these policies, regulations and incentives, are then compared with
index scores for a mix of countries in Asia, Africa and Latin America. The comparison includes both
high GHG-emitting countries and those that have proactively introduced policies, regulations and
incentives for renewable energy and energy efficiency.
3. An Overview of Policy, Regulatory and Institutional Frameworks
and Private Perceptions for Climate Investments in South Asia
The presence of a sound institutional and regulatory framework is a basic prerequisite for countries
wishing to attract investment in RE. The lack of a level competitive playing field for private investment
in sustainable energy typically implies that governments will need to intervene by means of sustainable
energy policies, including financial incentives. Policies that help lower the cost for RE (including the cost
of grid-related equipment and associated technologies) will increase the possibilities for scaling up
deployment of sustainable energy. Similarly regulations, standards, and incentives that promote greater
diffusion of energy-efficient products and construction practices in buildings will encourage greater
deployment of energy-efficient products.
Comprehensive RE and EE regulatory frameworks are relatively new developments in the South Asian
context, although there may have been specific policies and incentives governing individual sectors (such
as wind in India since the mid-1980s). Their relatively recent introduction means that their implications
for attracting investment will take some time to be understood. A number of laws and regulations also
exist in draft form or are pending approval before the cabinet or parliament, particularly in Pakistan,
Bangladesh, Nepal and Maldives, and further policies, regulations and incentives can be expected to
evolve. Box 1 gives an overview of existing policies, regulations, incentives and institutions.

7
Box 1: An Overview of Policies, Regulations, Incentives and Institutions
Policies , Regulations
and Incentives
India has the largest number of national-level policies, regulations and
incentives, covering all key RE sectors as well as EE. There are also a large
number of state-level schemes. India uses sophisticated policy instruments
such as RPOs and RECs for renewable energy; as well as a proposed market-
based mechanism, a perform, achieve, and trade (PAT) scheme for EE.
Pakistan has prescribed preferential tariffs for wind power, co-generation and
small hydro projects, but not for solar or grid-connected biomass.
Sri Lanka has preferential tariffs for for electricity produced from mini-
hydro, wind, biomass (dendro ), biomass (agriculture and industrial waste),
municipal waste, and waste heat recovery; however, the country as yet has no
such tariffs for solar production.
Bangladesh, Nepal and Maldives still do not have specific legislation for
either grid-connected RE or EE.
Institutions (for RE) India has a dedicated Ministry for New and Renewable Energy (MNRE).
The Indian Renewable Energy Development Agency (IREDA) is the
financing arm of the MNRE, which secures funds to be provided as grants or
loans to end-users, manufacturers and entrepreneurs. Apart from MNRE,
other significant institutions include central and state electricity regulatory
commissions, which are responsible for tariff setting, sale and distribution of
electricity; National Load Dispatch Centres at the central level; state agencies
to regulate RECs; and power exchanges where these certificates are traded.
Pakistan’s Alternative Energy Development Board (AEDB), under the
Ministry of Water and Power, plays a similar role in RE development. The
other key RE institution is the National Electric Power Regulatory Authority
(NEPRA). Additionally, Pakistan has state-level agencies that support
implementation of RE policies either on their own or in collaboration with
AEDB. The Water and Power Development Authority (WAPDA) is in
charge of hydro power development.
Sri Lanka Sustainable Energy Authority (SLSEA), established pursuant to
the Sri Lanka Sustainable Energy Authority Act of 2007, functions as a part
of the Ministry of Power and Environment. It has the authority to issue
permits for on-grid and off-grid RE projects for the generation and supply of
power. The Public Utilities Commission of Sri Lanka (PUCSL) was
established by Act No. 35 of 2002 as a multi-sector regulator of certain
physical infrastructure industries in the country, and plays a key role in RE
development in Sri Lanka. The Ceylon Electricity Board (CEB) also plays an
important role, as the entity that enters into power purchase agreements with

8
RE developers.
In Bangladesh, Nepal and Maldives units or departments dedicated to RE
policymaking or financing are still in the process of being established.
Bangladesh Power Development Board (BPDB), however, has been playing a
significant role in the commissioning of RE projects in the wind and solar
sectors. Also, the Infrastructure Development Company Limited (IDCOL),
licensed as a non-banking financial institution, has played a significant role in
bridging the financing gap for medium and large-scale infrastructure and RE
projects
Institutions (for EE) India’s EE efforts are coordinate by the Bureau of Energy Efficiency (BEE).
Pakistan’s National Energy Conservation Centre (ENERCON) is responsible
for EE.
In Sri Lanka, EE efforts are headed by the Sri Lanka Sustainable Energy
Authority.
Bangladesh, Nepal and Maldives have no specific institutions to administer
EE initiatives. In Bangladesh, the Power Division, Ministry of Power, Energy
and Mineral Resources and Bangladesh Power Development Board (BPDB)
have been undertaking a series of measures designed to improve EE. In
Maldives, the draft Maldives Energy Bill 2010 proposes to establish a
National Energy Efficiency Division within the Energy Department for
promotion of EE measures.
Private Sector Perceptions of the Existing Policy, Regulatory and Incentive
Framework in South Asia
The existence of regulatory frameworks and incentives for RE and EE may not, by itself, lead to
perceptions of an attractive investment climate. In addition to broader macroeconomic variables such as
infrastructure, the availability of skilled labor, and market size, the effective implementation of existing
laws and regulations is also important. Regardless of what exists on paper, investors need to get a sense
from those actually involved in the business of producing and selling renewable power about the issues
and challenges they face in a country.
Outlined below are the results from consultations held with private sector stakeholders—firms active in
RE generation; select vertically integrated firms active in both power generation and manufacturing; and
manufacturers and distributors of RE equipment—in India, Pakistan, Bangladesh and Sri Lanka. Due to
time constraints and the diversity of the sector, similar consultations were not carried out with distributors
of EE equipment; this could be done as part of a future study.

9
Cross-cutting factors The consultations revealed a broad range of critical factors—the ―ten Cs‖—that investors see as critical
for doing climate business in every country. These are described below. Country-specific issues and
challenges revealed by the consultations are discussed in the following section.
Clarity and Coherence. Policies/laws on clean energy should be very clear and transparent
as well as coherent. They should send a strong signal about the country‘s intention to move
toward cleaner/low carbon energy options.
Consistency. Policies have to be consistently implemented across sectors and regions of a
country. In a federal structure, for example, the national standard should guarantee a
minimum level of RE development, with states being allowed to set more aggressive targets
if needed.
Commitment and Credibility. For policies to be credible, governments should signal a
long- term commitment to the RE sector, backed by a comprehensive and transparent
regulatory and tariff structure.
Clearances. Investors are often discouraged by the number of clearances required to set up,
for example, a wind or solar farm. The approval process can be eased considerably by setting
up a single-window clearance system or a no-objection based approval process for specific
sectors.5
Capacity. As countries ambitiously expand their clean energy portfolios, the capacity of
agencies should be enhanced to ensure compliance with targets, policies and regulations.
Compliance. Investors often are concerned about utilites‘ commitment to comply with PPAs.
It is therefore important to establish transparent cost recovery rules and prudency tests for
utility compliance with policies and contractual arrangements. It also necessary to ensure
utilities‘ compliance with any obligations they may have to purchase RE or RE certificates.
Coordination. Coordination across the multitude of agencies involved in the clean energy
sector (regulatory agencies, implementing agencies, utilities, distribution companies, etc.) is
critical to ensure that clean energy policies are implemented consistently and efficiently.
Collateral. Banks are often reluctant to finance clean energy projects because of concerns
about the bankability of the PPAs, which are often related to utilities‘ compliance. Until
clean energy becomes as competitive as conventional energy, countries should consider
specialized vehicles or institutions that could ensure adequate clean energy financing and
help to mitigate risk.
Connectivity. Access to the grid is an important criterion for investment in the renewable
energy sector. Investors look for transparent rules, procedures and standards for grid
connectivity for the energy they produce.
Cartography. Since the quality and availability of RE (wind, solar, hydro, biomass) varies
across locations, the accurate mapping of potential sites will have a bearing on returns to
investment.
5 . Such a process would require officials to explicitly reject an application and provide written explanations for the
reasons they did so; unless rejected, an application would automatically be considered approved. (See Unleashing
the Potential of Renewable Energy in India, South Asia Energy Unit Sustainable Development Department and
ESMAPThe World Bank, 2010.)

10
Country-specific factors
Many of the country-specific issues that emerged from the consultations can also be categorized under the
ten Cs.
India
Attractive project financing options and terms and conditions are required. The availability of finance
emerged as an important issue in India. Smaller firms pointed to difficulties obtaining project-specific
financing, while larger firms had the option of using balance-sheet financing (owing to their large capital
base or assets held in non-RE related sectors). According to some firm representatives, rates of interest
and loan tenures (both important determinants of a project‘s IRR), could be better. Given that most RE
costs are upfront costs, the availability of financing mechanisms and options, including direct subsidies
and grants that could alleviate such costs, are seen as desirable. Also mentioned was the need to make the
Clean Development Mechanism more easily accessible and less administratively cumbersome.
A federal system of governance creates opportunities as well as challenges. Solar PV firms pointed to
the diversity of taxes on solar equipment from state to state, some of which were considered burdensome.
State-level enforcement of RPOs was also an issue, as were timely payments by state electricity boards.
On the other hand, federalism has helped create space for regulatory autonomy, which has enabled some
states to move faster than others in terms of providing investors with access to land and clearances. The
states of Rajasthan and Gujarat in India were noted for their efforts to facilitate investments in solar
energy while the state of Himachal Pradesh was noted for its support of small hydro.
Access to both data and grids is vital. Renewable power firms require access to grids to enable easy
evacuation of power generated from all renewable sources. A clear and predictable policy regarding grid
access was seen as essential if firms are to meet their responsibilities to construct and maintain such
facilities, as well as negotiate rights of way for transmission lines with third parties, when required. For
wind and solar, access to reliable data on wind speeds and solar radiation would enable firms to select
locations that provide maximum return on investment. Such data would also enable investors to more
accurately estimate revenue streams, which is essential for obtaining project financing from commercial
banks.
Technology costs are important, but so is performance. Power generation firms place a great deal of
importance on cost-effective technology, whether domestically produced or imported. They also
emphasize the need for stable and durable performance—a factor that is vital to calculating revenue
streams and to winning the confidence of commercial banks still unsure about renewable technologies
(primarily solar), which have not been widely tested under Indian conditions.
The investors also noted, in relation to wind, that the prevailing cap on generation-based incentives
penalizes firms that use the most efficient technology, as they reach the cap sooner due to their higher
productivity. Some suggested that incentives could be designed to benefit the most efficient and
productive firms. There were also concerns about ensuring the quality of equipment. Power generation
firms would like the freedom to procure the best and most cost-effective equipment globally. However,
some domestic manufacturing firms expressed concern about unfair competition from certain countries,

11
and argued that given a bit of breathing space, Indian manufacturers could emerge as cost-effective
producers of most RE technologies.
Transparency and good governance are essential but not always present. Some firms alluded to non-
transparency in the bidding and allotment process, and in issuing clearances and in loan disbursements.
In certain cases, firms with no prior experience in delivering solar projects have been selected simply
because they submitted the lowest bids. Investors also see the need for greater clarity on the proposed
value-added tax (VAT), since it has the potential to neutralize the tax benefits given to RE firms.
Streamlining the onerous clearance process would also facilitate the reduction of improper practices. On
the issue of transparency, investors said they welcomed initiatives, such as the JNNSM, which provide
open access to detailed data necessary for siting and estimation of revenues. Easy access to land and the
need for government to control speculative land grabbing emerged as an issue for some investors. Certain
states fared better than others in facilitating access to land for RE projects, with Gujarat being a notable
example.
Sri Lanka
The focus of the consultations in Sri Lanka was on net metering and the potential for grid-connected solar
projects Grid-connected solar has been in place since 2007, through net metering, which is still at a
nascent stage. The approach does not involve actual payments to a supplier into the grid. Instead, excess
solar energy produced by a captive user can be fed into the grid, and the value is offset against the
consumer‘s electricity bills.
Financing is essential for deployment of net metering: Net metered projects are not eligible for RERED
funding or grants.6 Investors flagged this as a significant shortcoming, since borrowing from commercial
banks carries a high interest rate. They emphasized the need for incentives and subsidies for net metered
projects.
Clarity, consistency and speedy clearances are required for effective operationalization of net metering.
Firms involved in the consultations pointed to a lack of clarity—and lack of commitment on the part of
utilities—concerning the procedures for establishing net metering. While one of the two transmission
companies in Sri Lanka—the Ceylon Electricity Board—seems to have indicated that credits will be
carried forward for 10 years, the second company—Lanka Electric Company (LECO)—has indicated that
the credits will lapse after a shorter period. There also is no mechanism to allow for utilities to pay
producers for accumulated credits. Further, the time required to obtain relevant permits and clearances is
unnecessarily long.
Financing and policy predictability are both essential for the success of grid-connected solar parks.
There was a general perception that the Government‘s efforts to attract private sector investment through
the establishment of solar parks would be ineffective without appropriate financing schemes and other
incentives. Many firms also suggested that the Government should not establish preferential tariffs, but
6 The Renewable Energy for Rural Economic Development (RERED) Project. It is a market based Project of the
Government of Sri Lanka (GOSL) supported with financial assistance from the World Bank and Global
Environment Facility, and implemented by DFCC Bank. The RERED Project aims to expand the commercial
provision and utilization of renewable energy resources, with a focus on improving the quality of life in rural areas
by using electricity as a means to further income generation and social service delivery. Source:
http://www.energyservices.lk/

12
that allowing tariffs to be negotiated between producers and the utilities would be more conducive to
private investment.
Pakistan
A number of private sector firms praised the efforts of the Government of Pakistan to create an attractive
investment climate for RE producers. However, they called for more effective implementation of existing
laws and regulations and greater transparency.
Many of the issues faced by Pakistani firms echo those in India and Sri Lanka, such as access to easy
financing options and effective implementation of laws and regulations. However, one distinct issue that
arose repeatedly during the consultations was that Pakistan‘s unstable political and security climate is
driving away potential investors—despite one of the most attractive terms and conditions offered by any
government in South Asia, notably a guaranteed rate of return of nearly 18 percent. Several firms called
for some sort of international political and security risk guarantee mechanism to be provided by
international institutions.
Existing laws need to be effectively implemented. A major problem facing RE firms in Pakistan is the
weak implementation of RE laws and regulations. For instance, while feed-in tariffs for various RE
sources exist on paper, in actual practice, tariffs are set through a process of negotiations between the
relevant authorities and power companies.
Administrative costs need to be reduced. RE in Pakistan comes under the purview of a number of
agencies. In certain sectors such as small hydro, the entrepreneur has to obtain both provincial and
federal-level clearances and the lack of efficient coordination among these agencies leads to delayed
implementation and increases administrative burdens and costs for the entrepreneur. There was also a
need for speedier, less political process of obtaining clearances. Private sector groups have suggested the
creation of a single agency—the Energy Administration Authority (EAA)—and this needs to be pursued.
Difficulties in obtaining finance. Access to finance was also mentioned as very important, especially in
sectors such as solar PV, where initial investment is high. Many firms find it very difficult to obtain easy
access to finance. More concessional loans were suggested, particularly for smaller players.
Cost-effective access to both land and equipment is critically important. Access to land remains a
serious constraint to investment. Most land is controlled by the provincial governments, and none has a
system in place for allocating land to the private sector at cost-effective rates. Private land is also quite
expensive. Investors also noted the need for cost-effective access to equipment and inputs. For wind, as
there is no manufacturing in Pakistan, customs duties are zero for wind equipment. But for solar cells and
modules, prevailing duties continue to be high—up to 50 percent—which raises investment costs for solar
PV producers. For biomass, opportunities to facilitate imports and technology transfer from India needs
to be explored, with institutions such as the World Bank playing a facilitating role.
Bangladesh
Clear and supportive policies are needed. Firms in Bangladesh highlighted the need for a clear set of
laws and enabling framework to realize effective deployment of RE. So far such clarity has been missing.
There is, for instance, no law on net metering, which would encourage rooftop solar. The Government
recently issued an order making it mandatory for new residential and commercial establishments to install

13
solar panels as a condition for securing an electricity connection. While the aim is laudable, the initiative
lacks supportive aspects, such as financial help for installation costs, which are likely to be more
effective.
RE investors must keep in mind the agrarian nature of the country’s economy. Most of the projects in
Bangladesh are off-grid in nature, as the existing grid cannot meet rising energy demand. Given the
largely agrarian and rural nature of the economy, RE opportunities are primarily in applications such as
water pumping, which presently rely on expensive diesel generators, given the intermittent electricity
supply.
Access to finance is still a difficult issue for small-scale projects. Non-profit organizations are an
important vehicle for RE technology diffusion in Bangladesh, given their involvement in micro-credit and
the small-scale, off-grid nature of RE deployment in most of the country. Commercial interest rates are
typically in the range of 11-14 percent for RE projects, although the Government sometimes provides
loans at lower rates for the purchase of capital equipment. Institutional actors such as Asian Development
Bank and World Bank are active in efforts to expand RE deployment of RE, although it was noted that
large institutional actors are interested mainly in large-scale projects. A programmatic approach with
clustering of similar projects was suggested so that smaller private sector players can benefit from these
institutional efforts.
There is a need to establish and scale up local manufacturing and technological collaboration. Some
firms pointed to current efforts to manufacture the hardware required for RE deployment, such as
batteries and charge controllers. Bangladesh would benefit from technology transfer and private sector
collaboration with countries such as India, which are more advanced in this area. Indian companies are
already actively involved in areas of RE technology deployment such as solar-powered mobile towers.
Nepal
Given the relatively nascent and off-grid nature of solar, wind, and biomass in Nepal, consultations with
the private sector focused on the small hydro sector. One issue that was interesting from a regional
energy trade perspective is hydropower exports to India. Private sector firms generally felt that easier
access to the Indian market would lead to the rapid scale-up of hydro sector investments in Nepal. Nepal
could then import power from India during the dry season, and export surplus power during the wet
season much more than the presently insignificant levels of trade, leading to a ‗win-win‘ situation for both
countries. However, they were concerned that large hydro would benefit from this access much more
than small hydro, given the high fixed costs (including transmission lines) of installations that could
supply the Indian market.
Lack of transmission facilities is a serious constraint to investment in grid-connected small hydro
projects.
Delayed clearances are often an issue due to lack of coordination among various government
departments. The process is presently streamlined, for smaller projects of less than 50MW, for which only
a simple environmental impact assessment (EIA) is needed, compared to the full range of environmental
clearances required for larger projects.

14
Capacity specifications can be a burden. The Nepal Electricity Authority buys all the power produced by
plants of less than 25MW, provided that they generate at full capacity at least 40 percent of time (i.e., Q40
plants). Firms expressed concern that during the wet season, unless the surplus power generated can be
exported, it will be wasted, and producers will incur a loss. Developers are also concerned that, in the
absence of a larger market, the Q40 requirement means the plants cannot be designed to optimize costs.
Access to equipment and inputs for small hydro projects was perceived to be largely free of barriers. The
zero VAT and one percent customs duty were considered attractive, as were the 7 to 10-year tax holidays.
Only construction materials incur a duty, and the government could help small hydro firms by reducing or
eliminating this as well.
4. Constructing a Climate Investment Readiness Index (CIRI)
The study undertook a comparative assessment of the investment environment for grid-connected
renewable energy and energy efficiency in a select group of South Asian and comparator countries. The
objective was to determine whether these countries have policies, regulations, and incentives designed to
attract investments in RE generation and EE, at least on paper, and how they rank when compared with
each other.
The indicators selected were based on an extensive survey of literature on some of the main policies,
regulations and incentives introduced by countries to attract private sector investment in RE, as well as
enable greater diffusion of EE products and techniques as indicated in Section 3. The selected indicators
are illustrated in Boxes 2 and 3. The lists are by no means exhaustive, but they do provide a fair indication
of some of the key elements that a country needs to have in place to give a clear signal to private
investors. For both RE and EE, two types of indicators were selected. The first comprised cross-cutting
policies, regulations and incentives that would broadly affect the investment climate in renewables or EE.
The second category included policies, regulations and incentives specific to a sector, such as solar PV or
small hydro (for renewables) or lighting and appliances (for EE). For RE, each indicator was assigned a
weight of 1, and the weighted score for each indicator was found by multiplying the score for presence or
absence. Thus, in the presence of an indicator, the weighted CIRI score (WS) would be:
(POLICIES, REGULATIONS AND INCENTIVES Score =1) X (Assigned Weight=1) == = 1
In the absence of an indicator, the weighted CIRI score (WS) would be:
(POLICIES, REGULATIONS AND INCENTIVES Score =0) X (Assigned Weight=1) ==POLICIES,
REGULATIONS AND INCENTIVES = 0
A slightly different approach to scoring has been followed for policies, regulations and incentives for EE.
As one of the indicators—namely, mandatory minimum energy performance standards (MEPS) and
labeling initiatives—is a function of the number of appliances covered by such initiatives, there is no
maximum ceiling and no absolute total score. Mandatory standards are obviously much more important
than voluntary standards for creating a climate that is conducive for the diffusion of EE appliances. If
similar scores were given for both mandatory as well as voluntary standards, then country A, for instance,
could enjoy a high total CIRI score if it had a large number of appliances covered by voluntary standards

15
and none under mandatory standards, whereas it may actually be country B that has a more attractive
investment climate due to the presence of mandatory standards.
To reinforce the importance of mandatory standards for lighting, appliances, and building codes,
mandatory labeling schemes or minimum energy performance standards are given a scoring weight of 2.
Thus for the presence of a single mandatory standard in lighting, a country would receive a score of 1 and
a weight of 2, giving it a weighted score of 2. If there are 7 mandatory standards, the country would get a
score of 7 and a weighted score of 14. For the presence of voluntary standards in lighting, by contrast, a
country would get a weighted score of 1 per standard, so that 1 standard would yield a score of 1, for
example, and 7 standards would yield a weighted score of 7.
The resulting total score for each country has been taken as the CIRI consolidated score for EE sectors in
the country. The consolidated score reflects the overall regulatory attractiveness of a country. However,
it does not indicate the effective implementation of these policies, regulations and incentives, or how the
private sector may view them; nor does it capture the geographical and sectoral scale or financial depth of
individual EE schemes or projects that may exist in any country.
Renewable Energy For renewable energy, the decision was made to focus on grid-connected electric power generation, as
this is the focus of activity in both developed and developing countries, and thus provides easier
comparability. Certain indicators, such as RE targets and tax incentives on equipment purchases, are
relevant for the expansion of both grid-connected and off-grid RE; but otherwise the two are quite
different in terms of the policies, regulations and incentives that matter for attracting investment. The
availability of equipment financing schemes and other consumer subsidies, in fact, matter much more in
the case off-grid RE, since they are often targeted at poor communities in remote areas untouched by the
electricity grid network.
Box 2: Key Indicators for Construction of CIRI RE
c Cross-cutting Indicators
1 Existence of RE Policy and Law
RE Policy
RE Law
2 Existence of RE Target
3 RE Purchase/Offtake Obligation
4 Availability of Tradable Instruments for RE
Sector Specific Indicators for Solar PV, Wind, Biomass and Small Hydro
1 Preferential tariffs for Solar/Wind/Biomass/Small Hydro
2 Grants/Subsidies/Incentives related to capital/Investment Tax Credits

16
3 Incentives Linked to Generation/Production tax-credits
4 Income Tax Holidays/Exemptions
5 Trade-related Incentives
Customs Duty Exemptions
Absence of Local Content Requirements
6 Other Tax Exemptions (VAT, Excise etc)
An examination of the presence or absence of these policies, regulations and incentives in South Asia
reveals that India, as expected, scores high for the presence of both cross-cutting and sector-specific
policies, regulations and incentives. Only in wind does Pakistan score above India, due to Pakistan‘s
income tax holidays. India is the only country that has deployed tradable instruments to facilitate entities‘
obligation to purchase RE. Pakistan scores higher than Sri Lanka for the presence of policies, regulations
and incentives in all sectors. A higher CIRI score, however, does not mean that a country is
attracting higher levels of investment or even that it offers a better climate for RE investors. It
merely indicates that a country has put in place more policies, regulations and incentives to attract
investors. Whether this contributes to creating a more attractive investment climate depends on a number
of other factors, including effective implementation. As the findings from the private sector consultations
reveal, many investors, particularly foreign firms, are still hesitant to invest in Pakistan owing to the
prevailing political and security climate, despite the offer of very attractive terms and conditions. Hence,
the binary nature of CIRI analysis reveals just one side of the story. As discussed earlier it needs to be
complemented with surveys of private sector to get a complete picture.
The tables below indicate the existence or absence of policies, regulations and incentives for grid-
connected RE investment in India, Pakistan and Sri Lanka. Scores are on a scale of 10 (which indicates
the presence of key RE policies, regulations and incentives). The presence of an indicator gives a country
a score of 1 and its absence a score of zero. Equal weights (carrying a value of 1) have been assumed for
each indicator set. One can, in principle, change the weights of various categories to arrive at a revised
scoring scheme. However, care must be taken to ensure that the weighting schemes are consistent with
private sector perceptions of the policies, regulations and incentives. As noted earlier, Nepal, Bangladesh
and Maldives have not been included in the scoring due to their emphasis on off-grid deployment and
relatively underdeveloped state of grid-connected RE, as well as the absence of required policies,
regulations and incentives.

17
Table 1a: Cross-cutting Grid-Connected RE Policy, Regulation and Incentives: CIRI Scores for India, Pakistan
and Sri Lanka
Table 1b: Solar PV-Grid-Connected RE Policy, Regulation and Incentives: CIRI Scores for India, Pakistan, and
Sri Lanka
Cross-cutting Grid-Connected CIRI
Indicators
India Pakistan
Sri Lanka
1 Existence of Law and Policy on Renewable
Energy
1 1 1
a Existence of RE Policy 0.5 0.5 0.5
b Existence of RE Law 0.5 0.5 0.5
2 Existence of RE Target 1 1 1
3 Obligation for Designated Entities to
Purchase/Off-take RE
1 1 1
4 Availability of Tradable Instruments for RE
Generation
1 0 0
Total 4 3 3
Grid-connected Solar PV CIRI Indicators India Pakistan Sri Lanka
1 Availability of Designated Preferential Tariffs
for Solar PV Power
1 0 0
2 Grants, subsidies and incentives related to
capital/Investment tax credits
1 1 0
3 Incentives linked to generation/Production
tax-credits
1 0 0
4 Income-tax holidays/exemptions 1 1 1
5 Trade-related Incentives 0.5 1 1
-Customs-duty exemptions (zero duty on major
components and equipment)
0.5 0.5 0.5
-Absence of ‘local-content’ requirements for 0 0.5 0.5

18
Table 1c: Onshore Wind-Grid-Connected RE Policy, Regulation and Incentives: CIRI Scores for India,
Pakistan, and Sri Lanka
power producers
6 Other tax-exemptions (Sales, VAT, Energy
Tax etc)
1 1 0
Total 5.5 4 2
Onshore Wind
Grid-Connected CIRI Indicators
India Pakistan Sri Lanka
1 Availability of Designated Preferential Tariffs
for Onshore Wind Power
1 1 1
2 Grants, subsidies and incentives related to
capital/Investment tax credits
1 0 0
3 Incentives linked to generation/Production
tax-credits
1 1 0
4 Income-tax holidays/exemptions 0 1 1
5 Trade-related Incentives 0.5 1 1
-Customs-duty exemptions (zero duty on major
components and equipment)
0 0.5 0.5
-Absence of ‘local-content’ requirements for
power producers
0.5 0.5 0.5
6 Other tax-exemptions (Sales, VAT, Energy
Tax etc)
1 1 1
Total 4.5 5 4

19
Table 1d: Small-Hydro Grid-Connected RE Policy, Regulation and Incentives: CIRI Scores for India, Pakistan,
and Sri Lanka
Table 1e: Biomass Grid-Connected RE Policy, Regulation and Incentives: CIRI Scores for India, Pakistan, and
Sri Lanka
Small-hydro
Grid-Connected CIRI Indicators
India Pakistan Sri Lanka
weighted score
1 Availability of Designated Preferential Tariffs
for Small-hydro Power
1 1 1
2 Grants, subsidies and incentives related to
capital/Investment tax credits
1 0 0
3 Incentives linked to generation/Production
tax-credits
0 1 0
4 Income-tax holidays/exemptions 1 1 1
5 Trade-related Incentives 0.5 1 0.5
-Customs-duty exemptions (zero duty on major
components and equipment)
0 0.5 0
-Absence of ‘local-content’ requirements for
power producers
0.5 0.5 0.5
6 Other tax-exemptions (Sales, VAT, Energy
Tax etc)
1 0 0
Total 4.5 4 2.5
Biomass
Grid-Connected CIRI Indicators
India Pakistan Sri Lanka
1 Availability of Designated Preferential Tariffs
for Biomass Power
1 0 1
2 Grants, subsidies and incentives related to
capital/Investment tax credits
1 0 0
3 Incentives linked to generation/Production
tax-credits
0 0 0
4 Income-tax holidays/exemptions 1 1 1
20
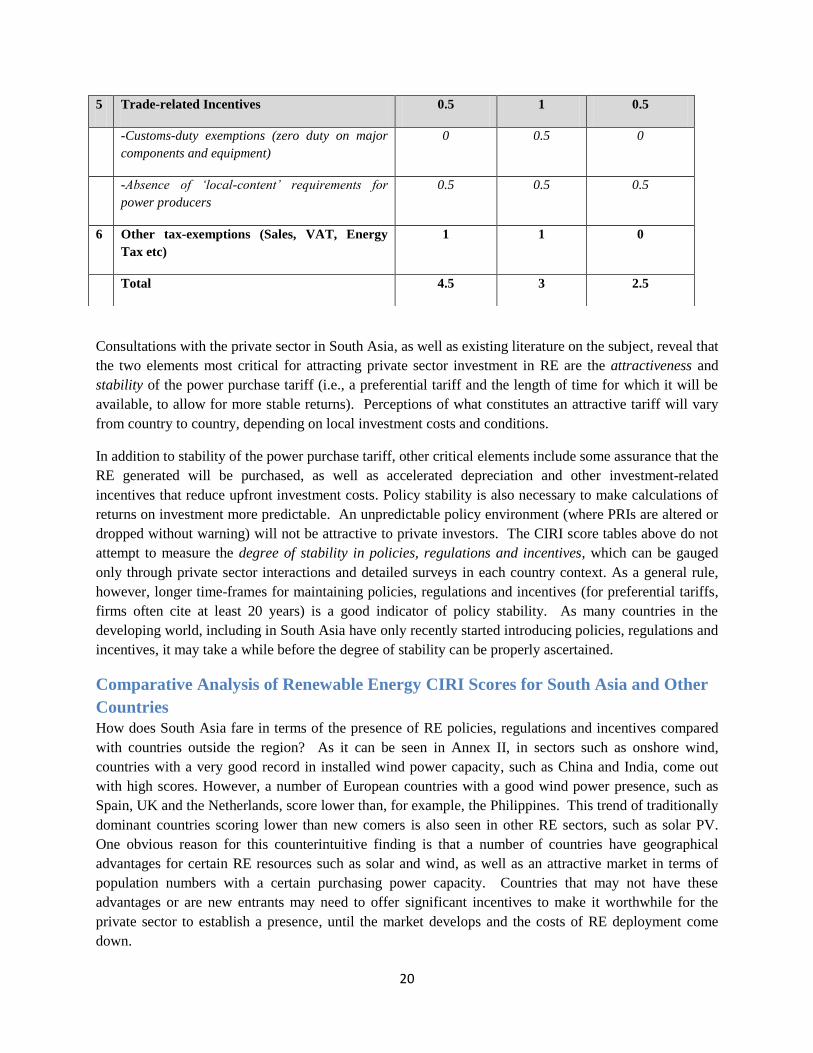
Consultations with the private sector in South Asia, as well as existing literature on the subject, reveal that
the two elements most critical for attracting private sector investment in RE are the attractiveness and
stability of the power purchase tariff (i.e., a preferential tariff and the length of time for which it will be
available, to allow for more stable returns). Perceptions of what constitutes an attractive tariff will vary
from country to country, depending on local investment costs and conditions.
In addition to stability of the power purchase tariff, other critical elements include some assurance that the
RE generated will be purchased, as well as accelerated depreciation and other investment-related
incentives that reduce upfront investment costs. Policy stability is also necessary to make calculations of
returns on investment more predictable. An unpredictable policy environment (where PRIs are altered or
dropped without warning) will not be attractive to private investors. The CIRI score tables above do not
attempt to measure the degree of stability in policies, regulations and incentives, which can be gauged
only through private sector interactions and detailed surveys in each country context. As a general rule,
however, longer time-frames for maintaining policies, regulations and incentives (for preferential tariffs,
firms often cite at least 20 years) is a good indicator of policy stability. As many countries in the
developing world, including in South Asia have only recently started introducing policies, regulations and
incentives, it may take a while before the degree of stability can be properly ascertained.
Comparative Analysis of Renewable Energy CIRI Scores for South Asia and Other
Countries
How does South Asia fare in terms of the presence of RE policies, regulations and incentives compared
with countries outside the region? As it can be seen in Annex II, in sectors such as onshore wind,
countries with a very good record in installed wind power capacity, such as China and India, come out
with high scores. However, a number of European countries with a good wind power presence, such as
Spain, UK and the Netherlands, score lower than, for example, the Philippines. This trend of traditionally
dominant countries scoring lower than new comers is also seen in other RE sectors, such as solar PV.
One obvious reason for this counterintuitive finding is that a number of countries have geographical
advantages for certain RE resources such as solar and wind, as well as an attractive market in terms of
population numbers with a certain purchasing power capacity. Countries that may not have these
advantages or are new entrants may need to offer significant incentives to make it worthwhile for the
private sector to establish a presence, until the market develops and the costs of RE deployment come
down.
5 Trade-related Incentives 0.5 1 0.5
-Customs-duty exemptions (zero duty on major
components and equipment)
0 0.5 0
-Absence of ‘local-content’ requirements for
power producers
0.5 0.5 0.5
6 Other tax-exemptions (Sales, VAT, Energy
Tax etc)
1 1 0
Total 4.5 3 2.5

21
In terms of the presence of cross-cutting framework elements, India is in the same category as Asian
countries that have put in place overarching RE policies and laws, including China, Indonesia, Japan,
Philippines, Indonesia and Kazakhstan, as well as the major economies of Europe, Australia, Mexico and
South Africa. For solar and wind-specific policies, regulations and incentives, India and Pakistan‘s CIRI
scores are comparable to those of China, Vietnam and Philippines in East Asia. India, in fact, scores
higher than most countries in Europe, Latin America and Africa for solar-specific policies, regulations
and incentives; and India, Pakistan and Sri Lanka all score higher than most European, Latin American
and African countries as well as Australia for wind-specific policies, regulations and incentives.
These findings highlight the fact that countries with lower sector-specific CIRI scores may fall into either
more mature markets (as in Europe) that need to rely on fewer incentives to attract wind investments; or
else immature or very early-stage markets that have not yet developed investment incentives. Rapidly
growing and emerging countries generally reflect higher sector-specific CIRI scores. A higher score can
also reflect recognition by pro-active policymakers of the potential of renewables and their desire to
attract investment as quickly as possible. The Philippines is a notable example in Asia. Consolidated solar
PV and onshore wind index scores put the South Asian countries among the top league among countries
from both Asia as and Western Europe. Russia and Ukraine fare rather poorly.
A similar picture is emerging for small hydro and biomass. India once again scores high for the presence
of policies, regulations and incentives for both sectors, whereas Pakistan and particularly Sri Lanka reflect
lower scores similar to those of a number of Latin American and many Asian countries. Japan
surprisingly obtains low CIRI scores in many RE sectors more similar to Sri Lanka. Once again this
reflects the fact that the Japanese market may not require certain types of incentives (perhaps owing to
higher prevailing electricity prices). Reliance on cheaper alternative forms of energy such as oil and gas
in Russia and nuclear in Japan may also have a role in explaining their lower CIRI scores, despite a higher
level of wealth than many Asian and Latin American countries that score better. Two countries in the
MENA region—Egypt and Iran—with an under-developed potential for RE development, both have low
CIRI scores, indicating the need to develop a more robust policy, regulatory and incentive framework.
Energy Efficiency
Unlike the scale of 10 used for scoring policies, regulations and incentives in RE, there is no perfect total
score for EE. This is because in addition to scoring for the presence of policies, regulations and
incentives, countries are also scored based on the number of appliances covered by mandatory minimum
energy performance standards and labeling, which carries a weight of 2. Such an approach means that
country A with 10 mandatory standards and 20 voluntary ones gets a higher score than a country with 5
mandatory standards and 100 voluntary ones. From the perspective of deployment of EE appliances,
there is a higher probability that mandatory standards will be implemented as compared to voluntary
standards. Therefore it is appropriate to give a higher CIRI scores based on the number of appliances
covered by mandatory standards and labeling schemes, but to keep the score and weight constant at 1

22
irrespective of how many appliances are covered by voluntary standards or labeling schemes (see Table
6f for the framework used for assessing EE policies, regulations and incentives).7
The CIRI scores for EE reveal that, within the South Asian region, India is well ahead in terms of relevant
policies, regulations and incentives as well as institutional structures for EE (See Annex III). India‘s high
scores are largely due to a larger number of electric appliances being covered by mandatory energy
performance standards, as well to the higher weights assigned to building codes. India has also
introduced a trading scheme for EE credits—the first of its kind in South Asia. As EE initiatives get
underway in other South Asian countries and more mandatory standards are introduced, the climate for
diffusion of energy efficient appliances will certainly improve. However, India—due to the sheer size of
its market, coupled with strong economic growth and its imperatives for energy conservation, energy
security and greenhouse gas reductions—is likely to remain the most attractive market for energy-
efficient products in South Asia.
Comparative Analysis of Energy Efficiency CIRI Scores for South Asia and Other
Countries
The scores obtained in the case of EE policies, regulations and incentives in some ways provides a more
robust and quantitative basis to assess where countries stand in terms of the environment to deploy
energy-efficient products. This is because while the presence of voluntary standards and labeling
initiatives are acknowledged with a nominal score, countries are really rewarded for the presence of
mandatory standards and labeling initiatives (which carries a greater weight of 2). Further the more
appliances that are covered by mandatory standards and labeling initiatives, the higher the CIRI score
countries chalk up.
Box 3: Key Indicators for Construction of CIRI EE
Cross-cutting
1 Existence of Law and Policy on EE
Existence of EE Policy
Existence of EE Law
2 Existence of EE Targets
3 Designated Implementing Institution/Department
4 Availability of Trading Schemes/Tradable Instruments for EE
5 Existence of Procurements for Energy-efficient products/Construction
7 Information and numbers for lighting and electrical appliances have been obtained from the Collaborative
Labelling and Appliance Standards Program (CLASP) at http://www.clasne.org/index.php. Ballast related standards
and labels have been included under the category of ‗Lighting.‘
23
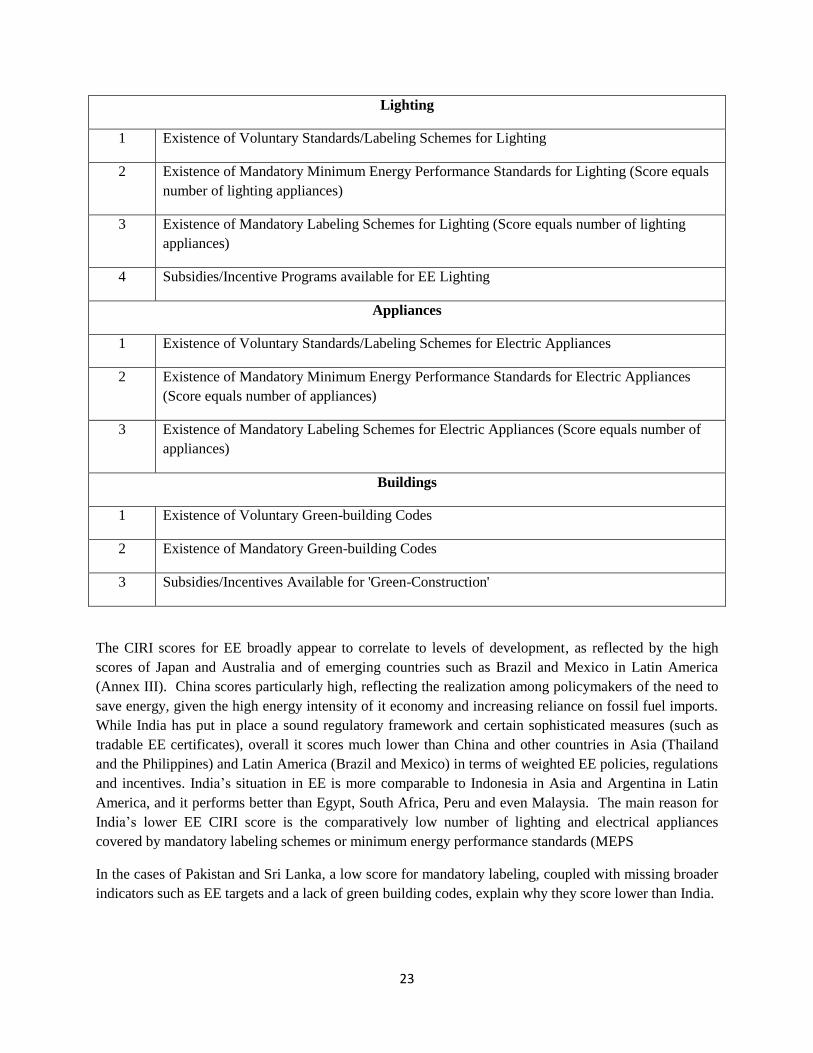
Lighting
1 Existence of Voluntary Standards/Labeling Schemes for Lighting
2 Existence of Mandatory Minimum Energy Performance Standards for Lighting (Score equals
number of lighting appliances)
3 Existence of Mandatory Labeling Schemes for Lighting (Score equals number of lighting
appliances)
4 Subsidies/Incentive Programs available for EE Lighting
Appliances
1 Existence of Voluntary Standards/Labeling Schemes for Electric Appliances
2 Existence of Mandatory Minimum Energy Performance Standards for Electric Appliances
(Score equals number of appliances)
3 Existence of Mandatory Labeling Schemes for Electric Appliances (Score equals number of
appliances)
Buildings
1 Existence of Voluntary Green-building Codes
2 Existence of Mandatory Green-building Codes
3 Subsidies/Incentives Available for 'Green-Construction'
The CIRI scores for EE broadly appear to correlate to levels of development, as reflected by the high
scores of Japan and Australia and of emerging countries such as Brazil and Mexico in Latin America
(Annex III). China scores particularly high, reflecting the realization among policymakers of the need to
save energy, given the high energy intensity of it economy and increasing reliance on fossil fuel imports.
While India has put in place a sound regulatory framework and certain sophisticated measures (such as
tradable EE certificates), overall it scores much lower than China and other countries in Asia (Thailand
and the Philippines) and Latin America (Brazil and Mexico) in terms of weighted EE policies, regulations
and incentives. India‘s situation in EE is more comparable to Indonesia in Asia and Argentina in Latin
America, and it performs better than Egypt, South Africa, Peru and even Malaysia. The main reason for
India‘s lower EE CIRI score is the comparatively low number of lighting and electrical appliances
covered by mandatory labeling schemes or minimum energy performance standards (MEPS
In the cases of Pakistan and Sri Lanka, a low score for mandatory labeling, coupled with missing broader
indicators such as EE targets and a lack of green building codes, explain why they score lower than India.

24
5. Conclusion and Next Steps
It is clear that investment in RE and EE will continue to expand, driven by government policies,
regulations and incentives as well as underlying macro strengths. Policies, Regulations and Incentives
will continue to exert influence over investment decisions. As costs of RE and EE technologies decline
and renewable power becomes comparable in cost and reliability to power generated from fossil fuels, the
need for additional incentives will decline. As this trend progresses, it will be useful to analyze the
correlation between policies, regulations and incentives and investment flows into the RE and EE sectors.
From a survey of the literature and of regulatory frameworks worldwide, there appears to be a broad set
of policies, regulations and incentives that countries usually put in place. For RE, these include
preferential tariffs, RE purchase obligations or portfolio standards, income and equipment tax breaks and
incentives (for producers and/or consumers), as well as incentives linked to capital and/or generation cost.
For EE, the main policies, regulations and incentives include minimum energy performance standards,
voluntary and mandatory labeling schemes, and incentives or tax breaks for the sale and purchase of
energy-efficient products. Countries may differ in the specific design of these policies, regulations and
incentives, choosing those that may be most appropriate to prevailing conditions in the country.
As evident from South Asia, countries may also be at various levels of evolution with regard to the
introduction of policies, regulations and incentives. Consultations with the private sector, however, have
made it clear that in addition to macroeconomic indicators and the presence of policies, regulations and
incentives, it is the attractiveness and effective implementation of these policies, regulations and
incentives that do the most to attract private investment. Hence to effectively assess and compare various
countries in terms of their investment climates, it becomes important to survey firms about their
perceptions of those investment climates.
The next phase of the study, therefore, will go beyond the binary framework attempted here and seek to
deepen its work in South Asia by launching formal private sector surveys, and also expand it to other key
developing countries in Asia, Africa and Latin America. These formally structured surveys will go
beyond broad informal consultations undertaken during the present phase and attempt to gather and
objectively score private sector perceptions of attractiveness of the investment climate including those
based on actual implementation-related indicators.
The CIRI will seek to be a living and constantly evolving tool. Based on feedback from experts and
target audiences, the indices can, over time, ensure that the policy variable elements it measures are the
ones that truly matter to clean energy and energy-efficiency investors.
Expected Outcomes and Measurement of the Study’s Effectiveness
The success of every study lies in the outcomes and long-term impact that it has and the real effectiveness
and value of the study will lie in the useful information and analysis it can provide for policy makers,
private investors and development agencies.
The ―Assessing Investment Climate for Climate Investments‖ study provides a framework that seeks to
enable the following outcomes:

25
Transparency: Provide factual information about existence of clean-energy and energy-efficiency laws
in a country complemented by a qualitative assessment of the investment climate based on extensive
consultations with the private sector as well.
Reform: An index-based benchmarking of countries complemented by the perception of their investment
climates amongst the private sector will be useful in spurring reform in these countries particularly those
that obtain weaker scores. Even countries with strong overall scores will be able to identify specific
policy variables that may benefit from further reform.
This could lead to better evaluation and understanding of what clean-energy and EE promotion
policies may or may not work in different country-contexts both by governments as well as donor
agencies.
Better targeting of external assistance: The study results will be useful for tailoring country-specific
technical assistance to improve investment climate in the clean-energy and EE sectors both from various
departments within the Bank group as well as other aid-agencies. Further it is also expected that the
results will influence the nature and direction of assistance that is channeled under the auspices of the
UNFCCC through the Green Climate Fund and Technology Mechanism.
Independent Verification: The results could also be a useful way to independently verify National
Nationally Appropriate Mitigation Action (NAMAs) that are related to clean-energy.
Indicators that reveal the achievement of these outcomes will be a useful way to assess the impact and
success of the study. Over a period of time it may be possible to draw a correlation between individual
and a collective group of CIRIs -their evolution and implementation and flows of private sector
investments in RE and EE sectors in a country. The lessons from such an exercise may indeed prove
invaluable. Measuring some of these impacts will also be an important aspect of assessing the overall
effectiveness of the study.

26
References
Avato,P. and Coony,J.E. (2009), Accelerating Clean Energy Technology Research, Development, and
Deployment: Lessons from Non-Energy Sectors, World Bank.
Aaron Cosbey, Jennifer Ellis, Mahnaz Malik, Howard Mann (2008), Clean Energy Investment:
Policymakers' Summary, IISD, 2008.
Bhattacharya, S. and M. Cropper (2010), ‗Options for Energy Efficiency in India and Barriers to Their
Adoption: A Scoping Study,‘ RFF Discussion Paper 10-20.
Hamilton, Kirsty (2009), Unlocking Finance for Clean Energy: The Need for ‗Investment Grade‘ Policy,
Energy, Environment and Resource Governance | December 2009 | EERG BP 2009/06.
Hassett, K.A., and G.E. Metcalf (1999), ―Investment with uncertain tax policy: Does random tax
policy discourage investment?‖ Economic Journal 109(457): 372–.93.
Hoekman, B., Maskus, K. and Saggi, K. (2005), ‗Transfer of Technology to Developing Countries:
Unilateral and Multilateral Policy Options.‘ World Development, 33(10), pp. 1587–1602.Elsevier,
Oxford.
Holdren.J.P. (2006), 'The Energy Innovation Imperative: Addressing Oil Dependence, Climate Change,
and Other 21st Century Energy Challenges, Innovations 1, no. 2 (Spring 2006): 3-23, MIT Press,
Cambridge.
Barton, John H. (2007), Intellectual Property and Access to Clean Energy Technologies in Developing
Countries: An Analysis of Solar Photovoltaic, Biofuels and Wind Technologies. ICTSD Trade and
Sustainable Energy Series Issue Paper No. 2. International Centre for Trade and Sustainable
Development, Geneva, Switzerland.
Brown, Marilyn (2001), ―Market Failures and Barriers as a Basis for Clean Energy Policies,‖ Energy
Policy, 29 (14): 1197-1207.
Jaffe, A.B., and R.N. Stavins (1994), ―The energy paradox and the diffusion of conservation
technology.‖ Resource and Energy Economics 16(2): 91–122.
Jaffe, A.B., R.G. Newell, and R.N. Stavins (2003), ―Technological change and the environment.‖
In K.-G. Mäler and J.R. Vincent (eds.), Handbook of Environmental Economics, Volume
Elsevier Science B.V.
Jha, V. (2009). Trade Flows, Barriers and Market Drivers in Renewable Energy Supply Goods: The Need
to Level the Playing Field, ICTSD Trade and Environment Issue Paper 10, International Centre for Trade
and Sustainable Development, Geneva, Switzerland.
Kirkegaard,J.F., Hanemann,T. and Weischer,L.(2009), It Should Be a Breeze: Harnessing the Potential of
Open Trade and Investment Flows in the Wind Energy Industry, Working Paper, World Resources
Institute and Peterson Institute for International Economics, Washington D.C.

27
Kirkegaard,J.F., Hanemann,T.,Weischer, L. and Miller,M. (2010), Toward a Sunny Future? Global
Integration in the Solar PV Industry, Working Paper, World Resources Institute and Peterson Institute for
International Economics, Washington D.C.
Mallett,A., Sheridan,N. and Sorrell,S. (2010), Barriers busting in energy efficiency in industry– report for
UNIDO, January 2010
Newell, R.G., A.B. Jaffe, and R.N. Stavins (1999), ―The induced innovation hypothesis and
energy-saving technological change.‖ Quarterly Journal of Economics 114(3): 941–75.
Kofoed-Wiuff,A.,Sandholt,K. and Marcus-Møller,C. (2006), A Synthesis of Various Studies on Barriers,
Challenges and Opportunities for Renewable Energy Deployment, Ea Energy Analyses for the IEA
RETD Implementing Agreement, May 2006.
Some Legal Provision and Policy Highlights on Hydro Power Sector in Nepal accessible at
http://www.nicci.org
Sathaye, J., L. Price, S. de la Rue du Can, and D. Fridley (2005), ―Assessment of energy use and energy
savings potential in selected industrial sectors in India.‖ LBNL-57293, Energy Analysis Department
Environmental Energy Technologies Division, Lawrence Berkeley National Laboratory, August.
World Bank (2010), World Development Report. Washington D.C.
World Bank (2008) International Trade and Climate Change: Economic, Legal and Institutional
Perspectives, World Bank Economic and Sector Work (Environment Department, Sustainable
Development Network). Washington D.C.
WTO (World Trade Organization) and UNEP (United Nations Environment Programme) (2009), Trade
and Climate Change: A Report by UNEP and WTO, Geneva: World Trade Organisation.

28
Annex I: Technical and Economic Drivers for Private Investment in
Renewable Energy and Energy Efficiency
This section focuses on the key technical and economic drivers of and constraints to private sector
investment in the solar, wind, biomass, and small hydro sectors, based on worldwide experience. The
drivers and constraints are grouped in two categories: (i) those that have a critical influence on the
producer‘s IRR; and (ii) others that are important but may not directly influence the IRR.
Critical Factors Affecting Revenues
Revenues from an RE power project are determined by two factors: (i) the number of units of electricity
generated; and (ii) the price per unit. While the former is determined by factors such as technology and
siting of the power project, the latter is determined mainly by regulatory support. A more in-depth
analysis of these factors is provided below:
a. Regulatory support
Regulatory support makes RE competitive with the conventional energy and ensures that the unit price
brings adequate returns. The most commonly used support mechanisms are feed-in-tariffs (FiT) and
renewable purchase obligations (RPO). Some countries also use renewable portfolio standards (RPS).
A feed-in-tariff, also known as a preferential tariff, is a policy instrument to promote RE. Under
the FiT mechanism, the RE producer is guaranteed grid access and a preferential price per unit of
electricity generated under a long-term power purchase agreement (PPA). Such tariffs are
typically offered for a long period of time (20-25 years). From an investor‘s perspective, the
guaranteed price and duration of support ensures a stable return over that period.
The RPO/RPS and REC are other mechanisms to promote RE power projects. In case of an RPO, the
regulatory agency requires the utility companies and other large buyers to purchase a certain percentage
of their total electricity from RE sources. An RPS requires electric utilities and other retail electric
providers to supply a specified minimum amount of customer load with electricity from eligible RE
sources.8 When these obligations are backed by strong enforcement mechanisms, including penalties in
case of non-compliance, it ensures demand for RE and leads to better pricing for RE developers.
Since RE is a distributed source of energy, it is likely that generation happens far from the place of
consumption. In such a scenario, the obligated entities might not be able to purchase RE power. To
address this issue, some countries use a mechanism called a renewable energy certificate (REC), which
allows an RE generator to split the electricity into two attributes—physical electricity and a green
certificate. While the former can be sold to any customer at standard electricity prices, the latter can be
sold in trading exchanges to get additional revenue. This ensures an attractive return to the RE generator.
8 http://www.epa.gov/chp/state-policy/renewable_fs.html

29
b. Financial health of power purchasers (private utilities, government utilities, others)
An investor does not decide to invest in a particular project based only on a favorable regulatory
environment. The financial health of the buyers is equally important. If a government or private utility
signs a PPA with the RE generator but is unable to pay because of lack of funds, the viability of the RE
generator—and the confidence of investors—is adversely affected. For example, the Government of
Spain came up with an attractive FiT policy for solar systems in 2007 and signed PPAs with several
developers. In 2008, the country‘s finances were badly affected by the global financial crisis, and Spain
imposed retroactive cuts to the FiTs. This created huge losses for many investors and crippled investor
confidence in the Spanish RE sector.
c. Site selection
Site selection also has a critical impact on RE production and revenues. Some of the relevant aspects of
site selection are:
irradiation levels/shading effects for solar
wind speed/topography for wind
the availability of biomass
terrain–head difference for small hydro.
In developed countries, adequate surveys, studies, and resource mapping have been done and reliable data
is available for an investor to predict revenues fairly accurately. However, in many emerging economies
and in most of the developing world, the data are not sufficient to confidently predict the power output for
a particular location over a period of time. This makes the investment decision more difficult, since if the
projections prove wrong, the returns will be badly affected. This also contributes to the reluctance of
commercial banks to lend for project financing.
d. Technology
Selection of the appropriate technology will have a positive impact on the efficiency of output and the
long-term performance of the system. Some important technology considerations have emerged from
consultations with private operators and investment experts.9
Solar PV – crystalline silicon output is higher for the same area compared to thin film technology.
Wind turbines – turbines with taller masts and larger diameters produce more output than smaller
turbines.
Biomass – gasification-based technology has scale constraints (up to only about 2 MW) whereas
combustion based technology has no such limits.
Small hydro – while hydro turbines have existed for more than a century, a number of innovations
have given them higher power output while requiring significantly less maintenance. While the
9 These considerations of course have been gathered from consultations with private-sector and investment experts
and do not reflect the views of the Bank or possibly other private-sector stakeholders and manufacturers. It is also
important to bear in mind that given the evolving nature of these technologies these considerations may also alter in
future.

30
newer turbines have a 10 to 15 percent higher capital cost, they could result in much project
returns, given the long project lifetimes.
Other Factors Affecting Revenues
A number of other factors also affect revenues. These include:
a. Vendor and contractor selection
Selection of the right vendor and, where necessary, the right engineering, procurement and construction
(EPC) contractor to prepare the site and install the equipment, also impacts revenue.
b. System degradation
Another important factor that impacts revenues is the performance of the system over 20-25 years. If the
system degrades more rapidly than expected, leading to progressively reduced power generation,
profitability will be affected. For example, in case of solar PV, thin film PV modules have a faster
degradation rate than the more robust crystalline silicon modules.
c. Transmission and distribution losses
These losses are usually caused by grid-inefficiencies (which can be exacerbated over longer transmission
distances) as well as power theft. Certain technologies such as high-voltage direct current (HVDC) cables
can help significantly reduce transmission related losses over longer distances but are usualy more
expensive.
d. Effective monitoring and control
Electricity generation from a remote RE farm, especially solar PV and wind, depends on both
uncontrollable factors, such as wind speed or cloud cover; and controllable factors such as malfunctions
of fuses or turbines. An effective monitoring system will enable the timely diagnosis of problems and
help to minimize downtime.
e. Carbon trading
An additional revenue stream for the project developer is carbon trading under the UNFCCC‘s Clean
Development Mechanism (CDM). Trading under current guidelines is valid until the end of 2012. With
the recent agreement at COP 17 in Durban to extend the Kyoto Protocol beyond 2012, the CDM has
gotten a new lease of life and will be a source of additional revenues for RE projects.
f. Co-products and byproducts
Renewable power sources such as biomass enable a power producer to valorize not just power but also
co-products such as charcoal or a digester effluent which serves as a soil nutrient. Waste heat can also be
deployed for useful purposes, thus increasing the overall efficiency and profitability of the system.

31
Critical Factors Affecting Costs
All forms of renewables except biomass entail a huge upfront fixed capital cost but negligible operation
and maintenance (O&M) costs. Further, RE projects are usually shielded against the risks of inflation and
supply shortages that typically affect coal-based or oil-based power plants. Some of the major factors
impacting costs are given below.
a. Capital costs
The most important cost driver is capital cost, consisting primarily of EPC, of which the largest
component is equipment.
Engineering cost refers to every aspect of system design—site surveys, soil testing, preparation of
engineering drawings, validation of the plan by experts.
b. Equipment cost constitutes the bulk of the project cost. Depending on the sector, purchases can
include wind turbines, hydro turbines, PV modules and inverters, or biomass gasifiers. Some
measures such as local content restrictions aimed at promoting indigenous equipment
manufacturing can increase capital costs by reducing the competitiveness of less expensive
imports thereby leading to escalation of input costs for the project.
Construction cost includes the cost of civil construction, electrical construction, approvals and
clearances, erection and commissioning.
c. Fiscal incentives
Fiscal incentives are designed to bring down the cost of expensive RE systems. They can take several
forms.
Capital subsidies reimburse the project developer for a certain percentage of the capital cost. For
example, in India, off-grid solar PV projects of up to 100 kW are eligible for a capital subsidy of
30 percent. This improves the return on investment and can accelerate the adoption of RE.
Tax benefits of various types. Credits for constructing RE systems are often used during times of
recession to stimulate growth in the sector and increase employment. Credits can be either short
or long term. Accelerated depreciation allows the project developer to show higher depreciation
upfront, thereby improving the project IRR. Certain countries also provide tax holidays for a
fixed period, typically about 10 years.
Duty concessions are another way to incentivize investors. Many countries reduce or waive
import duties on equipment required for an RE facility.
d. Replacement of parts
Over the lifetime of an RE project (20-25 years), important parts might need replacement. For example,
inverters on solar PV systems, which contribute about 10 percent of total system cost, have to be replaced
approximately after 10 years of operation.
e. Cost of raw materials

32
For biomass-based power generation, the availability of feedstock is an important factor impacting the
profitability of the project. Since biomass is a commodity, raw material costs can fluctuate, and it is
important for the project developer to have a long-term strategy for procuring biomass at a relatively
stable price and hedge against any huge inflation.
f. Financing cost
Financing cost, manifested mainly in the form of interest rates, impacts the equity IRR for a project. The
financing cost is determined by many factors, including:
The project’s debt/equity ratio (i.e., the relative share of interest-bearing loans to share capital
infused).
Track record of the promoter. A promoter with a good track record for quality, timely delivery,
and sound finances will generally pay less interest than one who is new or does not have a good
track record.
Project risk, tied to factors such as access to and rights over land where the project is located, the
financial health of the power purchasing entity, and predictability of the regulatory framework,
among others.
Prevailing interest rates in a country. Interest rates in the OECD countries are presently at
historic lows, whereas those in emerging economies such as India are relatively very high. Thus
it may make sense for an investor to raise money from the OECD countries for projects in
emerging economies.
Other factors affecting costs
a. Land costs
Land cost can be a critical factor in regions close to urban areas and in countries with high real estate
values. It can also be a critical factor where the proposed site already earns revenues for the land holder
(e.g., a farmer with fertile land). In other cases, especially in developing countries with large stretches of
arid land, land accounts for only a small percentage of the overall cost. However, it is expected that as the
cost of land continues to rise, it will account for a greater share of overall project cost.
b. O&M cost
In all forms of renewable energy except biomass, the annual O&M expenses form only a small percentage
of the capital cost (ranging from 1 percent to 5 percent). This category of expenses includes:
Periodic maintenance
Qualified manpower
Insurance.
c. Inflation
Except in the case of biomass-based power, inflation contributes a negligible percentage of the total cost.
As noted above, most of the cost for other renewables is upfront capital cost, with very little cost for
inputs (consumables, manpower, services) over the project life. In the case of biomass, however, the

33
feedstock is a commodity and is subject to inflation, which will impact the cost of operating the power
plant.
d. Costs towards infrastructure development (power evacuation cost)
In some cases, the nearest grid is far away from the power plant location. In this case, depending on local
rules and regulations, the project developer may have to fully or partly contribute to the development of
power evacuation infrastructure. This can add significantly to the overall cost.
e. Opportunity costs in case of grid instability
As more RE is fed to the grid, the grid can become unstable due to the variability in RE generation (e.g.,
solar power is generated only during daytime; wind power generation depends on wind speeds, which can
be intermittent with little or no options for effective storage). A sudden surge in electricity added to the
grid can lead to its collapse, which means that the RE generator may have to stop generating electricity
during these times. Since the RE generator gets paid only for electricity put into the grid, any grid
collapse leads to unrealized revenues and can be considered an opportunity cost. These risks can be
addressed through mechanisms to control, plan, and monitor transmission systems and by scheduling
outages from RE sources. India‘s Indian Electricity Grid Code is one such regulatory measure.
f. Foreign exchange hedging costs
This cost occurs mainly at the erection and commissioning phases, when a few months‘ delay in the
delivery of imported equipment can increase the cost significantly because of exchange rate variations.
g. Licensing and permitting fees
The costs of regulatory compliance contribute only a small part of the total cost, but can vary from
country to country. In countries with strict environmental protection rules, project developers have to
comply with many regulations. Compliance costs can be relatively high in some countries (e.g., the EU),
but much lower in others (e.g., Africa). But off course we are not counting here the costs from rent
extraction.
Given the higher upfront costs and long payback periods of renewable energy, confidence in policy
stability and clarity over circumstances that might lead to policy change are also important. While
mandatory renewable energy targets, in legislation at national or regional level, do provide confidence
that governments are taking renewable energy seriously, a strong level of ambition when setting the target
is important in creating the market demand and growth prospects needed to drive investment. In some
ways, this can be legislated through ‗grandfathering‘ provisions as a way of providing confidence that a
set of policy conditions will continue to apply to investments made under those conditions, regardless of
subsequent policy changes (Chatham House, 2009).
Energy Efficiency The rate of diffusion of energy-efficient technologies has been widely studied in the international
literature. Factors that are likely to prove important in affecting the diffusion of energy-efficient
technologies include appliance labeling schemes, energy efficiency standards for buildings, industry, and
transportation and opportunities for financing energy-efficient appliances, and electricity prices.

34
One explanation for the slow initial rate of technology penetration is that heterogeneous consumers
receive different benefits from a technology (Bhattacharya and Cropper, 2010). As the cost of the
technology falls, more consumers receive positive net benefits and adopt the technology. If benefits are
normally distributed across consumers, the rate of adoption will follow an S-shaped curve (Jaffee et al.
2003). This suggests that higher energy prices or lower capital costs should increase the rate of
technology adoption. Empirical evidence from the United States suggests that higher energy prices have
encouraged the adoption of energy-efficient room air-conditioners, central air-conditioners, and gas water
heaters (Newell et al. 1999). There is, however, evidence that decreases in capital costs have had a larger
effect on adoption than corresponding increases in operating costs (Jaffe and Stavins 1994; Hassett and
Metcalf 1999). This suggests that either myopia (i.e., high discount rates) or capital market constraints
have played a role in technology.
Lack of information is another barrier. Since there are information externalities in this case—adoption by
one person conveys information to nonadopters—governments can provide information about energy
efficiency by requiring that appliances and machinery be labeled to show their energy usage and that
efficiency claims be certified. Agency problems and lack of knowledge of the life-cycle benefits of
energy-efficient technologies are also often cited as a rationale for energy efficiency standards.10
10
One classic case of agency problem often cited is if landlords make decisions regarding refrigerator and air-
conditioner purchases, but tenants play electricity costs, energycosts will not necessarily be internalized in the
purchasing decision (Sathaye et al. 2005).

35
Annex II: CIRI RE Scores for Select Countries
Figure A1: Cross-cutting CIRI Scores for Select Countries
Figure A2: Grid-Connected Solar-PV CIRI Scores for Select Countries

36
Figure A3: Grid-Connected Onshore Wind CIRI Scores for Select Countries
Figure A4: Grid-Connected Small-hydro CIRI Scores for Select Countries

37
Figure A5: Grid-Connected Biomass CIRI Score for Select Countries
Annex III: CIRI EE Scores for Select Countries
Country Cross-cutting
CIRI Scores
Lighting Appliances Buildings
ASIA India 4 6 13 4
Pakistan 1.5 2 0 0
Sri Lanka 1.5 3 0 3
China 4 32 75 4
Indonesia 3 4 10 1
Malaysia 0.5 2 9 2
Thailand 4 13 39 4
Philippines 3.5 18 25 2
Japan 4 6 66 4
LATIN
AMERICA
Argentina 4 10 20 1
Brazil 4 12 37 1
Mexico 4 10 59 4
Peru 3 1 8 0
MIDDLE EAST
Iran 1 2 20 1
Egypt 0 3 16 1

38
AFRICA
South Africa 4 4 30 3
AUSTRALIA
Australia 5 12 59 4
Top Related