


Languages
Pages
Legal


Ascott Residence Trust 1H 2013 Financial Results
23 July 2013

• Results Highlights• Portfolio Performance• Capital and Risk Management• Portfolio Information• Prospects• Appendix
Agenda
2

Disclaimer
3
IMPORTANT NOTICE
The value of units in Ascott Residence Trust (“Ascott Reit”) (the “Units”) and the income derived from them may fall as well as rise. The Units are not obligations of, deposits in, or guaranteed by Ascott Residence Trust Management Limited, the Manager of Ascott Reit (the “Manager”) or any of its affiliates. An investment in the Units is subject to investment risks, including the possible loss of the principal amount invested. The past performance of Ascott Reit is not necessarily indicative of its future performance.
This presentation may contain forward-looking statements that involve risks and uncertainties. Actual future performance, outcomes and results may differ materially from those expressed in forward-looking statements as a result of a number of risks, uncertainties and assumptions. Representative examples of these factors include (without limitation) general industry and economic conditions, interest rate trends, cost of capital and capital availability, competition from similar developments, shifts in expected levels of property rental income, changes in operating expenses, including employee wages, benefits and training, property expenses and governmental and public policy changes and the continued availability of financing in the amounts and the terms necessary to support future business. Prospective investors and Unitholders are cautioned not to place undue reliance on these forward-looking statements, which are based on the current view of the Manager on future events.

Results Highlights
4

5
1H 2013 vs 1H 2012 Performance Highlights1H 2012
150.5
Gross Profit (S$’m)
Revenue (S$’m)
1H 2013
146.6
74.7
Unitholders’ Distribution (S$’m)
Distribution Per Unit (S cents)
58.5
4.70
Revenue Per Available Unit (S$/day) – serviced residences
133
Change
-3%
-7%
14%
4%
-10%
79.9
51.3
4.52
147
1. Divestments include Somerset Grand Cairnhill Singapore and Somerset Gordon Heights Melbourne.2. Acquisitions include Ascott Raffles Place Singapore, Ascott Guangzhou, Citadines Karasuma-Gojo Kyoto and
Madison Hamburg.
• Revenue decreased by S$3.9 million or 3% due to the divestments1, partially offset by additional revenue from the acquisitions2. On a same store basis, revenue decreased due to weaker performance from China Vietnam, Singapore and Japan (arising from depreciation of JPY against SGD).
• Gross profit decreased by a greater extent due to higher staff costs and higher depreciation expense arising from the completed refurbishment of properties.
• REVPAU decreased mainly due to divestment of Somerset Grand Cairnhill, weaker performance from China and Japan (arising from depreciation of JPY against SGD).

6
2Q 2012 vs 2Q 2013 Performance Highlights2Q 2012
78.9
Gross Profit (S$’m)
Revenue (S$’m)
2Q 2013
77.4
41.0
Unitholders’ Distribution (S$’m)
Distribution Per Unit (S cents)
30.9
2.451
Revenue Per Available Unit (S$/day) – serviced residences
142
Change
-2%
-4%
14%
3%
-9%
42.7
27.1
2.38
156
1. Excluding the placement units issued in 1Q 2013, DPU for 2Q 2013 would be 2.70 cents.2. Divestments include Somerset Grand Cairnhill Singapore and Somerset Gordon Heights Melbourne.3. Ascott Raffles Place Singapore, Ascott Guangzhou and Madison Hamburg were acquired in second half last year.
• Revenue decreased by S$1.5 million or 2% due to the divestments2 and lower contribution from existing properties, mainly in China, Vietnam, Singapore and Japan (arising from depreciation of JPY against SGD), partially offset by additional revenue from the acquisitions3.
• Gross profit decreased by S$1.7 million or 4% and S$2.1 million on a same store basis. This was mainly due to lower revenue as explained above.
• Unitholders’ distribution in 2Q 2013 included a reversal of over-provision of prior years’ tax expense of S$2.7 million.
• REVPAU decreased mainly due to divestment of Somerset Grand Cairnhill, weaker performance from China and Japan (arising from depreciation of JPY against SGD).

7
Distribution Details
Distribution Period* 6 February 2013 to 30 June 2013
Distribution Rate 4.081 cents per Unit
Last Day of Trading on “cum” Basis 26 July 2013, 5pm
Ex-Date 29 July 2013, 9am
Book Closure Date 31 July 2013
Distribution Payment Date 28 August 2013
*Advanced distribution of 0.617 cents for the period from 1 January 2013 to 5 February 2013 (prior to the date on which the placement units were issued) was paid on 5 April 2013.

8
Property Valuation
• Independent valuation conducted by Jones Lang LaSalle
• Property value for 1H 2013 is higher by S$25.9 million• Higher valuations from France, Japan and United Kingdom.• Partially offset by lower valuation from Vietnam, Philippines and Germany.
• NAV per unit as at 30 June 2013 is S$1.36

Portfolio Performance
9

Master Leases
10(1) Exclude new Cairnhill serviced residence and the 14 properties acquired on 28 June 2013.
30% of Group’s gross profit contributed by master leases
21 out of 67(1) properties on master leases
5 years average weighted remaining tenure
Master Leases
Management Contracts with Minimum Guaranteed Income
Management Contracts
30%
21%
49%Group
Gross ProfitS$41.0m

11
Local Currency 1H 2013 1H 2012 1H 2013 1H 2012
France (EUR)17 Properties 11.5 11.0 10.5 10.3
Germany (EUR)3 Properties 1 2.7 1.0 2.5 1.0
Philippines (PHP)Salcedo Residences 2 - 16.2 - 13.2
Singapore (SGD)Ascott Raffles Place Singapore 3 4.5 - 3.6 -
Total (S$'m) 18.7 0.0 16.6 ##
Gross Profit ('mil)Revenue ('mil)
1. 1H 2013 includes contribution from Madison Hamburg which was acquired in November 2012.2. Somerset Salcedo Property Makati was converted from master lease to management contract, and renamed to
Salcedo Residences in July 2012.3. Ascott Raffles Place Singapore was acquired in September 2012.
CitadinesSuites
Louvre Paris
CitadinesPrestige Les Halles Paris
Citadines Croisette Cannes
Citadines Arnulfpark Munich
MadisonHamburg
Ascott Raffles Place
Singapore
Master Leases(1H 2013 vs 1H 2012)

12
Local Currency 2Q 2013 2Q 2012 2Q 2013 2Q 2012
France (EUR)17 Properties 5.8 5.5 5.2 5.1
Germany (EUR)3 Properties 1 1.5 0.5 1.3 0.5
Philippines (PHP)Salcedo Residences 2 - 8.1 - 6.6
Singapore (SGD)Ascott Raffles Place Singapore 3 2.3 - 1.9 -
Total (S$'m) 9.6 0.0 8.4 ##
Gross Profit ('mil)Revenue ('mil)
1. 2Q 2013 includes contribution from Madison Hamburg which was acquired in November 2012.2. Somerset Salcedo Property Makati was converted from master lease to management contract, and renamed to
Salcedo Residences in July 2012.3. Ascott Raffles Place Singapore was acquired in September 2012.
CitadinesSuites
Louvre Paris
CitadinesPrestige Les Halles Paris
Citadines Croisette Cannes
Citadines Arnulfpark Munich
MadisonHamburg
Ascott Raffles Place
Singapore
Master Leases(2Q 2013 vs 2Q 2012)

Management Contracts with Minimum Guaranteed Income
13
21% of Group’s gross profit contributed by management contracts with minimum guaranteed income
8 out of 67(1) properties on management contracts with minimum guaranteed income
5 years average weighted remaining tenure
(1) Exclude new Cairnhill serviced residence and the 14 properties acquired on 28 June 2013.
Master Leases
Management Contracts with Minimum Guaranteed Income
Management Contracts
30%
21%
49%Group
Gross ProfitS$41.0m

Management Contracts with Minimum Guaranteed Income (1H 2013 vs 1H 2012)
14
Local Currency 1H 2013 1H 2012 1H 2013 1H 2012 1H 2013 1H 2012
Belgium (EUR) 3.2 3.5 0.5 0.9 49 53
Spain (EUR) 1.8 2.1 0.7 1.0 61 71
United Kingdom (GBP) 12.0 11.1 5.0 5.1 105 99
Vietnam (VND)1 34.6 33.2 22.7 19.8 1,284 1,384
Revenue ('mil) Gross Profit ('mil) RevPAU
1. Revenue and Gross Profit figures for VND are stated in billions. RevPAU figures are stated in thousands.

2.0
0.7
1.8
0.4
61 55
0
10
20
30
40
50
60
70
80
90
100
0.0
1.0
2.0
3.0
Revenue ('mil) Gross Profit ('mil) RevPAU
EUR
2Q 2012 2Q 2013
Belgium
15
-10%
-43%
-10%
Revenue and RevPAU decreased mainly due to ongoing refurbishment of Citadines Toison d’Or Brussels, expected to be completed in 3Q 2013. Gross profit decreased due to
lower revenue, higher staff costs and depreciation.
CitadinesSainte-Catherine
Brussels
Citadines Toison d’Or
Brussels

1.3
0.7
1.1
0.5
9274
0102030405060708090100
0.0
1.0
2.0
Revenue ('mil) Gross Profit ('mil) RevPAU
EUR
2Q 2012 2Q 2013
Spain
16
Revenue, gross profit and RevPAU decreased mainly due to ongoing refurbishment of Citadines Ramblas Barcelona, expected to be completed in 1Q 2014.
-15%
-29%
-20%
CitadinesRamblas
Barcelona

6.4
3.2
7.1
3.3
114 124
0
20
40
60
80
100
120
140
0.0
1.0
2.0
3.0
4.0
5.0
6.0
7.0
8.0
Revenue ('mil) Gross Profit ('mil) RevPAU
GBP
2Q 2012 2Q 2013
11%
3%
United Kingdom
17
CitadinesBarbican London
CitadinesPrestige Holborn-Covent Garden
London
CitadinesPrestige South
Kensington London
CitadinesPrestige Trafalgar Square London
Revenue and RevPAU increased mainly due to stronger demand from corporate and leisure sectors. Gross profit increased due to stronger underlying performance, partially offset by higher provision of
incentive fee in view of the stronger performance in FY 2013.
9%

15.9
9.6
17.6
11.4
1,3651,233
0
200
400
600
800
1000
1200
1400
1600
0.02.04.06.08.0
10.012.014.016.018.020.0
Revenue ('bil) Gross Profit ('bil) RevPAU ('000)
VND
2Q 2012 2Q 2013
Vietnam
18
Somerset West Lake Hanoi
Revenue and gross profit increased mainly due to higher yield protection amount.
19%
-10%11%

Management Contracts
19
49% of Group’s gross profit contributed by management contracts
38 out of 67(1) properties on management contracts
Master Leases
Management Contracts with Minimum Guaranteed Income
Management Contracts
30%
21%
49%Group
Gross ProfitS$41.0m
(1) Exclude new Cairnhill serviced residence and the 14 properties acquired on 28 June 2013.

Management Contracts (1H 2013 vs 1H 2012)
20
Local Currency 1H 2013 1H 2012 1H 2013 1H 2012 1H 2013 1H 2012
Australia (AUD) 2.4 3.2 0.9 1.4 151 148
China (RMB) 71.2 52.0 22.7 20.1 575 615
Indonesia (USD) 6.1 6.2 1.8 2.1 81 81 -
Japan (JPY)1 1,002.9 855.4 498.6 405.0 8,961 7,953
Philippines (PHP) 540.6 540.2 203.9 219.9 5,109 5,942
Singapore (SGD) 13.4 25.3 6.2 14.2 210 242
Vietnam (VND)2 300.5 313.0 171.2 175.4 1,572 1,625
Revenue ('mil) Gross Profit ('mil) RevPAU1
1. RevPAU for Japan refers to serviced residences and excludes rental housing.2. Revenue and Gross Profit figures for VND are stated in billions. RevPAU figures are stated in thousands.

1.4
0.7
1.2
0.5
154 156
020406080100120140160180
0.0
0.2
0.4
0.6
0.8
1.0
1.2
1.4
1.6
Revenue ('mil) Gross Profit ('mil) RevPAU
AUD
2Q 2012 2Q 2013
1%-14%
-29%
Australia
21
Somerset St Georges
Terrace Perth
1.3
0.6
164
Same store¹
Revenue and gross profit decreased mainly due to the divestment of Somerset Gordon Heights Melbourne. On a same store basis, revenue, gross profit and RevPAU decreased due to weaker
demand from the oil and gas industries.
1. Excludes Somerset Gordon Heights Melbourne (divested in April 2012).

26.6
11.4
35.9
12.0
627 578
0
100
200
300
400
500
600
700
0.0
5.0
10.0
15.0
20.0
25.0
30.0
35.0
40.0
Revenue ('mil) Gross Profit ('mil) RevPAU
RMB
2Q 2012 2Q 2013
24.3
8.8
571
Same store¹
22
China
Somerset Grand Fortune Garden Property Beijing
Somerset Olympic Tower Property
Tianjin
Somerset Xu Hui
Shanghai
Ascott Guangzhou
Revenue and gross profit increased mainly due to contribution from the newly acquired Ascott Guangzhou. Gross profit increased by a lower extent as a result of higher staff costs, depreciation expense and property tax. On a same store basis, revenue and gross profit decreased due to the
ongoing refurbishment of Somerset Xu Hui Shanghai, expected to be completed in 3Q 2013.
1. Excludes Ascott Guangzhou (acquired in September 2012).
5%
35% -8%

3.2
1.1
3.1
1.0
84 82
0102030405060708090
0.0
0.5
1.0
1.5
2.0
2.5
3.0
3.5
Revenue ('mil) Gross Profit ('mil) RevPAU
USD
2Q 2012 2Q 2013
Indonesia
23
Ascott Jakarta Somerset Grand Citra Jakarta
-9%
Revenue and gross profit decreased mainly due to the ongoing refurbishment of Ascott Jakarta, expected to be completed in 4Q 2013.
-3%-2%

489.6
230.9
535.6
284.9
8,6569,792
0
2000
4000
6000
8000
10000
12000
0.0
100.0
200.0
300.0
400.0
500.0
600.0
Revenue ('mil) Gross Profit ('mil) RevPAU
JPY
2Q 2012 2Q 2013
13%
23%
9%
Japan
24
19 rental housing properties in Tokyo¹
Citadines Shinjuku
Tokyo
Citadines Karasuma-Gojo
Kyoto
Somerset Azabu East
Tokyo
Revenue and RevPAU increased mainly due to stronger demand from corporate and leisure sectors. Gross profit increased as a result of higher revenue, lower depreciation, and operation and
maintenance expense.
1. Somerset Roppongi Tokyo was converted to rental housing in April 2012.2. RevPAU for serviced residence properties only.
2

271.1
109.8
268.7
101.5
5,9675,062
0
1000
2000
3000
4000
5000
6000
7000
0.0
50.0
100.0
150.0
200.0
250.0
300.0
Revenue ('mil) Gross Profit ('mil) RevPAU
PHP
2Q 2012 2Q 2013
-8%
-15%
The Philippines
25
Somerset Millennium Makati
Ascott Makati Salcedo Residences1
Revenue decreased mainly due to weaker demand from project groups. Gross profit decreased due to higher staff costs and housekeeping expense.
1. Somerset Salcedo Property Makati was converted from master lease to management contract, and renamed to Salcedo Residences in July 2012.
-1%

12.9
7.17.3
3.7
248 228
0
50
100
150
200
250
300
0.0
2.0
4.0
6.0
8.0
10.0
12.0
14.0
Revenue ('mil) Gross Profit ('mil) RevPAU
SGD
2Q 2012 2Q 2013
-43%
-48%
7.6
4.0
236
Same store¹
-8%
Singapore
26
Somerset Liang Court
PropertySingapore
CitadinesMount Sophia
PropertySingapore
Revenue and gross profit decreased mainly due to the divestment of Somerset Grand CairnhillSingapore. On a same store basis, revenue, gross profit and RevPAU decreased mainly due to
disruption from the construction of MRT tunnel for the new downtown line near Somerset Liang Court and weaker demand from project groups.
1. Excludes Somerset Grand Cairnhill Singapore (divested in September 2012).

158.9
90.6
151.5
87.6
1,654 1,581
020040060080010001200140016001800
0.020.040.060.080.0
100.0120.0140.0160.0180.0
Revenue ('bil) Gross Profit ('bil) RevPAU ('000)
VND
2Q 2012 2Q 2013
-5%
-3%
-4%
Vietnam
27
SomersetGrand Hanoi
Somerset Chancellor
Court Ho Chi Minh City
Somerset Ho Chi Minh City
SomersetHoa Binh
Hanoi
Revenue and gross profit decreased due to lower office rental income, weaker market demand and reduction in corporate accommodation budgets. Gross profit decreased by a lesser extent due to
lower staff costs.

Capital and Risk Management
28

Gearing 40.2%
NAV/Unit S$1.36
29
Healthy Balance Sheet & Credit Metrics
Credit Metrics as at 30 Jun 2013
Interest Cover 4.2x
Effective Borrowing
Rate3.1%
Weighted Avg Debt to
Maturity3.1 yearsMoody’s
RatingBaa3

250.0
398.9 377.2
120.0
65.7 71.0
3.0
19%
31%30%
9%
5% 6%
<1%0
50
100
150
200
250
300
350
400
450
SGD EUR JPY GBP USD RMB AUD
S$’m
73.3
290.8
382.8
214.8
324.1
6%
22%
30%
17%
25%
0
50
100
150
200
250
300
350
400
450
2013 2014 2015 2016 2017 andafter
S$’m
30
By MaturityAs at 30 Jun 2013
By CurrencyAs at 30 Jun 2013
Medium term note
Ascott Reit’s Share of Bank Loans = S$1,285.8 million Ascott Reit’s Share of Bank Loans = S$1,285.8 million
150.0
100.0
Debt Profile

65%
32%
3%
31
Interest Rate and Debt Mix Profile
Interest Rate ProfileAs at 30 Jun 2013
19%
81%
Debt TypeAs at 30 Jun 2013
Fixed # 65%Floating # 32%Floating with interest rate caps
# 3%
Medium Term Note 19%Bank Loans 81%

32
Foreign Exchange ProfileAscott Reit’s Share of Gross Profit
YTD Jun 2013
Asia-Pacific 53%
Singapore 14%
Vietnam 12%
Philippines 9%
Japan 7%
China 6%
Indonesia 3%
Australia 2%
CurrencyShare of
Gross ProfitExchange Rate
MovementSGD 14% -
EUR 33% 2.6%
GBP 14% -1.9%
VND 12% 1.7%
PHP 9% 0.8%
JPY 7% -11.0%
RMB 6% 2.1%
USD 3% 1.5%
AUD 2% -0.6%
Total 100% 0.4%
Exchange Rate Movement from Dec 2012 to Jun 2013
Europe 47%
France 24%
UK 14%
Germany 6%
Spain 2%
Belgium 1%

Portfolio Information
33

34
Geographical Diversification
Portfolio diversified across economic cycles.
Ascott Reit’s Share of Asset Values30 Jun 2013
Asia-Pacific 62.0%Singapore 18.0%China 15.0%Japan 12.8%Vietnam 8.0%Philippines 4.7%Indonesia 2.4%Australia 1.1%
Europe 38.0%France 16.4%UK 14.6%Germany 3.7%Belgium 1.7%Spain 1.6%
Total Share of Asset ValuesS$3.2b

35
Apartment Rental Income1
By Market Segment2Q 2013
1. Properties on master leases not included.
83%
17%
Asia-Pacific
37%
63%
Europe
Corporate Travel 83%Leisure 17%
Corporate Travel 37%Leisure 63%

36
Apartment Rental Income1
By Length of Stay2Q 2013
1. Properties on master leases not included.
Average apartment rental income by length of stay is about 4 months.Average apartment rental income by length of stay is about 4 months.
1 week or less 40%Less than 1 month 14%1 to 6 months 19%6 to 12 months 10%More than 12 months 17%
40%
14%19%
10%
17%

Prospects
37

38
Outlook and Prospects Global economic recovery continues to be anaemic because of the ongoing uncertainties. Nevertheless, Ascott REIT’s extended stay business model, geographical diversification and resilience through stable income base have and will continue to help to mitigate such impact.
On 28 June 2013, Ascott REIT completed the acquisitions of three serviced residences in China and 11 rental properties in Japan. The acquisitions will strengthen Ascott REIT’s presence in the key markets of China and Japan, as well as enhancing returns to Unitholders. We will continue to actively look for accretive acquisitions in key gateway cities in Asia as well as London, Paris and key cities in Germany.
The Group is progressively executing our planned asset enhancement programmes on selected properties to capture RevPAU growth when the market conditions improve. Citadines Toison d’Or Brussels, Somerset Xu Hui Shanghai, Somerset St Georges Terrace Perth, Ascott Jakarta, and Citadines RamblasBarcelona are undergoing refurbishment.
The Group’s operating performance for FY 2013 is expected to remain profitable.

Appendix
39

Completed Asset Enhancements
Refurbishment of 51 units completed in 1Q 2013
Citadines Suites Louvre Paris
40
Apartment (Pre-refurbishment) Apartment (Post-refurbishment)

Completed Asset Enhancements
Phase 2 refurbishment of 49 units completed in 1Q 2013
Citadines City Centre Lille
41
Studio (Pre-refurbishment) Studio (Post-refurbishment)
Completed Asset Enhancements
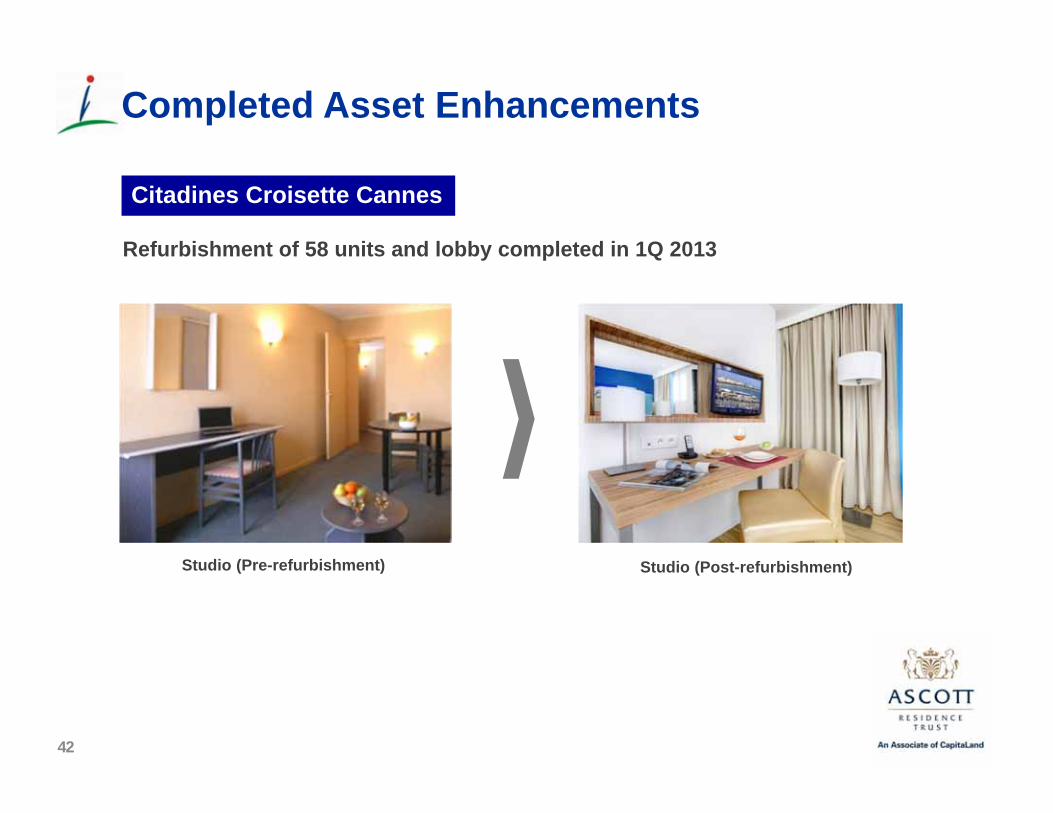
Refurbishment of 58 units and lobby completed in 1Q 2013
Citadines Croisette Cannes
42
Studio (Pre-refurbishment) Studio (Post-refurbishment)

Asset Enhancement Programmes
431. Asset enhancements for properties on master lease will be undertaken by the Master Lessee.
Properties under Master Lease1 Total No of Units Start Date Expected
Completion Date
1 Citadines Place d'Italie Paris 169 1Q 2013 2Q 2014
Properties under Management Contract Total No of Units Start Date Expected
Completion Date
1Citadines Toison d'Or BrusselsPhase 1 – 101 units
154 1Q 2013 3Q 2013
2Somerset Xu Hui ShanghaiPhase 1 – Lobby and 2 Floors
167 2Q 2013 3Q 2013
3 Somerset St Georges Terrace Perth 84 3Q 2013 1Q 2014
4 Ascott Jakarta 198 3Q 2012 4Q 2013
5 Citadines Ramblas Barcelona 131 2Q 2013 1Q 2014

Thank You
44
Top Related