


Languages
Pages
Legal


Dominic BartonGlobal Managing Partner Emeritus
McKinsey & Company
Dr Philip McRaeAssociate Coordinator, Government-Research
Alberta Teachers’ Association
Artificial Intelligence, Automation &
The Future of Public EducationJune 5, 2019 Evening Public Lecture
___________

Full Recorded Evening Public Lecture
Available at:YouTube.com/albertateachers


Artificial Intelligence, Automation &
The Future of Public Education
Dr Philip McRaeAssociate Coordinator, Government-Research
Alberta Teachers’ Association
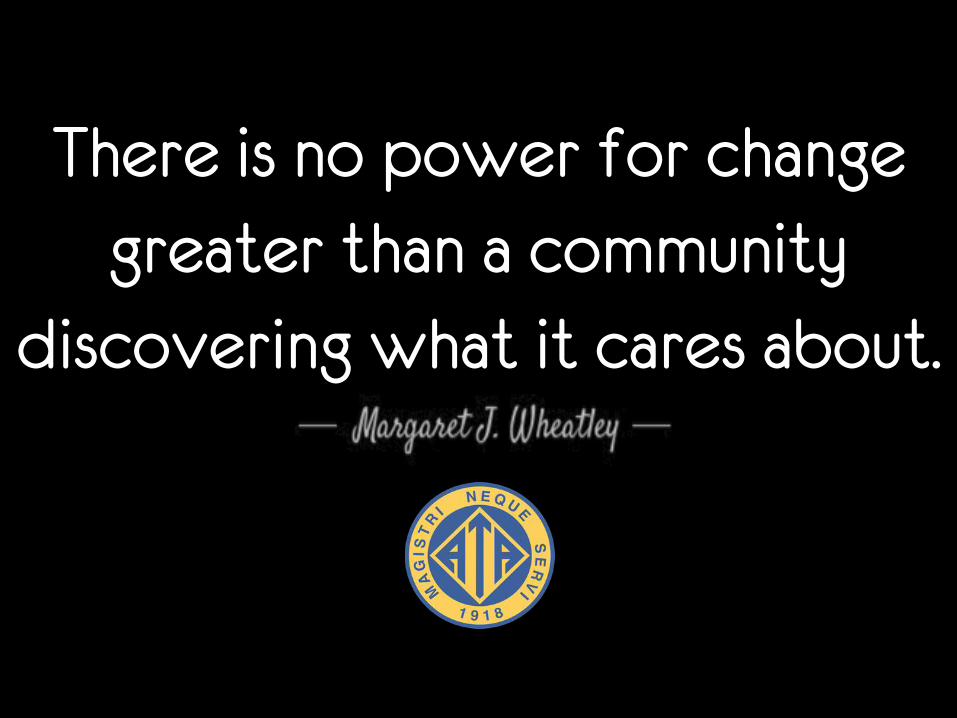
There is no power for changegreater than a community
discovering what it cares about.
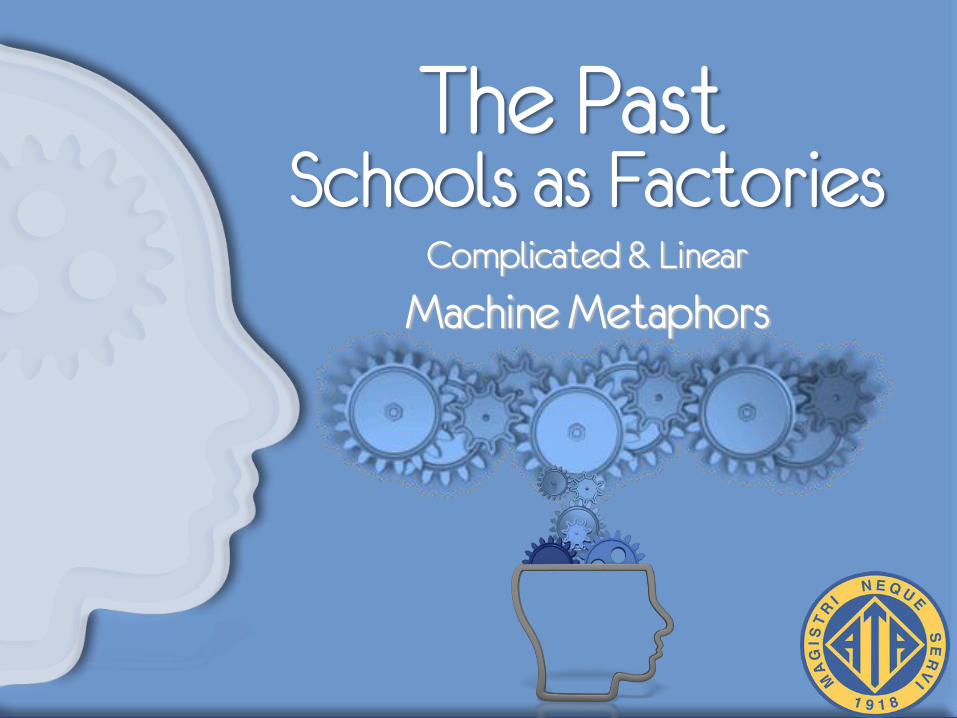
Schools as FactoriesComplicated & Linear
The Past
Machine Metaphors

Schools as GardensComplex & Dynamic
The Present
Ecosystem MetaphorsLiving Systems

2020 - 2040

“Artificial intelligence (A.I.) will reach human levels by around 2029.
By 2045 we will have multiplied our human biological intelligence
a billion fold.” — Ray Kurzweil
Inventor, Futurist, Google's Director of Engineering
Rapid Technological
Shift
~
Exponential Growth

50 Million People
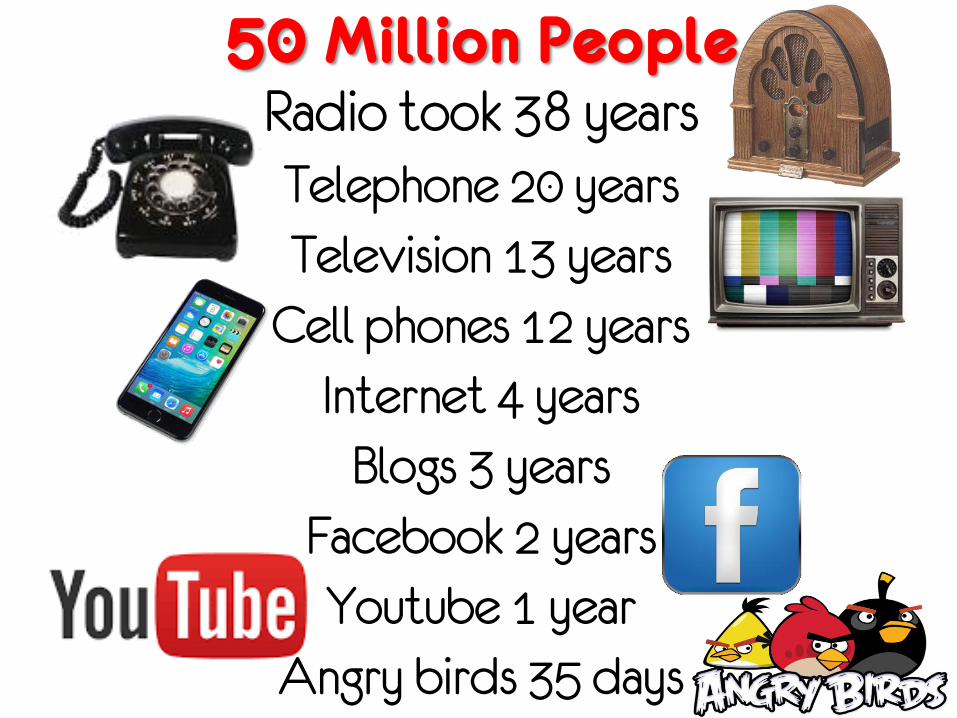
Radio took 38 yearsTelephone 20 yearsTelevision 13 years
Cell phones 12 yearsInternet 4 years
Blogs 3 yearsFacebook 2 yearsYoutube 1 year
Angry birds 35 days
50 Million People


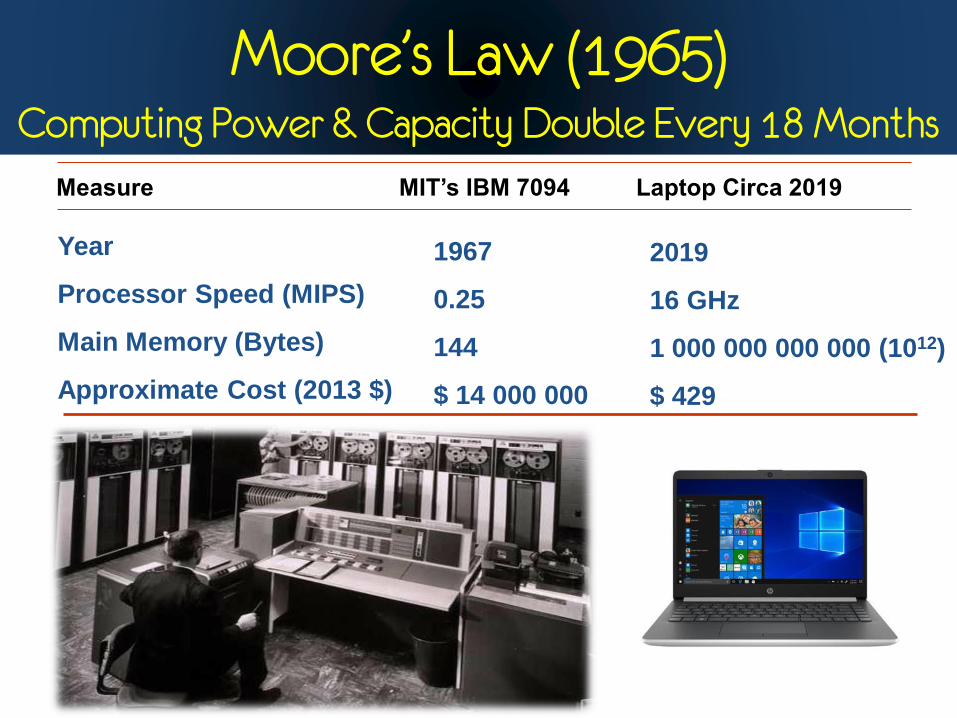
Measure MIT’s IBM 7094 Laptop Circa 2019
Year
Processor Speed (MIPS)
Main Memory (Bytes)
Approximate Cost (2013 $)
1967
0.25
144
$ 14 000 000
Moore’s Law (1965)Computing Power & Capacity Double Every 18 Months
2019
16 GHz
1 000 000 000 000 (1012)
$ 429

Measure Sunway Taihulight [CHINA] Quantum A.I. Circa 2023
Year
Processor Speed (Cal./Sec.)
Main Memory (Bytes)
Approximate Cost (2019 $)
2019
93 Quadrillion
5591 TB
$237 000 000
Moore’s Law (1965)Computing Power & Capacity Double Every 18 Months
2023
?
?
$1000 ?


Present but Absent
Smart ContactsPatent No. 13/64738
October 8, 2012
Wireless energy charging Embedded data storage Embedded wireless antennae Measurement of glucose levels Augmented reality

Blurring BoundariesNokia Patent: Vibrating Haptic Tattoos

The Internet of Me


Neuroprosthetics

2020 - 2040
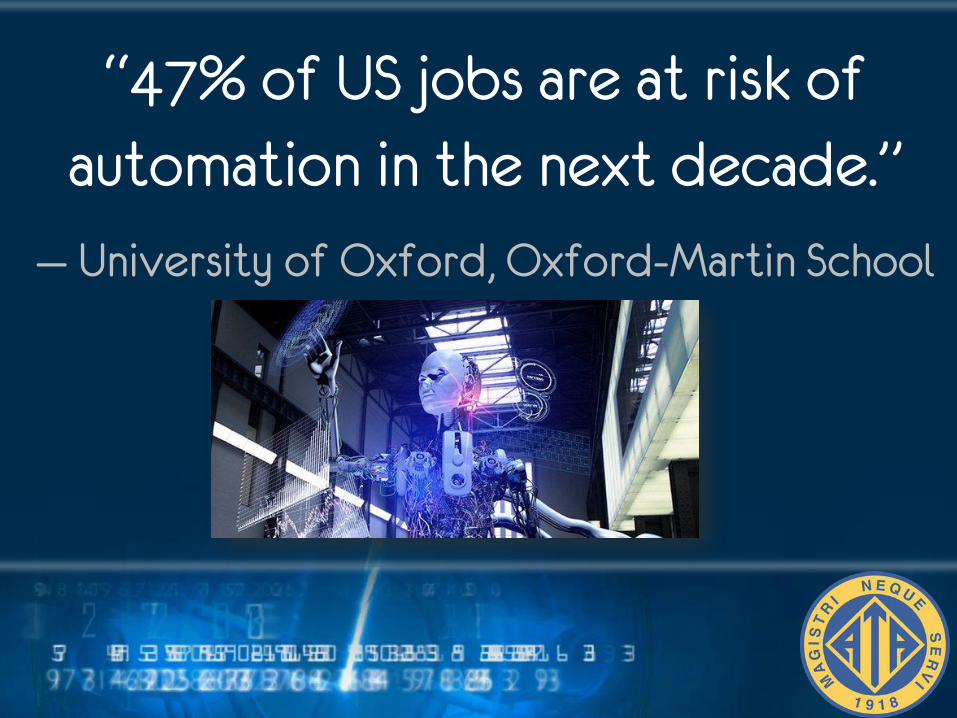
“47% of US jobs are at risk of automation in the next decade.”
— University of Oxford, Oxford-Martin School

Artificial Intelligence, Automation &
What They Mean for Education
Dominic BartonGlobal Managing Partner Emeritus
McKinsey & Company

30
Emeritus Global Managing Partner
McKinsey & Company
Dominic Barton
AI,
automation,
and what they
mean for
education
31
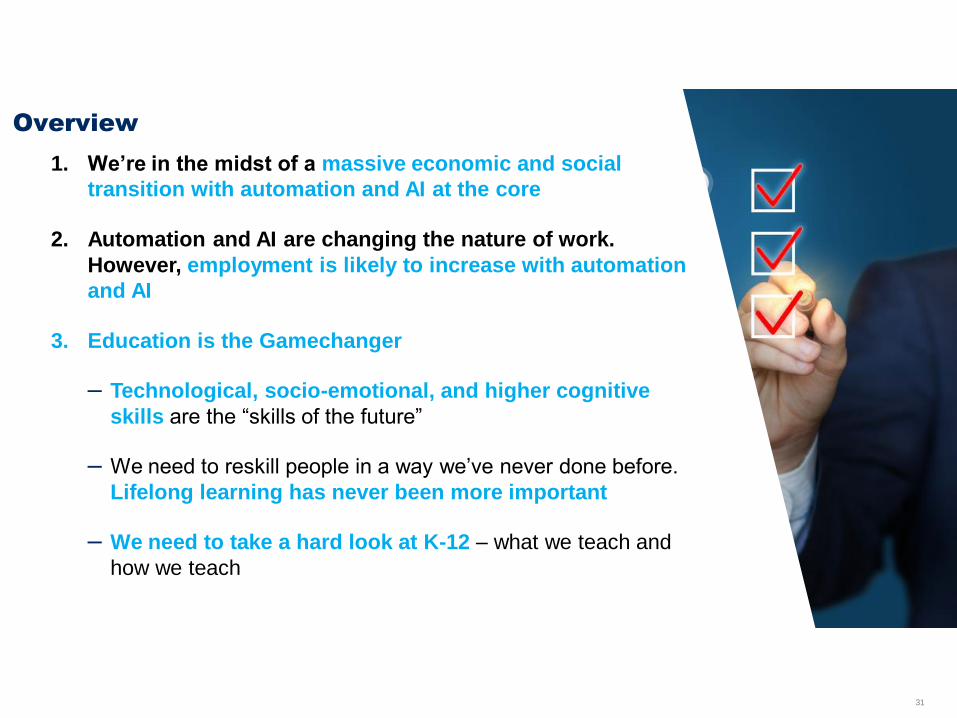
Overview
1. We’re in the midst of a massive economic and social
transition with automation and AI at the core
2. Automation and AI are changing the nature of work.
However, employment is likely to increase with automation
and AI
3. Education is the Gamechanger
– Technological, socio-emotional, and higher cognitive
skills are the “skills of the future”
– We need to reskill people in a way we’ve never done before.
Lifelong learning has never been more important
– We need to take a hard look at K-12 – what we teach and
how we teach
32
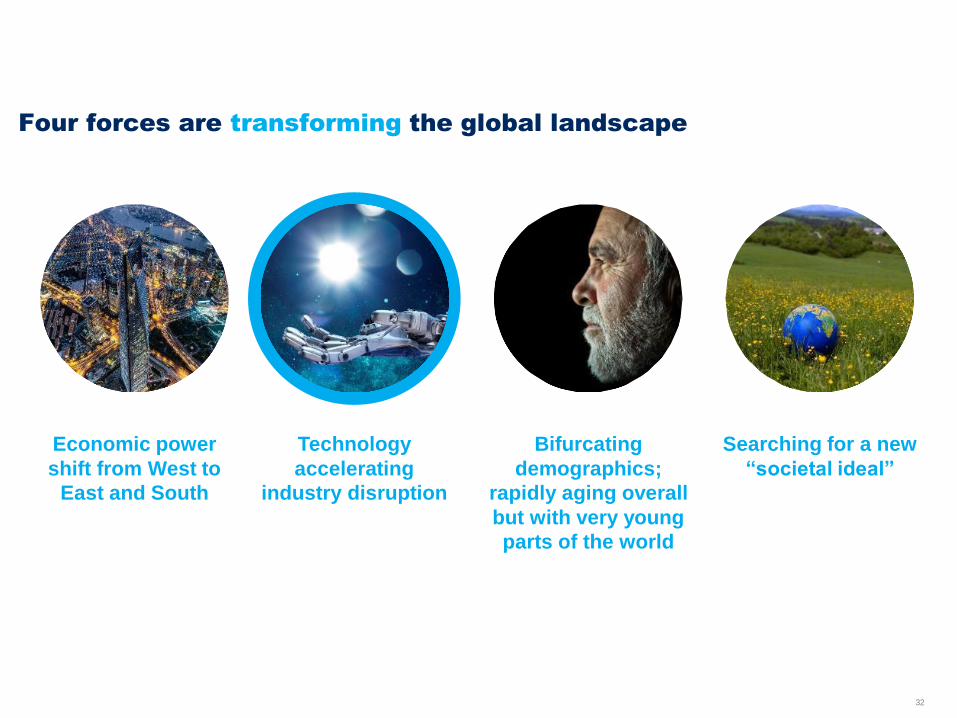
Four forces are transforming the global landscape
Economic power
shift from West to
East and South
Technology
accelerating
industry disruption
Bifurcating
demographics;
rapidly aging overall
but with very young
parts of the world
Searching for a new
“societal ideal”

33
SOURCE: McKinsey Global Institute, World Economic Forum
13 disruptive technologies are transforming business and society
Could store 10% of global GDP by 2027 according to WEF
Blockchain and cryptocurrency
$ trillions, annual
Automation of knowledge work
Mobile Internet
Internet of Things
Cloud technology
Advanced robotics
Autonomous and near-autonomous vehicles
Next-generations genomics
Energy storage
3D printing
Advanced materials
Advanced oil and gas exploration and recovery
Renewable energy
101 2 3 4 5 6 7 8 9
Range of sized potential economic impact Low High

34
SOURCE: Gartner; IBM, Apple
The pace of technological change is accelerating
3Data
1Computing
power
2Connectedness
and Intelligence
More data has been
created in the past two
years than the entire
previous history of the
human race
iPhone Xs is 300x
faster than the first
iPhone released just
10 years ago
Number of connected
devices will triple to +30
billion by 2020

35
35
30
15
0
20
5
40
25
10
2010 13 16 2017
42
12
37 +3x
Investment in AI has continued to grow exponentially fueled by
expectations of an AI market that will be over $300Bn by 2025
SOURCE: Pitchbook, Tractica
1 Estimates consist of annual VC investment in AI-focused companies, PE investment in AI-related companies, and M&A done by corporations. Includes only disclosed data available in databases, and assumes that all registered deals were completed within the year the transactions were announced.
2 Enterprise AI Revenue including software, applications, hardware, services
250
0
50
150
100
200
300
350
15
2017 21 2025
92
311
AI expected to be a +$300Bn market by
2025, growing at ~50% CAGR2
Enterprise AI revenue, $Bn Global investment in AI companies has been
tripling every 3 years1, $Bn
+46% p.a.
36
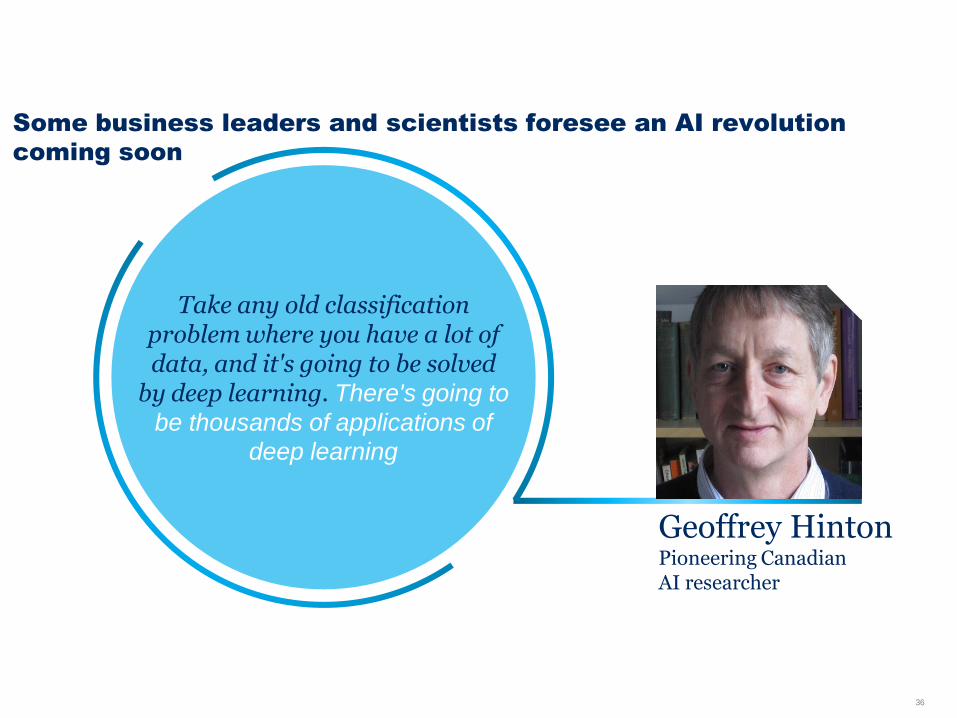
Some business leaders and scientists foresee an AI revolution
coming soon
Take any old classification problem where you have a lot of data, and it's going to be solved
by deep learning. There's going to
be thousands of applications of
deep learning
Geoffrey HintonPioneering CanadianAI researcher

37
Analytics to optimize
vehicle speed
Remote sensing to
monitor soil variability
Cloud-based data
integration
SOURCE: Goldman Sachs Innovation Symposium 2017
Cloud technology integrating data analytics in agriculture could
increase global crop yields by 10-15% – or $120-180 billion in annual
value

38
Automation
of
knowledge
work22 23
Typical Digital-
enabled
1
$250
millionin annual profit
Locomotive velocityAverage miles per hour per day

39
Effective application of AI techniques could drive up to $5.8 trillion
in incremental revenue – or up to 9% of total industry revenue
Range of sized potential economic impact Low High
SOURCE: McKinsey Global Institute
Aggregate dollar impact, $ trillions % of 2016 industry revenues
3.2 – 5.7
4.9 – 6.4
7.2 – 11.6
2.5 – 4.9
1.1 – 1.4
2.6 – 4.0
2.9 – 3.7
2.5 – 5.2
3.3 – 6.3
1.6 – 3.1
5.7 – 10.2
1.8 – 1.9
3.2 – 7.1
2.4 – 3.7
1.0 – 2.3
2.9 – 6.9
2.9 – 6.3
4.2 – 6.1
1.8 – 3.2
1.0 – 9.0
0 0.6 0.80.40.2 5.8
High tech
Oil and gas
Chemicals
Telecommunications
Basic materials
Banking
Insurance
Media and entertainment
Pharmaceuticals and medical products
Consumer packaged goods
Transport and logistics
Healthcare systems and services
Aerospace and defense
Total
Travel
3.5
Agriculture
Public and social sector
Automotive and assembly
Advanced electronics/semiconductors
Retail
5.83.5

40
Overview
1. We’re in the midst of a massive economic and social
transition with automation and AI at the core
2. Automation and AI are changing the nature of work.
However, employment is likely to increase with automation
and AI
3. Education is the Gamechanger
– Technological, socio-emotional, and higher cognitive
skills are the “skills of the future”
– We need to reskill people in a way we’ve never done before.
Lifelong learning has never been more important
– We need to take a hard look at K-12 – what we teach and
how we teach

41
1 Critical thinking, coordination, social perceptiveness,
active listening and complex problem solving
2.4 million additional
new jobs will require a
different set of “human skills1”
50% of Canadian jobswill be disrupted significantly
by automation
By 2030…
By 2022…
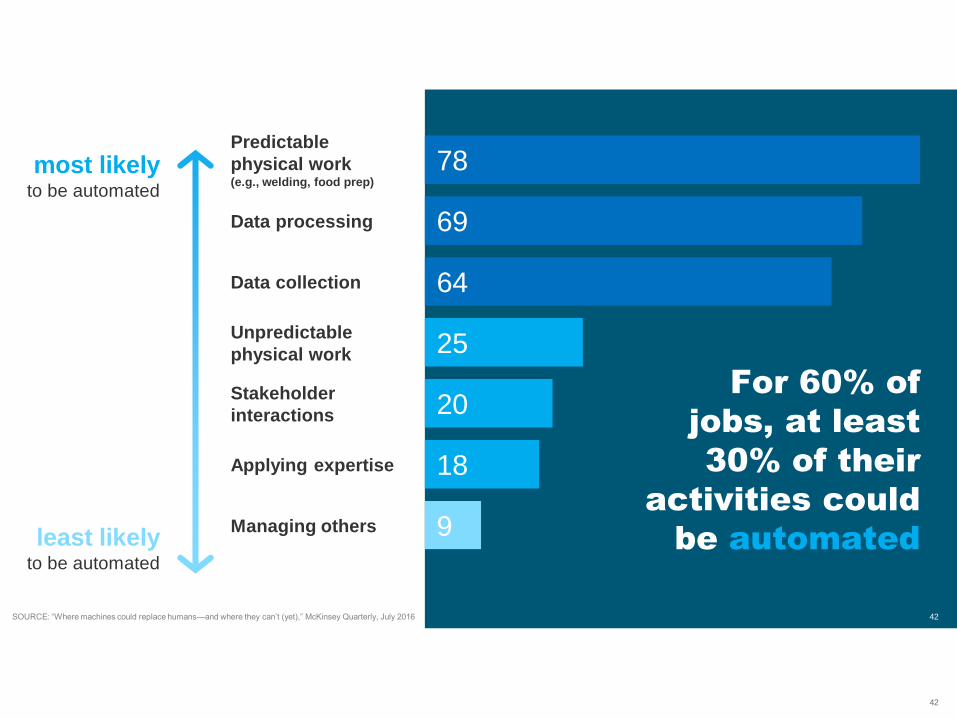
42
For 60% of
jobs, at least
30% of their
activities could
be automatedManaging others
Applying expertise
Stakeholder
interactions
Unpredictable
physical work
Data collection
Data processing
Predictable
physical work (e.g., welding, food prep)
9
18
20
25
64
69
78most likely to be automated
least likelyto be automated
SOURCE: “Where machines could replace humans—and where they can’t (yet),” McKinsey Quarterly, July 2016 42

43
We expect nearly a quarter of all work activities to be automated by
2030 – but it could be significantly higher
SOURCE: McKinsey Global Institute, Statistics Canada
1 Percent of work activities in the sector expected to be automated by 2030 2 Percent of work activities in the sector with potential for automation given current technology
30%
Total
Manufacturing
45%
Transportation and warehousing
23%
28%
Accommodation and food services
38%
32%
28%
52%
Real estate
Mining
Agriculture, forestry, fishing and hunting
22%
22%
55%
Construction
24%
Information
Retail trade
Educational services
24%Wholesale trade
42%Finance and insurance
24%Other services (except public administration)
Utilities 24%
51%
23%
Administration and government
22%
22%Arts, entertainment, and recreation
21%
19%
40%
Professional, scientific, and technical services
61%33%
45%
Health care and social assistance
17%
61%
52%
35%
17%
49%
30%
46%
44%
41%
33%
41%
Industry Automation of activities by 2030
Activities expected to be automated by 20301
Additional automation potential2

44
SOURCE: US Bureau of Labor Statistics; McKinsey Global Institute analysis
Both low and high-wage occupations have significant technical
automation potential
1 Our analysis used “detailed work activities,” as defined by O*NET, a program sponsored by the US Department of Labor, Employment and Training Administration.
20
90
50
65100 5 11015 3525 30
30
40 45
20
7050 55 60 750
80 85 90 95 100 105
40
10
60
70
80
100
Automatability1, %
Chief
executives
File
clerks
Land-
scaping
workers
Hourly wage, $
45
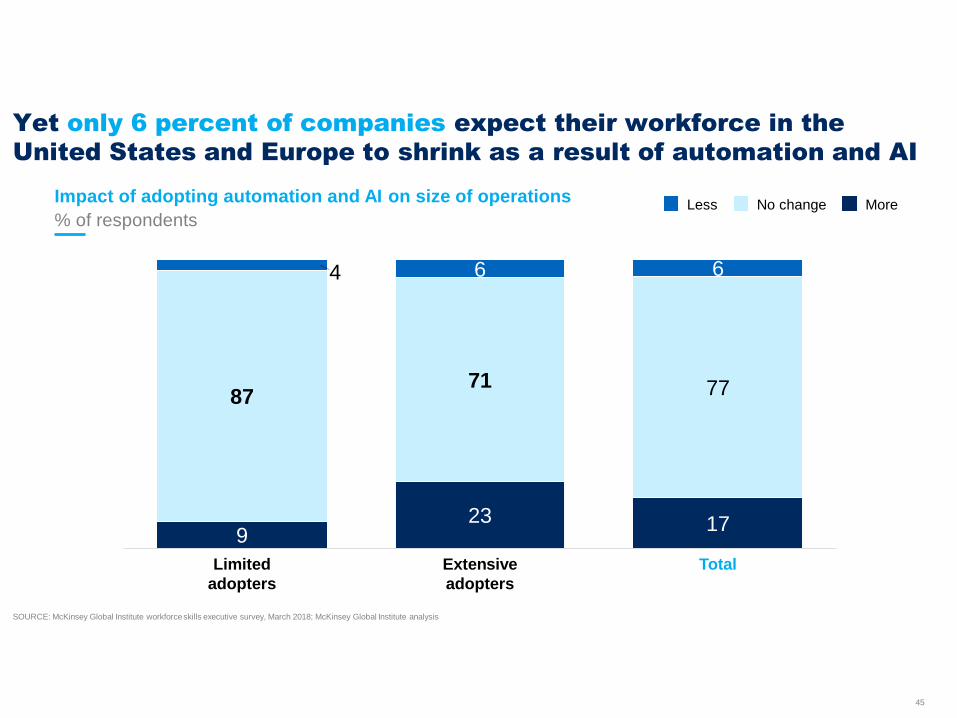
SOURCE: McKinsey Global Institute workforce skills executive survey, March 2018; McKinsey Global Institute analysis
Yet only 6 percent of companies expect their workforce in the
United States and Europe to shrink as a result of automation and AI
% of respondents
Impact of adopting automation and AI on size of operations
923 17
8771 77
4 6 6
TotalLimited
adopters
Extensive
adopters
Less No change More
46
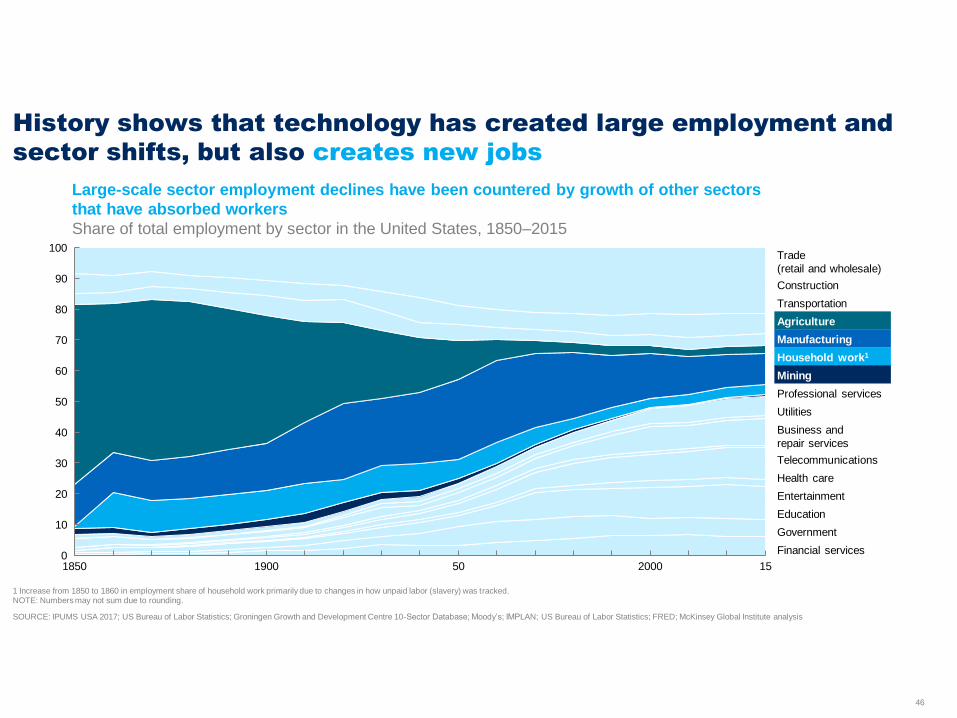
History shows that technology has created large employment and
sector shifts, but also creates new jobs
1 Increase from 1850 to 1860 in employment share of household work primarily due to changes in how unpaid labor (slavery) was tracked.NOTE: Numbers may not sum due to rounding.
Large-scale sector employment declines have been countered by growth of other sectors
that have absorbed workers
Share of total employment by sector in the United States, 1850–2015
SOURCE: IPUMS USA 2017; US Bureau of Labor Statistics; Groningen Growth and Development Centre 10-Sector Database; Moody’s; IMPLAN; US Bureau of Labor Statistics; FRED; McKinsey Global Institute analysis
30
0
90
10
20
40
60
50
70
80
100
1850 1900 50 2000 15
Trade
(retail and wholesale)
Construction
Transportation
Agriculture
Manufacturing
Household work1
Professional services
Utilities
Business and
repair services
Telecommunications
Health care
Entertainment
Education
Government
Financial services
Mining

47
Overview
1. We’re in the midst of a massive economic and social
transition with automation and AI at the core
2. Automation and AI are changing the nature of work.
However, employment is likely to increase with automation
and AI
3. Education is the Gamechanger
– Technological, socio-emotional, and higher cognitive
skills are the “skills of the future”
– We need to reskill people in a way we’ve never done before.
Lifelong learning has never been more important
– We need to take a hard look at K-12 – what we teach and
how we teach

48
Skills that will be in demand are changing – we have 5 defined
categories
Physical and
manual skills
▪ General equipment
operation and
navigation
Basic cognitive
skills
▪ Basic literacy,
numeracy, and
communication
Higher cognitive
skills
▪ Advanced literacy
and writing
▪ Critical thinking and
decision making
Social and
emotional skills
▪ Advanced
communication and
negotiation skills
▪ Interpersonal skills
and empathy
Technological
skills
▪ Basic digital skills
▪ Advanced data
analysis and
mathematical skills

49
2016 20302016 20302016 2030
Skill shifts are accelerating due to automation and AIUnited States, 2002-30
SOURCE: U.S. Bureau of Labor statistics; McKinsey Global Institute analysis
NOTE: Based on difference between hours worked per skill in 2016
Hours worked in skill categories% of time distribution
3331
26
2018
15
21 22 22
17 1821
911
16
Percentage point
change in share of
total hours
xx
Physical and
manual skills
Basic cognitive
skills
Technological
skills
2002 2016 2030 2002 2002 2016 20302002
Higher
cognitive skills
2002
Social and
emotional skills
-5 -3 0 3 5-2 -2 1 1 2
50
SOURCE: McKinsey Global Institute workforce skills executive survey, March 2018; McKinsey Global Institute analysis
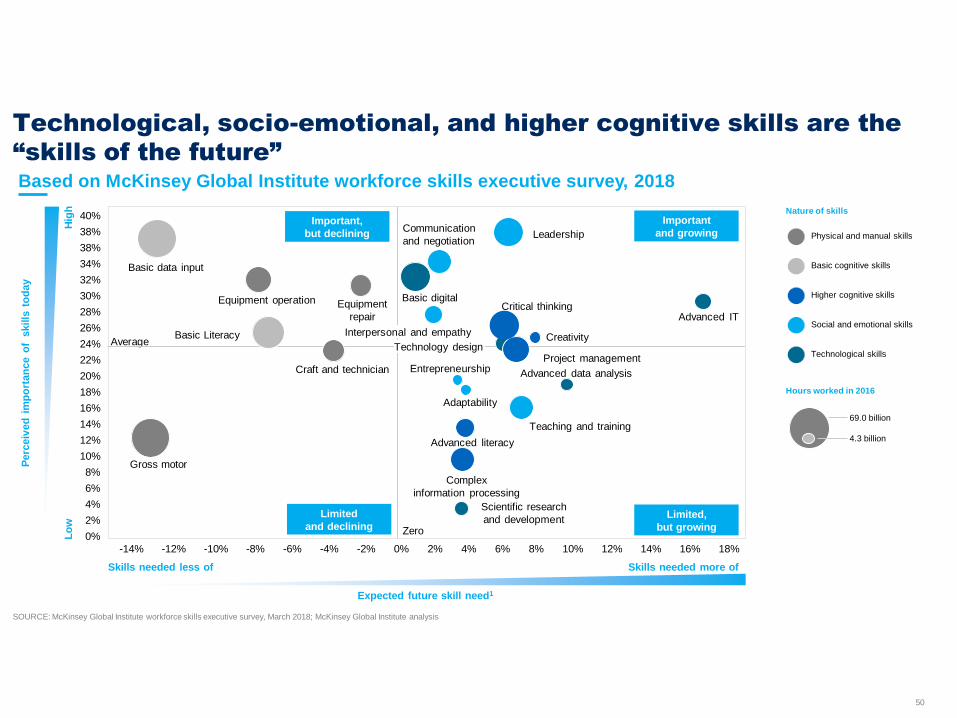
Technological, socio-emotional, and higher cognitive skills are the
“skills of the future”Based on McKinsey Global Institute workforce skills executive survey, 2018
Basic cognitive skills
Physical and manual skills
Social and emotional skills
Technological skills
Higher cognitive skills
Hours worked in 2016
69.0 billion
4.3 billion
Nature of skills
Perc
eiv
ed
im
po
rtan
ce o
f s
kills
to
day
Expected future skill need1
Hig
hL
ow
Skills needed less of Skills needed more of
Limited,
but growing
Limited
and declining
Important,
but declining
Important
and growing
Basic data input
Average
Gross motor
Basic Literacy
Equipment operation Equipment
repair
Craft and technician
Advanced IT
0%
2%
4%
6%
8%
10%
12%
14%
16%
18%
20%
22%
24%
26%
28%
30%
32%
34%
38%
38%
40%
0% 2% 4% 6% 8% 10% 12% 14% 16% 18%-2%-4%-6%-8%-10%-12%-14%
Basic digital
Communication
and negotiationLeadership
Entrepreneurship
Adaptability
Advanced literacy
Complex
information processing
Scientific research
and development
Teaching and training
Advanced data analysis
Project management
Creativity
Critical thinking
Zero
Interpersonal and empathy
Technology design
51
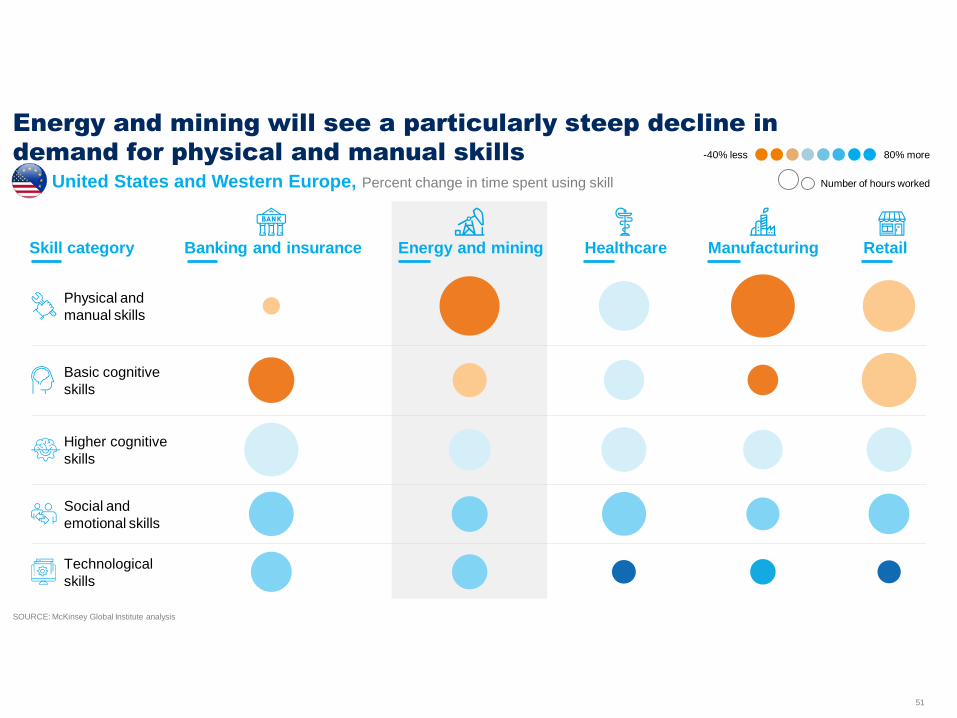
Energy and mining will see a particularly steep decline in
demand for physical and manual skills
SOURCE: McKinsey Global Institute analysis
-40% less 80% more
United States and Western Europe, Percent change in time spent using skill Number of hours worked
Skill category Banking and insurance Energy and mining Healthcare Manufacturing Retail
Technological
skills
Higher cognitive
skills
Social and
emotional skills
Basic cognitive
skills
Physical and
manual skills

52
Overview
1. We’re in the midst of a massive economic and social
transition with automation and AI at the core
2. Automation and AI are changing the nature of work.
However, employment is likely to increase with automation
and AI
3. Education is the Gamechanger
– Technological, socio-emotional, and higher cognitive
skills are the “skills of the future”
– We need to reskill people in a way we’ve never done before.
Lifelong learning has never been more important
– We need to take a hard look at K-12 – what we teach and
how we teach

53
Skill gaps are already emerging: companies say that functions that
are the most automated today have the largest skill mismatches
SOURCE: McKinsey Global Institute workforce skills executive survey, McKinsey Global Institute analysis
NOTE: Based on results of March 2018 study of more than 3,000 business leaders in 7 countries (Canada, France, Germany, Italy, Spain, United Kingdom, and the United States) and 14 sectors. Chart based on % of business leaders. Skills descriptions were shortened. Chart based on questions “When you think about how automation and AI will change your workforce skill needs, in which functions do you think skills mismatches will be largest over the next 3 years? (Select up to 3)”
and “Which of your organization’s functions have adopted automation and AI technologies to date? (Select all that apply)”
35
150 25 30105
25
6020 35 40
20
45 50 55
30
15
10
0
5
HR
Customer service
Data analyticsIT
Extent of automation and AI adoption today
% of executives who have adopted AI in function
Executive
management
Product design
Operational staff management
Channel management Risk management
Operations
Expected skills mismatch over the next 3 years
% of executives who expect large skills mismatch in function
Admin
R&DSales and marketing
Supply chain management

54
75% of global senior
executives say reskilling is
at least half of the solution to the skills gap
55
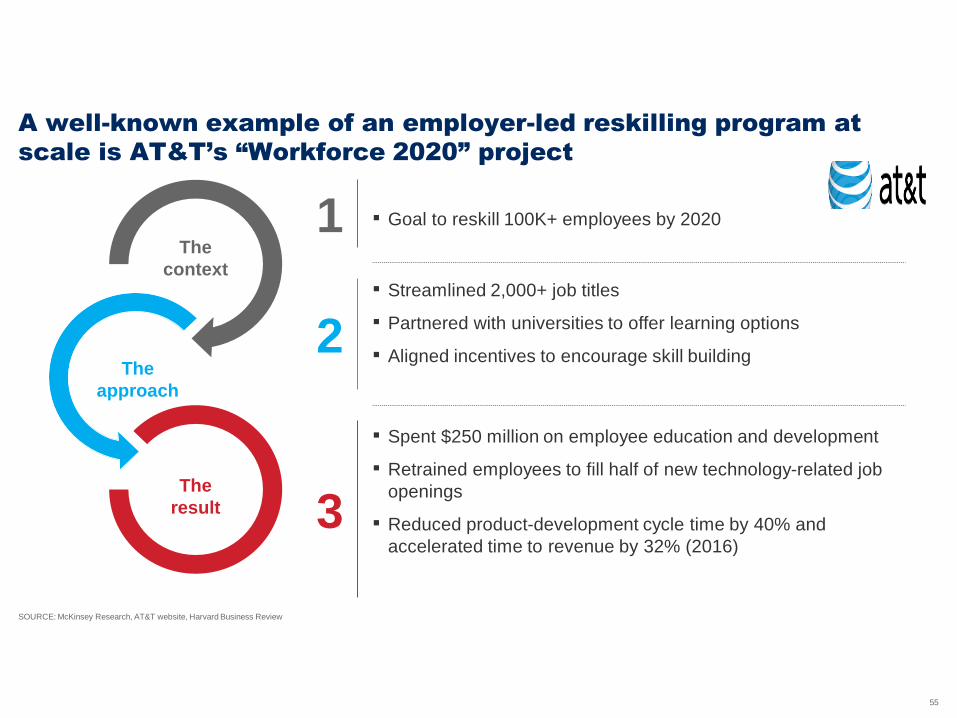
A well-known example of an employer-led reskilling program at
scale is AT&T’s “Workforce 2020” project
SOURCE: McKinsey Research, AT&T website, Harvard Business Review
The
context
The
approach
The
result
▪ Goal to reskill 100K+ employees by 2020
▪ Streamlined 2,000+ job titles
▪ Partnered with universities to offer learning options
▪ Aligned incentives to encourage skill building
▪ Spent $250 million on employee education and development
▪ Retrained employees to fill half of new technology-related job
openings
▪ Reduced product-development cycle time by 40% and
accelerated time to revenue by 32% (2016)
1
2
3

56
New government entities are being set up around the globe with
mandates to address the need for reskilling
Country/ entity Mandate
To provide world-class education and care that allows every child and
young person to reach his or her potential, regardless of background
A nation of lifelong learners: a society that values skills mastery
Enable individuals at all stages of their lives to pursue stimulating learning
opportunities across Europe
Lifelong
Learning
Program (LLP)
To have a lasting positive impact on skilling Australian workers into the
future
To provide Brazilian industry with a highly capable workforce and
competent technical assistance
To fulfill the growing need in India for skilled manpower across sectors and
narrow the gap between the demand and supply for skills
▪ Rising awareness
of need for
reskilling
support for
current workers
(not just un-
employed)
▪ Investment in
future skills, not
just current
industry needs
▪ New markets by
providing
incentives to
employers,
employees, and
training institutions
Key insights
FutureSkills LabTo be a laboratory for skills development and measurement in Canada
that informs skills and training program funding decisions of multiple players

57
Internships
Upskilling
Skills
framework
Enhanced internships Young talent program
90%
Mid-career enhanced subsidy
~9,000 69,000 126,000
Credit
Skills Framework Guide for enterprises and Singaporeans on skills required for emerging jobs
Framework
launched
Early childhood care and education
Hotel and accommodation services
Precision engineering
3
Frameworks in
the pipeline7
NEW
Singapore launched initiatives to upskill its citizens
and harmonize the skills framework
Courses offer experience in real work
environments
65% Students received funding to
participate in overseas programs
500+
Subsidies Courses offered Singaporeans
impacted
Singaporeans
registers
18,000+Approved courses
available

58
Education Unemployment Re-skilling
Canada needs a third pillar to support its workforce in the face of
unprecedented technological change
Canada’s workforce
59
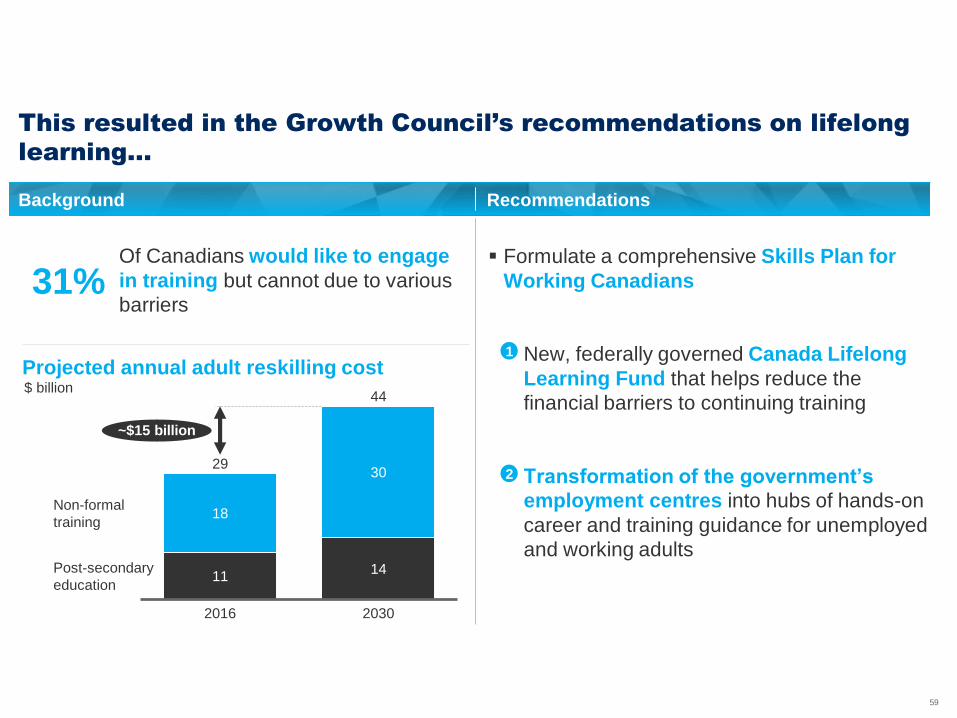
This resulted in the Growth Council’s recommendations on lifelong
learning…
Formulate a comprehensive Skills Plan for
Working Canadians
New, federally governed Canada Lifelong
Learning Fund that helps reduce the
financial barriers to continuing training
Transformation of the government’s
employment centres into hubs of hands-on
career and training guidance for unemployed
and working adults
Projected annual adult reskilling cost$ billion
Post-secondary
education11
18
2016
30
Non-formal
training
14
2030
29
44
~$15 billion
Background Recommendations
Of Canadians would like to engage
in training but cannot due to various
barriers31%
1
2
60
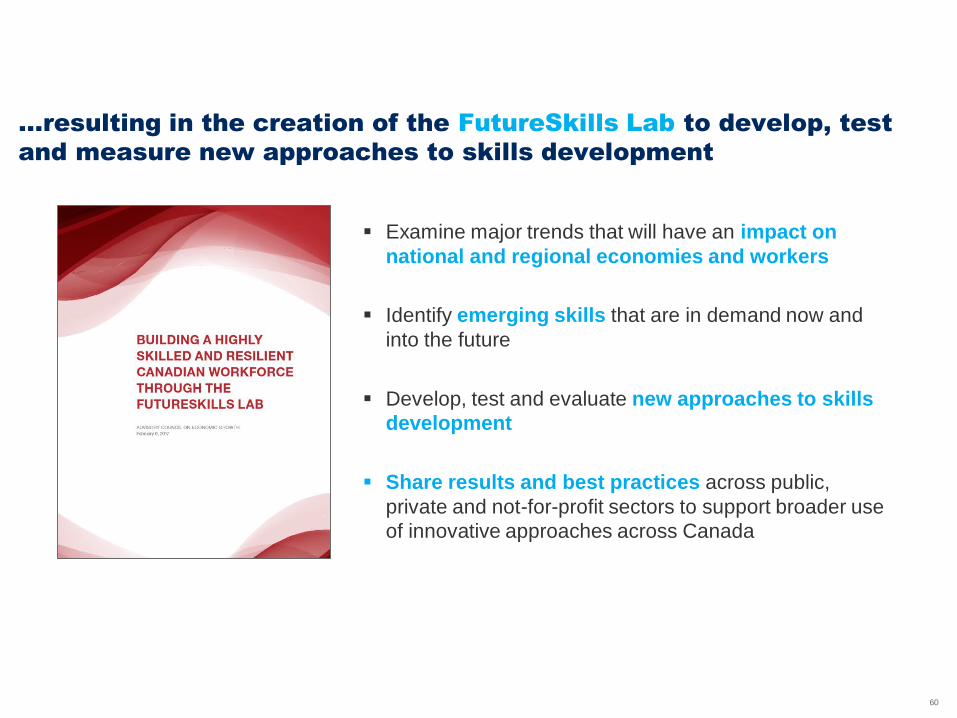
…resulting in the creation of the FutureSkills Lab to develop, test
and measure new approaches to skills development
Examine major trends that will have an impact on
national and regional economies and workers
Identify emerging skills that are in demand now and
into the future
Develop, test and evaluate new approaches to skills
development
Share results and best practices across public,
private and not-for-profit sectors to support broader use
of innovative approaches across Canada

61
Overview
1. We’re in the midst of a massive economic and social
transition with automation and AI at the core
2. Automation and AI are changing the nature of work.
However, employment is likely to increase with automation
and AI
3. Education is the Gamechanger
– Technological, socio-emotional, and higher cognitive
skills are the “skills of the future”
– We need to reskill people in a way we’ve never done before.
Lifelong learning has never been more important
– We need to take a hard look at K-12 – what we teach and
how we teach

62
Despite increased spending on primary education, we are failing
across the globe to provide a great education to every child
SOURCE: World Bank EdStats, UNESCO school totals, sizes and averages; OECD, SACMEQ, UNESCO and ACER; Results are a weighted average of the 96 countries for which enrolment, total number of students, and test data were available
70 million primary-school -age children still have no
access to schools
340millionsecondary-school-age students are out of
school
50% of those children lucky enough
to attend school are failed by
underperforming systems
$1.2 trillion
$2.8 trillion
20162002
Global K-12 education spending continues to rise

63
Alberta’s
education system
is building from a
position of
strength.
Alberta has…
63
Low variation in student performance
across the socioeconomic spectrum
Highly trained teachers with a culture of
collaborative practice
A decentralized model that pushes
pedagogical decisions to schools
and teachers
A plethora of technologies available in
its schools
64
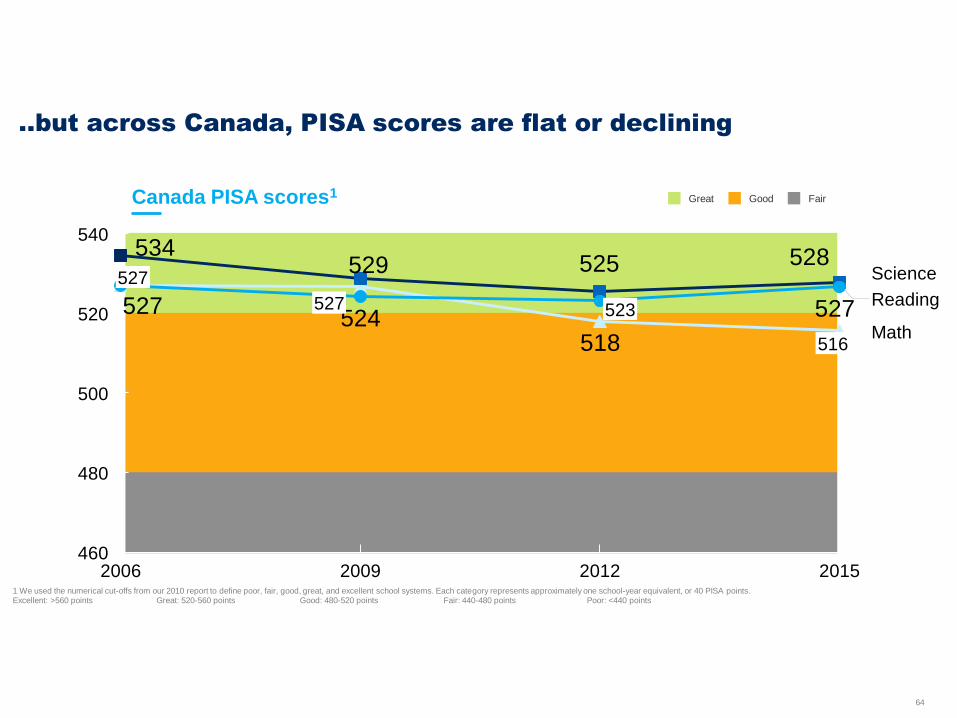
..but across Canada, PISA scores are flat or declining
Great Good Fair
518
534529 525 528
527524 527
460
500
480
520
540
2006
527
527
Science
2009
523
2012 2015
516Math
Reading
Canada PISA scores1
1 We used the numerical cut-offs from our 2010 report to define poor, fair, good, great, and excellent school systems. Each category represents approximately one school-year equivalent, or 40 PISA points.Excellent: >560 points Great: 520-560 points Good: 480-520 points Fair: 440-480 points Poor: <440 points
65
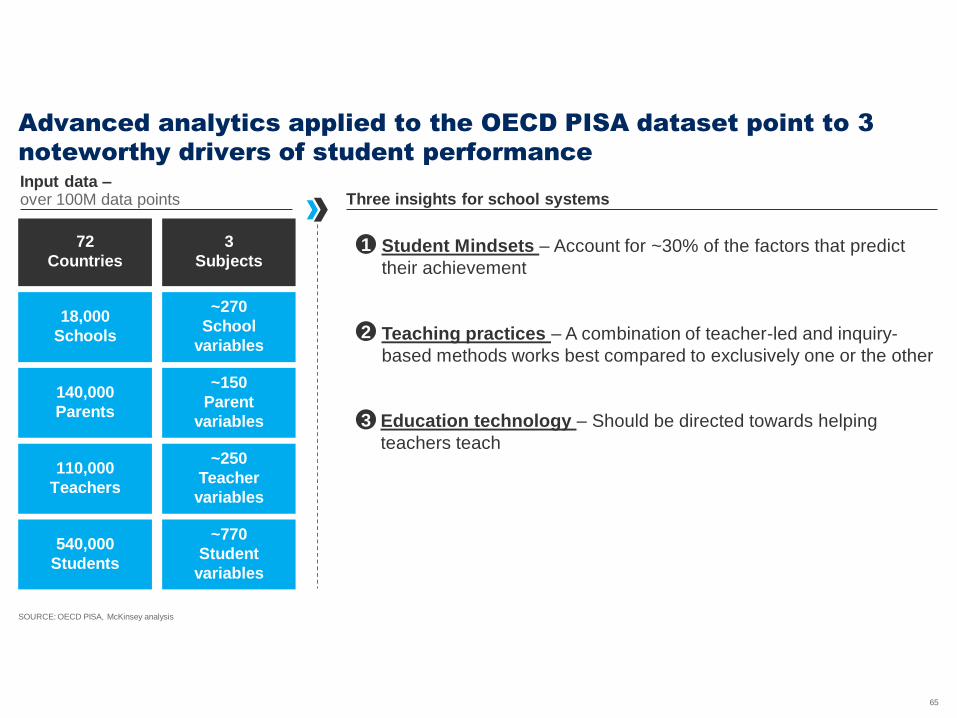
Student Mindsets – Account for ~30% of the factors that predict
their achievement
Teaching practices – A combination of teacher-led and inquiry-
based methods works best compared to exclusively one or the other
Education technology – Should be directed towards helping
teachers teach
SOURCE: OECD PISA, McKinsey analysis
Advanced analytics applied to the OECD PISA dataset point to 3
noteworthy drivers of student performance
72
Countries
3
Subjects
540,000
Students
~770
Student
variables
110,000
Teachers
~250
Teacher
variables
140,000
Parents
~150
Parent
variables
18,000
Schools
~270
School
variables
Input data –over 100M data points Three insights for school systems
1
2
3

66
Mindsets eclipse even home environment in predicting student
achievement
SOURCE: OECD PISA 2015
Factors driving Canadian student OECD PISA science performance, 2015
% of predictive power by category of variable for Canada
6 6
17 15
1816
1012
12 12
27 28
10 11
N America
Mindsets: General
Canada
Home environment
Mindsets: Subject
orientation
School factors
Student behaviors
Teacher factors
Other
100% 100%
1
Examples of subject orientation mindsets
Examples of general mindsets
"I have fun learning science"
"I see myself as an ambitious person"
"I am interested in the universe and its
history"
"What I learn in school will help get me a job"
"I feel like I belong at school"
"If I put in enough effort, I can succeed"

67
What mindsets matter most?
SOURCE: OECD PISA 2012, 2015; McKinsey analysis
Score improvement for select general mindset measures1
% increase in Canadian PISA science score
1 Statistically significant in regressions controlling for student socioeconomic status, school type, and school location2 Growth mindset from 2012 data as questions not asked in 2015; % increase in PISA math score as focus of 2012 assessment was math
16
13
6
7
7Instrumental motivation
Motivation calibration
Growth mindset2
Test anxiety
Motivation Self-identified desire to succeed
School-work and test-related anxiety
Ability to identify what motivation
looks like in day-to-day life
Belief that success in school will
lead to better career opportunities
Belief that abilities can be developed
through dedication and hard work
1
68
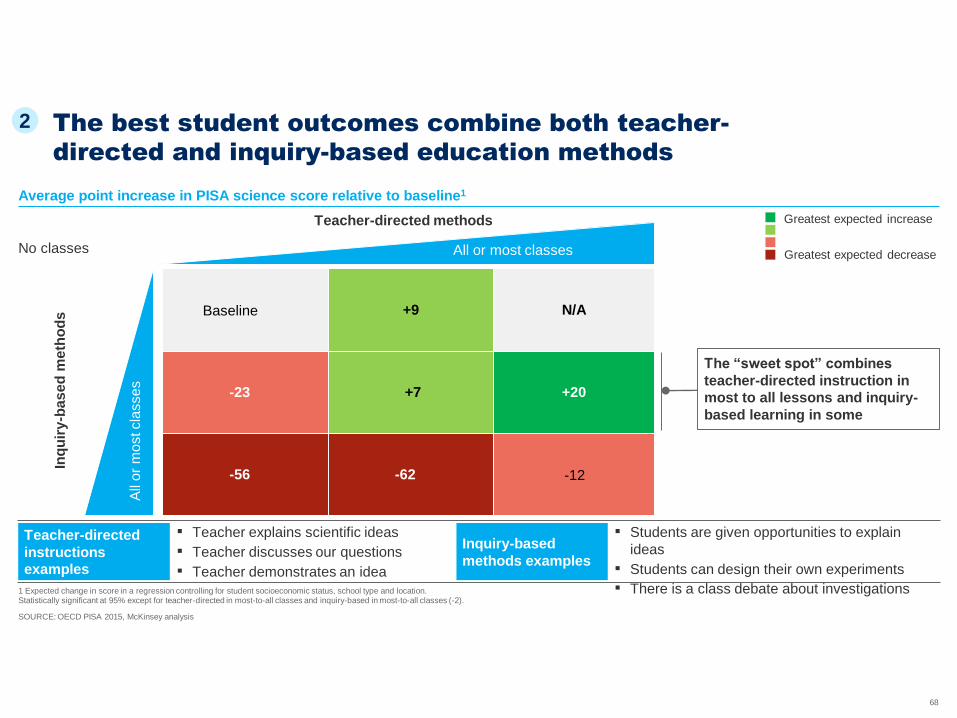
SOURCE: OECD PISA 2015, McKinsey analysis
1 Expected change in score in a regression controlling for student socioeconomic status, school type and location. Statistically significant at 95% except for teacher-directed in most-to-all classes and inquiry-based in most-to-all classes (-2).
The best student outcomes combine both teacher-
directed and inquiry-based education methods
Greatest expected increase
Greatest expected decrease
Baseline +9 N/A
-23 +7 +20
-56 -62 -12
Inq
uir
y-b
as
ed
me
tho
ds
All
or
most cla
sses
Teacher-directed methods
All or most classes
The “sweet spot” combines
teacher-directed instruction in
most to all lessons and inquiry-
based learning in some
No classes
Average point increase in PISA science score relative to baseline1
Teacher-directed
instructions
examples
Inquiry-based
methods examples
▪ Teacher explains scientific ideas
▪ Teacher discusses our questions
▪ Teacher demonstrates an idea
▪ Students are given opportunities to explain
ideas
▪ Students can design their own experiments
▪ There is a class debate about investigations
2
69
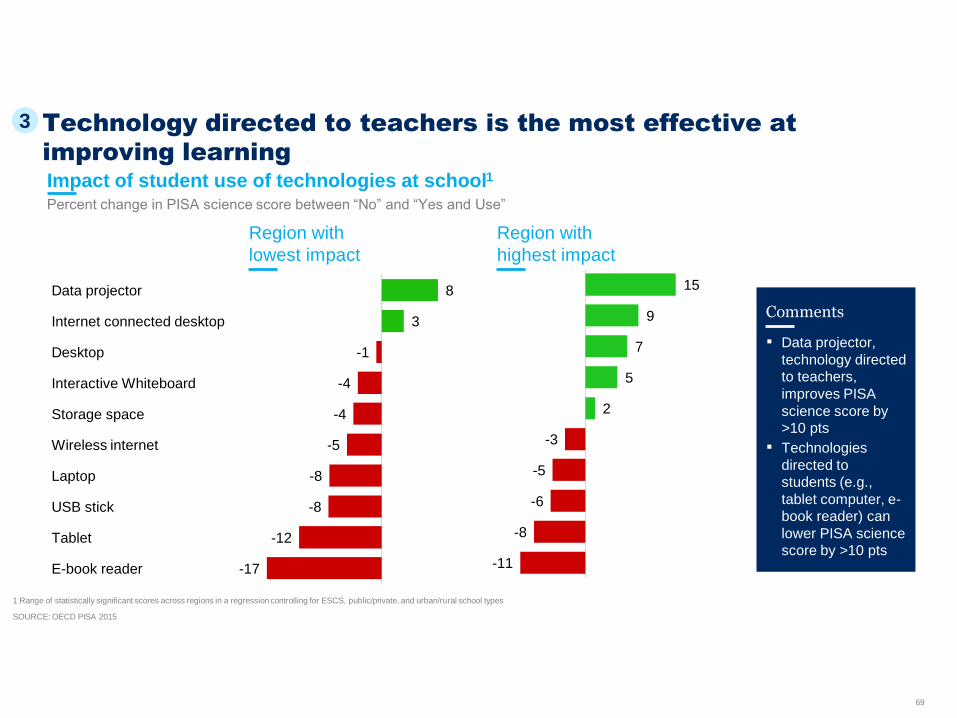
Technology directed to teachers is the most effective at
improving learning
SOURCE: OECD PISA 2015
1 Range of statistically significant scores across regions in a regression controlling for ESCS, public/private, and urban/rural school types
Percent change in PISA science score between “No” and “Yes and Use”
Impact of student use of technologies at school1
Region with
lowest impact
Region with
highest impact
Laptop
Wireless internet
Data projector
Internet connected desktop
USB stick
Desktop
Interactive Whiteboard
Storage space
Tablet
E-book reader
-5
8
3
-1
-12
-4
-4
-8
-8
-17
-6
-3
5
15
7
9
2
-5
-8
-11
69
Comments
▪ Data projector,
technology directed
to teachers,
improves PISA
science score by
>10 pts
▪ Technologies
directed to
students (e.g.,
tablet computer, e-
book reader) can
lower PISA science
score by >10 pts
3
70
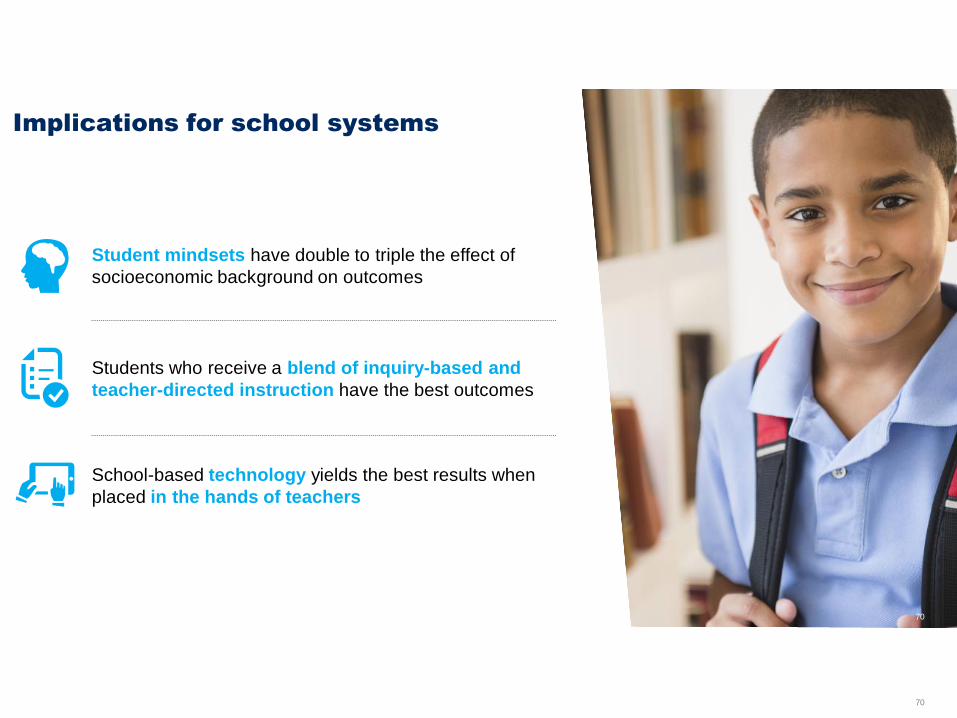
Implications for school systems
70
Student mindsets have double to triple the effect of
socioeconomic background on outcomes
School-based technology yields the best results when
placed in the hands of teachers
Students who receive a blend of inquiry-based and
teacher-directed instruction have the best outcomes
71
Emeritus Global Managing Partner
McKinsey & Company
Dominic Barton
AI,
automation,
and what they
mean for
education

Discussion
~Question & Answer~

Thank You
Top Related