


Languages
Pages
Legal


DALLAS
COLLINDENTON
DALLAS
AUSTIN
TRAVIS
WILLIAMSON
HAYS
MONTGOMERYLIBERTY
HARRIS
FORT BEND
BRAZORIA
GALVESTON
HOUSTON
In cooperation with the Texas Department of Transportation
Areal-Reduction Factors for the Precipitation of the 1-Day Design Storm in Texas
Water-Resources Investigations Report 99–4267
U.S. Department of the InteriorU.S. Geological Survey
DistrictCover_color_5.fm Page 1 Monday, December 27, 2004 11:20 AM

U.S. Department of the InteriorU.S. Geological Survey
Areal-Reduction Factors for the Precipitation of the 1-Day Design Storm in Texas
By William H. Asquith
U.S. GEOLOGICAL SURVEYWater-Resources Investigations Report 99–4267
In cooperation with the Texas Department of Transportation
Austin, Texas1999

ii
U.S. DEPARTMENT OF THE INTERIOR
Bruce Babbitt, Secretary
U.S. GEOLOGICAL SURVEY
Charles G. Groat, Director
Any use of trade, product, or firm names is for descriptive purposes only and does not imply endorsement by the U.S. Government.
For additional information write to
District ChiefU.S. Geological Survey8027 Exchange Dr.Austin, TX 78754–4733E-mail: [email protected]
Copies of this report can be purchased from
U.S. Geological SurveyBranch of Information ServicesBox 25286Denver, CO 80225–0286E-mail: [email protected]
CONTENTS iii
CONTENTS
Abstract ................................................................................................................................................................................ 1
Introduction .......................................................................................................................................................................... 1
Purpose and Scope .................................................................................................................................................... 1
Daily Precipitation Data Sources .............................................................................................................................. 2
Background and Previous Studies ............................................................................................................................ 3
Approach .............................................................................................................................................................................. 8
Annual Maxima-Centered Areal-Reduction Factors ................................................................................................ 8
Watershed Precipitation Volume ................................................................................................................... 8
Depth of Effective Precipitation and Areal-Reduction Factors ..................................................................... 9
Empirical Depth-Distance Relations From Sample-Ratio Calculation .................................................................... 10
Areal-Reduction Factors ...................................................................................................................................................... 11
Database Evaluation ................................................................................................................................................. 13
Point-Process Evaluation .............................................................................................................................. 13
Areal-Process Evaluation .............................................................................................................................. 14
Empirical Depth-Distance Relations Near Selected Localities ................................................................................ 16
Frequency Considerations ............................................................................................................................. 19
Seasonal Considerations ............................................................................................................................... 23
Estimation of Areal-Reduction Factors .................................................................................................................... 23
Application of Techniques ........................................................................................................................................ 25
Summary .............................................................................................................................................................................. 32
Selected References ............................................................................................................................................................. 34
Appendix I. Summary Statistics of Intra-Network Sample Ratios for Austin, Texas
I–1. Summary statistics of intra-network sample ratios surrounding any annual precipitation maxima
near Austin, Texas ...................................................................................................................................... 58
I–2. Summary statistics of intra-network sample ratios surrounding the 2-year or greater annual
precipitation maxima near Austin, Texas .................................................................................................. 60
I–3. Summary statistics of intra-network sample ratios surrounding the 5-year or greater annual
precipitation maxima near Austin, Texas .................................................................................................. 62
Appendix II. Summary Statistics of Intra-Network Sample Ratios for Dallas, Texas
II–1. Summary statistics of intra-network sample ratios surrounding any annual precipitation maxima
near Dallas, Texas ...................................................................................................................................... 66
II–2. Summary statistics of intra-network sample ratios surrounding the 2-year or greater annual
precipitation maxima near Dallas, Texas ................................................................................................... 68
II–3. Summary statistics of intra-network sample ratios surrounding the 5-year or greater annual
precipitation maxima near Dallas, Texas ................................................................................................... 70
Appendix III. Summary Statistics of Intra-Network Sample Ratios for Houston, Texas
III–1. Summary statistics of intra-network sample ratios surrounding any annual precipitation maxima
near Houston, Texas ................................................................................................................................... 74
III–2. Summary statistics of intra-network sample ratios surrounding the 2-year or greater annual
precipitation maxima near Houston, Texas ................................................................................................ 76
III–3. Summary statistics of intra-network sample ratios surrounding the 5-year or greater annual
precipitation maxima near Houston, Texas ................................................................................................ 78
III–4. Summary statistics of intra-network sample ratios surrounding the 10-year or greater annual
precipitation maxima near Houston, Texas ................................................................................................ 80

iv
FIGURES
1. Map showing location of study areas in Texas ..................................................................................................... 32–4. Maps showing location of stations for
2. Two precipitation-monitoring networks near Austin, Texas ...................................................................... 4
3. Two precipitation-monitoring networks near Dallas, Texas ...................................................................... 5
4. Three precipitation-monitoring networks near Houston, Texas ................................................................. 6
5. Empirical depth-distance relation and a subset of intra-network sample ratios for any annual
precipitation maxima near Dallas, Texas .............................................................................................................. 126–8. Comparison of empirical 2-year or greater depth-distance relations for
6. Two Austin precipitation-station networks, National Weather Service (NWS) and City of
Austin (AUS) .............................................................................................................................................. 15
7. Two Dallas precipitation-station networks, National Weather Service (NWS) and City of
Dallas (DAL) .............................................................................................................................................. 17
8. Three Houston precipitation-station networks: National Weather Service (NWS), Harris County
Office of Emergency Management (HAR), and Houston Urban Program (HURP) .................................. 18
9–11. Empirical depth-distance relations for selected recurrence intervals for
9. Austin, Texas .............................................................................................................................................. 20
10. Dallas, Texas .............................................................................................................................................. 21
11. Houston, Texas ........................................................................................................................................... 22
12–13. Empirical 2-year or greater depth-distance relations for
12. Winter and summer for Austin, Dallas, and Houston, Texas ..................................................................... 24
13. Austin, Dallas, and Houston, Texas ........................................................................................................... 26
14–16. Estimated 2-year or greater depth-distance relations for
14. Austin, Texas .............................................................................................................................................. 27
15. Dallas, Texas .............................................................................................................................................. 28
16. Houston, Texas ........................................................................................................................................... 29
17–18. Areal-reduction factors for 2-year or greater 1-day design storms for
17. Large circular watersheds for Austin, Dallas, and Houston, Texas ........................................................... 30
18. Small circular watersheds for Austin, Dallas, and Houston, Texas ........................................................... 31
TABLES
1. Stations for two precipitation-monitoring networks near Austin, Texas .............................................................. 35
2. Stations for two precipitation-monitoring networks near Dallas, Texas ............................................................... 39
3. Stations for three precipitation-monitoring networks near Houston, Texas ......................................................... 44
4. Abbreviated example of intra-network sample ratios surrounding any annual precipitation maxima near
Dallas, Texas ......................................................................................................................................................... 52
5. Abbreviated summary statistics of intra-network sample ratios surrounding any annual precipitation
maxima near Dallas, Texas ................................................................................................................................... 52
6. Summary of observed cumulative annual probabilities for each precipitation-monitoring network .................... 53
7. Equations that define the estimated 2-year and greater depth-distance relation and the areal-reduction
factor for circular watersheds for Austin, Dallas, and Houston, Texas ................................................................ 54
8. Example areal-reduction factor calculation for a hypothetical, linear watershed in the Austin
area ........................................................................................................................................................................ 55

Abstract 1
Areal-Reduction Factors for the Precipitationof the 1-Day Design Storm in Texas
By William H. Asquith
Abstract
The reduction of the precipitation depth from a design storm for a point to an effective (mean) depth over a watershed often is important for cost-effective design of hydraulic structures by reducing the volume of precipitation. A design storm for a point is the depth of precipitation that has a speci-fied duration and frequency (recurrence interval). The effective depth can be calculated by multiply-ing the design-storm depth by an areal-reduction factor . ranges from 0 to 1, varies with the recurrence interval of the design storm, and is a function of watershed characteristics such as watershed size and shape, geographic location, and time of year that the design storm occurs. This report documents an investigation of by the U.S. Geological Survey, in cooperation with the Texas Department of Transportation, for the 1-day design storm for Austin, Dallas, and Houston, Texas. The “annual maxima-centered” approach used in this report specifically considers the distri-bution of concurrent precipitation surrounding an annual precipitation maxima. Unlike previously established approaches, the annual maxima-centered approach does not require the spatial aver-aging of precipitation nor explicit definition of a representative area of a particular storm in the anal-ysis. Graphs of the relation between and cir-cular watershed area (to about 7,000 square miles) are provided, and a technique to calculate for noncircular watersheds is discussed.
INTRODUCTION
The reduction of the precipitation depth from a design storm for a point to an effective (mean) depth over a watershed often is important for cost-effective design of hydraulic structures by reducing precipitation volume. The hydraulic structures intended to control and route localized runoff include: drainage ditches,
culverts, road crossings, and runoff detention or reten-tion structures. A design storm for a point is the depth of precipitation that has a specified duration and fre-quency (recurrence interval). The effective depth often is computed by multiplying the design-storm depth by a “depth-area correction factor” or an “areal-reduction factor.” The areal-reduction factor is generally defined as the ratio of (1) the mean precipitation depth over a watershed resulting from a design storm to (2) the point depth of the design storm. The areal-reduction factor ranges from 0 to 1, varies with the recurrence interval of the design storm, and is a function of such characteris-tics as watershed size, watershed shape, geographic location, and time of year that the design storm occurs.
In 1996, the U.S. Geological Survey (USGS), in cooperation with the Texas Department of Transporta-tion (TxDOT), initiated a multi-component study of precipitation characteristics for Texas. The major objec-tives of this study were to (1) define the depth-duration frequency of point precipitation—design storms—for Texas, (2) investigate the extreme precipitation poten-tial of Texas, and (3) develop areal-reduction factors for the 1-day design storm in Texas. The 1-day design storm is frequently used by TxDOT and its contractors for hydraulic structure design. This report documents the third objective and is believed to be the first such study of areal-reduction factors specifically for the 1-day design storm in Texas. Asquith (1998) documents the analysis and results of the first objective, and Lanning-Rush and others (1998) documents the analy-sis and results of the second objective.
Purpose and Scope
The purpose of this report is to document an investigation of areal-reduction factors for estimation of the effective (mean) precipitation depth from 1-day design storms for watersheds in Texas. Most of this report is a comprehensive documentation of the analysis leading up to the final results, areal-reduction factors. The discussion involving the final results is brief. The reader who is familiar with the methods of areal-reduction factor estimation is directed to figures 17
ARF( ) ARF
ARF
ARF
ARF

2 Areal-Reduction Factors for the Precipitation of the 1-Day Design Storm in Texas
and 18 and the section titled “Application of Tech-niques.” The data for this investigation include the daily values of precipitation as reported (digitally) by various precipitation-monitoring networks in the vicinity of Austin, Dallas, and Houston, Texas. Detailed data verification was not possible; however, the daily precipitation values for each network were evaluated to assess data compatibility between networks (see the section “Database Evaluation”).
Daily Precipitation Data Sources
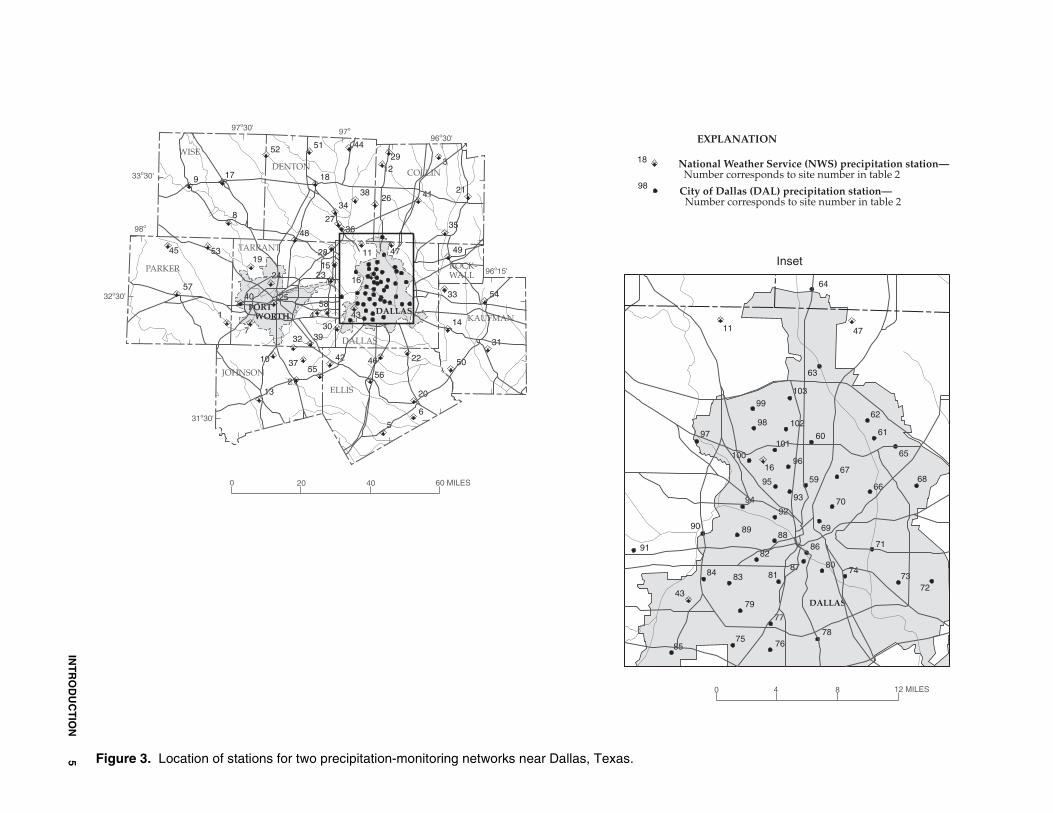
The “city databases” of daily precipitation were aggregated for Austin, Dallas, and Houston. Each city database was derived from several precipitation-station monitoring networks in the vicinity of each city. For the Austin area, two daily precipitation networks were iden-tified: 25 National Weather Service (NWS) stations (Internet address, http://www.nws.noaa.gov/) and 83 City of Austin (AUS) stations (J. David Walker, City of Austin, written commun., 1997). For the Dallas area, two daily precipitation networks were identified: 58 NWS stations and 45 City of Dallas (DAL) stations (Don Lawrence, City of Dallas, written commun., 1998). For the Houston area, three daily precipitation networks were identified: 64 NWS stations, 84 Harris County Office of Emergency Management (HAR) stations (Internet address, http://www.hcoem.co.harris.tx.us), and 45 USGS Houston Urban Program (HURP) stations (Fred Liscum, USGS, written commun., 1998). The NWS data were adopted from a CD–ROM published by Hydrosphere Data Products, Inc. (1996).
All of the stations, organized by network, are identified along with ancillary information in tables 1–3 (at end of report—Austin, table 1; Dallas, table 2; and Houston, table 3). The NWS, AUS, DAL, and HAR networks each used a three- or four-digit station num-bering system. A variable numbering system was used for the HURP network. To avoid confusion, unique “study” station numbers were assigned to the non-NWS networks. The AUS, DAL, and HAR networks were adjusted by adding 10,000, 40,000, and 70,000, respec-tively, to their original four-digit numbers. The HURP numbers were reassigned by dropping the alphabetical characters and adding 80,000 or 88,000 to the remaining numbers.
The stations in each network have varying peri-ods of record (in calendar years). In general, the NWS stations have the longest periods of record. Some NWS
stations have record lengths in excess of 80 years. Most NWS stations were still active as of 1995. In general, the AUS stations have start dates between about 1988 to 1990 and most were still active as of 1996. The DAL stations generally have a 1991 to 1997 or later period of record. The HAR stations have various start dates in the late 1980s, and most were still active as of 1997. The HURP stations have various periods of record, but in general the records start between about 1965 to 1975 and end about 1984 to 1989.
The stations in each network have varying degrees of record completeness. This record com-pleteness has important implications in the analysis. The implications are addressed in the sections “Empirical Depth-Distance Relations From Sample-Ratio Calculation,” “Point-Process Evaluation,” and “Areal-Process Evaluation.” In general, the NWS sta-tions have the most complete record; missing record occurs primarily in the beginning and ending years. The NWS stations recorded a “trace” as part of the nonzero record. These data were assumed to be zero, and were subsequently reset to zero, and included in the analysis. Trace precipitation amounts were not reported in the other networks. Individually, the Austin, Dallas, and Houston databases have about 248,000; 429,000; and 688,000 values of daily precipitation. When combined, the three databases contain about 1,365,000 values of daily precipitation.
The locations of the three study areas are shown in figure 1. Figures 2–4 show the location of each sta-tion, along with identification of its operator, for each city. In general, the NWS stations are more widely dis-persed than those for the other networks. The Austin database (fig. 2) was the smallest in overall geographic extent. The Austin database was assembled first, and preliminary analysis of the Austin database indicated that more stations (hence larger areal coverage) were needed for Dallas and Houston (figs. 3 and 4). Fortu-itously, the Dallas and Houston databases benefited from a greater NWS station density, and thus, a greater number of NWS stations per county than in the Austin area. The Houston database further benefited by having two non-NWS networks (HAR and HURP). The sta-tions in each database are reasonably well distributed geographically, except for the AUS stations, which were somewhat preferentially aligned north to south associated with how the city has grown.

INTRODUCTION 3
Background and Previous Studies
Estimation of areal-reduction factors requires the determination of effective precipitation depths. This section briefly outlines some of the various methods proposed or used to calculate effective precipitation depth—hereafter abbreviated as “ ”. Most investiga-tors have used an areal-reduction factor concept, which describes the ratio of effective precipitation (areal average) to point precipitation. Myers and Zehr (1980, p. 1–2) point out that an areal-reduction factor is the ratio of two different expectations and generally is not intended to describe the spatial or temporal variabil-ity of design storms, nor to describe the complex mor-phology of individual storms, nor to provide the basis for stochastic simulation.
Two types of areal-reduction factors—hereafter abbreviated as “ ” are commonly used. The first type of is known as the “geographically-fixed” or “fixed-area” that relates the point depth to the average depth of concurrent precipitation over a speci-fied or “fixed” area. The geographically-fixed is based on extreme value analysis of an annual time series of maxima mean precipitation for a given and fixed area. Generally, an assumption of probability equiva-
lence is made between the frequency of the point pre-cipitation to the frequency of the areal precipitation. In other words, the -year point precipitation is assumed to generate the -year volume of precipitation. The sec-ond type of is known as “storm-centered.” The storm-centered is most often associated with the calculation of for individual storms. The average storm depth is commonly derived from integration of depth contour lines divided by the maximum depth recorded in the storm (the storm center). Sivapalan and Blöschl (1998, p. 151) report that a storm-centered
is “usually somewhat smaller than [geographi-cally] fixed .”
The point and areal frequency curves (distribu-tions) would be expected to have different forms—the distribution of annual precipitation maxima point pro-cesses is far from normal (Asquith, 1998). Logic dictates that the areal distribution of the 1-day design storm would not be exactly normal because zero is the lower bound on potential precipitation for a given location within the area—whereas the normal distribu-tion has infinite lower and upper tails. The common methods of estimating areal precipitation from point observations, however, produce approximately normal distributions of areal precipitation. This occurs because
ZE
ARFARF
ARF
ARF
TT
ARFARF
ZE
ARFARF[ ]
0 50 100 150 200 MILES
Dallas study area
Austin study areaHouston study area
TEXAS
Dallas
Austin
Houston
Figure 1. Location of study areas in Texas.

4 Areal-R
edu
ction
Facto
rs for th
e Precip
itation
of th
e 1-Day D
esign
Sto
rm in
Texas
Figure 2. Location of stations for two precipitation-monitoring networks near Austin, Texas.
0 4 8 12 MILES
0 2010 30 MILES
97o15'
97o30'
97o45'
98o
30o45'
31o
98o15'
30o30'
30o15'
30o
29o45'
6 51
16 1213
14
24
22
8
23
15 9
18
19 20
32
4
25
17
7
21
10
11
47101
105
48
100
102
49
63
106
103
61
59 5758
62
104 7877
76
7971
7069
66
64 53
54
56
51
50
80
81
83
42
4039
41
38
34
36
43
37
33
27
3128
30
29
35
84107
99
85
32
26 72
73
8697
74
88
90
87
75 89 67
96 6593
9498 9291
9560
108
52
556846
4482
45
BURNET
WILLIAMSON
BLANCO
TRAVIS
HAYS BASTROP
CALDWELL
AUSTIN
AUSTIN
TRAVIS
WILLIAMSON
HAYS
24
80
National Weather Service (NWS) precipitation station— Number corresponds to site number in table 1
City of Austin (AUS) precipitation station— Number corresponds to site number in table 1
EXPLANATION
Inset
9
18
19
22
20
3 2
4
INT
RO
DU
CT
ION
5 Figure 3. Location of stations for two precipitation-monitoring networks near Dallas, Texas.
98
18 National Weather Service (NWS) precipitation station— Number corresponds to site number in table 2
City of Dallas (DAL) precipitation station— Number corresponds to site number in table 2
EXPLANATION
0 4 8 12 MILES
97
99
98
103
63
102
60
62
61
65100101
9667
94
95 59
93
92
90 8988
8286
87 8074
71
70
69
6668
91
84 83
8575
79
77
7678
81 7372
DALLAS
Inset
64
11 47
16
43
0 20 40 60 MILES
96o15'
96o30'97o97o30'
98o
33o30'
32o30'
31o30'
9 17
8
45 53
52
48
51 44
18
2638
34
2736
3
2141
35
49
1229
4711
57
1
19
24
40 25
7
10
32 39
37
458
30
2315
28
16
43
4255
256
46 22
33 54
14
31
50
13
5
20
6
COLLINDENTON
WISE
PARKER
TARRANT
DALLAS
JOHNSON
ELLIS
KAUFMAN
ROCK-WALL
FORT WORTH
DALLAS

6 Areal-R
edu
ction
Facto
rs for th
e Precip
itation
of th
e 1-Day D
esign
Sto
rm in
Texas
Figure 4. Location of stations for three precipitation-monitoring networks near Houston, Texas.
0 20 40 60 MILES
0 10 20 30 MILES
95o
94o
94o30'
95o30'
96o
96o30'
30o30'
29o30'
30o
30o
29o
28o30'
57
3955
8
19
11
9
1445
64
12
43
41 18
16
486
7
5351
52
2
4449
415
1750 62
4763
3
20
1
2122
24
61
40 29
6013
36
56
54
5958
1028
34
3731
33 27
4642
3835
5
23
30
25
26
32
118
110109
117
119
121
143
118
102
139
137
100101
131
129
138
99126
12598
124
128
123
122
127
73
74
7570
107106
976566
68
7169 67
136140
142
141
187
92
175
152
186
146149
148147 18086
156 159 8485
160
179 188
88
157 87158
108120
113 112 111114
184
184
116115 176
178
177 168133
185171135
132,169
130 170
1729694 134
174
91150
15195 153
90154
93155
89 145
82
144 103
166105
173
183
167104
83190 81
79 189
78 162
77,163
80 161 72
192182
165191193
164181
WALKER
SAN JACINTO
HARDIN
LIBERTY
MONTGOMERYORANGE
JEFFERSON
CHAMBERS
MATAGORDA
WHARTON
BRAZORIA
FORT BEND
HARRIS
WA
LL
ER
GALVES- TON
HOUSTON
GULF OF M
EXICO
GULF OF M
EXICO MONTGOMERYLIBERTY
HARRIS
FORT BEND
BRAZORIA
GALVESTON
HOUSTON
16 National Weather Service (NWS) precipitation— Number corresponds to site number in table 3
Harris County Office of Emergency Management (HAR) precipitation station—Number corresponds to site number in table 3
USGS Houston Urban Program (HURP) precipitation station—Number corresponds to site number in table 3
EXPLANATION
NOTE: The Harris County Flood Control District and USGS Houston Urban Program stations are not differentiated and plotted as open circles in the map on left for clarity.
61
40
29
13
36
10
28
59
56
54 58
60
46
3825
35
5
23
30
34
37
31
3327
32
26
76
Inset

INTRODUCTION 7
areal precipitation is estimated as weighted linear com-binations of many point observations—the central limit theorem requires that the areal distribution derived from such methods be normal (Rodriguez-Iturbe and Mejía, 1974a, p. 732) even though the point processes are not normally distributed.
Perhaps the most common sources of for the United States are Technical Paper 29 (TP–29) by the U.S. Weather Bureau (1957, 1958) and National Oceanic and Atmospheric Administration (NOAA) Atlas 2 by Miller and others (1973). TP–29 provides
for areas ranging from 0 to 400 square miles (mi2) for storm durations less than or equal to 24 hours. The TP–29 analysis is based on precipitation-monitoring networks east of the Mississippi River. TP–29 defines
as the ratio of (1) the mean annual maxima of areal precipitation to (2) the mean annual maxima of point precipitation. TP–29 presents a single curve based on 2-year recurrence intervals. This curve was judged applicable for all return periods up to 100 years.
TP–29 implicitly equates the frequency of the point precipitation to the frequency of the areal precipi-tation. This assumes that the relation between depth and area is not influenced by the frequency (recurrence interval) of the point precipitation. Leclerc and Schaake (1972) express the results of TP–29 as a single equation that shows to be a function of area and duration only:
, (1)
where
= areal-reduction factor, dimensionless;
= effective precipitation over the area, in inches;
= point precipitation or the design storm depth for recurrence interval , in inches;
= duration time, in hours; and
= area, in square miles.
Rodriquez-Iturbe and Mejía (1974a) developed a general methodology for converting any point precipi-tation to an effective precipitation. Their methodology is primarily oriented towards solutions for problems of (1) distributing precipitation from multiple inputs for rainfall-runoff modeling, (2) estimating long-term mean effective precipitation, and (3) estimating effective depths for individual storms. The of Rodriquez-Iturbe and Mejía depends solely on the correlation coef-ficient for a “characteristic correlation distance.” The
characteristic correlation distance is the expected dis-tance between two randomly chosen points in the area. The Rodriquez-Iturbe and Mejía correction factor is as follows:
, (2)
where
= expected correlation coefficient for the characteris-tic correlation distance.
Although the of equation 2 is simple, estimation of is a difficult problem with many uncertainties (Rodriguez-Iturbe and Mejía, 1974a and b). Like the other cited sources, the Rodriquez-Iturbe and Mejía approach equates the frequency of the point precipitation to the effective precipitation frequency. Although providing an extensive framework for trans-forming point depths to effective precipitation, the Rodriquez-Iturbe and Mejía approach is not specifically oriented toward estimation of the areal distribution of design storms. As reported by Sivapalan and Blöschl (1998, p. 152), “it is not clear what the relevance of [Rodriquez-Iturbe and Mejía] is to extreme [design] rainfalls.” To the author’s knowledge, the Rodriquez-Iturbe and Mejía (1974a, b) methodology has not been extensively used for estimating the of design storms.
A complex and more computationally intensive methodology—although still considered as geographi-cally-fixed—for calculation is presented in Myers and Zehr (1980). The model used by Myers and Zehr (1980, p. 1.2–3) is based on extensive statistical infer-ence to compensate for a lack of precipitation data. Myers and Zehr (1980) generated for Chicago, Ill., for many durations, areas, and frequencies. The principle difference of the Myers and Zehr approach is to spatially average the moments (mean and standard deviation) and not the depths of the precipitation within an area.
Another variant of calculation is proposed by Sivapalan and Blöschl (1998). Their approach deter-mined that depends heavily on the recurrence interval of the point precipitation process. The variance of a point precipitation process is greater than the vari-ance of an areal process. The ratio of the areal variance to point variance is known as a “variance-reduction factor.” The variance-reduction factor is estimated from the spatial correlation of precipitation. The spatial correlation is defined by all the precipitation data avail-able within a network for the duration of interest.
ARF
ARF
ARF
ARF
ARFZE
ZT------ 1 e–
1.1t0.25–e
1.1t0.25– 0.01A–( )+= =
ARF
ZE
ZTT
t
A
ARF
ARF ρ̂=
ρ
ARFρ
ARF
ZE
ARF
ARF
ARF
ARF

8 Areal-Reduction Factors for the Precipitation of the 1-Day Design Storm in Texas
Though the methods of investigation vary, the values from the various sources all show similar
behavior. values are at or near unity for very small distances or areas. For increasing areas, values decrease (decay) in exponential-like fashion. The decay of is more rapid for short duration storms (such as 30 minutes) than for long durations (such as 1 day). Fur-thermore, as the recurrence interval (intensity) of the point precipitation increases, the values decay more rapidly.
The spatial distribution of precipitation in Texas shows large variation in both space and time (demon-strated in the section “Approach”); thus, most depth-area analyses have required extensive statistical infer-ence because the underlying data sets are usually small. Because of the large amount of daily precipitation data available in Texas, an alternative approach is possible that relies on fewer assumptions. The theoretical basis of the alternative approach is presented in the next section.
APPROACH
Annual Maxima-Centered Areal-Reduction Factors
An alternative approach was adopted for the cal-culation of in Texas. The large daily precipitation databases available in Texas allowed an approach that considers the distribution of precipitation concurrent1 with and surrounding an annual precipitation maxima. Because the approach is based solely on annual precip-itation maxima and concurrent 1-day precipitation,
derived from this approach are termed “annual maxima-centered areal-reduction factors.” The annual maxima-centered approach, unlike some of the other approaches discussed in the “Background and Previous Studies” section, does not require spatial averaging of precipitation or explicit definition of a representative area. Defining the area of a particular storm before anal-ysis of its spatial distribution is a particularly difficult problem.
The first step of the annual maxima-centered approach is to define the depth-distance relation (the
relation between the design storm depth and the precip-itation depth at other locations) as a function of separa-tion distance between the two locations. The depth-distance relation is then integrated in space according to the specific size and shape of the watershed. An advan-tage of the annual maxima-centered approach is that the area over which the design storm occurs is needed only at the very end of analysis and is a known value for any watershed being considered.
Watershed Precipitation Volume
The volume of precipitation over a water-shed for a design criteria (such as a -year, 6-hour storm) can be expressed as a spatial integral over the watershed:
, (3)
where
= precipitation for each differential location ( ) and a function of the design storm precipitation.
can be formulated as the product of (the design storm depth) and some unknown spatial relation function, . , which describes the spa-tial structure of the storm and will eventually provide the basis of calculation, is dimensionless, contin-uous, nonnegative, and unbounded above. Addition-ally, it is necessary and sufficient for only the first moment (the mean) to exist for every location. Equation 3 is rewritten as:
. (4)
Either equation 3 or 4 characterizes a storm vol-ume—the precipitation is allowed to vary for every location within the watershed thereby permitting the description of the complex morphology of a storm. It is assumed, for this investigation, that the largest potential volume of a storm occurs when the storm is centered at the centroid of the watershed. Therefore, by conserva-tive definition, (a point precipitation) is located at the centroid of the watershed. Furthermore, if it is assumed that storm orientation over the watershed is unimportant—storms are assumed to be generated by an isotropic areal process— becomes symmetric and can be generalized by the separation distance between the centroid and the location of ( ). This assumption is likely invalid, but it is used here to greatly
1 “Concurrent” in this context, is used since the only time frame or duration of precipitation considered in this report is 1 day. The annual precipitation maxima are for 1 day, and precipitation surrounding the annual precipitation maxima is analyzed when it is concurrent, that is, occurring on the same day as the annual precipitation maxima.
ARFARF
ARF
ARF
ARF
ARF
ARF
V( )W( ) T
V Vd
W∫ Z ZT x y, ,( )[ ] xd yd
W∫= =
Z ZT x y, ,( )dx,dy
Z ZT x y, ,( ) ZT
S′T x y,( ) S′T x y,( )
ARF
x y,( )
V ZTS′T x y,( ) xd yd
W∫=
ZTxc yc,( )
S′Tr( )
dx,dy

APPROACH 9
simplify the mathematics. The separation distance is defined as:
. (5)
Accordingly, equation 4 can be rewritten as:
. (6)
in this form is assumed to describe the spatial structure of a storm radiating away from at the cen-troid of the watershed.
Though the storm volume model (eqn. 6) is suffi-cient for volume characterization, no two storms pro-ducing a ( = constant) located on the watershed centroid would be identical. Thus, is a random variable for each and is unique for each storm. More specifically, the spatial distribution of concurrent rain-fall with can be considered a random variable for each . Storm volume is rewritten as:
, (7)
where
= cumulative annual probability, and
= random variable having a cumulative distribu-tion function that can be different for each .
The subscript “ ” has been added to to show that with stochastic integration of equation 5, a single realization of the storm volume is generated. With this storm volume characterization, it is possible to generate many realizations of , which form a series of random variables ( , , . . ., ) of the storm volume. The series of would allow investigation of the distribu-tion of and formulation of its inverse cumulative dis-tribution function .
However, by far the majority of engineering designers do not require the actual distribution of . They only need the expected value of . The expected value of is termed the “design storm volume” for watershed and -year recurrence interval. The expected value of the design storm volume
is calculated as:
, (8)
where the expectation operator, is
. (9)
Equation 9 indicates that a single expected value of the spatial relation function, , exists; this value is a function of the recurrence interval of the design storm and the distance between the centroid and the location of each ( ) in the watershed. is referred to as the “depth-distance relation.” In essence,
describes the average spatial structure of the pre-cipitation concurrent with, and radiating from, the point of an annual precipitation maxima. is thus the expected value of the ratio between the depth at some location a distance “ ” from the point of the design storm. This definition differs from that of Rodriguez-Iturbe and Mejía (1974a, b) and Sivapalan and Blöschl (1998), who consider the spatial structure of all precip-itation for the duration of interest.
, as defined by equation 9, requires the assumption that the covariance (cross correlation) in concurrent precipitation at two non-centroid locations is insignificant. This assumption is fundamental for this investigation. Because the objective is to describe the average volume over a watershed and not the stochastic simulation of design storms, concern over the signifi-cance of ignoring the spatial covariance structure is mit-igated. Regarding equations 8 and 9, only one design volume exists for for a given watershed, which is a desirable property for design purposes. Also, no claim about the specific form of is made. Finally, the expected value (mean) of must exist for any “ .” The design storm volume is expressed as:
. (10)
Depth of Effective Precipitation and Areal-Reduction Factors
The effective precipitation over a watershed and the areal-reduction factor ( ) for recurrence interval for are expressed as:
, (11)
r( )
r x xc–( )2y yc–( )2
+=
V ZTS′T r( ) xd yd
W∫=
S′TZT
ZT ZTS′T r( )[ ]
r
ZTr
Vi ZTS′T r F,( ) xd yd
W∫=
F
S′TF S′T r( )[ ]
r
i V
ViV1 V2 Vn
ViV
V F( ) 0 F 1≤ ≤,
V F( )V F( )
V F( )W T
VT( )
VT E V F( )[ ] E ZTS′T r F,( ) xd yd
W∫= =
ZT
W∫ E S′T r F,( )[ ]dxdy=
E[]
E S′T r F,( )[ ] S′T r F,( ) Fd
0
1
∫ ST r( )= =
ST r( )
dx,dy ST r( )
ST r( )
ST r( )
r
ST r( )
VT
ST r( )S′T r( ) r
VT ZT ST r( ) xd yd
W∫=
ZE( )ARF
T ARFT( ) ZT
ZEi
Vi
AREA---------------=

10 Areal-Reduction Factors for the Precipitation of the 1-Day Design Storm in Texas
. (12)
Realizations of or analogous to could be generated. Because of linearity (eqns. 11–12), either
, , or , is needed to calculate the other values. The expected (design) values of and
are therefore calculated as:
; (13)
. (14)
To illustrate further, equation 14 can be rewritten for a circular watershed as:
, (15)
where
= circumference of a concentric circle at radius (separation distance) within the circular watershed, and
= maximum radius of the circular watershed.
Equations 14 and 15 are fundamental for calculation. Application of these equations is demon-strated through example calculations for circular and linear watersheds in the section “Application of Tech-niques.” For brevity, is dropped hereafter from ref-erence to .
Empirical Depth-Distance Relations From Sample-Ratio Calculation
The basic method for deriving empirical depth-distance relations is presented in this section. The depth-distance relation is generally described as the ratio of (1) the precipitation at a distance away from a point of the design storm to (2) the point precip-itation of the design storm. It follows that if a suf-ficiently large number of ratios from a densely spaced precipitation-station monitoring net-work are available, these “sample ratios” would provide the basis for estimating (eqn. 9).
Two prominent assumptions are made for this report. The first is that is assumed to be stationary over the area of investigation. The assumption that is stationary requires that the moments (for example: mean, standard deviation) of for a specified be position invariant, or constant within a study area. The second assumption made is that the actual temporal dis-tribution of precipitation within a day is unimportant. For example, it is assumed that a 2-hour and a 20-hour storm occurring on the same day at different locations are comparable, although it is recognized that the mete-orologic conditions generating each event could differ.
A computer program to compute the sample ratios was developed. The program produced large files containing the ratios for each of the stations in operation for each annual precipitation maxima in the database. An abbreviated example of the program output for the Dallas database is listed in table 4 (at end of report). The table identifies the station that recorded the annual maxima (central station); the station without missing precipitation records (selected station) simultaneous with the 6-month season (summer or winter) in which the annual maxima occurred; and finally, the calendar date that the annual maxima occurred. Summer is defined as April through September, and winter is defined as October through March. Additionally, the table lists the estimated cumulative annual probability and the calculated recurrence interval of the annual maxima. The relation between recurrence interval and cumulative probability is . The ratio of the annual maxima to concurrent precipitation (the “sample ratio”), and the separation distance also are listed.
Two computational checks were available in the sample-ratio program. These tests were made on the “apparent” annual precipitation maxima for a given year and given station, where “apparent annual
ARFTi
ZEi
ZT--------=
ZEi ARFTi Vi
Vi ZEi ARFTiZET
ARFT
ZET
VT
AREA---------------
ZT ST r( ) xd yd
W∫
xd yd
W∫
------------------------------------= =
ARFT
ZET
ZT---------
1ZT------
ZT ST r( ) xd yd
W∫
xd yd
W∫
------------------------------------= =
ST r( ) xd yd
W∫
xd yd
W∫
------------------------------=
ARFT
ZET
ZT---------
1ZT------
ZT 2πrST r( ) rd
R∫
2πr rd
R∫
---------------------------------------= =
2rST r( ) rd
0
R
∫
R2
----------------------------=
2πrr
R
ARF
r( )ST r( )
Z r( ) r
ZT( )Z r( ) ZT⁄( )
ST
STST
ST r
T( )F( ) T 1 1 F–( )⁄=
r
AREAL-REDUCTION FACTORS 11
maxima” represents the maximum of all the existing values for a year.
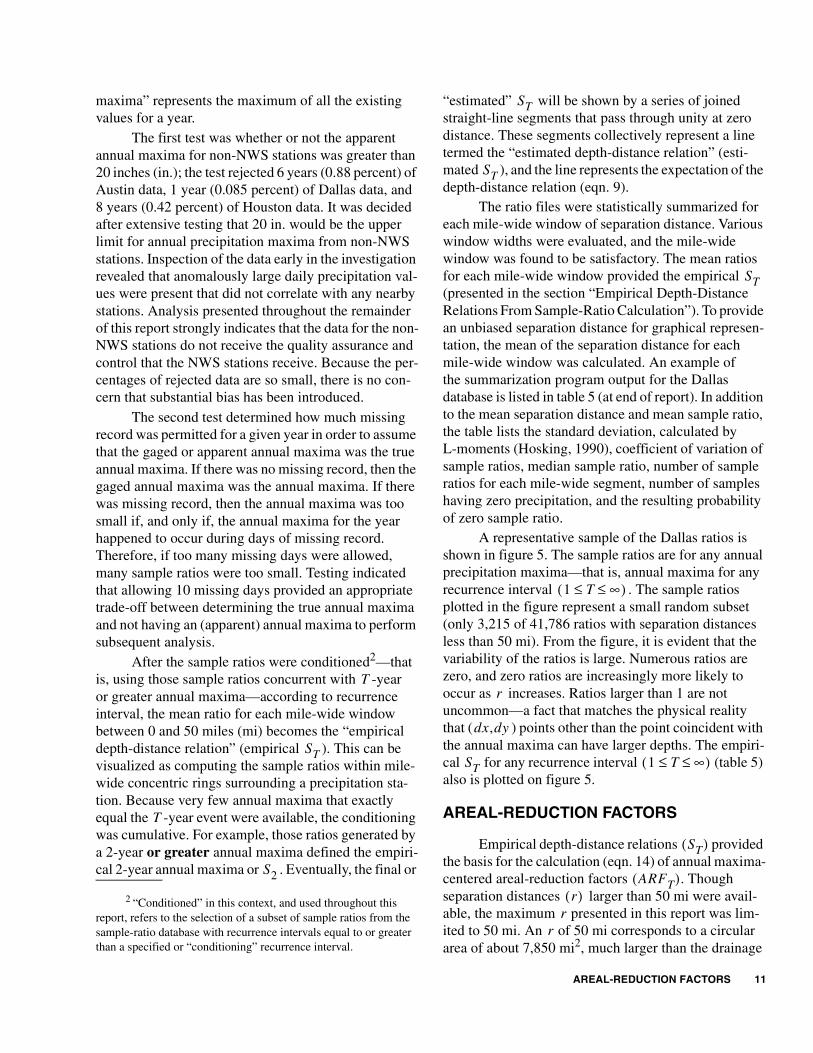
The first test was whether or not the apparent annual maxima for non-NWS stations was greater than 20 inches (in.); the test rejected 6 years (0.88 percent) of Austin data, 1 year (0.085 percent) of Dallas data, and 8 years (0.42 percent) of Houston data. It was decided after extensive testing that 20 in. would be the upper limit for annual precipitation maxima from non-NWS stations. Inspection of the data early in the investigation revealed that anomalously large daily precipitation val-ues were present that did not correlate with any nearby stations. Analysis presented throughout the remainder of this report strongly indicates that the data for the non-NWS stations do not receive the quality assurance and control that the NWS stations receive. Because the per-centages of rejected data are so small, there is no con-cern that substantial bias has been introduced.
The second test determined how much missing record was permitted for a given year in order to assume that the gaged or apparent annual maxima was the true annual maxima. If there was no missing record, then the gaged annual maxima was the annual maxima. If there was missing record, then the annual maxima was too small if, and only if, the annual maxima for the year happened to occur during days of missing record. Therefore, if too many missing days were allowed, many sample ratios were too small. Testing indicated that allowing 10 missing days provided an appropriate trade-off between determining the true annual maxima and not having an (apparent) annual maxima to perform subsequent analysis.
After the sample ratios were conditioned2—that is, using those sample ratios concurrent with -year or greater annual maxima—according to recurrence interval, the mean ratio for each mile-wide window between 0 and 50 miles (mi) becomes the “empirical depth-distance relation” (empirical ). This can be visualized as computing the sample ratios within mile-wide concentric rings surrounding a precipitation sta-tion. Because very few annual maxima that exactly equal the -year event were available, the conditioning was cumulative. For example, those ratios generated by a 2-year or greater annual maxima defined the empiri-cal 2-year annual maxima or . Eventually, the final or
“estimated” will be shown by a series of joined straight-line segments that pass through unity at zero distance. These segments collectively represent a line termed the “estimated depth-distance relation” (esti-mated ), and the line represents the expectation of the depth-distance relation (eqn. 9).
The ratio files were statistically summarized for each mile-wide window of separation distance. Various window widths were evaluated, and the mile-wide window was found to be satisfactory. The mean ratios for each mile-wide window provided the empirical (presented in the section “Empirical Depth-Distance Relations From Sample-Ratio Calculation”). To provide an unbiased separation distance for graphical represen-tation, the mean of the separation distance for each mile-wide window was calculated. An example of the summarization program output for the Dallas database is listed in table 5 (at end of report). In addition to the mean separation distance and mean sample ratio, the table lists the standard deviation, calculated by L-moments (Hosking, 1990), coefficient of variation of sample ratios, median sample ratio, number of sample ratios for each mile-wide segment, number of samples having zero precipitation, and the resulting probability of zero sample ratio.
A representative sample of the Dallas ratios is shown in figure 5. The sample ratios are for any annual precipitation maxima—that is, annual maxima for any recurrence interval . The sample ratios plotted in the figure represent a small random subset (only 3,215 of 41,786 ratios with separation distances less than 50 mi). From the figure, it is evident that the variability of the ratios is large. Numerous ratios are zero, and zero ratios are increasingly more likely to occur as increases. Ratios larger than 1 are not uncommon—a fact that matches the physical reality that ( ) points other than the point coincident with the annual maxima can have larger depths. The empiri-cal for any recurrence interval (table 5) also is plotted on figure 5.
AREAL-REDUCTION FACTORS
Empirical depth-distance relations provided the basis for the calculation (eqn. 14) of annual maxima-centered areal-reduction factors . Though separation distances larger than 50 mi were avail-able, the maximum presented in this report was lim-ited to 50 mi. An of 50 mi corresponds to a circular area of about 7,850 mi2, much larger than the drainage
2 “Conditioned” in this context, and used throughout this report, refers to the selection of a subset of sample ratios from the sample-ratio database with recurrence intervals equal to or greater than a specified or “conditioning” recurrence interval.
T
ST
T
S2
ST
ST
ST
1 T ∞≤ ≤( )
r
dx,dy
ST 1 T ∞≤ ≤( )
ST( )
ARFT( )r( )
rr

12 Areal-R
edu
ction
Facto
rs for th
e Precip
itation
of th
e 1-Day D
esign
Sto
rm in
Texas
Figure 5. Empirical depth-distance relation and a subset of intra-network sample ratios for any annual precipitation maxima near Dallas, Texas.
0 500 5 10 15 20 25 30 35 40 45
DISTANCE BETWEEN POINT OF ANNUAL PRECIPITATION MAXIMA AND SURROUNDING STATION, IN MILES
4.0
0
0.2
0.4
0.6
0.8
1.0
1.2
1.4
1.6
1.8
2.0
2.2
2.4
2.6
2.8
3.0
3.2
3.4
3.6
3.8R
AT
IO O
F C
ON
CU
RR
EN
T (
SA
ME
DA
Y)
PR
EC
IPIT
AT
ION
TO
AN
NU
AL
PR
EC
IPIT
AT
ION
MA
XIM
A, D
IME
NS
ION
LES
S
Intra-network mean sample ratio for anyannual precipitation maxima
Empirical depth-distance relation for anyannual precipitation maxima defined bythe intra-network mean sample ratiosfrom Appendix II–1
DALLAS
Note: 3,215 of 41,786 intra-network sampleratios are shown in the figure.

AREAL-REDUCTION FACTORS 13
areas for which values are frequently needed or for which a single would be expected to be appro-priate for volume estimation. The following sections include some evaluations of each network. These eval-uations provide assessment of relative network perfor-mance and compatibility.
A discussion of the evaluations is required to fully document exactly which data were used for the analysis. Empirical are discussed in a later section of this report entitled “Empirical Depth-Distance Relations Near Selected Localities.” This section also discusses the influence that recurrence interval and the season of occurrence of the annual precipitation max-ima have on the spatial distribution of precipitation.
Database Evaluation
Before either an empirical or an estimated can be derived from the networks for each city, an assess-ment of network performance and compatibility was necessary. Each network was operated by a different agency. The considerable differences in operation methods include, but are not limited to, differing instru-ment styles (recording or nonrecording), instrument types (tipping bucket or weighing), instrument models and manufacturers, instrument heights (above ground), instrument exposure (airports compared with residential backyards), reporting times (midnight to midnight or 8:00 a.m. to 8:00 a.m.), and instrument calibration (maintenance and accuracy of leveling). A comprehen-sive analysis of the real and potential systematic biases between the networks and of individual biases between the stations is outside the scope of this study; however, two important evaluations were performed for each net-work. One evaluation considered the performance of each network in recording the annual precipitation max-ima (a point process). The second evaluation considered distribution of concurrent precipitation surrounding the point of an annual maxima (an areal process)—the sec-ond evaluation basically is a comparison of several derived from various combinations of stations in the networks.
Point-Process Evaluation
The evaluation of how well the stations in each network recorded the annual precipitation maxima was based on the comparison of observed cumulative annual probabilities to defined probabilities. If the theoretical 2-year 1-day precipitation depth for a particular station in Austin is about 3.4 in., then about 50 percent of the
observed annual precipitation maxima at the station will be less than 3.4 in. The 2-year event—the median event—has a 50-percent cumulative annual probability. Counting the number of times that the observed annual precipitation maxima for a station did not equal or exceed the depth for the defined recurrence interval and dividing the count by the total number of observed annual precipitation maxima (“storms”) provided an “observed cumulative annual probability.” The observed cumulative annual probabilities were com-pared to the defined probabilities (recurrence interval). The defined probabilities for the evaluation were 0.10, 0.20, 0.50, 0.80, and 0.90, which correspond to recur-rence intervals of 1.111, 1.25, 2, 5, and 10 years. Esti-mates of the daily precipitation depth corresponding to each of the defined probabilities for each station within each network were derived from Asquith (1998).
Asquith (1998) presents a comprehensive study of the (point) depth-duration frequency of precipitation for Texas. From this study, essentially two independent methods are available to estimate the depth for the “defined cumulative annual probability” of the daily precipitation for each station. One method is based on the generalized logistic distribution, fit to the L-moments of the 24-hour annual precipitation maxima from many hourly recording NWS stations. The second method is based on the generalized extreme-value distribution, fit to the L-moments of the 1-day annual precipitation maxima from many daily NWS stations. The parameters of both the gener-alized logistic and extreme-value distributions are listed for each station in tables 1–3 (see Asquith, 1998, for further details; and Hosking, 1990, for related statistical theory). The depth of the defined cumulative probability of 1-day annual precipitation maxima was calculated from each method, and the resulting depths were aver-aged. It was then assumed that the average cumulative probability represents the “best” available estimate of the unknown cumulative distribution function of the 1-day design storm.
The observed cumulative annual probabilities for each of the precipitation-monitoring networks are listed in table 6 (at end of report). The differences between the defined and observed nonexceedance probabilities are also listed. Most of these differences are negative, which indicates that each network was systematically underestimating the assumed true precipitation quan-tiles. (Quantiles are the precipitation depths for given durations and probabilities and are derived from Asquith (1998) and based on total record for NWS
ARFARF
ST
ST
ST

14 Areal-Reduction Factors for the Precipitation of the 1-Day Design Storm in Texas
stations.) Daily observations of precipitation (fixed-interval recording) are known to underestimate the true 24-hour precipitation depth by about 14 percent (Weiss, 1964). Asquith (1998) included Weiss bias corrections. The correction for the bias was only possible on the overall mean of the annual maxima of the time series and the scale or variation of the time series. It is not pos-sible to correct individual annual maxima for the bias. Also contributing to the negative differences in table 6 was the fact that computations were done unless there were more than 10 missing days (see fig. 4, and corre-sponding discussion). The annual maxima will be too small if the true annual maxima for the year occurred during days of missing record.
The differences between the defined and observed cumulative probabilities decreased in the “tails” of the distribution (0.10, “left or lower tail”; or 0.90, “right or upper tail”) for all the networks and were largest near the middle (0.50). The reason for the largest difference near the middle was not readily apparent, and the scope of this study precluded further investigation.
The defined-observed probability differences, which generally were smaller for the NWS stations than for the other station networks, possibly could be related to NWS instrumentation and record length. The clima-tological network of the NWS is widely regarded as reliable and accurate. The stations in the NWS network are expected to have less bias because of standardized instrumentation and calibration (previously identified). The NWS stations generally have longer periods of record. Larger sample sizes allow more precise statisti-cal inferences that are less likely to be biased because of climatic cycles.
The HURP stations also show small defined-observed probability differences, and in some cases the differences are smaller than for the NWS stations. Thus, the HURP stations might provide an important indepen-dent verification of the daily precipitation frequency values from Asquith (1998). The HURP stations benefit by having considerably longer record lengths than either the AUS, DAL, and HAR networks. Statistics derived from the HURP stations therefore are expected to better estimate the unknown population statistics. However, the stations in the HURP network have much more missing record than the NWS stations, which sug-gests that the HURP stations are actually over-recording precipitation depths (as discussed in the next section), and it is a coincidence that the annual maxima from the HURP stations nearly match the annual maxima from the NWS stations.
Areal-Process Evaluation
An evaluation was conducted to assess network compatibility of the annual precipitation maxima with the concurrent daily precipitation. The basis of the eval-uation was the empirical derived specifically from each network. For example, if the empirical from each network are similar, then the networks were recording essentially the same information about the spatial distribution of precipitation. The empirical that are used to judge network compatibility corre-sponds to stations surrounding annual maxima that are greater than or equal to the 2-year recurrence interval. The “conditioned” empirical are referred to as the “empirical 2-year or greater depth-distance relations” or empirical .
Various empirical derived from the AUS and NWS networks in the Austin area are presented in fig-ure 6. The plotted points represent the mean sample ratio calculated independently from each network (intra-network) without regard to the presence of, or “cross” comparison to, the other network. The number of samples available to compute each mean ratio also is shown. The mean ratio decreases for increasing dis-tance. The AUS network provides most of the available ratio information for small separation distances. The NWS network provides most of the available ratio information for large separation distances.
The “intra-network empirical ” (solid line) (fig. 6) represents the combined weighted average of the AUS and NWS mean ratios, and is based on sample ratios derived individually within each network. In other words, the intra-network empirical for a particular network is derived independently from the other networks. The solid line closely matches AUS ratios when no NWS ratios (small distances) are avail-able, and closely matches the NWS ratios when no AUS ratios (large distances) are available. The “inter-network empirical ” (heavy, longer dashed line) is based on sample ratios derived from cross comparison of NWS (AUS) annual precipitation maxima to AUS (NWS) concurrent precipitation.
The dotted or shorter dashed line represents the combination of the intra- (within) and inter- (between) network lines. Initially, this line was considered the best estimate of because the line contains both the ratios derived from within and between the networks—more data are supposed to yield a better estimate. However, that line is systematically smaller than the intra-network relations. This implies a substantial and nonrandom bias
STST
ST
ST
S2S2
S2
S2
S2
S2

AR
EA
L-R
ED
UC
TIO
N F
AC
TO
RS
15
Figure 6. Comparison of empirical 2-year or greater depth-distance relations for two Austin precipitation-station networks, National Weather Service (NWS) and City of Austin (AUS).
24
15
12
20
50
32
36
57
19
6074
44
42
6042
25
99
51
95
24
63
77
72
57
69
56
59
40
35
61 6797
58
25
43
30
36
4946
20104
48
46,47
17
103
186225
245
245
236
241
242
230181 183
167
133
99
8776
51
37
31
18
14
13
11
0 5010 20 30 40
DISTANCE BETWEEN POINT OF ANNUAL PRECIPITATION MAXIMA AND SURROUNDING STATION, IN MILES
0.1
1.0
0.2
0.3
0.4
0.5
0.6
0.7
0.8
0.9
1.0
AUSTIN
RA
TIO
OF
CO
NC
UR
RE
NT
(S
AM
E D
AY
) P
RE
CIP
ITA
TIO
N T
OA
NN
UA
L P
RE
CIP
ITA
TIO
N M
AX
IMA
, DIM
EN
SIO
NLE
SS
Intra-network (within) empirical 2-year or greater depth-distance relation derived from weighted averages of the NWS and AUS precipitation station ratios
Combined intra- and inter-network empirical 2-year or greater depth-distance relation derived from the NWS and AUS precipitation stations
Inter-network (between) empirical 2-year or greater depth-distance relation derived from cross-comparing the NWS and AUS precipitation stations
Intra-network mean sample ratio for at least 2-year annual precipitation maxima from AUS stations—Number indicates observed samples within each mile-wide window. (Mean ratios for <10 samples are not shown.)
Intra-network mean sample ratio for at least 2-year annual precipitation maxima from NWS stations—Number indicates observed samples within each mile-wide window. (Mean ratios for <10 samples are not shown.)
24
14

16 Areal-Reduction Factors for the Precipitation of the 1-Day Design Storm in Texas
when comparing the precipitation recorded between the networks. This bias is indicated by the lack of similarity between the inter-network empirical and the intra-network empirical .
To explain the bias, it is concluded that the AUS network has a systematic and negative bias. Specifi-cally, the AUS network under-records precipitation depths when recording daily precipitation, although the magnitude of the bias is unknown. The negative bias conclusion is supported by three lines of evidence. First, and most important, because the AUS network systematically under-recorded the annual maxima (table 6), it follows that the network would under-record precipitation. Second, even though the intra-network ratios from the AUS network are slightly larger than similar intra-network ratios from the NWS network, a curvilinear best-fit line would smoothly pass through both the AUS and NWS intra-network ratios. The intra-network ratios are therefore judged to be compatible. This analysis is essential, because, although the data from the AUS network are biased, the AUS and NWS data points are deemed comparable because the system-atic bias of the AUS network is divided out when the sample ratios are calculated. The third line of evidence is more complicated and requires the following extended explanation.
If the data from the AUS network were underes-timated, the ratios of AUS concurrent precipitation to NWS annual maxima (AUS/NWS) would be too small. Accordingly, the ratios of NWS concurrent pre-cipitation to AUS annual maxima (NWS/AUS) would be too large. If the number of AUS/NWS ratios equaled the number of NWS/AUS ratios, the inter-network empirical would be expected to be equivalent to the intra-network empirical . However, it is much more common for an AUS station to have more than 10 days of missing record—10 days was the maximum amount of missing record allowed for a station before rejecting a year (fig. 4). Substantially more NWS annual maxima are available; therefore, substantially more negatively biased (smaller) AUS/NWS ratios are available than the positively biased (larger) NWS/AUS ratios. There were 5,707 ratios of AUS concurrent precipitation to NWS annual maxima and 2,483 ratios of NWS concurrent precipitation to AUS annual maxima available. As a result, the inter-network empirical is systematically too small.
Because of the above arguments, the ratios judged to best represent the spatial distribution of precipitation surrounding annual maxima in the Austin area were the
intra-network ratios rather than the inter-network ratios. The intra-network ratios for the AUS and NWS net-works were judged compatible and were used in the final analysis (next section).
Empirical derived from the DAL and NWS networks for the Dallas area are presented in figure 7. Similar to the Austin data (fig. 6), the mean ratios decrease for increasing distance. The intra-network DAL mean ratios are larger than the intra-network NWS mean ratios for comparable distances. However, the two networks show nearly the same mean ratio for separa-tion distances between about 7 to 11 mi—a large num-ber of samples from both networks are available in this range. As in the discussion for the Austin database, the inter-network empirical is substantially less than the intra-network empirical . There are 3,148 ratios of DAL concurrent precipitation to NWS annual maxima and 2,636 ratios of NWS concurrent precipitation to DAL annual maxima available. The ratios judged to best represent the spatial distribution of precipitation surrounding annual maxima in the Dallas area are intra-network ratios rather than inter-network ratios. The intra-network ratios for the DAL and NWS networks are judged compatible and were used in the final analy-sis (next section).
Empirical , derived from the NWS, HAR, and HURP networks in the Houston area, are presented in figure 8. These are analogous to those derived for Austin and Dallas. Conclusions comparable to that presented for Austin and Dallas databases can be made. Specifically, for the inter-network empirical , there are 33,180 ratios of HAR or HURP concurrent precipitation to NWS annual maxima; 19,846 ratios of NWS or HURP concurrent precipitation to HAR annual maxima; and 8,030 ratios of NWS or HAR concurrent precipitation to HURP annual maxima available.
The intra-network HURP mean ratios do not con-form with either the intra-network NWS or HAR pre-cipitation mean ratios. An explanation is not readily apparent; however, the HURP stations have consider-able missing record and therefore the annual maxima are frequently underestimated. Therefore, only the HAR and NWS intra-network ratios were used in the final analysis (next section).
Empirical Depth-Distance Relations Near Selected Localities
The large sample-ratio files generated by the computer program were used to define various
S2S2
S2S2
S2
S2
S2S2
S2
S2
S2

AR
EA
L-R
ED
UC
TIO
N F
AC
TO
RS
17
Figure 7. Comparison of empirical 2-year or greater depth-distance relations for two Dallas precipitation-station networks, National Weather Service (NWS) and City of Dallas (DAL).
26
53
95
108
97
177
128
184
281
325
356
215
294226
274
153
257
217
367 331314
398
469236
404
186 456305
421362
384 377
393 630 370
342
476
232
310399
551
234
480616
237
395
50
103
139142
149
166151
156133
77102
6248
46
32
16
0 5010 20 30 40
DISTANCE BETWEEN POINT OF ANNUAL PRECIPITATION MAXIMA AND SURROUNDING STATION, IN MILES
0.1
1.0
0.2
0.3
0.4
0.5
0.6
0.7
0.8
0.9
1.0
DALLAS
RA
TIO
OF
CO
NC
UR
RE
NT
(S
AM
E D
AY
) P
RE
CIP
ITA
TIO
N T
OA
NN
UA
L P
RE
CIP
ITA
TIO
N M
AX
IMA
, DIM
EN
SIO
NLE
SS
Intra-network (within) empirical 2-year or greater depth-distance relation derived from weighted averages of the NWS and DAL precipitation station ratios
Combined intra- and inter-network empirical 2-year or greater depth-distance relation derived from the NWS and DAL precipitation stations
Inter-network (between) empirical 2-year or greater depth-distance relation derived from cross-comparing the NWS and DAL precipitation stations
Intra-network mean sample ratio for at least 2-year annual precipitation maxima from DAL stations—Number indicates observed samples within each mile-wide window. (Mean ratios for <10 samples are not shown.)
Intra-network mean sample ratio for at least 2-year annual precipitation maxima from NWS stations—Number indicates observed samples within each mile-wide window. (Mean ratios for <10 samples are not shown.)
16
26

18 Areal-R
edu
ction
Facto
rs for th
e Precip
itation
of th
e 1-Day D
esign
Sto
rm in
Texas
Figure 8. Comparison of empirical 2-year or greater depth-distance relations for three Houston precipitation-station networks: National Weather Service (NWS), Harris County Office of Emergency Management (HAR), and Houston Urban Program (HURP).
13
12
125 144
113
107
156
144
243 157
63
252
146222
240331
260
169
118 357
259206
253314
274
184
282
193188
208
279
410
390
210
265
388
501195
461
272
319
393
249
326
269
167
31
61
122
113252
242
218287
273312
299
388
325
361
359
374 404
412 315373301
382
315
351320
275
308234
231272
236
163
224
174
126142
127
127
93
126
82
73
68
63 46
65 23
29
34
20
17
24
3040
50
80
45 41
67
46
58
61
44
82
50
43
23
45
36
40
35
14 27
0 500 5 10 15 20 25 30 35 40 45
DISTANCE BETWEEN POINT OF ANNUAL PRECIPITATION MAXIMA AND SURROUNDING STATION, IN MILES
0.1
1.0
0.2
0.3
0.4
0.5
0.6
0.7
0.8
0.9
1.0
HOUSTONIntra-network (within) empirical 2-year or greater depth-distance relation derived from weighted averages of the NWS, HAR, and HURP precipitation station ratios
Intra-network mean-sample ratio for at least 2-year annual precipitation maxima from HURP stations—Number indicates observed samples within each mile-wide window. (Mean ratios for <10 samples are not shown.)
Intra-network mean-sample ratio for at least 2-year annual precipitation maxima from HAR stations—Number indicates observed samples within each mile-wide window. (Mean ratios for <10 samples are not shown.)
Intra-network mean-sample ratio for at least 2-year annual precipitation maxima from NWS stations—Number indicates observed samples within each mile-wide window. (Mean ratios for <10 samples are not shown.)
Combined intra- and inter-network empirical 2-year or greater depth-distance relation derived from the NWS, HAR, and HURP precipitation stations
Inter-network (between) empirical 2-year or greater depth-distance relation derived from cross-comparing the NWS, HAR, and HURP precipitation stations
222
50
404
RA
TIO
OF
CO
NC
UR
RE
NT
(S
AM
E D
AY
) P
RE
CIP
ITA
TIO
NT
O A
NN
UA
L P
RE
CIP
ITA
TIO
N M
AX
IMA
, DIM
EN
SIO
NLE
SS

AREAL-REDUCTION FACTORS 19
empirical . Two major perspectives of are fre-quency and seasonal considerations. Frequency consid-erations (or recurrence interval) of are the most important from a design standpoint. Seasonal consider-ations provide valuable insight into the spatial nature of precipitation surrounding an annual maxima but have limited utility in hydraulic design using an annual risk basis.
Frequency Considerations
The magnitude and frequency of the storm center (the point of an annual maxima) have considerable influence on the expected (average) decrease of with increasing distance from the storm center, which in turn influences the expected areal distribution of precip-itation. It is hypothesized that as the maximum point depth (intensity) of a storm increases, the surrounding depths decrease more substantially as area increases. In other words, the rainfall depths for large or very intense storms typically are not as widely or as evenly distrib-uted in space as smaller more frequent storms. Each of the three databases support this hypothesis, as do the pertinent references (for further details, see Myers and Zehr, 1980; or Sivapalan and Blöschl, 1998).
Comparisons between empirical for selected recurrence intervals for Austin, Dallas, and Houston are shown in figures 9–11. As presented earlier, the frequency levels are defined in a cumulative type, that is, the “empirical -year or greater depth-distance relation” (empirical ) is derived from only those ratios for which the recurrence interval of the annual maxima of the storm center (central station, fig. 4) was equal to or greater than years and not simply just the “ -year depth-distance relation.” The empirical for recurrence intervals greater than 5 years are not pre-sented for Austin and Dallas because the record lengths of the AUS and DAL networks are short. The 5-year recurrence interval corresponds to the 0.80 cumulative annual probability. When the NWS and HAR networks are combined, a larger and denser database is available for Houston than for Austin or Dallas. Therefore, the empirical for 10-year or greater recurrence intervals for Houston is also presented (fig. 11). Several observa-tions of the empirical relations (figs. 9–11) are:
1. A tendency of more rapid decrease (decay) of with increasing for larger recurrence
intervals exists. This does not necessarily imply that extremely intense (rare) storms do not pro-duce less rainfall volume than moderately
intense (common) storms but indicates that large storms have (on average) a smaller spatial extent.
2. Even with the large number of precipitation sta-tions and sample ratios, accurate estimation of for less than about 2 mi remains difficult.
3. All of the empirical appear to flatten or level off at ratios of about 0.2 to 0.3 for large .
4. As recurrence interval of the annual maxima increases, the variability of the empirical increases because of a reduction of sample size for each mile-wide window, which occurs because the available data diminishes.
The summary statistics (similar to table 5) for each of the empirical (figs. 9–11) are listed in Appendices I–III. For the Austin database (App. I), the
is about 0.5 for small and increases with recur-rence interval. Also, for each recurrence interval, the
increases substantially with increasing . Similar behavior of is shown for the Dallas (App. II) and Houston (App. III) databases. indicates that the spatial variability of precipitation centered on an annual maxima is large. Also, the number of samples for each mile-wide window increases substantially for about 6 to 12 mi and then gradually diminishes for increases in .
The probability of a station proximate to a site experiencing a 2-year or greater annual maxima in the Austin area recording concurrent zero precipita-tion increases with increasing . However, the zero-precipitation probability shows substantial varia-tion and is therefore difficult to assess. The zero-precipitation probability for Austin stations is about 5 to 10 percent for small and increases for large . The zero precipitation probabilities for Dallas and Houston show similar magnitudes and trends. The probability of a station close to a 2-year or greater annual maxima in Dallas not recording concurrent precipitation is about 1 to 2 percent for small , about 7 to 9 percent for mod-erate , and about 10 to 12 percent for large . Likewise, the probability that a station for a 2-year or greater annual maxima in Houston not recording concurrent precipitation is about 3 to 5 percent for small , about 5 to 7 percent for moderate , and about 9 to 12 percent for large . It is expected that the zero probabilities are sensitive to both the systematic and individual station biases. However, the apparent trends are in agreement with the conceptual spatial model used in this report—
ST ST
ST
ARF
ST
TST
TT ST
ST
ARFT r
ARF r
STr
ST
ST
CV r
CV rCV
CV
r
r
r r
rr r
rr
r

20 Areal-R
edu
ction
Facto
rs for th
e Precip
itation
of th
e 1-Day D
esign
Sto
rm in
Texas
Figure 9. Empirical depth-distance relations for selected recurrence intervals for Austin, Texas.
0 505 10 15 20 25 30 35 40 45
DISTANCE BETWEEN POINT OF ANNUAL PRECIPITATION MAXIMA AND SURROUNDING STATION, IN MILES
0.1
1.0
0.2
0.3
0.4
0.5
0.6
0.7
0.8
0.9
1.0
AUSTINR
AT
IO O
F C
ON
CU
RR
EN
T (
SA
ME
DA
Y)
PR
EC
IPIT
AT
ION
TO
AN
NU
AL
PR
EC
IPIT
AT
ION
MA
XIM
A, D
IME
NS
ION
LES
S
Empirical depth-distance relation for any annual precipitation maxima defined by the intra-network mean sample ratios—Values from Appendix I–1
Empirical 5-year or greater depth-distance relation defined by the intra-network mean sample ratios— Values from Appendix I–3
Empirical 2-year or greater depth-distance relation defined by the intra-network mean sample ratios— Values from Appendix I–2

AR
EA
L-R
ED
UC
TIO
N F
AC
TO
RS
21 Figure 10. Empirical depth-distance relations for selected recurrence intervals for Dallas, Texas.
0 505 10 15 20 25 30 35 40 45
DISTANCE BETWEEN POINT OF ANNUAL PRECIPITATION MAXIMA AND SURROUNDING STATION, IN MILES
0.1
1.1
0.2
0.3
0.4
0.5
0.6
0.7
0.8
0.9
1.0
1.1
DALLAS
RA
TIO
OF
CO
NC
UR
RE
NT
(S
AM
E D
AY
) P
RE
CIP
ITA
TIO
NT
O A
NN
UA
L P
RE
CIP
ITA
TIO
N M
AX
IMA
, DIM
EN
SIO
NLE
SS
Empirical depth-distance relation for any annual precipitation maxima defined by the intra-network mean sample ratios—Values from Appendix II–1
Empirical 5-year or greater depth-distance relation defined by the intra-network mean sample ratios— Values from Appendix II–3
Empirical 2-year or greater depth-distance relation defined by the intra-network mean sample ratios— Values from Appendix II–2

22 Areal-R
edu
ction
Facto
rs for th
e Precip
itation
of th
e 1-Day D
esign
Sto
rm in
Texas
Figure 11. Empirical depth-distance relations for selected recurrence intervals for Houston, Texas.
0 505 10 15 20 25 30 35 40 45
DISTANCE BETWEEN POINT OF ANNUAL PRECIPITATION MAXIMA AND SURROUNDING STATION, IN MILES
0.1
1.0
0.2
0.3
0.4
0.5
0.6
0.7
0.8
0.9
1.0
HOUSTON
RA
TIO
OF
CO
NC
UR
RE
NT
(S
AM
E D
AY
) P
RE
CIP
ITA
TIO
NT
O A
NN
UA
L P
RE
CIP
ITA
TIO
N M
AX
IMA
, DIM
EN
SIO
NLE
SS
Empirical depth-distance relation for any annual precipitation maxima defined by the intra-network mean sample ratios—Values from Appendix III–1
Empirical 5-year or greater depth-distance relation defined by the intra-network mean sample ratios— Values from Appendix III–3
Empirical 2-year or greater depth-distance relation defined by the intra-network mean sample ratios— Values from Appendix III–2
Empirical 10-year or greater depth-distance relation defined by the intra-network mean sample ratios— Values from Appendix III–4
Anomalous data for one or more stations

AREAL-REDUCTION FACTORS 23
specifically that a storm decays on average with radial distance away from its intensity center (annual precipi-tation maxima).
Seasonal Considerations
Detailed discussion of the various climatic and meteorologic factors affecting the areal distribution of precipitation is beyond the scope of this report. Bomar (1995) provides an excellent and detailed discussion of Texas weather.
The season in which an annual maxima occurs has an important influence on the resulting spatial dis-tribution of precipitation. Comparisons between the empirical for 6-month seasons, termed “summer” and “winter”, are presented in figure 12. Summer is defined as April through September, and winter is defined as October through March. The greatest differ-ence between the winter and summer empirical for the three cities exists for Austin—the winter ratios are larger than the summer ratios. This observation is expected because the winter precipitation in the Austin area is generally from large low pressure systems that originate from the northwest and west. These fronts typ-ically move eastward and show circulation along the frontal boundary to the northeast. Numerous rainfall “cells” are commonly embedded in and along the fronts. Frontal precipitation occurs principally during the win-ter. Additionally, precipitation from tropical storms and hurricanes that originate from the Gulf of Mexico might contribute to the differences between summer and win-ter . These storms often produce extensive regional precipitation during late August, September, and Octo-ber. Contrasted with the winter, most of the summer pre-cipitation largely is due to relatively isolated and largely convective thunderstorms.
The winter and summer for Dallas are sub-stantially different from each other, though not as differ-ent from each other as the winter and summer are for Austin. Like the winter for Austin, the winter for Dallas are larger than the summer. Again, this might be expected because Dallas is similarly affected by fronts during the winter season. The summer for Dallas is larger in magnitude than the summer for Austin.
The winter and summer show considerably different results for Houston than for Austin or Dallas. The two do not show the large separation like those for either Austin or Dallas. The summer are larger than the winter , although the differences are not large. Houston experiences a more similar climate from
month to month than Austin and Dallas because of its immediate proximity to the Gulf of Mexico.
While is it clear that seasonality has a large influ-ence on the spatial distribution of precipitation sur-rounding an annual maxima, virtually all uses of design storm data rely on an annual probability perspective and therefore, do not use seasonal considerations.
Estimation of Areal-Reduction Factors
The estimated for the calculation of for 1-day design storms near Austin, Dallas, and Houston are presented in this section. Also presented are relations for circular watersheds near these localities.
The final results were limited to only one recur-rence interval, that for 2 or more years, because of limited “observation” of data for greater recurrence intervals, for the sake of conservative estimation, and for simplicity of application in hydraulic design. Consequently, estimated for specific recurrence intervals other than 2 or more years are not presented. However, empirical for 5 or more years (Austin, Dallas, and Houston) and 10 or more years (Houston) were discussed in the previous section. These empirical
could be used to derive associated values for . The number of sample ratios decreases substantially for increasing recurrence intervals for each city; as a conse-quence, reliable assessment of is difficult for large recurrence intervals. The number of sample ratios for the Austin database decreases from 17,242 (any year), to 5,226 (2 year), and to 1,293 (5 year). Likewise, for the Dallas database, the number of sample ratios decreases from 41,786 (any year), to 15,775 (2 year), and to 5,146 (5 year). Finally, the number of sample ratios for the Houston database decreases from 69,370 (any year), to 21,392 (2 year), to 8,536 (5 year), and to 4,654 (10 year).
The estimated and values were derived for those annual precipitation maxima having recur-rence intervals of at least 2 years. Empirical for increasingly large recurrence intervals indicate larger decreases in . Consequently, is negatively biased (underestimated) for recurrence intervals of about 2 years and positively biased (overestimated) for larger recurrence intervals. This should provide conser-vative estimation (higher values) of areal-reduction factors. The relation is used to produce the 2-year or greater areal-reduction factor .
Before can be calculated, the estimated must be defined. A comparison of the empirical for
S2
S2
S2
S2
S2 S2
S2S2
S2
S2S2
S2
ST ARF
ARF
ARF
ST
ST
ST ARFT
ST
T
T
T
ST ARFT
ST
ARF S2
S2ARF2( )
ARF2 S2S2

24 Areal-R
edu
ction
Facto
rs for th
e Precip
itation
of th
e 1-Day D
esign
Sto
rm in
Texas
Figure 12. Empirical 2-year or greater depth-distance relations for winter and summer for Austin, Dallas, and Houston, Texas.
0.1
1.1
0.3
0.5
0.7
0.9
1.1
0.1
1.1
0.3
0.5
0.7
0.9
1.1
0 505 10 15 20 25 30 35 40 45
DISTANCE BETWEEN POINT OF ANNUAL PRECIPITATION MAXIMA AND SURROUNDING STATION, IN MILES
0.1
1.1
0.3
0.5
0.7
0.9
1.1
AUSTIN
DALLAS
HOUSTON
RA
TIO
OF
CO
NC
UR
RE
NT
(S
AM
E D
AY
) P
RE
CIP
ITA
TIO
NT
O A
NN
UA
L P
RE
CIP
ITA
TIO
N M
AX
IMA
, DIM
EN
SIO
NLE
SS
The winter depth-distance relation is smaller than the summer relationfor Houston which is opposite of that for Austin and Dallas.
EXPLANATIONWinter (October through March) empirical 2-year or greater depth-distance relation
Summer (April through September) empirical 2-year or greater depth-distance relation
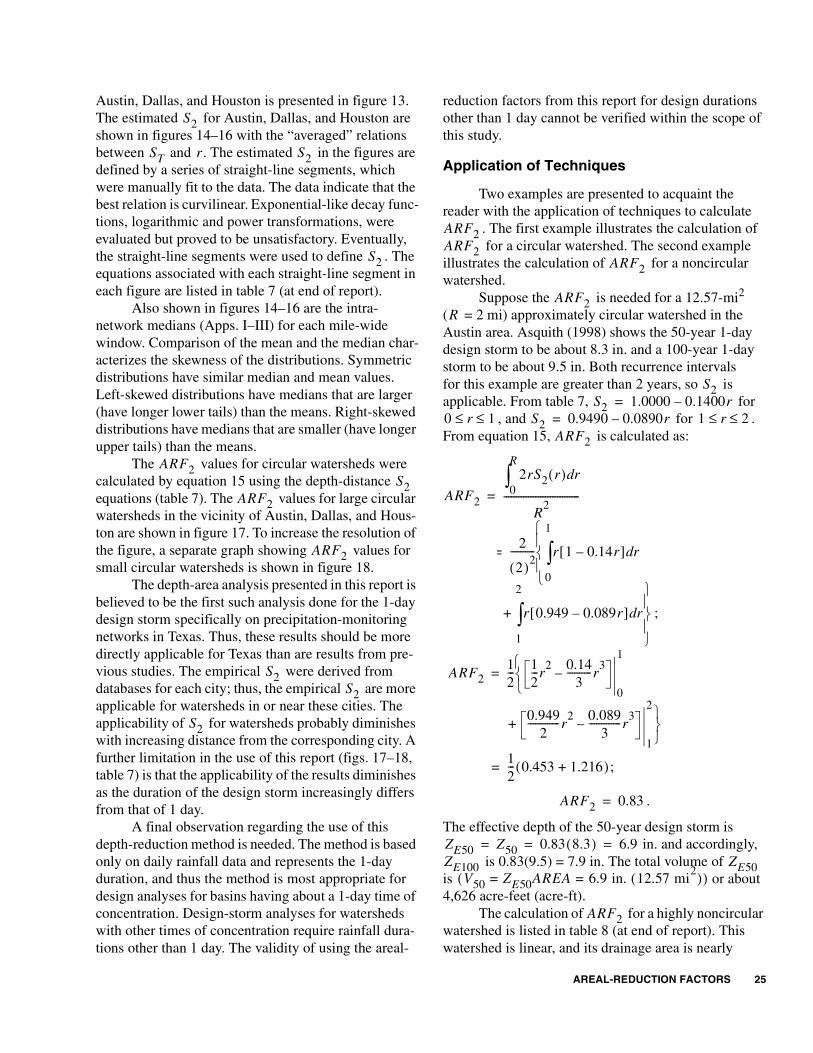
AREAL-REDUCTION FACTORS 25
Austin, Dallas, and Houston is presented in figure 13. The estimated for Austin, Dallas, and Houston are shown in figures 14–16 with the “averaged” relations between and . The estimated in the figures are defined by a series of straight-line segments, which were manually fit to the data. The data indicate that the best relation is curvilinear. Exponential-like decay func-tions, logarithmic and power transformations, were evaluated but proved to be unsatisfactory. Eventually, the straight-line segments were used to define . The equations associated with each straight-line segment in each figure are listed in table 7 (at end of report).
Also shown in figures 14–16 are the intra-network medians (Apps. I–III) for each mile-wide window. Comparison of the mean and the median char-acterizes the skewness of the distributions. Symmetric distributions have similar median and mean values. Left-skewed distributions have medians that are larger (have longer lower tails) than the means. Right-skewed distributions have medians that are smaller (have longer upper tails) than the means.
The values for circular watersheds were calculated by equation 15 using the depth-distance equations (table 7). The values for large circular watersheds in the vicinity of Austin, Dallas, and Hous-ton are shown in figure 17. To increase the resolution of the figure, a separate graph showing values for small circular watersheds is shown in figure 18.
The depth-area analysis presented in this report is believed to be the first such analysis done for the 1-day design storm specifically on precipitation-monitoring networks in Texas. Thus, these results should be more directly applicable for Texas than are results from pre-vious studies. The empirical were derived from databases for each city; thus, the empirical are more applicable for watersheds in or near these cities. The applicability of for watersheds probably diminishes with increasing distance from the corresponding city. A further limitation in the use of this report (figs. 17–18, table 7) is that the applicability of the results diminishes as the duration of the design storm increasingly differs from that of 1 day.
A final observation regarding the use of this depth-reduction method is needed. The method is based only on daily rainfall data and represents the 1-day duration, and thus the method is most appropriate for design analyses for basins having about a 1-day time of concentration. Design-storm analyses for watersheds with other times of concentration require rainfall dura-tions other than 1 day. The validity of using the areal-
reduction factors from this report for design durations other than 1 day cannot be verified within the scope of this study.
Application of Techniques
Two examples are presented to acquaint the reader with the application of techniques to calculate
. The first example illustrates the calculation of for a circular watershed. The second example
illustrates the calculation of for a noncircular watershed.
Suppose the is needed for a 12.57-mi2
( = 2 mi) approximately circular watershed in the Austin area. Asquith (1998) shows the 50-year 1-day design storm to be about 8.3 in. and a 100-year 1-day storm to be about 9.5 in. Both recurrence intervals for this example are greater than 2 years, so is applicable. From table 7, for
, and for . From equation 15, is calculated as:
;
;
.
The effective depth of the 50-year design storm is in. and accordingly,
is 0.83(9.5) = 7.9 in. The total volume of is or about 4,626 acre-feet (acre-ft).
The calculation of for a highly noncircular watershed is listed in table 8 (at end of report). This watershed is linear, and its drainage area is nearly
S2
ST r S2
S2
ARF2S2
ARF2
ARF2
S2S2
S2
ARF2ARF2
ARF2
ARF2R
S2S2 1.0000 0.1400r–=
0 r 1≤ ≤ S2 0.9490 0.0890r–= 1 r 2≤ ≤ARF2
ARF2
2rS2 r( ) rd0
R
∫R
2-------------------------------=
2
2( )2---------- r 1 0.14r–[ ] rd
0
1
∫⎩⎪⎨⎪⎧
=
r 0.949 0.089r–[ ] rd
1
2
∫+
⎭⎪⎬⎪⎫
ARF212--- 1
2---r
2 0.143
----------r3
–0
1
⎩⎨⎧
=
0.9492
-------------r2 0.089
3-------------r
3–
1
2
+⎩ ⎭⎨ ⎬⎧ ⎫
12--- 0.453 1.216+( )=
ARF2 0.83=
ZE50 Z50 0.83 8.3( ) 6.9= = =ZE100 ZE50
V50 ZE50AREA 6.9 in. = =( 12.57 mi2( ))
ARF2

26 Areal-R
edu
ction
Facto
rs for th
e Precip
itation
of th
e 1-Day D
esign
Sto
rm in
Texas
Figure 13. Empirical 2-year or greater depth-distance relations for Austin, Dallas, and Houston, Texas.
0 505 10 15 20 25 30 35 40 45
DISTANCE BETWEEN POINT OF ANNUAL PRECIPITATION MAXIMA AND SURROUNDING STATION, IN MILES
0.1
1.0
0.2
0.3
0.4
0.5
0.6
0.7
0.8
0.9
1.0
RA
TIO
OF
CO
NC
UR
RE
NT
(S
AM
E D
AY
) P
RE
CIP
ITA
TIO
NT
O A
NN
UA
L P
RE
CIP
ITA
TIO
N M
AX
IMA
, DIM
EN
SIO
NLE
SS Empirical 2-year or greater depth-distance relation for
Houston—Values from Appendix III–2
Empirical 2-year or greater depth-distance relation for Austin—Values from Appendix I–2
Empirical 2-year or greater depth-distance relation for Dallas—Values from Appendix II–2

AR
EA
L-R
ED
UC
TIO
N F
AC
TO
RS
27 Figure 14. Estimated 2-year or greater depth-distance relations for Austin, Texas.
17
103
186
232
269
245
251
253 242
250
231
215
203
190
118147
150
95
79
9160
39
112
62100
24
64
7773
5869
56
59
40
35
61 6797
58
25
43
30
36
49 46
20104
48
46,47
0 505 10 15 20 25 30 35 40 45
DISTANCE BETWEEN POINT OF ANNUAL PRECIPITATION MAXIMA AND SURROUNDING STATION, IN MILES
0.1
1.0
0.2
0.3
0.4
0.5
0.6
0.7
0.8
0.9
1.0
AUSTIN
60
Median is larger than mean, which ischaracteristic of a left-skewed distribution
Median is smaller than mean, which is characteristic of a right-skewed distribution
60
RA
TIO
OF
CO
NC
UR
RE
NT
(S
AM
E D
AY
) P
RE
CIP
ITA
TIO
NT
O A
NN
UA
L P
RE
CIP
ITA
TIO
N M
AX
IMA
, DIM
EN
SIO
NLE
SS
Intra-network mean sample ratio for at least 2-year annual precipitation maxima (empirical 2-year or greater depth-distance relation)—Number indicates observed samples for each mile-wide window (Values from Appendix I–2)Intra-network median sample ratio for at least 2-year annual precipitation maxima—Values from Appendix I–2
Estimated 2-year or greater depth-distance relation—Manually fitted to the intra-network means

28 Areal-R
edu
ction
Facto
rs for th
e Precip
itation
of th
e 1-Day D
esign
Sto
rm in
Texas
Figure 15. Estimated 2-year or greater depth-distance relations for Dallas, Texas.
53
111
165195
159
261
259
253
310
205
286
343
373
402
247
310
235
281
162
266
218
369
332 316
399
469
236
404186
456
305
421
362 384377
393630
370
342
476
232
310
399
551
234
480616
237
395
0 505 10 15 20 25 30 35 40 45
DISTANCE BETWEEN POINT OF ANNUAL PRECIPITATION MAXIMA AND SURROUNDING STATION, IN MILES
0.1
1.0
0.2
0.3
0.4
0.5
0.6
0.7
0.8
0.9
1.0
DALLAS
162
Intra-network median sample ratio for at least 2-year annual precipitation maxima—Values from Appendix II–2
Intra-network mean sample ratio for at least 2-year annual precipitation maxima (empirical 2-year or greater depth-distance relation)—Number indicates observed samples for each mile-wide window (Values from Appendix II–2)
Estimated 2-year or greater depth-distance relation—Manually fitted to the intra-network means
RA
TIO
OF
CO
NC
UR
RE
NT
(S
AM
E D
AY
) P
RE
CIP
ITA
TIO
NT
O A
NN
UA
L P
RE
CIP
ITA
TIO
N M
AX
IMA
, DIM
EN
SIO
NLE
SS
Median is smaller than mean, which is characteristic of a right-skewed distribution
Median is about equal to mean, which is characteristic of a "near" normal distribution

AR
EA
L-R
ED
UC
TIO
N F
AC
TO
RS
29 Figure 16. Estimated 2-year or greater depth-distance relations for Houston, Texas.
31
61135
119
264
367
362400
380468
443
631
482
424611
520626
652646
633
470500
672
638
526
528622
508415
554
429351
432
453 536
532
337 392
481
627 277
534
340382
439
314
349
298
201
0 505 10 15 20 25 30 35 40 45
DISTANCE BETWEEN POINT OF ANNUAL PRECIPITATION MAXIMA AND SURROUNDING STATION, IN MILES
0.1
1.0
0.2
0.3
0.4
0.5
0.6
0.7
0.8
0.9
1.0
HOUSTON
482
Intra-network median sample ratio for 2-year or greater annual precipitation maxima—Values from Appendix III–2
Intra-network mean sample ratio for 2-year or greater annual precipitation maxima (empirical 2-year or greater depth-distance relation)—Number indicates observed samples for each mile-wide window (Values from Appendix III–2)
Estimated 2-year or greater depth-distance relation—Manually fitted to the intra-network means
RA
TIO
OF
CO
NC
UR
RE
NT
(S
AM
E D
AY
) P
RE
CIP
ITA
TIO
NT
O A
NN
UA
L P
RE
CIP
ITA
TIO
N M
AX
IMA
, DIM
EN
SIO
NLE
SS
Median is smaller than mean, which ischaracteristic of a right-skewed distribution

30 Areal-R
edu
ction
Facto
rs for th
e Precip
itation
of th
e 1-Day D
esign
Sto
rm in
Texas
Figure 17. Areal-reduction factors for 2-year or greater 1-day design storms for large circular watersheds for Austin, Dallas, and Houston, Texas.
0 7,000500 1,000 1,500 2,000 2,500 3,000 3,500 4,000 4,500 5,000 5,500 6,000 6,500
AREA OF CIRCULAR WATERSHED, IN SQUARE MILES
0.40
1.00
0.45
0.50
0.55
0.60
0.65
0.70
0.75
0.80
0.85
0.90
0.95
1-D
AY
DE
SIG
N-S
TO
RM
AR
EA
L-R
ED
UC
TIO
N F
AC
TO
R, D
IME
NS
ION
LES
S
DALLASAUSTIN
HOUSTON
Areal-reduction factors for 2-year or greater 1-day design storms for Austin
Areal-reduction factors for 2-year or greater 1-day design storms for Houston
Areal-reduction factors for 2-year or greater 1-day design storms for Dallas

AR
EA
L-R
ED
UC
TIO
N F
AC
TO
RS
31 Figure 18. Areal-reduction factors for 2-year or greater 1-day design storms for small circular watersheds for Austin, Dallas, and Houston, Texas.
0.005 4000.01 0.02 0.05 0.1 0.2 0.5 1 2 5 10 20 50 100 200
AREA OF CIRCULAR WATERSHED, IN SQUARE MILES
0.65
1.00
0.70
0.75
0.80
0.85
0.90
0.95
1-D
AY
DE
SIG
N-S
TO
RM
AR
EA
L-R
ED
UC
TIO
N F
AC
TO
R, D
IME
NS
ION
LES
S
DALLASAUSTIN
HOUSTON
Areal-reduction factors for 2-year or greater 1-day design storms for Austin
Areal-reduction factors for 2-year or greater 1-day design storms for Houston
Areal-reduction factors for 2-year or greater 1-day design storms for Dallas

32 Areal-Reduction Factors for the Precipitation of the 1-Day Design Storm in Texas
identical to the above example. The for a water-shed is the weighted mean . The steps to calculate
are (1) represent the watershed as discrete cells, the cells do not have to have the same area, (2) locate the cell containing the centroid, (3) for each cell, calcu-late the distance to the centroid, (4) using the distance from step 3, solve the appropriate equations from table 7 for , (5) multiply the by the corresponding cell area to compute , the area multiplication simply acts as a weight for a weighted mean, (6) compute the sum of the cell areas, (7) compute the sum of the prod-uct of and cell area from step 5, and (8) divide the result of step 7 by step 6. These steps are shown in table 8. The is 0.76, which is substantially smaller than the 0.83 computed in the previous circular water-shed example. Therefore, watershed shape might signif-icantly influence calculation.
SUMMARY
This report documents an investigation by the U.S. Geological Survey, in cooperation with the Texas Department of Transportation, of areal-reduction factors for the 1-day design storm in Texas. The reduction of the precipitation depth from a design storm for a point to an effective (mean) depth over a watershed is important for cost-effective design of hydraulic structures. A design storm for a point is the depth of precipitation for a specified duration and frequency or recurrence interval. An effective depth can be calcu-lated by multiplying the design-storm depth by an areal-reduction factor. The areal-reduction factor ( ) is generally defined as the ratio of (1) the mean precipita-tion depth over a watershed resulting from a design storm to (2) the point depth of the design storm. The areal-reduction factor ranges from 0 to 1, varies with the recurrence interval of the design storm, and is a function of such characteristics as watershed size, watershed shape, geographic location, and time of year that the design storm occurs.
The data for the investigation include the daily values of precipitation as reported (digitally) by various precipitation-station monitoring networks in the vicinity of Austin, Dallas, and Houston. Databases of daily precipitation were separately aggregated for the Austin, Dallas, and Houston areas. Each city data-base was derived from several precipitation-station monitoring networks. For the Austin area, two daily precipitation networks were identified: the daily values for 25 National Weather Service (NWS) stations and for
83 City of Austin (AUS) stations. For the Dallas area, two daily precipitation networks were identified: the daily values for 58 NWS stations and for 45 City of Dallas (DAL) stations. For the Houston area, three daily precipitation networks were identified: the daily values for 64 NWS stations, for 84 Harris County Office of Emergency Management (HAR) stations, and for 45 USGS Houston Urban Program (HURP) stations. Individually, the Austin, Dallas, and Houston databases have about 248,000; 429,000; and 688,000 daily precip-itation values, a total of about 1,365,000 values.
An annual maxima-centered approach was used to analyze the data. From the approach, the “depth-distance relation,” , is the basis of defini-tion. is the ratio of (1) the precipitation at a dis-tance away from the design storm to (2) the point precipitation of the annual precipitation maxima. Thus,
describes the average radial structure of the pre-cipitation concurrent with and surrounding the point of an annual maxima. is calculated by integrating
over the entire watershed and dividing by the watershed area.
The three city databases provided a total of more than 128,000 “sample ratios” for mi. Though separation distances larger than 50 mi were avail-able, the maximum presented in this report was limited to 50 mi. The sample ratios were statistically summarized for each mile-wide window of separation distance. To provide an unbiased separation distance for graphical representation and analysis, the means of the separation distances for each mile-wide window were calculated.Various preliminary or empirical were estimated from the daily precipitation data. Before a final was derived from the combination of the net-works for each city, two evaluations were performed for each network. One evaluation considered the perfor-mance of each network in recording the annual precipi-tation maxima (a point process); whereas, the other evaluation considered areal distribution of concurrent precipitation surrounding that point of an annual max-ima (an areal process).
The point-process evaluation was based on the comparison of observed cumulative annual probabili-ties to those by definition. The comparison was made, using an “observed cumulative annual probability” calculated by counting the number of times that the observed annual precipitation maxima for a station did not equal or exceed the depth for the defined recurrence interval and dividing the count by the total number of observed annual precipitation maxima (storms). The
ARF2S2
ARF2
S2 S2ARF2
S2
ARF2
ARF2
ARF
S r( ) ARFS r( )r
S r( )
ARFS r( )
r 50≤r( )
r
r
S r( )
S r( )

SUMMARY 33
observed cumulative annual probability was compared to defined probabilities. The defined cumulative annual probabilities for this investigation were 0.10, 0.20, 0.50, 0.80, and 0.90, which correspond to recurrence intervals of 1.111, 1.25, 2, 5, and 10 years. The comparison indicates that each network is systematically underesti-mating the assumed true precipitation quantiles or depths for the given frequencies. The differences decreased in the tails of the distribution (0.10, left or lower-tail; or 0.90, right or upper tail) for all the net-works and were largest near the middle (0.50). The observed-defined probability differences generally were smaller for the NWS stations than for the other station networks. The HURP stations also showed small differences; the HURP stations might provide an inde-pendent verification of the daily precipitation frequency values for the Houston area. However, the stations in the HURP network have much more missing record than the NWS stations, which indicated that the HURP sta-tions are really over-recording precipitation, and it is a coincidence that the annual maxima from the HURP stations nearly match the annual maxima from the NWS stations.
The areal-process evaluation is based on compar-ison of empirical derived specifically from each network. For example, if the empirical from each network are similar, then evidence is established that provides assurance that each network was recording essentially the same information about the spatial distri-bution of precipitation. The empirical used to judge network compatibility was surrounding annual maxima greater than or equal to the 2-year recurrence interval. The intra-network empirical is based on sample ratios derived from the data of each network, independent of the data from the other networks. The inter-network empirical is based on sample ratios derived from cross-comparison of the data from the other networks. The intra- and inter-network lines are substantially different. The presence of a substantial and nonrandom bias is implied by the inter-network empirical clearly not agreeing with the intra-network empirical . Potential explanations for the bias were discussed. The bias is removed when only intra-network empirical are used. Thus, only the intra-network were judged as appropriate for esti-mating . The areal-process evaluation determined that all the intra-network empirical are applica-ble, except for the intra-network empirical from the HURP network. The HURP network appears to over record precipitation, in agreement with the point-
process evaluation. The HURP network was not used for subsequent analysis.
Two major perspectives of are frequency and seasonal considerations. The magnitude and fre-quency of the storm center (the point of an annual max-ima) has a large influence on the expected (average) decrease of with increasing distance from the storm center, which in turn influences the expected areal distribution of precipitation. A tendency for more rapid decrease of with increasing for larger recurrence intervals exists (figs. 9–11). Even with the considerable number of stations and a very large number of ratios, reliable estimation of for less than about 2 mi remains difficult. The variability of the empirical increases with increasing recurrence interval partially because of a systematic reduction of sample size for each mile-wide window.
The season in which an annual maxima occurs has an influence on the resulting spatial distribution of precipitation. Comparisons between the empirical
for 6-month seasons termed summer and winter are shown. The for the Austin seasons show the greatest difference for the three cities. The winter rela-tion is larger than the summer relation. The winter and summer for Dallas are substantially different from each other, though not as different as for Austin. Similar to the relations for Austin, the winter relation is larger than the summer relation. The winter and summer
for Houston show considerably different results than those for Austin or Dallas. The two Houston do not show the large differences like those for either Austin or Dallas. The summer for Houston is slightly larger than the winter .
The final results present only the 2 or more year recurrence interval because of limited “observation” of less frequent annual maxima, for the sake of conser-vative estimation, and to simplify application of the results. Estimated for specific recurrence inter-vals greater than 2 years are not included. However, the empirical for 5 years or greater (Austin, Dallas, and Houston) and 10 years or greater (Houston) are included. The number of sample ratios decreases very rapidly for increasing recurrence interval for each city, hence reliable assessment of for recurrence intervals larger than 2 or more years is difficult.
The final or estimated are defined by a series of hand-fit straight-line segments. The underlying relation is curvilinear. Exponential-like decay func-tions, logarithmic and power transformations, were evaluated but proved to be unsatisfactory. Finally,
S r( )S r( )
S2 r( )
S2 r( )
S2 r( )
S2 r( )S2 r( )
S2 r( )S r( )
S2 r( )S2 r( )
S2 r( )
S r( )
S r( )
S r( ) r
ARF rS r( )
S2 r( )S2 r( )
S2 r( )
S2 r( )S2 r( )
S2 r( )S2 r( )
ARFST
ST
ST
S2 r( )

34 Areal-Reduction Factors for the Precipitation of the 1-Day Design Storm in Texas
is calculated by integrating over the entire watershed and dividing by the watershed area. Graphs of the relation between and circular watershed area (to about 7,000 mi2) are shown, and a technique to calculate for noncircular water-sheds also is discussed.
SELECTED REFERENCES
Asquith, W.A., 1998, Depth-duration frequency of precipita-tion for Texas: U.S. Geological Survey Water-Resources Investigations Report 98–4044, 67 p., 1 app., 1 pl.
Bacchi, B., and Ranzi, R., 1996, On the derivation of the areal reduction factor of storms: Atmospheric Research, v. 42, p. 123–135.
Bomar, G.W., 1995, Texas weather: Austin, University of Texas Press, 275 p.
Davis, J.C., 1986, Statistics and data analysis in geology: New York, John Wiley and Sons, p. 646.
Frederick, R.H., Meyers, V.A., and Auciello, E.P., 1977a, Storm depth-area curves derived from digitized radar data: Water Resources Research, v. 13, p. 675–679.
______1977b, Five- to 60-minute precipitation frequency for the eastern and central United States: Silver Springs, Md.,U.S. Department of Commerce, National Oceanic and Atmospheric Administration, National Weather Service, NOAA Technical Memorandum NWS HYDRO–35, 36 p.
Hosking, J.R.M., 1990, L-moments—Analysis and estima-tion of distributions using linear combination of order statistics: Journal Royal Statistical Society B, v. 52, no. 1, p. 105–124.
Hydrosphere Data Products, Inc., 1996, Custom storm data for Texas: Boulder, Colo., Hydrosphere Data Products, Inc., 1 diskette.
Isaaks, E.H., and Srivastava, R.M., 1989, Introduction to applied geostatistics: New York, Oxford University Press, 561 p.
Lanning-Rush, Jennifer, Asquith, W.H., Slade, R.M., 1998, Extreme precipitation depths for Texas, excluding the Trans-Pecos region: U.S. Geological Survey Water-Resources Investigations Report 98–4099, 38 p.
Leclerc, G., and Schaake, J.C., 1972, Derivation of hydrologic frequency curves: Cambridge, Mass., Massachusetts Institute of Technology, Report 142, 151 p.
Miller, J.F., Frederick, R.H., and Tracey, R.J., 1973, Precipitation-frequency atlas of the conterminous
western United States (by states): Silver Springs, Md., U.S. Department of Commerce, National Oceanic and Atmospheric Administration, National Weather Service, NOAA Atlas 2, v. 1–11.
Myers, V.A., and Zehr, R.M., 1980, A methodology for point-to-area rainfall frequency ratios: Silver Springs, Md., U.S. Department of Commerce, National Oceanic and Atmospheric Administration, National Weather Service, NOAA Technical Report NWS 24 [variously paged].
Norwine, Jim, Giardino, J.R., North, G.R., and Valdés, J.B., 1995, The changing climate of Texas—Predictability and implications for the future: College Station, Texas A&M University, 348 p.
Omolayo, A.S., 1993, On the transposition of areal reduction factors for rainfall frequency estimation: Journal of Hydrology, v. 145, p. 191–205.
Rodriquez-Iturbe, Ignacio, and Mejía, J.M., 1974a, On the transformation of point rainfall to areal rainfall: Water Resources Research, v. 10, no. 4, p. 729–735.
______, 1974b, The design of rainfall networks in time and space: Water Resources Research, v. 10, no. 4, p. 713–728.
Ross, Sheldon, 1988, A first course in probability: New York, Macmillan, 473 p.
Sivapalan, Murugesu, and Blöschl, Günter, 1998, Transfor-mation of point rainfall to areal rainfall—Intensity-duration-frequency curves: Journal of Hydrology, v. 204, p. 150–167.
Smith, J.A., 1993, Precipitation, in Maidment, D.A., ed., Handbook of applied hydrology, chap. 3: New York, McGraw-Hill, p. 3.1–3.47.
U.S. Weather Bureau, 1957, Rainfall intensity-frequency regime—pt. 1, The Ohio Valley: Washington, D.C., U.S. Department of Commerce, Technical Paper 29.
______1958, Rainfall intensity-frequency regime—pt. 2, Southeastern United States: Washington, D.C., U.S. Department of Commerce, Technical Paper 29.
Weiss, L.L., 1964, Ratio of true to fixed-interval maximum rainfall: American Society of Civil Engineers, Journal of the Hydraulics Division, v. 90, HY–1, p. 77–82.
Zehr, R.M., and Myers, V.A., 1984, Depth-area ratios in the semi-arid southwest United States: Silver Springs, Md., U.S. Department of Commerce, National Oceanic and Atmospheric Administration, National Weather Service, NOAA Technical Memorandum NWS HYDRO–35, 45 p.
ARF2 S2 r( )
ARF2
ARF2

Tab
le 1 35
Table 1Table 1. Stations for two precipitation-monitoring networks near Austin, Texas—Continued
Site
no.
Current
study
station
no.
Original
station
no.
Operator Station name Latitude Longitude
Years
of
record
Begin-
ning
year
of
record
Ending
year
of
record
Distribution parameters for determining
recurrence interval of annual precipitation maxima
(Asquith, 1998)
GLO
ξ(in.)
GLO
α(in.)
GLO
κ(--)
GEV
ξ(in.)
GEV
α(in.)
GEV
κ(--)
1 246 246 NWS Andice 1 W-NW 30°47' 97°52' 28 1968 1995 3.116 0.635 –0.245 2.819 1.007 –0.0954
2 428 428 NWS Austin Weather Service Office Airport 30°18' 97°42' 66 1930 1995 3.334 .699 –.212 3.003 1.296 –.0954
3 430 430 NWS Austin Dam 30°18' 97°47' 18 1948 1965 3.330 .693 –.217 2.954 1.235 –.0954
4 432 432 NWS Austin Montopolis Bridge 30°15' 97°41' 16 1948 1963 3.348 .707 –.209 3.031 1.312 –.0954
5 738 738 NWS Bertram 3 E-NE 30°45' 98°01' 28 1968 1995 3.068 .630 –.249 2.794 .971 –.0954
6 1250 1250 NWS Burnet 30°44' 98°14' 87 1909 1995 2.966 .623 –.253 2.748 .962 –.0954
7 1541 1541 NWS Cedar Creek 4 SE 30°02' 97°28' 18 1978 1995 3.371 .758 –.200 3.248 1.272 –.0954
8 2210 2210 NWS Cypress Mill 30°23' 98°15' 17 1948 1964 3.222 .667 –.246 2.933 1.022 –.0954
9 2585 2585 NWS Dripping Springs SE 30°13' 97°59' 12 1984 1995 3.348 .695 –.227 3.210 1.179 –.0954
10 2820 2820 NWS Elgin 30°21' 97°22' 34 1962 1995 3.333 .729 –.201 3.134 1.267 –.0954
11 3506 3506 NWS Georgetown 30°38' 97°43' 25 1959 1983 3.219 .662 –.228 2.991 1.186 –.0954
12 3507 3507 NWS Georgetown Lake 30°41' 97°43' 15 1981 1995 3.194 .654 –.233 2.971 1.138 –.0954
13 3685 3685 NWS Granger 30°43' 97°26' 28 1968 1995 3.237 .675 –.215 3.011 1.227 –.0954
14 3686 3686 NWS Granger Dam 30°42' 97°20' 16 1980 1995 3.258 .689 –.209 3.010 1.210 –.0954
15 4088 4088 NWS Henly 30°12' 98°13' 18 1948 1965 3.362 .692 –.240 3.345 1.128 –.0954
16 5202 5202 NWS Liberty Hill 30°40' 97°55' 18 1948 1965 3.147 .642 –.244 2.870 1.004 –.0954
17 5284 5284 NWS Lockhart 29°53' 97°42' 49 1947 1995 3.411 .759 –.202 3.250 1.300 –.0954
18 5538 5538 NWS Manchaca 30°08' 97°50' 18 1948 1965 3.376 .712 –.213 3.262 1.304 –.0954
19 5561 5561 NWS Mansfield Dam 30°24' 97°55' 21 1944 1964 3.276 .673 –.231 2.882 1.056 –.0954
20 6992 6992 NWS Pflugerville 30°26' 97°37' 18 1948 1965 3.296 .689 –.213 3.029 1.306 –.0954
21 7497 7497 NWS Red Rock 29°58' 97°27' 30 1965 1994 3.385 .769 –.200 3.254 1.280 –.0954
22 7791 7791 NWS Round Rock 3 NW 30°32' 97°38' 28 1968 1995 3.261 .677 –.220 3.008 1.252 –.0954
23 8531 8531 NWS Spicewood 1 S 30°29' 98°10' 28 1968 1995 3.195 .659 –.245 2.841 .990 –.0954
24 8861 8861 NWS Taylor 30°34' 97°25' 67 1929 1995 3.280 .696 –.207 3.041 1.254 –.0954
25 9815 9815 NWS Wimberley 2 29°59' 98°03' 12 1984 1995 3.423 .726 –.223 3.373 1.297 –.0954
Table 1. Stations for two precipitation-monitoring networks near Austin, Texas
[GLO, generalized logistic distribution; in., inches; --, dimensionless; GEV, generalized extreme-value distribution; NWS, National Weather Service; AUS, City of Austin]

36 Areal-R
edu
ction
Facto
rs for th
e Precip
itation
of th
e 1-Day D
esign
Sto
rm in
Texas
26 10700 700 AUS Westlake High School 30°17'24" 97°48'45" 8 1989 1996 3.332 0.692 –0.219 2.943 1.218 –0.0954
27 10800 800 AUS 1301 W. Oltorf St. 30°14'26" 97°46'18" 8 1989 1996 3.349 .701 –.215 3.000 1.282 –.0954
28 10810 810 AUS St. Edwards Dr. 30°13'48" 97°44'51" 8 1989 1996 3.353 .704 –.213 3.025 1.297 –.0954
29 10820 820 AUS E. Riverside Dr. 30°13'40" 97°43'13" 8 1989 1996 3.354 .707 –.211 3.045 1.307 –.0954
30 10830 830 AUS S. I–35/IRS Service Center 30°12'53" 97°44'49" 5 1992 1996 3.357 .706 –.212 3.047 1.302 –.0954
31 10840 840 AUS 3616 S. First St. 30°13'44" 97°46'15" 5 1992 1996 3.353 .703 –.214 3.013 1.288 –.0954
32 10850 850 AUS S. First/OTC 30°15'27" 97°45'00" 5 1992 1996 3.345 .701 –.214 2.997 1.286 –.0954
33 10910 910 AUS 5100 S. Congress Ave. 30°12'09" 97°46'31" 7 1990 1996 3.360 .706 –.213 3.064 1.296 –.0954
34 10920 920 AUS Seminary Ridge 30°11'23" 97°49'16" 6 1991 1996 3.362 .705 –.215 3.120 1.284 –.0954
35 11000 1000 AUS S. Pleasant Valley 30°10'44" 97°44'40" 8 1989 1996 3.366 .711 –.211 3.114 1.311 –.0954
36 11010 1010 AUS W. Dittmar 30°10'58" 97°47'20" 9 1988 1996 3.364 .708 –.213 3.123 1.299 –.0954
37 11020 1020 AUS 5000 Manchaca 30°13'07" 97°47'38" 8 1989 1996 3.355 .703 –.215 3.029 1.281 –.0954
38 11100 1100 AUS 3400 William Cannon Blvd. 30°12'30" 97°49'40" 8 1989 1996 3.357 .702 –.217 3.066 1.268 –.0954
39 11120 1120 AUS US 290 W. 30°13'55" 97°51'36" 9 1988 1996 3.348 .698 –.220 3.027 1.230 –.0954
40 11140 1140 AUS Oak Hill Volunteer Fire Department 30°14'50" 97°54'50" 9 1988 1996 3.340 .693 –.224 3.024 1.184 –.0954
41 11160 1160 AUS Old San Antonio Hwy. at Slaughter Creek 30°08'48" 97°48'01" 6 1991 1996 3.373 .712 –.212 3.221 1.307 –.0954
42 11180 1180 AUS FM 1826 at Slaughter Creek 30°12'13" 97°54'31" 7 1990 1996 3.356 .699 –.221 3.157 1.223 –.0954
43 11210 1210 AUS Loop 360 at Loop 1 (MoPac) 30°14'20" 97°48'13" 5 1992 1996 3.349 .700 –.217 2.994 1.263 –.0954
44 11300 1300 AUS 11100 State Hwy. 71 W. 30°16'48" 97°55'19" 8 1989 1996 3.327 .689 –.226 2.967 1.146 –.0954
45 11500 1500 AUS St. Stevens School 30°19'45" 97°49'03" 8 1989 1996 3.317 .687 –.221 2.933 1.182 –.0954
46 11520 1520 AUS Metropolitan Park WX Station 30°19'23" 97°53'20" 9 1988 1996 3.313 .684 –.226 2.908 1.124 –.0954
47 11600 1600 AUS Mansfield Dam 30°23'41" 97°54'54" 9 1988 1996 3.279 .674 –.230 2.885 1.059 –.0954
48 11800 1800 AUS Purple Sage School 30°27'28" 97°49'12" 7 1990 1996 3.265 .671 –.228 2.942 1.110 –.0954
49 11810 1810 AUS Northwest Optimist 30°27'51" 97°46'21" 6 1991 1996 3.269 .673 –.225 2.968 1.150 –.0954
50 11900 1900 AUS Pflugerville High School 30°26'44" 97°38'12" 9 1988 1996 3.290 .686 –.215 3.021 1.290 –.0954
Table 1. Stations for two precipitation-monitoring networks near Austin, Texas—Continued
Site
no.
Current
study
station
no.
Original
station
no.
Operator Station name Latitude Longitude
Years
of
record
Begin-
ning
year
of
record
Ending
year
of
record
Distribution parameters for determining
recurrence interval of annual precipitation maxima
(Asquith, 1998)
GLO
ξ(in.)
GLO
α(in.)
GLO
κ(--)
GEV
ξ(in.)
GEV
α(in.)
GEV
κ(--)

Tab
le 1 37
51 11910 1910 AUS Pflugerville/Picadilly 30°28'04" 97°39'22" 8 1989 1996 3.281 0.682 –0.217 3.013 1.266 –0.0954
52 12000 2000 AUS Old Manor Rd. at Walnut Creek 30°19'20" 97°39'03" 9 1988 1996 3.330 .699 –.210 3.017 1.312 –.0954
53 12010 2010 AUS Dessau Rd. at Walnut Creek 30°22'29" 97°39'37" 10 1987 1996 3.314 .692 –.213 3.010 1.300 –.0954
54 12020 2020 AUS 12100 N. I–35 30°23'29" 97°40'32" 9 1988 1996 3.307 .689 –.215 3.005 1.284 –.0954
55 12030 2030 AUS Blue Goose Rd. 30°20'58" 97°37'46" 7 1990 1996 3.322 .698 –.210 3.021 1.317 –.0954
56 12050 2050 AUS 1500 Howard Ln. 30°25'36" 97°40'34" 7 1990 1996 3.294 .685 –.216 3.005 1.266 –.0954
57 12060 2060 AUS 12000 Metric Blvd. 30°24'05" 97°41'52" 4 1993 1996 3.302 .686 –.217 2.998 1.258 –.0954
58 12070 2070 AUS 4000 Oak Creek Dr. 30°25'47" 97°42'43" 7 1990 1996 3.290 .681 –.219 2.992 1.225 –.0954
59 12080 2080 AUS 3700 Duval Rd. at Loop 1 (MoPac) 30°24'38" 97°43'12" 7 1990 1996 3.297 .683 –.219 2.988 1.226 –.0954
60 12090 2090 AUS 7000 FM 969 30°16'38" 97°39'06" 7 1990 1996 3.343 .705 –.208 3.026 1.316 –.0954
61 12100 2100 AUS 5300 Duval Rd./Fire Station 30°24'45" 97°44'12" 9 1988 1996 3.294 .682 –.220 2.978 1.206 –.0954
62 12120 2120 AUS Howard Ln. at Abbott 30°26'52" 97°42'13" 9 1988 1996 3.284 .680 –.219 2.996 1.224 –.0954
63 12140 2140 AUS 6500 CC Dr. 30°26'30" 97°44'40" 9 1988 1996 3.282 .677 –.222 2.977 1.185 –.0954
64 12200 2200 AUS E. Rundberg Ln. at Fire Station 30°21'30" 97°40'42" 8 1989 1996 3.318 .693 –.214 3.005 1.293 –.0954
65 12210 2210 AUS 2700 Loyola Ln. 30°18'44" 97°40'40" 9 1988 1996 3.332 .699 –.211 3.009 1.304 –.0954
66 12220 2220 AUS 8700 Georgian Dr. 30°21'15" 97°41'42" 8 1989 1996 3.318 .692 –.215 3.000 1.283 –.0954
67 12230 2230 AUS 7500 Bennett Ave. 30°19'48" 97°41'50" 8 1989 1996 3.326 .695 –.213 3.000 1.289 –.0954
68 12240 2240 AUS 8800 Cameron Rd. 30°20'34" 97°40'45" 8 1989 1996 3.323 .694 –.213 3.006 1.296 –.0954
69 12300 2300 AUS 1000 Rutland Dr. 30°21'59" 97°41'58" 9 1988 1996 3.314 .690 –.216 2.998 1.274 –.0954
70 12320 2320 AUS 9100 Parkfield Dr. 30°21'55" 97°42'40" 9 1988 1996 3.313 .689 –.216 2.994 1.262 –.0954
71 12340 2340 AUS Golden Meadow Dr. 30°22'49" 97°42'38" 9 1988 1996 3.308 .687 –.217 2.994 1.255 –.0954
72 12370 2370 AUS 1600 W. Enfield Rd. 30°17'37" 97°45'50" 8 1989 1996 3.333 .695 –.216 2.963 1.256 –.0954
73 12380 2380 AUS W. 12th St. at Shoal Creek 30°16'35" 97°45'00" 8 1989 1996 3.339 .698 –.214 2.983 1.276 –.0954
74 12400 2400 AUS W. 45th St. at Shoal Creek 30°18'55" 97°44'53" 8 1989 1996 3.327 .693 –.215 2.973 1.256 –.0954
75 12410 2410 AUS 6500 Arroyo Seca 30°20'13" 97°43'56" 8 1989 1996 3.321 .692 –.216 2.986 1.257 –.0954
Table 1. Stations for two precipitation-monitoring networks near Austin, Texas—Continued
Site
no.
Current
study
station
no.
Original
station
no.
Operator Station name Latitude Longitude
Years
of
record
Begin-
ning
year
of
record
Ending
year
of
record
Distribution parameters for determining
recurrence interval of annual precipitation maxima
(Asquith, 1998)
GLO
ξ(in.)
GLO
α(in.)
GLO
κ(--)
GEV
ξ(in.)
GEV
α(in.)
GEV
κ(--)

38 Areal-R
edu
ction
Facto
rs for th
e Precip
itation
of th
e 1-Day D
esign
Sto
rm in
Texas
76 12500 2500 AUS 6700 Shoal Creek Blvd. 30°20'46" 97°44'42" 8 1989 1996 3.317 0.690 –0.217 2.980 1.239 –0.0954
77 12520 2520 AUS 3000 Foster Ln. at Shoal Creek 30°21'27" 97°44'20" 9 1988 1996 3.313 .689 –.217 2.983 1.238 –.0954
78 12540 2540 AUS 7600 Woodhollow 30°21'49" 97°45'17" 8 1989 1996 3.310 .687 –.219 2.973 1.218 –.0954
79 12550 2550 AUS Loop 1 (MoPac) at US 183 at frontage road 30°22'27" 97°43'28" 7 1990 1996 3.309 .687 –.218 2.989 1.242 –.0954
80 12600 2600 AUS FM 1826 at Goldwood 30°08'42" 97°58'18" 8 1989 1996 3.374 .705 –.223 3.323 1.243 –.0954
81 12720 2720 AUS FM 967 at Buda and Onion Creek 30°05'47" 97°50'47" 7 1990 1996 3.385 .717 –.213 3.301 1.312 –.0954
82 12730 2730 AUS 900 Barton Creek Blvd. 30°17'27" 97°51'19" 7 1990 1996 3.329 .690 –.222 2.941 1.184 –.0954
83 12750 2750 AUS 11200 Brodie Ln. 30°09'45" 97°51'50" 7 1990 1996 3.369 .707 –.217 3.226 1.281 –.0954
84 12790 2790 AUS William Cannon Dr. at Onion Creek 30°10'21" 97°45'03" 5 1992 1996 3.367 .712 –.211 3.126 1.311 –.0954
85 12900 2900 AUS Del Valle School 30°12'55" 97°39'53" 6 1991 1996 3.357 .713 –.207 3.069 1.315 –.0954
86 13000 3000 AUS E. 12th St. at Red River 30°16'20" 97°44'06" 6 1991 1996 3.341 .700 –.213 2.998 1.288 –.0954
87 13100 3100 AUS 4400 Ave. F 30°18'28" 97°43'38" 9 1988 1996 3.330 .696 –.214 2.990 1.278 –.0954
88 13110 3110 AUS 38th St. at Guadalupe St. 30°18'11" 97°44'27" 8 1989 1996 3.331 .696 –.215 2.980 1.269 –.0954
89 13120 3120 AUS 500 Koenig Ln. at FM 2222 30°19'22" 97°43'21" 9 1988 1996 3.326 .694 –.214 2.989 1.274 –.0954
90 13130 3130 AUS 3200 Hemphill Park 30°17'49" 97°44'08" 5 1992 1996 3.333 .697 –.214 2.986 1.277 –.0954
91 13200 3200 AUS 3700 Oak Springs Dr. 30°16'25" 97°41'35" 8 1989 1996 3.342 .703 –.210 3.014 1.306 –.0954
92 13210 3210 AUS MLK Blvd. at Morris Williams Golf Course 30°17'06" 97°41'12" 9 1988 1996 3.339 .702 –.210 3.011 1.306 –.0954
93 13220 3220 AUS 2100 E. 51st St. 30°18'15" 97°41'38" 9 1988 1996 3.333 .699 –.212 3.004 1.299 –.0954
94 13300 3300 AUS 5300 Manor Rd. 30°18'00" 97°41'07" 10 1987 1996 3.335 .700 –.211 3.008 1.303 –.0954
95 13310 3310 AUS 1650 Webberville Rd. 30°16'40" 97°40'52" 9 1988 1996 3.341 .703 –.210 3.016 1.309 –.0954
96 13320 3320 AUS 3320 Berkman Dr. 30°18'48" 97°41'37" 9 1988 1996 3.331 .697 –.212 3.003 1.297 –.0954
97 13400 3400 AUS 2600 Webberville Rd. 30°15'49" 97°42'44" 8 1989 1996 3.344 .703 –.211 3.014 1.301 –.0954
98 13410 3410 AUS 2900 Manor Rd. 30°17'09" 97°42'38" 9 1988 1996 3.338 .700 –.212 3.002 1.296 –.0954
99 13500 3500 AUS 5400 US 183 S. 30°10'14" 97°41'39" 8 1989 1996 3.367 .716 –.208 3.130 1.315 –.0954
100 13600 3600 AUS Canyon Vista School 30°25'37" 97°47'17" 9 1988 1996 3.282 .677 –.225 2.949 1.148 –.0954
Table 1. Stations for two precipitation-monitoring networks near Austin, Texas—Continued
Site
no.
Current
study
station
no.
Original
station
no.
Operator Station name Latitude Longitude
Years
of
record
Begin-
ning
year
of
record
Ending
year
of
record
Distribution parameters for determining
recurrence interval of annual precipitation maxima
(Asquith, 1998)
GLO
ξ(in.)
GLO
α(in.)
GLO
κ(--)
GEV
ξ(in.)
GEV
α(in.)
GEV
κ(--)

Tab
le 2 39
Table 2
Table 2. Stations for two precipitation-monitoring networks near Dallas, Texas—Continued
Site
no.
Current
study
station
no.
Original
station
no.
Operator Station name Latitude Longitude
Years
of
record
Begin-
ning
year
of
record
Ending
year
of
record
Distribution parameters for determining
recurrence interval of annual precipitation maxima
(Asquith, 1998)
GLO
ξ(in.)
GLO
α(in.)
GLO
κ(--)
GEV
ξ(in.)
GEV
α(in.)
GEV
κ(--)
1 129 129 NWS Aledo 4 SE 32°39' 97°34' 35 1960 1995 3.220 0.720 –0.220 2.920 1.050 –0.0954
2 201 201 NWS Alvarado 32°25' 97°13' 16 1948 1964 3.320 .740 –.210 2.990 1.100 –.0954
3 262 262 NWS Anna 33°21' 96°31' 47 1948 1995 3.620 .800 –.220 3.260 1.240 –.0954
4 337 337 NWS Arlington 32°42' 97°07' 47 1948 1995 3.340 .750 –.220 2.990 1.110 –.0954
5 440 440 NWS Avalon 32°12' 96°47' 31 1964 1995 3.470 .780 –.200 3.100 1.200 –.0954
6 518 518 NWS Bardwell Dam 32°16' 96°38' 30 1965 1995 3.520 .790 –.200 3.150 1.210 –.0954
7 691 691 NWS Benbrook Dam 32°39' 97°27' 46 1949 1995 3.250 .730 –.220 2.950 1.070 –.0954
8 996 996 NWS Boyd 33°04' 97°34' 47 1948 1995 3.230 .710 –.230 2.980 1.090 –.0954
9 1063 1063 NWS Bridgeport 33°13' 97°46' 47 1948 1995 3.180 .700 –.230 2.970 1.070 –.0954
10 1245 1245 NWS Burleson 2 S-SW 32°31' 97°20' 37 1948 1985 3.280 .730 –.220 2.970 1.080 –.0954
Table 2. Stations for two precipitation-monitoring networks near Dallas, Texas
[GLO, generalized logistic distribution; in., inches; --, dimensionless; GEV, generalized extreme-value distribution; NWS, National Weather Service; DAL, City of Dallas]
101 13610 3610 AUS River Place at FM 2222 30°23'51" 97°50'40" 8 1989 1996 3.287 0.677 –0.226 2.915 1.105 –0.0954
102 13620 3620 AUS 8300 Fathom Cir. 30°25'55" 97°46'09" 7 1990 1996 3.282 .677 –.224 2.960 1.165 –.0954
103 13630 3630 AUS 10700 Floral Park 30°24'32" 97°45'35" 8 1989 1996 3.292 .681 –.222 2.959 1.185 –.0954
104 13700 3700 AUS Loop 360 at Bull Creek 30°22'40" 97°46'39" 9 1988 1996 3.302 .684 –.221 2.948 1.185 –.0954
105 13710 3710 AUS Long Canyon Volunteer Fire Department 30°22'30" 97°49'25" 6 1991 1996 3.299 .681 –.223 2.912 1.138 –.0954
106 14800 4800 AUS Texas Instruments WX Station 30°25'55" 97°45'04" 8 1989 1996 3.285 .678 –.222 2.971 1.183 –.0954
107 14900 4900 AUS McKinney Falls 30°10'20" 97°43'00" 9 1988 1996 3.367 .714 –.209 3.128 1.315 –.0954
108 15000 5000 AUS Decker WX Station 30°16'36" 97°36'32" 9 1988 1996 3.341 .709 –.206 3.044 1.317 –.0954
Table 1. Stations for two precipitation-monitoring networks near Austin, Texas—Continued
Site
no.
Current
study
station
no.
Original
station
no.
Operator Station name Latitude Longitude
Years
of
record
Begin-
ning
year
of
record
Ending
year
of
record
Distribution parameters for determining
recurrence interval of annual precipitation maxima
(Asquith, 1998)
GLO
ξ(in.)
GLO
α(in.)
GLO
κ(--)
GEV
ξ(in.)
GEV
α(in.)
GEV
κ(--)

40 Areal-R
edu
ction
Facto
rs for th
e Precip
itation
of th
e 1-Day D
esign
Sto
rm in
Texas
11 1490 1490 NWS Carrollton 32°59' 96°54' 47 1948 1995 3.410 0.770 –0.220 3.080 1.170 –0.0954
12 1573 1573 NWS Celina 33°19' 96°48' 35 1948 1983 3.460 .790 –.220 3.250 1.210 –.0954
13 1800 1800 NWS Cleburne 32°20' 97°24' 80 1915 1995 3.270 .720 –.220 2.960 1.090 –.0954
14 2080 2080 NWS Crandall 32°38' 96°28' 34 1960 1994 3.610 .790 –.200 3.180 1.210 –.0954
15 2242 2242 NWS Dallas-Fort Worth Regional Weather Service Office Airport 32°54' 97°02' 21 1974 1995 3.370 .750 –.220 3.010 1.140 –.0954
16 2244 2244 NWS Dallas FAA Airport 32°51' 96°51' 47 1948 1995 3.430 .770 –.210 3.040 1.170 –.0954
17 2334 2334 NWS Decatur 33°14' 97°36' 23 1972 1995 3.230 .710 –.230 3.030 1.110 –.0954
18 2403 2403 NWS Denton 33°14' 97°08' 16 1949 1965 3.360 .750 –.220 3.140 1.170 –.0954
19 2677 2677 NWS Eagle Mountain Lake 32°53' 97°27' 17 1978 1995 3.260 .720 –.220 2.970 1.070 –.0954
20 2925 2925 NWS Ennis 32°20' 96°38' 40 1951 1991 3.520 .790 –.200 3.140 1.200 –.0954
21 3080 3080 NWS Farmersville 33°11' 96°22' 48 1947 1995 3.700 .800 –.210 3.250 1.240 –.0954
22 3133 3133 NWS Ferris 32°32' 96°40' 45 1950 1995 3.510 .780 –.210 3.100 1.200 –.0954
23 3283 3283 NWS Fort Worth Weather Service Office Airport 32°50' 97°03' 20 1953 1973 3.360 .750 –.220 2.990 1.130 –.0954
24 3284 3284 NWS Fort Worth Meacham Weather Service Office Airport 32°49' 97°21' 3 1992 1995 3.280 .730 –.220 2.970 1.080 –.0954
25 3286 3286 NWS Fort Worth Vickery Blvd. 32°44' 97°20' 13 1953 1966 3.280 .730 –.220 2.970 1.080 –.0954
26 3370 3370 NWS Frisco 33°09' 96°50' 29 1966 1995 3.440 .780 –.220 3.180 1.190 –.0954
27 3476 3476 NWS Garza Little Elm Dam 33°04' 97°01' 14 1949 1963 3.370 .760 –.220 3.090 1.160 –.0954
28 3691 3691 NWS Grapevine Dam 32°58' 97°03' 46 1949 1995 3.360 .750 –.220 3.030 1.140 –.0954
29 3822 3822 NWS Gunter 5 S 33°22' 96°46' 47 1948 1995 3.480 .790 –.220 3.260 1.220 –.0954
30 4597 4597 NWS Joe Pool Lake 32°38' 97°01' 11 1984 1995 3.370 .760 –.210 2.990 1.130 –.0954
31 4705 4705 NWS Kaufman 3 SE 32°33' 96°16' 80 1915 1995 3.720 .800 –.200 3.260 1.220 –.0954
32 4761 4761 NWS Kennedale 6 S-SW 32°33' 97°14' 32 1949 1981 3.310 .740 –.210 2.990 1.090 –.0954
33 4914 4914 NWS Lake Ray Hubbard 32°48' 96°29' 15 1978 1993 3.610 .790 –.210 3.180 1.220 –.0954
34 4977 4977 NWS Lake Dallas 33°07' 97°02' 9 1947 1956 3.370 .760 –.220 3.110 1.160 –.0954
35 5094 5094 NWS Lavon Dam 33°02' 96°29' 46 1949 1995 3.620 .800 –.210 3.220 1.230 –.0954
Table 2. Stations for two precipitation-monitoring networks near Dallas, Texas—Continued
Site
no.
Current
study
station
no.
Original
station
no.
Operator Station name Latitude Longitude
Years
of
record
Begin-
ning
year
of
record
Ending
year
of
record
Distribution parameters for determining
recurrence interval of annual precipitation maxima
(Asquith, 1998)
GLO
ξ(in.)
GLO
α(in.)
GLO
κ(--)
GEV
ξ(in.)
GEV
α(in.)
GEV
κ(--)

Tab
le 2 41
36 5191 5191 NWS Lewisville 33°03' 97°00' 12 1947 1959 3.380 0.760 –0.220 3.080 1.160 –0.0954
37 5216 5216 NWS Lillian 32°30' 97°11' 12 1947 1959 3.320 .750 –.210 3.000 1.100 –.0954
38 5258 5258 NWS Little Elm 33°10' 96°56' 20 1946 1966 3.400 .770 –.220 3.160 1.180 –.0954
39 5560 5560 NWS Mansfield 32°34' 97°09' 17 1947 1964 3.330 .750 –.210 3.000 1.100 –.0954
40 5646 5646 NWS Marys Creek 32°44' 97°30' 26 1947 1973 3.240 .720 –.220 2.940 1.060 –.0954
41 5766 5766 NWS McKinney 3 S 33°10' 96°37' 80 1915 1995 3.530 .790 –.210 3.220 1.220 –.0954
42 5896 5896 NWS Midlothian 32°29' 97°03' 17 1947 1964 3.370 .760 –.210 3.000 1.120 –.0954
43 6116 6116 NWS Mountain Creek 32°43' 96°56' 17 1947 1964 3.400 .760 –.210 3.000 1.150 –.0954
44 7028 7028 NWS Pilot Point 33°23' 96°58' 48 1947 1995 3.410 .780 –.220 3.240 1.200 –.0954
45 7165 7165 NWS Poolville 32°58' 97°52' 10 1947 1957 3.150 .700 –.230 2.870 1.030 –.0954
46 7495 7495 NWS Red Oak 32°31' 96°48' 30 1964 1994 3.450 .780 –.210 3.040 1.180 –.0954
47 7588 7588 NWS Richardson 32°59' 96°45' 45 1950 1995 3.460 .780 –.210 3.120 1.190 –.0954
48 7659 7659 NWS Roanoke 33°00' 97°14' 48 1947 1995 3.320 .740 –.220 3.010 1.110 –.0954
49 7707 7707 NWS Rockwall 32°56' 96°28' 49 1946 1995 3.620 .800 –.210 3.210 1.220 –.0954
50 7773 7773 NWS Rosser 32°28' 96°27' 48 1947 1995 3.610 .800 –.200 3.200 1.210 –.0954
51 8043 8043 NWS Sanger 33°22' 97°10' 5 1990 1995 3.360 .750 –.220 3.190 1.180 –.0954
52 8378 8378 NWS Slidell 33°21' 97°23' 48 1947 1995 3.310 .730 –.230 3.120 1.150 –.0954
53 8561 8561 NWS Springtown 32°58' 97°40' 21 1957 1978 3.200 .710 –.220 2.930 1.060 –.0954
54 8929 8929 NWS Terrell 32°45' 96°17' 48 1947 1995 3.730 .800 –.200 3.240 1.230 –.0954
55 9337 9337 NWS Venus 32°26' 97°06' 17 1947 1964 3.350 .750 –.210 3.000 1.120 –.0954
56 9522 9522 NWS Waxahachie 32°25' 96°51' 80 1915 1995 3.440 .770 –.210 3.050 1.170 –.0954
57 9532 9532 NWS Weatherford 32°46' 97°49' 80 1915 1995 3.160 .710 –.220 2.860 1.030 –.0954
58 9538 9538 NWS Webb 32°42' 97°04' 12 1947 1959 3.360 .750 –.210 2.990 1.120 –.0954
59 40155 155 DAL Turtle Creek at Willow Wood St. 32°49'35" 96°48'04" 7 1991 1997 3.450 .770 –.210 3.050 1.180 –.0954
60 40195 195 DAL NW Hwy. at Edgemere Rd. 32°52'03" 96°47'42" 7 1991 1997 3.450 .770 –.210 3.060 1.180 –.0954
Table 2. Stations for two precipitation-monitoring networks near Dallas, Texas—Continued
Site
no.
Current
study
station
no.
Original
station
no.
Operator Station name Latitude Longitude
Years
of
record
Begin-
ning
year
of
record
Ending
year
of
record
Distribution parameters for determining
recurrence interval of annual precipitation maxima
(Asquith, 1998)
GLO
ξ(in.)
GLO
α(in.)
GLO
κ(--)
GEV
ξ(in.)
GEV
α(in.)
GEV
κ(--)

42 Areal-R
edu
ction
Facto
rs for th
e Precip
itation
of th
e 1-Day D
esign
Sto
rm in
Texas
61 40915 915 DAL McCree Branch at White Rock Tr. 32°52'18" 96°43'25" 7 1991 1997 3.480 0.780 –0.210 3.090 1.190 –0.0954
62 40935 935 DAL Jackson Branch at Skillman Ave. 32°53'19" 96°43'53" 7 1991 1997 3.470 .780 –.210 3.090 1.190 –.0954
63 41055 1055 DAL White Rock Creek at Spring Valley 32°56'23" 96°47'12" 7 1991 1997 3.450 .780 –.210 3.090 1.180 –.0954
64 41095 1095 DAL Preston Rd. at Olive 33°00'47" 96°47'45" 7 1991 1997 3.450 .780 –.220 3.120 1.190 –.0954
65 41235 1235 DAL Dixon Branch below NW Hwy. 32°51'51" 96°41'57" 7 1991 1997 3.490 .780 –.210 3.100 1.190 –.0954
66 41515 1515 DAL White Rock Lake Dam 32°49'15" 96°43'40" 7 1991 1997 3.480 .780 –.210 3.080 1.190 –.0954
67 41535 1535 DA Stonewall Jackson School 32°50'05" 96°45'56" 7 1991 1997 3.460 .770 –.210 3.060 1.180 –.0954
68 41755 1755 DAL Harry Stone Park at Millmar Dr. 32°49'36" 96°40'29" 7 1991 1997 3.500 .780 –.210 3.100 1.200 –.0954
69 41855 1855 DAL Exall Park at Bryan St. 32°47'33" 96°47'07" 7 1991 1997 3.450 .770 –.210 3.050 1.180 –.0954
70 41955 1955 DAL Garrett Park at Bryan St. 32°48'23" 96°46'15" 7 1991 1997 3.460 .770 –.210 3.060 1.180 –.0954
71 42055 2055 DAL White Rock Creek at Scyene Rd. 32°45'58" 96°43'30" 7 1991 1997 3.480 .780 –.210 3.070 1.190 –.0954
72 42535 2535 DAL Lake June Branch at St. Augustine Dr. 32°44'10" 96°39'24" 7 1991 1997 3.510 .780 –.210 3.100 1.200 –.0954
73 42555 2555 DAL Elam Creek at Lake June Rd. 32°44'05" 96°41'41" 7 1991 1997 3.490 .780 –.210 3.080 1.190 –.0954
74 43075 3075 DAL SMBX (Street Station)-Municipal at Budd 32°44'25" 96°45'20" 7 1991 1997 3.470 .780 –.210 3.050 1.180 –.0954
75 44135 4135 DAL Woody Branch at Westmoreland Rd. 32°40'25" 96°52'57" 7 1991 1997 3.420 .770 –.210 3.010 1.160 –.0954
76 44155 4155 DAL Woody Branch at Polk St. 32°40'11" 96°50'24" 7 1991 1997 3.430 .770 –.210 3.030 1.170 –.0954
77 44515 4515 DAL Five Mile Creek at Polk St. 32°41'40" 96°50'23" 7 1991 1997 3.430 .770 –.210 3.030 1.170 –.0954
78 44535 4535 DAL Five Mile Creek at Lancaster Rd. 32°40'49" 96°47'10" 7 1991 1997 3.460 .770 –.210 3.050 1.180 –.0954
79 44555 4555 DAL Five Mile Creek at Westmoreland Rd. 32°42'24" 96°52'28" 7 1991 1997 3.420 .770 –.210 3.020 1.160 –.0954
80 44855 4855 DAL Sargent Rd. at Morrell Ave. 32°44'43" 96°46'54" 7 1991 1997 3.450 .770 –.210 3.050 1.180 –.0954
81 45055 5055 DAL Cedar Creek at Clarendon Dr. 32°44'04" 96°49'52" 7 1991 1997 3.440 .770 –.210 3.030 1.170 –.0954
82 45235 5235 DAL Coombs Creek at Hampton Rd. 32°45'19" 96°51'23" 7 1991 1997 3.430 .770 –.210 3.020 1.160 –.0954
83 45295 5295 DAL L.O. Donald School 32°43'58" 96°53'14" 7 1991 1997 3.410 .770 –.210 3.010 1.160 –.0954
84 45515 5515 DAL Jefferson Blvd. at Ira Ave. 32°44'11" 96°54'59" 7 1991 1997 3.400 .760 –.210 3.010 1.150 –.0954
85 45535 5535 DAL Camp Wisdom Rd. at Sarah Dr. 32°39'58" 96°57'08" 7 1991 1997 3.390 .760 –.210 2.990 1.140 –.0954
Table 2. Stations for two precipitation-monitoring networks near Dallas, Texas—Continued
Site
no.
Current
study
station
no.
Original
station
no.
Operator Station name Latitude Longitude
Years
of
record
Begin-
ning
year
of
record
Ending
year
of
record
Distribution parameters for determining
recurrence interval of annual precipitation maxima
(Asquith, 1998)
GLO
ξ(in.)
GLO
α(in.)
GLO
κ(--)
GEV
ξ(in.)
GEV
α(in.)
GEV
κ(--)

Tab
le 2 43
86 46135 6135 DAL Upper A Sump at 1200 Industrial 32°45'44" 96°47'58" 7 1991 1997 3.450 0.770 –0.210 3.040 1.170 –0.0954
87 46235 6235 DAL Corinth St. Intake at W. Levee 32°45'15" 96°48'10" 7 1991 1997 3.450 .770 –.210 3.040 1.170 –.0954
88 46355 6355 DAL Sylvan at Union Pacific Railroad 32°46'24" 96°50'10" 7 1991 1997 3.430 .770 –.210 3.030 1.170 –.0954
89 46475 6475 DAL Singleton Blvd. at Shadrack Dr. 32°46'43" 96°52'43" 7 1991 1997 3.420 .770 –.210 3.020 1.160 –.0954
90 46505 6505 DAL Eagleford Control Gate 32°46'47" 96°55'04" 7 1991 1997 3.400 .760 –.210 3.010 1.150 –.0954
91 46635 6635 DAL West Fork at Belt Line 32°45'47" 96°59'47" 7 1991 1997 3.380 .760 –.210 2.990 1.140 –.0954
92 46715 6715 DAL 2255 Irving Blvd. 32°47'45" 96°50'09" 7 1991 1997 3.430 .770 –.210 3.030 1.170 –.0954
93 46775 6775 DAL Cedar Spring at Kings Rd. 32°49'13" 96°49'09" 7 1991 1997 3.440 .770 –.210 3.040 1.170 –.0954
94 46835 6835 DAL Mockingbird at CRI&P Railroad 32°48'20" 96°52'22" 7 1991 1997 3.420 .770 –.210 3.020 1.160 –.0954
95 46855 6855 DAL Knights Branch at Denton Dr. 32°49'30" 96°50'08" 7 1991 1997 3.430 .770 –.210 3.040 1.170 –.0954
96 46895 6895 DAL Inwood Rd. at University Blvd. 32°50'38" 96°49'16" 7 1991 1997 3.440 .770 –.210 3.050 1.170 –.0954
97 47035 7035 DAL Elm Fork at California Crossing 32°52'02" 96°55'33" 7 1991 1997 3.400 .760 –.220 3.030 1.160 –.0954
98 47535 7535 DAL Joes Creek at Walnut Hill 32°52'49" 96°51'39" 7 1991 1997 3.420 .770 –.220 3.050 1.170 –.0954
99 47555 7555 DAL Townsend at Royal Park 32°53'56" 96°51'44" 7 1991 1997 3.420 .770 –.220 3.060 1.170 –.0954
100 47725 7725 DAL Bachman Dam 32°50'58" 96°51'57" 7 1991 1997 3.420 .770 –.210 3.040 1.170 –.0954
101 47735 7735 DAL Bachman Branch at Midway Rd. 32°51'35" 96°50'12" 7 1991 1997 3.430 .770 –.210 3.050 1.170 –.0954
102 47755 7755 DAL Bachman Branch at Walnut Hill 32°52'47" 96°49'27" 7 1991 1997 3.440 .770 –.210 3.060 1.180 –.0954
103 47775 7775 DAL Bachman Branch at Forest Ln. 32°54'33" 96°49'12" 7 1991 1997 3.440 .770 –.210 3.070 1.180 –.0954
Table 2. Stations for two precipitation-monitoring networks near Dallas, Texas—Continued
Site
no.
Current
study
station
no.
Original
station
no.
Operator Station name Latitude Longitude
Years
of
record
Begin-
ning
year
of
record
Ending
year
of
record
Distribution parameters for determining
recurrence interval of annual precipitation maxima
(Asquith, 1998)
GLO
ξ(in.)
GLO
α(in.)
GLO
κ(--)
GEV
ξ(in.)
GEV
α(in.)
GEV
κ(--)

44 Areal-R
edu
ction
Facto
rs for th
e Precip
itation
of th
e 1-Day D
esign
Sto
rm in
Texas
Table 3
Table 3. Stations for three precipitation-monitoring networks near Houston, Texas—Continued
Site
no.
Cur-
rent
study
station
no.
Original
station
no.
Operator Station name Latitude Longitude
Years
of
record
Begin-
ning
year
of
record
Ending
year
of
record
Distribution parameters for determining
recurrence interval of annual precipitation maxima
(Asquith, 1998)
GLO
ξ(in.)
GLO
α(in.)
GLO
κ(--)
GEV
ξ(in.)
GEV
α(in.)
GEV
κ(--)
1 204 204 NWS Alvin 29°25' 95°13' 2 1995 1996 4.380 1.150 –0.250 4.100 1.500 –0.0954
2 235 235 NWS Anahuac 29°47' 94°40' 66 1931 1996 4.700 1.180 –.250 4.380 1.550 –.0954
3 257 257 NWS Angleton 2 W 29°09' 95°27' 82 1915 1996 4.400 1.150 –.250 4.240 1.510 –.0954
4 569 569 NWS Bay City Waterworks 28°59' 95°59' 55 1942 1996 4.320 1.120 –.250 3.980 1.470 –.0954
5 586 586 NWS Baytown 29°50' 95°00' 15 1982 1996 4.440 1.170 –.250 4.200 1.490 –.0954
6 611 611 NWS Beaumont City 30°06' 94°06' 82 1915 1996 4.840 1.170 –.250 4.610 1.720 –.0954
7 613 613 NWS Beaumont Research Center 30°04' 94°17' 19 1978 1996 4.840 1.180 –.250 4.530 1.740 –.0954
8 1034 1034 NWS Brazoria 29°93' 95°34' 15 1915 1929 3.720 .990 –.250 3.570 1.280 –.0954
9 1810 1810 NWS Cleveland 30°22' 95°05' 43 1954 1996 4.320 1.150 –.250 3.710 1.440 –.0954
10 1838 1838 NWS Clodine 29°42' 95°41' 46 1951 1996 4.020 1.070 –.250 3.620 1.390 –.0954
11 1870 1870 NWS Cold Spring 5 S-SW 30°32' 95°09' 43 1954 1996 4.220 1.120 –.250 3.590 1.420 –.0954
12 1956 1956 NWS Conroe 30°20' 95°29' 49 1948 1996 3.870 1.080 –.250 3.650 1.310 –.0954
13 2206 2206 NWS Cypress 29°58' 95°42' 7 1990 1996 3.850 1.030 –.250 3.580 1.350 –.0954
14 2218 2218 NWS Dacus 30°26' 95°47' 43 1954 1996 3.600 .930 –.250 3.570 1.240 –.0954
15 2266 2266 NWS Danevang 1 W 29°04' 96°13' 82 1915 1996 4.140 1.090 –.250 3.830 1.410 –.0954
16 2436 2436 NWS Deweyville 5 S 30°14' 93°44' 33 1954 1986 4.780 1.090 –.250 4.820 1.650 –.0954
17 2786 2786 NWS El Campo 29°12' 96°17' 34 1941 1974 3.970 1.050 –.250 3.670 1.360 –.0954
18 3000 3000 NWS Evadale 30°20' 94°05' 5 1992 1996 4.750 1.100 –.250 4.420 1.570 –.0954
19 3298 3298 NWS Four Notch Guard Station 30°39' 95°25' 25 1940 1964 3.900 1.020 –.250 3.540 1.350 –.0954
20 3340 3340 NWS Freeport 2 NW 28°59' 95°23' 66 1931 1996 4.380 1.160 –.250 4.380 1.580 –.0954
21 3430 3430 NWS Galveston Weather Service Office 29°18' 94°48' 51 1946 1996 4.530 1.180 –.250 4.390 1.560 –.0954
22 3431 3431 NWS Galveston Weather Bureau Airport 29°16' 94°51' 16 1948 1963 4.500 1.170 –.250 4.390 1.560 –.0954
23 3640 3640 NWS Goose Creek 29°44' 94°58' 36 1921 1956 4.470 1.170 –.250 4.240 1.490 –.0954
24 4080 4080 NWS Hempstead 30°06' 96°05' 33 1946 1978 3.600 .900 –.250 3.460 1.310 –.0954
25 4300 4300 NWS Houston WSCMO Airport 29°58' 95°21' 28 1969 1996 4.160 1.130 –.250 3.940 1.430 –.0954
Table 3. Stations for three precipitation-monitoring networks near Houston, Texas
[GLO, generalized logistic distribution; in., inches; --, dimensionless; GEV, generalized extreme-value distribution; NWS, National Weather Service; WSCMO, Weather Service Contract Meteorological Observatory; FAA, Federal Aviation Administration; HAR, Harris County Office of Emergency Management; HURP, U.S. Geological Survey Houston Urban Program]

Tab
le 3 45
26 4305 4305 NWS Houston Weather Bureau City 29°46' 95°22' 29 1941 1969 4.230 1.130 –0.250 3.870 1.440 –0.0954
27 4307 4307 NWS Houston FAA Airport 29°39' 95°17' 33 1941 1973 4.310 1.140 –.250 3.930 1.460 –.0954
28 4311 4311 NWS Houston—Alief 29°43' 95°36' 17 1948 1964 4.070 1.090 –.250 3.670 1.410 –.0954
29 4313 4313 NWS Houston—Barker 29°49' 95°44' 49 1948 1996 3.910 1.040 –.250 3.550 1.380 –.0954
30 4315 4315 NWS Houston—Deer Park 29°43' 95°08' 52 1945 1996 4.380 1.160 –.250 4.100 1.470 –.0954
31 4321 4321 NWS Houston—Heights 29°47' 95°26' 8 1989 1996 4.170 1.120 –.250 3.790 1.430 –.0954
32 4323 4323 NWS Houston—Independence Heights 29°52' 95°25' 48 1948 1995 4.150 1.120 –.250 3.810 1.420 –.0954
33 4325 4325 NWS Houston—Westbury 29°40' 95°28' 49 1948 1996 4.200 1.120 –.250 3.800 1.430 –.0954
34 4327 4327 NWS Houston—N Houston 29°53' 95°32' 49 1948 1996 4.050 1.100 –.250 3.670 1.400 –.0954
35 4328 4328 NWS Houston—San Jacinto St. 29°55' 95°09' 43 1954 1996 4.330 1.160 –.250 4.110 1.460 –.0954
36 4329 4329 NWS Houston—Satsuma 29°56' 95°38' 17 1948 1964 3.930 1.060 –.250 3.610 1.370 –.0954
37 4331 4331 NWS Houston—Spring Branch 29°48' 95°30' 7 1990 1996 4.110 1.110 –.250 3.720 1.420 –.0954
38 4362 4362 NWS Humble 30°00' 95°15' 32 1954 1985 4.250 1.150 –.250 4.030 1.450 –.0954
39 4382 4382 NWS Huntsville 30°43' 95°33' 51 1946 1996 3.750 .970 –.250 3.510 1.300 –.0954
40 4704 4704 NWS Katy-Wolf Hill 29°51' 95°50' 2 1995 1996 3.810 1.010 –.250 3.510 1.360 –.0954
41 4878 4878 NWS Kountze 3 SE 30°20' 94°14' 5 1992 1996 4.750 1.120 –.250 4.370 1.600 –.0954
42 5196 5196 NWS Liberty 30°03' 94°48' 82 1915 1996 4.620 1.170 –.250 4.220 1.570 –.0954
43 5496 5496 NWS Magnolia 1 W 30°13' 95°47' 11 1976 1986 3.670 .970 –.250 3.580 1.270 –.0954
44 5659 5659 NWS Matagorda 2 28°42' 95°58' 82 1915 1996 4.410 1.140 –.250 4.360 1.650 –.0954
45 6024 6024 NWS Montgomery 30°23' 95°42' 43 1954 1996 3.650 .970 –.250 3.600 1.260 –.0954
46 6280 6280 NWS New Caney 2 E 30°08' 95°11' 45 1952 1996 4.290 1.150 –.250 3.980 1.440 –.0954
47 6286 6286 NWS New Gulf 29°16' 95°54' 51 1946 1996 4.180 1.090 –.250 3.700 1.400 –.0954
48 6664 6664 NWS Orange 4 NW 30°07' 93°47' 59 1938 1996 4.830 1.150 –.250 4.760 1.680 –.0954
49 6750 6750 NWS Palacios FAA Airport 28°43' 96°15' 54 1943 1996 4.340 1.120 –.250 4.330 1.640 –.0954
50 7020 7020 NWS Pierce 1 E 29°14' 96°11' 82 1915 1996 4.000 1.060 –.250 3.650 1.370 –.0954
Table 3. Stations for three precipitation-monitoring networks near Houston, Texas—Continued
Site
no.
Cur-
rent
study
station
no.
Original
station
no.
Operator Station name Latitude Longitude
Years
of
record
Begin-
ning
year
of
record
Ending
year
of
record
Distribution parameters for determining
recurrence interval of annual precipitation maxima
(Asquith, 1998)
GLO
ξ(in.)
GLO
α(in.)
GLO
κ(--)
GEV
ξ(in.)
GEV
α(in.)
GEV
κ(--)

46 Areal-R
edu
ction
Facto
rs for th
e Precip
itation
of th
e 1-Day D
esign
Sto
rm in
Texas
51 7172 7172 NWS Port Arthur City 29°54' 93°56' 22 1975 1996 4.860 1.220 –0.250 4.680 1.720 –0.0954
52 7173 7173 NWS Port Arthur 29°52' 93°56' 22 1946 1967 4.860 1.230 –.250 4.680 1.730 –.0954
53 7174 7174 NWS Port Arthur Weather Service Office Airport 29°57' 94°01' 50 1947 1996 4.850 1.210 –.250 4.660 1.730 –.0954
54 7594 7594 NWS Richmond 29°53' 95°45' 51 1946 1996 4.030 1.070 –.250 3.610 1.400 –.0954
55 7651 7651 NWS Riverside 30°51' 95°24' 25 1946 1970 3.880 .980 –.250 3.460 1.370 –.0954
56 7756 7756 NWS Rosenberg 29°33' 95°47' 20 1941 1960 4.030 1.070 –.250 3.590 1.390 –.0954
57 8045 8045 NWS San Jacinto 30°37' 95°43' 10 1977 1986 3.620 .930 –.250 3.520 1.250 –.0954
58 8728 8728 NWS Sugar Land 29°37' 95°38' 51 1946 1996 4.100 1.090 –.250 3.690 1.410 –.0954
59 8996 8996 NWS Thompsons 3 W-SW 29°29' 95°38' 40 1957 1996 4.200 1.100 –.250 3.760 1.420 –.0954
60 9076 9076 NWS Tomball 30°06' 95°37' 51 1946 1996 3.850 1.050 –.250 3.650 1.330 –.0954
61 9448 9448 NWS Waller 3 S-SW 30°01' 95°56' 50 1947 1996 3.670 .950 –.250 3.490 1.330 –.0954
62 9655 9655 NWS Wharton 29°19' 96°06' 51 1946 1996 3.980 1.050 –.250 3.590 1.370 –.0954
63 9772 9772 NWS William Harris Reservoir 29°15' 95°33' 16 1949 1964 4.360 1.130 –.250 4.050 1.470 –.0954
64 9780 9780 NWS Willis 30°26' 95°29' 10 1919 1928 3.840 1.050 –.250 3.600 1.300 –.0954
65 70110 110 HAR A100 Clear Creek at I–45 29°30'41" 95°07'16" 12 1986 1997 4.400 1.160 –.250 4.160 1.490 –.0954
66 70120 120 HAR A100 Clear Creek at FM 2351 29°31'07" 95°10'43" 12 1986 1997 4.380 1.160 –.250 4.080 1.490 –.0954
67 70140 140 HAR A119 Turkey Creek at FM 1959 29°35'02" 95°11'30" 12 1986 1997 4.370 1.150 –.250 4.030 1.480 –.0954
68 70150 150 HAR A100 Clear Creek at Country Club 29°33'26" 95°15'10" 12 1986 1997 4.350 1.150 –.250 3.970 1.470 –.0954
69 70160 160 HAR A120 Beamer Ditch at Hughes Rd. 29°35'30" 95°13'23" 12 1986 1997 4.350 1.150 –.250 3.990 1.470 –.0954
70 70170 170 HAR A104 Nasa Rd. 1 at Taylor Lake 29°33'25" 95°03'15" 12 1986 1997 4.420 1.170 –.250 4.220 1.500 –.0954
71 70180 180 HAR A100 Clear Creek at Telephone 29°35'45" 95°17'20" 12 1986 1997 4.320 1.140 –.250 3.930 1.470 –.0954
72 70190 190 HAR A100 Clear Creek at State Hwy. 288 29°35'18" 95°23'03" 12 1986 1997 4.280 1.130 –.250 3.870 1.450 –.0954
73 70220 220 HAR B100 Middle Bayou at Genoa and Red Bluff 29°39'00" 95°07'45" 12 1986 1997 4.380 1.160 –.250 4.100 1.480 –.0954
74 70230 230 HAR B106 Big Island Slough at Fairmont 29°36'50" 95°05'05" 12 1986 1997 4.400 1.160 –.250 4.160 1.490 –.0954
75 70250 250 HAR B104 Bay Area Blvd. at Clear Lake 29°35'00" 95°06'10" 12 1986 1997 4.400 1.160 –.250 4.160 1.490 –.0954
Table 3. Stations for three precipitation-monitoring networks near Houston, Texas—Continued
Site
no.
Cur-
rent
study
station
no.
Original
station
no.
Operator Station name Latitude Longitude
Years
of
record
Begin-
ning
year
of
record
Ending
year
of
record
Distribution parameters for determining
recurrence interval of annual precipitation maxima
(Asquith, 1998)
GLO
ξ(in.)
GLO
α(in.)
GLO
κ(--)
GEV
ξ(in.)
GEV
α(in.)
GEV
κ(--)

Tab
le 3 47
76 70320 320 HAR C106 Berry Bayou at Forest Oaks 29°40'35" 95°14'37" 12 1986 1997 4.330 1.150 –0.250 3.970 1.460 –0.0954
77 70340 340 HAR C100 Sims Bayou at Telephone 29°40'27" 95°17'21" 12 1986 1997 4.300 1.140 –.250 3.930 1.460 –.0954
78 70360 360 HAR C100 Sims Bayou at MLK Blvd. 29°38'42" 95°20'13" 12 1986 1997 4.280 1.130 –.250 3.890 1.460 –.0954
79 70370 370 HAR C100 Sims Bayou at State Hwy. 288 29°38'02" 95°23'28" 12 1986 1997 4.260 1.130 –.250 3.850 1.450 –.0954
80 70380 380 HAR C100 Sims Bayou at Hiram Clarke 29°37'07" 95°26'45" 12 1986 1997 4.230 1.120 –.250 3.820 1.440 –.0954
81 70400 400 HAR D109 at Holcombe Blvd. 29°42'25" 95°21'15" 12 1986 1997 4.250 1.130 –.250 3.870 1.450 –.0954
82 70410 410 HAR D100 Brays Bayou at Lawndale 29°43'25" 95°18'15" 12 1986 1997 4.280 1.140 –.250 3.930 1.450 –.0954
83 70420 420 HAR D100 Brays Bayou at S. Main 29°41'48" 95°24'45" 12 1986 1997 4.220 1.120 –.250 3.820 1.440 –.0954
84 70440 440 HAR D100 Brays Bayou at Rice 29°40'42" 95°28'07" 12 1986 1997 4.190 1.110 –.250 3.790 1.430 –.0954
85 70460 460 HAR D100 Brays Bayou at Gessner 29°40'20" 95°31'40" 12 1986 1997 4.150 1.110 –.250 3.750 1.420 –.0954
86 70470 470 HAR D100 Brays Bayou at High Star 29°42'55" 95°35'15" 12 1986 1997 4.080 1.090 –.250 3.680 1.410 –.0954
87 70480 480 HAR D118 Keegans Bayou at Roark 29°39'20" 95°33'45" 12 1986 1997 4.140 1.100 –.250 3.730 1.420 –.0954
88 70490 490 HAR D118 Keegans Bayou at Keegan 29°39'55" 95°35'28" 12 1986 1997 4.110 1.090 –.250 3.710 1.410 –.0954
89 70520 520 HAR E100 White Oak Bayou at Heights 29°45'50" 95°24'25" 12 1986 1997 4.200 1.120 –.250 3.820 1.440 –.0954
90 70530 530 HAR E100 White Oak Bayou at Ella Blvd. 29°48'05" 95°26'45" 12 1986 1997 4.160 1.120 –.250 3.770 1.430 –.0954
91 70540 540 HAR E100 White Oak Bayou at Alabonson 29°52'15" 95°28'50" 12 1986 1997 4.100 1.110 –.250 3.730 1.410 –.0954
92 70550 550 HAR E100 White Oak Bayou at Lakeview 29°53'15" 95°33'20" 12 1986 1997 4.030 1.090 –.250 3.650 1.400 –.0954
93 70560 560 HAR E101 Little White Oak Bayou at Trimble 29°48'05" 95°22'15" 12 1986 1997 4.210 1.130 –.250 3.870 1.440 –.0954
94 70570 570 HAR E101 Little White Oak Bayou at Tidwell 29°50'00" 95°23'20" 12 1986 1997 4.190 1.130 –.250 3.850 1.430 –.0954
95 70580 580 HAR E115 Brickhouse Gully at Costa Rica 29°48'40" 95°28'15" 12 1986 1997 4.120 1.110 –.250 3.740 1.420 –.0954
96 70590 590 HAR E117 Cole Creek at Deihl 29°51'00" 95°22'15" 12 1986 1997 4.190 1.130 –.250 3.880 1.430 –.0954
97 70620 620 HAR F216 Little Cedar Bayou at Eighth St. 29°29'10" 95°01'40" 12 1986 1997 4.430 1.170 –.250 4.270 1.510 –.0954
98 70710 710 HAR G103 San Jacinto at G103–07–05 29°49'45" 95°05'00" 12 1986 1997 4.390 1.160 –.250 4.150 1.470 –.0954
99 70720 720 HAR G103 San Jacinto River at US 90 29°52'34" 95°05'37" 12 1986 1997 4.380 1.160 –.250 4.150 1.470 –.0954
100 70750 750 HAR G103 at Lake Houston Dam Spillway 30°02'30" 95°10'00" 12 1986 1997 4.320 1.160 –.250 4.060 1.460 –.0954
Table 3. Stations for three precipitation-monitoring networks near Houston, Texas—Continued
Site
no.
Cur-
rent
study
station
no.
Original
station
no.
Operator Station name Latitude Longitude
Years
of
record
Begin-
ning
year
of
record
Ending
year
of
record
Distribution parameters for determining
recurrence interval of annual precipitation maxima
(Asquith, 1998)
GLO
ξ(in.)
GLO
α(in.)
GLO
κ(--)
GEV
ξ(in.)
GEV
α(in.)
GEV
κ(--)

48 Areal-R
edu
ction
Facto
rs for th
e Precip
itation
of th
e 1-Day D
esign
Sto
rm in
Texas
101 70760 760 HAR G103 San Jacinto River at US 59 30°01'35" 95°15'30" 12 1986 1997 4.240 1.140 –0.250 4.020 1.440 –0.0954
102 70790 790 HAR G103 East Fork San Jacinto at FM 1485 30°08'45" 95°07'30" 12 1986 1997 4.340 1.160 –.250 3.990 1.450 –.0954
103 70820 820 HAR H100 Hunting Bayou at I–10 29°45'00" 95°15'00" 12 1986 1997 4.310 1.150 –.250 3.990 1.460 –.0954
104 70830 830 HAR H100 Hunting Bayou at Loop 610 E. 29°47'35" 95°16'10" 12 1986 1997 4.280 1.140 –.250 3.990 1.450 –.0954
105 70840 840 HAR H100 Hunting Bayou at Lockwood 29°48'34" 95°19'54" 12 1986 1997 4.240 1.130 –.250 3.920 1.440 –.0954
106 70920 920 HAR I100 Vince Bayou at Southmore 29°41'40" 95°12'45" 12 1986 1997 4.340 1.150 –.250 4.010 1.460 –.0954
107 70940 940 HAR I100 Little Vince Bayou at Jackson 29°42'30" 95°12'00" 12 1986 1997 4.340 1.150 –.250 4.030 1.460 –.0954
108 71050 1050 HAR J100 Spring Creek at I–45 30°06'55" 95°26'22" 12 1986 1997 4.030 1.110 –.250 3.790 1.380 –.0954
109 71070 1070 HAR J100 Spring Creek at State Hwy. 249 30°07'11" 95°39'00" 12 1986 1997 3.800 1.040 –.250 3.630 1.320 –.0954
110 71090 1090 HAR J100 Spring Creek at Hegar Rd. 30°05'55" 95°44'41" 12 1986 1997 3.740 1.000 –.250 3.580 1.310 –.0954
111 71110 1110 HAR K100 Cypress Creek at Cypresswood 30°01'35" 95°20'00" 12 1986 1997 4.170 1.130 –.250 3.960 1.430 –.0954
112 71120 1120 HAR K100 Cypress Creek at I–45 30°02'08" 95°24'43" 12 1986 1997 4.090 1.120 –.250 3.840 1.410 –.0954
113 71130 1130 HAR K100 Cypress Creek at Kuykendahl 30°01'44" 95°28'52" 12 1986 1997 4.020 1.100 –.250 3.750 1.390 –.0954
114 71140 1140 HAR K100 Cypress Creek at Stuebner-Airline 30°00'23" 95°30'42" 12 1986 1997 4.010 1.100 –.250 3.720 1.390 –.0954
115 71160 1160 HAR K100 Cypress Creek at Grant 29°58'23" 95°35'52" 12 1986 1997 3.950 1.070 –.250 3.640 1.370 –.0954
116 71170 1170 HAR K100 Cypress Creek at Huffmeister Rd. 29°57'45" 95°37'15" 12 1986 1997 3.930 1.060 –.250 3.620 1.370 –.0954
117 71180 1180 HAR K100 Cypress Creek at Katy-Hockley 29°57'00" 95°48'29" 12 1986 1997 3.770 1.000 –.250 3.530 1.350 –.0954
118 71190 1190 HAR K166 Little Mound Creek at Betka 30°01'15" 95°53'30" 12 1986 1997 3.690 .960 –.250 3.510 1.330 –.0954
119 71220 1220 HAR L100 Little Cypress at Cypress Rosehill 30°00'55" 95°41'37" 12 1986 1997 3.820 1.030 –.250 3.590 1.340 –.0954
120 71320 1320 HAR M100 Willow Creek at Kuykendahl 30°06'18" 95°32'15" 12 1986 1997 3.930 1.090 –.250 3.700 1.350 –.0954
121 71340 1340 HAR M100 Willow Creek at FM 249 30°03'45" 95°37'15" 12 1986 1997 3.860 1.050 –.250 3.640 1.350 –.0954
122 71420 1420 HAR N100 Carpenters Bayou at I–10 29°46'15" 95°08'40" 12 1986 1997 4.360 1.160 –.250 4.090 1.470 –.0954
123 71440 1440 HAR N100 Carpenters Bayou at Wallisville 29°47'35" 95°08'40" 12 1986 1997 4.360 1.160 –.250 4.100 1.470 –.0954
124 71520 1520 HAR O100 Goose Creek at State Hwy. 146 29°42'50" 94°59'30" 12 1986 1997 4.450 1.170 –.250 4.230 1.490 –.0954
125 71540 1540 HAR O100 Goose Creek at Baker Rd. 29°50'35" 95°00'35" 12 1986 1997 4.440 1.170 –.250 4.190 1.490 –.0954
Table 3. Stations for three precipitation-monitoring networks near Houston, Texas—Continued
Site
no.
Cur-
rent
study
station
no.
Original
station
no.
Operator Station name Latitude Longitude
Years
of
record
Begin-
ning
year
of
record
Ending
year
of
record
Distribution parameters for determining
recurrence interval of annual precipitation maxima
(Asquith, 1998)
GLO
ξ(in.)
GLO
α(in.)
GLO
κ(--)
GEV
ξ(in.)
GEV
α(in.)
GEV
κ(--)

Tab
le 3 49
126 71600 1600 HAR P100 Greens Bayou at Mount Houston Pkwy. 29°53'15" 95°13'59" 12 1986 1997 4.280 1.150 –0.250 4.060 1.450 –0.0954
127 71610 1610 HAR P100 Greens Bayou at Normandy 29°46'00" 95°11'20" 12 1986 1997 4.340 1.150 –.250 4.050 1.460 –.0954
128 71620 1620 HAR P100 Greens Bayou at Ley Rd. 29°50'13" 95°13'59" 12 1986 1997 4.300 1.150 –.250 4.050 1.450 –.0954
129 71630 1630 HAR P130 Garners Bayou at Beltway 8 29°56'03" 95°14'03" 12 1986 1997 4.270 1.150 –.250 4.060 1.450 –.0954
130 71640 1640 HAR P100 Greens Bayou at US 59 29°55'06" 95°18'23" 12 1986 1997 4.210 1.140 –.250 4.000 1.440 –.0954
131 71650 1650 HAR P130 Garners at US 59 29°58'40" 95°16'45" 12 1986 1997 4.220 1.140 –.250 4.020 1.440 –.0954
132 71660 1660 HAR P100 Greens Bayou at Knobcrest 29°57'25" 95°25'02" 12 1986 1997 4.110 1.120 –.250 3.820 1.420 –.0954
133 71670 1670 HAR P100 Greens Bayou at Cutten Rd. 29°56'50" 95°29'50" 12 1986 1997 4.050 1.100 –.250 3.720 1.400 –.0954
134 71680 1680 HAR P118 Halls Bayou at Jensen 29°50'05" 95°20'00" 12 1986 1997 4.230 1.130 –.250 3.930 1.440 –.0954
135 71690 1690 HAR P118 Halls Bayou at Airline 29°53'05" 95°23'45" 12 1986 1997 4.160 1.120 –.250 3.850 1.430 –.0954
136 71720 1720 HAR Q100 Cedar Bayou at State Hwy. 146 29°46'12" 95°55'00" 12 1986 1997 3.800 1.000 –.250 3.480 1.360 –.0954
137 71740 1740 HAR Q100 Cedar Bayou at US 90 29°58'23" 94°59'07" 12 1986 1997 4.460 1.170 –.250 4.170 1.490 –.0954
138 71840 1840 HAR R102 Gum Gully at Diamond Head 29°54'15" 95°05'00" 12 1986 1997 4.380 1.170 –.250 4.150 1.470 –.0954
139 71940 1940 HAR S100 Luce Bayou at FM 2100 30°03'15" 95°03'15" 12 1986 1997 4.400 1.160 –.250 4.110 1.480 –.0954
140 72020 2020 HAR T101 Mason Creek at Prince Creek 29°46'30" 95°43'45" 12 1986 1997 3.940 1.050 –.250 3.560 1.380 –.0954
141 72040 2040 HAR T100 Cane Island Branch at Franz Rd. 29°51'55" 95°38'40" 12 1986 1997 3.960 1.070 –.250 3.590 1.380 –.0954
142 72150 2150 HAR U101 S Mayde at Greenhouse 29°48'19" 95°42'15" 12 1986 1997 3.940 1.050 –.250 3.570 1.380 –.0954
143 72180 2180 HAR U102 Bear Creek at FM 529 29°53'15" 95°45'00" 12 1986 1997 3.850 1.030 –.250 3.550 1.360 –.0954
144 72210 2210 HAR W100 Buffalo Bayou at Turning Basin 29°45'00" 95°17'30" 12 1986 1997 4.280 1.140 –.250 3.950 1.450 –.0954
145 72220 2220 HAR W100 Buffalo Bayou at Milam 29°45'50" 95°21'30" 12 1986 1997 4.230 1.130 –.250 3.880 1.440 –.0954
146 72250 2250 HAR W140 State Hwy. 6 at Bingle 29°47'49" 95°30'14" 12 1986 1997 4.110 1.100 –.250 3.710 1.420 –.0954
147 72260 2260 HAR W100 Buffalo Bayou at San Felipe 29°45'00" 95°30'20" 12 1986 1997 4.130 1.110 –.250 3.730 1.420 –.0954
148 72270 2270 HAR W100 Buffalo Bayou at West Belt 29°45'45" 95°33'30" 12 1986 1997 4.080 1.100 –.250 3.680 1.410 –.0954
149 83630 3630 HURP Bettina St. ditch at Houston 29°46'32" 95°32'23" 6 1979 1984 4.090 1.100 –.250 3.690 1.410 –.0954
150 84145 4145 HURP Bingle Rd. storm sewer at Houston 29°51'31" 95°29'09" 5 1980 1984 4.100 1.110 –.250 3.720 1.410 –.0954
Table 3. Stations for three precipitation-monitoring networks near Houston, Texas—Continued
Site
no.
Cur-
rent
study
station
no.
Original
station
no.
Operator Station name Latitude Longitude
Years
of
record
Begin-
ning
year
of
record
Ending
year
of
record
Distribution parameters for determining
recurrence interval of annual precipitation maxima
(Asquith, 1998)
GLO
ξ(in.)
GLO
α(in.)
GLO
κ(--)
GEV
ξ(in.)
GEV
α(in.)
GEV
κ(--)

50 Areal-R
edu
ction
Facto
rs for th
e Precip
itation
of th
e 1-Day D
esign
Sto
rm in
Texas
151 84150 4150 HURP Cole Creek at Deihl Rd. 29°51'04" 95°29'16" 26 1964 1989 4.100 1.110 –0.250 3.720 1.410 –0.0954
152 84200 4200 HURP Brickhouse Gully at Clarblak at Houston 29°49'53" 95°31'42" 6 1979 1984 4.070 1.100 –.250 3.680 1.410 –.0954
153 84250 4250 HURP Brickhouse Gully at Costa Rica St. 29°49'40" 95°28'09" 26 1964 1989 4.130 1.110 –.250 3.740 1.420 –.0954
154 84400 4400 HURP Lazybrook St. storm sewer 29°48'15" 95°26'04" 6 1979 1984 4.160 1.120 –.250 3.780 1.430 –.0954
155 84540 4540 HURP Little Whiteoak Bayou at Trimble St. 29°47'33" 95°22'06" 5 1980 1984 4.220 1.130 –.250 3.870 1.440 –.0954
156 84760 4760 HURP Brays Bayou at Alief Rd. 29°42'39" 95°35'13" 4 1981 1984 4.090 1.090 –.250 3.690 1.410 –.0954
157 84780 4780 HURP Keegans Bayou at Keegan Rd. 29°39'55" 95°35'42" 6 1979 1984 4.110 1.090 –.250 3.700 1.410 –.0954
158 84800 4800 HURP Keegans Bayou at Roark Rd. 29°39'23" 95°33'43" 26 1964 1989 4.140 1.100 –.250 3.730 1.420 –.0954
159 84850 4850 HURP Bintliff ditch at Bissonnet at Houston 29°41'16" 95°30'20" 2 1979 1980 4.160 1.110 –.250 3.760 1.430 –.0954
160 84910 4910 HURP Hummingbird St. ditch at Houston 29°39'44" 95°29'11" 6 1979 1984 4.190 1.110 –.250 3.780 1.430 –.0954
161 85400 5400 HURP Sims Bayou at Hiram Clarke St. 29°37'07" 95°26'45" 21 1964 1984 4.230 1.120 –.250 3.820 1.440 –.0954
162 85470 5470 HURP Sims Bayou at MLK Blvd. 29°38'42" 95°20'13" 6 1979 1984 4.280 1.130 –.250 3.890 1.460 –.0954
163 85500 5500 HURP Sims Bayou at Houston 29°40'27" 95°17'21" 15 1975 1989 4.300 1.140 –.250 3.930 1.460 –.0954
164 85550 5550 HURP Berry Bayou at Gilpin St. at Houston 29°38'32" 95°13'22" 6 1979 1984 4.340 1.150 –.250 3.990 1.470 –.0954
165 85650 5650 HURP Berry Bayou at Forest Oaks St. 29°40'35" 95°14'37" 26 1964 1989 4.330 1.150 –.250 3.970 1.460 –.0954
166 85760 5760 HURP Hunting Bayou at Falls St. at Houston 29°48'22" 95°19'50" 6 1979 1984 4.240 1.130 –.250 3.930 1.440 –.0954
167 85770 5770 HURP Hunting Bayou at I–10 29°47'35" 95°16'04" 26 1964 1989 4.290 1.140 –.250 3.990 1.450 –.0954
168 85780 5780 HURP Greens Bayou at Cutten Rd. near Houston 29°56'56" 95°31'10" 13 1977 1989 4.030 1.100 –.250 3.700 1.390 –.0954
169 85900 5900 HURP Greens Bayou at US 75 near Houston 29°57'24" 95°25'04" 25 1965 1989 4.110 1.120 –.250 3.820 1.420 –.0954
170 86000 6000 HURP Greens Bayou near Houston 29°55'05" 95°18'24" 25 1965 1989 4.210 1.140 –.250 4.000 1.440 –.0954
171 86200 6200 HURP Halls Bayou at Deertrail St. at Houston 29°54'07" 95°25'21" 6 1979 1984 4.130 1.120 –.250 3.800 1.420 –.0954
172 86500 6500 HURP Halls Bayou at Houston 29°51'42" 95°20'05" 11 1979 1989 4.210 1.130 –.250 3.950 1.440 –.0954
173 88011 11R HURP Linder Lake 29°49'00" 95°21'15" 3 1964 1966 4.220 1.130 –.250 3.890 1.440 –.0954
174 88014 14R HURP Sayer St. 29°49'54" 95°19'47" 7 1966 1972 4.230 1.130 –.250 3.940 1.440 –.0954
175 88021 21R HURP Brittmore St. 29°51'02" 95°33'46" 21 1964 1984 4.040 1.090 –.250 3.650 1.400 –.0954
Table 3. Stations for three precipitation-monitoring networks near Houston, Texas—Continued
Site
no.
Cur-
rent
study
station
no.
Original
station
no.
Operator Station name Latitude Longitude
Years
of
record
Begin-
ning
year
of
record
Ending
year
of
record
Distribution parameters for determining
recurrence interval of annual precipitation maxima
(Asquith, 1998)
GLO
ξ(in.)
GLO
α(in.)
GLO
κ(--)
GEV
ξ(in.)
GEV
α(in.)
GEV
κ(--)

Tab
le 3 51
176 88025 25R HURP Jones Rd. 29°58'00" 95°34'12" 4 1965 1968 3.970 1.080 –0.250 3.660 1.380 –0.0954
177 88026 26R HURP Louedda St. 29°56'57" 95°33'58" 3 1968 1970 3.990 1.080 –.250 3.660 1.380 –.0954
178 88029 29R HURP Mills Rd. 29°57'29" 95°33'40" 11 1970 1980 3.990 1.090 –.250 3.660 1.380 –.0954
179 88031 31R HURP Stafford 29°36'43" 95°32'58" 21 1964 1984 4.170 1.110 –.250 3.760 1.420 –.0954
180 88039 39R HURP KHTV 29°43'25" 95°30'06" 13 1967 1980 4.150 1.110 –.250 3.740 1.420 –.0954
181 88041 41R HURP Gulf Palms 29°37'54" 95°12'32" 3 1964 1966 4.350 1.150 –.250 4.010 1.470 –.0954
182 88045 45R HURP Minnesota St. 29°37'35" 95°14'30" 5 1968 1972 4.340 1.150 –.250 3.970 1.470 –.0954
183 88101 101R HURP Liberty Rd. 29°47'19" 95°18'50" 2 1979 1980 4.260 1.140 –.250 3.940 1.450 –.0954
184 88203 203R HURP Mintz Ln. 29°59'53" 95°28'39" 5 1979 1983 4.040 1.100 –.250 3.750 1.400 –.0954
185 88204 204R HURP Breen St. 29°53'57" 95°27'28" 6 1979 1984 4.100 1.110 –.250 3.750 1.410 –.0954
186 88205 205R HURP Frontier St. 29°50'08" 95°31'22" 6 1979 1984 4.080 1.100 –.250 3.690 1.410 –.0954
187 88303 303R HURP Four Corners 29°40'07" 95°39'36" 4 1979 1982 4.050 1.080 –.250 3.650 1.400 –.0954
188 88304 304R HURP Chasewood 29°36'32" 95°29'57" 4 1979 1982 4.210 1.110 –.250 3.790 1.430 –.0954
189 88305 305R HURP Furman 29°37'45" 95°22'45" 6 1979 1984 4.270 1.130 –.250 3.860 1.450 –.0954
190 88308 308R HURP Public Health Department, City of Houston 29°42'27" 95°23'30" 6 1979 1984 4.230 1.130 –.250 3.840 1.440 –.0954
191 88401 401R HURP Llano St. 29°39'11" 95°12'07" 4 1979 1982 4.350 1.150 –.250 4.010 1.470 –.0954
192 88402 402R HURP Klondike 29°38'06" 95°15'04" 5 1979 1983 4.330 1.150 –.250 3.960 1.470 –.0954
193 88403 403R HURP Edgebrook 29°38'55" 95°13'23" 6 1979 1984 4.340 1.150 –.250 3.990 1.470 –.0954
Table 3. Stations for three precipitation-monitoring networks near Houston, Texas—Continued
Site
no.
Cur-
rent
study
station
no.
Original
station
no.
Operator Station name Latitude Longitude
Years
of
record
Begin-
ning
year
of
record
Ending
year
of
record
Distribution parameters for determining
recurrence interval of annual precipitation maxima
(Asquith, 1998)
GLO
ξ(in.)
GLO
α(in.)
GLO
κ(--)
GEV
ξ(in.)
GEV
α(in.)
GEV
κ(--)

52 Areal-Reduction Factors for the Precipitation of the 1-Day Design Storm in Texas
Table 5
Table 4
Table 4. Abbreviated example of intra-network sample ratios surrounding any annual precipitation maxima near Dallas, Texas
[Unless otherwise noted, units are dimensionless. Vertical line indicates data available, but not shown. in., inches; mi, miles; w, winter season consisting of annual precipitation maxima October–March; s, summer season consisting of annual precipitation maxima April–September]
Table 5. Abbreviated summary statistics of intra-network sample ratios surrounding any annual precipitation maxima near Dallas, Texas
[Unless otherwise noted, units are dimensionless. Vertical line indicates data available, but not shown. All table entries from Appendix II–1, except for column “Limits for each mile-wide window.” mi, miles]
Centralstation(station
with annualprecipitation
maxima)
Selectedstation
(neighboringstation
with existingconcurrent
precipitation)
Annualprecipitation
maxima(in.)
Depth ofconcurrent
precipitation(in.)
Seasonidentifier
Date ofannual
precipitationmaxima
Estimatedcumulative
annualprobabilityof annual
precipitationmaxima
Calculatedrecurrenceinterval of
annualprecipitation
maxima(years)
Ratio ofannual
precipitationmaxima toconcurrent
precipitation
Separationdistance
(mi)
129 201 2.46 0 w 10/10/1961 0.2202 1.28 0 25.96
129 262 2.46 .47 w 10/10/1961 .2202 1.28 .191 77.64
129 337 2.46 1.59 w 10/10/1961 .2202 1.28 .646 26.30
5646 9522 2.36 .72 s 5/18/1952 .1836 1.22 .305 43.63
5646 9532 2.36 1.29 s 5/18/1952 .1836 1.22 .547 18.48
5646 9538 2.36 .50 s 5/18/1952 .1836 1.22 .212 25.20
47775 47725 4.06 3.15 w 12/20/1997 .6590 2.93 .776 4.92
47775 47725 4.06 3.52 w 12/20/1997 .6590 2.93 .867 3.56
47775 47725 4.06 3.31 w 12/20/1997 .6590 2.93 .815 2.06
Limits
for each
mile-wide
window
(mi)
Mean separation
distance for
each mile-
wide window
(mi)
Mean
sample
ratio,
mean
empirical
Standard
deviation
of sample
ratios
Coefficient
of variation
of sample
ratios
Median
sample
ratio,
median
empirical
No. of
sample
ratios
No. of
zero
sample
ratios
Probability
of zero
sample
ratio
0 0 1 0 0 1 0 0 0
0–1 ————————————————No data, less than 10 sample ratios available for 0 to 1 mi———————————
1–2 1.61 1.0537 .4960 .4707 .9280 182 6 .0319
2–3 2.55 .9179 .3251 .3542 .9010 368 7 .0187
18–19 19.53 .6660 .4424 .6643 .6200 427 20 .0447
19–20 20.56 .5617 .4421 .7870 .5120 684 87 .1128
20–21 21.67 .5375 .4208 .7828 .5000 599 72 .1073
47–48 47.53 .4501 .4093 .9093 .3450 1,516 190 .1114
48–49 48.41 .4808 .4218 .8774 .3720 576 81 .1233
49–50 49.52 .4191 .3990 .9518 .3220 1,039 148 .1247
ST r( ) ST r( )

Table 6 53
Table 6
Table 6. Summary of observed cumulative annual probabilities for each precipitation-monitoring network
[NWS, National Weather Service; AUS, City of Austin; DAL, City of Dallas; HAR, Harris County Office of Emergency Management; HURP, U.S. Geological Survey Houston Urban Program]
Location of
data base/network
Recurrence
interval
(years)
Defined
cumulative
annual
probability
Observed
cumulative
annual
probability
No. of
nonexceedance
storms
No. of
storms
Defined cumulative
annual probability
minus observed
cumulative annual
probability
Austin/NWS 1.111 0.10 0.120 68 –0.020
1.25 .20 .252 143 –.052
2 .50 .591 335 567 –.091
5 .80 .857 486 –.057
10 .90 .938 532 –.038
Austin/AUS 1.111 .10 .161 28 –.061
1.25 .20 .333 58 –.133
2 .50 .753 131 174 –.253
5 .80 .954 166 –.154
10 .90 .989 172 –.089
Dallas/NWS 1.111 .10 .134 224 –.034
1.25 .20 .271 451 –.071
2 .50 .601 1,000 1,664 –.101
5 .80 .855 1,423 –.055
10 .90 .931 1,549 –.031
Dallas/DAL 1.111 .10 .0977 13 .002
1.25 .20 .203 27 –.003
2 .50 .722 96 133 –.222
5 .80 .977 130 –.177
10 .90 1.000 133 –.100
Houston/NWS 1.111 .10 .147 294 –.047
1.25 .20 .276 554 –.076
2 .50 .604 1,211 2,004 –.104
5 .80 .833 1,669 –.033
10 .90 .910 1,824 –.010
Houston/HAR 1.111 .10 .245 141 –.145
1.25 .20 .440 253 –.240
2 .50 .741 426 575 –.241
5 .80 .899 517 –.099
10 .90 .944 543 –.044
Houston/HURP 1.111 .10 .0663 13 .034
1.25 .20 .270 53 –.070
2 .50 .663 130 196 –.163
5 .80 .847 166 –.047
10 .90 .949 186 –.049

54 Areal-Reduction Factors for the Precipitation of the 1-Day Design Storm in Texas
Table 7. Equations that define the estimated 2-year or greater depth-distance relation and the areal-reduction factor for circular watersheds for Austin, Dallas, and Houston, Texas
CityEstimated 2-year or greater depth-
distance relation (figs. 14–16)for distance (r), in miles
Areal-reduction factor for circularwatersheds having radius (r),
in milesEquation limits
Austin S2(r) = 1.0000 – 0.1400(r) ARF2(r) = 1.0000 – 0.0933(r) 0 < r < 1
S2(r) = 0.9490 – 0.0890(r) ARF2(r) = 0.9490 – 0.0593(r) + (0.0170 / r2) 1 < r < 2
S2(r) = 0.8410 – 0.0350(r) ARF2(r) = 0.8410 – 0.0233(r) + (0.1610 / r2) 2 < r < 3
S2(r) = 0.8080 – 0.0240(r) ARF2(r) = 0.8080 – 0.0160(r) + (0.2600 / r2) 3 < r < 4.5
S2(r) = 0.7750 – 0.0167(r) ARF2(r) = 0.7750 – 0.0111(r) + (0.4828 / r2) 4.5 < r < 9
S2(r) = 0.7420 – 0.0130(r) ARF2(r) = 0.7420 – 0.0087(r) + (1.3737 / r2) 9 < r < 13
S2(r) = 0.7203 – 0.0113(r) ARF2(r) = 0.7203 – 0.0076(r)+ (2.5943 / r2) 13 < r < 19
S2(r) = 0.6950 – 0.0100(r) ARF2(r) = 0.6950 – 0.0067(r) + (5.6427 / r2) 19 < r < 28
S2(r) = 0.6502 – 0.0084(r) ARF2(r) = 0.6502 – 0.0056(r) + (17.3505 / r2) 28 < r < 33
S2(r) = 0.6040 – 0.0070(r) ARF2(r) = 0.6040 – 0.0047(r) + (34.1211 / r2) 33 < r < 41
Austin S2(r) = 0.3717 – 0.0013(r) ARF2(r) = 0.3717 – 0.0009(r) + (164.3052 / r2) 41 < r < 50
Dallas S2(r) = 1.0000 – 0.0600(r) ARF2(r) = 1.0000 – 0.0400(r) 0 < r < 2
S2(r) = 0.9670 – 0.0435(r) ARF2(r) = 0.9670 – 0.0290(r) + (0.0440 / r2) 2 < r < 4
S2(r) = 0.8910 – 0.0245(r) ARF2(r) = 0.8910 – 0.0163(r) + (0.4493 / r2) 4 < r < 6
S2(r) = 0.8760 – 0.0220(r) ARF2(r) = 0.8760 – 0.0147(r) + (0.6293 / r2) 6 < r < 8
S2(r) = 0.8460 – 0.0183(r) ARF2(r) = 0.8460 – 0.0122(r) + (1.2693 / r2) 8 < r < 12
S2(r) = 0.8130 – 0.0155(r) ARF2(r) = 0.8130 – 0.0103(r) + (2.8533 / r2) 12 < r < 16
S2(r) = 0.7650 – 0.0125(r) ARF2(r) = 0.7650 – 0.0083(r) + (6.9493 / r2) 16 < r < 18
S2(r) = 0.7200 – 0.0100(r) ARF2(r) = 0.7200 – 0.0067(r) + (11.8093 / r2) 18 < r < 24
S2(r) = 0.6880 – 0.0087(r) ARF2(r) = 0.6800 – 0.0058(r) + (17.9533 / r2) 24 < r < 27
S2(r) = 0.6228 – 0.0063(r) ARF2(r) = 0.6228 – 0.0042(r) + (33.8091 / r2) 27 < r < 31
Dallas S2(r) = 0.5563 – 0.0041(r) ARF2(r) = 0.5563 – 0.0027(r) + (55.1070 / r2) 31 < r < 50
Houston S2(r) = 1.0000 – 0.1200(r) ARF2(r) = 1.0000 – 0.0800(r) 0 < r < 1
S2(r) = 0.9400 – 0.0600(r) ARF2(r) = 0.9400 – 0.0400(r) + (0.0200 / r2) 1 < r < 2
S2(r) = 0.8800 – 0.0300(r) ARF2(r) = 0.8800 – 0.0200(r) + (0.1000 / r2) 2 < r < 4
S2(r) = 0.8667 – 0.0267(r) ARF2(r) = 0.8667 – 0.0178(r) + (0.1711 / r2) 4 < r < 7
S2(r) = 0.8078 – 0.0183(r) ARF2(r) = 0.8078 – 0.0122(r) + (1.1334 / r2) 7 < r < 11
S2(r) = 0.7363 – 0.0118(r) ARF2(r) = 0.7363 – 0.0078(r) + (4.0173 / r2) 11 < r < 15
S2(r) = 0.6800 – 0.0080(r) ARF2(r) = 0.6800 – 0.0053(r) + (8.2360 / r2) 15 < r < 20
Houston S2(r) = 0.6187 – 0.0049(r) ARF2(r) = 0.6187 – 0.0033(r) + (16.4138 / r2) 20 < r < 50

Table 8 55
Table 8Table 8. Example areal-reduction factor calculation for a hypothetical, linear watershed in the Austin area
[mi, miles; mi2, square miles; --, dimensionless; (5), column number]
Cellno.
Watershedmap
(each cellrepresents
1 mi2)
Distance (r)from
centroid,cell 7(mi)
Applicableequation fromtable 7, with
distancesubstituted for
distance (r)(--)
(5)Estimated
2-yearor greater
depth-distancerelation
(--)
(6)Cell area
(mi2)
Areal-reduction
factorfor cell(5) * (6)
1 6 0.775 – 0.0167(6) = 0.675 1 0.675
2 5 0.775 – 0.0167(5) = 0.692 1 0.692
3 4 0.808 – 0.024(4) = 0.712 1 0.712
4 3 0.841 – 0.035(3) = 0.736 1 0.736
5 2 0.949 – 0.089(2) = 0.771 1 0.771
6 1 1.0 – 0.14(1) = 0.860 1 0.860
7 0 1.0 – 0.14(0) = 1.00 1 1.00
8 1 1.0 – 0.14(1) = 0.860 1 0.860
9 2 0.949 – 0.089(2) = 0.771 1 0.771
10 3 0.841 – 0.035(3) = 0.736 1 0.736
11 4 0.808 – 0.024(4) = 0.712 1 0.712
12 5 0.775 – 0.0167(5) = 0.692 1 0.692
13 6 0.775 – 0.0167(6) = 0.675 1 0.675
Column total 13 9.892
Areal-reduction factor 0.76
For comparison, an areal-reduction factor for a circular watershed having the same drainage area as this example can be calculated. The radius of a 13-mi2 circular watershed is 2.03 mi. The areal-reduction factor is calculated from equation in table 7.
The areal-reduction factor for a 13-mi2 circular watershed 0.83
Centroid9.892 / 13

Appendix I 57
Appendix I APPENDIX I—Summary Statistics of Intra-Network
Sample Ratios for Austin, Texas

58 Areal-Reduction Factors for the Precipitation of the 1-Day Design Storm in Texas
Appendix I–1. Summary statistics of intra-network sample ratios surrounding any annual precipitation maxima near Austin, Texas—Continued
Mean separation
distance for
each mile-
wide window
(mi)
Mean
sample
ratio, mean
empirical
Standard
deviation
of sample
ratios
Coefficient
of variation
of sample
ratios
Median
sample
ratio, median
empirical
No. of
sample
ratios
No. of
zero
sample
ratios
Probability
of zero
sample
ratio
0 1 0 0 1 0 0 0
.83 .9018 .2326 .2579 .9580 74 4 .0513
1.50 .8288 .3776 .4556 .8930 399 36 .0828
2.50 .8364 .3577 .4277 .8790 675 52 .0715
3.48 .8292 .3494 .4214 .8630 837 37 .0423
4.50 .7884 .3534 .4482 .8290 1011 46 .0435
5.47 .7929 .3694 .4659 .8100 932 48 .0490
6.52 .7760 .3845 .4955 .7970 1012 42 .0398
7.50 .7593 .3700 .4873 .7820 974 45 .0442
8.50 .7329 .3786 .5165 .7510 934 49 .0498
9.50 .6990 .4130 .5908 .6990 951 66 .0649
10.50 .7077 .4027 .5691 .6930 884 41 .0443
11.51 .7015 .4174 .5950 .7000 789 56 .0663
12.54 .6603 .4157 .6296 .6480 743 46 .0583
13.53 .6631 .4303 .6489 .6310 663 50 .0701
14.44 .6229 .4141 .6647 .5990 465 30 .0606
15.41 .6417 .4273 .6659 .6360 476 23 .0461
16.46 .6045 .4311 .7131 .5790 498 27 .0514
17.46 .5918 .3891 .6575 .5680 310 27 .0801
18.45 .5006 .4383 .8756 .4260 278 44 .1366
19.54 .5330 .4209 .7897 .4780 285 24 .0777
20.39 .5807 .4310 .7422 .5680 195 19 .0888
21.39 .6412 .4408 .6875 .6040 112 7 .0588
22.40 .5030 .4510 .8967 .4290 272 43 .1365
23.27 .4207 .3906 .9285 .3310 141 22 .1350
ST r( ) ST r( )
Appendix I–1. Summary statistics of intra-network sample ratios surrounding any annual precipitation maxima near Austin, Texas
[Unless otherwise noted, units are dimensionless. Total number of samples for separation distances up to 50 miles equals 17,242. mi, miles]

Appendix I 59
24.64 0.4668 0.4242 0.9087 0.3880 231 31 0.1183
25.48 .5424 .4169 .7687 .4580 77 8 .0941
26.57 .4510 .4281 .9492 .3040 171 27 .1364
27.32 .4592 .4089 .8904 .4120 181 25 .1214
28.61 .4716 .4535 .9616 .3720 178 25 .1232
29.41 .4226 .4162 .9850 .2900 144 27 .1579
30.50 .3127 .3191 1.0205 .2220 152 34 .1828
31.52 .5242 .4287 .8178 .4310 151 14 .0848
32.44 .3368 .3651 1.0842 .2030 144 31 .1771
33.37 .4391 .4026 .9169 .3720 90 15 .1429
34.76 .4793 .4448 .9280 .3530 87 10 .1031
35.53 .4803 .3892 .8105 .4480 138 12 .0800
36.64 .4244 .4132 .9737 .3310 158 22 .1222
37.81 .3953 .3833 .9696 .2690 238 38 .1377
38.46 .2960 .3193 1.0788 .1350 122 24 .1644
39.44 .2587 .3228 1.2478 .0910 46 16 .2581
40.51 .5615 .5074 .9037 .4090 100 11 .0991
41.47 .5381 .4611 .8569 .4240 71 5 .0658
42.16 .2428 .2747 1.1312 .1150 74 19 .2043
43.60 .3415 .3706 1.0852 .1720 125 22 .1497
45.22 .4526 .4248 .9386 .3540 107 15 .1230
46.71 .3695 .3493 .9455 .2510 49 4 .0755
47.48 .4465 .4168 .9335 .3310 254 33 .1150
48.08 .4125 .3939 .9550 .3020 133 17 .1133
49.87 .3634 .3595 .9891 .2290 111 12 .0976
Appendix I–1. Summary statistics of intra-network sample ratios surrounding any annual precipitation maxima near Austin, Texas—Continued
Mean separation
distance for
each mile-
wide window
(mi)
Mean
sample
ratio, mean
empirical
Standard
deviation
of sample
ratios
Coefficient
of variation
of sample
ratios
Median
sample
ratio, median
empirical
No. of
sample
ratios
No. of
zero
sample
ratios
Probability
of zero
sample
ratioST r( ) ST r( )

60 Areal-Reduction Factors for the Precipitation of the 1-Day Design Storm in Texas
Appendix I–2. Summary statistics of intra-network sample ratios surrounding the 2-year or greater annual precipitation maxima near Austin, Texas—Continued
Mean separation
distance for
each mile-
wide window
(mi)
Mean
sample
ratio, mean
empirical
Standard
deviation
of sample
ratios
Coefficient
of variation
of sample
ratios
Median
sample
ratio, median
empirical
No. of
sample
ratios
No. of
zero
sample
ratios
Probability
of zero
sample
ratio
0 1 0 0 1 0 0 0
.84 .8714 .1786 .2050 .9020 17 1 .0556
1.48 .7549 .3513 .4653 .8590 103 17 .1417
2.50 .7288 .3374 .4629 .8110 186 22 .1058
3.50 .7441 .3312 .4450 .8090 232 21 .0830
4.53 .6732 .3282 .4875 .7440 269 19 .0660
5.46 .7144 .2888 .4042 .7490 245 11 .0430
6.49 .6669 .3326 .4987 .6660 251 16 .0599
7.51 .6361 .3375 .5306 .6420 253 22 .0800
8.51 .6356 .3485 .5483 .6480 242 21 .0798
9.48 .5896 .3636 .6167 .5880 250 21 .0775
10.49 .6394 .3708 .5798 .6150 231 11 .0455
11.51 .5789 .3721 .6428 .5480 215 25 .1042
12.57 .5129 .3538 .6897 .5270 203 19 .0856
13.51 .5896 .3839 .6511 .5600 190 14 .0686
14.46 .5099 .3454 .6773 .5340 118 8 .0635
15.39 .5259 .3824 .7271 .5000 147 8 .0516
16.48 .5410 .3691 .6823 .5290 150 9 .0566
17.47 .5919 .3763 .6358 .5800 95 8 .0777
18.49 .4582 .4073 .8889 .4100 79 10 .1124
19.57 .5585 .4362 .7810 .5300 91 10 .0990
20.34 .5786 .4321 .7468 .5230 60 6 .0909
21.35 .6036 .4264 .7064 .5560 39 2 .0488
22.37 .4446 .3915 .8805 .3640 112 14 .1111
23.24 .4022 .3873 .9629 .3400 62 12 .1622
ST r( ) ST r( )
Appendix I–2. Summary statistics of intra-network sample ratios surrounding the 2-year or greater annual precipitation maxima near Austin, Texas
[Unless otherwise noted, units are dimensionless. Total number of samples for separation distances up to 50 miles equals 5,226. mi, miles]
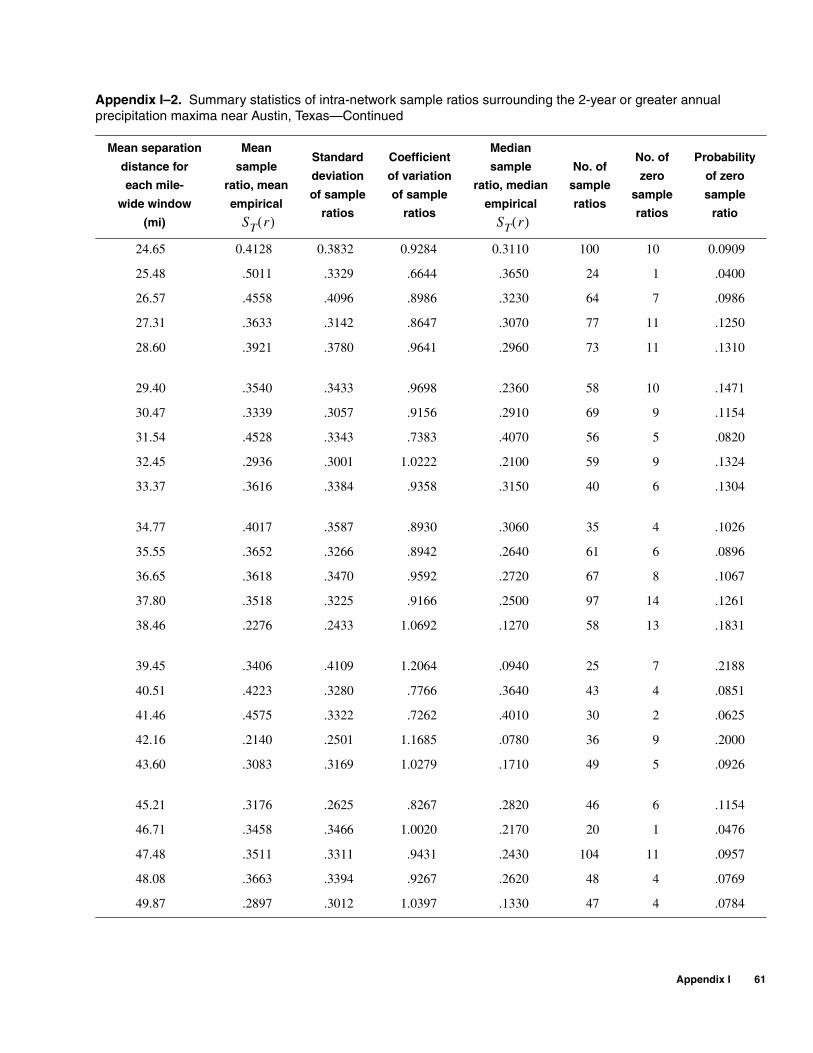
Appendix I 61
24.65 0.4128 0.3832 0.9284 0.3110 100 10 0.0909
25.48 .5011 .3329 .6644 .3650 24 1 .0400
26.57 .4558 .4096 .8986 .3230 64 7 .0986
27.31 .3633 .3142 .8647 .3070 77 11 .1250
28.60 .3921 .3780 .9641 .2960 73 11 .1310
29.40 .3540 .3433 .9698 .2360 58 10 .1471
30.47 .3339 .3057 .9156 .2910 69 9 .1154
31.54 .4528 .3343 .7383 .4070 56 5 .0820
32.45 .2936 .3001 1.0222 .2100 59 9 .1324
33.37 .3616 .3384 .9358 .3150 40 6 .1304
34.77 .4017 .3587 .8930 .3060 35 4 .1026
35.55 .3652 .3266 .8942 .2640 61 6 .0896
36.65 .3618 .3470 .9592 .2720 67 8 .1067
37.80 .3518 .3225 .9166 .2500 97 14 .1261
38.46 .2276 .2433 1.0692 .1270 58 13 .1831
39.45 .3406 .4109 1.2064 .0940 25 7 .2188
40.51 .4223 .3280 .7766 .3640 43 4 .0851
41.46 .4575 .3322 .7262 .4010 30 2 .0625
42.16 .2140 .2501 1.1685 .0780 36 9 .2000
43.60 .3083 .3169 1.0279 .1710 49 5 .0926
45.21 .3176 .2625 .8267 .2820 46 6 .1154
46.71 .3458 .3466 1.0020 .2170 20 1 .0476
47.48 .3511 .3311 .9431 .2430 104 11 .0957
48.08 .3663 .3394 .9267 .2620 48 4 .0769
49.87 .2897 .3012 1.0397 .1330 47 4 .0784
Appendix I–2. Summary statistics of intra-network sample ratios surrounding the 2-year or greater annual precipitation maxima near Austin, Texas—Continued
Mean separation
distance for
each mile-
wide window
(mi)
Mean
sample
ratio, mean
empirical
Standard
deviation
of sample
ratios
Coefficient
of variation
of sample
ratios
Median
sample
ratio, median
empirical
No. of
sample
ratios
No. of
zero
sample
ratios
Probability
of zero
sample
ratioST r( ) ST r( )

62 Areal-Reduction Factors for the Precipitation of the 1-Day Design Storm in Texas
Appendix I–3. Summary statistics of intra-network sample ratios surrounding the 5-year or greater annual precipitation maxima near Austin, Texas—Continued
Mean separation
distance for
each mile-
wide window
(mi)
Mean
sample
ratio, mean
empirical
Standard
deviation
of sample
ratios
Coefficient
of variation
of sample
ratios
Median
sample
ratio, median
empirical
No. of
sample
ratios
No. of
zero
sample
ratios
Probability
of zero
sample
ratio
0 1 0 0 1 0 0 0
0–1 -- -- -- -- -- -- --
1.53 .5271 .4524 .8583 .7090 20 8 .2857
2.51 .6616 .3278 .4955 .7980 40 8 .1667
3.43 .5398 .3723 .6897 .6000 41 10 .1961
4.55 .5323 .3690 .6932 .5700 61 12 .1644
5.46 .6118 .3039 .4966 .7440 50 7 .1228
6.51 .5735 .3865 .6739 .7350 42 7 .1429
7.45 .4787 .3720 .7772 .6300 48 14 .2258
8.50 .4236 .3687 .8705 .5650 48 14 .2258
9.46 .4514 .3692 .8180 .5490 48 13 .2131
10.49 .5727 .3136 .5476 .6280 50 5 .0909
11.50 .4538 .3648 .8038 .4980 43 10 .1887
12.54 .4339 .3384 .7798 .5040 43 5 .1042
13.52 .5502 .3846 .6991 .5280 45 2 .0426
14.43 .3996 .2845 .7121 .4600 19 2 .0952
15.34 .5486 .4144 .7554 .5050 27 2 .0690
16.45 .4682 .3178 .6787 .4890 31 2 .0606
17.47 .5296 .3386 .6393 .4580 25 1 .0385
18.52 .3142 .3013 .9591 .1640 24 3 .1111
19.60 .4042 .3956 .9788 .2160 31 6 .1622
20.25 .6229 .3095 .4969 .6150 14 0 .0000
21.31 .6562 .4284 .6528 .6040 12 1 .0769
22.38 .3886 .3569 .9183 .2450 35 6 .1463
23.28 .2707 .2141 .7910 .2770 19 1 .0500
ST r( ) ST r( )
Appendix I–3. Summary statistics of intra-network sample ratios surrounding the 5-year or greater annual precipitation maxima near Austin, Texas
[Unless otherwise noted, units are dimensionless. Total number of samples for separation distances up to 50 miles equals 1,293. mi, miles; --, no data available]

Appendix I 63
24.47 0.4666 0.4472 0.9584 0.3110 36 3 0.0769
26.61 .3289 .2666 .8107 .2640 22 1 .0435
27.38 .3673 .3212 .8743 .2720 26 2 .0714
28.57 .3974 .2300 .5787 .4100 23 1 .0417
29.40 .3597 .3005 .8353 .2850 26 3 .1034
30.38 .3660 .3595 .9823 .2670 22 3 .1200
31.57 .3942 .3051 .7740 .3570 18 1 .0526
32.41 .2162 .1926 .8909 .2100 22 4 .1538
33.37 .3787 .3167 .8363 .3150 15 0 .0000
35.52 .2951 .2838 .9619 .2130 28 4 .1250
36.65 .3601 .2920 .8108 .2720 27 1 .0357
37.78 .3613 .3522 .9749 .2500 36 5 .1220
38.42 .2060 .2235 1.0845 .1070 25 4 .1379
40.48 .4020 .3198 .7955 .3640 21 3 .1250
41.48 .6205 .4023 .6483 .5500 11 1 .0833
42.14 .1210 .1508 1.2464 .0410 13 5 .2778
43.62 .2628 .2667 1.0150 .0970 15 0 .0000
45.23 .3764 .2762 .7338 .4180 13 1 .0714
46.71 .3865 .3951 1.0221 .1480 11 1 .0833
47.51 .3065 .3170 1.0343 .2190 38 5 .1163
48.07 .4418 .3479 .7875 .3020 13 0 .0000
49.87 .2598 .2697 1.0383 .1170 16 1 .0588
Appendix I–3. Summary statistics of intra-network sample ratios surrounding the 5-year or greater annual precipitation maxima near Austin, Texas—Continued
Mean separation
distance for
each mile-
wide window
(mi)
Mean
sample
ratio, mean
empirical
Standard
deviation
of sample
ratios
Coefficient
of variation
of sample
ratios
Median
sample
ratio, median
empirical
No. of
sample
ratios
No. of
zero
sample
ratios
Probability
of zero
sample
ratioST r( ) ST r( )

Appendix II 65
Appendix II APPENDIX II—Summary Statistics of Intra-Network
Sample Ratios for Dallas, Texas

66 Areal-Reduction Factors for the Precipitation of the 1-Day Design Storm in Texas
Appendix II–1. Summary statistics of intra-network sample ratios surrounding any annual precipitation maxima near Dallas, Texas—Continued
Mean separation
distance for
each mile-
wide window
(mi)
Mean
sample
ratio, mean
empirical
Standard
deviation
of sample
ratios
Coefficient
of variation
of sample
ratios
Median
sample
ratio, median
empirical
No. of
sample
ratios
No. of
zero
sample
ratios
Probability
of zero
sample
ratio
0 1 0 0 1 0 0 0
0–1 -- -- -- -- -- -- --
1.61 1.0537 .4960 .4707 .9280 182 6 .0319
2.55 .9179 .3251 .3542 .9010 368 7 .0187
3.56 .8307 .3119 .3754 .8300 499 9 .0177
4.52 .7956 .3515 .4419 .7890 593 25 .0405
5.49 .8368 .3325 .3973 .8130 555 5 .0089
6.49 .7866 .3700 .4703 .7750 800 25 .0303
7.47 .7891 .3596 .4558 .7660 783 18 .0225
8.58 .7493 .3851 .5140 .7350 780 21 .0262
9.53 .6709 .4165 .6208 .6460 873 54 .0583
10.58 .7052 .4048 .5740 .6970 705 31 .0421
11.44 .7091 .4052 .5714 .6810 817 33 .0388
12.43 .6963 .4141 .5948 .6950 975 55 .0534
13.60 .6795 .4318 .6356 .6770 1,000 56 .0530
14.48 .6111 .4341 .7103 .5820 1,076 100 .0850
15.53 .6133 .4335 .7069 .5630 643 53 .0761
16.48 .5928 .4343 .7327 .5470 835 72 .0794
17.65 .5833 .4227 .7245 .5650 655 56 .0788
18.53 .5596 .4351 .7775 .5000 816 95 .1043
19.53 .6660 .4424 .6643 .6200 427 20 .0447
20.56 .5617 .4421 .7870 .5120 684 87 .1128
21.67 .5375 .4208 .7828 .5000 599 72 .1073
22.55 .5471 .4220 .7713 .4790 955 80 .0773
23.46 .5399 .4318 .7996 .4780 886 92 .0941
ST r( ) ST r( )
Appendix II–1. Summary statistics of intra-network sample ratios surrounding any annual precipitation maxima near Dallas, Texas
[Unless otherwise noted, units are dimensionless. Total number of samples for separation distances up to 50 miles equals 41,786. mi, miles; --, no data available]

Appendix II 67
24.39 0.5014 0.4336 0.8649 0.4210 823 114 0.1217
25.50 .5621 .4580 .8147 .4940 958 110 .1030
26.53 .5197 .4153 .7990 .4650 1,144 122 .0964
27.54 .5114 .4132 .8079 .4520 610 59 .0882
28.56 .5085 .4182 .8224 .4460 1,050 118 .1010
29.40 .5198 .4488 .8634 .4240 475 55 .1038
30.47 .4934 .4312 .8739 .3980 1,131 147 .1150
31.46 .5041 .4471 .8870 .4020 793 99 .1110
32.62 .4723 .4261 .9023 .3820 1,106 155 .1229
33.58 .4596 .4042 .8794 .3770 926 122 .1164
34.51 .4722 .4152 .8792 .3820 911 118 .1147
35.41 .4838 .4144 .8566 .3950 980 122 .1107
36.56 .4794 .4156 .8668 .3990 1,046 119 .1021
37.53 .4498 .4151 .9229 .3540 1,545 223 .1261
38.54 .4912 .4098 .8343 .4120 933 89 .0871
39.53 .4352 .4185 .9617 .3250 945 153 .1393
40.57 .4946 .4243 .8579 .4150 1,202 137 .1023
41.41 .4449 .4122 .9265 .3430 589 87 .1287
42.40 .4136 .3965 .9587 .2980 758 122 .1386
43.50 .4403 .3952 .8976 .3610 1,047 157 .1304
44.51 .4238 .4050 .9555 .3110 1,363 193 .1240
45.56 .3714 .3668 .9878 .2570 603 111 .1555
46.38 .4150 .3876 .9340 .3270 1,211 200 .1417
47.53 .4501 .4093 .9093 .3450 1,516 190 .1114
48.41 .4808 .4218 .8774 .3720 576 81 .1233
49.52 .4191 .3990 .9518 .3220 1,039 148 .1247
Appendix II–1. Summary statistics of intra-network sample ratios surrounding any annual precipitation maxima near Dallas, Texas—Continued
Mean separation
distance for
each mile-
wide window
(mi)
Mean
sample
ratio, mean
empirical
Standard
deviation
of sample
ratios
Coefficient
of variation
of sample
ratios
Median
sample
ratio, median
empirical
No. of
sample
ratios
No. of
zero
sample
ratios
Probability
of zero
sample
ratioST r( ) ST r( )

68 Areal-Reduction Factors for the Precipitation of the 1-Day Design Storm in Texas
Appendix II–2. Summary statistics of intra-network sample ratios surrounding the 2-year or greater annual precipitation maxima near Dallas, Texas—Continued
Mean separation
distance for
each mile-
wide window
(mi)
Mean
sample
ratio, mean
empirical
Standard
deviation
of sample
ratios
Coefficient
of variation
of sample
ratios
Median
sample
ratio, median
empirical
No. of
sample
ratios
No. of
zero
sample
ratios
Probability
of zero
sample
ratio
0 1 0 0 1 0 0 0
0–1 -- -- -- -- -- -- --
1.60 .9155 .1967 .2148 .9260 53 1 .0185
2.59 .8599 .2642 .3073 .8720 111 1 .0089
3.55 .7821 .2676 .3421 .8180 165 3 .0179
4.55 .7575 .2984 .3940 .7700 195 6 .0299
5.51 .7688 .2782 .3618 .7770 159 2 .0124
6.48 .7135 .3233 .4532 .6930 261 8 .0297
7.48 .7340 .3054 .4161 .7320 259 6 .0226
8.58 .6733 .3441 .5111 .6630 253 7 .0269
9.54 .6068 .3660 .6032 .5740 310 16 .0491
10.60 .6672 .3653 .5475 .6740 205 7 .0330
11.47 .6265 .3640 .5811 .5940 286 14 .0467
12.43 .6486 .4010 .6183 .6420 343 14 .0392
13.61 .6186 .4007 .6477 .5810 373 18 .0460
14.50 .5815 .3871 .6657 .5530 402 21 .0496
15.53 .5501 .3830 .6962 .5260 247 14 .0536
16.47 .5574 .3772 .6768 .4980 310 15 .0462
17.64 .5314 .3888 .7316 .4840 235 18 .0711
18.50 .4945 .3805 .7696 .4290 281 27 .0877
19.55 .5784 .3946 .6823 .5220 162 8 .0471
20.59 .5018 .3567 .7109 .4910 266 23 .0796
21.67 .4752 .3606 .7589 .4000 218 19 .0802
22.56 .4852 .3807 .7846 .4120 369 30 .0752
23.48 .4772 .3813 .7990 .4110 332 24 .0674
ST r( ) ST r( )
Appendix II–2. Summary statistics of intra-network sample ratios surrounding the 2-year or greater annual precipitation maxima near Dallas, Texas
[Unless otherwise noted, units are dimensionless. Total number of samples for separation distances up to 50 miles equals 15,775. mi, miles; --, no data available]

Appendix II 69
24.36 0.4844 0.3968 0.8191 0.4130 316 30 0.0867
25.50 .5130 .3987 .7771 .4480 399 36 .0828
26.54 .4703 .3815 .8112 .4040 469 42 .0822
27.55 .4508 .3591 .7965 .3860 236 15 .0598
28.57 .4142 .3484 .8411 .3500 404 37 .0839
29.39 .4191 .3420 .8160 .3620 186 14 .0700
30.47 .4182 .3662 .8757 .3340 456 50 .0988
31.45 .4299 .3747 .8717 .3450 305 23 .0701
32.63 .4143 .3712 .8960 .3220 421 49 .1043
33.60 .4220 .3627 .8593 .3170 362 38 .0950
34.52 .4269 .3548 .8311 .3520 384 41 .0965
35.42 .4352 .3561 .8181 .3640 377 30 .0737
36.56 .4244 .3569 .8409 .3410 393 26 .0621
37.54 .4063 .3708 .9126 .3110 630 75 .1064
38.55 .4175 .3462 .8293 .3430 370 30 .0750
39.51 .3727 .3381 .9071 .2960 342 41 .1070
40.56 .4353 .3804 .8739 .3510 476 45 .0864
41.40 .3669 .3323 .9057 .2640 232 29 .1111
42.41 .3630 .3229 .8893 .2800 310 36 .1040
43.53 .3762 .3248 .8635 .3070 399 50 .1114
44.50 .3582 .3354 .9364 .2620 551 64 .1041
45.56 .3059 .2904 .9494 .2010 234 32 .1203
46.37 .3658 .3385 .9256 .2800 480 63 .1160
47.53 .3818 .3280 .8591 .2980 616 55 .0820
48.43 .4008 .3498 .8728 .3220 237 33 .1222
49.55 .3275 .2949 .9006 .2500 395 49 .1104
Appendix II–2. Summary statistics of intra-network sample ratios surrounding the 2-year or greater annual precipitation maxima near Dallas, Texas—Continued
Mean separation
distance for
each mile-
wide window
(mi)
Mean
sample
ratio, mean
empirical
Standard
deviation
of sample
ratios
Coefficient
of variation
of sample
ratios
Median
sample
ratio, median
empirical
No. of
sample
ratios
No. of
zero
sample
ratios
Probability
of zero
sample
ratioST r( ) ST r( )

70 Areal-Reduction Factors for the Precipitation of the 1-Day Design Storm in Texas
Appendix II–3. Summary statistics of intra-network sample ratios surrounding the 5-year or greater annual precipitation maxima near Dallas, Texas—Continued
Mean separation
distance for
each mile-
wide window
(mi)
Mean
sample
ratio, mean
empirical
Standard
deviation
of sample
ratios
Coefficient
of variation
of sample
ratios
Median
sample
ratio, median
empirical
No. of
sample
ratios
No. of
zero
sample
ratios
Probability
of zero
sample
ratio
0 1 0 0 1 0 0 0
0–1 -- -- -- -- -- -- --
1–2 -- -- -- -- -- -- --
2.76 .7003 .2935 .4191 .6430 14 0 .0000
3.85 .6089 .3929 .6452 .6520 13 1 .0714
4.56 .6697 .2642 .3946 .6650 27 0 .0000
5.54 .7054 .2860 .4055 .6930 14 0 .0000
6.48 .5765 .2783 .4828 .5310 50 2 .0385
7.50 .6812 .3218 .4724 .6000 45 0 .0000
8.64 .5840 .3595 .6156 .5000 47 0 .0000
9.52 .5331 .3544 .6649 .4440 82 5 .0575
10.63 .6344 .3227 .5086 .5450 54 1 .0182
11.50 .5573 .3386 .6076 .4760 69 2 .0282
12.44 .6577 .3903 .5935 .6670 100 2 .0196
13.62 .5280 .3272 .6197 .5160 114 4 .0339
14.47 .5901 .3667 .6213 .5370 115 4 .0336
15.56 .5012 .3725 .7434 .4830 92 5 .0515
16.44 .5100 .3560 .6980 .4470 102 4 .0377
17.66 .5653 .3970 .7022 .5930 85 7 .0761
18.54 .4733 .3640 .7691 .3950 99 7 .0660
19.55 .4652 .2566 .5515 .4370 58 0 .0000
20.58 .4844 .3651 .7537 .3760 79 6 .0706
21.67 .4301 .3065 .7126 .3930 79 8 .0920
22.58 .4485 .3321 .7405 .3780 144 9 .0588
23.51 .4367 .3576 .8188 .3780 114 6 .0500
ST r( ) ST r( )
Appendix II–3. Summary statistics of intra-network sample ratios surrounding the 5-year or greater annual precipitation maxima near Dallas, Texas
[Unless otherwise noted, units are dimensionless. Total number of samples for separation distances up to 50 miles equals 5,146. mi, miles; --, no data available]

Appendix II 71
24.38 0.4895 0.3546 0.7244 0.4200 96 2 0.0204
25.47 .4497 .3332 .7408 .3920 133 9 .0634
26.53 .4728 .3484 .7368 .4370 156 9 .0545
27.57 .3900 .2993 .7674 .3250 87 4 .0440
28.55 .3750 .3205 .8546 .2680 139 9 .0608
29.38 .3738 .3380 .9043 .2650 67 6 .0822
30.48 .3768 .3294 .8742 .2970 155 11 .0663
31.45 .4305 .3602 .8368 .3410 113 7 .0583
32.62 .3889 .3372 .8671 .3070 141 12 .0784
33.62 .3789 .2705 .7139 .3020 112 6 .0508
34.50 .3953 .3122 .7896 .3360 133 8 .0567
35.43 .3836 .3121 .8136 .3090 150 9 .0566
36.59 .3983 .3349 .8409 .2930 159 7 .0422
37.54 .3699 .3130 .8462 .3030 220 15 .0638
38.55 .3810 .3107 .8154 .3070 141 6 .0408
39.52 .2785 .2456 .8819 .2010 131 11 .0775
40.60 .3736 .3080 .8244 .3210 181 10 .0524
41.42 .3085 .2565 .8313 .2480 79 9 .1023
42.43 .3153 .2589 .8210 .2540 102 10 .0893
43.53 .3503 .3008 .8585 .2890 139 12 .0795
44.55 .2941 .2478 .8425 .2550 207 15 .0676
45.57 .2849 .2480 .8705 .1910 81 7 .0795
46.39 .3315 .3091 .9326 .2000 164 16 .0889
47.54 .3559 .2859 .8032 .2760 229 10 .0418
48.47 .4096 .3342 .8159 .3350 92 8 .0800
49.53 .2718 .2339 .8608 .2270 143 13 .0833
Appendix II–3. Summary statistics of intra-network sample ratios surrounding the 5-year or greater annual precipitation maxima near Dallas, Texas—Continued
Mean separation
distance for
each mile-
wide window
(mi)
Mean
sample
ratio, mean
empirical
Standard
deviation
of sample
ratios
Coefficient
of variation
of sample
ratios
Median
sample
ratio, median
empirical
No. of
sample
ratios
No. of
zero
sample
ratios
Probability
of zero
sample
ratioST r( ) ST r( )

Appendix III 73
Appendix III
APPENDIX III—Summary Statistics of Intra-NetworkSample Ratios for Houston, Texas

74 Areal-Reduction Factors for the Precipitation of the 1-Day Design Storm in Texas
Appendix III–1. Summary statistics of intra-network sample ratios surrounding any annual precipitation maxima near Houston, Texas—Continued
Mean separation
distance for
each mile-
wide window
(mi)
Mean
sample
ratio, mean
empirical
Standard
deviation
of sample
ratios
Coefficient
of variation
of sample
ratios
Median
sample
ratio, median
empirical
No. of
sample
ratios
No. of
zero
sample
ratios
Probability
of zero
sample
ratio
0 1 0 0 1 0 0 0
0–1 -- -- -- -- -- -- --
1.68 1.4273 1.3440 .9416 .8810 111 2 .01770
2.54 .8688 .4027 .4635 .8410 224 5 .0218
3.50 .8314 .4132 .4970 .8080 516 15 .0282
4.51 .8070 .4102 .5082 .7990 487 11 .0221
5.57 .7616 .4168 .5473 .7430 1,016 32 .0305
6.48 .6963 .4593 .6597 .6810 1,284 87 .0635
7.51 .6903 .4446 .6441 .6700 1,221 68 .0528
8.55 .7100 .4469 .6294 .6740 1,334 85 .0599
9.47 .6923 .4578 .6613 .6520 1,405 64 .0436
10.47 .6767 .4310 .6369 .6450 1,651 85 .0490
11.52 .6390 .4500 .7042 .5940 1,538 86 .0530
12.51 .6146 .4447 .7235 .5550 2,240 166 .0690
13.49 .6382 .4465 .6996 .5970 1,700 106 .0587
14.45 .6134 .4250 .6928 .5590 1,634 97 .0560
15.47 .6045 .4278 .7077 .5560 2,173 142 .0613
16.47 .6272 .4491 .7161 .5620 1,761 110 .0588
17.50 .6021 .4334 .7198 .5410 2,064 123 .0562
18.48 .5894 .4440 .7534 .5300 2,182 169 .0719
19.47 .5829 .4406 .7560 .5080 2,189 155 .0661
20.48 .5711 .4315 .7556 .4940 2,179 147 .0632
21.52 .5359 .4131 .7708 .4700 1,690 126 .0694
22.46 .5561 .4255 .7653 .4880 1,771 118 .0625
23.55 .5504 .4287 .7789 .4750 2,244 178 .0735
ST r( ) ST r( )
Appendix III–1. Summary statistics of intra-network sample ratios surrounding any annual precipitation maxima near Houston, Texas
[Unless otherwise noted, units are dimensionless. Total number of samples for separation distances up to 50 miles equals 69,370. mi, miles; --, no data available]

Appendix III 75
24.43 0.5537 0.4326 0.7813 0.4710 2,094 152 0.0677
25.49 .5441 .4499 .8269 .4540 1,724 155 .0825
26.50 .5583 .4400 .7881 .4770 1,717 123 .0668
27.56 .5212 .4123 .7912 .4360 2,012 164 .0754
28.54 .5015 .4252 .8479 .4100 1,646 146 .0815
29.45 .5145 .4352 .8459 .4210 1,396 116 .0767
30.46 .5229 .4275 .8175 .4350 1,769 132 .0694
31.46 .4935 .4154 .8417 .3970 1,374 119 .0797
32.51 .4809 .4068 .8457 .4000 1,143 112 .0892
33.50 .4688 .4108 .8764 .3630 1,335 121 .0831
34.48 .4703 .4272 .9084 .3550 1,407 170 .1078
35.51 .4517 .4193 .9283 .3320 1,526 190 .1107
36.57 .4823 .4108 .8518 .4000 1,613 153 .0866
37.49 .4773 .4359 .9131 .3560 1,105 107 .0883
38.46 .4461 .4143 .9286 .3320 1,070 136 .1128
39.39 .4815 .4274 .8877 .3740 1,438 130 .0829
40.61 .4537 .4201 .9260 .3420 1,735 223 .1139
41.56 .4262 .4020 .9433 .2970 790 98 .1104
42.48 .4797 .4374 .9118 .3550 1,479 146 .0898
43.40 .4299 .4216 .9806 .2960 878 133 .1316
44.50 .4171 .3830 .9182 .3180 1,021 119 .1044
45.51 .4680 .4447 .9501 .3590 1,195 152 .1128
46.49 .4219 .4265 1.0108 .2810 903 125 .1216
47.47 .4026 .4073 1.0115 .2740 975 148 .1318
48.62 .4280 .4283 1.0008 .2890 862 147 .1457
49.44 .3932 .4023 1.0231 .2440 549 91 .1422
Appendix III–1. Summary statistics of intra-network sample ratios surrounding any annual precipitation maxima near Houston, Texas—Continued
Mean separation
distance for
each mile-
wide window
(mi)
Mean
sample
ratio, mean
empirical
Standard
deviation
of sample
ratios
Coefficient
of variation
of sample
ratios
Median
sample
ratio, median
empirical
No. of
sample
ratios
No. of
zero
sample
ratios
Probability
of zero
sample
ratioST r( ) ST r( )

76 Areal-Reduction Factors for the Precipitation of the 1-Day Design Storm in Texas
Appendix III–2. Summary statistics of intra-network sample ratios surrounding the 2-year or greater annual precipitation maxima near Houston, Texas—Continued
Mean separation
distance for
each mile-
wide window
(mi)
Mean
sample
ratio, mean
empirical
Standard
deviation
of sample
ratios
Coefficient
of variation
of sample
ratios
Median
sample
ratio, median
empirical
No. of
sample
ratios
No. of
zero
sample
ratios
Probability
of zero
sample
ratio
0 1 0 0 1 0 0 0
0–1 -- -- -- -- -- -- --
1.70 .8237 .3461 .4202 .8830 31 1 .0312
2.57 .7792 .3896 .5000 .7620 61 3 .0469
3.49 .7918 .3894 .4918 .7630 135 7 .0493
4.51 .7501 .3745 .4993 .7800 119 4 .0325
5.57 .7191 .3820 .5312 .6910 264 8 .0294
6.46 .6264 .4383 .6996 .6260 367 33 .0825
7.50 .6535 .4138 .6331 .6540 362 17 .0449
8.55 .6597 .3974 .6024 .6350 400 21 .0499
9.45 .6488 .3924 .6049 .6140 380 18 .0452
10.45 .6321 .3802 .6014 .5910 468 19 .0390
11.51 .5671 .4165 .7344 .5030 443 26 .0554
12.52 .5456 .3923 .7191 .4970 631 42 .0624
13.49 .5769 .4183 .7251 .5210 482 27 .0530
14.45 .5535 .3766 .6805 .4750 424 19 .0429
15.44 .5534 .3943 .7126 .4920 611 34 .0527
16.47 .5526 .3949 .7146 .4690 520 27 .0494
17.50 .5654 .3995 .7066 .4990 626 34 .0515
18.49 .5253 .3958 .7533 .4470 652 46 .0659
19.48 .5212 .3836 .7359 .4450 646 39 .0569
20.47 .5028 .3913 .7782 .4100 633 34 .0510
21.52 .4750 .3795 .7988 .3900 470 33 .0656
22.47 .5041 .3848 .7634 .4300 500 22 .0421
23.56 .5467 .4117 .7531 .4560 672 34 .0482
ST r( ) ST r( )
Appendix III–2. Summary statistics of intra-network sample ratios surrounding the 2-year or greater annual precipitation maxima near Houston, Texas
[Unless otherwise noted, units are dimensionless. Total number of samples for separation distances up to 50 miles equals 21,392. mi, miles; --, no data available]

Appendix III 77
24.42 0.4913 0.3965 0.8071 0.3990 638 45 0.0659
25.50 .4703 .3964 .8429 .3660 526 45 .0788
26.51 .5141 .4136 .8046 .4300 528 25 .0452
27.56 .4912 .3956 .8054 .3810 622 41 .0618
28.54 .4701 .4065 .8647 .3560 508 29 .0540
29.45 .4630 .4063 .8776 .3400 415 34 .0757
30.46 .5174 .4271 .8255 .4090 554 29 .0497
31.46 .4245 .3547 .8355 .3260 429 27 .0592
32.52 .4535 .3965 .8743 .3430 351 23 .0615
33.48 .4144 .3660 .8832 .2850 432 30 .0649
34.49 .4268 .3891 .9118 .3300 453 53 .1047
35.51 .4153 .3814 .9183 .3200 536 61 .1022
36.57 .4516 .3751 .8307 .3620 532 33 .0584
37.48 .4231 .3721 .8794 .3040 337 27 .0742
38.47 .4219 .3953 .9368 .2970 392 43 .0989
39.37 .4416 .3699 .8376 .3400 481 27 .0531
40.63 .3982 .3746 .9406 .2670 627 62 .0900
41.55 .3752 .3406 .9079 .2580 277 25 .0828
42.48 .4543 .4108 .9042 .3190 534 41 .0713
43.40 .3918 .3774 .9633 .2800 340 41 .1076
44.49 .3453 .3259 .9439 .2380 382 45 .1054
45.50 .4662 .4294 .9209 .3590 439 48 .0986
46.48 .3872 .3957 1.0220 .2280 314 38 .1080
47.47 .3416 .3438 1.0065 .2370 349 42 .1074
48.63 .3850 .3834 .9959 .2520 298 43 .1261
49.43 .3627 .3764 1.0377 .2150 201 25 .1106
Appendix III–2. Summary statistics of intra-network sample ratios surrounding the 2-year or greater annual precipitation maxima near Houston, Texas—Continued
Mean separation
distance for
each mile-
wide window
(mi)
Mean
sample
ratio, mean
empirical
Standard
deviation
of sample
ratios
Coefficient
of variation
of sample
ratios
Median
sample
ratio, median
empirical
No. of
sample
ratios
No. of
zero
sample
ratios
Probability
of zero
sample
ratioST r( ) ST r( )

78 Areal-Reduction Factors for the Precipitation of the 1-Day Design Storm in Texas
Appendix III–3. Summary statistics of intra-network sample ratios surrounding the 5-year or greater annual precipitation maxima near Houston, Texas—Continued
Mean separation
distance for
each mile-
wide window
(mi)
Mean
sample
ratio, mean
empirical
Standard
deviation
of sample
ratios
Coefficient
of variation
of sample
ratios
Median
sample
ratio, median
empirical
No. of
sample
ratios
No. of
zero
sample
ratios
Probability
of zero
sample
ratio
0 1 0 0 1 0 0 0
0–1 -- -- -- -- -- -- --
1–2 -- -- -- -- -- -- --
2.54 .7417 .3351 .4518 .7620 21 1 .0455
3.49 .7392 .3806 .5149 .7500 51 3 .0556
4.48 .7380 .4288 .5810 .8290 46 3 .0612
5.60 .7613 .3756 .4935 .7190 97 3 .0300
6.44 .5705 .3869 .6783 .5810 155 17 .0988
7.53 .6320 .4029 .6374 .6170 137 5 .0352
8.56 .6288 .3888 .6184 .6260 147 12 .0755
9.43 .6916 .4042 .5844 .6940 149 7 .0449
10.39 .6650 .4045 .6082 .6210 164 6 .0353
11.52 .5437 .4359 .8018 .5010 183 16 .0804
12.49 .5602 .4189 .7478 .5220 240 20 .0769
13.48 .5313 .3899 .7338 .4970 192 12 .0588
14.47 .5854 .3663 .6258 .5220 165 4 .0237
15.43 .5448 .4018 .7375 .5080 237 17 .0669
16.47 .5401 .3835 .7102 .4550 199 12 .0569
17.51 .5537 .3996 .7216 .4970 252 15 .0562
18.50 .5282 .4137 .7832 .4090 257 21 .0755
19.49 .4937 .3738 .7571 .4040 255 14 .0520
20.44 .4762 .3567 .7489 .3610 239 15 .0591
21.52 .4522 .3942 .8717 .3250 193 15 .0721
22.47 .5014 .3833 .7644 .4300 185 8 .0415
23.56 .5205 .3786 .7273 .4470 295 12 .0391
ST r( ) ST r( )
Appendix III–3. Summary statistics of intra-network sample ratios surrounding the 5-year or greater annual precipitation maxima near Houston, Texas
[Unless otherwise noted, units are dimensionless. Total number of samples for separation distances up to 50 miles equals 8,536. mi, miles; --, no data available]

Appendix III 79
24.42 0.4793 0.4069 0.8490 0.3780 236 18 0.0709
25.52 .4596 .3952 .8598 .3480 216 20 .0847
26.51 .5156 .4024 .7804 .4350 186 9 .0462
27.57 .4776 .3667 .7677 .3760 232 7 .0293
28.57 .4742 .4006 .8447 .3590 215 8 .0359
29.43 .4084 .3652 .8942 .3000 167 14 .0773
30.46 .4919 .4167 .8472 .4060 230 13 .0535
31.45 .3681 .3266 .8875 .2660 172 10 .0549
32.51 .4345 .3816 .8783 .3120 136 6 .0423
33.50 .3893 .3448 .8857 .2360 174 7 .0387
34.50 .4293 .3805 .8865 .3340 184 16 .0800
35.50 .3675 .3286 .8941 .2960 234 27 .1034
36.60 .4062 .3315 .8162 .3330 208 13 .0588
37.48 .3786 .3436 .9074 .2700 159 17 .0966
38.50 .3776 .3617 .9581 .2370 142 16 .1013
39.35 .4055 .3549 .8752 .2810 205 9 .0421
40.64 .3507 .3392 .9673 .2230 270 25 .0847
41.53 .3646 .3560 .9764 .2150 115 12 .0945
42.48 .3871 .3368 .8701 .2810 204 14 .0642
43.39 .4076 .4105 1.0072 .2590 144 13 .0828
44.49 .2922 .2761 .9450 .2090 164 18 .0989
45.50 .4121 .3961 .9612 .2970 187 24 .1137
46.46 .2984 .3058 1.0249 .1730 137 16 .1046
47.46 .2828 .2946 1.0418 .1770 151 18 .1065
48.64 .3607 .3691 1.0232 .2300 121 17 .1232
49.43 .3274 .3370 1.0295 .2020 88 8 .0833
Appendix III–3. Summary statistics of intra-network sample ratios surrounding the 5-year or greater annual precipitation maxima near Houston, Texas—Continued
Mean separation
distance for
each mile-
wide window
(mi)
Mean
sample
ratio, mean
empirical
Standard
deviation
of sample
ratios
Coefficient
of variation
of sample
ratios
Median
sample
ratio, median
empirical
No. of
sample
ratios
No. of
zero
sample
ratios
Probability
of zero
sample
ratioST r( ) ST r( )

80 Areal-Reduction Factors for the Precipitation of the 1-Day Design Storm in Texas
Appendix III–4. Summary statistics of intra-network sample ratios surrounding the 10-year or greater annual precipitation maxima near Houston, Texas—Continued
Mean separation
distance for
each mile-
wide window
(mi)
Mean
sample
ratio, mean
empirical
Standard
deviation
of sample
ratios
Coefficient
of variation
of sample
ratios
Median
sample
ratio, median
empirical
No. of
sample
ratios
No. of
zero
sample
ratios
Probability
of zero
sample
ratio
0 1 0 0 1 0 0 0
0–1 -- -- -- -- -- -- --
1–2 -- -- -- -- -- -- --
2–3 -- -- -- -- -- -- --
3.45 .6831 .3546 .5191 .7060 30 2 .0625
4.44 .7259 .4350 .5992 .7820 25 1 .0385
5.56 .7325 .2940 .4014 .7140 56 2 .0345
6.46 .5286 .3659 .6921 .5770 79 10 .1124
7.54 .6358 .4016 .6316 .6260 75 3 .0385
8.59 .6105 .3518 .5762 .6350 85 7 .0761
9.42 .7116 .3720 .5227 .7250 90 1 .0110
10.41 .6062 .3585 .5915 .5870 82 5 .0575
11.54 .5385 .4228 .7851 .5110 105 9 .0789
12.50 .5601 .4147 .7405 .5230 135 12 .0816
13.48 .5198 .3505 .6744 .5280 98 3 .0297
14.47 .6172 .3797 .6151 .5390 87 3 .0333
15.44 .5664 .3787 .6686 .5920 130 6 .0441
16.46 .5128 .3576 .6973 .4550 104 6 .0545
17.51 .5110 .3628 .7099 .4640 138 12 .0800
18.48 .5449 .4049 .7431 .4700 142 10 .0658
19.47 .4710 .3545 .7528 .4040 131 8 .0576
20.45 .4389 .3281 .7474 .3500 122 7 .0543
21.52 .4450 .3895 .8751 .3240 112 6 .0508
22.48 .5340 .3941 .7380 .4970 102 3 .0286
23.58 .5024 .3709 .7383 .4480 162 8 .0471
ST r( ) ST r( )
Appendix III–4. Summary statistics of intra-network sample ratios surrounding the 10-year or greater annual precipitation maxima near Houston, Texas
[Unless otherwise noted, units are dimensionless. Total number of samples for separation distances up to 50 miles equals 4,654. mi, miles; --, no data available]

Appendix III 81
24.41 0.4897 0.3733 0.7624 0.4170 121 3 0.0242
25.51 .4458 .3870 .8681 .3190 127 10 .0730
26.52 .5096 .3826 .7508 .4590 99 6 .0571
27.55 .4922 .3444 .6996 .4200 116 4 .0333
28.57 .4251 .3563 .8382 .3130 118 5 .0407
29.44 .3583 .2921 .8153 .3010 90 8 .0816
3.47 .4404 .3783 .8592 .3450 135 7 .0493
31.43 .3536 .2598 .7348 .2710 79 3 .0366
32.52 .3821 .3483 .9116 .2890 68 4 .0556
33.49 .3436 .3054 .8887 .2170 98 6 .0577
34.49 .3749 .3360 .8962 .2640 107 11 .0932
35.49 .3146 .2642 .8398 .2500 133 15 .1014
36.57 .3482 .3048 .8751 .2610 106 11 .0940
37.48 .3204 .3001 .9366 .2250 96 15 .1351
38.49 .3289 .3282 .9977 .2260 69 11 .1375
39.32 .3610 .3206 .8881 .2320 100 5 .0476
40.63 .2897 .2711 .9358 .1930 151 16 .0958
41.52 .3081 .2749 .8923 .2290 59 6 .0923
42.45 .3048 .2496 .8191 .2490 115 9 .0726
43.38 .2967 .2942 .9917 .1920 78 8 .0930
44.46 .2436 .2254 .9251 .1720 96 10 .0943
45.51 .4200 .3763 .8958 .3240 111 11 .0902
46.46 .2349 .2391 1.0176 .1310 80 11 .1209
47.48 .2711 .2819 1.0398 .1700 91 9 .0900
48.65 .2703 .2627 .9720 .2150 70 12 .1463
49.39 .2335 .2161 .9255 .1620 51 4 .0727
Appendix III–4. Summary statistics of intra-network sample ratios surrounding the 10-year or greater annual precipitation maxima near Houston, Texas—Continued
Mean separation
distance for
each mile-
wide window
(mi)
Mean
sample
ratio, mean
empirical
Standard
deviation
of sample
ratios
Coefficient
of variation
of sample
ratios
Median
sample
ratio, median
empirical
No. of
sample
ratios
No. of
zero
sample
ratios
Probability
of zero
sample
ratioST r( ) ST r( )
Top Related