


![Changes in Biochemical and Physico-chemical Qualities ... · Non-volatile acidity of the cocoa beans were determined according to AOAC method 970.21, [24] (AOAC, 2005) and expressed](https://static.fdocuments.in/doc/165x107/5ea239c3bb4787553045f822/changes-in-biochemical-and-physico-chemical-qualities-non-volatile-acidity-of.jpg)


Languages
Pages
Legal


1
Applying Precision Agriculture Methodology to the Viticulture of Douro
Demarcated Region
Fernando A. Santos (*)
(*) Universidade de Trás-os-Montes e Alto Douro (UTAD). Rural Engineering
Department. [email protected]
Abstract
The INTERREG - COREA project, entitle “The News Information and Communication
Technologies (NTIC) used in Atlantic Arc Region” (*) had the purpose of applying
Precision Agriculture techniques to the viticulture of Douro Region, in order to analyse
data variability between and within parcels and between the installations forms (terraces
and slope vineyards).
In this study several environmental data were determined at various geo-referenced
sites, namely atmospheric, plant and soil (at two levels) data, and yield, must and wine
parameters, being each one “divided” in three levels and related to the wine sensorial
characteristics in order to get three different quality wines.
Using ANOVA various possible scenarios were envisage. In some cases parameters
were significantly different within and between the parcels, in other cases no significant
differences were detected under any circumstance. In the vast majority of cases
however, the parameters were different when comparing the parcels but not inside them.
Considering the high number of parameters determined for each group of data a
Principal Component Analysis (PCA) was performed in order to select the most
important, according the interpretation of the first factor.
(*) The whole report can be consulted in:
www.utad.pt/~fsantos/pub-fas/COREA-RelFinalIng.pdf
2
Keywords: precision viticulture, vineyard, wine, enology
1. Introduction
The project “The News Information and Communication Technologies (NTIC) used in
Atlantic Arc Region Agricultural Services” is a part of an INTERREG-COREA study,
and is composed of Portuguese, Spanish and French research teams. The project had
two parts, one named “Axe I” pertaining to the identification and spreading of national
sites with relevant information for NTIC and, the second one, named “Axe II”, related
to experimental work on precision agriculture. The Portuguese team was focused on
precision viticulture, implemented at the S. Bárbara Experimental Station, which is
located nearby the Pinhão town (Douro Demarcated Region), property of Official
Agricultural Services.
This experimental work included the selection and identification (Figure 1) of several
geo-referenced sites within each parcel where environmental, plant and soil parameters
were determined.
Figure 1
For the yield, must and wine data characterisation each parcel was “divided” in three
blocks being the parameters determined for each one; in the terraced vineyards the three
blocks were discriminated in the sideslope according the topographic contours and, in
the slope vineyards, according the same level; these blocks are the “units” to
performance the final vineyard variability management.
The experimental data analysis and its comparison with the wines sensorial data,
attributed by a wine tasting panel (Alvelos et al., 2000) allow the drivers identification
more relevant to the wine quality. The knowledge on parameters variation within and

3
between parcels can be used to do a differentiated vintage, in order to get different
quality wines (Krstic & Smart, 2002).
2. Material and methods
2.1. Parcels selection and its characterisation
The identification and characterisation of selected parcels (Table 1) were conceived to
guarantee the same lineage (Aragonês - Tinta Roriz), no matter the parcels were to be
installed in terraces, with one and two rows, or slope vineyards, at different altitudes
and exposition. Variability in the parcels’ settings had as main purpose to emphasize the
differences within and between parcels (Krstic & Smart, 2002).
Table 1
2.2. Environmental data characterisation
The environmental data were determined several times during the plants’ vegetative
cycle and included the air temperature and humidity, as well as, the plants and soil
temperatures.
2.3. Plants data characterisation
The plant characterization, done after the sprout load correction (Escudero & Zaballa,
2000), in order to have the same number of grape flowers in all plants consisted in the
determination of the photosynthetic activity (SPAD), leaves dry weight and area,
macronutrients concentration (nitrogen, phosphorous and potassium) and micronutrients
(calcium, magnesium, boron, iron, copper, zinc and manganese) in leaves and pruning
weight (Bramley, 2001). .
The photosynthetic activity determination, done several times during the plants’ life
cycle, was carried out in leaves gathered at the first hours of the day. For this

4
determination, leaves were picked up from the plants’ grape region located close to the
geo-referenced sites. The SPAD determination along the plants’ life cycle, had the
purpose of knowing the nutritional state of plants, namely the nitrogen content.
Leaves used in SPAD determinations were used to determine leaf area and dry weight.
The leaves picked up in 2005 during the grape veraison were grinded and analysed in
the UTAD Soil Laboratory to determine their chemical composition, namely nitrogen,
phosphorous and potassium concentrations. In 2006, two determinations were done, one
during the flowering and the other in veraison (Bramley, 2001); in this year
micronutrients such as (calcium, magnesium, boron, iron, copper, zinc and manganese)
were also determined.
To get the pruning wood average weight per plant (Figure 2), material was collected
from plants located close to the geo-referenced site; the pruning wood is a good
indicator of yield (Krstic & Smart, 2002).
Figure 2
2.4. Soil data characterisation
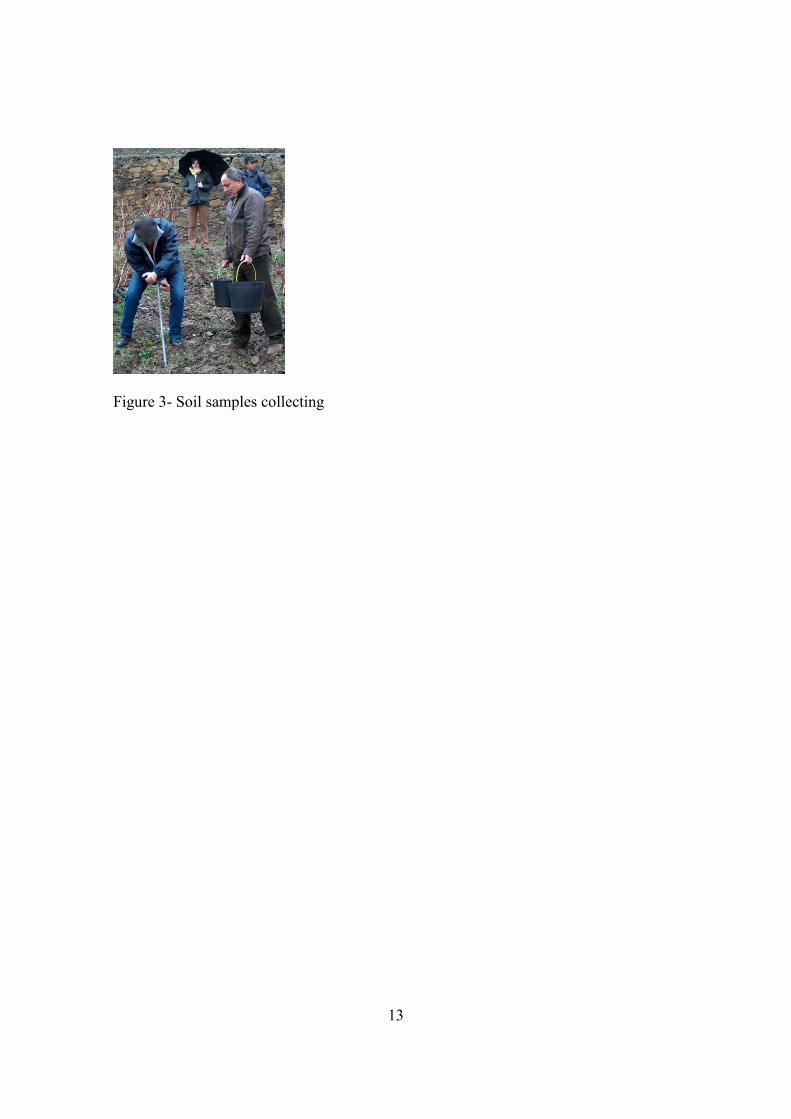
For soil surveying, samples were taken next to the geo-referenced sites at of 0 - 20 cm
and 20 - 40 cm depths intervals (Figure 3). Samples collected at the same depth, from
three geo-referenced close sites (stations), were joined getting so nine samples per
parcel, accomplishing so 72 samples in all parcels (4 parcels x 9 stations x 2 depths).
Figure 3
The data determined at the UTAD Soil Laboratory refers to soil texture, pH in H2O and
KCl, organic matter (OM), assimilable phosphorous (P2O5), assimilable potassium
(K2O), calcium (Ca), magnesium (Mg), potassium (K), nitrogen (Na), extracted boron
in boiling water (B), exchangeable acidity (AT), sum of exchangeable bases (SBT),

5
cation exchangeable capacity (CTCe) and base saturation (GSBe). These analysis were
done by the Egner-Riehm method of extraction, using an extraction agent solution of
lactic acid, ammonium acetate and acetic acid, tampon at pH of ± 3.5.
2.5. Grapes, must and wine data
These data were measured in samples resulting from the joining of the three close
stations (blocks), of each parcel from which resulted 12 samples (4 parcels x 3 blocks).
The vintage date was decided based on the evolution of grapes ripening.
2.5.1. Grapes weight and composition
To determine the grapes weight, about 20 berries were collected along the fruit ripening
(from middle July until the vintage, in the beginning of September), in each geo-
referenced site, joining them in the three blocks of each parcel.
The data determinations of grapes composition during the vegetative cycle were the
probable alcohol, sugar content, total acidity and pH (Rizzon & Miele, 2003). Some
grapes were frozen to be used later for sugar analysis content, pH, total acidity, total
phenols and total anthocyanins.
2.5.2. Must characterization
The characterisation of must used the last picked up grapes. In each microvinification,
at least 30 kg were used, which means that ± 100 kg of grapes were necessary to
characterize the must of each parcel. Must characterization was based on probable
alcohol, total acidity and pH determinations (Rizzon & Miele, 2003).
2.5.3. Wine analytical parameters
The musts microvinifications took place according to usual techniques of red wines
vinifications with long maceration, to the extraction of aroma and phenols. Once the
alcoholic fermentation ended, controlled malolactic fermentation were started with the

6
addition of lactic bacteria and, when finished, the wines were microbiologically
stabilized by drawing off and sulphurous addiction, being transferred to a refrigerator
chamber at about 4ºC, for a period of nearly 20 days, until the tartaric stabilization had
occurred, after what the wines were bottled (Silva, 1994).
Analytical determinations made during the microvinification were the alcohol content,
volume mass, non reducer dry extract, reducer sugar, total dry extract (non reducer dry
extract + reducer sugar), pH, volatile acidity, fix acidity, total acidity (volatile acidity +
fix acidity), total phenols, colour intensity, character, ashes, ashes alkalinity, ashes
inorganic phosphates and anthocyanins (Rizzon & Miele, 2003).
2.6. Wine sensorial tests
The wines resulting from the twelve microvinifications were subject to visual and
tasting tests, concerned with colour intensity, aroma, including red fruits and floral
aroma, body, astringency and total acidity (Andrade et al., 2006).
A classification was attributed to the several characteristics, varying the sensorial scale
evaluation from 0 to 5 and the final marks from 0 to 20 (Alvelos et al., 2000).
3. Results and discussion
All data were introduced in a worksheet where columns represent the several variables
and the rows the cases. In order to analyse and interpret the data, it was used statistical,
geographical and cartographic interpretation software. The first one allows for variance,
regression, principal component and cluster analysis data, the second to figure out its
spatial distribution and the third to draw variable distribution maps.
This paper pertains solely to the results of wine sensorial data and final marks attributed
by a jury in the first year, which include the colour intensity (Cor), aroma (Aroma), red
7
fruit aroma (FrVer), floral aroma (Floral), body (Corpo), astringency (Adst), total
acidity (AcTt) and final marks (NFinal).
The results for the twelve wines, obtained from the twelve analysed regions (blocks),
are depicted in Table 2.
Table 2
The final grades presents values that are significantly different between parcels, but not
when comparing the vineyards installation forms (F=4.14, P=0.048 and F=1.70,
P=0.222, respectively); it is impossible to analyse the variation within the parcels
because no data is available on the variations inside each block. For the parcels the
highest grades were obtained in Bateiras (BaG2) and Bico dos Casais (BCG2) (> 13)
and the lowest in Cardanhas (CaG2 and CaG3) (< 12). According the installation forms
mean values were 12.9 in case of terraces and 12.3 for slope vineyards.
Comparing the data from two years it is noticed that in the last one the wine quality was
lower, keeping Bateiras as the best parcel and Cardanhas the worst. Comparing the
different installations forms one realises that, in the last year, the wines from terraces
are significantly better (F=8.72, P=0.014) than those from slope vineyards, a result that
did not occurred in the first year. This probably means that in years of good wines, there
is no significant difference between vineyards installations forms but when the quality
is lower the differences are noticeable.
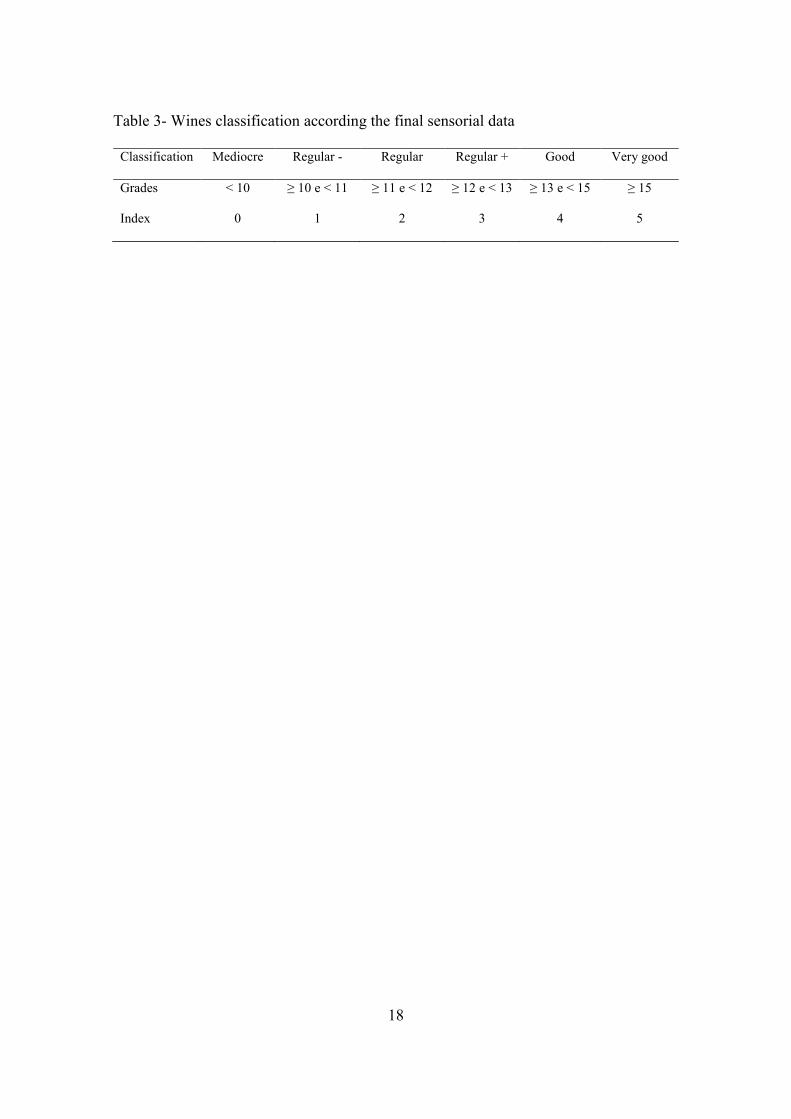
The scale followed by the panellist (Table 3) indicates that the wines with a grade ≥ 15
are very good, with a final grade ≥ to 13 and < 15 are good, with a grade ≥ 10 and < 13
are regular, and with a grade <10 are mediocre. Within the classification of regular,
three levels were considered.
Table 3

8
To define three wine quality levels among the twelve blocks, a cluster analysis was
executed, with the following results (Figure 4):
- cluster 1 - 8 wines (AmG1, AmG2, AmG3, BaG1, BaG3, BCG1, BCG3 and CaG1),
considered wines of average quality;
- cluster 2 - 2 wines (BaG2 and BCG2), considered the best quality wines;
- cluster 3 - 2 wines (CaG2 and CaG3), considered the worst quality wines.
Figure 4
The level 1 includes the wines classified by the panellist with grades > 13 (good), the
level 2 the wines classified with a grade between 12 - 13 (regular +) and the level 3 the
wines classified with a grade < 12 (regular and regular -).
Relatively to the PCA (Andrade et al., 2006), and according the interpretation of factor
one, the more relevant sensorial parameters (loadings > 0.70) are the aroma,
adstringency, colour and structure.
4. Conclusions
The differentiation between and within parcels characteristics, must be taken in
consideration to a differentiated vintage, with the purpose of getting grapes lots
qualitatively different, that should be converted separately into wine. The identification
and characterisation of quality major potential zones allows the improvement of the
other ones (Bramley, 2001), although there will be always some parcels, or part of it,
that will have better grapes (Krstic & Smart, 2002).
Considering the determined data, and for this situation, we notice:
- for the environmental data there are some, like the atmospheric temperature, after the
firsts hours of the day, are generally significantly different between and within parcels;

9
- for the plants data, like leaves composition, the variance is not, generally, significant
between and within parcels;
- for the data soil we find different situations but, generally, we can say that between
parcels the variance is significant, and inside the parcels it can be or not;
- for the yield, must and wine data, where is not possible to analyse the variance inside
parcels, there are some parameters that are significant different between the parcels but
others ones, no.
Considering the variance analysis of all parameters, it is believed that it is necessary to
go on these trials in order to get broadly consistent data from year to year and increase
the relationship between site-soil-water-vine-wine; before reach these goals the
principal component analysis give important information on the variance of all
parameter, why must be taken on a predictive value (Bramley, 2001). Considering that
the spatial pattern is relatively consistent between years (Profffit & Hamilton, 2001) it is
more important to know the within parcel variability.
The understanding of the relationship between the inputs of grape production system
and their output is so required to reach the purpose of the precision viticulture.
To finish we can say that the vinification techniques can overcome some lack of grapes
quality, but the wines are better when the grapes are of good quality, why it is necessary
to select the better ones to get the betters wines (Silva, 1994).
10
Figures list
Figure 1- Georeferenciation sites and its identification
Figure 2- Determination of the average plant pruning wood weight.
Figure 3- Soil samples collecting
Figure 4- Cluster analyse for the several blocks according the final grades.

11
Figure 1- Georeferenciation sites and its identification

12
Figure 2- Determination of pruning wood weight.
13
Figure 3- Soil samples collecting

14
CASE CLUSTER DISTANCE
AmG1 1 0.24
AmG2 1 0.20
AmG3 1 0.16
BaG1 1 0.25
BaG2 2 0.24
BaG3 1 0.15
BCG1 1 0.23
BCG2 2 0.24
BCG3 1 0.16
CaG1 1 0.26
CaG2 3 0.28
CaG3 3 0.28
Tree Diagram f or 12 Cases
Ward`s methodEuclidean distances
0 1 2 3 4 5 6
Linkage Distance
CaG3
CaG2
BCG2
BaG2
BCG3
BCG1
CaG1
BaG1
AmG2
BaG3
AmG3
AmG1
Figure 4- Cluster analyse for the several blocks according the final grades.

15
Tables list
Table 1- General characterisation of selected parcels
Table 2- Results of wine tasting done in 2005
Table 3- Wines classification according the final grade

16
Table 1- Identification and characterisation of selected parcels
Parcel name Parcel number Area (ha) Installation type
Amendoal (Am) 42 0.397 1 row terraces
Bateiras (Ba) 1 1.130 2 row terraces
Bico dos Casais (BC) 25 0.353 Slope vineyards
Cardanhas (Ca) 23 0.353 Slope vineyards

17
Table 2- Results of wine sensorial data and final grade in 2005 (*)
AmG1 AmG2 AmG3 BaG1 BaG2 BaG3 BCG1 BCG2 BCG3 CaG1 CaG2 CaG3
Cor 3.83 3.83 3.67 4.00 4.17 3.50 3.17 4.17 3.17 3.50 3.00 2.83
Aroma 3.67 3.50 3.33 3.83 3.50 3.33 3.33 3.50 3.50 3.67 2.83 2.67
FrVer 2.16 1.83 2.00 2.50 2.00 2.00 2.33 2.00 2.33 2.50 1.50 1.67
Floral 0.00 0.33 0.33 0.67 0.33 0.50 0.83 1.33 0.50 0.67 0.83 1.00
Corpo 3.50 3.33 3.33 3.17 3.67 3.17 3.50 3.50 3.33 2.83 2.83 2.67
Adst 3.00 3.50 3.00 3.50 3.83 3.00 3.33 3.00 3.17 3.17 3.00 2.00
AcTt 3.00 3.00 3.00 3.00 3.00 3.00 3.00 3.00 3.00 3.00 3.00 3.00
NFinal 12.83 12.50 12.83 12.67 13.50 12.83 12.67 13.83 12.50 12.17 11.83 10.67
(*) The scope of the sensorial data is between 0 and 5 and, the final grade, between 0 and 20.
18
Table 3- Wines classification according the final sensorial data
Classification Mediocre Regular - Regular Regular + Good Very good
Grades < 10 ≥ 10 e < 11 ≥ 11 e < 12 ≥ 12 e < 13 ≥ 13 e < 15 ≥ 15
Index 0 1 2 3 4 5

19
References
Alvelos H; Cabral J; Amaral B; Barros P (2000). Statistical methods for controlling
wine tasting panels. Ciência Técnica Vitivinícola 15 (1):15-26.
Andrade M; Paim A; Silva J (2006). Aplicação de métodos analíticos e
quimiométricos para caracterização de vinhos comercializados no Recife. 29a Reunião
Anual da Sociedade Brasileira de Química
Bramley R (2001). Progress in the development of precision viticulture - variation in
yield, quality and soil properties in contrasting Australian vineyards. CSIRO Land and
Water and Cooperative Research Centre for Viticulture. Private Bag nº 2, Glen
Osmond, SA 5064, Australia.
Escuder E; Zaballa O (2000). Ensayos de aclareo manual de racimos en la D.O. La
Rioja. Agro Técnica 811: 61-68.
Proffit T; Hamilton R (2001). Precision viticulture - Technology to Optimize
Vineyard Performance. Australian Wine Industry. Technical Conference. Adelaide -
Australia.
Rizzon L; Miele A (2003). Avaliação da cv. Merlot para elaboração de vinho tinto.
Ciências Tecnológicas Alimentares, Campinas, 23 (Supl); 156-161, Dez.2003
Silva H (1994). A enologia preventiva: a estabilidade dos vinhos. Vida Rural 1596: 32-
34.
Krstic M; Smart R (2002). Possible applications of new world viticulture in Portugal.
Revista de Vinhos. II Conferência Revista de Vinhos.
Top Related