


Languages
Pages
Legal


© 2014 IJEDR | Volume 2, Issue 1 | ISSN: 2321-9939
IJEDR1401022 International Journal of Engineering Development and Research ( www.ijedr.org) 126
Application of SIX-SIGMA In Four Wheeler
Platform Truck With Quality Tools and Techniques
1Abhishek Kishor Sardeshpande,
2Prof. H.P.Khairnar
1M-Tech (Machine Design) PG Scholar,
2Assistant Professor (Mechanical Engineering).
1,2Dept of Mechanical Engineering, Veermata Jijabai Technological Institute, Mumbai, Maharashtra, India-400019
[email protected], [email protected]
Abstract— The six sigma method is a project-driven management approach to improve the organization’s products, services, and
processes by continually reducing defects in the organization.
This paper examines the evolution, benefits, and challenges of six sigma practices and identifies the key factors influencing
successful six sigma project implementations. It integrates the lessons learned from successful six sigma projects and considers further
improvements to the six sigma approach. Effective six sigma principles and practices will succeed by refining the organizational culture
continuously.
The purpose of this paper is the survey of six sigma process and its impact on the total productivity and final quality of the four
wheeler platform truck in leading manufacturing of material handling equipments. So I have studied key concepts, problem solving
process of six-sigma as well as the survey of important fields such as: DMAIC, six sigma and productivity applied program, and other
advantages of six-sigma.
After successful implementation of this concept, the total sigma level for four wheeler platform truck will be improved from 1.2 to 3.2.
Index Terms—Six-Sigma, DMAIC, Cause and Effect Diagram, Pareto Chart & CASE STUDY.
I. INTRODUCTION
The six sigma method is a project-driven management approach to improve the organization‘s products, services, and processes
by continually reducing defects in the organization. It is a business strategy that focuses on improving customer requirements
understanding, business systems, productivity, and financial performance. Dating back to the mid 1980s, applications of the six
sigma methods allowed many organizations to sustain their competitive advantage by integrating their knowledge of the process
with statistics, engineering, and project management.
The six sigma approach was first applied in manufacturing operations and rapidly expanded to different functional areas such as
marketing, engineering, purchasing, servicing, and administrative support, once organizations realized the benefits. Particularly,
the widespread applications of six-sigma were possible due to the fact that organizations were able to articulate the benefits of
six-sigma presented in financial returns by linking process improvement with cost savings.
Statistical viewpoint
Six sigma methods have two major perspectives. The origin of six-sigma comes from statistics and statisticians. From the
statistical point of view, the term six sigma is defined as having less than 3.4 defects per million opportunities or a success rate of
99.9997% where sigma is a term used to represent the variation about the process average. If an organization is operating at three
sigma levels for quality control, this is interpreted as achieving a success rate of 93% or 66,800 defects per million opportunities.
Therefore, the six sigma method is a very rigorous quality control concept where many organizations still performs at three sigma
level.
Business viewpoint
In the business world, six-sigma is defined as a ‗business strategy used to improve business profitability, to improve the
effectiveness and efficiency of all operations to meet or exceed customer‘s needs and expectations.
Definition of Six-Sigma
Six-Sigma is a statistic quantity about performance of products or service. Sigma, transliteration of Greek letter σ, means standard
deviation in Statistics and reflects the degree of deviation. In the process of production or management, Six Sigma is used to
describe quality fluctuation and indicates the amount of data that is within the extension of quality demands and customer needs.
From the view of statistics, Six-Sigma means Six-time standard deviation between the average and the lower or upper limit; in the
meanwhile, the fluctuation is reduced and only 3.4 defective parts per million opportunities (namely 3.4 ppm) is produced.
Therefore, the larger the σ is, the more disperse the data is; and the smaller the σ is, the more centralized the data is. Six-Sigma
Management measures performance using ―σ yardstick‖, and the smaller the σ is, the higher the quality is. We usually use the
following formula to express the value of

Application of SIX-SIGMA In Four Wheeler Platform Truck With Quality Tools and Techniques
IJEDR1401022 International Journal of Engineering Development and Research ( www.ijedr.org) 127
Figure 1: - Standard Deviation
Xi- observation data of samples
X- Average level of samples.
n- Capability of samples.
II. METHODOLOGY
Six sigma process
Six sigma strategies, tools, techniques, and principles are a systematic, data-driven approach using define, measure, analysis,
improve, and control (DMAIC) process.
DMAIC is a closed-loop process that eliminates unproductive steps, often focuses on new measurements, and applies technology
for continuous improvement.
DMAIC – Defining, Measuring, Analysis, Improving and controlling which is the general way of Six-Sigma implementation.
Define: Find out problems establish improved target and make plans for programs.
Measure: Quality the customers‘ CTQ, collect the data, and know about the current quality level.
Analyze: Analyze data and find out the vital factors affecting quality.
Improve: Establish the best method to improve quality based on the vital factors.
Control: Take measures to keep the improved results.
DMAIC begins with investigating and understanding the customers‘ needs, and then finding out the factors which affect the key
products or services and improving the quality. DMAIC is the key to application of Six Sigma.
III. Quality Management Tools & Methods Used In Six-Sigma

Application of SIX-SIGMA In Four Wheeler Platform Truck With Quality Tools and Techniques
IJEDR1401022 International Journal of Engineering Development and Research ( www.ijedr.org) 128
1. Process Mapping
2. Cause & effect diagram.
3. Control chart.
4. Cost-Benefit Analysis.
5. CTQ tree.
6. Histograms.
7. Quality Function Development.
8. Pareto Chart.
9. Process capability.
10. Regeneration analysis.
11. Root cause analysis.
12. SIPOC analysis. (Supplier, Input, Process, Output, Customers.)
Terms and definitions: -
Project charter:
The project charter is a document that evolves over the course of a Six Sigma project. It names the project, lists the people
involved and delineates the responsibilities of each, identifies the project objectives, links them to the organization‘s strategic
goals, and establishes the reasons for the project. The charter has its roots in your project-selection efforts. The project and
objective statements you created in Chapter 5 represent the early stages of your project charter. Essentially, the charter documents
a Six Sigma project and provides all relevant information about it. Anyone who reads this document should be able to understand
all of the elements of a project. Choose a descriptive title: it should make the subject and purpose of your project immediately
recognizable.
Cause-and-effect diagram
CE is a tool to solve problems through finding the cause of their occurrence. It helps to find all possible causes, to split causes
into categories and organize their relationships and impact on output, and to identify opportunities for improvement. In general,
these categories are commonly known as 7M causes:
• Man - people, job;
• Methods and mechanics, process;
• Machine – machines, equipment;
• Measurement;
• Management - system of organization and management;
• Material;
• Mother Nature - Environment.
Figure 2 is a more detailed analysis of each factor gives a diagram that resembles a fish bone as seen in
Figure 2: -
Fish-bone Diagram (Cause and effect diagram)
SIPOC` A SIPOC diagram helps us understand what is upstream and downstream from our process. The elements of the diagram are: the
Suppliers (S) to our process and their Inputs (I), our Process (P), and the Outputs (O) we provide to our process‘s Customers (C).
A SIPOC can be drawn quickly and can help us better understand the context of our process and explain it to others.
Check sheet
A Check sheet is a tally sheet that is used to collect data. It is a simple manual method that operators can use with a minimum of
instruction

Application of SIX-SIGMA In Four Wheeler Platform Truck With Quality Tools and Techniques
IJEDR1401022 International Journal of Engineering Development and Research ( www.ijedr.org) 129
Pareto chart
Pareto diagrams are special types of histograms. The bars in pareto diagrams are rearranged in descending order of their heights,
showing individual contribution of each factor as well as cumulative contributions. The purpose of pareto diagram is to identify
high priority items separating the vital few from the trivial many or as they known as useful many.
Standard Sigma level chart: -
Sigma level DPMO Percentage defective
1 691,462 69%
2 308,538 31%
3 66,807 6.7%
4 6,210 0.62%
5 233 0.023%
6 3.4 0.00034%
Table 1: - Sigma levels
IV. CASE STUDY
Quality Improvement in Four Wheeler Platform Trucks (Moving Towards ZERO DEFECTS)
Product: - Four Wheeler Platform Truck.
PURPOSE: -
To improve the work and quality level within a company and at customers level in given schedule time at minimum expenses
with maximum operational feasibility.
SCOPE: -
This project applies to all departments that are currently participating in the company. Specifically quality and service
departments for development of six sigma standard.
This project also improves the quality of the product within six sigma level for customer‘s satisfaction and for the growth of
company.
ANALYSIS: - 1. Analysis of major quality issues during warranty period.

Application of SIX-SIGMA In Four Wheeler Platform Truck With Quality Tools and Techniques
IJEDR1401022 International Journal of Engineering Development and Research ( www.ijedr.org) 130
2. Root cause analysis using QA techniques.
3. Corrective solutions for the root cause.
4. Feedback on implementation.
5. Study and improvement of processes for six-sigma level.
Need of Study: -
The problem and scope for work effort of the project. The description of the problem should include the pain felt by the customer
and/or business as well as how long the issue has existed. Hence, identify the customer(s), the project goals, and timeframe for
completion.
The appropriate types of problems have unlimited scope and scale, from employee problems to issues with the production process
or advertising. Regardless of the type of problem, it should be systemic part of an existing, steady-state process where in the
problem not a one-time event is, but has caused pain for a couple of cycles
Define customers and their requirements.
Define project boundaries (project scope).
Create a Process Map (e.g., flow chart) of the process to be improved.
Identify project support people (operators, engineers, supervisors, finance)
PROBLEM STATEMENT
After detail study and as per available data I have got current sigma level calculation.
Now final aim is to increase the level of quality for each four wheeler platform truck for the customer‘s satisfaction with
improvement of six-sigma level as a reduction in cost and process time.
For better quality of trucks, I am trying to nullify all possible problems which are directly or indirectly affect the quality of
product with every possible changes and modifications in design and in SOP.
Final aim is to nullify all present complaints from final inspection and all complaints from customers end per sample which
directly increase sigma level of the product and company.
Application of SIX-SIGMA standards
Source of data:-
Total Quality Department- Complaints received from final inspection.
Service Department- Complaints received from customers end.
Period of review: -
Quality Dept.: - Jan 2013 to Sep 2013.
Service Dept.: - Jan 2013 to Sep 2013.
Summary: - Total Trucks = 264
Sr. No. CATEGORY No. Of Problems
1 Brake and hand brake 286
2 Differential & Gearbox- Oil Leakage 170
3 Rear axle shaft 116
4 Fuse terminal & F/R switch 97
5 Steering 89
TOTAL = 858
Table 2: - Data Table
Pareto chart:-
Sr. No. Category No. Of Problems Cumulative
frequency
% cumulative
frequency
Application of SIX-SIGMA In Four Wheeler Platform Truck With Quality Tools and Techniques
IJEDR1401022 International Journal of Engineering Development and Research ( www.ijedr.org) 131
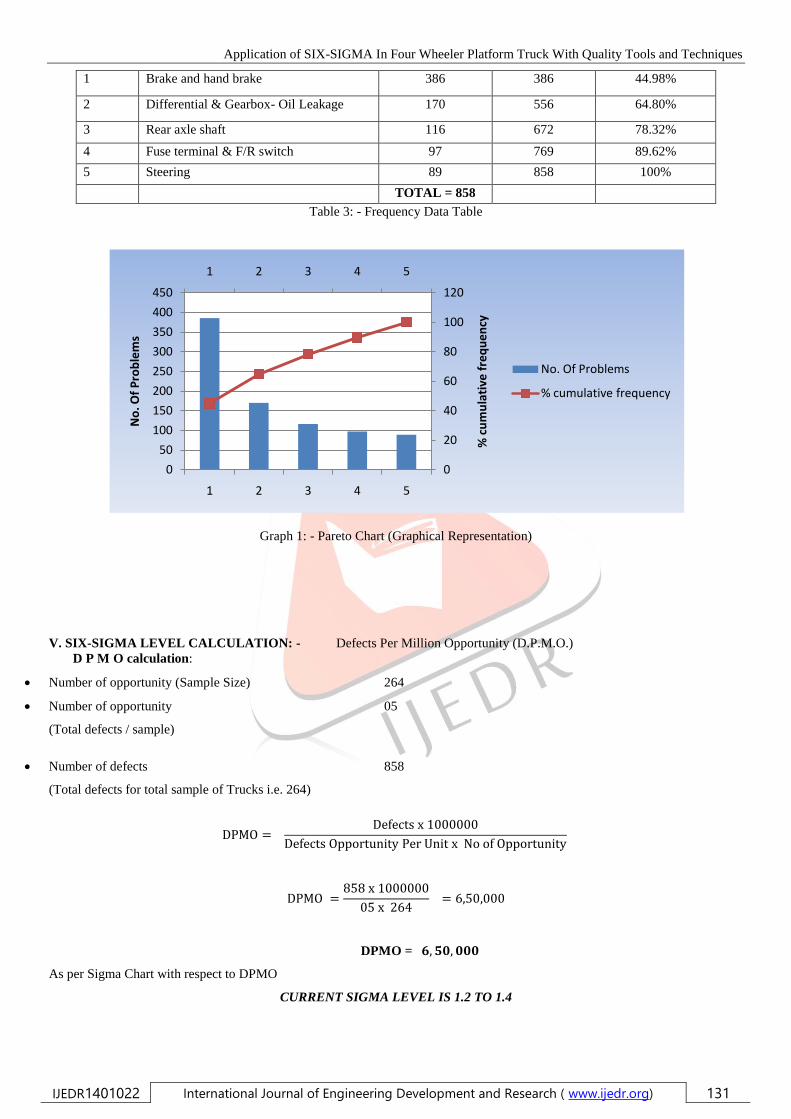
1 Brake and hand brake 386 386 44.98%
2 Differential & Gearbox- Oil Leakage 170 556 64.80%
3 Rear axle shaft 116 672 78.32%
4 Fuse terminal & F/R switch 97 769 89.62%
5 Steering 89 858 100%
TOTAL = 858
Table 3: - Frequency Data Table
Graph 1: - Pareto Chart (Graphical Representation)
V. SIX-SIGMA LEVEL CALCULATION: - Defects Per Million Opportunity (D.P.M.O.)
D P M O calculation:
Number of opportunity (Sample Size) 264
Number of opportunity 05
(Total defects / sample)
Number of defects 858
(Total defects for total sample of Trucks i.e. 264)
DPMO = Defects x 1000000
Defects Opportunity Per Unit x No of Opportunity
DPMO =858 x 1000000
05 x 264 = 6,50,000
DPMO = 𝟔,𝟓𝟎,𝟎𝟎𝟎
As per Sigma Chart with respect to DPMO
CURRENT SIGMA LEVEL IS 1.2 TO 1.4
1 2 3 4 5
0
20
40
60
80
100
120
0
50
100
150
200
250
300
350
400
450
1 2 3 4 5%
cu
mu
lati
ve f
req
ue
ncy
No
. Of
Pro
ble
ms
No. Of Problems
% cumulative frequency

Application of SIX-SIGMA In Four Wheeler Platform Truck With Quality Tools and Techniques
IJEDR1401022 International Journal of Engineering Development and Research ( www.ijedr.org) 132
VI. RESULT & DISCUSSION
Problems, Root Causes and Its Solutions: -
1) Brakes: -
Total No. Of complaints: - 222 + 94 + 36 out of 264 Trucks.
2) O
il
Leaka
ge:-
a)
Gearb
ox: -
b)
Differe
ntial: -
Total No. Of complaints: - 170 out of 264 Trucks.
Problems
1. 1. Oil leakage from drain plug.
2. 2. Oil leakage from two gearbox casing.
3. 3. Oil leakage from threading of bolts.
4. 4. Less / Excess oil.
Root Causes
1. 1. Uneven facing.
2. 2. Improper threading of bolts.
3. 3. No gasket provision.
4. 4. Loose tightening of drain plug.
5. 5. Loose tightening of nut and bolts.
6. 6. No oil measuring instrument.
Corrective actions
1. 1. Facing of two meeting surfaces should be proper.
2. 2. Provide Gasket in between two meeting surfaces.
3. 3. Use CELLAC solution with gasket.
4. 4. Use of Lock-tight solution for drain plug.
5. 5. Teflon tape should be use for drain plug.
6. 6. Oil should be fill as per measured quantity, For Gearbox- 450 ml & for Differential – 1250 ml.
3) Rear Axle Shaft:-
Total No. Of complaints: - 116 out of 264 Trucks.
Problems 1. 1. Key comes out.
2. 2. Shaft damage.
Root Causes
1. 1. Key way depth is small / large.
2. 2. Key size is not as per key way depth.
3. 3. Key hole on brake drum is smaller / bigger.
4. 4. Key material is not good.
Corrective Actions
1. 1. Use of three different sizes of key as per key way size.
2. 2. Sample inspection of keys as per drawing.
3. 3. Proper assembly of key on key way with press fitting.
4) Electrical Department: -
Total No. Of complaints: - 97 out of 264 Trucks.
Problems
1. 1. Short life of F/R switch.
2. 2. Loose Fuse terminal.
3. 3. Loose head light wiring.
Problems
1. 1. Brake shoe liner crack.
2. 2. Brake light continuously on.
3. 3. Brake Noise after brake pedal released.
4. 4. Oil leakage from 3-way junction.
5. 5. Improper assembly of Service and parking brake.
Root Causes
1. 1. Poor quality of liner material.
2. 2. Thickness of liner is not standardised.
3. 3. Variation in Brake plate and brake drum alignment.
4. 4. Difference in inner diameter of brake drum and outer diameter brake plate.
5. 5. Ferruling problem in 3 way junction.
Corrective actions
1. 1. Use brake shoe liner of ASBESTOS MATERIAL as per standard brake plate.
2. 2. Procure Brake plate and Brake drum as a one unit
3. 3. New braking system for service and parking brakes individually.
4. 4. Use all brake plates and brake drums of 11 inch for all four wheels.
5. 5. Use hydraulic braking system for service brake.
6. 6. Mechanical brake (Wire braking) arrangement for parking brake.
7. 7. Use limit switch arrangement for brake lights.
Application of SIX-SIGMA In Four Wheeler Platform Truck With Quality Tools and Techniques
IJEDR1401022 International Journal of Engineering Development and Research ( www.ijedr.org) 133
4. 4. Battery discharge buzzer open.
Root causes
1. 1. Bad quality of F/R switch.
2. 2. Rough handling of switch over its cycle of rotation.
3. 3. Fuse terminal pins are loose.
4. 4. No screw arrangements on fuse terminal.
5. 5. Loose wiring.
6. 6. Not proper routing of wires.
7. 7. Random wiring assembly.
8. 8. Buzzer body gets open.
9. 9. High vibrations.
Corrective Actions
1. 1. Provide two way switches.
2. 2. Fix cycle of operation.
3. 3. Use screw tightening for fuse terminals.
4. 4. Proper screw arrangements on fuse terminal on control panel.
5. 5. Routing of wires with standard process.
6. 6. Avoid random assembly of wires.
7. 7. Provide electric tape on buzzer body.
5) Steering: -
Total No. Of complaints: - 89 out of 264 Trucks.
Problems
1. 1. Hard Steering
2. 2. Play in steering rod.
3. 3. Steering lock.
Root Causes 1. 1. No Universal joint for steering rod.
2. 2. Problem with new design of steering assembly.
3. 3. Threads of steering rod & wheel are not matching (Serration).
4. 4. Crowning is not available on steering gears.
Corrective Actions 1. 5. Provide one universal joint in between steering rod and gears
2. 6. Crowning and serration on teeth of the gears.
3. 7. Threads should be properly matched during incoming inspection.
4. 8. Assembly of new design as per standard procedure.
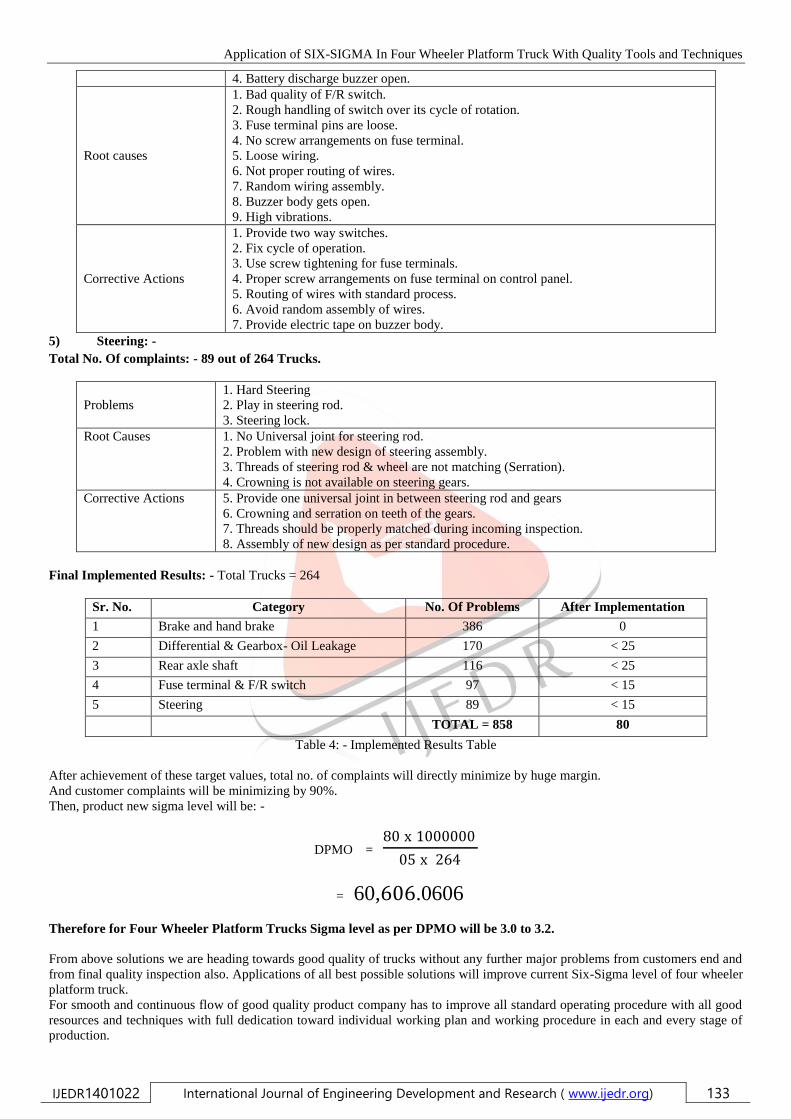
Final Implemented Results: - Total Trucks = 264
Sr. No. Category No. Of Problems After Implementation
1 Brake and hand brake 386 0
2 Differential & Gearbox- Oil Leakage 170 < 25
3 Rear axle shaft 116 < 25
4 Fuse terminal & F/R switch 97 < 15
5 Steering 89 < 15
TOTAL = 858 80
Table 4: - Implemented Results Table
After achievement of these target values, total no. of complaints will directly minimize by huge margin.
And customer complaints will be minimizing by 90%.
Then, product new sigma level will be: -
DPMO = 80 x 1000000
05 x 264
= 60,606.0606
Therefore for Four Wheeler Platform Trucks Sigma level as per DPMO will be 3.0 to 3.2.
From above solutions we are heading towards good quality of trucks without any further major problems from customers end and
from final quality inspection also. Applications of all best possible solutions will improve current Six-Sigma level of four wheeler
platform truck.
For smooth and continuous flow of good quality product company has to improve all standard operating procedure with all good
resources and techniques with full dedication toward individual working plan and working procedure in each and every stage of
production.

Application of SIX-SIGMA In Four Wheeler Platform Truck With Quality Tools and Techniques
IJEDR1401022 International Journal of Engineering Development and Research ( www.ijedr.org) 134
With implementation of all new and current solutions in final check sheets will increase the way of inspection and process of
operations.
Prepared three new check sheets with all improved solutions:
1. Check list for Incoming Inspection
2. New Production Check list.
3. Final inspection Check list.
Prepared a new SOP for further production of Four Wheeler Platform Trucks.
FINAL OUTPUT – Improved Sigma level is from 1.6 to 3.2
VII. CONCLUSIONS
1- Six-sigma is a business improvement approach that seeks to find and eliminate causes of mistakes or defects in business
processes by focusing on outputs that are of critical importance to customers.
2- The four phase improvement process; define, measure, analyze, improve, control (DMAIC).
3- Six-sigma has both management and technical components.
4- Six-sigma is designed to dramatically upgrade an organizations performance, improving quality and productivity.
5- The program of six sigma and productivity is designed for quality service managers and administratively/ professional staff,
who are seeking to learn and apply six sigma language and concept at their respective work places and increasing their
productivity.
6- Direct and positive relation is between six sigma and productivity.
7- It works and it can be important to both the success of your organization and your career. Six Sigma is arguably the most
important business and industry initiative that has involved statistical thinking and methods.
8- "Good things don't come easy". This is certainly the case for Six Sigma.
VIII. REFERENCES
[1] Antony, J. and Banuelas, R. (2002), ―Critical success factors for the successful implementation of six sigma projects‖, The
TQM Magazine, Vol. 14 No. 2, pp. 92-99.
[2] Deleryd, M., Garvare, R. and Klefsjo, B. (1999), ―Experiences of implementing statistical methods in small enterprises‖, The
TQM Magazine, Vol. 11, No. 5.
[3] Deshmukh, S.V. and Lakhe, R.R. (2009), ―An innovative model of Six Sigma for SMEs: the T-DMAIC model‖, International
Journal of Six Sigma and Competitive Advantage, Vol. 5, No. 2, pp. 187-203.
[4] Deshmukh S.V. and Lakhe R.R. (2010), ―Six Sigma Awareness in Central Indian SMEs‖ paper published in the,
International Journal of Productivity and Quality Management, Vol. 5, No. 2, pp- 200-212.
[5] Lakshmikanthan, P.R. (2002), ―Statistical Techniques in Six Sigma‖, Productivity, Vol. 43, No. 2, pp. 188-191.
[6] Pande, P.S., Neuman, R.P. and Cavanagh, R.R. (2000), ―The Six Sigma Way‖, McGraw-Hill, New York.
[7] Mahajan, M. (2003), ―Statistical Quality Control‖, Dhanpat Rai and Co., Delhi
Top Related