


Languages
Pages
Legal


Apple Inc.
Sheila Jung
Eric Kao
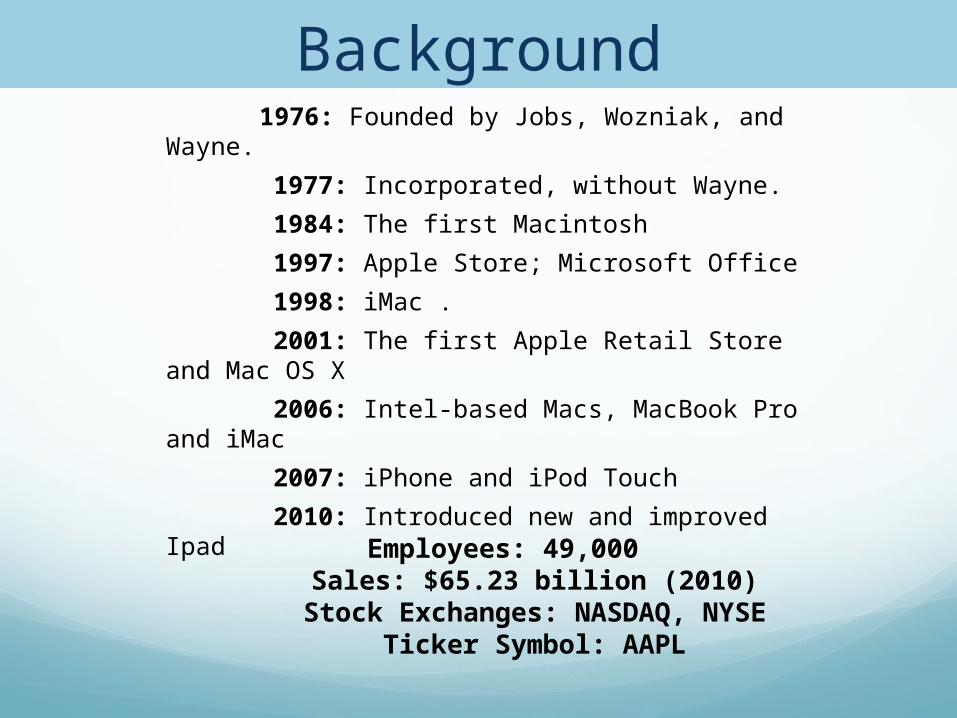
1976: Founded by Jobs, Wozniak, and Wayne.
1977: Incorporated, without Wayne.
1984: The first Macintosh
1997: Apple Store; Microsoft Office
1998: iMac .
2001: The first Apple Retail Store and Mac OS X
2006: Intel-based Macs, MacBook Pro and iMac
2007: iPhone and iPod Touch
2010: Introduced new and improved Ipad
Employees: 49,000 Sales: $65.23 billion (2010)
Stock Exchanges: NASDAQ, NYSE Ticker Symbol: AAPL
Background

COO: Tim Cook• Previous VP of
Corporate Material at Compaq• Reduced
inventory levels and streamlined supply chain, increasing margins• Acted as CEO
when Steve Jobs took leaves of absences
CFO: Peter Oppenheimer
• Previous CFO of ADP and IT Consultant at PwC
Steve Jobs: Co-Founder and CEO• Emphasizes Design and Aesthetic Appeal• Awarded over 230 patents or Patent
Applications • Previous CEO of Pixar Animation Studios and
Current Board Member of Walt Disney Company
Management

Strengths Innovative Brand, Aesthetic, Design Marketing and Accessibility Product Development Steve Jobs
Weaknesses Business Practices Expensive Product Defects and
Complaints Not Share-Holder Friendly Steve Jobs
Opportunities Advancement in Technology Improvement in Technology Rapid Changing Industry and
Response to Client Feedback Brand Loyalty Market Diversification and
Online Presence
Threats Competition High Priced Products Economic Crisis Product Substitution Effect Copycat Effect
SWOT Analysis

Apple Quantitative Analysis

Apple Qualitative Analysis

Apple Technical Analysis
One Year Range

Apple Horizontal Analysis
2010 2009 2008 2007 20060.00
10,000.00
20,000.00
30,000.00
40,000.00
50,000.00
60,000.00
70,000.0065,225.00
42,905.00
37,491.00
24,578.00
19,315.00
14,013.00
8,235.006,119.00
3,495.00 1,989.00
Apple Horizontal Analysisin Millions of $
Total Revenue
Gross Profit
Net Income
2010 2009 2008 2007 2006Total Revenue 65,225.00 42,905.00 37,491.00 24,578.00 19,315.00Gross Profit 25,684.00 17,222.00 13,197.00 8,152.00 5,598.00Net Income 14,013.00 8,235.00 6,119.00 3,495.00 1,989.00
2010 2009 2008 2007 20060.00
5,000.00
10,000.00
15,000.00
20,000.00
25,000.00
30,000.00
35,000.00
40,000.00
45,000.0039,541.00
25,683.0024,294.00
16,426.0013,717.00
Apple Total Cost of Revenue
in Millions of $

Apple Vertical Analysis
2010 2009 20080
10,000,000
20,000,000
30,000,000
40,000,000
50,000,000
60,000,000
70,000,000
80,000,00075,183,000
47,501,000
39,572,000
47,791,000
31,640,000
21,030,000
Apple Total Assets/Liabilities/EquityTotal Assets Total Liabilities Total Stockholder Equity
2010 2009 2008
Total Assets 75,183,000 47,501,000 39,572,000
Total Liabilities 27,392,000 15,861,000 18,542,000
Total Stockholder Equity 47,791,000 31,640,000 21,030,000

Emily ZhangJuan Carlos

Background1984: Founded, 26 years ago
1987: Started International Operation
1988: Public on NASDAQ
1988: 3.5 Million shares; $8.5 per share
2011: 6.15 Million shares; $15.73 per share
1991: First Notebook
1996: Initiated Internet Operation
2011:No.38 on the Fortune 500 (2011)
Principle operating Units:
Dell Americas, Dell Europe;
Dell Asia Pacific –Japan;
Middle East and Africa.
1992 Dell Precision 386SX/25, Sale Price: $1,295
Current Employees:
Dell: 100,300
Apple: 49,000
HP: 324,600
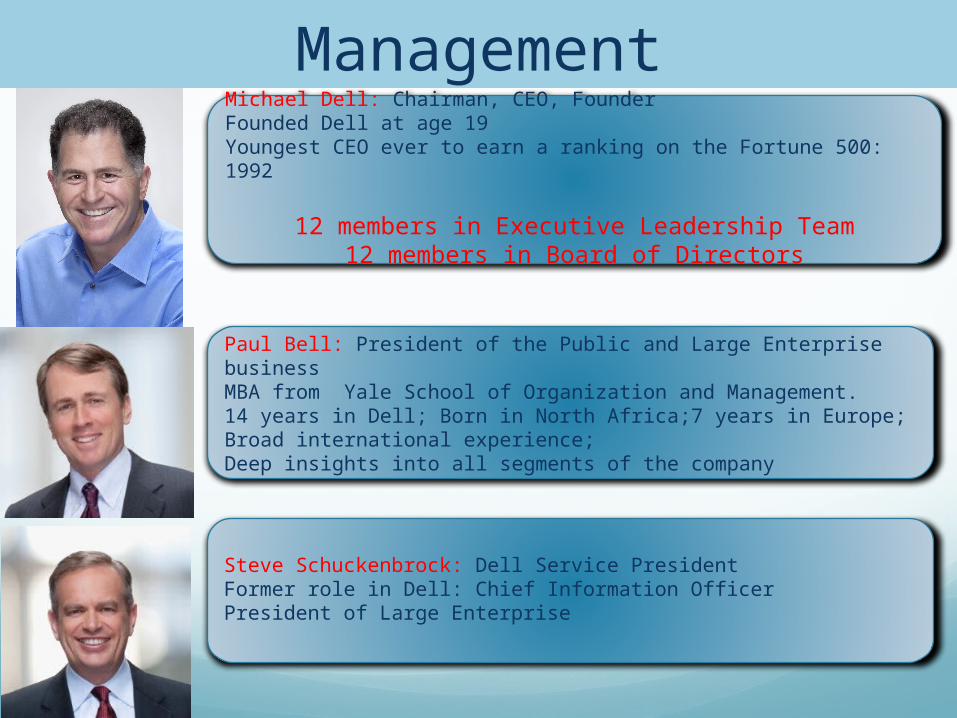
ManagementMichael Dell: Chairman, CEO, FounderFounded Dell at age 19Youngest CEO ever to earn a ranking on the Fortune 500: 1992
12 members in Executive Leadership Team 12 members in Board of Directors
Paul Bell: President of the Public and Large Enterprise business MBA from Yale School of Organization and Management. 14 years in Dell; Born in North Africa;7 years in Europe;Broad international experience;Deep insights into all segments of the company
Steve Schuckenbrock: Dell Service PresidentFormer role in Dell: Chief Information OfficerPresident of Large Enterprise

Strengths• Customization• Diversified Products• Business operation• Customer service
Weaknesses• Labor-intensive Assembling• Risks for quality
management• Inflexible supply Chain
Opportunities• Customer service• Cohesion between
departments• More customization
Threats• Not standing out from the
rest• Not keeping up with
technology changes• Competitors producing at
low cost
SWOT Analysis

Quantitative AnalysisStock Activity
Last Price 16.01
52-Wk High 16.45
52-Wk Low 11.34
Volume 29.44 MilAvg Daily Vol (13 Wks) 23.63 Mil50-Day Moving Average 15.06200-Day Moving Average 13.86
Volatility (beta) 1.42
Fundamental Data
Debt/Equity Ratio 0.77
Gross Margin 18.53%
Net Profit Margin 4.28%
Shares Outstanding 1.91 Bil
Market Cap 30.2 Bil
EPS 1.35Institutional Ownership 70.50%

Qualitative Analysis
6 Design Centers located mainly in U.S. Singapore, Mainland China, Taiwan.Transformation on the way: Data Center!
Business will be centered on services and the bigger gear used in data centers — server computers, storage and networking equipment.
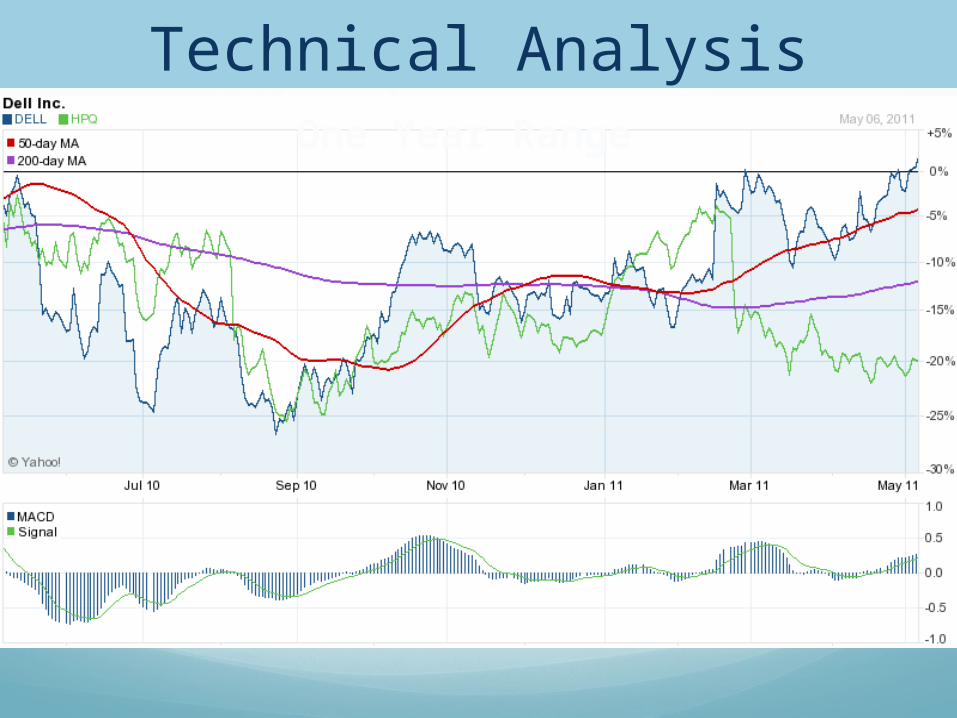
Technical AnalysisOne Year Range
Dell Horizontal Analysis
2011 2010 2009 2008 20070.00
10,000.00
20,000.00
30,000.00
40,000.00
50,000.00
60,000.00
70,000.0061,494.00
52,902.00
61,101.00 61,133.0057,420.00
2,635.00 1,433.00 2,478.00 2,947.00 2,583.00
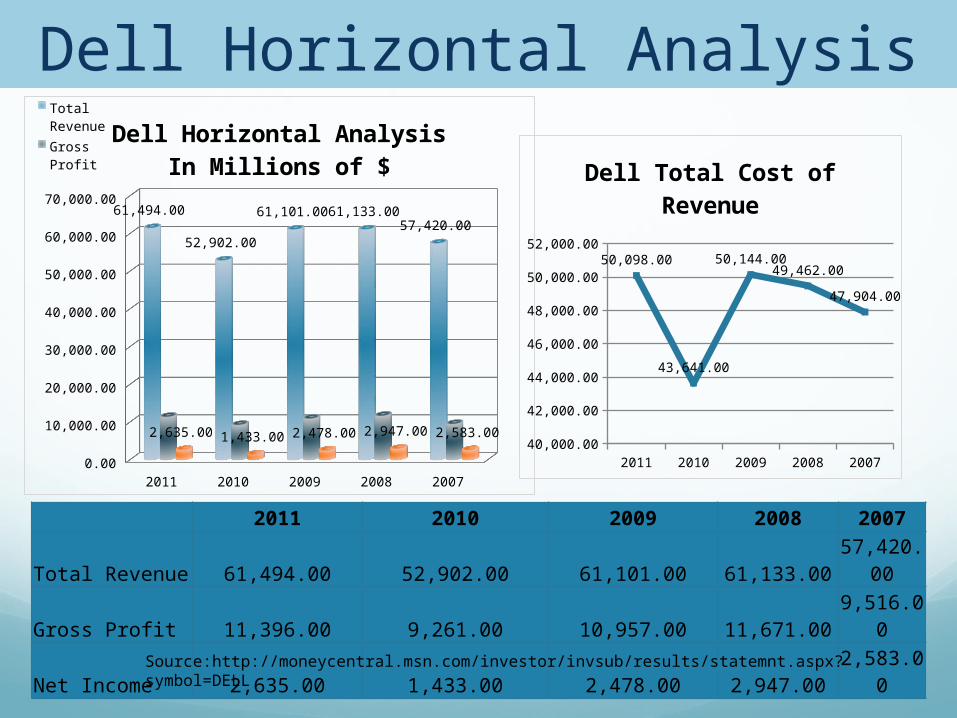
Dell Horizontal AnalysisIn Millions of $
Total Revenue
Gross Profit
2011 2010 2009 2008 2007Total Revenue 61,494.00 52,902.00 61,101.00 61,133.00 57,420.00Gross Profit 11,396.00 9,261.00 10,957.00 11,671.00 9,516.00Net Income 2,635.00 1,433.00 2,478.00 2,947.00 2,583.00
Source:http://moneycentral.msn.com/investor/invsub/results/statemnt.aspx?symbol=DELL
2011 2010 2009 2008 200740,000.00
42,000.00
44,000.00
46,000.00
48,000.00
50,000.00
52,000.00
50,098.00
43,641.00
50,144.0049,462.00
47,904.00
Dell Total Cost of Revenue

Dell Vertical Analysis
2011 2010 2009 2008 20070.00
5,000.00
10,000.00
15,000.00
20,000.00
25,000.00
30,000.00
35,000.00
40,000.0038,599.00
33,652.00
26,500.00 27,561.0025,635.00
7,766.005,641.00
4,271.00 3,829.00 4,439.00
Dell Total Assets/Liabilities/Euityin Millions of $
Total AssetsTotal LiabilitiesTotal Equity
2011 2010 2009 2008 2007
Total Assets 38,599.00 33,652.00 26,500.00 27,561.00 25,635.00
Total Liabilities 30,833.00 28,011.00 22,229.00 23,732.00 21,196.00
Total Equity 7,766.00 5,641.00 4,271.00 3,829.00 4,439.00
Source: http://moneycentral.msn.com/investor/invsub/results/statemnt.aspx?lstStatement=Balance&symbol=US%3aDELL&stmtView=Ann
Leanne ChouQueenie He
YoYo Li

1939: HP was founded by Bill Hewlett and Dave Packard
1947: HP incorporated with Revenue – 851,287 and 111 employees
1957: HP goes public and employees receive stock
1959 : HP enters European market
1963 : HP enters the Asian market
1966: HP invents its 1st computer- HP 2116A
1980: HP’s 1st PC
1981: HP moves to China
1983: HP introduces Touch screen PC
2002: HP and Compaq merge
2006: HP acquires Mercury Interactive Corp.
2008: HP acquires Electronic Data Systems Corporation (EDS)
Background

Léo Apotheker: President & CEO Main focuses for H.P.: innovation, employee engagement, and operational
efficiency Former CEO of SAP Founded & COO of ECsoft BV Held various leadership positions in: ABP Partners, McCormack & Dodge
Europe, S.W.I.F.T. and Altex GmbH.
Management
Randall D. Mott: VP & CIO responsible for the global information technology (IT)
strategy and all of the company's IT assets Former VP and CIO for Dell Inc. & Wal-Mart
Catherine A. Lesjak: VP & CFO Served as CFO since Jan 1, 2007 Served as interim chief executive officer of HP from Aug 2010
to Oct 2010 Was previously HP’s senior vice president and treasurer
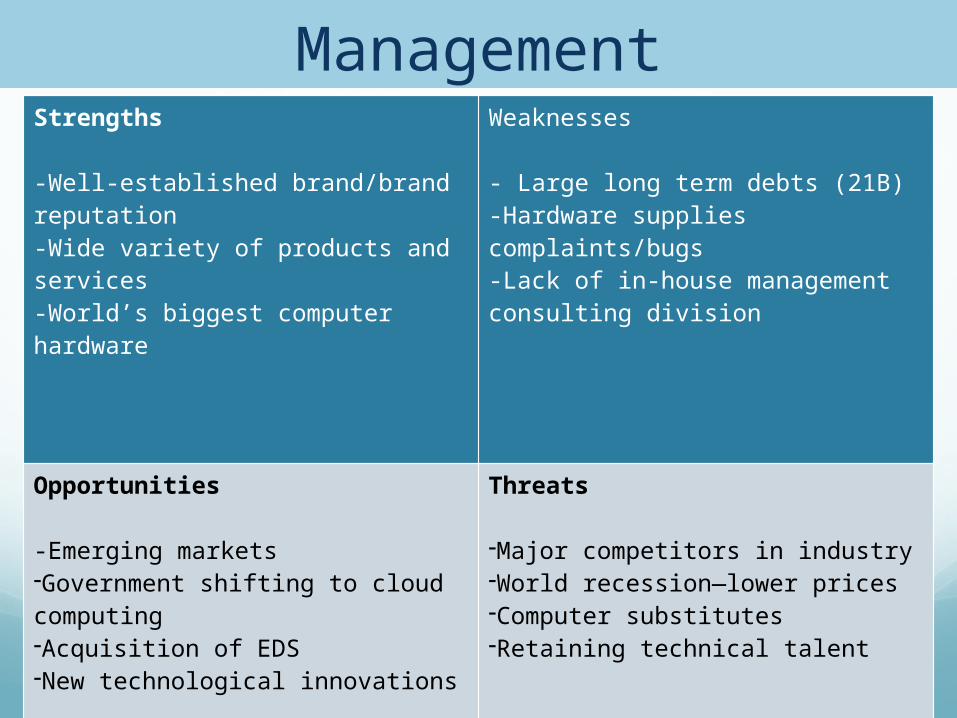
Strengths
-Well-established brand/brand reputation-Wide variety of products and services -World’s biggest computer hardware
Weaknesses
- Large long term debts (21B)-Hardware supplies complaints/bugs-Lack of in-house management consulting division
Opportunities
-Emerging markets-Government shifting to cloud computing-Acquisition of EDS-New technological innovations
Threats
-Major competitors in industry-World recession—lower prices-Computer substitutes -Retaining technical talent
Management
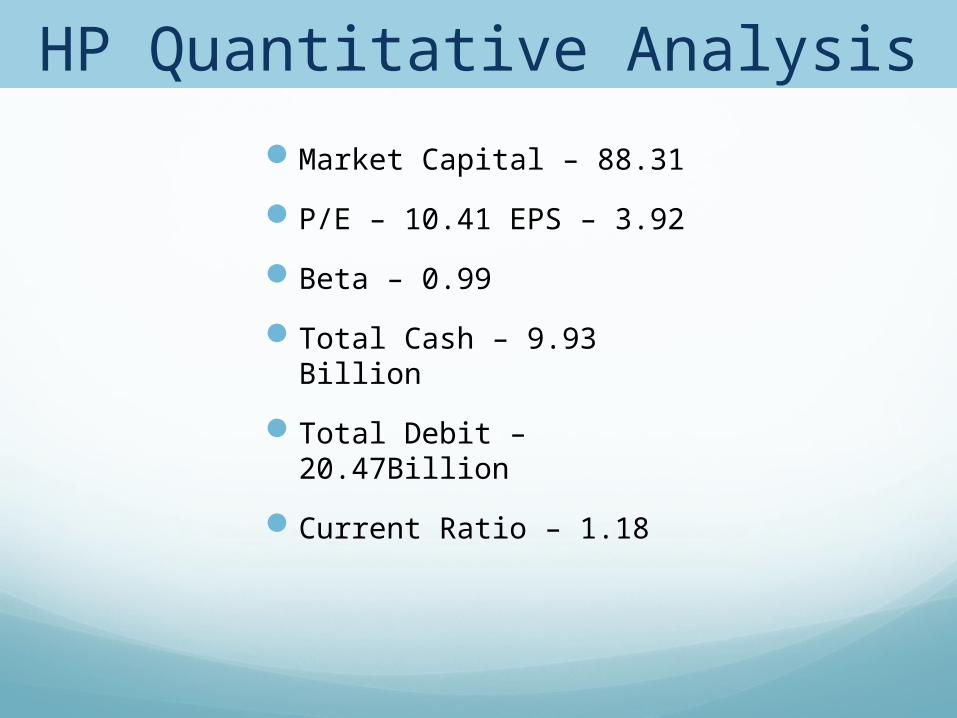
Market Capital – 88.31
P/E – 10.41 EPS – 3.92
Beta – 0.99
Total Cash – 9.93 Billion
Total Debit – 20.47Billion
Current Ratio – 1.18
HP Quantitative Analysis

Historical Prices Chart: Stock price: $40.99 Declining (As of May 6th, 2011)
Technical AnalysisOne Year Range

HP’s vice president of marketing is leavingHP feel pressure from IPad2Benefit From Government's Shift to Cloud
HP Qualitative Analysis
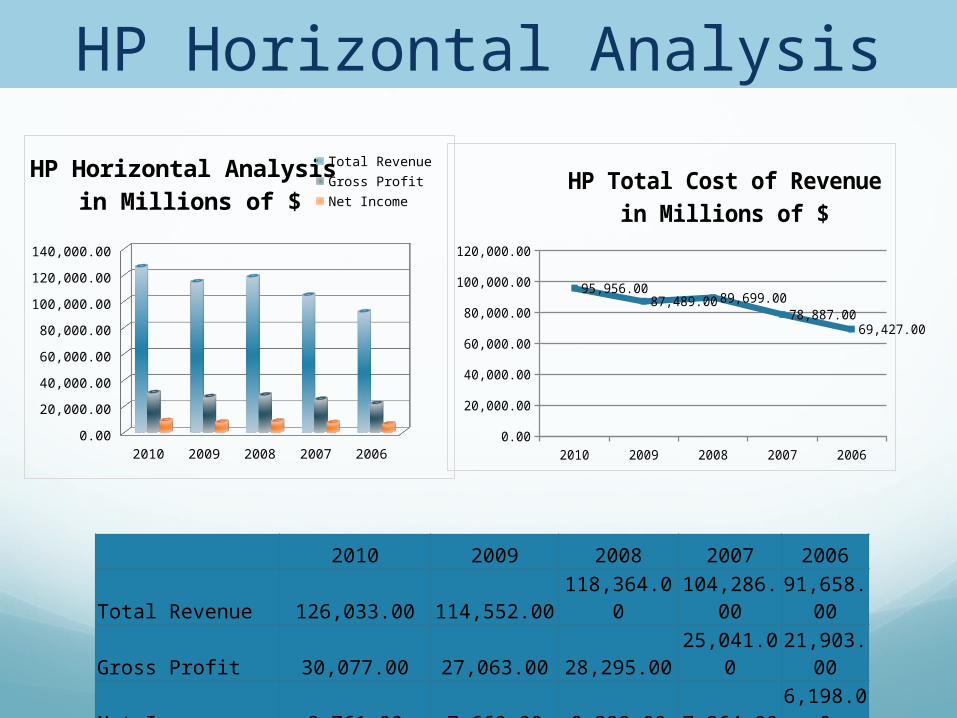
HP Horizontal Analysis
2010 2009 2008 2007 20060.00
20,000.00
40,000.00
60,000.00
80,000.00
100,000.00
120,000.00
140,000.00
HP Horizontal Analysis in Millions of $
Total RevenueGross ProfitNet Income
2010 2009 2008 2007 20060.00
20,000.00
40,000.00
60,000.00
80,000.00
100,000.00
120,000.00
95,956.0087,489.00 89,699.00
78,887.0069,427.00
HP Total Cost of Revenuein Millions of $
2010 2009 2008 2007 2006
Total Revenue 126,033.00 114,552.00 118,364.00 104,286.00 91,658.00
Gross Profit 30,077.00 27,063.00 28,295.00 25,041.00 21,903.00
Net Income 8,761.00 7,660.00 8,329.00 7,264.00 6,198.00
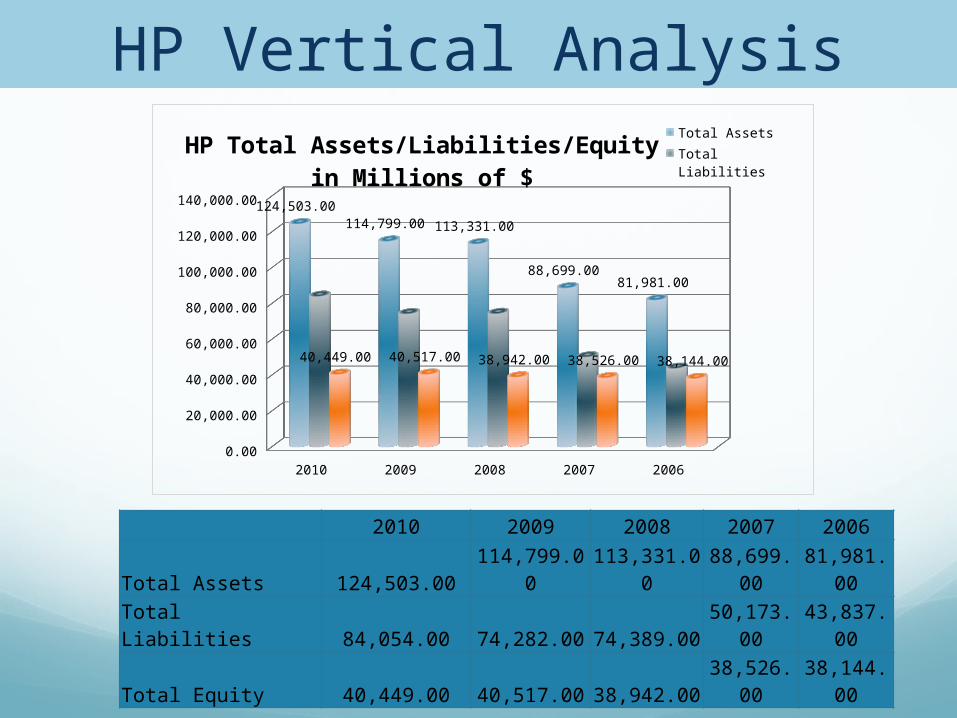
HP Vertical Analysis
2010 2009 2008 2007 20060.00
20,000.00
40,000.00
60,000.00
80,000.00
100,000.00
120,000.00
140,000.00 124,503.00114,799.00 113,331.00
88,699.0081,981.00
40,449.00 40,517.00 38,942.00 38,526.00 38,144.00
HP Total Assets/Liabilities/Equityin Millions of $
Total Assets
Total Liabilities
Total Equity
2010 2009 2008 2007 2006
Total Assets 124,503.00 114,799.00 113,331.00 88,699.00 81,981.00
Total Liabilities 84,054.00 74,282.00 74,389.00 50,173.00 43,837.00
Total Equity 40,449.00 40,517.00 38,942.00 38,526.00 38,144.00

Questions?
Thank You!
Top Related