


Languages
Pages
Legal


[Funded by the Sustainable Development Fund (SDF)]
Enhancing the Low Carbon
Competitive Advantage across the
Manufacturing Sector of the Hong
Kong Apparel Supply Chain
through Effective Carbon
Disclosure & Carbon Emission
Reduction (SDF425)
Apparel Supply Chain –Carbon
Assessment about Jeans Producing
[Completed By]
1
Table of Content
Introduction ........................................................................................ 2
Pilot report 1: Cotton Spinning ........................................................ 4
Pilot report 2: Cotton Yarn Dyeing .................................................. 9
Pilot report 3: Fabric Weaving and Finishing .............................. 14
Pilot report4: Garment Manufacturing ......................................... 19
Pilot report 5: Jeans Washing ......................................................... 24

2
Introduction
Fashionable and comfortable textiles and apparel products is playing
important role in our daily life. The textile and apparel industry contributes a
large share of raw materials and energy consumption in their manufacturing
locations. To launch this pilot study is a prerequisite for seeking the low carbon
manufacturing opportunities for the whole industry and answering the voice of
sustainable fashion from brands, consumers, NGOs and even the whole
public.
Pilot factories from the manufacturing sector of major cotton products have
been invited to this case study, that aim to help them build their low carbon
competitive advantages by identifying carbon emission reduction
opportunities.
Jeans is a typical cotton product produced by the local industry. This chapter
will demonstrate 5 pilot reports in jeans manufacturing supply chain, including
spinning, dyeing, weaving, finishing, garment manufacturing and washing.
Four internal carbon assessment tools were adopted to quantitatively
monitor the pilot factories’ GHG emissions levels and qualitatively position the
potential carbon reduction opportunities.

3
Figure 1 Internal carbon assessment tools for manufacturing sector
of Hong Kong Apparel Supply Chain.
NOTE Auxiliary production facilities are assisting equipment in production area such as air compressors,
lightings, electric fans and air-conditioners.
Average GHG emissions per unit product per month Tool 1
• To monitor the monthly fluctuation of the GHG emissions by unit products
• Key parameters: monthly GHG emissions, monthly total production
GHG emissions distribution by space Tool 2
• To compare the distribution of the GHG emissions by space.
• Key parameters: administrative facilities, production facilities (including auxiliary production facilities )
GHG emissions distribution by sub-process Tool 3
• To clarify the distribution of the GHG emissions by sub-process.
• Key parameters: manufacturing sub-process
GHG emissions distribution by emission source Tool 4
• To trace the distribution of the GHG emissions by emission source.
• Key parameters: emission source

4
Pilot report 1: Cotton Spinning
About Cotton Spinning
Spinning is the process to turn the fibers to yarns by means of series of
sub-processes, e.g. blowing, carding, drawing, roving, spinning, etc. This is a
very traditional textile manufacturing process, being greatly developed based
on the innovations of machine and technology. Different properties of fiber
require their special spinning systems. And even the same fiber, with various
requirements of yarn, manufacturers’ experience and machine, their sub
spinning processes would differ from one another.
Pilot factory introduction
This medium size spinning factory with about 30,000 spindles had been
invited to this pilot study. This factory mainly provides high-grade cotton yarns
for denim products. It works with its sister companies of yarn dyeing and fabric
weaving to constitute a vertical chain from fiber to fabric.
Process map
Figure 2 Process map of carded yarn spinning

5
Data collecting and analysis results
A set of data had been collected from the pilot factory. The important
results focused on time, space, sub-process and energy consumption source
are featured in Figure 3, 4, 5 and 6.
Figure 3 Average GHG emissions per pound per month (2011)
Figure 4 GHG emissions distribution by space (2011)
0.00
0.20
0.40
0.60
0.80
1.00
1.20
1.40
1 2 3 4 5 6 7 8 9 10 11 12
KgCO2e/lb
Month
Production Area 96.61%
Administrative Area
3.39%

6
Figure 5 GHG emissions distribution by sub-process (2011)
Figure 6 GHG emissions distribution by emission source (2011)
NOTE Auxiliary production facilities are assisting equipment in production area such as air compressors,
lightings, electric fans and air-conditioners.
NOTE Administration facilities are general office equipment in administrative area, such as lightings,
computers, electric fans and air-conditioners.
Blowing 8.92%
Carding 10.31%
1st Drawing 2.06%
2nd Drawing 3.49%
Roving 4.41%
Ring Spinning 48.11%
Winding 22.71%
Auxiliary Production Facilities 42.66%
Ring Spinning Machine 26.80%
Winding Machine 12.51%
Carding Machine 5.53%
Blowing Machine
4.75%
Administrative Facilities
2.91%
Drawing Machine 2.58%
Roving Machine 2.21%
Vehicle 0.06%

7
Discussion and carbon reduction opportunities
On the basis of results in Figure 3, 4, 5 and 6, further discussions have been
made to find out the opportunity for carbon reduction.
1. In Figure 3, the average GHG emission per pound of yarn per month of this
pilot factory in 2011 is showed. This emission figure calculated based on
two major factors, monthly GHG emission and monthly total production. It
indicates the overall stability of the GHG emissions per unit product of the
factory. The fluctuation in Figure 17 is considered acceptable due to the
good balance between monthly GHG emission and monthly total
production. The former comes from all the emission source of a factory,
such as administrative facilities and production facilities. The latter would
be affected by production order, production plan and production efficiency.
Each of the parameters indicates the carbon reduction opportunities.
2. In Figure 4, the GHG emissions from production area and administrative
area respectively cover about 97% and 3% of the total GHG emissions.
The majority energy consumptions are contributed to direct manufacturing
processes, and this indicates the use of the energy is efficient in this pilot
factory.
3. In Figure 5, ring spinning that consumed the most energy is the
sub-process occupies almost half of the total GHG emissions. Winding,
carding and blowing covers 40% in total. As electricity is the major source

8
of energy of the spinning process, the figure indicates that about 90% of the
energy was consumed by ring spinning, winding, carding and blowing
sub-process. The energy efficiency in these sub-processes will provide the
potential carbon reduction opportunity.
4. In Figure 6, important emission source can be highlighted. The two
machines that consumed the most energy are ring spinning machine and
winding machine, which reconfirms the results of Figure 19. The total
auxiliary production facilities, such as air compressor, lighting, electric fan
and air-conditioner, plays a very important role of energy consumption.
These auxiliary facilities are essential supporting equipment to ensure the
product quality and manufacture environment, and this indicate the
potential carbon reduction opportunity.
NOTE The above results and discussions are based on the data collected from the pilot factory in the
reporting year of 2011, which can only indicate the possibility in the given period and location.

9
Pilot report 2: Cotton Yarn Dyeing
About Cotton Yarn Dyeing
The denim yarn dyeing process is one that applies indigo dyes and sizing
chemicals to the warp with series of sub-processes.
Pilot factory introduction
This is a small and medium enterprise, with single intermediate products
of dyed warp for denim fabric in a three-story building. Although it is a dyeing
department of a textile company, this factory has independent manufacturing
space, entire manufacturing processes, raw materials and energy
consumption. In this pilot study, it is regarded as a factory conveying the
assessment of carbon footprint of yarn dyeing process.
Process map
Figure 7 Process map of yarn dyeing

10
Data collecting and analysis results
A set of data had been collected from the pilot factory. The important results
focused on time, space, sub-process and energy consumption source are
featured in Figure 8, 9, 10 and 11.
Figure 8 Average GHG emissions per yard per month (2011)
Figure 9 GHG emissions distribution by space (2011)
0.00
0.10
0.20
0.30
0.40
0.50
0.60
0.70
1 2 3 4 5 6 7 8 9 10 11 12
KgCO2e/yard
Month
Production Area 99.47%
Administrative Area
0.53%
11
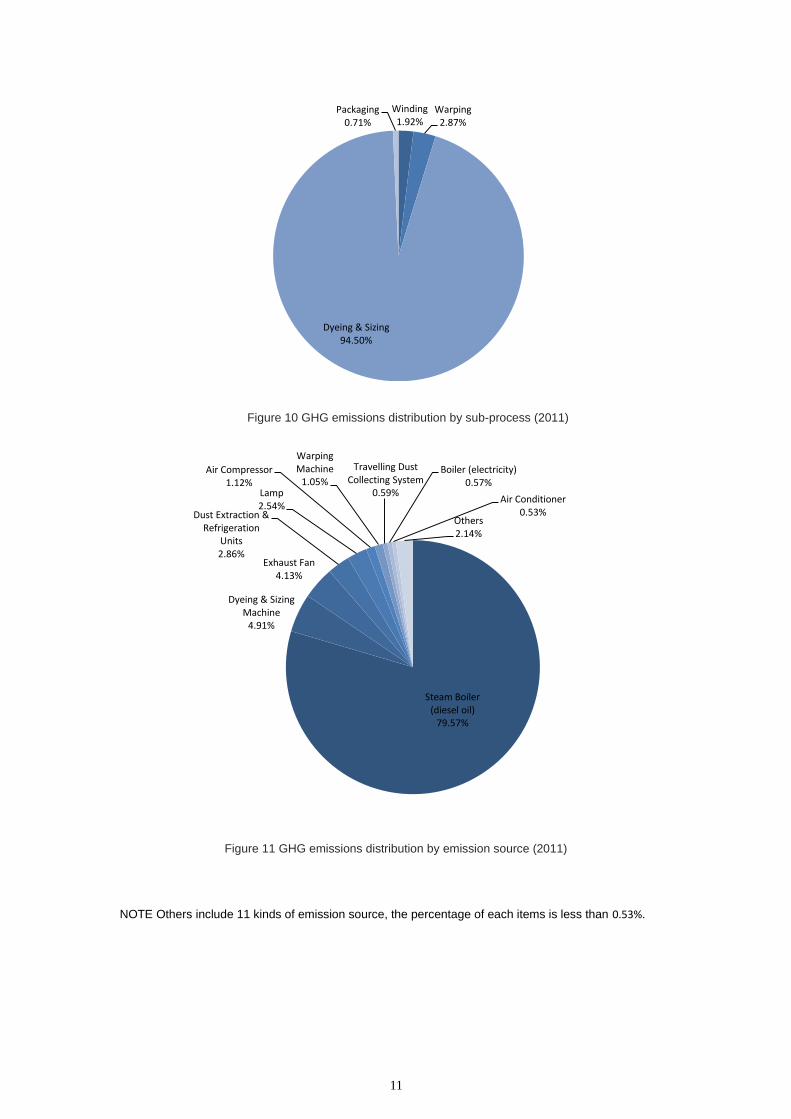
Figure 10 GHG emissions distribution by sub-process (2011)
Figure 11 GHG emissions distribution by emission source (2011)
NOTE Others include 11 kinds of emission source, the percentage of each items is less than 0.53%.
Winding 1.92%
Warping 2.87%
Dyeing & Sizing 94.50%
Packaging 0.71%
Steam Boiler (diesel oil)
79.57%
Dyeing & Sizing Machine
4.91%
Exhaust Fan 4.13%
Dust Extraction & Refrigeration
Units 2.86%
Lamp 2.54%
Air Compressor 1.12%
Warping Machine
1.05%
Travelling Dust Collecting System
0.59%
Boiler (electricity) 0.57%
Air Conditioner 0.53%
Others 2.14%

12
Discussion and carbon reduction opportunities
On the basis of results in Figure 8, 9, 10 and 11, further discussions have
been made to find out the opportunity for carbon reduction.
1. In Figure 8, the average GHG emission per pound dyed yarn per month
fluctuated slightly, which means that this pilot factory was in stable
operation in 2011. In February, the factory has the highest GHG emission
of the year. In contrast, the collective primary data shows that this month
had the lowest total production.
The order’s fluctuation is mainly due to fashion season and sourcing’s cycle,
and the change of factory’s operating rate due to the workers’ holiday.
These factors will affect the monthly output which has relevance with the
average GHG emission per unit product during a same period. It is not a
conclusion but it may be supposed that the external environment, such as
fashion seasons, holidays and even outer economic environment, would
have impacts on the carbon performance of an organization.
2. In Figure 9, it was shown that almost 99% GHG emissions occurred in the
production area. The energy efficiency in the factory is very high.
3. In Figure 10, the dyeing and sizing sub-process consumed about 95% of
the total energy, and it indicates this sub-process have the most energy
consumption. Fully understand the energy source used and the behavior of
13
the machines in this sub-process could provide important probability to
reduce the carbon level.
4. In Figure 11, the diesel steam boiler contributed about 80% GHG
emissions of the total. Dyeing machine and sizing machine is the second
energy consumer. These results reconfirm the findings from Figure 24 and
ascertain the biggest GHG emission source.
NOTE The above results and discussions are based on the data collected from the pilot factory in the
reporting year of 2011, which can only indicate the possibility in the given period and location.

14
Pilot report 3: Fabric Weaving and Finishing
About fabric weaving
This is a process of interlacing two or more yarns at right angles to each
other to produce woven fabric. There are three kinds of basic weaves,
commonly used for the majority of fabrics, named plain weave, twill weave and
satin weave. Other weaves are a variation or a combination of these weaves.
Fabric finishing is the final process carried out after coloration and before the
materials are made up into garments, which furnish the textiles materials
suitable for their end uses (e.g. water repellent) and to meet certain customers’
expectation (e.g. shrinkage control).
Pilot factory introduction
The pilot factory undertakes the manufacturing functions of denim fabric
weaving and finishing. The yarns come from its sister spinning company Pilot
factory 1. This vertical manufacturing group is a very good case to simulate
carbon footprint assessment in a real fiber to fabric supply chain of denim.
Process map
Figure 12 Process map of fabric weaving and finishing—denim fabric

15
Data collecting and analysis results
A set of data had been collected from the pilot factory. The important
results focused on time, space, sub-process and energy consumption source
are featured in Figure 13, 14, 15 and 16.
Figure13 Average GHG emissions per yard per month (2011)
Figure 14 GHG emissions distribution by space (2011)
0.00
0.50
1.00
1.50
2.00
2.50
1 2 3 4 5 6 7 8 9 10 11 12
KgCO2e/yard
Month
Production Area 97.02%
Administrative Area 2.98%

16
Figure 15 GHG emissions distribution by sub-process (2011)
Figure 16 GHG emissions distribution by emission source (2011)
NOTE Others include 19 kinds of emission source, the percentage of each items is less than 0.58%.
Drawing-in 0.14%
Weaving 52.32%
Woven fabric Inspecting
1.23% woven fabric Packaging
0.87%
Fabric Loosing 0.46%
Singeing&Desizing&Washing
16.97%
Heat-setting 4.45%
Pre-shrinking 21.85%
Finished fabric inspecting
1.15%
Finished fabric packaging
0.57%
Air Compressor 42.64%
Steam Boiler(light
oil)
24.80%
Weaving Machine 12.67%
Dust Extraction& Refrigeration Units
9.76%
Lamp 2.09%
Travelling Dust Collecting System
1.41%
Air Conditioner 2.04%
Fabric Inspecting Machine
0.74%
Singeing System (gas)
0.58%
Vacuum Collection System 0.54% Others
2.73%

17
Discussion and carbon reduction opportunities
On the basis of results in Figure 13, 14, 15 and 16, further discussions have
been made to find out the opportunity for carbon reduction.
1. In Figure 13, average GHG emission per yard per month of denim fabric
weaving and finishing progress is almost evenly distributed. The data in
January and February is a little bit higher than other months. This period is
the traditional holiday. The possible reasons of this fluctuation may refer to
the analysis for Figure 8.
2. In Figure 14, it was shown that the factory had very good energy efficiency
as most of the GHG emissions were emitted by the production area. The
GHG emissions in administrative area has only very small portion.
3. In Figure 15, weaving sub-process offered more than half GHG emissions
of the whole production part. Preshrinking, singeing, desizing, washing and
heat-setting, which make up the major denim fabric finishing process,
contributed about 40% GHG emissions of total. To investigate all the
manufacturing machines, including auxiliary production facilities, is an
important step to focus the key carbon reduction opportunity.
4. In Figure16, air compressor, steam boiler (light oil) and weaving machine
are the top three machines contributed about 80% GHG emissions of the
total emissions of the factory. Compressed air is essential motive power in

18
many processes of textile manufacturing. In weaving process, the air jet
loom needs a great deal of compressed air. Owing to the 40% GHG
emissions of the whole factory, the air compressor may be defined as an
important source for carbon reduction. The steam boiler providing steaming
for finishing sub-process, such as desizing, drying and preshrinking, are
the second GHG emission source which should be emphasized with about
20% of the total GHG emissions. Weaving machine is another big
energy consumer. A combination of the weaving process and the
necessary compressed air make the weaving sub-process the biggest
GHG emission source.
NOTE The above results and discussions are based on the data collected from the pilot factory in the
reporting year of 2011, which can only indicate the possibility in the given period and location.

19
Pilot report4: Garment Manufacturing
About Garment Manufacturing
Garment manufacturing is the process the garments are made. Cut and
Sewn is a simplified description. In brief, it is to cut the fabrics according to the
pattern construction and then sew the pieces to a complete garment. Besides,
the accessories and trimmings will be assembled to the garments during this
manufacturing process. Not all the garments are made by cut and sewn
method but the woven fabrics and some knitted fabrics are usually be made to
garments by means of this method. Generally speaking, the output from this
process is the final product of manufacturing sector, excluding some special
effects conveyed on it due to the requirements of functions or design concepts.
Pilot factory introduction
This pilot factory is located in Guangdong province focused on jeans
garments manufacturing. This process turns the denim fabrics in bundles to
denim jeans in wearable pieces. After sewing, the intermediate product will be
sent to washing factory for special washing effects.
Process map
Figure17 Process map of jeans manufacturing

20
Data collecting and analysis results
A set of data had been collected from the pilot factory. The important
results focused on time, space, sub-process and energy consumption source
are featured in Figure 18, 19, 20 and 21.
Figure 18 Average GHG emissions per piece per month (2011)
Figure 19 GHG emissions distribution by space (2011)
0.00
0.50
1.00
1.50
2.00
2.50
3.00
3.50
1 2 3 4 5 6 7 8 9 10 11 12
KgCO2e/Piece
Month
Production Area 90.75%
Administrative Area 9.25%

21
Figure 20 GHG emissions distribution by sub-process (2011)
NOTE Others include 11 processes, and PCF of each process is less than cut-pieces checking process: 1.69%.
Figure 21 GHG emissions distribution by emission source (2011)
NOTE Others include 28 kinds of emission source, the percentage of each items is less than 2.11%.
Ironing 57.85%
Sewing 12.15%
Cutting 4.58%
Interlining Fusing 2.34%
Pattern Printing 2.16%
Packaging 2.09%
Button Fixing 1.77%
Fabric Inspection
1.76%
Fabric Speading 1.74%
Cut-pieces Checking 1.69%
Others 11.86%
Outsourcing Steam 39.14%
Lamp 10.28%
Sewing Machine 10.18%
Exhaust Fan 8.07%
Electric Iron 6.85%
Air Conditioner 4.99%
Fusing Machine 2.85%
Wet Curtain Air-condition System
2.62%
Computer 2.23%
Electric Fan 2.11%
Others 10.67%

22
Discussion and carbon reduction opportunities
On the basis of results in Figure 18, 19, 20 and 21, further discussions have
been made to find out the opportunity for carbon reduction.
1. In Figure 18, the monthly average GHG emission per piece denim jeans
are nearly even except the special case in February. The possible reasons
of this fluctuation may refer to the analysis for Figure 8. Garment
manufacturing is a labor intensive process. If the workers go back
hometown for Lunar Chinese New Year, the operating rate of the factory
will be greatly declined in February, This month has the lowest output of the
year which almost no more than the 10% or the monthly average. This
would be the potential reason for this special case.
2. In Figure 19, the ratio of GHG emission from production area to those from
administrative area is close to 91 to 9. The energy efficiency in the factory
is very high.
3. In Figure 20, ironing, sewing and cutting are the top three energy
consuming sub-processes, which totally contributed about 75% GHG
emissions of the total GHG emissions. Ironing is a sub-process using
immense energy to smooth the fabric wrinkle. Sewing is one the major
sub-process which turns the fabrics to garments. Cutting process has a low
production and cost a lot of working hours, so it has a big GHG emission.

23
4. In Figure 21, out sourcing steam, lighting, sewing machine, exhaust fan,
electric Iron, air conditioner and fusing machine are the major GHG
emission source.
NOTE The above results and discussions are based on the data collected from the pilot factory in the
reporting year of 2011, which can only indicate the possibility in the given period and location.
NOTE The steam used in this factory is outsourcing, so we use the ‘outsourcing steam’ instead of the
‘steam boiler’ in figure 21.

24
Pilot report 5: Jeans Washing
About jeans washing
In order to make the jeans show distinctive visual effects, a unique
washing process will be done after the garment or fabric stage, such as
standard wash, stone wash, enzyme wash, chemical wash, bleach wash and
destroy wash. The jeans washing effect design is an important step of jeans
development, which attracts the consumers.
Pilot factory introduction
This pilot factory is a sister company of pilot factory 4 and in close
collaboration with each other. This factory has mature and trendy washing
techniques. The washed products will be sent back to garment manufacturing
factory for final inspection and packaging steps. This is the end of the
assessment of jeans carbon footprint in manufacturing sector.
Process map
Figure 22 Process map of jeans washing

25
Data collecting and analysis results
A set of data had been collected from the pilot factory. The important
results focused on time, space, sub-process and energy consumption source
are featured in Figure 23, 24, 25 and 26.
Figure 23 Average GHG emissions per piece per month (2011)
Figure 24 GHG emissions distribution by space (2011)
0.00
0.05
0.10
0.15
0.20
0.25
1 2 3 4 5 6 7 8 9 10 11 12
KgCO2e/Piece
Month
Production Area 95.72%
Administrative Area 4.28%

26
Figure 25 GHG emissions distribution by sub-process (2011)
Figure 26 GHG emissions distribution by emission source (2011)
NOTE Others include 13 kinds of emission source, the percentage of each items is less than 1.49%.
Discussion and carbon reduction opportunities
Washing 62.18%
Hydrate Extraction
9.97%
Drying 20.95%
Tumble Cool
6.90%
Outsouring Steam 54.06%
Washing Machine
9.70%
Hydrate Extractor
7.81%
Hot-water Boiler 6.87%
Dryer 5.50%
Air Cooler 4.58%
Electric Fan 3.17%
Air Conditioner 2.66%
Lamp 2.25%
Gasoline 1.49%
Others 1.90%

27
On the basis of results in Figure 23, 24, 25 and 26, further discussions have
been made to find out the opportunity for carbon reduction.
1. In Figure 23, the monthly GHG emission per piece per month of denim
jeans washing is not fluctuated significantly. According to the collective
primary data, the production in this factory is nearly stable. Comparing to
garment manufacturing process, the washing process is less labor
intensive as this sub-process relies mostly on machines. Even in the
traditional holidays, the carbon performance is not obviously decreased.
2. In Figure 24, the ratio of GHG emissions from production area to those
from administrative area is close to 96 to 4. The energy efficiency in the
factory is very high.
3. In Figure 25, the GHG emissions distribution by sub-process of denim
jeans washing are very simple, as only four major sub-processes are
involved. The highest one is washing which contributes more than 60% of
the total GHG emissions of the factory. The second one is drying. These
two sub-processes are majority of the whole GHG emissions with a total
share of about 80%, which should be considered as the possibility of
carbon reduction opportunities.
4. In Figure 26, out sourcing steam holds the biggest share of the total
emissions which are the essential elements for washing sub-processes
which providing steaming to enhance the washing effects. The electricity
used to run the washing machines contributes about 10% of GHG
emissions. These two parts are the major energy consumption source of

28
washing sub-process, with a share of 60% of the total. This process is the
biggest carbon reduction opportunities.
NOTE The above results and discussions are based on the data collected from the pilot factory in the
reporting year of 2011, which can only indicate the possibility in the given period and location.
Top Related