


Languages
Pages
Legal


Anthropogenic Chlorofluorocarbons in the Black Sea and the Sea of
Marmara Bing-Sun Lee
E-mail: [email protected]
National Center for Ocean Research
P.O. Box 23-13, Taipei, Taiwan 10617, R.O.C.
John L. Bullister*
E-mail: [email protected]
National Oceanic and Atmospheric Administration,
Pacific Marine Environmental Laboratory,
7600 Sand Point Way NE, Seattle, WA 98115 0070
James W. Murray
E-mail: [email protected]
School of Oceanography,
Box 357940,
University of Washington,
Seattle, WA 98195-7940
Rolf E. Sonnerup
E-mail: [email protected]
Joint Institute for the Study of Oceans and Atmospheres,
Box 354235,
University of Washington,
Seattle, WA 98195-4235
7 December 2001 * Corresponding Author
Keywords: anoxia, chlorofluorocarbons, mathematical models, residence time, tracers,
Black Sea
2
Abstract. Measurements of the distributions of two chlorofluorocarbons, CCl3F (CFC-
11) and CCl2F2 (CFC-12), made during the June/July 1988 R. V. Knorr cruise in the
Black Sea indicate that CFC-11 is non-conservative relative to CFC-12 in the strongly
reducing anoxic waters. A multi-layer model combining horizontal/vertical renewal and
vertical diffusion processes was tuned to the distributions of CFC-12 and salinity in
suboxic and anoxic waters and used to estimate the residence times of subsurface waters
and first order in-situ removal rate constants for CFC-11. The model-calculated
residence times were ~ 5 years in the suboxic zone (80 – 120 m) and increased to ~ 625
years at 500 m. The first order CFC-11 in-situ removal coefficients were 0.52 (±0.19) yr-
1 for the depth range 160 – 480 m. Based on the observed CFC-12 concentrations, the
residence time of Cold Intermediate Layer (CIL) water (~50 – 100 m) was estimated to
be less than five years. The residence time of the deep water (100 - 450 m) in the Sea of
Marmara was estimated to be 12-19 years using a box model tuned to CFC-12, implying
an in-situ oxygen utilization rate of 10-18 µmol kg-1 yr-1.
Introduction
The Black Sea (Fig. 1) is the world's largest anoxic basin. A low salinity upper
layer, maintained by freshwater inputs from many rivers (Fig. 1), overlays a more saline
layer which is maintained by Mediterranean waters supplied to the Black Sea through the
Bosporus Strait. The saline inflow mixes with a sub-surface “cold intermediate water”
layer (CIL) to ventilate the deep basin (Murray et al, 1991; Buesseler et al, 1991). The
sinking of organic material from the surface and subsequent remineralization at depth,
combined with the strong stratification of the water column and slow renewal times for
3
deep waters, leads to anoxic conditions at depths > ~100m.
Ventilation rates for deep waters in the Black Sea are poorly known. An estimate
of the residence time of deep water based on 14C was 2000 years (Östlund and Dyrssen,
1986), while a budget of heat and salt indicated a turnover time of ~387 years (Murray et
al, 1991). Because these turnover times are useful for constraining rates of the
geochemical processes occurring in the Black Sea, chlorofluorocarbons were analyzed
during a 1988 US-Turkish expedition to further constrain the rate of this ventilation
process.
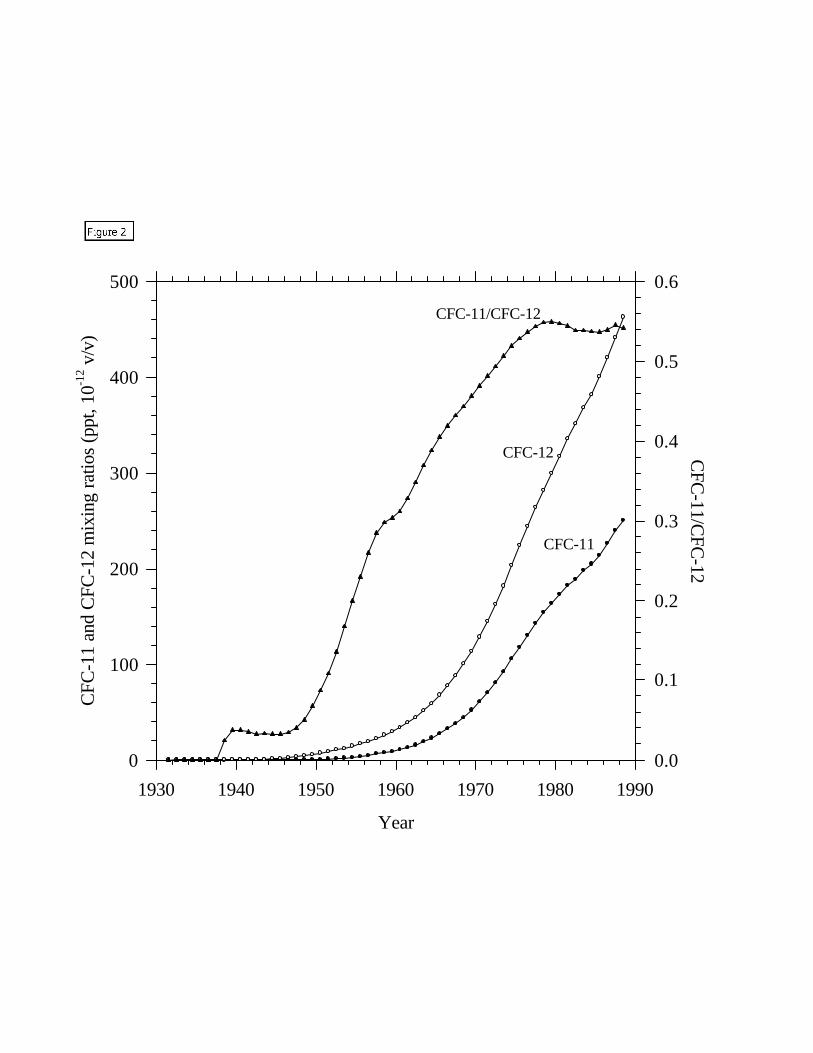
The chlorofluorocarbons (CFCs), CFC-12 (CCl2F2) and CFC-11 (CCl3F) are
entirely anthropogenic compounds whose production and atmospheric release began in
the 1930s. Due to the rapid rise in production and the stability of these gases in the
troposphere, CFC levels in the atmosphere increased dramatically during the following
decades. Photocatalytic reactions with ozone in the stratosphere provide the major sink
for CFCs, whose atmospheric lifetimes are 180 and 44 years for CFC-12 and CFC-11,
respectively (Cunnold et al., 1994). Atmospheric CFC levels have been monitored
globally since ~1978. A reconstruction of the CFC atmospheric history for the period
1930 to 1978 can be made based on estimates of production and release of CFCs and
their atmospheric lifetimes, normalized to atmospheric CFC measurements made since
1978. In this study, reconstructed histories of the concentrations of CFC-11 and CFC-12
in the atmosphere (Walker et al., 2000) were normalized to atmospheric measurements
made during the Black Sea Expedition in 1988 (Fig. 2).
Dissolved CFC-12 and CFC-11 are widely employed as transient tracers for water
dating and ocean mixing and circulation studies (e.g. Gammon et al., 1982; Bullister and
4
Weiss, 1983; Weiss et al, 1985; Doney and Bullister 1992). CFCs have also been used
to estimate oxygen utilization rates (OURs) (Doney and Bullister 1992; Warner et al.,
1996) and anthropogenic CO2 uptake by the oceans (Gammon et al., 1982; Matear and
Wong, 1997; Sabine et al., 1999). Most CFC applications have assumed that there are no
in situ sources or sinks of CFCs in the ocean. However, in some marine environments,
the use of CFCs as tracers may be complicated by the fact that CFC removal has been
reported under anaerobic conditions in soils (Khalil and Rasmussen, 1989), rice fields
(Khalil et al., 1990) and organic-rich freshwater sediments (Lovley and Woodward,
1992). In seawater, CFC-11 consumption in strongly reducing (anoxic) marine
environments like Saanich Inlet (Bullister and Lee, 1995; Lee et al., 1999) and
Framvaren Fjord (Shapiro et al., 1997) has been reported, but CFC-12 appears to be
conservative in these environments.
In this paper we use CFC measurements collected during a 1988 US-Turkish
expedition in the Black Sea (Murray, 1991a; Murray, 1991b) to calculate water exchange
and CFC-11 removal rates in suboxic and anoxic waters. Assuming that CFC-12 is a
conservative tracer, a simple mixing model is tuned to the 1988 CFC-12 inventories
observed in the Black Sea. The model is used to estimate deep water residence times and
CFC-11 removal rates in the Black Sea’s suboxic and anoxic waters. Finally, we use a
simple mixing model and CFC observations from the adjacent Sea of Marmara to
estimate the residence time and oxygen utilization rate of deep waters there.
Hydrographic Background
The Black Sea
5
Black Sea waters can be classified as oxygenated surface waters, suboxic waters,
and anoxic (hydrogen sulfide-bearing) waters. Large chemical gradients are present in the
water column extending from the surface into the suboxic and anoxic zones (Codispoti et
al., 1991). Isopycnal surfaces above 300 m are dome-shaped, that is, shallower in the
central parts of the Black Sea reflecting the cyclonic circulation (Caspers, 1957). The
oxygenated surface layer ranges in thickness from ~ 50 m in the central basin to ~150 m
near the margins. Immediately below the surface layer is the Cold Intermediate Layer
(CIL) where temperature decreases to a minimum. The upper and lower boundaries of the
CIL (σθ = 14.29 - 15.45) are defined by the depths of the 8°C isotherms (Murray et al.,
1991) above and below the temperature minimum. Two mechanisms have been proposed
for the formation of CIL water. First, CIL water has been reported to originate in the
Northwestern Shelf (NWS) region of the Black Sea (Neumann, 1943; Filippov, 1968;
Tolmazin, 1985; Sanchez et al., 1991). In this region, a combination of cold temperatures
and low river run-off during wintertime forms dense slope water which descends and
spreads laterally across the Black Sea (Georgiev, 1967; Filippov, 1968; Boguslavsky et
al., 1976; Blatov et al., 1980). Second, Ovchinnkov and Popov (1987) discuss the
possibility that CIL water is formed in the centers of the cyclonic gyres, and subsequently
spirals outward along the dome-shaped isopycnal surfaces. Ivanov et al. (1997)
concluded that both sources are important and noted that the two reservoirs of CIL are
separated by a rim current in the Black Sea.
The oxic-anoxic interface (σθ = 15.45 - 16.16) below the CIL has been
characterized as a “suboxic zone” (Murray et al 1995). In the central basin, oxygen
decreases from ~ 10 µM at σθ = 15.45 (~80 m) to less than 2 µM at σθ = 16.16 (~115 m).
6
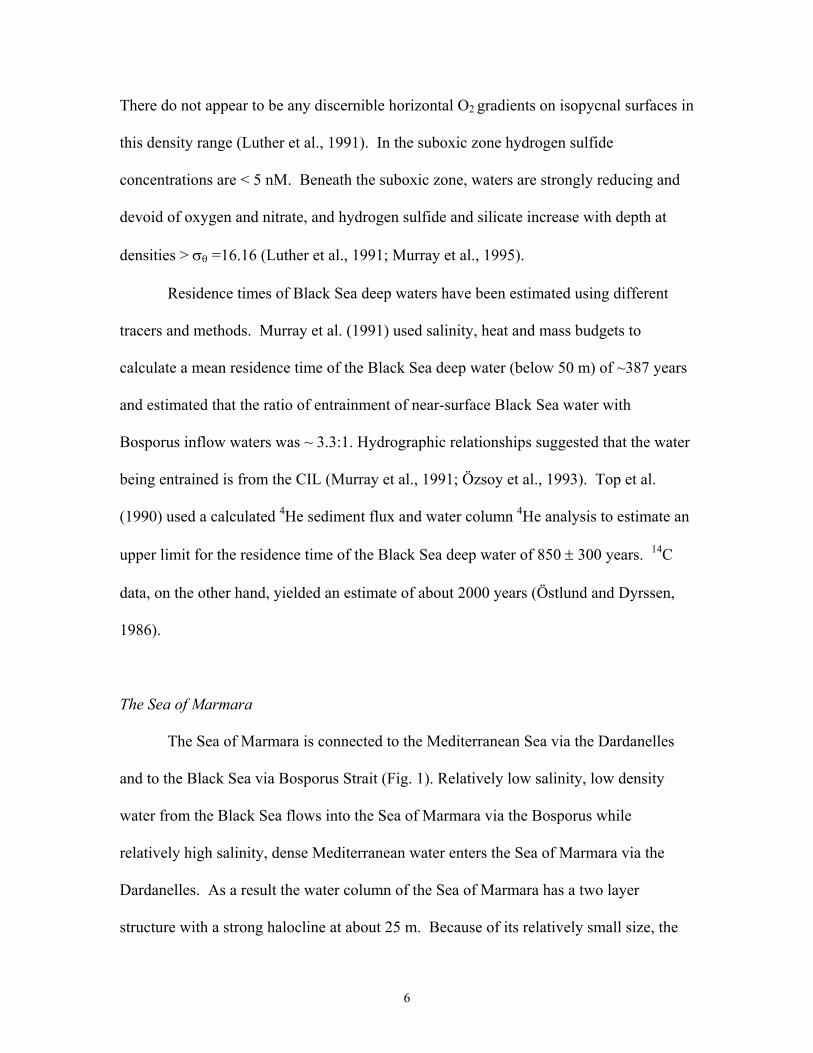
There do not appear to be any discernible horizontal O2 gradients on isopycnal surfaces in
this density range (Luther et al., 1991). In the suboxic zone hydrogen sulfide
concentrations are < 5 nM. Beneath the suboxic zone, waters are strongly reducing and
devoid of oxygen and nitrate, and hydrogen sulfide and silicate increase with depth at
densities > σθ =16.16 (Luther et al., 1991; Murray et al., 1995).
Residence times of Black Sea deep waters have been estimated using different
tracers and methods. Murray et al. (1991) used salinity, heat and mass budgets to
calculate a mean residence time of the Black Sea deep water (below 50 m) of ~387 years
and estimated that the ratio of entrainment of near-surface Black Sea water with
Bosporus inflow waters was ~ 3.3:1. Hydrographic relationships suggested that the water
being entrained is from the CIL (Murray et al., 1991; Özsoy et al., 1993). Top et al.
(1990) used a calculated 4He sediment flux and water column 4He analysis to estimate an
upper limit for the residence time of the Black Sea deep water of 850 ± 300 years. 14C
data, on the other hand, yielded an estimate of about 2000 years (Östlund and Dyrssen,
1986).
The Sea of Marmara
The Sea of Marmara is connected to the Mediterranean Sea via the Dardanelles
and to the Black Sea via Bosporus Strait (Fig. 1). Relatively low salinity, low density
water from the Black Sea flows into the Sea of Marmara via the Bosporus while
relatively high salinity, dense Mediterranean water enters the Sea of Marmara via the
Dardanelles. As a result the water column of the Sea of Marmara has a two layer
structure with a strong halocline at about 25 m. Because of its relatively small size, the

7
renewal time of deep waters in the Sea of Marmara by surface water is much faster than
in the Black Sea (~ 6 - 7 years, Besiktepe et al., 1993) such that deep water in the Sea of
Marmara is oxygenated.
Measurement Methods
Concentrations of CFC-11 and CFC-12 in seawater and air were measured during
the June 21- July 4 1988 cruise by shipboard electron-capture gas chromatography
(Bullister and Weiss, 1988). Water samples for CFC analysis were collected using 30
liter Niskin bottles mounted on a rosette frame. Individual samples were carefully
isolated in 100 ml ground glass syringes to avoid contamination with shipboard air.
Water samples were analyzed by injecting ~30 cm3 into a glass stripping chamber fitted
with a sintered glass frit. CFC-free carrier gas, (5% methane in argon), was bubbled
through the water to purge CFCs from the sample. A column of Ascarite® was placed
downstream of a magnesium perchlorate drying tube to remove hydrogen sulfide. The
purge-stream CFCs were collected and concentrated on a Porasil C/Porapak T trap at -
30oC. The trap was then heated to 100oC to transfer the CFCs from the extraction system
to a gas chromatograph. CFCs were first separated from more slowly-eluting compounds
on a ~25 cm Porasil C precolumn. Final separation was on a ~90 cm Porasil C column.
CFCs were detected using a constant-current 63Ni electron capture detector. Peak areas
were determined by digital integration, and the nonlinear response of the detector was
calibrated by injecting known amounts of a standard gas. CFC concentrations are
reported as parts per trillion (mole fraction of CFC in dry air) for air samples, and in
picomoles (pmol or 10-12 moles) per kilogram (pM) for water samples. All samples are

8
referenced to the SIO-1998 calibration scale (Walker et al., 2000; Prinn et al., 2000),
which is based on primary standards prepared in the laboratory by volumetric dilution.
The estimated accuracy of this calibration scale is ~1% for CFC-11 and CFC-12 (Prinn et
al 2000). The precision of the seawater measurements, as given by the mean standard
deviation for replicate samples, was ~ 0.01 pmol/kg or 1% (whichever is greater) for both
CFC-11 and CFC-12, and systematic sampling and handling errors were estimated to be
of the same order.
Measured volumes of clean ambient air (~3 cc), drawn from a continuously
pumped sampling line at the bow were dried with magnesium perchlorate and analyzed
by injection into the same low-temperature trapping system. The relative standard
deviation of the atmospheric measurements, based on replicate analyses, was ~ 1% for
CFC-11 and ~ 0.4% for CFC-12. Overall systematic calibration errors were estimated to
be ~ 2% for both gases.
Results
Hydrographic and CFC data were obtained at ~20 stations (Fig. 1) on Leg 4 of the
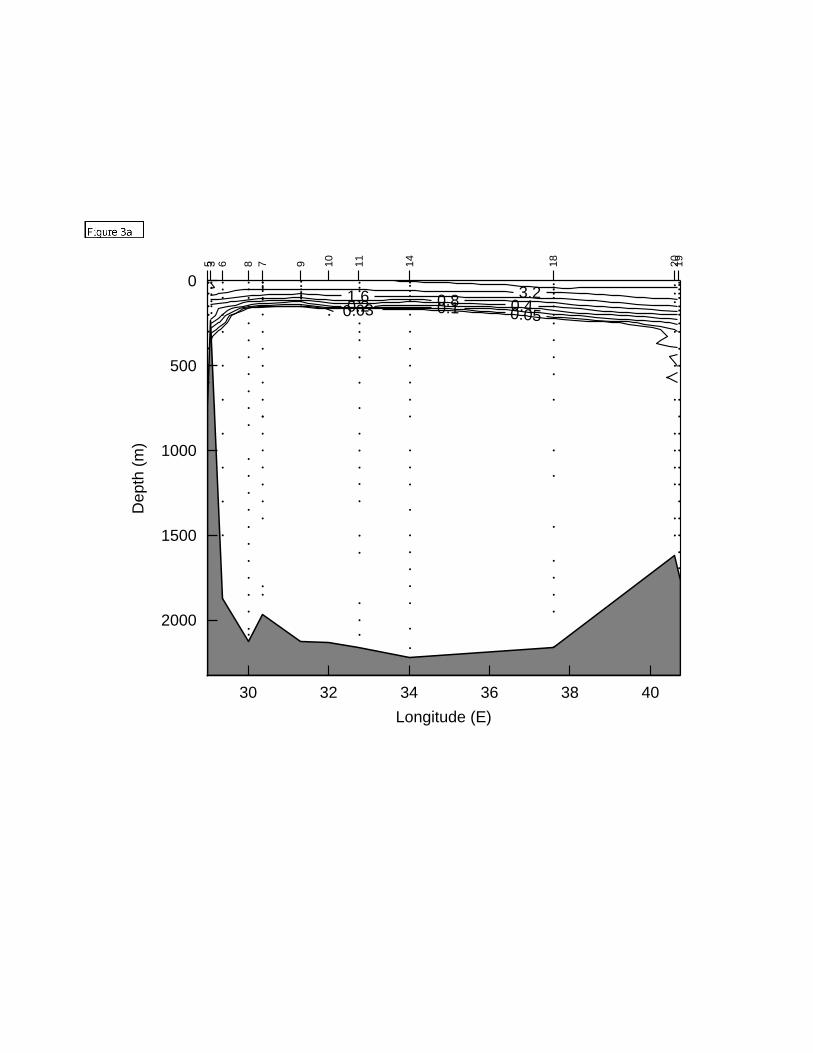
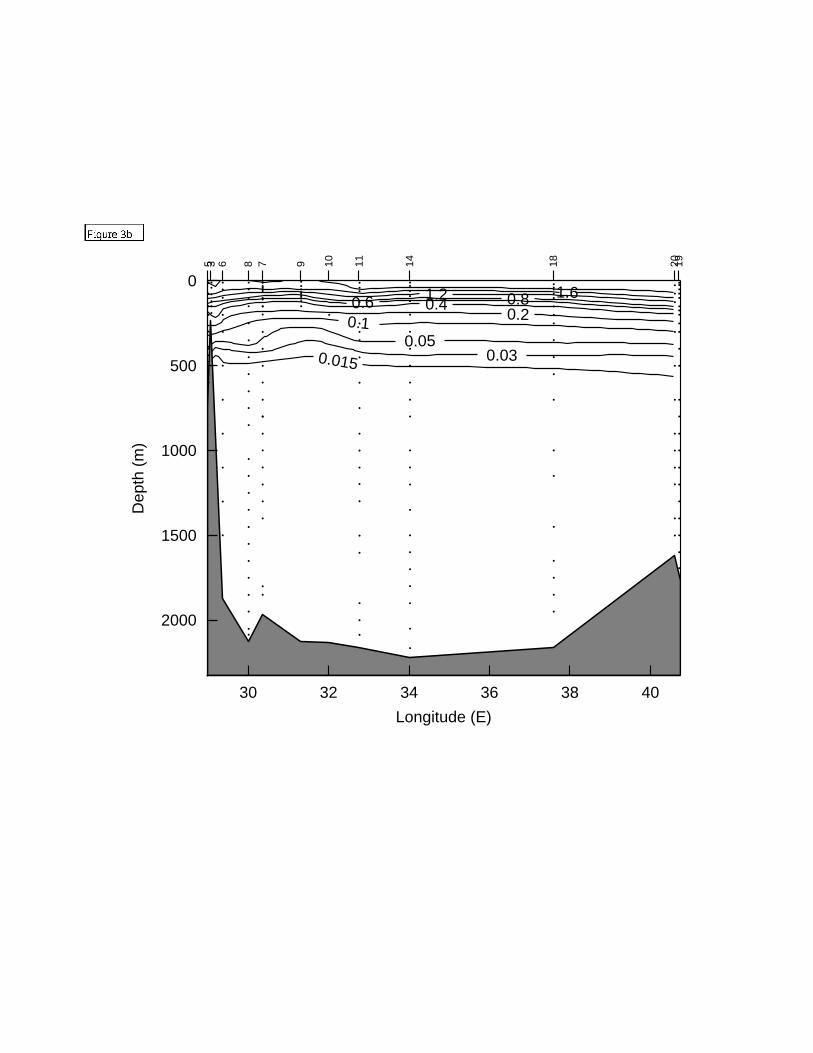
1988 Black Sea Oceanographic Expedition during June 1988 on R. V. Knorr. CFC-11
and CFC-12 concentrations were highest in the near surface waters, but were detectable
well into the suboxic and anoxic layers (Fig. 3). CFC concentrations were near or below
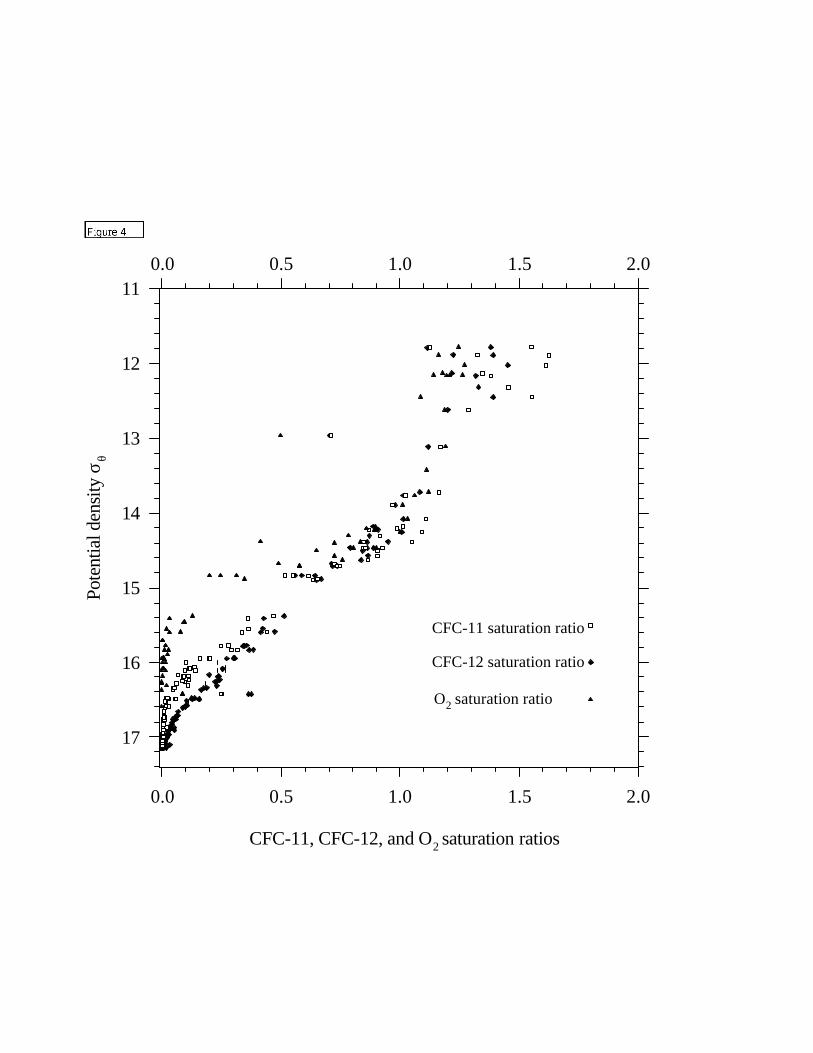
the detection limit at depths > 500 meters. Summertime CFC-11 and CFC-12 saturation
levels in near surface waters were as high as ~160% and ~150%, respectively (Fig. 4),
based on the average of all atmospheric measurements (264.6 ± 3.2 ppt and 493.4 ± 6.7
ppt for CFC-11 and CFC-12 respectively) during the cruise. In near surface waters

9
dissolved oxygen reached saturation levels of 125%. The extreme supersaturations for
dissolved CFCs in the near-surface water may be due to 1) sample contamination; 2)
periodic episodes of elevated levels of atmospheric CFCs over this region; 3) rapid
seasonal warming of near surface waters combined with relatively slow rates of air-sea
gas exchange.
The fact that the CFC-11 and CFC-12 supersaturations were within ~10% of each
other argues against contamination from shipboard or Niskin bottle sources, since these
usually affect one CFC much more strongly than the other. No evidence for severe
contamination of CFC-11 or CFC-12 was seen in the deep samples collected at these
stations. CFC sample contamination at levels (~1 pmol kg-1) needed to bring the surface
saturations to >150% would be obvious if it occurred in deep water samples. A
prolonged period of elevated levels of atmospheric CFCs over the Black Sea occurring a
month or more before the cruise could drive near-surface dissolved CFC concentrations
to high levels, which would then persist for weeks even after the atmospheric CFC levels
returned to background levels. No CFC air measurements over the Black Sea are
available for the period immediately preceding Leg 4, so this possibility cannot be
eliminated. However, average of daily air measurements of CFCs made on Leg 4 were
only slightly (6-7%) above clean Northern Hemisphere background values (Walker et al.,
2000) for this time period, and varied by less than 2% from 21 June to 4 July 1988.
The most likely cause of the observed summertime CFC supersaturations is rapid
surface warming by solar radiation (e.g. Murray et al, 1991), combined with slow gas
exchange in the highly stratified near-surface layer of the Black Sea. Rapid cooling of
the near surface layer in winter produces a mixed layer with temperatures of ~8oC down

10
to the depth of the CIL (σθ =14.46) (Tolmazin, 1985; Ovchinnikov and Popov, 1987;
Sanchez et al., 1991). CFC gas exchange rates are relatively rapid in winter, due to the
low stratification and high mean wind speeds (Tolmazin, 1985). The solubilities of CFC-
11 and CFC-12 decrease by ~ 4% per oC temperature increase (Warner and Weiss, 1985).
If the CFC concentrations in near-surface water in wintertime are assumed to be near
equilibrium at wintertime temperatures (~8oC), then an increase in temperature from 8oC
to 23oC (in the absence of gas exchange) could lead to CFC summertime saturation levels
of > 200%. Thus, the ~150% CFC supersaturation levels observed in the summer of
1988 are probably the result of seasonal warming combined with the substantially lower
mean wind speeds in spring and summer (Woodruff et al, 1998) allowing only partial re-
equilibration of the upper water during the warming.
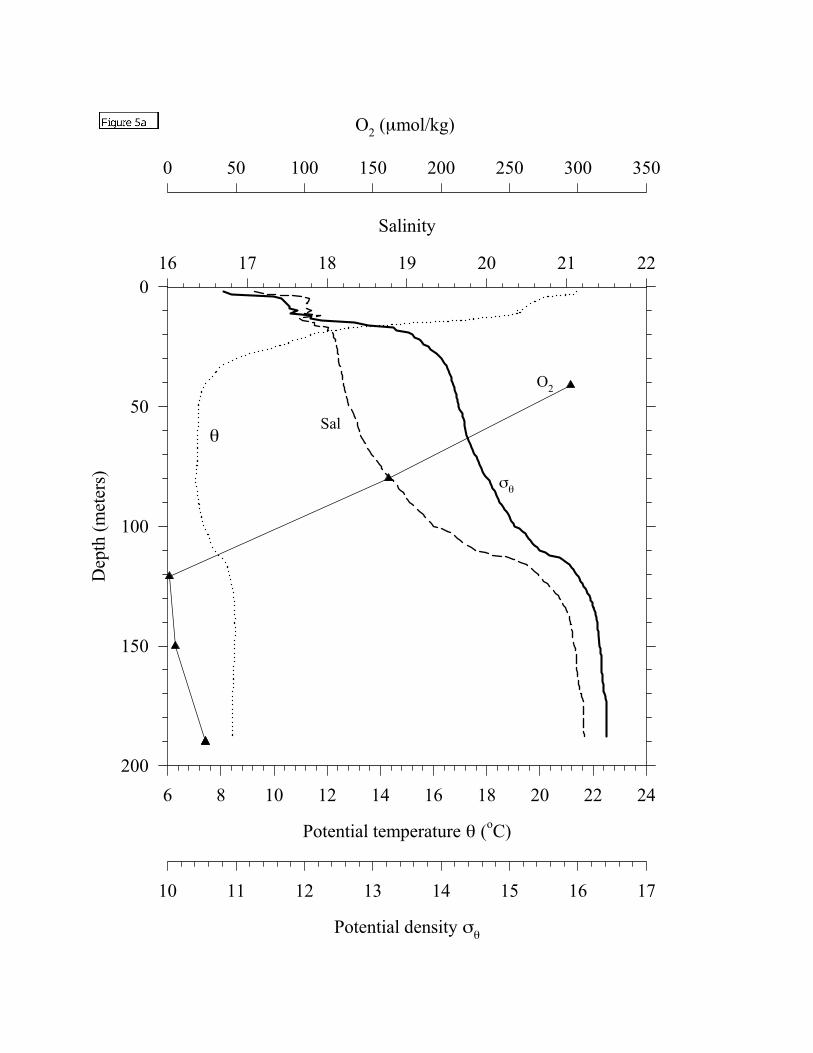
Depth profiles of potential temperature, salinity, dissolved oxygen (O2), CFC-11
and CFC-12 from the Black Sea at Station 3, near the exit of Bosporus Strait, are shown
in Fig. 5. Subsurface maxima in both CFCs and dissolved oxygen were observed at 190
m. These maxima suggest that the inflowing plume containing entrained near surface
origin water penetrates to this depth, carrying with it elevated levels of CFCs and
dissolved oxygen.
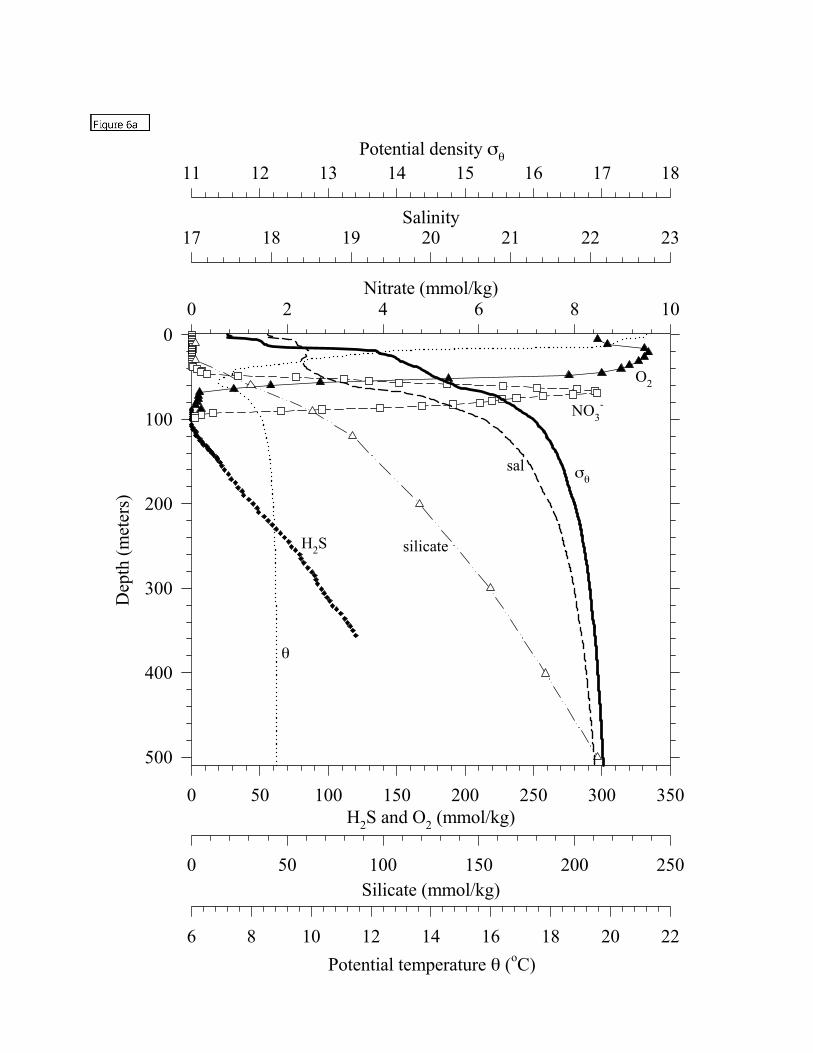
Profiles of dissolved O2, nitrate (NO3-), H2S, potential temperature (θ), salinity
and potential density (σθ) at Station 14, a typical station near the center of the Black Sea,
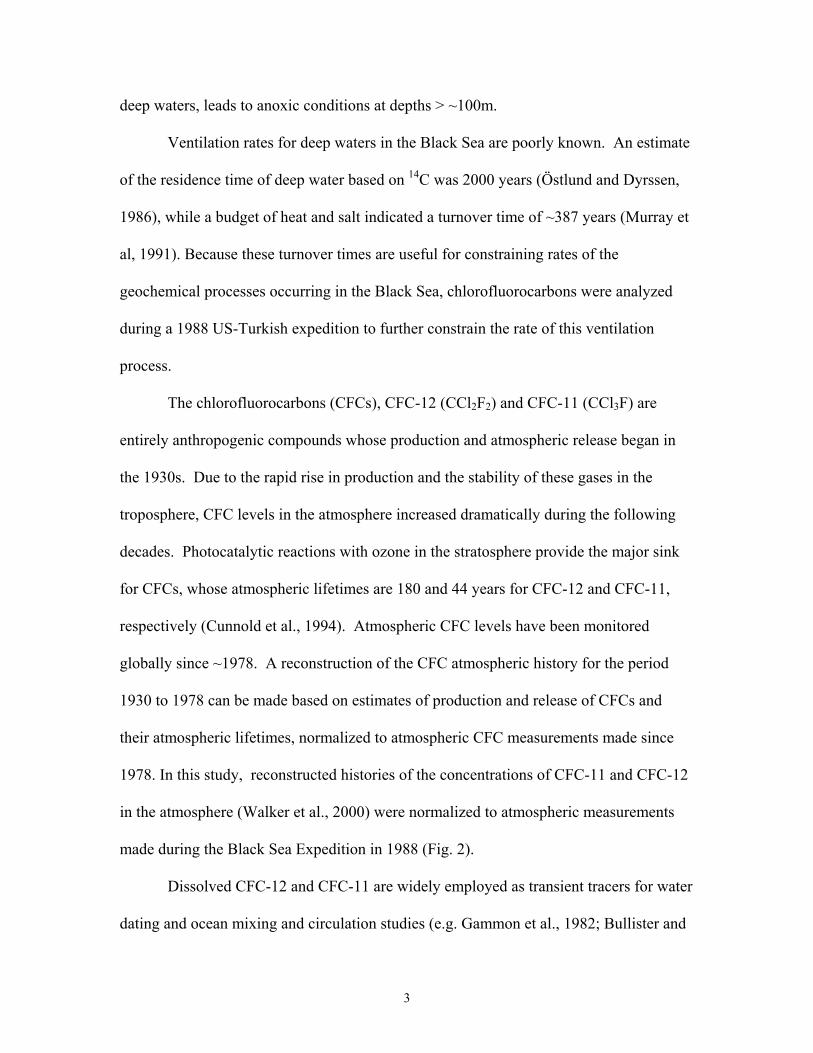
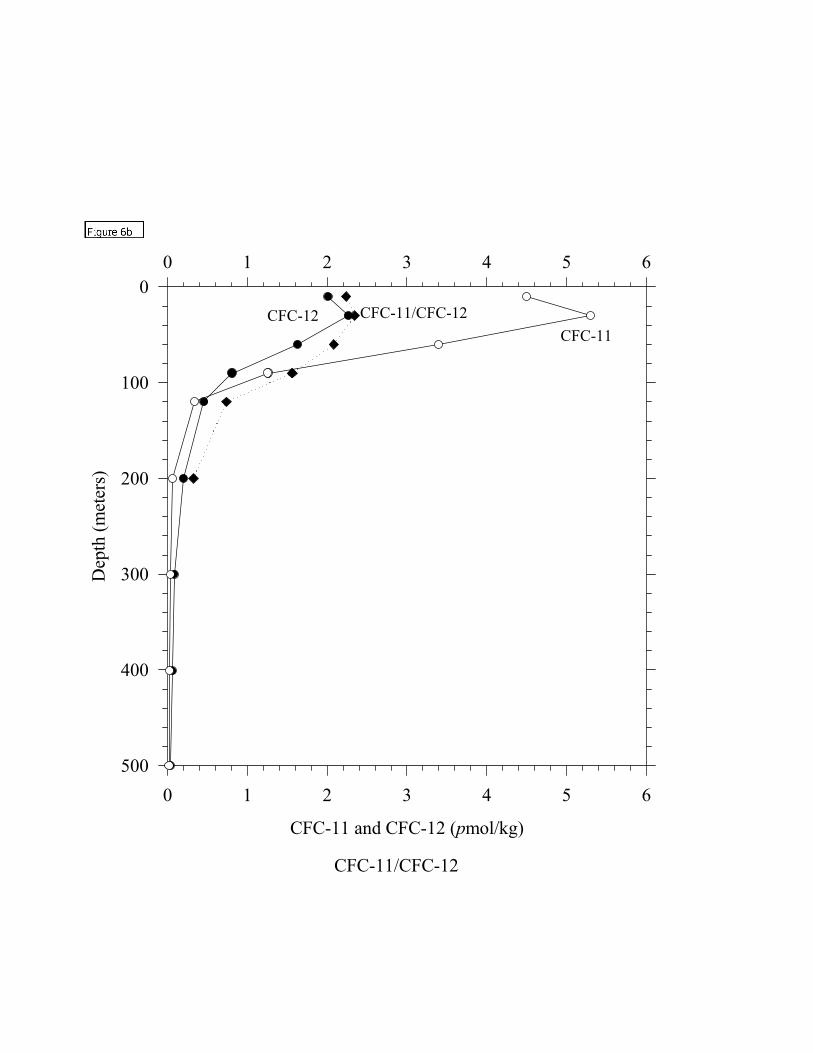
are shown in Fig. 6a. Profiles of dissolved CFC-11, CFC-12 and the CFC-11/CFC-12
ratio are shown in Fig. 6b. As predicted from the overlying atmospheric CFC
concentrations and their solubilities, the dissolved CFC-11 concentrations were higher
than CFC-12 in oxygenated waters. However, this trend was reversed at depth (>~100m)
11
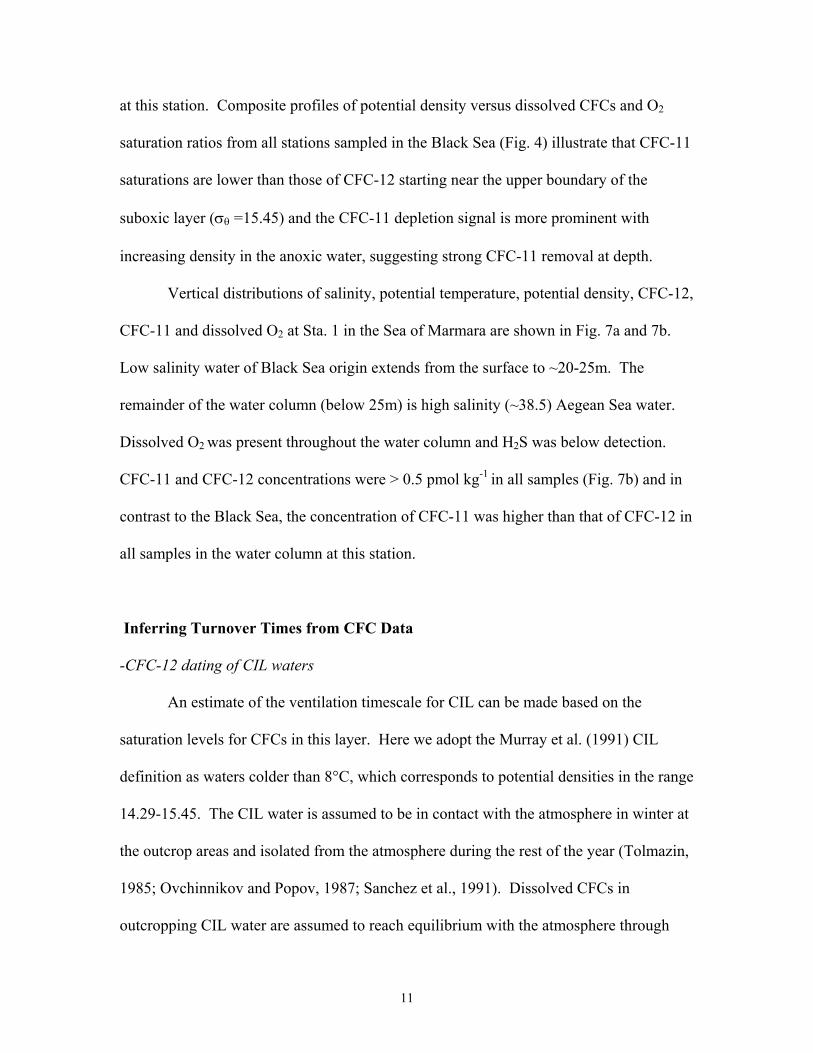
at this station. Composite profiles of potential density versus dissolved CFCs and O2
saturation ratios from all stations sampled in the Black Sea (Fig. 4) illustrate that CFC-11
saturations are lower than those of CFC-12 starting near the upper boundary of the
suboxic layer (σθ =15.45) and the CFC-11 depletion signal is more prominent with
increasing density in the anoxic water, suggesting strong CFC-11 removal at depth.
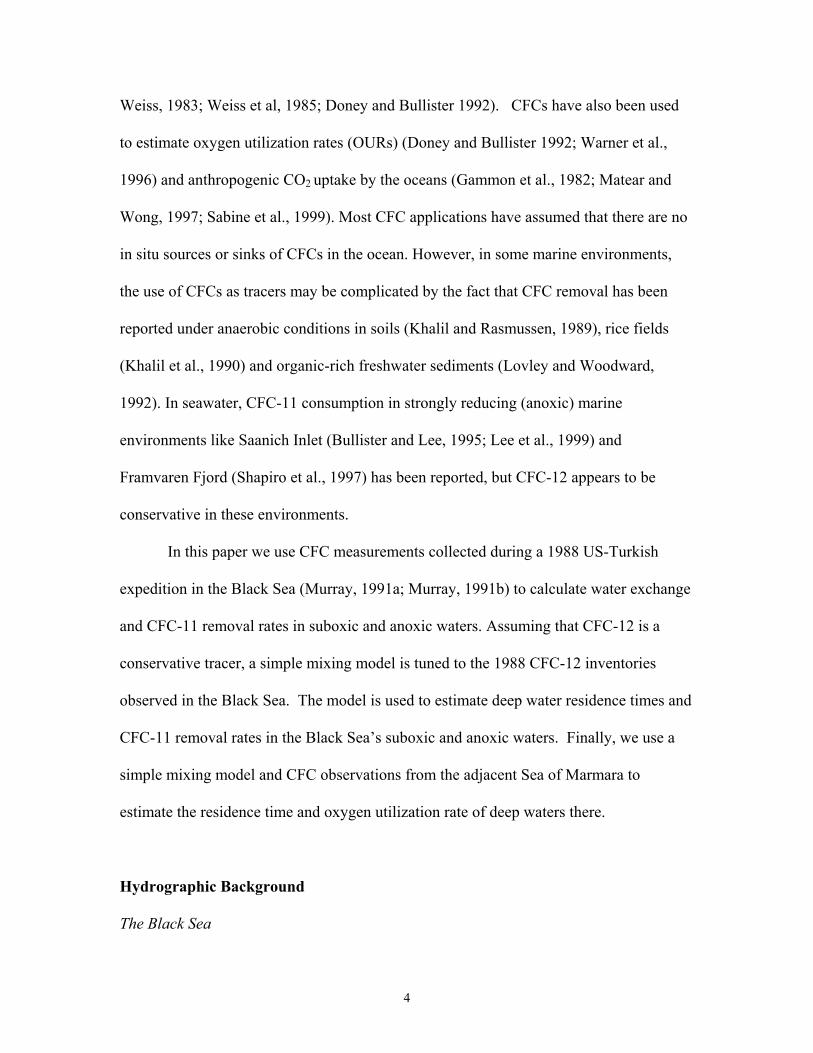
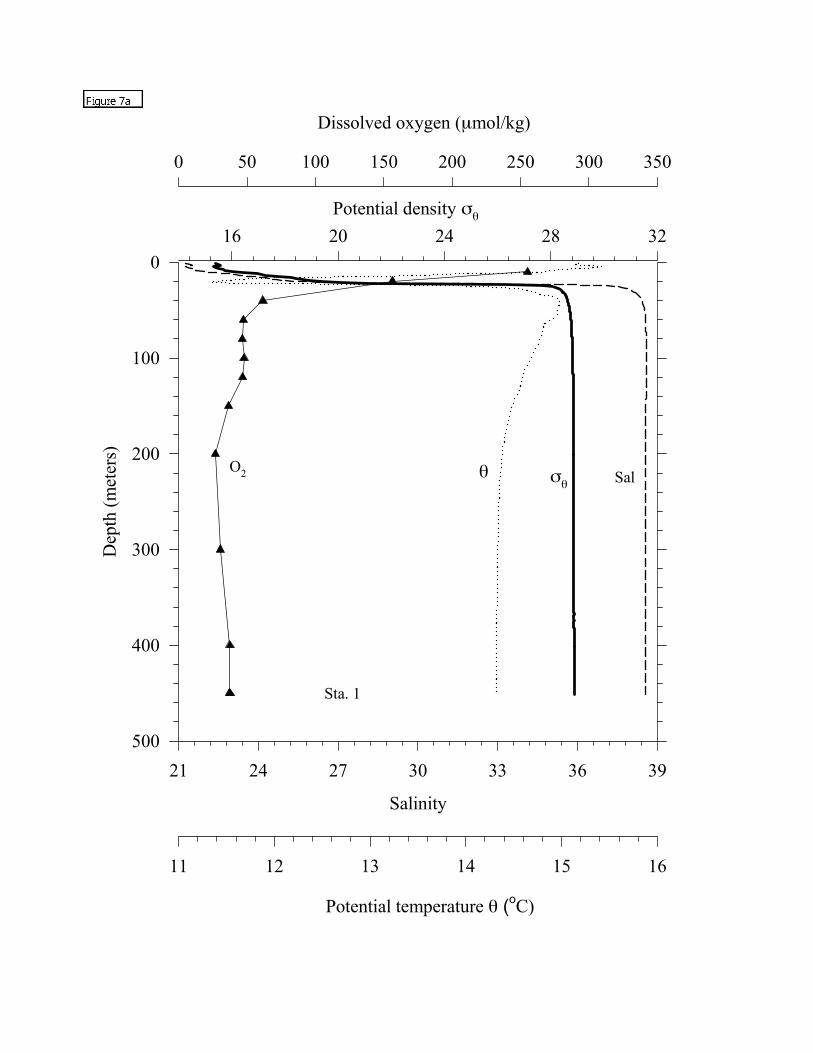
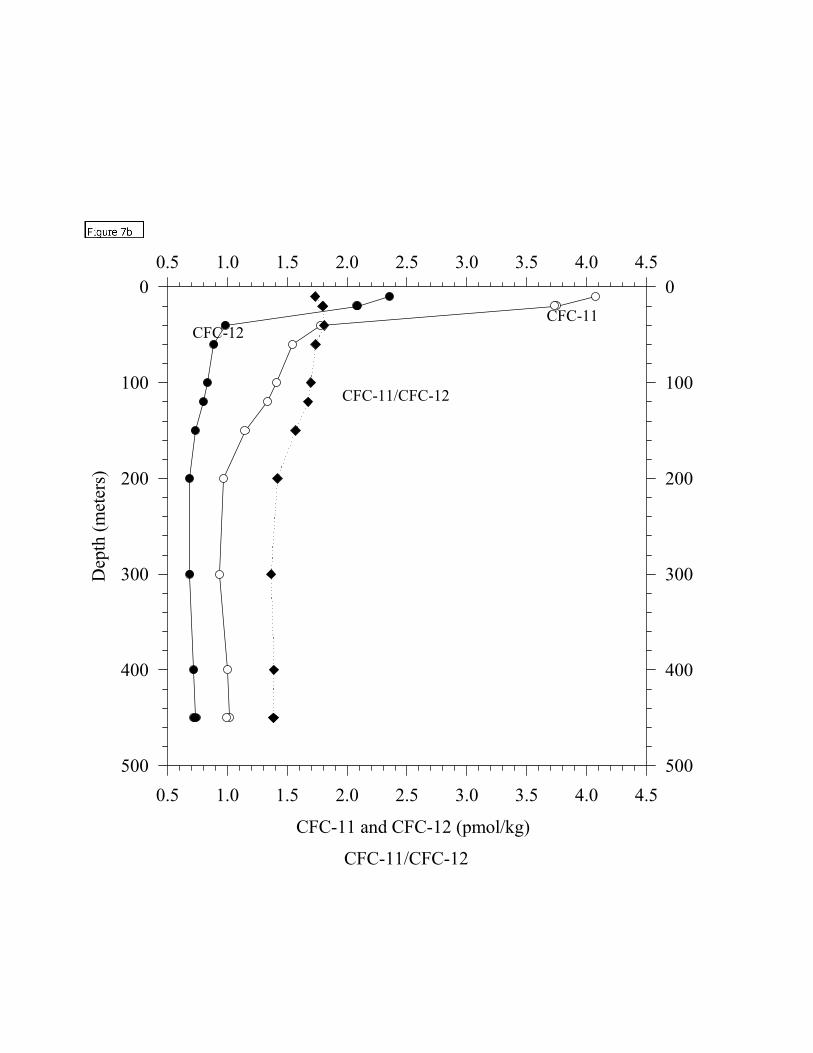
Vertical distributions of salinity, potential temperature, potential density, CFC-12,
CFC-11 and dissolved O2 at Sta. 1 in the Sea of Marmara are shown in Fig. 7a and 7b.
Low salinity water of Black Sea origin extends from the surface to ~20-25m. The
remainder of the water column (below 25m) is high salinity (~38.5) Aegean Sea water.
Dissolved O2 was present throughout the water column and H2S was below detection.
CFC-11 and CFC-12 concentrations were > 0.5 pmol kg-1 in all samples (Fig. 7b) and in
contrast to the Black Sea, the concentration of CFC-11 was higher than that of CFC-12 in
all samples in the water column at this station.
Inferring Turnover Times from CFC Data
-CFC-12 dating of CIL waters
An estimate of the ventilation timescale for CIL can be made based on the
saturation levels for CFCs in this layer. Here we adopt the Murray et al. (1991) CIL
definition as waters colder than 8°C, which corresponds to potential densities in the range
14.29-15.45. The CIL water is assumed to be in contact with the atmosphere in winter at
the outcrop areas and isolated from the atmosphere during the rest of the year (Tolmazin,
1985; Ovchinnikov and Popov, 1987; Sanchez et al., 1991). Dissolved CFCs in
outcropping CIL water are assumed to reach equilibrium with the atmosphere through

12
air-sea exchange at the surface. Negligible dilution of CIL water with the lower CFC
water from below this layer is also assumed.
The observed CFC-12 saturation ratio in the core of CIL water in 1988 was 73.8 ±
13.2 % (Fig. 8). The CFC-12 mixing ratio in the atmosphere increased at a rate of ~5%
yr-1 for the 10 year period prior to the 1988 expedition (see Fig. 2). If the dissolved CFC-
12 concentration in CIL is assumed to track the atmosphere, then the observed CFC-12
saturation in CIL in 1988 reflects equilibrium with the atmosphere about 5 years earlier
(1983). This ~5 year timescale for CIL ventilation based on CFC-12 saturation levels is
somewhat longer than the 1 year estimate of Tolmazin (1985), based on studies of
temporal and spatial variations of the cold water transport in the CIL. However, there are
two distinct groups of CFC saturation levels (Fig. 8) that reflect the strong vertical CFC
gradient in the CIL (Fig. 6b). The ~90% saturation level in the upper CIL waters is
consistent with a ~ 2 year turnover timescale. Also, if newly formed CIL waters do not
attain full equilibration with respect to atmospheric CFC levels, then our estimates would
be an upper limit for the ventilation timescale of CIL.
-Suboxic and Anoxic CFC-bearing waters
The relative vertical distributions of CFCs in the Black Sea indicate qualitatively
that CFC-11 is not conservative relative to CFC-12 in suboxic and anoxic waters. This
phenomenon has been reported in several anoxic basins, including Saanich Inlet, Canada
(Bullister and Lee, 1995; Lee et al., 1999), Lake Nitinat, Canada (Lee, 1998) and
Framvaren Fjord, Norway (Shapiro et al., 1997). CFC-12 appears to be essentially
conservative in the anoxic waters in these basins, with modeled first-order removal rates
13
from 0.01 to 0.03 yr-1 (Shapiro et al., 1997), which may be indistinguishable from 0,
considering measurement and modeling errors. Assuming that CFC-12 is conservative in
oxygenated, suboxic and anoxic waters of the Black Sea, quantitative estimates of the
removal rate of CFC-11, and estimates of the ventilation timescales of CIL, suboxic and
anoxic deep waters can be estimated using a ventilation model tuned to CFC-12.
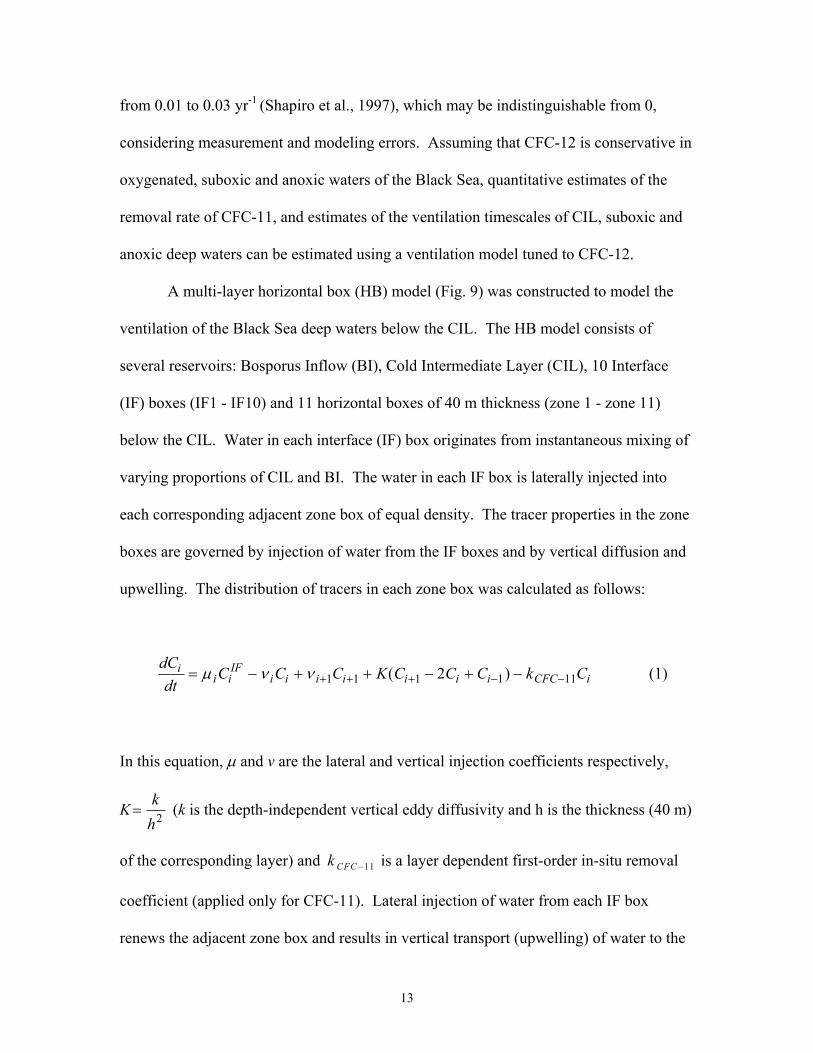
A multi-layer horizontal box (HB) model (Fig. 9) was constructed to model the
ventilation of the Black Sea deep waters below the CIL. The HB model consists of
several reservoirs: Bosporus Inflow (BI), Cold Intermediate Layer (CIL), 10 Interface
(IF) boxes (IF1 - IF10) and 11 horizontal boxes of 40 m thickness (zone 1 - zone 11)
below the CIL. Water in each interface (IF) box originates from instantaneous mixing of
varying proportions of CIL and BI. The water in each IF box is laterally injected into
each corresponding adjacent zone box of equal density. The tracer properties in the zone
boxes are governed by injection of water from the IF boxes and by vertical diffusion and
upwelling. The distribution of tracers in each zone box was calculated as follows:
dCdt
C C C K C C C k Cii i
IFi i i i i i i CFC i= − + + − + −+ + + − −µ ν ν 1 1 1 1 112( ) (1)
In this equation, µ and v are the lateral and vertical injection coefficients respectively,
K =k
h2 (k is the depth-independent vertical eddy diffusivity and h is the thickness (40 m)
of the corresponding layer) and k CFC −11 is a layer dependent first-order in-situ removal
coefficient (applied only for CFC-11). Lateral injection of water from each IF box
renews the adjacent zone box and results in vertical transport (upwelling) of water to the

14
overlying zone box. Thus, the water in the 10 upper zone boxes are renewed both by
lateral injection from the adjacent IF box and by upwelling from the underlying zone box.
The water in zone box 10 is renewed only by the lateral injection of water from the
adjacent IF box. Vertical injection into zone box 10 from the deep water could not be
constrained using CFCs because CFC-12 in water below ~ 500 m was close to the blank
level of ~ 0.01 pmol kg-1. Here we assume no exchange with deeper (> 500 m) waters.
The residence time of water in each zone box is equal to the volume in the
reservoir of the zone box divided by the sum of the lateral and vertical volume inflow
rates (Fig. 9). The lateral volume flux of water from each IF box equals the lateral
injection coefficient, µi, multiplied by the volume in the reservoir of the zone box (Vi).
The vertical volume flux of water from the ith zone box is equivalent to the vertical
volume flux coefficient (νi) multiplied by the volume in the reservoir of the ith zone box
(Vi). The vertical volume flux of water from zone box 10 is ν10*V10 which is equivalent
to the lateral volume flux, µ10*V10, therefore 1010 µ=v . For zone boxes 1-10, the water
mass budget in the modeled boxes is as follows:
1iii +ν+µ=ν (2)
To derive the history of a dissolved CFC in the CIL box (the CIL source
function), the concentration of each dissolved CFC in CIL was assumed to track the
atmospheric CFC source function (Fig. 2) at a constant saturation ratio. The saturation
ratio used was 73.8 % for CFC-12 and 75.3% for CFC-11 in CIL determined from the
dissolved CFC concentrations observed in the CIL during the 1988 cruise (Fig. 8), the
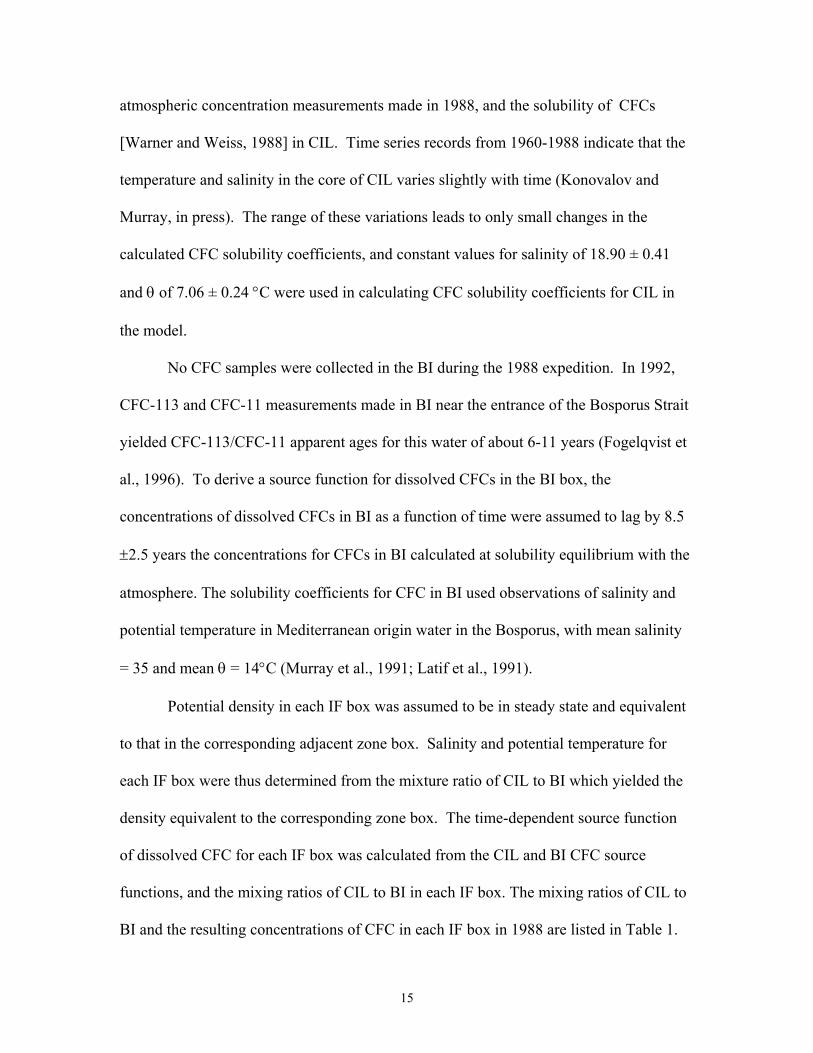
15
atmospheric concentration measurements made in 1988, and the solubility of CFCs
[Warner and Weiss, 1988] in CIL. Time series records from 1960-1988 indicate that the
temperature and salinity in the core of CIL varies slightly with time (Konovalov and
Murray, in press). The range of these variations leads to only small changes in the
calculated CFC solubility coefficients, and constant values for salinity of 18.90 ± 0.41
and θ of 7.06 ± 0.24 °C were used in calculating CFC solubility coefficients for CIL in
the model.
No CFC samples were collected in the BI during the 1988 expedition. In 1992,
CFC-113 and CFC-11 measurements made in BI near the entrance of the Bosporus Strait
yielded CFC-113/CFC-11 apparent ages for this water of about 6-11 years (Fogelqvist et
al., 1996). To derive a source function for dissolved CFCs in the BI box, the
concentrations of dissolved CFCs in BI as a function of time were assumed to lag by 8.5
±2.5 years the concentrations for CFCs in BI calculated at solubility equilibrium with the
atmosphere. The solubility coefficients for CFC in BI used observations of salinity and
potential temperature in Mediterranean origin water in the Bosporus, with mean salinity
= 35 and mean θ = 14°C (Murray et al., 1991; Latif et al., 1991).
Potential density in each IF box was assumed to be in steady state and equivalent
to that in the corresponding adjacent zone box. Salinity and potential temperature for
each IF box were thus determined from the mixture ratio of CIL to BI which yielded the
density equivalent to the corresponding zone box. The time-dependent source function
of dissolved CFC for each IF box was calculated from the CIL and BI CFC source
functions, and the mixing ratios of CIL to BI in each IF box. The mixing ratios of CIL to
BI and the resulting concentrations of CFC in each IF box in 1988 are listed in Table 1.
16
In tuning the model, mean ± 1 σ of the measured distributions of salinity and CFC
concentrations for each zone box were used (Table 2).
In this model we assumed that circulation and hydrology were in steady state, so
possible variations of Mediterranean inflow or river run-off to the Black Sea were not
taken into account. Equation 1 was integrated from 1930 - 1988 for CFC-12, assuming
zero initial concentrations in all boxes in 1930, using an explicit numerical method. The
values for each µi and νi in the corresponding zone box and K were determined by
successive approximation to match the 1988 measured concentration of CFC-12 and
salinity in each zone box simultaneously (Fig. 10).
Potential temperature predicted from the HB model is relatively lower than the
observed potential temperature by up to 0.5°C. Time-series observations of salinity and
temperature at σθ =14.5 for CIL water from 1960 to 1995 (Konovalov and Murray, in
press) showed that during 1960-1984 and in 1988, salinity decreased from 18.63-18.57 to
~18.53 and temperature decreased from 7.1-7.6 to ~6.8oC. The use of the low potential
temperature observed for CIL in 1988 leads to low predictions of potential temperature in
the deep waters in the HB model. Because of the observed variability of temperature in
CIL water on decadal time scales, substantial errors arise in the temperature field in the
HB model due to its steady state assumption.
Variations of potential temperature and salinity in CIL water from the long term
(1960 - 1988) background were about 0.7°C and 0.1 respectively (Konovalov and
Murray, in press). Changes in the solubility coefficient of CFC-12 in the CIL water due
to variations of temperature (0.7°C) and salinity (0.1) were less than 4%. The effects of
variation in the salinity and temperature of CIL on the CFC-12 distribution in the each

17
zone can be estimated, assuming the injection rate of surface-origin water into deep water
was constant. The variation in the inventory of CFC-12 in each zone box due to solubility
effects was less than ~0.2%.
The model transport parameters cannot be uniquely determined from CFC-12 and
salinity distributions because there are uncertainties in each zone box concentration. For
many different values of vertical diffusivity within certain bounds, a set of model µ terms
can be found that fits the salinity and CFC-12 distribution. Our model does place limits,
however, on the range of vertical diffusivity values that are consistent with both the CFC
and salinity distributions. The 1988 CFC-12 distribution indicates that a vertical
diffusivity > 5 x 10⁻⁶ m2 s-1 is not consistent with our model of the Black Sea’s deep
circulation. Diffusivities > 5 x 10⁻⁶ m2 s-1 bring more CFC-12 into the suboxic and anoxic
zone than was observed during 1988.
We used a Monte-Carlo approach to determine the water transport and mixing
rates that best describe the 1988 CFC-12 and salinity distributions. CFC values for each
zone box during 1988 were calculated from the mean ± 1 σ of the measured distribution.
Similarly for each year a CFC concentration in the BI and CIL were randomly selected
from the mean ± 1 σ saturation levels observed in 1988, and the mean ± 1 σ of the
temperature and salinity within the BI and CIL using the Walker et al. (2000) CFC
atmospheric history and Warner and Weiss (1988) solubility. For each calculated CFC
data set, transports (µ1-µ10) were determined that fit the CFC data within ± 2%, and this
procedure was repeated 1000 times for several a-priori designations of k, the model’s
vertical diffusivity.
For some CFC concentration scenarios no set of µ’s can be calculated that fits the

18
1988 calculated CFCs. These cases occur for two reasons: 1) When the calculated CFC
in a zone box is higher than that in its adjacent interface box, the vertical diffusivity may
not provide a large enough source of CFCs to that zone box. 2) Often, the calculated
vertical supply (from above) of CFCs is too large to explain the very steep drop-off in
CFC concentrations measured deeper than the CIL in 1988 (Fig. 6b). These latter cases
become more probable with higher values of k.
The likelihood that a set of model µ’s can be found that fit the CFC observations
generally decreased with increasing vertical diffusivity. The model can fit the CFC
distribution 93 % of the time for k = 0 . For higher diffusivities this probability
decreases, as discussed above (Fig. 11). To determine the “best” model fit, we also
evaluated the proportion of scenarios (that is, the likelihood) that the CFC-derived
transports also explain the salinity distribution by a χ2 test. Unlike the situation for
CFCs, the salinity distribution places a lower bound on likely values for k. This is
because the mixing flux of salinity (density) necessarily dictates the upwelling rate
through the zone boxes (Walin, 1982). The maximum probability of satisfying both CFC
and salinity constraints was found at ~ 1.1 x 10⁻⁶ m2 s-1. The minimum k that provides
solutions at 2/3 (~1 σ) of the maximum probability was about 0.6 x 10⁻⁶ m2 s-1 and the
maximum was about 2.2 x 10⁻⁶ m2 s-1 (Fig. 11). Our model’s circulation was thus
constrained by both tracers, with CFC-12 furnishing an upper bound on k, and salinity
providing a lower bound.
The best fit vertical diffusivity, derived from the CFC-12 HB model was k =
1.1(±0.9)x10-6 m2 sec-1. The magnitude of vertical diffusivity k in the open oceans was
reported to be in the range of 10 to 100 x 10-6 m-2 sec-1 (Munk, 1966; Matear and Wong,

19
1997) which is about one to two orders of magnitude higher than that calculated for the
Black Sea deep waters. However a similar value of k was found in the strongly anoxic
fjord Framvaren with k ranging from 0.1 to 2.7 x 10⁻⁶ m2 sec-1 (Tanhua, 1997).
Microstructure measurements in the suboxic zone of the Black Sea (Gregg and Ozsoy,
1999) for the suboxic-anoxic interface region also yielded estimates of vertical diffusion
coefficients in the range of 10-6 m2 sec-1. The extremely low k in these two basins
compared to the relatively high k in the open ocean reflects the relatively strong
stratification in these two basins and the lack of significant tides in the Black Sea, both of
which likely contribute to the development of anoxic conditions. Gregg and Özsoy
(1999) discuss the possibility that the existence of a suboxic zone in the Black Sea places
an upper bound on k of about 5 x 10⁻⁶ m2 s-1in this region.
The upwelling velocity for each zone box is equivalent to the zone thickness
multiplied by the corresponding vertical volume flux coefficient and decreases with
depth from 8 to 0.06 m yr-1 in zones 1-10, respectively (Table 3). The total upwelling in
the system, that is, the uppermost upwelling flux, v1, was 0.13 Sv in our best fit solution.
This value is 50% higher than the value of 0.8 Sv that is obtained when the Bosporus
inflow rate of 0.01 Sv (Unluata et al., 1989) is multiplied by the BI:CIL entrainment ratio
of 1:7.89. The model-derived residence time for the zone 1 (the suboxic zone) was ~
5 years and is not very different from the ~8 years derived from the volume in the
reservoir of the suboxic zone divided by the inflow rate derived from the entrainment of
Bosporus inflow with CIL water. The volume of the suboxic zone is calculated based on
the surface area of the Black Sea (508,000 km2) (Murray, 1991a), and the thickness of the
suboxic zone (40 m). The inflow rate of ~2500 km3 yr-1 is based on a long term estimate
20
of BI of 312 km3 yr-1 (Unluata et al., 1989) and an entrainment ratio of BI:CIL of 1:7.89
for the suboxic zone water. The residence time of water in each zone box (Table 3)
increased with depth up to about 625 years in zone 10 (~500 m). The residence times for
depths below CIL and above the bottom (2200 m) have been estimated to be ~387
(Murray et al., 1991) and 850 ± 300 years (Top et al., 1990). The residence time derived
from the HB model for depths around 500 m range from 200 - 1000 years (Table 3). The
uncertainty in this estimate is very large because the CFC-12 concentrations in the
deepest layer were near the detection limit.
-CFC-11 removal rate coefficients
The lateral and vertical injection coefficients and vertical diffusion coefficients
determined using CFC-12 and salinity were used to estimate the first order in-situ
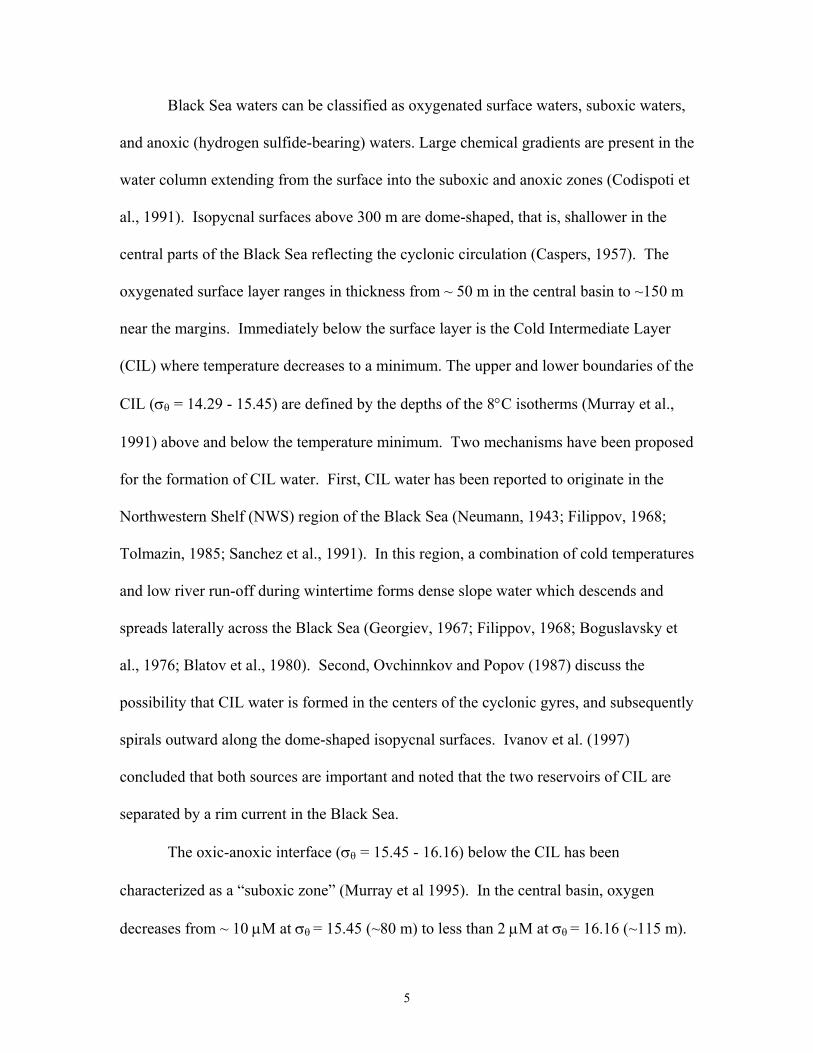
removal coefficient ( kCFC−11 ) for CFC-11 in each depth layer. The calculations were
carried out for CFC-11, assuming zero initial concentration of CFC-11 in all boxes in
1930. The value of kCFC−11 for each horizontal layer was determined by successive
approximation to bring the model predicted CFC-11 concentration in each zone box to
within ~1% of the observed CFC-11 concentrations in 1988 (Fig. 12).
The minimum calculated first-order in-situ removal coefficient kCFC−11 is
0.15(±0.13) yr-1 in the suboxic zone (zone 1) at~80-120 m and the maximum value is
~0.7 (±0.18) yr-1 in zone 4 (~200-240 m). The mean first order CFC-11 in-situ removal
coefficient kCFC−11 was ~ 0.47 (±0.05) yr-1 in the depth range 160-480 m (Table 3). In the
eastern tropical Pacific oxygen minimum zone, where the dissolved oxygen levels are in
the same range as those in the Black Sea suboxic water, vertical profiles of CFC-11 and
21
CFC-12 do not show any clear evidence for CFC-11 removal (Bullister and Lee, 1995).
In this model, the small but non-zero CFC-11 removal term in the suboxic zone indicates
the possibility of in-situ CFC-11 removal, although the relative uncertainty in this
number is substantial.
CFC-11 removal rates have been estimated as 0.9 and 6-9 yr-1 respectively in two
anoxic Basins: Saanich Inlet, B.C., Canada (Bullister and Lee, 1995) and Framvaren
Fjord, Norway (Shapiro et al., 1997). Long-term incubation experiments using anoxic
hydrogen sulfide-bearing waters from Saanich Inlet yielded a CFC-11 first-order removal
coefficient kCFC−11 at 8°C of 0.5 (±0.3) yr-1 (Lee et al., 1999). The first-order in-situ
removal coefficients for CFC-11 derived in this study and in Saanich Inlet are much
lower than that from Framvaren Fjord. The differences in kCFC−11 values derived from
these anoxic basins may be related to differences in chemical and/or biological activity in
these regions and the contrast between the high primary production and particle fluxes in
the coastal Framvaren site and the relatively oligotrophic Black Sea site.
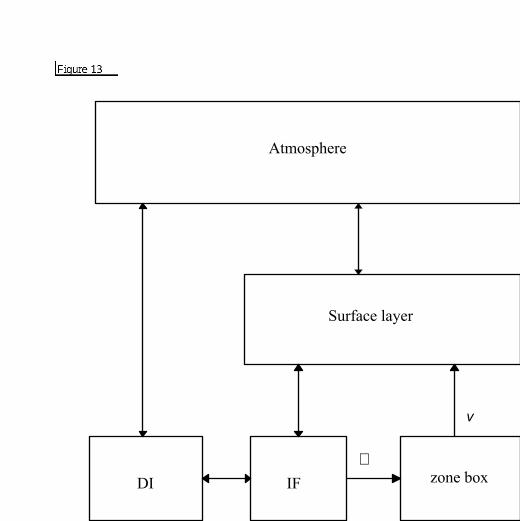
-1-layer box model of CFCs in the Sea of Marmara
A simple 1-layer box model incorporating CFC-11 and CFC-12 as conservative
transient tracers was constructed to estimate the residence time and oxygen utilization
rate of the Sea of Marmara deep water. The box model consisted of Dardanelles inflow
(DI), the Sea of Marmara surface box, an interface (IF) box and a deep zone box with an
upper boundary at 100 m and a bottom boundary at 450 m (Fig. 13). There were no CFC
measurements in the water below 450 m on the 1988 expedition, so water below that
depth was not included. In this model, the water in the deep zone box is renewed by new

22
waters in the IF box which is a mixture of DI water and the Sea of Marmara surface
water. The salinity, potential temperature and potential density of the IF water was
assumed to be in steady state and equal to that observed in the deep zone box. CFC and
dissolved oxygen levels in DI and the Sea of Marmara surface waters were assumed to be
in equilibrium with the atmosphere. CFC and dissolved oxygen concentrations in water
in the IF box, formed by mixing of DI and Sea of Marmara surface water, were assumed
to be at equilibrium with the atmosphere at the temperature and salinity of the IF box
water (38.57±0.02 and 14.5±0.2 oC, respectively). Concentrations of dissolved CFC-11,
CFC-12 and oxygen at equilibrium with the overlying atmosphere in 1988 (CFC-11 =
268.5 ppt and CFC-11 = 486.2 ppt) in the IF box were ~2.98 (±0.03) pmol kg-1, 1.46
(±0.01) pmol kg-1 and 243.9 (±0.9) µmol kg-1 respectively. Average measured
concentrations of CFC-11, CFC-12 and dissolved oxygen in the deep water at Sta. 1 in
1988 were 1.16 ±0.24 pmol kg-1, 0.74±0.08 pmol kg-1 and 37.7 ± 7.8 µmol kg-1
respectively.
The CFC budget for the deep water of the Sea of Marmara was calculated using:
deepIFdeep ]C[]C[
dt]C[d
ν−µ= (3)
In this expression µ and ν are the lateral and vertical volume flux coefficients
respectively. In this case µ = ν and the residence time of the deep water is 1/ν. In this
model the circulation was assumed to be in steady state. Equation 3 was integrated
numerically and the value for the vertical volume flux coefficient was determined by
successive approximation to match the measured concentration of CFC in the deep water
23
in 1988. The values of µ derived from CFC-11 and CFC-12 were 0.046 (±0.015) yr-1 and
0.066 (±0.014) yr-1 respectively. The respective residence times of deep water derived
from CFC-11 and CFC-12 were ~24±8 and 16 ±3.5 years. The relatively large difference
in the values of ν derived using CFC-11 and CFC-12 may be due in part to analytical
problems (these were the first CFC samples measured on the expedition), errors in the
reconstruction of atmospheric histories of CFCs prior to the availability of reliable direct
measurements (errors are estimated as ~2% in 1978 and increase to greater than 10%
with increasing age (Doney and Bullister, 1992) and most likely due to the
simplifications inherent in this model. The residence time of the Sea of Marmara deep
water below 100 m was computed as 6 - 7 years using mass balance techniques (Unluata
et al., 1989).
A rough estimate for the oxygen utilization rate (OUR) in the deep water (Jo2.)
can be obtained by assuming steady state conditions and using the CFC derived flux
coefficients from the simple Sea of Marmara model:
2Odeep2IF2 J]O[]O[0 −ν−µ= (4)
The oxygen utilization rate (Jo2 ) of the Sea of Marmara deep water was thus calculated
to be 9.8 ±3.7 µmol kg-1yr-1 and 13.9±3.8 µmol kg-1yr-1, taking µ = 0.046(±0.015) yr-1
and 0.066(±0.014) yr-1 respectively. These rates are somewhat faster than those
calculated from CFCs in the open North Atlantic (Doney and Bullister, 1992) but
comparable to rates (~9 µmol kg-1yr-1) in the North Pacific derived using pCFC11
apparent ages for water with residence time less than 20 years (Warner et al., 1996).
24
Conclusions
A box-model tuned to CFC-12 was developed for estimating the residence times
of suboxic water and deeper waters in the Black Sea. Estimated residence times of
waters were about ~5 years in the region of the suboxic layer and more than 500 years in
the deep water. The model derived first order CFC removal coefficient kCFC−11 was
~0.15±0.13 yr-1 in the suboxic zone and increased to ~ 0.5 ±0.1 yr-1 in the anoxic waters
(120 - 480m). The CFC-11 removal rates derived for Black Sea anoxic waters using the
HB model are similar to that in Saanich Inlet but lower than estimates made for anoxic
waters in Framvaren. This may reflect real differences in CFC-11 removal rates between
oligotrophic regions and some productive coastal areas.
Estimates of residence times for deep water in the Sea of Marmara were 12-32
years. The average of OUR in the deep water of the Sea of Marmara was ~ 12 µmol kg-1
yr-1 estimated by the CFC box model. The mean OUR in this region is comparable to the
pCFC-11 apparent age derived mean OUR in other regions.
Acknowledgments:
We thank Chief Scientists Zafer Top and Bob Anderson. Emin Ozsoy provided much
help with the CFC analyses. This paper was greatly improved by the efforts of Anatoly
S. Samodurov and an anonymous reviewer. The hydrographic and sampling team
supervised by George White provided the hydrographic data. This work was supported
by NOAA’s Office of Global Programs. This is National Center for Ocean Research,
Taiwan, R.O.C. contribution No. 5; NOAA-PMEL Contribution No. 1484; University of
Washington Contribution No. 1876; Joint Institute for the Study of Atmospheres and

25
Oceans Contribution No. 521.
26
REFERENCES Besiktepe, S., Özsoy, E., Unluata, U., 1993. Filling of the Marmara Sea by the
Dardanelles lower layer inflow. Deep-Sea Research, 40, 1815 - 1838. Blatov, A.S., Kosarev, A.N., Tuzhilkin, V.S., 1980. Variability of the hydrographic
structure of the Black Sea and its links with external factors. Vodnyye resursy (Water Resources), 6, 71-82 (Russian).
Boguslavsky, S.G., Sarkisyan, A.S., Dzhioyev, T.Z., Kolesnikov, L.A., 1976. Analysis of
the Black Sea current calculations. Atmospheric and Oceanic Physics, 12 (3), 205-207 (English translation).
Buesseler, K.O., Livingston, H.D., Casso, S.A., 1991. Mixing between oxic and anoxic
waters of the Black Sea as traced by Chernobyl cesium isotopes. Deep-Sea Research, 38 (Suppl), S725 - S745.
Bullister, J.L., Lee, B.S., 1995. Chlorofluorocarbon-11 Removal in Anoxic Marine
Waters. Geophysical Research Letters, 22, 1893-1896. Bullister, J. L., Weiss, R.F., 1983. Anthropogenic Chlorofluoromethanes in the
Greenland and Norwegian Seas. Science, 221, 265 - 268. Bullister, J.L., Weiss, R.F., 1988. Determination of CCl3F and CCl2F2 in seawater and
air. Deep-Sea Research, Part A, 35, 839-853. Caspers, H., 1957. Black Sea and Sea of Azov. In: Treatise on marine ecology and
paleocology, J. W. Hedgpeth, editor, Geological Society of America Memoire 67, 1, 801-890.
Codispoti, L.A., Friederich, G.E., Murray, J.W., Sakamoto, C.M., 1991. Chemical
variability in the Black Sea: implications of continuous vertical profiles that penetrated the oxic/anoxic interface. Deep-Sea Research, 38 (Suppl.), S691- S710.
Cunnold, D.M., Prinn, R.G., Fraser, P.J., Weiss, R.F., Simmonds, P.G.,. Miller, B.R.,
Alyea, F.N., Crawford, A.J., 1994. Global trends and annual releases of CFCl3 and CF2Cl2 estimates from ALE/GAGE and other measurements from July 1978 to June 1991, Journal of Geophysical Research, 99, 1107-1126.
Doney, S.C., Bullister, J.L.,1992. A chlorofluorocarbon section in the eastern North
Atlantic. Deep-Sea Research, 39, 1857-1883. Filippov, D. M., 1968. Circulation and structure of waters in the Black Sea, Moscow,
Nauka, 136 (Russian). Friederich, G.E., Codispoti, L.A., Sakamoto, C.M., 1990. Bottle and pumpcast data
27
from the 1988 Black Sea Expedition, Monterey Bay Aquarium Research Center Technical. Report, 90-93.
Fogelqvist, E., Tanhua, T., Basturk, O., Salihoglu, I., 1996. The distribution of man-made
and naturally produced halocarbons in a double layer flow strait system. Continental Shelf Research, 16, 1185-1199.
Gammon, R.H., Cline, J., Wisegarver, D.P., 1982. Chlorofluoromethanes in the
Northeast Pacific Ocean: Measured vertical distribution and application as transient tracers of upper ocean mixing. Journal of Geophysical Research, 87, 9441-9454.
Georgiev, Y. S., 1967. On dynamics of cold intermediate layer in the Black sea. In:
Okeanograpficheskiye issledovaniya Chernogo morya (Oceanographic investigations of the Black Sea), Naukova Dumka, Kiev, 105-113.
Gregg, M.C., Özsoy, E., 1999. Mixing on the Black Sea shelf north of the Bosphorus.
Geophysical Research Letters, 26(13) 1809-1872. Ivanov L.I., Besiktepe, S., Ozsoy, E., (1997). Black Sea Cold Intermediate Layer. In:
Sensitivity to Change: Black Sea and North Sea. (E. Özsoy and A. Mikaelyan, eds.) Kluwer Academic Publishers, NATO ASI Series 2: Environment. 27, 253-264.
Khalil, M.A.K., Rasmussen, R.A., 1989. The potential of soils as a sink of
chlorofluorocarbons and other man made chlorocarbons, Geophysical Research Letters, 16, 679 - 682.
Khalil, M.A.K., Rasmussen, R.A., Wang, M.X., Ren, L., 1990. Emissions of trace
gases from Chinese rice fields and biogas generators: CH4, N2O, CO, CO2, chlorocarbons, and hydrocarbons. Chemosphere, 20, 207.
Konovalov S.K. and J.W. Murray (in press) Variations in the basic chemical properties of
the Black Sea on a scale of decades (1960-1995). Journal of Marine Systems. Latif, M.A., Özsoy, E., Oguz, T., Unluata, U. 1991. Observations of the Mediterranean
inflow into the Black Sea., Deep-Sea Research. 38, S711-S723.
Lee, B.-S., 1998. Uses of Chlorofluorocarbons as ocean tracers and for estimating the removal rates of CFC-11 and carbon tetrachloride in certain marine environments. Ph.D. Thesis, University of Washington, Seattle.
Lee, B.-S., Bullister J.L., Whitney, F. A, 1999. Chlorofluorocarbon CFC-11 and Carbon
tetrachloride removal in Saanich Inlet, an Intermittently Anoxic Basin. Marine Chemistry, 66, 171-185.
Lovley, D.R., Woodward, J.C., 1992. Consumption of freons CFC- 11 and CFC-12 by
Anaerobic Sediments and Soils. Environmental Science and Technology, 26, 925-
28
929. Luther, G.W. III, Church, T.M., Powell, D., 1991. Sulfur speciation and possible
sulfide oxidation in the water column of the Black Sea. Deep-Sea Research, 38 (Suppl.), S1121-S1137.
Matear, R.J., Wong, C.S., 1997. Estimation of vertical mixing in the upper ocean at
Station P from chlorofluorocarbons. Journal of Marine Research, 55, 507-521. Munk, W. 1966. Abyssal recipes. Deep Sea Research, 13, 707-730. Murray J. W., 1991a. The 1988 Black Sea Oceanographic Expedition: introduction and
summary. Deep-Sea Research, 38 (Suppl), S655 - S661. Murray J.W., 1991b. Hydrographic variability in the Black Sea. In: (E. Izdar and J.W.
Murray, eds.) Black Sea Oceanography. Kluwer Academic Pub. NATO ASI Series C: Mathematical and Physical Sciences, 351, 1-16.
Murray, J. W., Top, Z., Özsoy, E., 1991. Temperature and salinity distributions in the
Black Sea. Deep-Sea Research, 38 (Suppl.), S663-S689. Murray, J. W., Codispoti, L.A., Friederich, G.E., 1995. Redox Environments: The
Suboxic Zone in the Black Sea. In: C. P. Huang, C. O’Melia and J. J. Morgan, eds., Aquatic Chemistry, 157.
Neumann, G., 1943. Uber der Aufau und die Frage der Tiefenfenzirkulation des
Schwarzen Meers. Alannalen Hydrographic and Maritimen Meterologic, 7 (1), 1-20. Östlund, H.G., Dyrssen, D., 1986. Renewal rates of the Black Sea deep water. In: The
chemical and physical oceanography of the Black sea. Reports of the Chemistry of the Sea XXXIII, University of Göteborg, Göteborg, Sweden.
Ovchinnikov, I. M., Popov, Y.I., 1987. Evolution of the cold intermediate layer in the
Black Sea. Oceanography, 27, 555-560. Özsoy, E., Unluata, U., Top, Z., 1993. The evolution of Mediterranean water in the
Black Sea: interior mixing and material transport by double diffusive intrusions. Progress in Oceanography, 31, 275 - 320.
Prinn, R. G., Weiss, R.F., Fraser, P.J., Simmonds, P.G., Cunnold, D.M., Alyea, F.N.,
O'Doherty, S., Salameh, P., Miller, B.R., Huang, J., Wang, R.H.J., Hartley, D.E., Harth, C., Steele, L.P., Sturrock, G., Midgley, P.M., McCulloch, A., 2000. A history of chemically and radiatively important gases in air deduced from ALE/GAGE/AGAGE Journal of Geophysical Research, 105, 17,751-17,792.

29
Roemmich, D., 1983. Optimal estimation of hydrographic station data and derived fields. Journal of Physical Oceanography, 13, 1544-1549.
Sabine, C., Key, R.M., Johnson, K.M., Millero, F.J., Poisson, A., Sarmiento, J.L.,
Wallace, D.W.R., Winn, C.D., 1999. Anthropogenic CO2 inventory of the Indian Ocean. Global Biogeochemical Cycles, 13, 179-198.
Sanchez, A.L., Gustaud, J., Noshkin, V., Buesseler, K.O., 1991. Plutonium oxidation
states in the southwestern Black Sea: evidence regarding the origin of the cold intermediate layer. Deep-Sea Research, 38 (Suppl.), S845-S853.
Shapiro, S.D., Schlosser, P., Smethie, W.M., Stute, M., 1997. The use of 3H and
tritiogenic 3He to determine CFC degradation rates in Framvaren Fjord, Norway. Marine Chemistry, 59,141-157.
Tanhua, T., 1997. Halogenated substances as marine tracers. Ph.D. Thesis, Göteborg
University, Sweden. Tolmazin, D., 1985. Changing coastal oceanography of the Black Sea. I: northwestern
shelf. Progress in Oceanography, 15, 217-276. Top, Z., Izdar, E., Ergun, M., Konuk, T., 1990. Evidence of Tectonism from He-3 and
residence time of helium in the Black Sea. EOS, 71, 1020-1021. Unluata, U.T., Oguz, T., Latif, M.A., Özsoy, E., 1989. On the physical oceanography of
the Turkish Straits. In: The physical oceanography of sea straits, L.J. Pratt, editor, NATO ASI Series, Kluwer, Deventer, The Netherlands.
Walin, 1982. On the relation between sea-surface heat flow and thermal circulation in
the ocean. Tellus, 34, 187-195. Walker, S.J., Weiss, R.F., Salameh, P., 2000. Reconstructed histories of the annual mean
atmospheric mole fractions for the halocarbons CFC-11, CFC-12, CFC-113 and carbon tetrachloride. Journal of Geophysical Research, 105, C6, 14,285-14,296.
Warner, M. J., Weiss, R.F., 1988. Solubilities of Chlorofluorocarbons 11 and 12 in
water and seawater. Deep-Sea Research, 32, 1485-1497. Warner, M.J., Bullister, J.L., Wisegarver, D.P., Gammon, R.H., Weiss, R.F., 1996.
Basin-wide distributions of Chlorofluorocarbons CFC-11 and CFC-12 in the North Pacific: 1985-1989. Journal of Geophysical Research, 101, 20525 - 20542.
Weiss, R.F., Bullister, J.L, Gammon, R.H., Warner, M.J., 1985. Atmospheric
Chlorofluoromethanes in the deep equatorial Atlantic. Nature, 314, 608-610. White, G., Relander, M., Postal, J., Murray, J., 1989. Hydrographic data from the 1988

30
Black Sea Oceanographic Expedition, Special Report No. 109, Reference A89-1, University of Washington, School of Oceanography
Woodruff, D., Diaz, H.F., Elms, J.D., Worley, S.J. . 1998. COADS Release 2 Data and
Metadata Enhancements for Improvements of Marine Surface Flux Fields. Physics and Chemistry of the Earth, 23, No. 5-6, pp. 517-526.
31
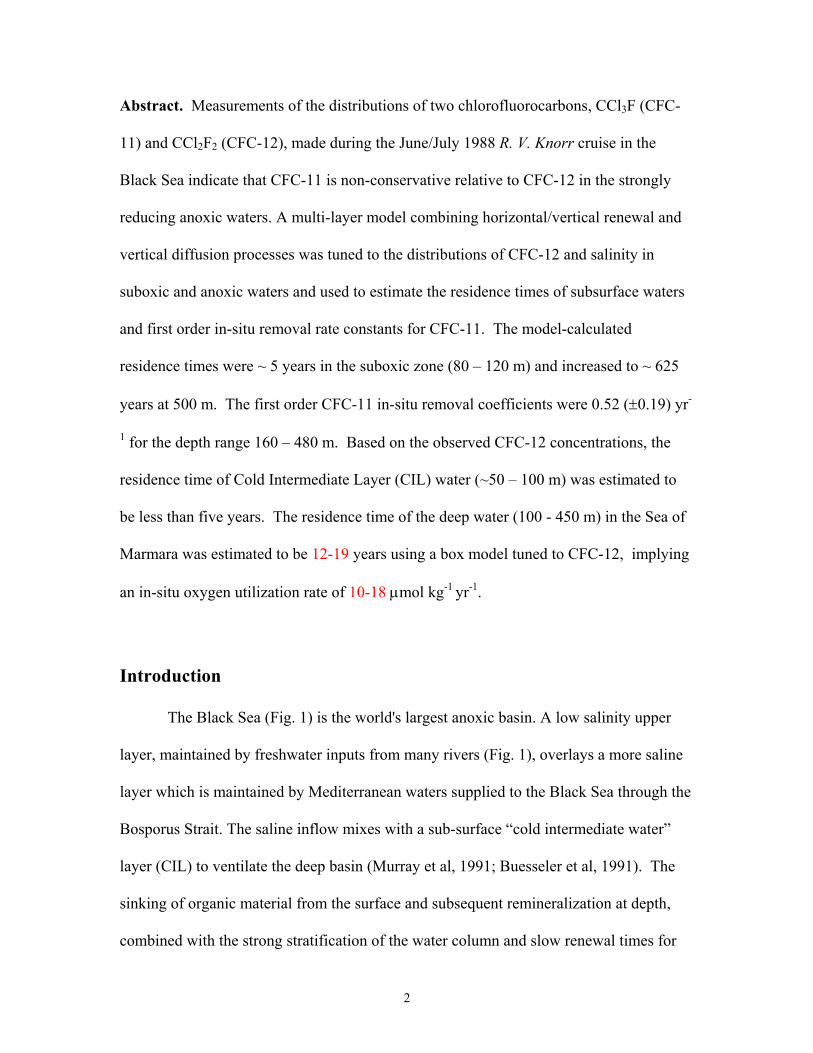
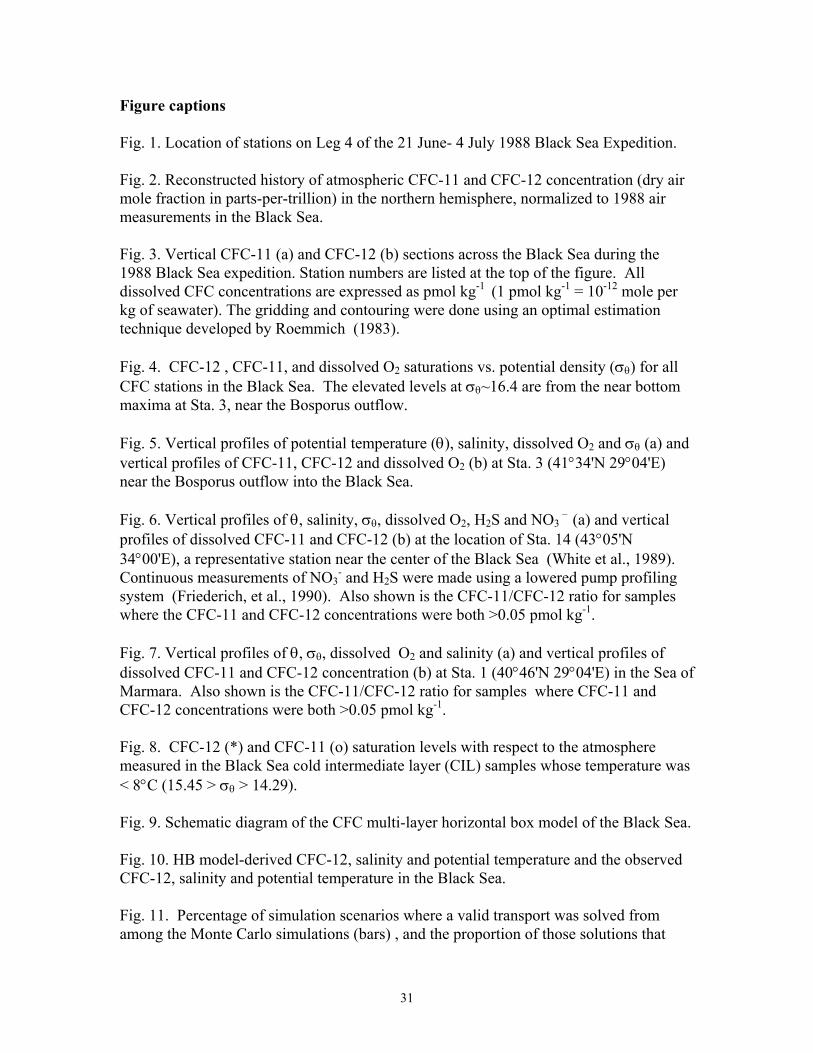
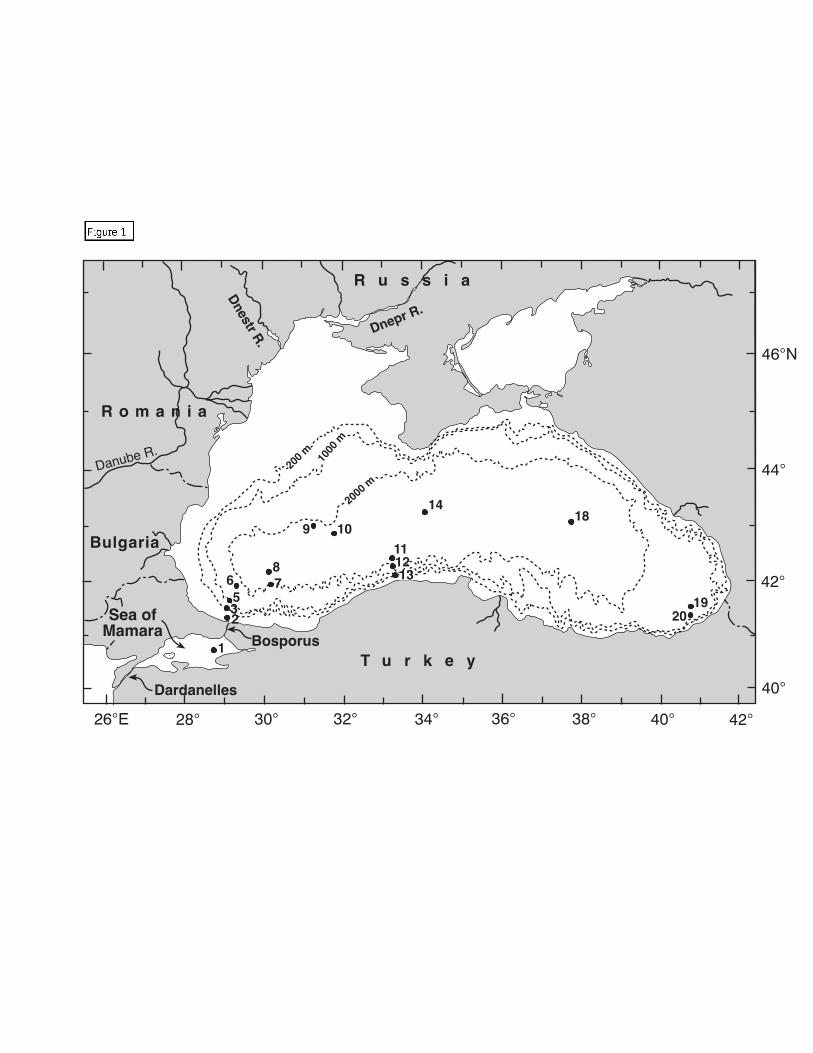
Figure captions Fig. 1. Location of stations on Leg 4 of the 21 June- 4 July 1988 Black Sea Expedition. Fig. 2. Reconstructed history of atmospheric CFC-11 and CFC-12 concentration (dry air mole fraction in parts-per-trillion) in the northern hemisphere, normalized to 1988 air measurements in the Black Sea. Fig. 3. Vertical CFC-11 (a) and CFC-12 (b) sections across the Black Sea during the 1988 Black Sea expedition. Station numbers are listed at the top of the figure. All dissolved CFC concentrations are expressed as pmol kg-1 (1 pmol kg-1 = 10-12 mole per kg of seawater). The gridding and contouring were done using an optimal estimation technique developed by Roemmich (1983). Fig. 4. CFC-12 , CFC-11, and dissolved O2 saturations vs. potential density (σθ) for all CFC stations in the Black Sea. The elevated levels at σθ~16.4 are from the near bottom maxima at Sta. 3, near the Bosporus outflow. Fig. 5. Vertical profiles of potential temperature (θ), salinity, dissolved O2 and σθ (a) and vertical profiles of CFC-11, CFC-12 and dissolved O2 (b) at Sta. 3 (41°34'N 29°04'E) near the Bosporus outflow into the Black Sea. Fig. 6. Vertical profiles of θ, salinity, σθ, dissolved O2, H2S and NO3
– (a) and vertical profiles of dissolved CFC-11 and CFC-12 (b) at the location of Sta. 14 (43°05'N 34°00'E), a representative station near the center of the Black Sea (White et al., 1989). Continuous measurements of NO3
- and H2S were made using a lowered pump profiling system (Friederich, et al., 1990). Also shown is the CFC-11/CFC-12 ratio for samples where the CFC-11 and CFC-12 concentrations were both >0.05 pmol kg-1. Fig. 7. Vertical profiles of θ, σθ, dissolved O2 and salinity (a) and vertical profiles of dissolved CFC-11 and CFC-12 concentration (b) at Sta. 1 (40°46'N 29°04'E) in the Sea of Marmara. Also shown is the CFC-11/CFC-12 ratio for samples where CFC-11 and CFC-12 concentrations were both >0.05 pmol kg-1. Fig. 8. CFC-12 (*) and CFC-11 (o) saturation levels with respect to the atmosphere measured in the Black Sea cold intermediate layer (CIL) samples whose temperature was < 8°C (15.45 > σθ > 14.29). Fig. 9. Schematic diagram of the CFC multi-layer horizontal box model of the Black Sea. Fig. 10. HB model-derived CFC-12, salinity and potential temperature and the observed CFC-12, salinity and potential temperature in the Black Sea. Fig. 11. Percentage of simulation scenarios where a valid transport was solved from among the Monte Carlo simulations (bars) , and the proportion of those solutions that

32
also satisfied the concurrently measured salinity distribution by a reduced χ2 test (solid line). Fig. 12. Observed CFC-11 in the Black Sea, HB model-derived CFC-11 at best kCFC−11 for each zone layer and HB model-derived CFC-11 assuming kCFC−11 = 0. Fig. 13. Schematic diagram of the CFC box model for the Sea of Marmara.
33
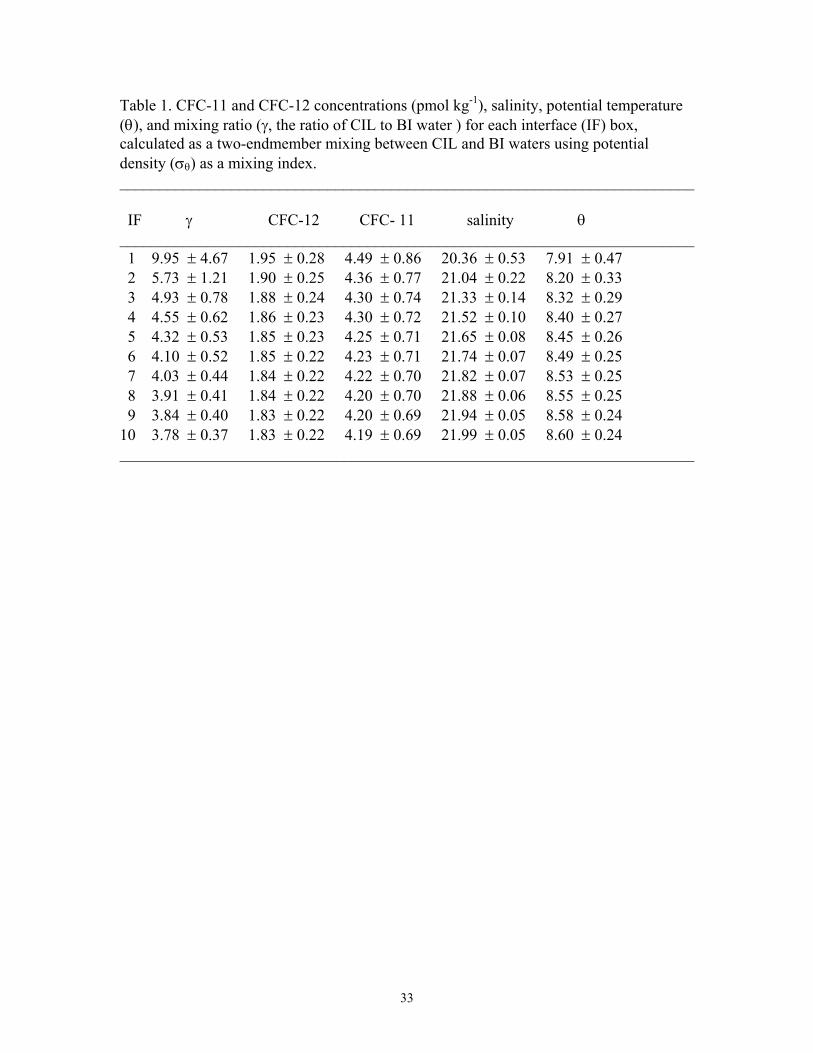
Table 1. CFC-11 and CFC-12 concentrations (pmol kg-1), salinity, potential temperature (θ), and mixing ratio (γ, the ratio of CIL to BI water ) for each interface (IF) box, calculated as a two-endmember mixing between CIL and BI waters using potential density (σθ) as a mixing index. ________________________________________________________________________
IF γ CFC-12 CFC- 11 salinity θ ________________________________________________________________________ 1 9.95 ± 4.67 1.95 ± 0.28 4.49 ± 0.86 20.36 ± 0.53 7.91 ± 0.47 2 5.73 ± 1.21 1.90 ± 0.25 4.36 ± 0.77 21.04 ± 0.22 8.20 ± 0.33 3 4.93 ± 0.78 1.88 ± 0.24 4.30 ± 0.74 21.33 ± 0.14 8.32 ± 0.29 4 4.55 ± 0.62 1.86 ± 0.23 4.30 ± 0.72 21.52 ± 0.10 8.40 ± 0.27 5 4.32 ± 0.53 1.85 ± 0.23 4.25 ± 0.71 21.65 ± 0.08 8.45 ± 0.26 6 4.10 ± 0.52 1.85 ± 0.22 4.23 ± 0.71 21.74 ± 0.07 8.49 ± 0.25 7 4.03 ± 0.44 1.84 ± 0.22 4.22 ± 0.70 21.82 ± 0.07 8.53 ± 0.25 8 3.91 ± 0.41 1.84 ± 0.22 4.20 ± 0.70 21.88 ± 0.06 8.55 ± 0.25 9 3.84 ± 0.40 1.83 ± 0.22 4.20 ± 0.69 21.94 ± 0.05 8.58 ± 0.24 10 3.78 ± 0.37 1.83 ± 0.22 4.19 ± 0.69 21.99 ± 0.05 8.60 ± 0.24 ________________________________________________________________________

34
Table 2. CFC-12 and CFC-11 concentrations (pmol kg-1 ), salinity and potential temperature (θ) (with uncertainty) calculated for each zone box. The 1988 Black Sea Expedition stations used are 3, 5-9, 11, 12, 14, and 18-20. _______________________________________________________________________ Zone σθ CFC-12 CFC-11 salinity θ _______________________________________________________________________ 1 15.450 -16.178 0.79 ± 0.19 1.22 ± 0.54 20.46 ± 0.27 8.18 ± 0.22 2 16.178 -16.451 0.47 ± 0.07 0.36 ± 0.12 21.02 ± 0.09 8.53 ± 0.06 3 16.451 -16.610 0.26 ± 0.05 0.13 ± 0.08 21.38 ± 0.05 8.69 ± 0.02 4 16.610 -16.717 0.15 ± 0.03 0.04 ± 0.01 21.57 ± 0.07 8.76 ± 0.02 5 16.717 -16.799 0.11 ± 0.02 0.03 ± 0.01 21.69 ± 0.03 8.79 ± 0.01 6 16.799 -16.858 0.07 ± 0.01 0.02 ± 0.00 21.81 ± 0.02 8.82 ± 0.00 7 16.858 -16.910 0.07 ± 0.02 0.03 ± 0.03 21.88 ± 0.02 8.83 ± 0.00 8 16.910 -16.950 0.04 ± 0.00 0.01 ± 0.00 21.95 ± 0.00 8.83 ± 0.00 9 16.950 -16.986 0.04 ± 0.01 0.01 ± 0.01 21.99 ± 0.01 8.84 ± 0.00 10 16.986 -17.016 0.02 ± 0.01 0.01 ± 0.01 22.03 ± 0.01 8.84 ± 0.00 _______________________________________________________________________
35
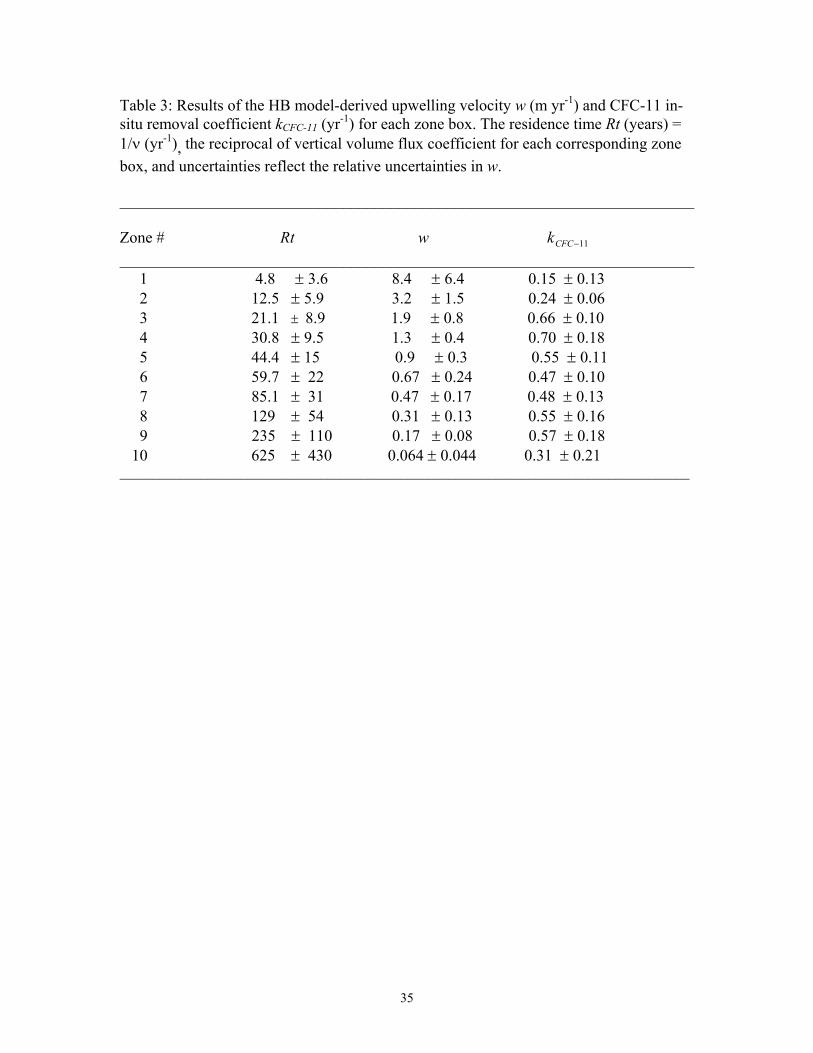
Table 3: Results of the HB model-derived upwelling velocity w (m yr-1) and CFC-11 in-situ removal coefficient kCFC-11 (yr-1) for each zone box. The residence time Rt (years) = 1/ν (yr-1), the reciprocal of vertical volume flux coefficient for each corresponding zone box, and uncertainties reflect the relative uncertainties in w. ________________________________________________________________________ Zone # Rt w kCFC−11 ________________________________________________________________________ 1 4.8 ± 3.6 8.4 ± 6.4 0.15 ± 0.13 2 12.5 ± 5.9 3.2 ± 1.5 0.24 ± 0.06 3 21.1 ± 8.9 1.9 ± 0.8 0.66 ± 0.10 4 30.8 ± 9.5 1.3 ± 0.4 0.70 ± 0.18 5 44.4 ± 15 0.9 ± 0.3 0.55 ± 0.11 6 59.7 ± 22 0.67 ± 0.24 0.47 ± 0.10 7 85.1 ± 31 0.47 ± 0.17 0.48 ± 0.13 8 129 ± 54 0.31 ± 0.13 0.55 ± 0.16 9 235 ± 110 0.17 ± 0.08 0.57 ± 0.18 10 625 ± 430 0.064 ± 0.044 0.31 ± 0.21 _____________________________________________________________________________________
T u r k e y
R u s s i a
R o m a n i a
1
2
687
9 10
53
2000
m
1418
1920
1112
Danube R.
26°E 28° 30° 32° 34° 36° 38° 40° 42°
Bulgaria
Sea ofMamara
46°N
44°
42°
40°
200 m 10
00 m
Dnepr R.
Dnestr R
.
13
Bosporus
Dardanelles
Year
1930 1940 1950 1960 1970 1980 1990
CFC
-11
and
CFC
-12
mix
ing
ratio
s (p
pt, 1
0-12 v
/v)
0
100
200
300
400
500
CFC
-11/CFC
-12
0.0
0.1
0.2
0.3
0.4
0.5
0.6
CFC-11/CFC-12
CFC-12
CFC-11
0.03
0.03
0.03
0.05
0.05
0.10.2 0.40.81.6 3.2
30 32 34 36 38 40
2000
1500
1000
500
0
Longitude (E)
Dep
th (
m)
.
.
.
.
..
.
.
..
..
..
.
.
.
.
.
.
.
.
..
.
..
.
.
.
.
.
.
.
.
.
.
.
.
.
.
.
.
.
..
..
.
.
.
.
.
.
.
.
.
.
.
.
.
..
...
...
.
.
.
.............
.
.
.
.
.
.
.
.
.
.
.
.
.
.
..
.
.
...
.
.
.
.
.
.
.
.
.
.
.
.
.
.
.
.
.
.
..
...
.
.
.
.
.
.
.
.
.
.
.
..
..
....
.
.
.
.
.
.
.
.
.
..
.
.
.
.
.
.
.
.
.
.
.
.
.
.
..
...
...
..
5 3 6 8 7 9 10 11 14 18 20 19
0.015
0.015
0.030.05
0.1 0.20.40.6 0.81.2 1.6
30 32 34 36 38 40
2000
1500
1000
500
0
Longitude (E)
Dep
th (
m)
.
.
.
.
..
.
.
..
..
..
.
.
.
.
.
.
.
.
..
.
..
.
.
.
.
.
.
.
.
.
.
.
.
.
.
.
.
.
..
..
.
.
.
.
.
.
.
.
.
.
.
.
.
..
...
...
.
.
.
.............
.
.
.
.
.
.
.
.
.
.
.
.
.
.
..
.
.
...
.
.
.
.
.
.
.
.
.
.
.
.
.
.
.
.
.
.
..
...
.
.
.
.
.
.
.
.
.
.
.
..
..
....
.
.
.
.
.
.
.
.
.
..
.
.
.
.
.
.
.
.
.
.
.
.
.
.
..
...
...
..
5 3 6 8 7 9 10 11 14 18 20 19
CFC-11, CFC-12, and O2 saturation ratios
0.0 0.5 1.0 1.5 2.0
0.0 0.5 1.0 1.5 2.0
Pote
ntia
l den
sity
σθ
11
12
13
14
15
16
17
CFC-11 saturation ratio
CFC-12 saturation ratio
O2 saturation ratio
Potential temperature θ (oC)
6 8 10 12 14 16 18 20 22 24
Dep
th (m
eter
s)
0
50
100
150
200
Potential density σθ
10 11 12 13 14 15 16 17
Salinity
16 17 18 19 20 21 22
O2 (µmol/kg)
0 50 100 150 200 250 300 350
θ
σθ
Sal
O2

CFC-11 and CFC-12 (pmol/kg)
0 1 2 3 4 5 6
Dep
th (m
eter
s)
0
50
100
150
200
O2 (µmol/kg)
0 50 100 150 200 250 300 350
CFC-12
O2
CFC-11
H2S and O2 (mmol/kg)0 50 100 150 200 250 300 350
Dep
th (m
eter
s)
0
100
200
300
400
500
Nitrate (mmol/kg)0 2 4 6 8 10
Silicate (mmol/kg)0 50 100 150 200 250
Salinity17 18 19 20 21 22 23
Potential temperature θ (oC)6 8 10 12 14 16 18 20 22
Potential density σθ
11 12 13 14 15 16 17 18
σθsal
silicateH2S
θ
NO3-
O2
CFC-11 and CFC-12 (pmol/kg)
0 1 2 3 4 5 6
0 1 2 3 4 5 6
Dep
th (m
eter
s)
0
100
200
300
400
500
CFC-11/CFC-12
CFC-11CFC-11/CFC-12CFC-12
Salinity
21 24 27 30 33 36 39
Dep
th (m
eter
s)
0
100
200
300
400
500
Potential temperature θ (oC)
11 12 13 14 15 16
σθ
16 20 24 28 32
Dissolved oxygen (µmol/kg)
0 50 100 150 200 250 300 350
Potential density σθ
θ Sal
Sta. 1
O2
CFC-11 and CFC-12 (pmol/kg)
0.5 1.0 1.5 2.0 2.5 3.0 3.5 4.0 4.5
0.5 1.0 1.5 2.0 2.5 3.0 3.5 4.0 4.5
Dep
th (m
eter
s)
0
100
200
300
400
500
0
100
200
300
400
500
CFC-11/CFC-12
CFC-11CFC-12
CFC-11/CFC-12

5 10 15 2040
50
60
70
80
90
100
110
Black Sea Station Number
atm
osph
eric
sat
urat
ion
(%)

��
�������
��
���
���
���
���
���
�����
�����
�����
�����
�����
������
�
� �
�
�
�
�
���
����
��
����
��
����
�����
���������
�
����
���
���
���
���
����
�����
�����
�����
������
������
� �
� �
� �
� �
� �
���������
��������
��������
���������
���������������
�
�
�
�
�

CFC-12 (pmol/kg)
0.0 0.5 1.0 1.5
Dep
th (
met
ers)
050
100150200250300350400450500
Salinity
19.5 20.0 20.5 21.0 21.5 22.0 22.5
Dep
th (
met
ers)
050
100150200250300350400450500
Potential temperature θ (oC)
7.6 7.8 8.0 8.2 8.4 8.6 8.8 9.0
Dep
th (
met
ers)
050
100150200250300350400450500
Observed
HB model
HB model
Observed
Observed
HB model

0 1 2 30
20
40
60
80
100
k in black sea model (10−6 m2 s−1)
% o
f sce
nario
s so
lvab
le

CFC-11 (pmol/kg)
0.0 0.5 1.0 1.5 2.0 2.5 3.0 3.5 4.0 4.5
0.0 0.5 1.0 1.5 2.0 2.5 3.0 3.5 4.0 4.5
Dep
th (
met
ers)
0
50
100
150
200
250
300
350
400
450
500
0
50
100
150
200
250
300
350
400
450
500
Observed
HB model
HB model (kCFC-11 = 0)
���������
�� �������
�� ��������
��
�
Top Related