


Languages
Pages
Legal


Barclays PLC Becoming the ‘Go-To’ bank
12 February 2013
NEW IMAGE TO BE ADDED

2 | Barclays Strategic Review | 12 February 2013
Our goal
To make Barclays the ‘Go-To’ bank for all of our stakeholders

3 | Barclays Strategic Review | 12 February 2013
Our strategic plan
To make Barclays the ‘Go-To’ bank for all of our stakeholders
Transform programme
Turnaround Return
Acceptable Numbers
Sustain Forward
Momentum
Turnaround
Return Acceptable Numbers
Sustain FORward Momentum
Stabilise the organisation, provide context for the change to come, maintain short-term momentum
Improve business returns define and execute plan to deliver RoE above CoE
Become the ‘Go-To’ bank for our stakeholders – customers and clients, colleagues, investors and wider society
4 | Barclays Strategic Review | 12 February 2013
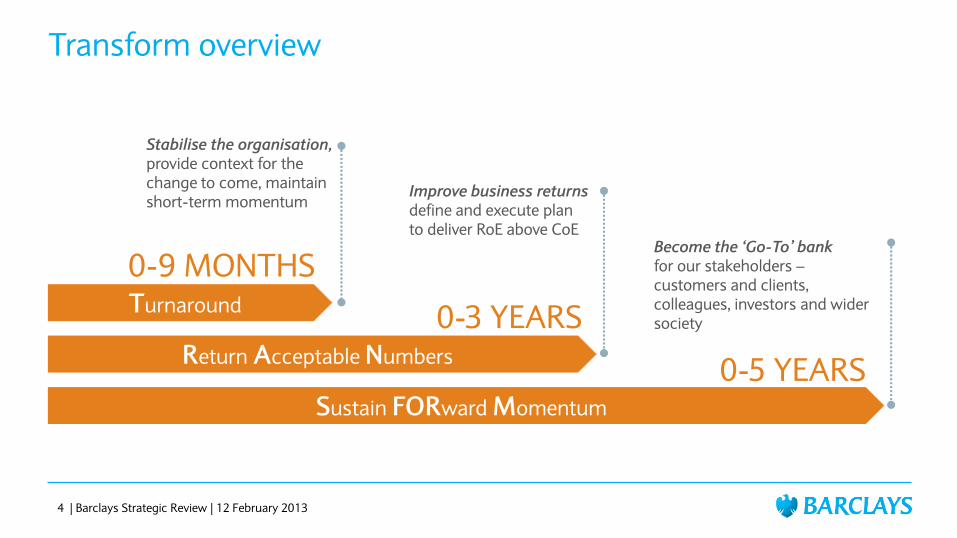
Transform overview
Turnaround
Return Acceptable Numbers
Sustain FORward Momentum
Stabilise the organisation, provide context for the change to come, maintain short-term momentum
Improve business returns define and execute plan to deliver RoE above CoE
Become the ‘Go-To’ bank for our stakeholders – customers and clients, colleagues, investors and wider society
0-9 MONTHS
0-3 YEARS
0-5 YEARS

5 | Barclays Strategic Review | 12 February 2013
Turnaround - our purpose
To help people achieve their ambitions – in the right way
Turnaround
Return Acceptable Numbers
Sustain FORward Momentum
6 | Barclays Strategic Review | 12 February 2013
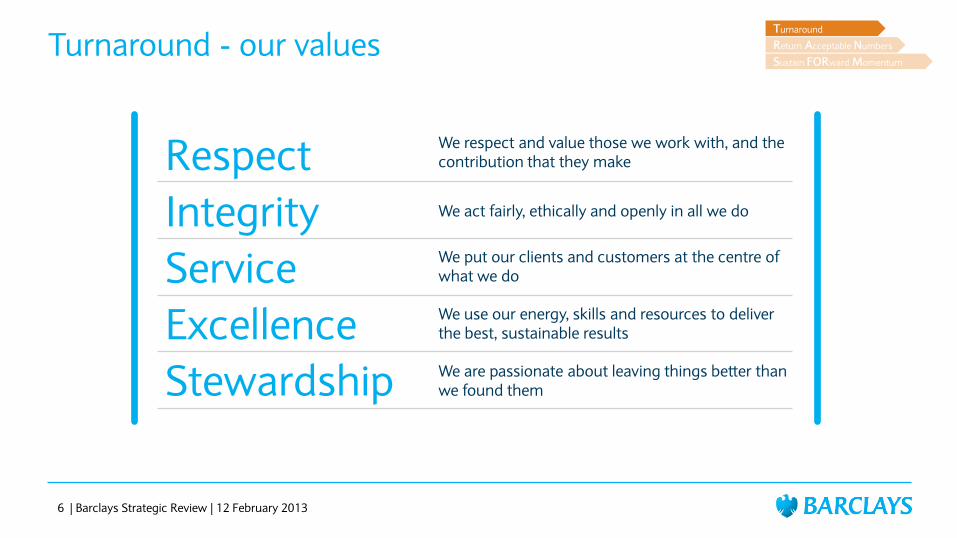
Turnaround - our values
Respect
Integrity
Service
Excellence
Stewardship
We respect and value those we work with, and the contribution that they make
We act fairly, ethically and openly in all we do
We put our clients and customers at the centre of what we do
We use our energy, skills and resources to deliver the best, sustainable results
We are passionate about leaving things better than we found them
Turnaround
Return Acceptable Numbers
Sustain FORward Momentum

7 | Barclays Strategic Review | 12 February 2013
Turnaround Turnaround
Return Acceptable Numbers
Sustain FORward Momentum
Delivering financial objectives for 2012
Demonstrating our resilience and strong franchise
Commitment of our staff

8 | Barclays Strategic Review | 12 February 2013
Return Acceptable Numbers
…above… Return on
Equity Cost of Equity
Turnaround
Return Acceptable Numbers
Sustain FORward Momentum

9 | Barclays Strategic Review | 12 February 2013
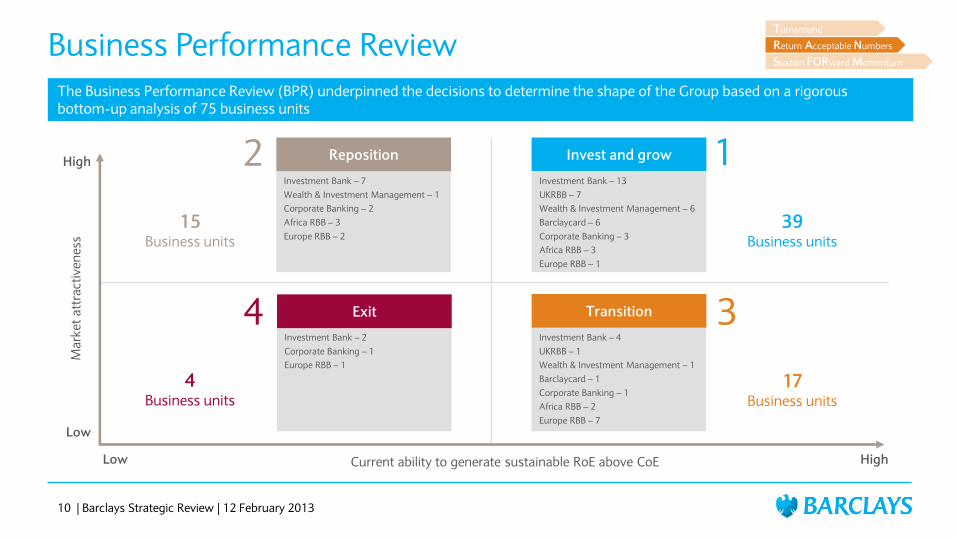
Business Performance Review - assumptions
• Muted economic outlook
• Estimated costs for Basel 3 and other regulatory changes included
• Reputational risks assessed through purpose and values lens
• Head Office allocations considered, but not included in business metrics
Turnaround
Return Acceptable Numbers
Sustain FORward Momentum
10 | Barclays Strategic Review | 12 February 2013
Investment Bank – 7
Wealth & Investment Management – 1
Corporate Banking – 2
Africa RBB – 3
Europe RBB – 2
2 Reposition
15 Business units
1 Invest and grow
39 Business units
Investment Bank – 2
Corporate Banking – 1
Europe RBB – 1
4 Exit
4 Business units
Investment Bank – 4
UKRBB – 1
Wealth & Investment Management – 1
Barclaycard – 1
Corporate Banking – 1
Africa RBB – 2
Europe RBB – 7
3 Transition
17 Business units
Investment Bank – 13
UKRBB – 7
Wealth & Investment Management – 6
Barclaycard – 6
Corporate Banking – 3
Africa RBB – 3
Europe RBB – 1
Current ability to generate sustainable RoE above CoE High Low
Ma
rke
t a
ttra
ctiv
en
ess
High
Low
The Business Performance Review (BPR) underpinned the decisions to determine the shape of the Group based on a rigorous bottom-up analysis of 75 business units
Business Performance Review Turnaround
Return Acceptable Numbers
Sustain FORward Momentum

11 | Barclays Strategic Review | 12 February 2013
2 Reposition
15 Business units
1 Invest and grow
39 Business units
4 Exit
4 Business units
3 Transition
17 Business units
Key metrics 2012
Income (£bn) 4.5
PBT (£bn) 0.5
B3 RWA (£bn) 62
Key metrics 2012
Income (£bn) 22.0
PBT (£bn) 7.7
B3 RWA (£bn) 287
Key metrics 2012
Income (£bn) 0.4
PBT (£bn) (1.1)
B3 RWA (£bn) 92
Key metrics 2012
Income (£bn) 2.2
PBT (£bn) 1.0
B3 RWA (£bn) 21
18% RoE
Current ability to generate sustainable RoE above CoE High Low
Ma
rke
t a
ttra
ctiv
en
ess
High
Low
Turnaround
Return Acceptable Numbers
Sustain FORward Momentum
1All footnotes are listed in the appendix
BPR – financial output 1

12 | Barclays Strategic Review | 12 February 2013
Investment Bank
Largest business in the Group and well positioned to be one of the few full-service global investment banks, leveraging on our strong UK and US positions to serve our clients
A leader in FICC
• Mature, at scale platforms
• Client-orientated flow business model
Large US and UK franchises, complemented by global reach
• Consistent growth in Equities and IBD in both US and UK
Focus on returns generation under Basel 3
• Proactive RWA management in FICC
• Right-sizing across all divisions to reflect market opportunities
• Profitable growth in the front-book
• Reduce legacy asset drag on returns
Turnaround
Return Acceptable Numbers
Sustain FORward Momentum

13 | Barclays Strategic Review | 12 February 2013
FICC
A leading scale player with top tier position across products
• Strong and diversified business, well positioned to benefit from retrenchment of competitors
• Leader in client-driven flow businesses
• Scale player with operating efficiencies
• State-of-the art trading platform e.g. BARX
• Ongoing technology investment programme to maintain competitive advantage
• Proactive RWA management – plans to reduce legacy book from £79bn to £36bn in 2015
Best Flow House European FICC
House of the Year Best Multi-Asset Class
Platform
Turnaround
Return Acceptable Numbers
Sustain FORward Momentum
Euromoney Awards 2012

1st
2nd
3rd
4th
5th
6th
7th
8th
9th
Ra
nk
ing
14 | Barclays Strategic Review | 12 February 2013
Equities and Investment Banking Division
Monetise market share gains in key markets
• Good progress in build-outs in a tough market environment
• Material market share gains in US and UK, which represent half the global revenue pool
• Growth based on ability to provide global reach to clients
• Focus on generating sustainable returns
• Though lower capital intensity, continue to scrutinise RWAs
• Right-size our footprint in some markets to reflect current market opportunity
• Reassess market conditions for improvement or worsening
#2 in US ECM
#1 in overall UK (ECM, M&A and DCM)
Highest ever ranking demonstrating growth2
Moved from #5 to #1 of overall UK IBD fees
2008-2012 Best Debt House
2012 share of reported Equities revenues vs. competitors2
Progression since 2010
Turnaround
Return Acceptable Numbers
Sustain FORward Momentum
Euromoney Awards 2012
£bn

15 | Barclays Strategic Review | 12 February 2013
Structured Capital Markets
• Closing our Structured Capital Markets tax-related business unit
• We will not engage in complex structures where the primary objective is accessing tax benefits
• Incompatible with our purpose and the new tax principles we are publishing today

16 | Barclays Strategic Review | 12 February 2013
Investment Banking
The Investment Bank will remain a large and very important part of the Group going forward
Single digit growth
£210-230bn
Mid 30s
14-15%
£11.7bn
£257bn3
39%
13.7%
FY 15 FY 12
Income
Proforma B3 RWA
Comp:Income
RoE4
Turnaround
Return Acceptable Numbers
Sustain FORward Momentum

17 | Barclays Strategic Review | 12 February 2013
Corporate Banking
In 2010 the business was repositioned and turnaround is progressing well
Adjusted PBT
(314)
204
551
2010 2011 2012
• Deal decisively with legacy issues
• Exited Russia, Indonesia and India Retail
• Reduce legacy portfolios in Europe5
• Continue to strengthen our market leading UK franchise
• Leverage our home market in UK and increasingly in Africa
• Provide multinational clients with full suite of investment banking and corporate products
• Plan for modest income growth but significant RoE improvement to over 10% by 2015
Turnaround
Return Acceptable Numbers
Sustain FORward Momentum
£m
2010

18 | Barclays Strategic Review | 12 February 2013
UK RBB
A leading franchise in our UK home market
• High performing despite macroeconomic environment
• Focus on deepening customer engagement and enhancing customer satisfaction, with innovation and technology
• Drive income growth in Business Banking and mortgages
• Sharpen focus on costs to drive reduction in Cost:Income ratio to mid-50s
• RoE target of high teens by 2015
Turnaround
Return Acceptable Numbers
Sustain FORward Momentum
19 | Barclays Strategic Review | 12 February 2013
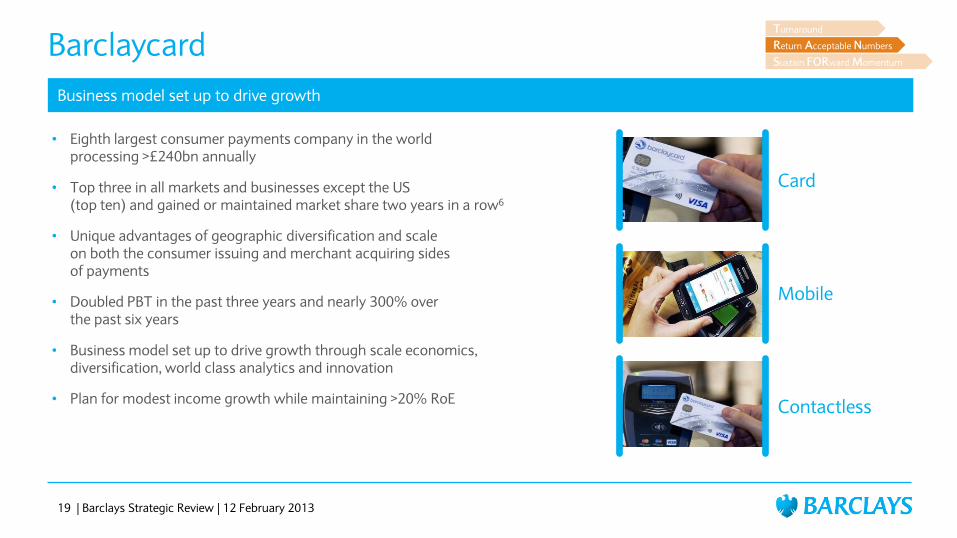
Barclaycard
Business model set up to drive growth
• Eighth largest consumer payments company in the world processing >£240bn annually
• Top three in all markets and businesses except the US (top ten) and gained or maintained market share two years in a row6
• Unique advantages of geographic diversification and scale on both the consumer issuing and merchant acquiring sides of payments
• Doubled PBT in the past three years and nearly 300% over the past six years
• Business model set up to drive growth through scale economics, diversification, world class analytics and innovation
• Plan for modest income growth while maintaining >20% RoE
Mobile
Card
Contactless
Turnaround
Return Acceptable Numbers
Sustain FORward Momentum

20 | Barclays Strategic Review | 12 February 2013
Wealth & Investment Management
Top ten wealth manager globally7
• Business entering high return phase
• Fragmented global market represents significant opportunity
• Strategic investment plan over last three years is yielding results
• PBT has more than doubled since 2009
• Further plans to improve high-return areas and reposition lower-return areas (HNW Asia)
• Gamma investment at an advanced stage and now have IT platforms and bankers on board to deliver significant growth
• Income growth to generate significant increase in RoE to high teens
Turnaround
Return Acceptable Numbers
Sustain FORward Momentum

21 | Barclays Strategic Review | 12 February 2013
One Africa
Area of higher economic growth
• One of the largest banks across Africa with a home market in South Africa and critical mass across most of our 12 African countries
• One Africa strategy is to build the ‘Go-To’ bank integrating our businesses across the continent
• Global, regional and local relationship banking model creating a compelling proposition for customers and clients
• Opportunities for growth by broadening our services in leading markets and investing in local geographies where local presence is essential
• Over £900m PBT generated across all African businesses in 2012
Turnaround
Return Acceptable Numbers
Sustain FORward Momentum

22 | Barclays Strategic Review | 12 February 2013
Africa RBB
Underlying fundamentals still strong
• RBB is complemented by other African businesses, notably IB, Corporate and Cards
• Some areas of variable performance but clear plans to improve returns in those units
• Focus on building the most innovative, digital banking solutions in Africa, leveraging our global technology capabilities
• Achieve RoE above CoE by 2015
Turnaround
Return Acceptable Numbers
Sustain FORward Momentum

23 | Barclays Strategic Review | 12 February 2013
Europe RBB
Restructure business, manage risks tightly and reduce costs
• Unsatisfactory returns, facing significant macro-economic challenges
• Businesses need to be repositioned
• Infrastructure and cost base to be reduced by 30%, near halving of 2010 run-rate costs
• Run-off of £23bn low-performing legacy assets, to be accelerated through dedicated asset optimisation team
• Target profitable mass affluent segment
• Plans driven by right-sizing of cost base to appropriate level of income and risk tightly managed
• Deliver a low, but positive RoE in 2015
Turnaround
Return Acceptable Numbers
Sustain FORward Momentum
24 | Barclays Strategic Review | 12 February 2013
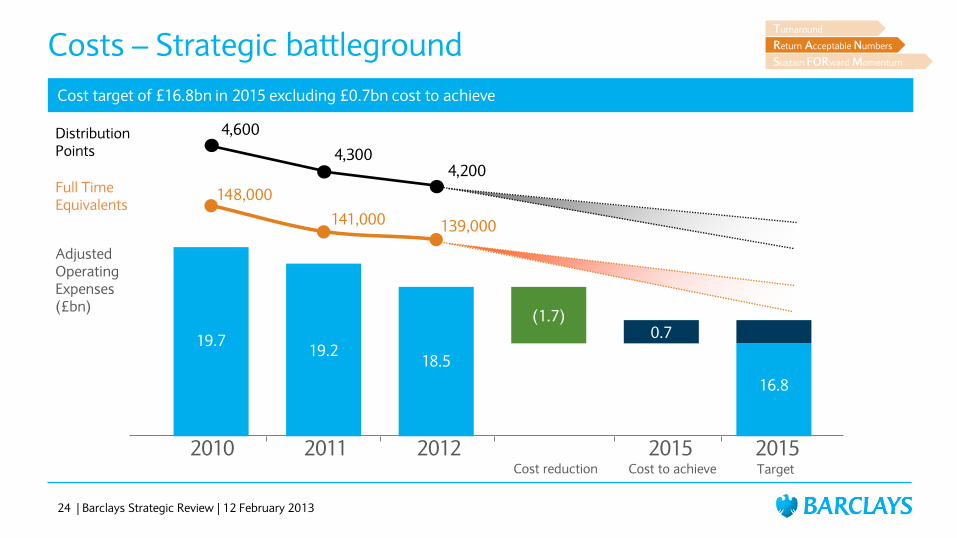
Costs – Strategic battleground
Cost target of £16.8bn in 2015 excluding £0.7bn cost to achieve
19.7 19.2
18.5
16.8
0.7 (1.7)
148,000
141,000 139,000
4,600
4,300 4,200
2010 2011 2012 2015 2015 Cost to achieve Target Cost reduction
Adjusted Operating Expenses (£bn)
Full Time Equivalents
Distribution Points
Turnaround
Return Acceptable Numbers
Sustain FORward Momentum
25 | Barclays Strategic Review | 12 February 2013
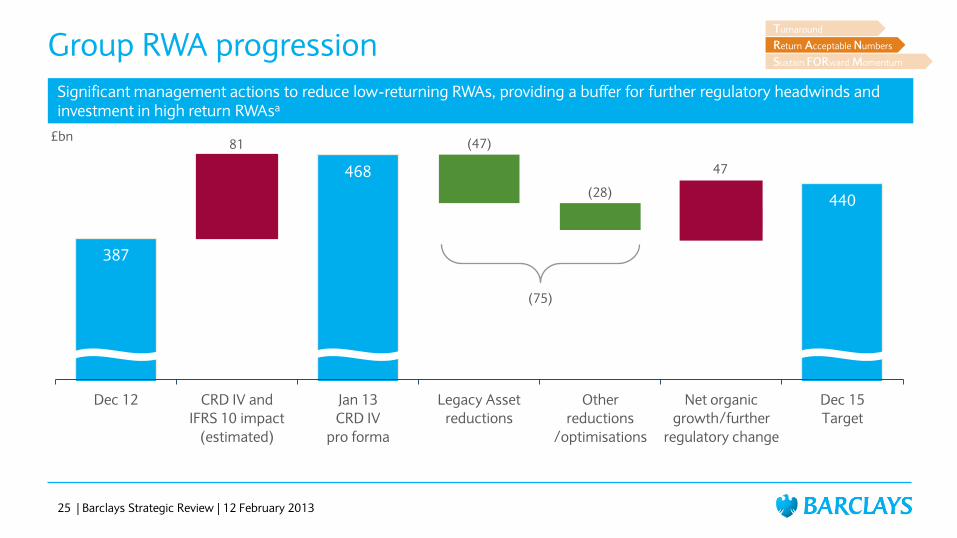
Group RWA progression
Significant management actions to reduce low-returning RWAs, providing a buffer for further regulatory headwinds and investment in high return RWAsa
387
468
440
Dec 12 CRD IV and
IFRS 10 impact
(estimated)
Jan 13
CRD IV
pro forma
Legacy Asset
reductions
Other
reductions
/optimisations
Net organic
growth/further
regulatory change
Dec 15
Target
£bn
47
(47) 81
(28)
(75)
Turnaround
Return Acceptable Numbers
Sustain FORward Momentum

26 | Barclays Strategic Review | 12 February 2013
Capital structure
Our target capital structure is intended to support CRD IV and ICB regulations
Barclays Q4 2012 Capital Structure
(Basel 2.5)
Barclays target CRD IV/ICB
Capital Structure
17.1% Total Capital Ratio
17.0% Total Capital Ratio
10.9% £42.1bn
CT1
2.4% £9.5bn
T1 (traditional)
3.8% £14.4bn
T2
4.5% Equity
2.5% Capital conservation
buffer
2.0% G-SIFI
1.5% Internal buffer
1.5% AT1
5.0% T2/Senior unsecured
2% CCN
9.0%
7.0%
10.5% Management Target
Turnaround
Return Acceptable Numbers
Sustain FORward Momentum

27 | Barclays Strategic Review | 12 February 2013
Capital ratios
Transitional CET1 in 2015 is expected to be well above 10.5%
10.9% 10.6%
8.2%
>10.5%
Reported
Basel 2.5
CT1
Transitional
Basel 3 CET1
Fully Loaded
Basel 3 CET1
Target Transitional
CET1 Ratio
Dec 12 Jan 13 Pro forma Dec 15
Turnaround
Return Acceptable Numbers
Sustain FORward Momentum

Group loan to deposit ratio
118% 110% 103-107%
Customer deposits/total funding
(excl. Absa)
47% 53% 60-65%
WAM wholesale funding (excl. liquidity pool)
58 mths
61 mths
Mid-50s mths
28 | Barclays Strategic Review | 12 February 2013
Superior funding and liquidity
Funding outlook to 2015
2011 2012 2015 • Increased customer and client deposits
• Reduced reliance on wholesale unsecured funding
• Growing usage of secured funding, while maintaining reasonable encumbrance levels
• Dramatic improvement in wholesale funding costs since summer 2012, which has been sustained in 2013
• Overall funding costs expected to fall
• Liquidity buffer targeted to reduce to £125-150bn in 2015, with the projected annual cost expected to fall to £300m9
Turnaround
Return Acceptable Numbers
Sustain FORward Momentum
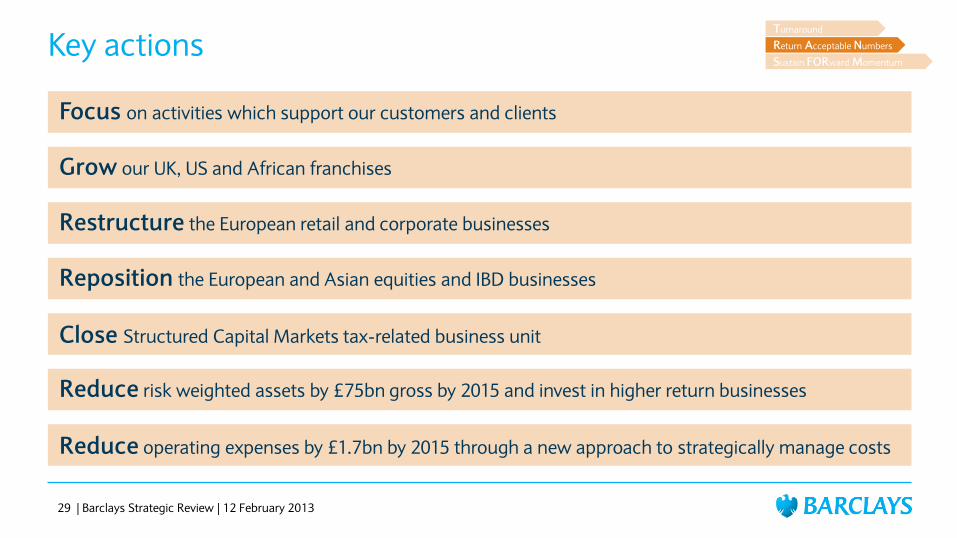
Reduce risk weighted assets by £75bn gross by 2015 and invest in higher return businesses
Reduce operating expenses by £1.7bn by 2015 through a new approach to strategically manage costs
Reposition the European and Asian equities and IBD businesses
29 | Barclays Strategic Review | 12 February 2013
Key actions
Grow our UK, US and African franchises
Restructure the European retail and corporate businesses
Focus on activities which support our customers and clients
Close Structured Capital Markets tax-related business unit
Turnaround
Return Acceptable Numbers
Sustain FORward Momentum

30 | Barclays Strategic Review | 12 February 2013
Sustain Forward Momentum
0-5 YEARS
Turnaround
Return Acceptable Numbers
Sustain FORward Momentum
Controls Cost
Culture Rewards
31 | Barclays Strategic Review | 12 February 2013
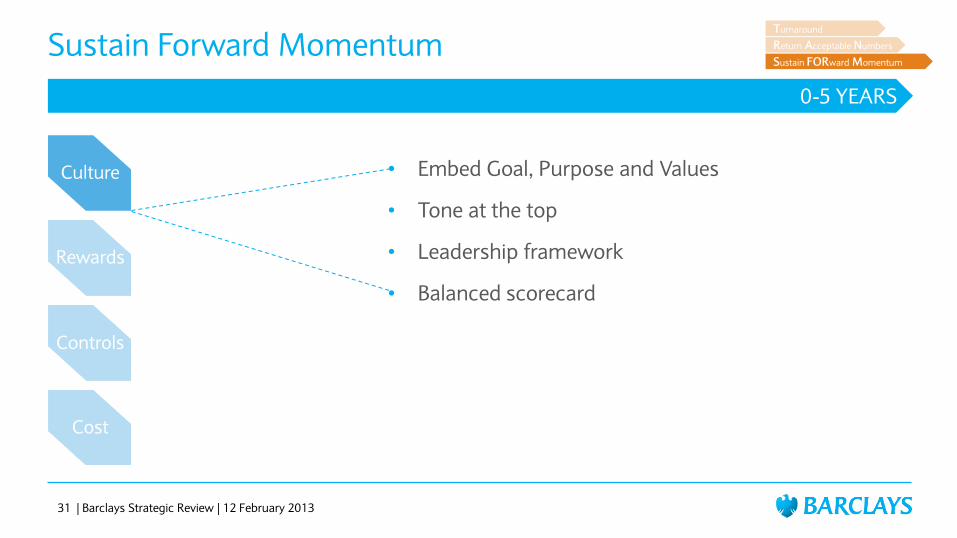
Sustain Forward Momentum
0-5 YEARS
Culture
Rewards
Controls
Cost
• Embed Goal, Purpose and Values
• Tone at the top
• Leadership framework
• Balanced scorecard
Turnaround
Return Acceptable Numbers
Sustain FORward Momentum
32 | Barclays Strategic Review | 12 February 2013
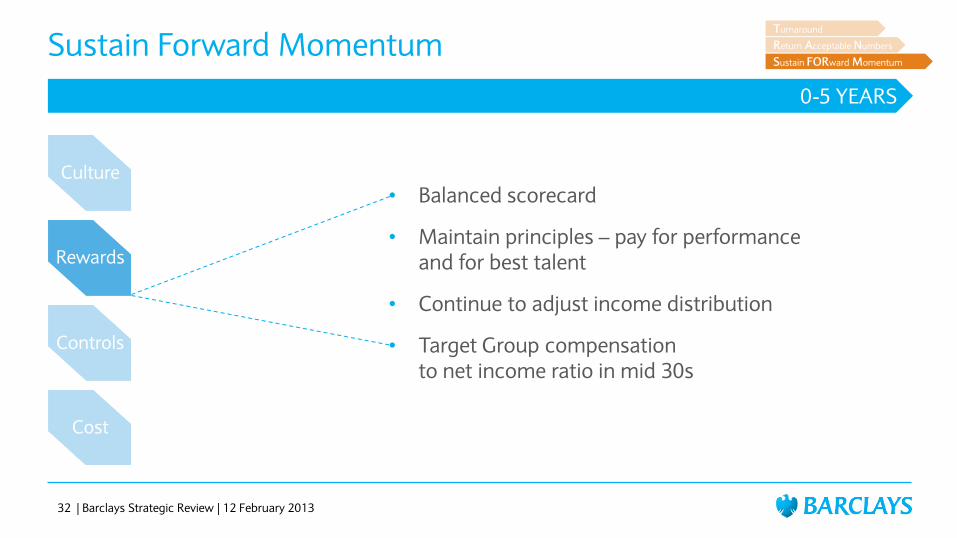
Sustain Forward Momentum
0-5 YEARS
Culture
Rewards
Controls
Cost
• Balanced scorecard
• Maintain principles – pay for performance and for best talent
• Continue to adjust income distribution
• Target Group compensation to net income ratio in mid 30s
Turnaround
Return Acceptable Numbers
Sustain FORward Momentum

33 | Barclays Strategic Review | 12 February 2013
Sustain Forward Momentum
0-5 YEARS
Culture
Rewards
Controls
Cost
• Starts with individual responsibility – culture
• Strong oversight from world-class compliance function
• Have made a start – more to do
• Getting balance right requires training, investment and integration
Turnaround
Return Acceptable Numbers
Sustain FORward Momentum
34 | Barclays Strategic Review | 12 February 2013
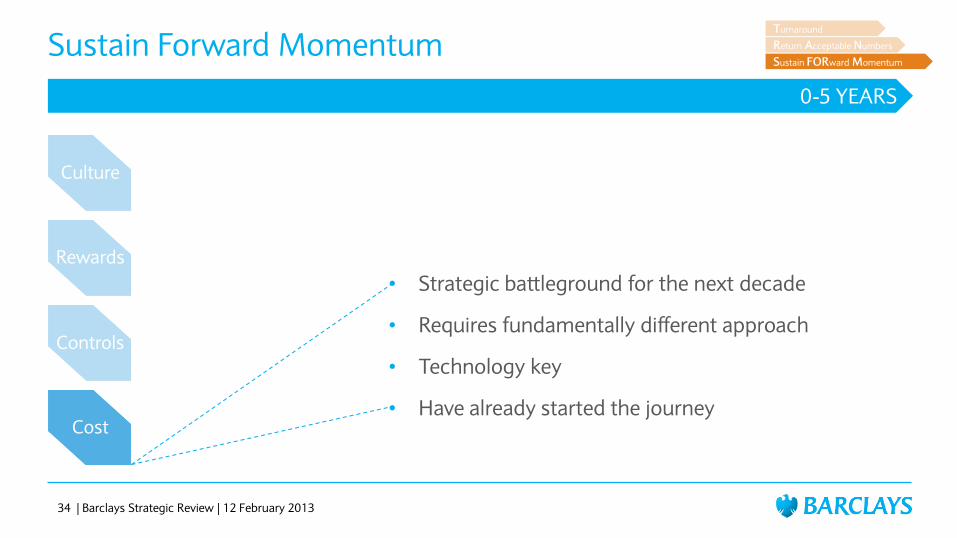
Sustain Forward Momentum
0-5 YEARS
Culture
Rewards
Controls
Cost
• Strategic battleground for the next decade
• Requires fundamentally different approach
• Technology key
• Have already started the journey
Turnaround
Return Acceptable Numbers
Sustain FORward Momentum

35 | Barclays Strategic Review | 12 February 2013
Risks
Legacy issues
Significant change in Regulation
Failure to Execute
Major Economic Downturn
Turnaround
Return Acceptable Numbers
Sustain FORward Momentum

36 | Barclays Strategic Review | 12 February 2013
Risks – UK regulation
Ring-fence based on minimum liabilities with appropriate asset mix
Will establish operating service company
Some uncertainty remains
Best current estimate is that ongoing cost lower than earlier estimates
Confident could adapt Group structure if required
Legacy issues
Significant change in Regulation
Failure to Execute
Major Economic Downturn
Turnaround
Return Acceptable Numbers
Sustain FORward Momentum

37 | Barclays Strategic Review | 12 February 2013
Risks – legacy issues
Legacy issues
Significant change in Regulation
Failure to Execute
Major Economic Downturn
Turnaround
Return Acceptable Numbers
Sustain FORward Momentum

38 | Barclays Strategic Review | 12 February 2013
Risks – failure to execute
Only risk under our control
Rests squarely with me and my team
Recognise you need to be able to monitor progress
Legacy issues
Significant change in Regulation
Failure to Execute
Major Economic Downturn
Turnaround
Return Acceptable Numbers
Sustain FORward Momentum

39 | Barclays Strategic Review | 12 February 2013
Clear 2015 financial targets
2012 Results 2015 Targets Commentary
Return on Equity
Operating Expenses
Cost:Income Ratio
Core Capital Ratio
Pro forma B3 RWAs
7.8% > Group
CoE
£18.5bn £16.8bn
64% mid-50s
10.9% >10.5%
£468bn3 £440bn
Target sustainable returns in excess of cost of equity
Improve quality of income and predictability of earnings
Target operating expense base excluding £0.7bn cost to achieve (CTA) in 2015
Plan assumes low to mid-single digit income growth
Strategic cost management required to drive fundamental change
Management actions including run-down of legacy assets to counter effect Basel 3
Significant profit generation to support growth and offset regulatory headwinds
Reduction of £75bn gross risk assets by 2015 including over £45bn legacy assets
Legacy asset disposal and run-off allows investment in higher return RWAs e.g. UK mortgages and Equities/IBD
Dividend Payout Ratio 19% 30%
Drive greater balance between staff and shareholder returns
Demonstration of solid capital base
Turnaround
Return Acceptable Numbers
Sustain FORward Momentum

Balanced scorecard
• Embed purpose and values
• Assessing performance against
• Customers and clients, company, conduct, colleagues and citizenship
40 | Barclays Strategic Review | 12 February 2013
Commitments – non-financial
Financial reporting
• Provide greater disclosure and transparency
• Committed to industry-leading financial reporting

41 | Barclays Strategic Review | 12 February 2013
Our goal
To make Barclays the ‘Go-To’ bank for all of our stakeholders

Appendix
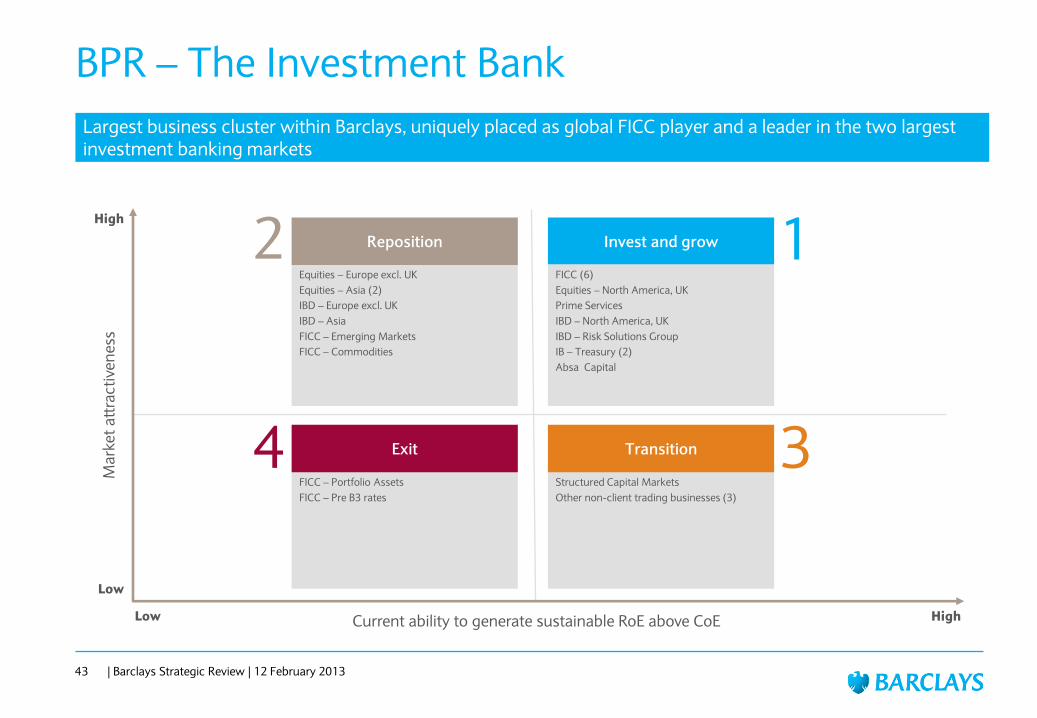
Largest business cluster within Barclays, uniquely placed as global FICC player and a leader in the two largest investment banking markets
BPR – The Investment Bank
43 | Barclays Strategic Review | 12 February 2013
Ma
rke
t a
ttra
ctiv
en
ess
Current ability to generate sustainable RoE above CoE High
High
Low
Equities – Europe excl. UK
Equities – Asia (2)
IBD – Europe excl. UK
IBD – Asia
FICC – Emerging Markets
FICC – Commodities
2 Reposition 1 Invest and grow
FICC – Portfolio Assets
FICC – Pre B3 rates
4 Exit
Structured Capital Markets
Other non-client trading businesses (3)
3 Transition
FICC (6)
Equities – North America, UK
Prime Services
IBD – North America, UK
IBD – Risk Solutions Group
IB – Treasury (2)
Absa Capital
Low

The Investment Bank
44 | Barclays Strategic Review | 12 February 2013
• One of a small group of global investment banks gaining share at low incremental cost
• Full service model deployed in the UK and US with appropriately sized models for the rest of the world to reflect market opportunities
• Further consolidate leading FICC franchise with top tier products
• Continue on upwards trajectory of share and profitability in US and UK, Equities and IBD franchises
• Robust and comprehensive control environment
• Business mix that minimizes earnings volatility and eliminates reputational risks
Go-To:
• Well positioned businesses
• Mature, at scale platforms
• Bottom line performance continues to be resilient
• Despite challenging backdrop, market share continues to grow (e.g. M&A volumes)
Already a top franchise
• 1,600 FTE reductions
• 55% front-office, 45% back-office
• £300m p.a. savings by 2015
• Reduce legacy assets by £43bn with minimal lost income
• Exit businesses with significant reputational risks
Actions we‘re taking
Key metrics¹ FY12 2015 Target
Income (£bn) 11.7 Single digit growth
B3 RWA (£bn) 257 210-230
Compensation:Income ratio (%) 39 Mid-30s
RoE (%) 13.7 14-15
PBT quarterly volatility (excl. own credit and bank levy), 2009-2012
Investment Bank 2012-2015 RWAa
£bn [VALUE]
178
257
[VALUE]
[VALUE]
[VALUE]
Dec 12
Basel 2.5
CRD IV
impact
Dec 12
Basel 3
pro forma
Legacy
reduction
Derivative
efficiencies
Other
optimisation
Organic
growth and
further
regulatory
change
Dec 1510
15-35
210-230 (19)
(20)
(23) 23 79
Ba
rcla
ys
Pe
er 1
Pe
er 2
Pe
er 3
Pe
er 4
Pe
er 5
Pe
er 6
Pe
er 7
Pe
er 8
Pe
er 9
Pe
er 1
0
1.3 1.3 1.8 1.9 2.4
2.4 2.6
2.9
3.7
3.9 4.6 £bn

Key metrics¹ FY12
Income (£bn) 7.4
B2.5 RWA (£bn) 137
FICC
45 | Barclays Strategic Review | 12 February 2013
• Strong client-based franchise, well diversified across asset classes and geographic regions, serving global client needs
• Scale player well positioned to deliver returns in the new regulatory environment, and benefit from retrenchment of competitors
• Competitive advantage maintained through state of the art technology platforms that deliver cost efficiency and tight controls
• Capital efficient business as a result of active management of RWAs and run-off of legacy assets
Go-To:
• For non-client and reputationally challenged businesses, move into appropriate structure, sell or wind-down 3
1
• Majority of FICC businesses (e.g. Rates, FX, Credit) well positioned, scale businesses able to grow share
• Maintain leading presence in flow markets continues to provide a sustainable advantage
• Broaden definition of legacy book to £79bn RWA and reduce to £36bn by 2015 4
Legacy Assets RWA development a,11
£bn 79
2
• Reposition commodities business to focus on core banking, financing and risk management activities, and ‗smart‘ physical activity (restructuring largely completed)
• Focus on delivering risk management and DCM solutions to target client base in emerging markets
24 9.5 9.5
9.5 11 5
44 (23)
(20)
36
Dec 10 Dec 12
B2.5
Jan 13
B3
pro forma
Legacy asset
reduction
Derivative
efficiencies
Dec 15
Credit Market Exposures Additional Legacy Assets
Pre-B3 Rates Corporate and monoline derivatives
CRD IV Reductions
IB Legacy Assets
Flow-based business model – IB revenue distribution
36% 30% 28%
46% 50% 53%
18% 20% 19%
2010 2011 2012
Non-flow
Flow-trading
Advisory and underwriting

2.3%
3.3% 3.8%
3.3% 3.4%
4.4%
#10 #9 #9 #10 #9 #7
ECM M&A
Equities and IBD
46 | Barclays Strategic Review | 12 February 2013
• Larger market share and profitability trajectory in our US and UK franchises
• Adaptable target model over various geographies, depending on core market and penetration
• Footprint and cost base realigned in Asia and Europe to reflect market environment
• Low capital intensive business; well positioned for upturn in European market activity
Go-To:
• Maintain positioning of US and UK Equities and IBD businesses, where half of wallet is concentrated
• Compete and win share (#2 in US ECM, #1 UK ECM/M&A/DCM) from competitors2
• Maintain growth in UK IBD business as a leading corporate broker
1
Key metrics¹ FY12
IBD
Income (£bn) 2.1
B2.5 RWA (£bn) 19
Equities and Prime Services
Income (£bn) 2.0
B2.5 RWA (£bn) 21
FTE reductions across Equities and IBD
Barclays gained market share in ECM and M&A12
2010 2011 2012
145 220
85
100
Equities IBD
Front-office efficiency savings
Strategic realignment
2
• Right-size footprint in Equities and Asia to reflect market opportunity
• FTE reduction of approx. 550 front-office in Equities and IBD as part of IB-wide reduction resulting in c.15% reduction of front-office MD/D FTE in the businesses being strategically realigned
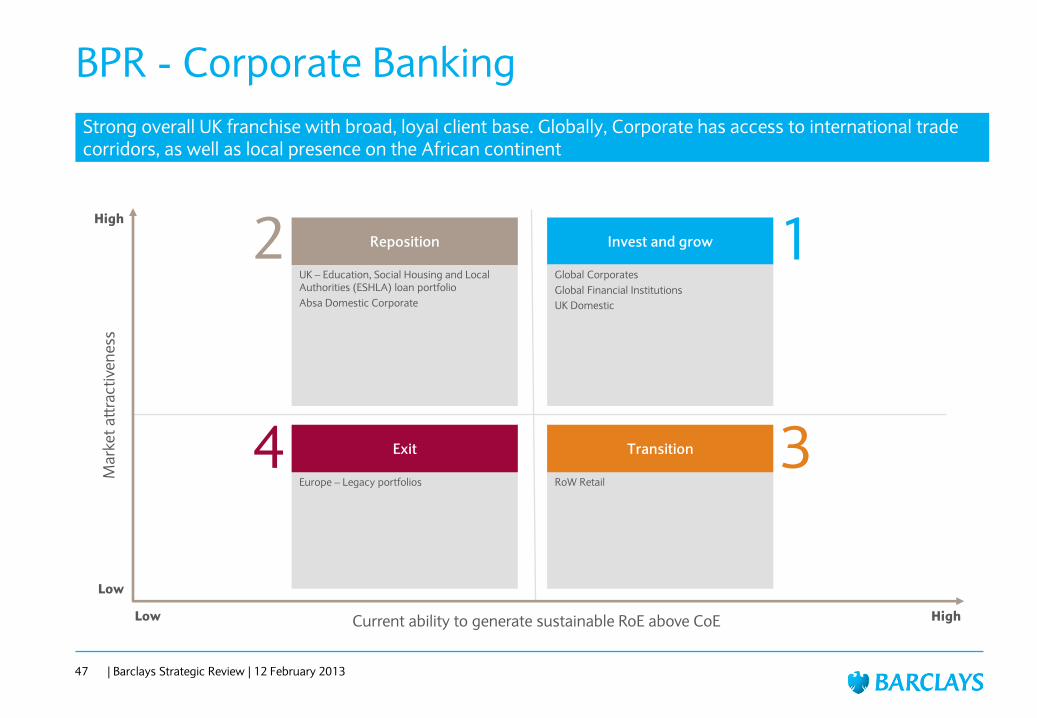
Strong overall UK franchise with broad, loyal client base. Globally, Corporate has access to international trade corridors, as well as local presence on the African continent
BPR - Corporate Banking
47 | Barclays Strategic Review | 12 February 2013
Ma
rke
t a
ttra
ctiv
en
ess
Current ability to generate sustainable RoE above CoE High
High
Low
UK – Education, Social Housing and Local Authorities (ESHLA) loan portfolio
Absa Domestic Corporate
2 Reposition 1 Invest and grow
Europe – Legacy portfolios
4 Exit
RoW Retail
3 Transition
Global Corporates
Global Financial Institutions
UK Domestic
Low

10.3
8.6
4.6
2010 2011 2012
(6)
Corporate Banking
48 | Barclays Strategic Review | 12 February 2013
• Core UK and Africa markets strengthened
• Synergies across the Group maximised for referral and cross-sell
• New cash management platform fully deployed
• Legacy assets wound down to improve returns
Go-To:
• Maintain a franchise leading position in the UK
• Focus on global corporates and financial institutions through:
— Building on IB relationships to expand business
— Accelerating investment plans for enhancing global product capabilities
• Continue to self-fund the balance sheet
1
• Continue to run-off or restructure legacy assets
• Reduce client base in Iberia from 5,000 to <3,000 4
Key metrics¹ FY12 2015 Target
Income (£bn) 2.9 3.0-3.5
RoE (%) 5.5 >10
B3 RWA (£bn) 68 70-80
UK Market Share13
Deposits 17.5% 18.3% 18.6%
Loans 16.8% 18.3% 19.0%
78
85
97
68 67 63
2010 2011 2012
Deposits
Loans
18
Global Customer Balances (£bn)
Remaining legacy RWAs5
£bn
£bn
• Improve performance in ROW Retail 3
2
• Strengthen cross-border offerings to support clients particularly in Africa
• Deepen relationships with Education, Social Housing and Local Authorities clients (ESHLA)
79

UK RBB is a leading franchise in our UK home market where the majority of businesses are high performing despite challenging economic conditions
BPR – UK RBB
49 | Barclays Strategic Review | 12 February 2013
Ma
rke
t a
ttra
ctiv
en
ess
Current ability to generate sustainable RoE above CoE High
High
Low
1 Invest and grow
Investment Products
3 Transition
Mortgages
Retail Current Accounts
Savings
Insurance (2)
Barclays Business
Consumer Loans
Low
2
4

UK RBB
50 | Barclays Strategic Review | 12 February 2013
• Unique and differentiated customer experience provided through seamless multichannel access, focused on digital channels (e.g. Barclays Mobile Banking, PingIt, Text alerts)
• Simple products that are easily understood, putting the customer in control and building trust through transparency (e.g. Features Store)
• Products and services provided instantly for our customers, enhancing processes and driving a reduction in costs and complaints
• Relationships consolidated in target segments - mass affluent and business
Go-To:
• Continue to develop products that utilise technology to meet customer needs
• Offer tailored pricing to grow lending through existing customers and provide right-sized lending mandates to accommodate current gaps in market
• Further integration of services with core banking offerings to provide bespoke solutions to the mass market through products like Features Store
• Grow mortgage share with niche products and attractive rates, as demonstrated by the new Family Springboard Mortgage product
1
• Develop an integrated investment and banking solution in conjunction with Wealth & Investment Management 3
Key metrics¹ FY12 2015 Target
Income (£bn) 4.4 Mid single digit growth
RoE (%) 16 High teens
B3 RWA (£bn) 39 43–45
The mortgage book is forecast to grow at a greater rate than the market14
12.6% 12.5% 12.8%
8.4% 8.9%
9.4%
2010 2011 2012
Market share Mortgage flow
Mortgage stock share

Barclaycard is a strong, diverse franchise with scale presence on both the consumer and merchant sides of payments with growth opportunities in multiple markets
BPR – Barclaycard
51 | Barclays Strategic Review | 12 February 2013
Ma
rke
t a
ttra
ctiv
en
ess
Current ability to generate sustainable RoE above CoE High
High
Low
1 Invest and grow
Secured Lending
3 Transition
Business Payments Solutions
Barclaycard US
Entercard
Germany
Barclaycard UK
Absa cards
Low
2
4

Payments processed (£bn)
134 188 240
Loans and advances to customers (£bn)
18 26 33
475 623
929
47
577
2006 2009 2012
International
UK
Barclaycard
52 | Barclays Strategic Review | 12 February 2013
• Continue to surpass existing and new customers needs by developing new and innovative products
• Attract over one million net new customers each year
• Market leading net promoter scores and most trusted bank credit card brand in the UK
• Largest provider of mobile payments in Europe both in store and online
• Over half of all customer and client interactions completed electronically
• Market leading products and value delivered to both customers and clients
Go-To:
• Grow customer base in consumer credit cards in the US, Europe and Africa
• Expand payment acceptance and commercial payments in Europe
• Consolidate to a single card platform for Continental Europe
• Selectively acquire portfolios and leverage scale to deliver superior economics
• Continue to ensure products are simple, transparent and meet the highest standards of conduct
• Maintain world class risk management
1
Key metrics¹ FY12 2015 Target
Income (£bn) 4.2 >5
RoE (%) 22.1 >20
B3 RWA (£bn) 36 Mid 40s
Performance Trajectory
522
Adjusted PBT £bn
730
1,506
107
• Run-off UK Secured Lending portfolio 3
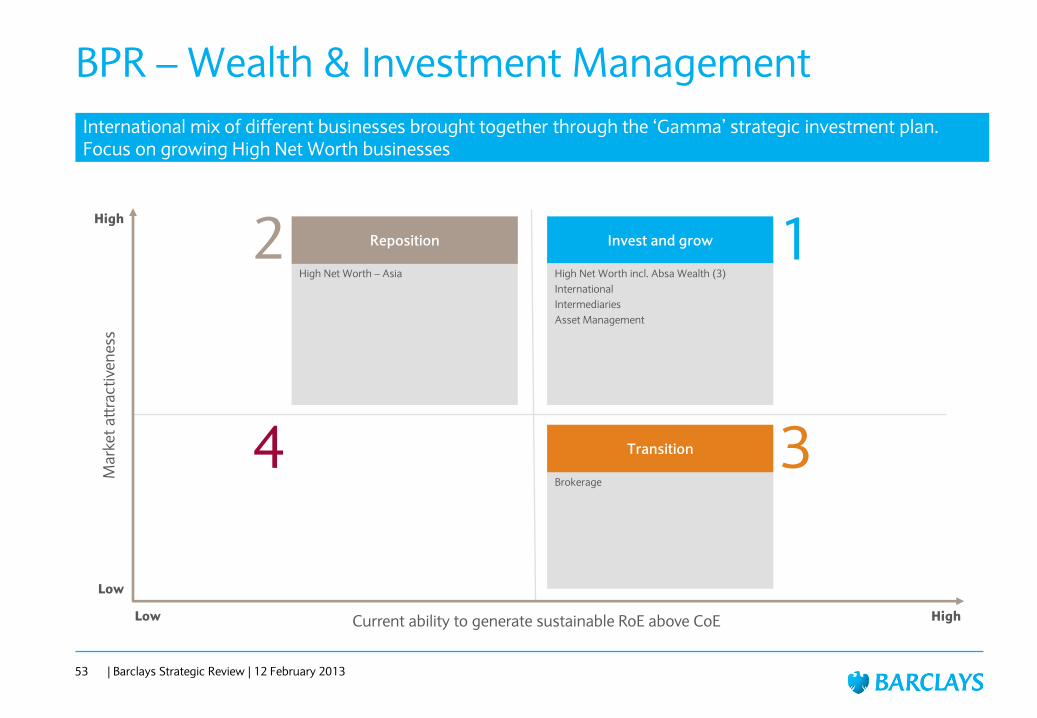
International mix of different businesses brought together through the ‗Gamma‘ strategic investment plan. Focus on growing High Net Worth businesses
BPR – Wealth & Investment Management
53 | Barclays Strategic Review | 12 February 2013
Ma
rke
t a
ttra
ctiv
en
ess
Current ability to generate sustainable RoE above CoE High
High
Low
High Net Worth – Asia
2 Reposition 1 Invest and grow
4 Brokerage
3 Transition
High Net Worth incl. Absa Wealth (3)
International
Intermediaries
Asset Management
Low
Wealth & Investment Management
54 | Barclays Strategic Review | 12 February 2013
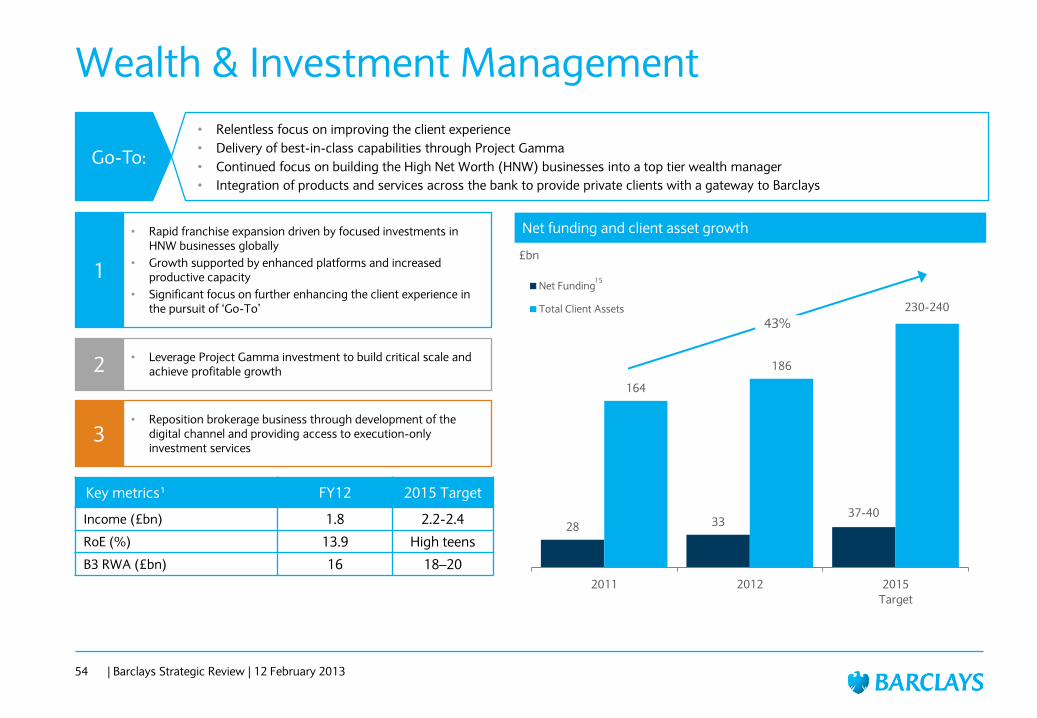
• Relentless focus on improving the client experience
• Delivery of best-in-class capabilities through Project Gamma
• Continued focus on building the High Net Worth (HNW) businesses into a top tier wealth manager
• Integration of products and services across the bank to provide private clients with a gateway to Barclays
Go-To:
• Reposition brokerage business through development of the digital channel and providing access to execution-only investment services
3
• Rapid franchise expansion driven by focused investments in HNW businesses globally
• Growth supported by enhanced platforms and increased productive capacity
• Significant focus on further enhancing the client experience in the pursuit of ‗Go-To‘
1
• Leverage Project Gamma investment to build critical scale and achieve profitable growth 2
Key metrics¹ FY12 2015 Target
Income (£bn) 1.8 2.2-2.4
RoE (%) 13.9 High teens
B3 RWA (£bn) 16 18–20
28 33 40
164
186
240
2011 2012 2015
Target
Net Funding
Total Client Assets
£bn
Net funding and client asset growth
230-240
37-40
43%
15
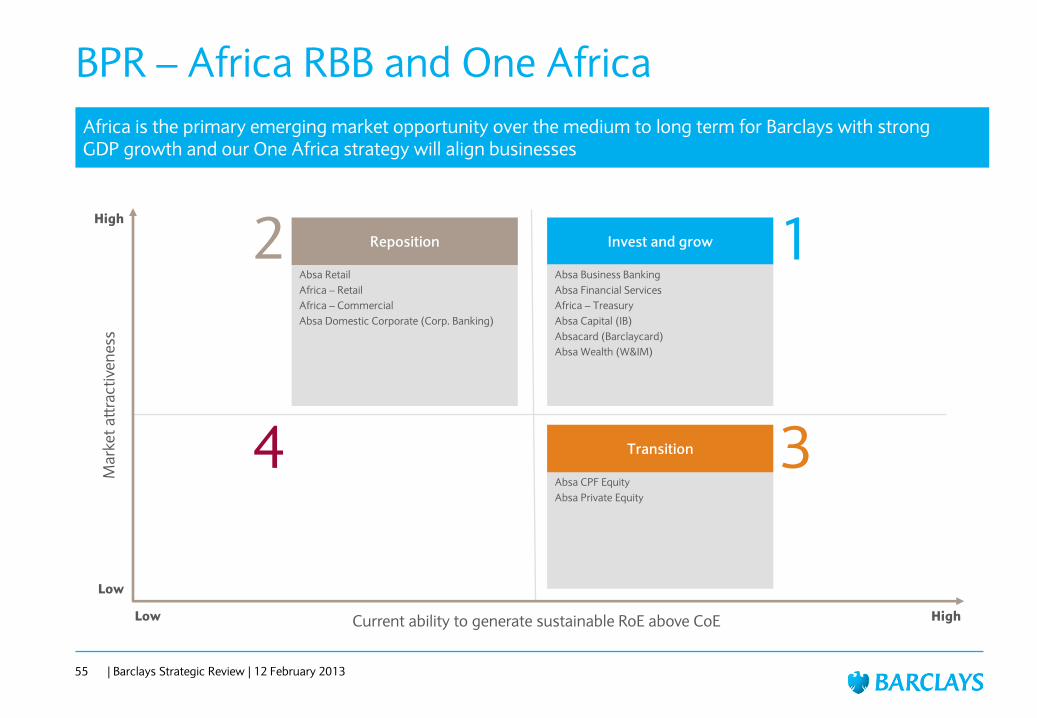
Africa is the primary emerging market opportunity over the medium to long term for Barclays with strong GDP growth and our One Africa strategy will align businesses
BPR – Africa RBB and One Africa
55 | Barclays Strategic Review | 12 February 2013
Ma
rke
t a
ttra
ctiv
en
ess
Current ability to generate sustainable RoE above CoE High
High
Low
Absa Retail
Africa – Retail
Africa – Commercial
Absa Domestic Corporate (Corp. Banking)
2 Reposition 1 Invest and grow
4 Absa CPF Equity
Absa Private Equity
3 Transition
Absa Business Banking
Absa Financial Services
Africa – Treasury
Absa Capital (IB)
Absacard (Barclaycard)
Absa Wealth (W&IM)
Low

30
58
29
40
2010 2015
estimate
Africa (excl. SA)
South Africa
Africa RBB and One Africa
56 | Barclays Strategic Review | 12 February 2013
• Global product knowledge combined with regional expertise and our extensive and well established local presence in 12 countries
• Through targeted innovation, improved customer and client service and experience Go-To:
• Expand in core markets and broaden footprint
• Optimise our wealth, investment management and insurance value offerings across Africa
• Service business customers with a pan-African business banking proposition
1
• Build scale through growth in our Corporate and Investment Bank activity across Africa
• Restore top-line growth through relentless customer focus and new product offerings
• Complete roll-out of improved processes to enhance customer experience
• Leverage Retail Banking capabilities across Africa
• Step-change customer service through innovation and digital roll-out
2
Africa RBB key metrics¹ FY12 2015 Target
RoE (%) 3.8 >CoE
B3 RWA (£bn) 27 28-30
Africa is the next major growth frontier
Projected banking revenues (incl. retail and corporate)16
% of GDP
$bn
1.9x 14% CAGR
• Pursue an orderly reduction of the listed and unlisted Commercial Property Finance (CPF) equity portfolios
• Reduce capital deployed in Private Equity with the focus on optimising return on equity
3 4.0% 9.3% 5.3% 10.8%

Low return, mass consumer businesses utilising limited amounts of Group capital but facing significant challenges in macro economic and sovereign environment
BPR – Europe RBB
57 | Barclays Strategic Review | 12 February 2013
Ma
rke
t a
ttra
ctiv
en
ess
Current ability to generate sustainable RoE above CoE High
High
Low
Mass Affluent – Spain
Mass Affluent – Portugal
2 Reposition 1 Invest and grow
Legacy assets
4 Exit
Mass Consumer – Spain
Mass Consumer– Portugal
Mass Consumer– France
Mass Consumer– Italy
Mass Affluent – France
Mass Affluent – Italy
Cards – Italy
3 Transition
Iberia Cards
Low

Europe RBB
58 | Barclays Strategic Review | 12 February 2013
• Downsized presence and run-off of mass consumer business
• Legacy asset run-off through dedicated asset optimisation team
• Repositioned to focus on targeted growth in mass affluent segment
• Business excluding legacy portfolio is expected to breakeven in 2014, with the whole business breakeven in 2015
Go-To:
• Selectively target higher value customer segments and manage down mass consumer business 3
• Continue with a leading card platform and proven open market capability driving a small but highly profitable operation 1
• Significantly downsize network to reduce infrastructure by 30% and FTE by approximately 2,000 in 2013
• Manage assets for accelerated run-off through creation of £23bn legacy book with a dedicated asset optimisation team
4
Near halving of costs vs. 2010 Q4 run rate
Key metrics¹ FY12 2015 Target
Income (£bn) 0.9 1.0
RoE (%) (8) Low single digits
B3 RWA (£bn) 17 Mid teens
Halving of distribution points vs. 201017
1,128 839
650
Q4 2010
run-rate
2012 2015
Target
£bn
1,363 1,142
Approx. 650
2010 2012 2015
Target
• Grow higher value customer segments 2

387
468
393
440
Dec 12 CVA Securitisation Other Jan 13
CRD IV
pro forma
Legacy
asset
reduction
Derivative
credit risk
optimisation
Other IB
Optimisation
Non-IB
optimisation
After
optimisation
Organic
growth
and further
regulatory
change
Dec 15
Target
£bn
a
Group RWA progression, 2012-2015
59 | Barclays Strategic Review | 12 February 2013
47
29
25
27 (23)
(20)
(19)
(13)
CRD IV and IFRS 10 impact £81bn
Management actions £75bn
Investment Bank (IB) £62bn
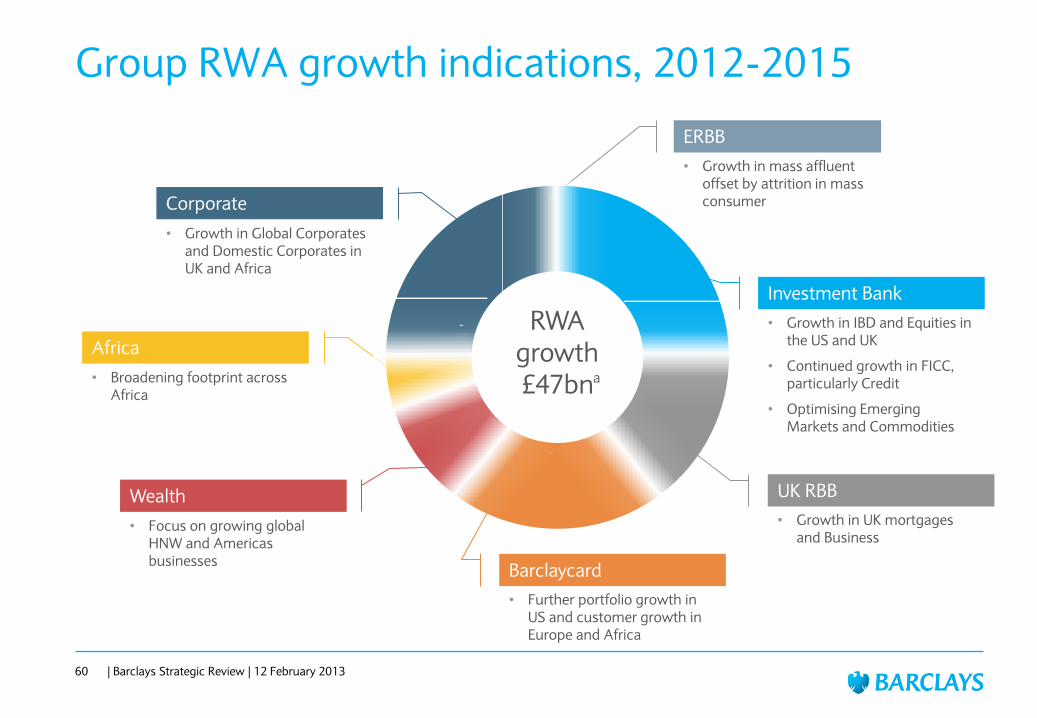
Investment Bank
• Growth in IBD and Equities in the US and UK
• Continued growth in FICC, particularly Credit
• Optimising Emerging Markets and Commodities
RWA growth £47bn
UK RBB
• Growth in UK mortgages and Business
Barclaycard
• Further portfolio growth in US and customer growth in Europe and Africa
Wealth
• Focus on growing global HNW and Americas businesses
Africa
• Broadening footprint across Africa
• Growth in Global Corporates and Domestic Corporates in UK and Africa
Corporate
ERBB
• Growth in mass affluent offset by attrition in mass consumer
60 | Barclays Strategic Review | 12 February 2013
Group RWA growth indications, 2012-2015
a

Legacy assets RWAs £92bn
Group RWAa – quadrant 4 legacy assets
Additional IB legacy assets
£9.5bn
£13bn
IB Credit Market Exposures
£9.5bn
£11bn
Corporate and monoline derivatives
£5bn
CRD IV add-ons
Additional
IB legacy
assets
£7bn
IB CMEs
£7bn
Pre B3 rates
£23bn
Corporate
and
monoline
derivatives
£7bn
CRD IV add-ons £44bn
61 | Barclays Strategic Review | 12 February 2013
Pre B3 rates
Corporate Europe and ERBB legacy portfolios
£44bn
a

Optimising funding costs and risk profile
Secured
Deposits
Robust funding and liquidity position supported by diversified, low cost funding base
Funding and Liquidity
62 | Barclays Strategic Review | 12 February 2013
• Impact of revised Liquidity Coverage Ratio (LCR) rules on Barclays estimated LCR as at 31 December 2012 was a 23 percentage points increase in overall LCR ratio (from 103% to 126%)
• Seek to optimise composition of pool, while maintaining very conservative approach
• Buffer only consists of very high quality assets that remain liquid in stress events
Reduction in wholesale funding requirements
Liquidity
Minimal regulatory impact
Short-term/long-term split to remain constant
Reduction in term funding costs
• Reduced wholesale funding requirement due to increase in customer deposits and further reduction of legacy assets
• Optimising the cost of funding through greater emphasis on secured funding while maintaining encumbrance at reasonable levels
• Impact of pending regulatory actions mitigated by pro-active approach and management actions
• Increased proportion of customer deposits
• Continued decline in non-IB Loan:Deposit ratio to 102% in 2012, down from 111% in 2011
• Over the last few years, reduced reliance on short-term money market funding
• Alignment of assets/liabilities maturities and optimisation of the duration of the balance sheet
Jan 2012 Feb 2013
Barclays 5 year EUR cash spread tightening of 150-200bps
Secured
Deposits

18.5 18.5
17.5 16.8
1.0
1.0
0.7
Cost to achieve
Operating Expenses
Over the next 3 years, results will be affected by ‗cost to achieve‘ charges, delivering further strategic cost reduction beyond 2015
Costs – Strategic battleground
2012 Estimate
2013 Estimate 2014
Target 2015
Adjusted operating expenses £bn
19.5
18.5
17.5 5%
4%
63 | Barclays Strategic Review | 12 February 2013
18

Executed and managed through active continuous feedback across the Balanced Scorecard
Cost to Achieve (P&L) breakdown 2013-2015
64 | Barclays Strategic Review | 12 February 2013
Cost to achieve £bn
Select examples
Restructuring
• Europe Retail and Corporate restructuring (2013) – £0.4bn
• IB restructuring (incl. Front Office, 2013) – £0.1bn
• Africa – Transform the Branch
• Right-sizing while leveraging Group wide capabilities, primarily
focusing on technology
21st Century Industrialisation
• Large scale focused automation of core processes
• Globalisation of processes – ‗active-active‘ across the globe and reduced real-estate footprint
• Consolidation and rationalisation of operations and platforms
• Customer and client-centric self-service via best-in-class digital and mobile (opening window to all of Barclays capabilities)
• Hyper-scale secure internal cloud infrastructure
0.7
0.3
1.0
0.7
2.7
2013 2014 2015 Total
Restructuring
CTA
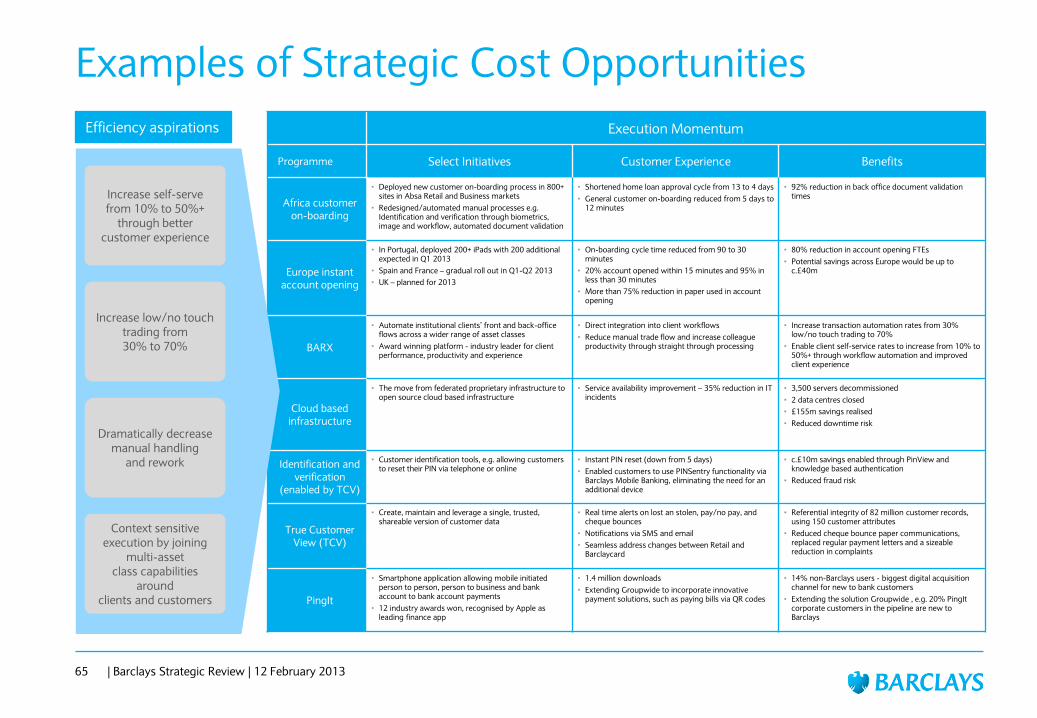
Examples of Strategic Cost Opportunities
65 | Barclays Strategic Review | 12 February 2013
Execution Momentum
Programme Select Initiatives Customer Experience Benefits
Africa customer on-boarding
• Deployed new customer on-boarding process in 800+ sites in Absa Retail and Business markets
• Redesigned/automated manual processes e.g. Identification and verification through biometrics, image and workflow, automated document validation
• Shortened home loan approval cycle from 13 to 4 days
• General customer on-boarding reduced from 5 days to 12 minutes
• 92% reduction in back office document validation times
Europe instant account opening
• In Portugal, deployed 200+ iPads with 200 additional expected in Q1 2013
• Spain and France – gradual roll out in Q1-Q2 2013
• UK – planned for 2013
• On-boarding cycle time reduced from 90 to 30 minutes
• 20% account opened within 15 minutes and 95% in less than 30 minutes
• More than 75% reduction in paper used in account opening
• 80% reduction in account opening FTEs
• Potential savings across Europe would be up to c.£40m
BARX
• Automate institutional clients‘ front and back-office flows across a wider range of asset classes
• Award winning platform - industry leader for client performance, productivity and experience
• Direct integration into client workflows
• Reduce manual trade flow and increase colleague productivity through straight through processing
• Increase transaction automation rates from 30% low/no touch trading to 70%
• Enable client self-service rates to increase from 10% to 50%+ through workflow automation and improved client experience
Cloud based infrastructure
• The move from federated proprietary infrastructure to open source cloud based infrastructure
• Service availability improvement – 35% reduction in IT incidents
• 3,500 servers decommissioned
• 2 data centres closed
• £155m savings realised
• Reduced downtime risk
Identification and verification
(enabled by TCV)
• Customer identification tools, e.g. allowing customers to reset their PIN via telephone or online
• Instant PIN reset (down from 5 days)
• Enabled customers to use PINSentry functionality via Barclays Mobile Banking, eliminating the need for an additional device
• c.£10m savings enabled through PinView and knowledge based authentication
• Reduced fraud risk
True Customer View (TCV)
• Create, maintain and leverage a single, trusted, shareable version of customer data
• Real time alerts on lost an stolen, pay/no pay, and cheque bounces
• Notifications via SMS and email
• Seamless address changes between Retail and Barclaycard
• Referential integrity of 82 million customer records, using 150 customer attributes
• Reduced cheque bounce paper communications, replaced regular payment letters and a sizeable reduction in complaints
PingIt
• Smartphone application allowing mobile initiated person to person, person to business and bank account to bank account payments
• 12 industry awards won, recognised by Apple as leading finance app
• 1.4 million downloads
• Extending Groupwide to incorporate innovative payment solutions, such as paying bills via QR codes
• 14% non-Barclays users - biggest digital acquisition channel for new to bank customers
• Extending the solution Groupwide , e.g. 20% PingIt corporate customers in the pipeline are new to Barclays
Increase self-serve from 10% to 50%+
through better customer experience
Increase low/no touch trading from 30% to 70%
Dramatically decrease manual handling
and rework
Context sensitive execution by joining
multi-asset class capabilities
around clients and customers
Efficiency aspirations

Our tax professionals will be subject to clear standards to ensure that they uphold these principles
All tax planning must be subject to the robust review and approval process outlined in our Tax Risk Framework
We will maintain transparent disclosure in our relationship with the tax authorities, recognising that early resolution of risks is in everyone‘s best interest
We will routinely seek feedback from the tax authorities on the quality of our relationship with them
Any litigation necessary to resolve a difference of opinion will be handled professionally, efficiently and in a way that is consistent with our values
We will reward employees based on a balanced scorecard approach to measuring performance, which includes an assessment of behaviour and appropriate consideration of tax risk over the long-term
Barclays tax principles
We believe that tax planning, for clients and on our own account, must…
Support genuine commercial activity
Comply with generally accepted custom and practice, in addition to the law and the UK Code of Practice on Taxation of Banks
Be of a type that the tax authorities would expect
Only take place with customers and clients sophisticated enough to assess its risks
Be consistent with, and be seen to be consistent with, our purpose and values
Should any of these principles be threatened, we will not proceed – regardless of the commercial implications
66 | Barclays Strategic Review | 12 February 2013

Plan financials and RWAs based on the following assumptions and current market rates
Economic assumptions
67 | Barclays Strategic Review | 12 February 2013
-
1.00%
2.00%
3.00%
4.00%
5.00%
6.00%
7.00%
Dec 11 Dec 12 Dec 13 Dec 14 Dec 15
Interest Rates
-
1.00
2.00
3.00
4.00
5.00
6.00
7.00
Dec-11 Dec-12 Dec-13 Dec-14 Dec-15
Inflation
(2.00)
(1.00)
-
1.00
2.00
3.00
4.00
5.00
Dec-11 Dec-12 Dec-13 Dec-14 Dec-15
GDP Growth
0.00
2.00
4.00
6.00
8.00
10.00
12.00
14.00
16.00
18.00
0.00
0.20
0.40
0.60
0.80
1.00
1.20
1.40
1.60
1.80
Dec-11 Dec-12 Dec-13 Dec-14 Dec-15
Ra
nd
Do
llar
Eu
ro
FX Rates against GBP
(3.00)
(2.00)
(1.00)
-
1.00
2.00
3.00
4.00
5.00
Jan-11 Jan-12 Jan-13 Jan-14 Jan-15
House Price Inflation
-
2.00
4.00
6.00
8.00
10.00
12.00
14.00
Dec-11 Dec-12 Dec-13 Dec-14 Dec-15
Unemployment
UK US EURO ZAR
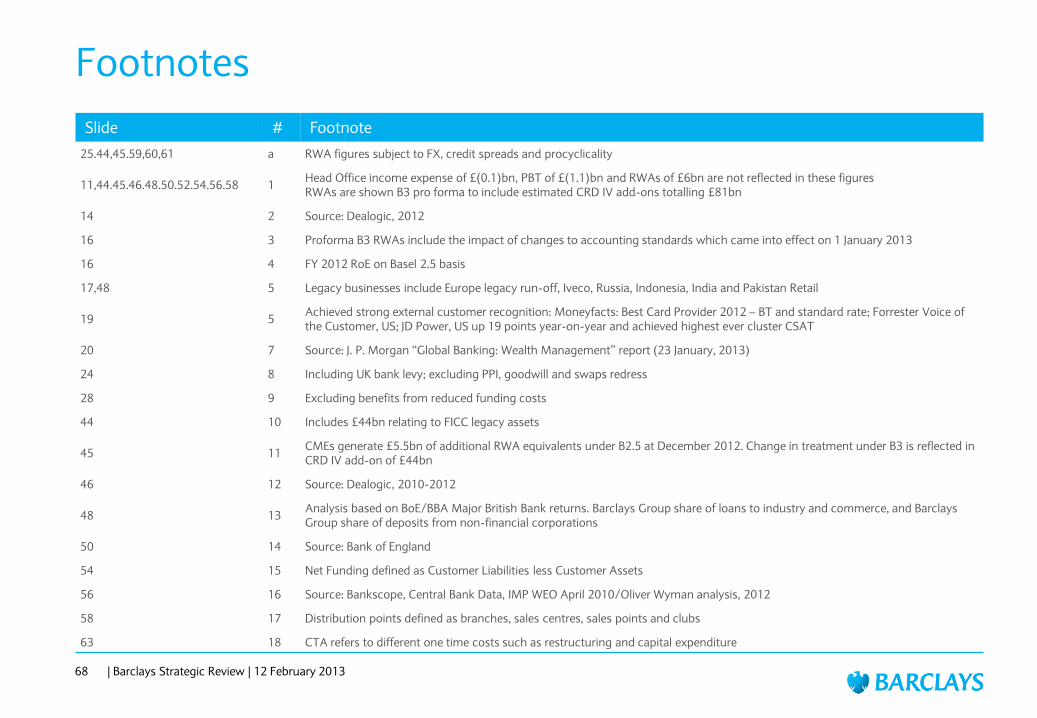
Footnotes
Slide # Footnote
25.44,45.59,60,61 a RWA figures subject to FX, credit spreads and procyclicality
11,44.45.46.48.50.52.54.56.58 1 Head Office income expense of £(0.1)bn, PBT of £(1.1)bn and RWAs of £6bn are not reflected in these figures RWAs are shown B3 pro forma to include estimated CRD IV add-ons totalling £81bn
14 2 Source: Dealogic, 2012
16 3 Proforma B3 RWAs include the impact of changes to accounting standards which came into effect on 1 January 2013
16 4 FY 2012 RoE on Basel 2.5 basis
17,48 5 Legacy businesses include Europe legacy run-off, Iveco, Russia, Indonesia, India and Pakistan Retail
19 5 Achieved strong external customer recognition: Moneyfacts: Best Card Provider 2012 – BT and standard rate; Forrester Voice of the Customer, US; JD Power, US up 19 points year-on-year and achieved highest ever cluster CSAT
20 7 Source: J. P. Morgan ―Global Banking: Wealth Management‖ report (23 January, 2013)
24 8 Including UK bank levy; excluding PPI, goodwill and swaps redress
28 9 Excluding benefits from reduced funding costs
44 10 Includes £44bn relating to FICC legacy assets
45 11 CMEs generate £5.5bn of additional RWA equivalents under B2.5 at December 2012. Change in treatment under B3 is reflected in CRD IV add-on of £44bn
46 12 Source: Dealogic, 2010-2012
48 13 Analysis based on BoE/BBA Major British Bank returns. Barclays Group share of loans to industry and commerce, and Barclays Group share of deposits from non-financial corporations
50 14 Source: Bank of England
54 15 Net Funding defined as Customer Liabilities less Customer Assets
56 16 Source: Bankscope, Central Bank Data, IMP WEO April 2010/Oliver Wyman analysis, 2012
58 17 Distribution points defined as branches, sales centres, sales points and clubs
63 18 CTA refers to different one time costs such as restructuring and capital expenditure
68 | Barclays Strategic Review | 12 February 2013

Legal disclaimers
69 | Barclays Strategic Review | 12 February 2013
Important Notice
The information, statements and opinions contained in this document do not constitute a public offer under any applicable legislation or an offer to sell or solicitation of any offer to buy any securities or financial instruments or any advice or recommendation with respect to such securities or other financial instruments.
Forward-looking Statements
This document contains certain forward-looking statements within the meaning of Section 21E of the US Securities Exchange Act of 1934, as amended, and Section 27A of the US Securities Act of 1933, as amended, with respect to certain of the Barclays Group (the ―Group‖)‘s plans and its current goals and expectations relating to its future financial condition and performance. Barclays cautions readers that no forward-looking statement is a guarantee of future performance and that actual results could differ materially from those contained in the forward-looking statements. These forward-looking statements can be identified by the fact that they do not relate only to historical or current facts. Forward-looking statements sometimes use words such as ―may‖, ―will‖, ―seek‖, ―continue‖, ―aim‖, ―anticipate‖, ―target‖, ―projected‖, ―expect‖, ―estimate‖, ―intend‖, ―plan‖, ―goal‖, ―believe‖ or other words of similar meaning. Examples of forward-looking statements include, among others, statements regarding the Group‘s future financial position, income growth, assets, impairment charges, business strategy, capital ratios, leverage, payment of dividends, projected levels of growth in the banking and financial markets, projected costs, estimates of capital expenditures and plans and objectives for future operations and other statements that are not historical fact. By their nature, forward-looking statements involve risk and uncertainty because they relate to future events and circumstances, including, but not limited to, UK domestic, Eurozone and global macroeconomic and business conditions, the effects of continued volatility in credit markets, market related risks such as changes in interest rates and foreign exchange rates, effects of changes in valuation of credit market exposures, changes in valuation of issued notes, the policies and actions of governmental and regulatory authorities (including requirements regarding capital and Group structures and the potential for one or more countries exiting the Eurozone), changes in legislation, the further development of standards and interpretations under International Financial Reporting Standards (―IFRS‖) applicable to past, current and future periods, evolving practices with regard to the interpretation and application of standards under IFRS, the outcome of current and future legal proceedings, the success of future acquisitions and other strategic transactions and the impact of competition, a number of which factors being beyond the Group‘s control. As a result, the Group‘s actual future results may differ materially from the plans, goals, and expectations set forth in the Group‘s forward-looking statements.
Any forward-looking statements made herein speak only as of the date they are made. Except as required by the UK Financial Services Authority, the London Stock Exchange plc (the ―LSE‖) or applicable law, Barclays expressly disclaims any obligation or undertaking to release publicly any updates or revisions to any forward-looking statements contained herein to reflect any change in Barclays expectations with regard thereto or any change in events, conditions or circumstances on which any such statement is based. The reader should, however, consult any additional disclosures that Barclays has made or may make in documents it has published or may publish via the Regulatory News Service of the LSE and/or has filed or may file with the US Securities and Exchange Commission.
Top Related