


Languages
Pages
Legal


Market Update
Publication Date: 19 December 2019
Annual monitoring update on the postal
market
Financial year 2018-19

1
Contents
Section
1. Overview 2
2. Introduction 4
3. Letters 7
4. The Parcels Market 18
5. Consumer and business experience of postal services 32
6. Efficiency of the Reported Business 52
7. The financial performance of the Reported Business 62
8. Regulatory compliance 80
Annex
A1. Summary of Royal Mail reporting requirements 94

2
1. Overview This report sets out key data and trends in the postal sector for the 2018-19 financial year.
The regulatory framework Ofcom put in place in March 2012, and reviewed in March 2017, is
designed to fulfil our statutory duty of securing a universal postal service, having regard to financial
sustainability and efficiency. An effective and ongoing monitoring regime remains one of the key
safeguards of the regulatory framework, alongside greater pricing freedom for Royal Mail.
This document, together with a broad range of interactive data, constitutes our eighth annual
monitoring update on the postal sector. This report covers six key areas: analysis of the letters
market; the parcels market; consumer and small business experience of postal services; the financial
performance of Royal Mail’s Reported Business; the efficiency of Royal Mail’s Reported Business;
and Royal Mail’s regulatory compliance. The Reported Business is the part of Royal Mail’s business
responsible for the universal service, which requires Royal Mail to collect and deliver letters six days
a week and parcels five days a week, at an affordable and uniform price to all UK addresses.
What we have found
Letter volumes and revenues continued to decline. Addressed letters volumes declined by 8% to
10.2 billion items in 2018-19. The decline was larger than in the previous year, which saw a 5%
decline. Overall letters revenues fell by 7% in real terms to £3.8 billion.
Parcel volumes and revenues continued to grow. Total volumes increased by 10% year-on-year,
reaching a total of 2.6 billion items. This increase was slightly lower than last year’s increase of 11%
year-on-year. Total revenues increased by 4%, reaching £10 billion.
Consumers continued to be satisfied with postal services. Over eight in ten residential consumers
were satisfied with Royal Mail (84%) and postal services overall (86%). Similarly, over eight in ten
SMEs who use Royal Mail (86%) and other providers (84%) said they were satisfied.
We launched two investigations against Royal Mail for breach of regulatory obligations. One was
for compliance with certain quality of service performance targets and one for pricing above the
permitted level for Second Class Mail for the last week of the financial year. In relation to
compliance with the quality of service performance targets, in 2018-19, Royal Mail only delivered
91.5% of its First Class mail next day against a target of 93%.
There was a downward trend across efficiency metrics. Real costs increased slightly and efficiency
overall was negative. Royal Mail did not achieve its target productivity range of 2-3% or offset the
increases in pay with gross hour reduction. We continue to believe that efficiency gains are crucial in
ensuring the sustainability of the universal service.
Profitability of the part of Royal Mail that provides the universal service declined. Royal Mail’s
Reported Business EBIT margin was 1.6% for 2018-19 (on a 52-week basis), though the financial
position and financial health metrics (including credit rating) of the Royal Mail Group do not indicate
any short-term financial health issues. The longer term sustainability depends on a range of factors,
including the extent to which the revenue growth and Royal Mail’s transformation programme, set
out in its five-year strategy, can be delivered.

3
Recent developments
1.1 In May 2019, Royal Mail set out its five-year strategy, which envisaged a Group revenue
growth of 2-3% per year from 2019-20 to 2023-24.1 Royal Mail’s strategy has a strong focus
on parcels, which is in line with the strategy of comparable operators internationally to
transform their operations from a letters to a parcels business.2 If the implementation of
the new strategy proceeds as Royal Mail foresees, Royal Mail expects its UK business to
return to revenue growth by 2023-24.3
1.2 We note that the strategy is subject to some risks, notably the outcome of discussions
between management and unions on how this will be delivered, as well as broader market
and macro-economic risks which could affect Royal Mail’s ability to grow parcel revenues
at the rate envisaged and/or suppress overall levels of demand for letters and parcels.
1.3 In its half-year results announcements, Royal Mail noted that transformation is running
behind schedule and is likely to impact productivity in the second half of the year. Royal
Mail also revised its forecast for the full year’s letter volume decline, expecting letter
volumes to decrease by 7-9% in 2019-20, instead of 5-7% as previously forecast. Royal Mail
stated that, combined with the industrial relations situation and lower than anticipated
productivity gains, its UK business is expected to be break-even or loss making in 2020-21.
1.4 Therefore, we believe that uncertainty remains about the longer-term sustainability of the
universal service. As in previous years, we will continue to monitor the sustainability of the
universal service, and engage with management to understand better how they plan to
mitigate the risks to the sustainability of the universal service.
1 The 2-3% growth per year is calculated on a Compound Annual Growth Rate (CAGR). See Royal Mail, 2018-19 results and strategy presentation, slide 43: https://www.royalmailgroup.com/media/10705/fy-2018-19-results-and-strategy-presentation.pdf 2 For instance postal operators in the Netherlands, Denmark and Sweden have widely introduced parcel automation. 3 Royal Mail reports that between 2015-16 and 2018-19 (on a 52-week basis), UKPIL revenues declined from £7,671bn to £7,595bn (-0.3%). Slide 36, Royal Mail’s 2018-19 results and strategy presentation, https://www.royalmailgroup.com/media/10705/fy-2018-19-results-and-strategy-presentation.pdf

4
2. Introduction 2.1 Ofcom has a duty under the Postal Services Act 2011 to carry out our postal functions in a
way that we consider will secure the provision of a universal postal service, having regard
to its financial sustainability and efficiency. The minimum universal service requirements
are set by Parliament and require Royal Mail to provide certain postal services at
affordable, uniform prices throughout the UK. In light of this duty, our approach to
regulating the postal sector was set out in our March 2012 Statement.4 This included the
decision to give Royal Mail greater pricing freedom to enable it to return the universal
service to financial sustainability, subject to certain safeguards.
2.2 One of the key safeguards was an effective and ongoing monitoring regime to track Royal
Mail’s performance, as well as monitoring changes in the postal market. As part of this
regime, we committed to publishing an annual monitoring update which sets out key data
and trends in the postal sector, focusing on the progress towards securing the provision of
a universal service. In our March 2017 statement where we confirmed we would broadly
maintain the current regulatory framework until 2022, we said that our ongoing
monitoring of the postal market remains a key safeguard of our regulatory framework,
alongside the Second Class safeguard caps on certain universal service products and
mandated access regulation.5
2.3 In order to ensure that the regulatory framework continues to work effectively we monitor
a range of factors including competition in parcels and letters, consumers’ and businesses’
experiences in the postal sector, Royal Mail’s performance on efficiency and the financial
performance of the universal service network, and Royal Mail’s prices and quality of
service results.
Measuring the outcomes of the regulatory regime
2.4 This report focuses on the 2018-19 financial year and in particular on:
• The letters market – Section Three
• The parcels market – Section Four
• Residential and SME users’ experience of postal services – Section Five
• The efficiency of the Reported Business – Section Six
• The financial performance of the Reported Business – Section Seven
• Compliance with regulation – Section Eight
2.5 We continue to monitor market developments and Royal Mail’s performance in the key
areas outlined above.
4 https://www.ofcom.org.uk/__data/assets/pdf_file/0029/74279/Securing-the-Universal-Postal-Service-statement.pdf 5 https://www.ofcom.org.uk/__data/assets/pdf_file/0033/97863/Review-of-the-Regulation-of-Royal-Mail.pdf

5
The wider monitoring programme
2.6 In addition to this annual monitoring update, the aims of which are discussed above, the
wider programme includes:
• monitoring potential market developments through requests to industry stakeholders
for market specific information, and identifying concerns raised by stakeholders with
how the regime is operating. This year, we sought the views of some bulk mailers to
understand better the drivers of their current and future usage of post. We are also in
the process of engaging with parcel operators to deepen our understanding of the
wider parcels market in light of growing demands for parcel services. We report our
findings to date later in this report;
• regular review of data and indicators for the key areas set out above; and
• monitoring developments in other markets internationally.
2.7 Furthermore, in our Annual Plan for 2019-20, we set out our intention to bring forward
some of the work we had planned to undertake as part of our next review of the regulation
of Royal Mail, which was intended to be undertaken by 2022. Accordingly, this year we
have commenced work on reviewing Royal Mail efficiency, and the reasonable needs of
postal users.
2.8 Within this report we provide our view of how the regulatory regime is meeting our duty to
secure the provision of a universal service by publishing some information on the financial
performance of the Reported Business, the part of Royal Mail Group’s business responsible
for the universal service. We also highlight compliance with regulatory requirements,
market developments in the past year, and postal users’ experience of postal services.
2.9 Royal Mail (along with other postal operators) provides a range of confidential data to us.
Although the confidential nature of this data means that we do not publish it, the data
informs our ongoing monitoring programme, and is used to identify any potential or
emerging problems in relation to the provision of the universal service and wider
competition in the postal markets. So that stakeholders are aware of the information we
gather, our financial monitoring data is listed in Annex 1.
Royal Mail is the focus of our monitoring regime
2.10 The focus of our monitoring is Royal Mail, although we undertake our monitoring within
the context of the broader postal services market. This is because Royal Mail is the
designated universal postal service provider, operating a network capable of delivering
letters and parcels to approximately 30 million business and household addresses
nationwide.
2.11 Not all of Royal Mail’s business is subject to Ofcom regulation. The parts that are subject to
our monitoring regime are known as the ‘Reported Business’, which sits within a group of
business units referred to by Royal Mail as ‘UK Parcels, International and Letters’ (UKPIL).
6
2.12 The Reported Business includes all universal services, as well as other services which are
delivered over the universal service network, namely retail bulk mail and access products
and parcels.
2.13 Although we focus on the financial year 2018-19, in parts we deviate from this time period
to include more recent events and price changes, including analysing residential letter and
parcel prices (which are typically revised in April and apply for the rest of the financial
year), business prices (which are normally revised every January), developments in the
parcels market, and wider developments relevant to Royal Mail’s financial position.
Presentation of data in this annual monitoring update
2.14 Financial data presented in the annual monitoring update on the postal market is in real
terms, unless otherwise stated, except for the revenue, price and cost data presented in
Sections 6 and 7. This is consistent with how it is presented in Royal Mail’s Regulatory
Financial Statements.
2.15 Where we report real terms changes, we have elected to use the Consumer Price Index
(CPI) as the basis for our calculations, as has been our custom since the 2014-15 annual
monitoring update on the postal market. This year we have used a yearly average CPI index
(from April 2018 - March 2019).
2.16 Royal Mail reports its financial statements using whole weeks. This means that for the
2018-19 financial year Royal Mail has reported a 53-week year. In Sections 6 and 7, where
possible, 2018-19 results have therefore been adjusted to 52 weeks to enable a like-for-like
year-on-year comparison. Where we discuss changes, we are referring to the comparisons
to the prior financial year i.e. 2018-19 to 2017-18 on a 52-week basis (unless otherwise
stated).
2.17 The metrics in this update are, unless otherwise stated,6 consistent with those in our
previous two annual monitoring updates on the postal market, published in November
2017 and 2018 respectively (enabling year-on-year comparisons). As mentioned above,
while the majority of the analysis in this report focuses on 2018-19, pricing information
focuses on the most recent pricing data available (i.e. 2019), which is in line with previous
monitoring updates. This annual monitoring update comprises both this report and
accompanying interactive data available on the Ofcom website.7 Data presented in the
annual monitoring update is available in csv files on the Ofcom website.
6 For instance, our change to use a yearly average instead of March CPI index. 7 Annual monitoring reports and interactive data avalible here: https://www.ofcom.org.uk/postal-services/information-for-the-postal-industry/monitoring_reports
7
3. Letters
Letters market in the UK
3.1 This section covers recent developments and trends in the end-to-end and access letter
markets. Together, the letters and large letters8 mail sector consists of three parts:
• mail collected and delivered by Royal Mail (Royal Mail end-to-end) which consists of
both bulk and non-bulk mail;
• mail collected by other operators and delivered by Royal Mail (Royal Mail access); and
• mail collected and delivered by other operators (other operators’ end-to-end).
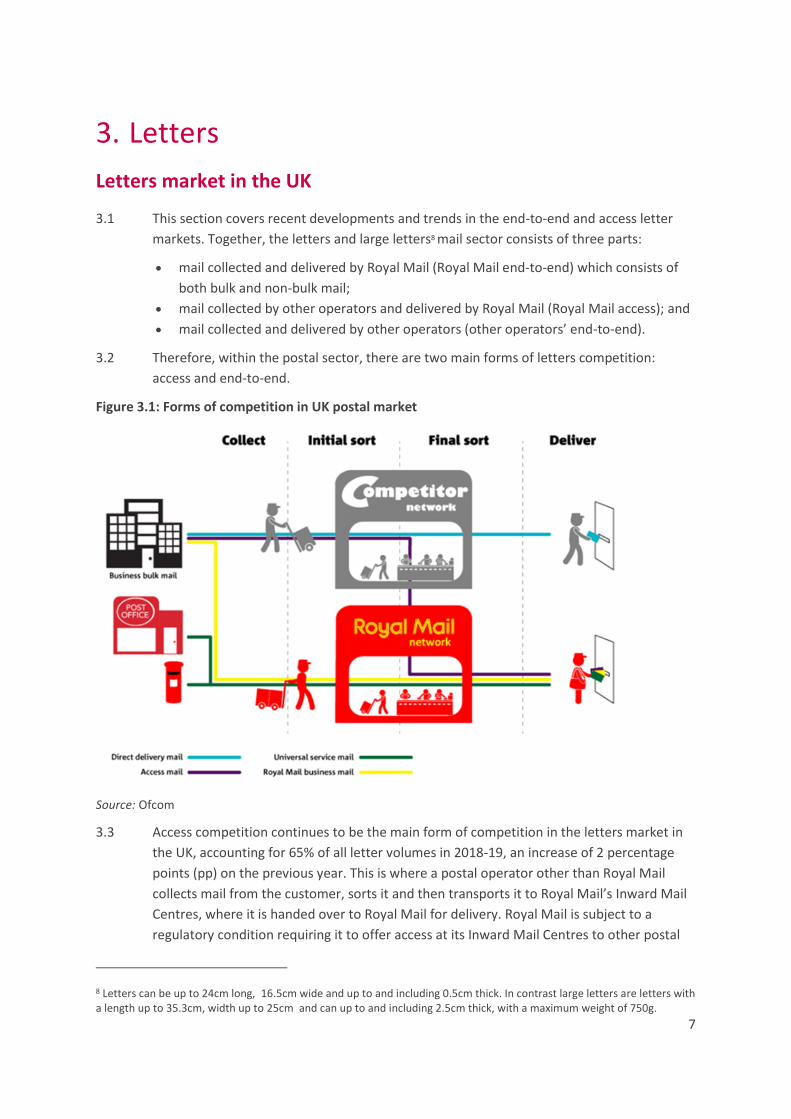
3.2 Therefore, within the postal sector, there are two main forms of letters competition:
access and end-to-end.
Figure 3.1: Forms of competition in UK postal market
Source: Ofcom
3.3 Access competition continues to be the main form of competition in the letters market in
the UK, accounting for 65% of all letter volumes in 2018-19, an increase of 2 percentage
points (pp) on the previous year. This is where a postal operator other than Royal Mail
collects mail from the customer, sorts it and then transports it to Royal Mail’s Inward Mail
Centres, where it is handed over to Royal Mail for delivery. Royal Mail is subject to a
regulatory condition requiring it to offer access at its Inward Mail Centres to other postal
8 Letters can be up to 24cm long, 16.5cm wide and up to and including 0.5cm thick. In contrast large letters are letters with a length up to 35.3cm, width up to 25cm and can up to and including 2.5cm thick, with a maximum weight of 750g.

8
operators and customers for certain letters and large letter services with a routing time of
two working days or later. This enables other operators to offer postal services to their
customers (normally large businesses) for these formats without setting up a delivery
network.
3.4 Royal Mail also offers a similar access service for parcels; this product, used by some access
mail operators, is currently offered on a commercial basis by Royal Mail and is not a
regulatory requirement. Access parcels volumes and revenues remain small compared to
access letters volumes and revenue. In contrast, the UK parcels market is generally
characterised by end-to-end competition with operators using their own networks.9
3.5 End-to-end competition relies on network competition and does not rely on Royal Mail for
collection, sortation or delivery of letters to end customers. The scale of end-to-end
competition in the letters market is small, with no nationwide end-to-end competitor to
Royal Mail.10
3.6 As in previous years, there continues to be examples of mergers and acquisitions (M&A)
related to businesses involved in the letters sector. M&A activity may offer the opportunity
for businesses to grow scale within their existing market, and potentially reduce cost, or
else allow for diversification, for example, letters operators such as Whistl purchasing
businesses in the e-commerce fulfilment sector.11
3.7 In June 2019, the Delivery Group, owner of Secured Mail (an access operator) and CMS (an
operator with an end-to-end network in London), completed its acquisition of Portishead-
based access operator OnePost for an undisclosed sum. According to PrintWeek, between
March 2018 and March 2019 there were 77 M&A transactions involving a UK-firm in the
printing sector.12 As an example, one of these larger transactions was US-based OSG
Holdings’ £154m acquisition of Communisis Plc, a provider of outsourced transactional and
marketing communications on behalf of major senders of bulk letters mail, which was
completed in December 2018. As well as producing transactional and direct mail on behalf
of its clients, Communisis manages the handover of this to the client’s selected letters
operator. According to Communisis’ chairman, the transaction will benefit Communisis by
enabling it to take advantage of greater scale and OSG’s technology.13
9 Though some parcel operators do rely on third party networks for delivery in some parts of the UK where they lack a delivery network themselves. 10 There is also a nationwide Document Exchange service operated by DX which enables documents to be sent between member organisations. Volumes and revenues from this service are not included the addressed letters volumes and revenues data. 11 Printweek, 2018. Whistl bolsters fulfilment offering with Spark acquisition. https://www.printweek.com/print-week/news/1166306/whistl-bolsters-fulfilment-offering-with-spark-acquisition 12 Printweek, 2019. Better together: print M&A activity shows no sign of abating. https://www.printweek.com/print-week/briefing/1168287/better-together-print-m-a-activity-shows-no-sign-of-abating 13 Insidermedia, 2018. £150m deal agreed for marketing services specialist. https://www.insidermedia.com/news/yorkshire/150m-deal-agreed-for-marketing-services-specialist

9
Letters volumes and revenues
Addressed letters volumes declined by 8% in the year to March 2019
3.8 Addressed letters volumes (which include letters and large letters) declined by 8% to 10.2
billion items in 2018-19, reflecting continued structural decline in transactional mail (such
as bills and statements) and advertising mail. As shown in Section 7, such business mail
drives the volume of letters sent, but the volume of letters and parcels sent using the
universal service is also declining (in 2018-19, the volume of letters and parcels sent under
the universal service obligation (USO) declined by 9.8%). The overall letter volume decline
of 8% was larger than in the previous year, during which addressed letters volumes fell by
5%. In its half-year (H1) 2019-20 results, Royal Mail indicated it expected to see volumes
decline to be between 6% and 8% in 2020-21, reflecting the economic cycle and business
uncertainty (Royal Mail did not expect an impact from the General Data Protection
Regulation (GDPR) in 2020-21).14
3.9 The proportion of letters carried by downstream access providers15 increased by two
percentage points in the year to March 2019 to 65% of addressed letters. Overall access
volumes fell by 6%, compared to a 13% decline in Royal Mail end-to-end addressed letters
volumes, which may indicate some senders switching business from Royal Mail to access
operators. The number of letters delivered by operators other than Royal Mail in 2018-19
fell to 6 million items (less than 0.1% of total letters volumes).
Figure 3.2: Addressed letters volumes (millions)
Source: Operator returns, Ofcom estimates. NB: Due to change in methodology from 2015-16 data,
it is not possible to make direct comparisons between pre-and post-2016. *Royal Mail end-to-end is
14 Royal Mail, 21 November 2019. Half Year 2019-20 Presentation Results. https://www.royalmailgroup.com/media/10974/rmg-h1-2019-20-results-presentation-print.pdf, slide 14 15 Where a postal operator other than Royal Mail collects mail from a customer, and hands it over to Royal Mail to complete the delivery. See the section above for further details.

10
an Ofcom calculation and refers to Royal Mail total letters, excepting access. Figures exclude
international. Access volumes include access parcels.
Letters revenues fell by 7% in real terms between 2017-18 and 2018-19
3.10 Overall letters revenues fell by 7% in real terms to £3,848m in 2018-19, driven by a 9%
real-terms decline in Royal Mail end-to-end letters revenues. Royal Mail access revenues
fell by 4% to £1,517m.
3.11 Reported revenues retained by access operators fell by 9% in real terms to £143m. This
figure reflects the revenues retained by access operators for the delivery of mail, once
payments to other operators (mainly Royal Mail) have been made. This may reflect price
competition between access operators to secure and maintain contracts with their
customers. We note that access operators may bundle postal services with a range of
value-added services such as mailroom management, mail collection, magazine
distribution and printing. Revenue from these other services is not reported in the figures
below but forms an important part of the revenue mix for some access operators.
Figure 3.3: Addressed letters revenues
Source: Royal Mail Regulatory Financial Statements, operator returns to Ofcom, Ofcom estimates. Adjusted for
CPI at 2018-19 prices. Royal Mail figures relate to the ‘reported business’. *Royal Mail end-to-end is an Ofcom
calculation and refers to Royal Mail total letters revenues, excepting access. Access revenues include access
parcels. Due to changes in methodology from 2015-16 data it is not possible to make direct comparisons
between pre- and post-2016 data. 2017-18 access operator revenues include operator restatements.
3.12 Marketing mail revenues declined further than overall letter revenues. Overall spend on
direct mail advertising continued to fall in 2018-19. Overall expenditure (which includes

11
production and elements of postage) fell by 12% in real terms to £1502m16, compared to a
6% real-term decline in the prior year. Royal Mail Marketing mail17 revenues fell by 10% in
nominal terms (12% in real terms) to £994m in 2018-19, which Royal Mail said reflects the
impact of the General Data Protection Regulation (GDPR).18 According to Royal Mail,
products such as partially addressed mail (where mail is addressed to a location but not to
a named individual) offer advertisers the potential to reach audiences at a potentially
lower cost than with traditional marketing mail, while potentially offsetting concerns about
GDPR.19
Bulk Mailers
3.13 This section outlines the views of some bulk mailers20 about recent changes in the postal
market. It also explores what further changes they anticipate in coming years, and the
factors driving these changes.
3.14 As bulk mail consists of the vast majority of the letters sent, we were keen to understand
better how bulk mailers use post and what is driving their decisions about usage of post.
We sought the views of a small sample of large mailers via an online survey, followed by a
workshop exploring the themes identified in the survey.21 The survey was completed by 21
respondents and the workshop attended by ten organisations. The findings below
represent a snapshot of views on bulk mail and are not representative of the market as a
whole.22
3.15 The survey and workshop collected views from various sectors including banking, financial
services, retail and the public sector. Participants’ details were provided by their postal
operators. The majority of participants use Royal Mail and one access operator, and the
majority of mail sent was transactional mail (e.g. bills) and marketing mail, with some
publication and fulfilment mail. Respondents to the survey were generally very large
mailers. They collectively reported sending c.2.8bn items a year.
16 Source: AA/WARC Expenditure Report. Adjusted for CPI at 2018-19 prices by Ofcom. 17 Includes revenues from addressed and unaddressed advertising mail, redirections and Address Management Unit. 18 Royal Mail Group, 2019. Journey 2024: FY 2018-2019 results and strategy presentation. https://www.royalmailgroup.com/media/10705/fy-2018-19-results-and-strategy-presentation.pdf. Please also see p.25 of the 20181-19 Royal Mail Group Annual Report https://www.royalmailgroup.com/media/10924/royal_mail_ar19_190918.pdf 19 Royal Mail, 2018. Introducing Partially Addressed Mail, https://www.royalmailtechnical.com/rmt_docs/User_Guides_Nov_2018/Partially_Addressed_Product_Presenter_Retail_November_2018.pptx 20 We refer to bulk mailers as companies and organisations that send very large quantities of mail, here primarily letters. 21 The survey was issued on 18 June 2019 and the workshop held on 22 July 2019. 22 The survey asked questions on respondent’s postal usage including volume of letters and parcels sent, type of mail product used, and type of mail sent e.g. transactional or promotional. Other questions asked why respondents send mail and why mail can be preferable to online communications. Respondents who were moving to online communications were asked their motivation for this. Respondents were also asked to rate how the importance of different factors driving their usage of mail had changed over the past two years.

12
Key findings
3.16 The views emerging from both survey and workshop participants were broadly consistent.
A high level summary is set out below:
• Participants anticipated that they would use post less in future, but that generally the
decrease in postal usage would be gradual.
• Participants highlighted legislative requirements and customer preferences are key
reasons to use post. Another reason highlighted was the need to deliver physical
products such as magazines, credit cards and loyalty cards.
• For many participants, the price of mail is an important factor in their decisions to use
post instead of other methods of communication.
Past and future usage of post
3.17 Participants reported that they had been using post less in the last two years and
anticipated that this trend would continue. Moving to other forms of communication is the
key reason reported for their decreasing use of post. However, participants did not
completely substitute post for other forms of communication. While some used other
methods of communications instead of post, others used both post and other methods of
communication.
Legislative and regulatory requirements
3.18 Most participants identified that legislative and regulatory requirements are one of the
biggest drivers for using post to contact customers or clients rather than online
communications. For example, this was the case for workshop attendees from the financial
sector. They reported that the mail that bulk mailers are legally required to send is a
significant proportion of the volume of post that they send. Conversely, if regulatory and
legislative requirements were to change, most workshop attendees believed they would
send considerably less post.
3.19 Specifically, workshop attendees were asked about the impact of GDPR has had on the way
that they send post. Attendees highlighted that GDPR meant organisations could no longer
send mail combining advertising mail with transactional mail such as bank statements,
because recipients may not have ‘opted in’ to receive advertising mail. This meant that
they needed to send more post if they wanted to send advertising mail in addition to bills
and statements. Partially addressed mail (a new postal product where mail is addressed to
a location but not to a named individual) was discussed as an alternative, although it was
noted that take up is still at an early stage.23
Customers’ preferences
3.20 Participants reported that another key reason they use post over other forms of
communication is customers’ preferences. Attendees at the workshop identified that there
23 Partially Addressed Mail enables targeted mail marketing without the use of personal data about recipients.

13
is a subset of customers who continue to prefer to receive bills and statements via post,
and that they are likely to continue to require physical copies of statements in the short to
medium term. Attendees highlighted that they seek to respond to customers’ preferences,
although should the price of mail increase substantially, some attendees said they may
pass this cost onto their customers. Some attendees also explained that their organisations
focus on the delivery of physical items well suited to distribution by post (e.g. magazines
and vouchers).
Pricing and quality of service
3.21 Some participants believed that price increases are triggering a move towards e-
substitution in communicating with customers. Those participants stressed that the
importance of price as a factor in using post has increased for them. Some attendees
indicated that, for them, mail price rises usually result in efforts to drive down non-
essential post usage to partially off-set the increased costs of post, and that they expect
this to continue to drive down post volumes. Some participants also highlighted the
potential difficulty in budgeting for price increases for which they have not planned.
3.22 Finally, some attendees noted that on occasion Royal Mail offers special incentives or
discount offers24 but were of the view that these could be better communicated and with
more notice, which would allow clients to plan discounts into their marketing strategies.
3.23 Attendees to the workshop in general believed that quality of service was important to
them, but that they are not currently able to track the progress of letters through the Royal
Mail network, or negotiate individual service level agreements. For instance, mail arriving
on time was noted as vital for banks sending out time-sensitive documents. In terms of
marketing communications in the retail sector, respondents said that it was important to
have certainty over on-time delivery.
Price trends for retail bulk mail and access customers
Retail bulk mail prices
3.24 Royal Mail and other operators offer several products and services to business customers
who send larger volumes of mail, which are not within the universal service.
3.25 This includes products like Mailmark, which is a type of barcode product. Barcoding on
envelopes means that they can be better read by letter sorting machines. This in turn helps
Royal Mail sort and route mail more efficiently. Compared to standard barcoding, Royal
Mail considered that Mailmark —introduced in November 2013 — enables even greater
24 To encourage the posting of Letters and Large Letters Royal Mail offers an incentive scheme, whereby customers can apply for certain incentives when using certain mail services. Customers signing up for the incentive earn credits to use against future mail postings. For example, ‘Back to School’ incentive, which in 2019 awarded postage credits to advertising customers posting above certain volumes of eligible mail during the offer period. See: https://www.royalmail.com/sites/default/files/rmg-back-to-school-incentive-terms-2019.pdf

14
automated sortation, trackability and enhanced reporting and feedback to customers on
the quality of their address data.25
3.26 Royal Mail has offered its Mailmark product at a lower rate compared to other barcode
products (i.e. Barcode and Optical Character Recognition (OCR)).26 Discounts are also given
for sortation level and volumes sent, as well as machine-readability. There is a similar
Mailmark product offered both by Royal Mail Retail and for access products.
Figure 3.4: Royal Mail Retail Business Mail and Advertising Mail prices – Jan 2016-Jan 201927
Source: Royal Mail, Ofcom calculation based on maximum discounted prices and low sort barcode discount for
standard letter sizes. Prices adjusted for CPI.
3.27 For different retail bulk products, where both First Class and Second Class services are
offered as part of a product category, First Class products have increased more than
Second Class products. For instance, the Advertising low sort OCR First Class product
increased by 4.6% in real terms (7% in nominal terms), compared with a real term increase
of 0.2% for the Advertising low sort OCR Second Class product (2.5% in nominal terms).
3.28 For non-advertising products, the most significant price rises in January 2019 were seen on
OCR products, compared to Advanced or Mailmark products. For instance, Business low
sort Economy OCR products increased by 7% in real terms (9.5% in nominal terms).
3.29 For advertising products, there was a weighted average price increase of 0.5% in real terms
(2.8% in nominal terms).28 However, aside for the First Class increase noted above,
25 https://www.royalmail.com/corporate/mailmark 26 Royal Mail uses scanning software with OCR to allow mail to be machine sorted, but the address needs to be printed in specific fonts and sizes for this to work. See: https://www.royalmailwholesale.com/addressing-your-mail 27 Figures in red bold represent price increases or decreases, relative to inflation, in percentage terms from January 2018 to January 2019. 28 Given the data relates to products with different mail volumes, we have decided to change our methodology in how we calculate average price rises over different products, from using an unweighted mean to using a weighted average mean, as we believe it is a more accurate approach. As the basis of our calculations is different from previous years, the information on average price rises is not directly comparable with former Annual Monitoring Updates.

15
increases on Advertising low sort OCR Second Class and Economy products were minimal
compared with their Business equivalent: 0.2% and 0.5% real term increases for the
Advertising low sort OCR Second Class and Economy products respectively, compared with
6.6% and 7% real term increases for Business low sort OCR Second Class and Economy
products respectively. This may reflect Royal Mail’s view in 2016 that transactional mail has
lower e-substitution risk than advertising mail.29
3.30 Page 4 of the interactive data shows historic trends in business and advertising mail
prices.30
Access prices
3.31 Royal Mail, under regulatory obligation, is obliged to offer access to its postal network to
operators for certain letter and large letter services with a routing time of two working
days or later. Figure 3.5 sets out the prices that Royal Mail charges access operators for
national access products.31
3.32 As noted in our previous report, Royal Mail announced its intention to increase its access
prices in January 2019. In a letter to customers, sent on 11 October 2018, Royal Mail said it
was increasing prices for business mail services by an average of 9% and for advertising
mail by an average of 1% (those are nominal price rises).32 Royal Mail set out that price
increases were implemented in the context of “rising UK inflation and a decline in letter
volumes.” Royal Mail also said that its planned price increases on some products were
“necessary for us to maintain, protect and invest in the Universal Service.”
29 Response to Ofcom’s May 2016 Fundamental Review of the Regulation of Royal Mail, Royal Mail Submission, August 2016. See p.13: “It is economically rational to price transactional and advertising mail in relation to their respective competitive constraints. Under such a pricing strategy, transactional mail prices would be expected to increase more than advertising mail. […] Transactional mail has lower substitution risks than advertising mail.” https://www.ofcom.org.uk/__data/assets/pdf_file/0033/90789/Royal-Mail.pdf 30 Interactive data can be accessed here: https://www.ofcom.org.uk/postal-services/information-for-the-postal-industry/monitoring_reports 31 In 2018, Royal Mail discontinued one type of of its access services (Customer Barcode or CBC). The prices of these products are no longer reported in the Annual Monitoring Updates. 32 Royal Mail, 2019. Price changes for the access letters contract. https://www.royalmailwholesale.com/news/price-changes-for-the-access-letters-contract

16
Figure 3.5: Royal Mail national access prices in real terms from January 2016 to January 201933 34
3.33 Non-advertising access products saw the highest real term price increases compared with
advertising products: Access 70 OCR saw a 7.3% real term increase, Access 1400 Customer
Barcodes (CBC) a 6.6% real term increase, and Access 70 Mailmark a 6.6% real term
increase. In comparison, for advertising access products, real terms prices for Access 70
Mailmark advertising declined by 0.1% compared with last year, whereas Access 1400
advertising remained stable (0.0%) and Access 70 OCR advertising increased by 0.6%
3.34 Royal Mail retains a price differential between Access 70 Mailmark and Access 70 OCR
products, and continues to encourage take up of the Mailmark product.
3.35 In early 2015, Royal Mail introduced a provision to the terms of its contract with access
operators that increased its flexibility to offer incentive schemes and promotions in access
products to stimulate mail volume growth. These discounts are not included in Figure 3.5.
3.36 Page 5 of the interactive data shows historic trends in access mail prices.35
Summary
3.37 Addressed letter volumes declined by 8% in the year to March 2019, and letters revenues
fell by 7% in real terms. The proportion of letters carried by downstream access providers
increased by two percentage points in the year to March 2019 compared with last year, to
reach 65% of addressed letters.
3.38 This year we sought the views of some large mailers about changes in the letters market,
and the factors driving those changes. Our findings represented a snapshot of views from
large mailers who responded to us or participated in our workshop, and are not
33 Royal Mail offers a variety of access mail products, which vary by level of sortation, and type of mail, among other factors. The terms ‘Access 70’ and ‘Access 1400’ refer to two different levels of mail sorting which must take place before access mail enters Royal Mail’s network. OCR is a mail format specification whereby the printed address can be read by Royal Mail’s automated sorting machines and a barcode is applied to the envelope. 34 As above, figures in red bold represent price increases or decreases, relative to inflation, in percentage terms from January 2018 to January 2019. 35 Interactive data can be accessed here: https://www.ofcom.org.uk/postal-services/information-for-the-postal-industry/monitoring_reports

17
representive of the market. Among other things, participants said that they expected to
gradually use post less in the future, and explained that current legislation and customer
preferences are among the factors which drive their continued usage of postal services.
3.39 For bulk mail, business mail saw the biggest price increases, particularly on First Class
products, compared with advertising mail prices.

18
4. The Parcels Market 4.1 This section outlines trends in the UK parcels sector for domestic parcels, and inbound and
outbound international parcels.36 We then summarise recent developments in the parcels
market and conclude by looking at parcel pricing trends over time.
Collecting information on parcels
4.2 In 2018-19 we have continued to collect revenue and volumes data from major parcel
operators in the UK as part of our ongoing monitoring of the postal sector. These operators
are: The Alternative Parcels Company, Amazon Logistics (encompassing both Amazon
Marketplace and Amazon Retail)37, DHL International and DHL Parcel UK (rebranded from
UK Mail in October 2018)38, DPD Group, DX, FedEx and TNT UK (a subsidiary of FedEx),
Hermes, Royal Mail Group including Parcelforce Worldwide, Tuffnells, UPS and Yodel. We
have not collected information from operators who offer only same-day delivery services
and as in previous years same-day services are excluded from the reported data.
4.3 It is our view that the information we have collected represents the significant majority of
UK parcel volumes and revenues carried by national parcel operators (excluding same day
parcels). We recognise, however, that the range of operators we have collected
information from may differ from other market sizing exercises, and therefore may not be
directly comparable.39 In addition, the international volumes and revenues reported here
include parcels only and not other methods of moving goods (such as freight). Where we
state proportions of total volumes and revenues below, the figures presented are (unless
otherwise stated) shares of the data collected. Unless stated otherwise, revenue data is
presented in real terms at 2018-19 prices.
4.4 In light of the continued growth in the e-commerce and parcels sector, we are undertaking
further work as part of our monitoring programme to assess how the market is responding
to the needs of parcel users, for instance considering business-to-consumer (B2C) and
consumer (C2X) parcel deliveries.
4.5 This year we have also decided to gather further information on parcel surcharging. In
2017 we identified additional costs to parcel deliveries when items begin or end their
journeys from more difficult to reach locations. Such higher costs were priced into services
offered to customers, including retailers sending bulk parcels. We found these additional
36 International data is collected from operators within the United Kingdom. Ofcom is unable to confirm whether data captured in international outbound includes revenue from external shipping or delivery. 37 Excluding same-day and within the hour delivery. 38 The list of operators from whom we collected information is unchanged from the 2017-18 Annual monitoring update on the postal market. UK Mail was acquired by DHL in December 2016 and is now listed as part of the latter. 39 While Ofcom’s definition of parcels in monitoring includes those postal items which are neither letters nor large letters and which weigh no more than 31.5kg, the preamble to Regulation (EU) 2018/644 on cross-border parcel delivery services assumes that all postal items more than 20mm thick are likely not to contain correspondence. See https://eur-lex.europa.eu/legal-content/EN/TXT/?uri=CELEX%3A32018R0644.

19
costs were driven by reduced economies of scale, delivery route/sector size and density,
and fuel or other transportation costs (related to flights and ferries, for example). We are
currently testing the extent to which these costs remain relevant to pricing variations for
parcel delivery across the UK. This updated analysis is planned in support of work
undertaken by the Consumer Protection Panel40 and other stakeholders exploring pricing
arrangements across delivery routes.
Parcel volumes and revenues
4.6 Total measured volumes and revenues continued to grow in 2018-19, though at a slightly
lower rate compared to the previous year. Total volumes increased by 10% year-on-year,
reaching a total of 2.6 billion items. Total revenues increased by 4% in real terms, a lower
rate than volumes, reaching £10 billion. This is shown in Figure 4.1 below. Taking all
measured parcels into account, the average unit revenue per parcel decreased by 5% year-
on-year, from £4.08 in 2017-18 to £3.86 in 2018-19.
4.7 In 2018-19 measured domestic parcel volumes increased by 9% to 2.1 billion items and
measured domestic revenues reached £6.25bn, an increase of 4% in real terms.41 As
illustrated in Figure 4.1, domestic parcels continue to make up the majority of parcel
volumes and revenues, as in 2017-18. While domestic parcels represented 81% of total
volumes in 2018-19 (the same proportion as in 2017-18), they only make up 62% of total
revenues (a decrease of 1% from 2017-18). The average unit revenue for a domestic parcel
was 5% lower than in 2017-18 at £2.98 and continues the trend of year-on-year real-terms
decline in average unit revenue for domestic parcels.
4.8 International inbound parcel volumes reached 309 million items in 2018-19, an increase of
15% year-on-year. However, inbound revenues did not grow as fast as volumes at 7% year-
on-year in real terms; the average unit revenue for inbound parcels therefore decreased
9% year-on-year from £5.22 to £4.75. Inbound parcels made up 12% of total measured
parcels and 15% of total measured revenues.
4.9 There may be a number of factors behind the significant increases in international inbound
volumes, with cross-border e-commerce purchases, particularly from China, being the
most likely significant driver of growth. The International Post Corporation survey found
that Chinese parcels accounted for 38% of all global cross-border parcels in 2018. The same
survey found that in 2018, 50% of international e-commerce shoppers in the UK had
bought their most recent cross-border purchase from China (up from 40% in 2017), with
the next highest proportion being purchases from the US at 19%.42 Within China itself there
is continued growth in outbound parcels: the Chinese State Post Bureau estimates found
40 Set up by BEIS the CPP identifies and prioritises areas where there is greatest harm caused to consumers in the UK and coordinates action by its members, including the Competition and Markets Authority, Chartered Trading Standards Institute and equivalent national bodies, and UK consumer advocacy bodies. 41 At 2018-19 prices. 42 IPC, 2018. Cross-border e-commerce shopper survey 2018. https://www.ipc.be/sector-data/e-commerce/cross-border-e-commerce-shopper-survey.

20
that there has been significant growth in Chinese parcel volumes during 2018 and that
Chinese express delivery firms dispatched around 34% more items globally in 2018 than in
the previous year.43
4.10 There was a year-on-year increase of 10% in international outbound parcel volumes in
2018-19 (reaching 193 million items), in line with the rate of growth for total parcels (10%).
However, the rate of growth in outbound parcel revenues was lower than the growth in
volumes, at 4% in 2018-19 in real terms (reaching £2.3bn), an increase at the same rate as
the revenues for the overall UK parcels market (4%). Outbound parcels represented 23% of
total parcel revenues in 2018-19 despite only making up 7% of total parcel volumes.
Average unit revenues for outbound parcels in 2018-19 fell from £12.62 to £11.92, a 6%
year-on-year decrease in real terms.
Figure 4.1: Total measured parcels volumes and revenues (including international)
Source: Operator returns to Ofcom/Ofcom estimates. Revenue figures adjusted for CPI at 2018-19
prices. Includes access volumes. 2017-18 figures include operator restatements and so may vary from
those published previously.
4.11 Figures 4.2 and 4.3 below show the measured total parcel volumes and revenues on a
quarterly basis for both 2017-18 and 2018-19. The Q3 period continues to be the busiest
period for domestic and international parcels. During this period, e-commerce was driven
by Christmas shopping and retail events like Black Friday and Cyber Monday. According to
the Office for National Statistics (ONS), growth in total retail spend in November 2018 (the
43 State Post Bureau of The People’s Republic of China, 2019. http://www.spb.gov.cn/xw/dtxx_15079/201905/t20190510_1828821.html.

21
month of Black Friday) was 5% greater and the quantity bought was 3.6% greater than in
the same month in 2017.
Figure 4.2: Quarterly measured volumes for parcels, 2017-18 to 2018-19 (million)
Source: Operator returns to Ofcom. Includes access volumes. 2017-18 figures include operator
restatements.
Figure 4.3: Quarterly measured revenues for parcels, 2017-18 to 2018-19 (million)

22
Source: Operator returns to Ofcom. Revenue figures adjusted for 2018-19 prices on a quarterly basis
so will differ from annual totals presented above. 2017-18 figures include operator restatements.
4.12 Next day (D+1) delivery items made up the majority of measured domestic parcel volumes
(59%) and revenues (65%) during 2018-19. Next day delivery items were a more substantial
part of parcel operators’ revenues than other parcel products, reflecting the higher prices
which are typically charged for next day services. The proportion of revenue accounted for
by next day items remained the same between 2017-18 and 2018-19, but the proportion
of overall volumes increased for next day by 3%. The average unit revenue for next day
items decreased by 9% in real terms, from £3.61 to £3.28. Conversely, the average unit
revenue for later than next day deliveries increased, to £2.42, up from £2.40 from 2017-18.
Figure 4.4: Domestic parcel volumes and revenues by speed of delivery: 2017-18 and 2018-19
Source: Operator returns to Ofcom/Ofcom estimates. Revenue figures adjusted for CPI at 2018-19
prices. Includes access volumes. 2017-18 figures have been restated. Due to a change in data
collection methodology from 2018-19, certain day-specific products listed as later than next day in
2017-18 may be reported as next-day from 2018-19 onwards.
Developments in the parcels sector
e-Commerce continues to grow in the UK
4.13 The growth in parcel volumes and revenues set out above reflects the continuing rise of e-
commerce in the UK and worldwide. The ONS reported that internet sales made up 18.0%
of total UK retail sales in 2018, up from 16.3% in 2017 and 14.7% in 2016.44
44 Office of National Statistics. Internet sales as a percentage of total retail sales. https://www.ons.gov.uk/businessindustryandtrade/retailindustry/timeseries/j4mc/drsi

23
4.14 According to research by Mintel, around 81% of British consumers used express and
courier services in the six months to February 2019, and the top three reasons for
consumers shopping online are cost, ease of finding products online and greater variety.45
4.15 Parcel operators are seeking to meet the demand for flexibility in parcel services from this
expansion of the e-commerce market by making collection and sending of parcels easier
for customers. We look in more detail at residential consumers’ attitudes and experiences
of sending and receiving parcels in Section 5.
4.16 One trend concerns the growth in e-commerce between the UK and China. In November
2018 Yodel opened its first international office in Chengdu, China to meet the demand
from UK consumers for goods from China.46 The new office is positioned to be accessible
from both Shenzhen and Hong Kong, and its sorting facility is close to Heathrow Airport.
Royal Mail has also launched a Tracked and Signed service to China in partnership with
China Post to meet demand for UK goods in China.47
4.17 Amazon, the largest e-commerce retailer in the UK with net UK sales of $14.5 bn in 2018 (a
nominal increase of 28% from its $11.3 bn net sales in 2017), launched its Business Prime
service for business procurement in the UK in summer 2019, offering free next day
delivery, for subscribing businesses.48 49 Pricing of the service at the time of writing is £80-
£4,500 a year, depending on the number of user accounts required by the business.50
Parcel operators are continuing to invest in infrastructure
4.18 In this section we cover some recent developments that operators are undertaking to
support growth and automation. These investments may also support the initiatives
focusing on the consumer experience, in particular around tracking. Alongside investment
in improved consumer access and functionality (discussed below), operators are making a
number of wider investments in infrastructure to meet growing demand for e-commerce.
Amazon currently operates 17 fulfilment centres across the UK and has opened four new
sites in 2018 in Rugby, Bolton, Bristol and Coventry, and in March 2019 announced plans to
open another site in Chesterfield later in the year.51
45 Mintel, 2019. Delivering the goods: British courier and express delivery market hit £12.6 billion in 2018. https://www.mintel.com/press-centre/retail-press-centre/delivering-the-goods-british-courier-and-express-delivery-market-hit-12-6-billion-in-2018 46 Yodel, 2018. Yodel announces launch of first international office in China. https://www.yodel.co.uk/news/2018/november/yodel-announces-launch-of-first-international-office-in-china/. 47 Royal Mail Group, 2018. Royal Mail launches tracked and signed service to China. https://www.royalmailgroup.com/en/press-centre/press-releases/royal-mail/royal-mail-launches-tracked-and-signed-service-to-china/. 48 Amazon, 2018. Amazon annual report 2018. https://ir.aboutamazon.com/static-files/0f9e36b1-7e1e-4b52-be17-145dc9d8b5ec. 49 Amazon, 2019. Amazon business launches business Prime in the UK. http://phx.corporate-ir.net/phoenix.zhtml?c=251199&p=irol-newsArticle&ID=2402817. 50 Amazon, 2019. Business Prime plans. https://www.amazon.co.uk/businessprime. 51 Amazon, 2019. Amazon to Create 200 New Permanent Jobs with the Opening of a new Fulfilment Centre in Chesterfield. http://phx.corporate-ir.net/phoenix.zhtml?c=251199&p=irol-newsArticle&ID=2395959.

24
4.19 Following the opening of its largest depot in Scotland at EuroCentral near Glasgow in
September 2018, DPD continues to build its £150m hub in Hinckley, Leicestershire, which
once operational in 2022 will be the largest parcel hub in Europe, according to the firm.52
4.20 With the announcement of its five-year strategic plan in May, Royal Mail stated it is
planning £400-500 million incremental investment to support its development of the UK
business. Part of this investment will be spent in further automating the handling of parcels
through Royal Mail’s network, via the deployment of additional small parcel sorting
machines in mail centres (handling single-piece untracked parcels) and the construction of
three new fully automated parcel hubs, to handle small tracked and larger and late-
acceptance parcels.53 Recent deployments of automated parcel machines by Royal Mail
include Bristol Mail Centre in July 2019, with work also starting on planning the fit-out of
the first of three parcel hubs (in Warrington) in the same month.54 55 We discuss Royal
Mail’s strategy further in Section 7.
4.21 Following its opening in 2017, Hermes upgraded its Rugby hub in 2019, allowing capacity to
be increased by 40%, thus enabling the handling of 1.35 million parcels per day at peak
periods.56
Operators are investing in customer convenience and functionality
4.22 In addition to investments to increase capacity, operators are also developing ways to offer
senders and receivers of parcels greater convenience and choice.
4.23 In relation to pick-up points, operators are creating pick-up points partnerships with high-
street retailers, such as Amazon’s Amazon Counter service offered with Next and PayPoint,
allowing consumers to pick up Amazon parcels from its retail stores.57 Another example is
DHL Parcels UK’s purchase of Pass My Parcel to take over their service points, as well as its
partnership with PayPoint, announced in August 2019 to offer click and collect and sending
services.58 In December 2019, FedEx entered an agreement with PayPoint to join Collect+,
allowing FedEx parcels to be delivered to 2,300 PayPoint locations in the UK.59 Lockers are
52 Post&Parcel, 2019. DPD’s fifth UK hub starting to take shape. https://postandparcel.info/106441/news/dpds-fifth-uk-hub-starting-to-take-shape/. 53 Royal Mail Group, 2019. Journey 2024: FY 2018-2019 results and strategy presentation. 54 Royal Mail Group, 2019. Royal Mail rolls out advanced technology to speed up parcel sorting in its Bristol mail centre. https://www.royalmailgroup.com/en/press-centre/press-releases/royal-mail/royal-mail-rolls-out-advanced-technology-to-speed-up-parcel-sorting-in-its-bristol-mail-centre/. 55 Parcel and Postal Technology International, 2019. Royal Mail starts work on state-of-the-art North West hub as part of network extention. https://www.parcelandpostaltechnologyinternational.com/news/construction-development/royal-mail-starts-work-on-state-of-the-art-north-west-hub-as-part-of-network-extension.html. 56 Apex Insight, 2019. Hermes Rugby super-hub expands capacity by 40%. https://apex-insight.com/hermes-rugby-super-hub-expands-capacity-by-40/. 57 Amazon. Amazon hub, Counter. https://www.amazon.co.uk/b?ie=UTF8&node=16302375031 58 Convenience Store, 2019. DHL Parcel partners with PayPoint to expand click and collect service. https://www.conveniencestore.co.uk/news/dhl-parcel-partners-with-paypoint-to-expand-click-and-collect-service/596271.article 59 Retail Times 2019, FedEx partners with PayPoint to offer convenient package pickup solutions http://www.retailtimes.co.uk/fedex-partners-with-paypoint-to-offer-convenient-package-pickup-solutions/

25
another option: Hermes has partnered with InPost, with the agreement providing Hermes
customers with access to InPost parcel lockers through its ParcelShop network.60
4.24 Following Royal Mail’s trial in 2018, parcel postboxes will be available in 1,400 locations
across the country including Birmingham, Leeds, Aberdeen and Cardiff which allow people
to send parcels without the need to visit a post office. In order to use the postboxes, users
must pay for the postage in advance and print a label at home.61
4.25 During the past year, several operators have developed their tracking services, increasing
convenience for consumers and decreasing the costs of delivery by enabling more
successful first time deliveries. For example, Yodel launched its Inflight app in October
2018, allowing customers to change their delivery details up to an hour before delivery is
due.62 In April 2019, Royal Mail announced the launch of delivery windows as short as two-
hours, with recipients being notified of these the windows the day before delivery.63
4.26 Operators are also investing in the equipment used to track and record deliveries. For
example, Hermes has started to replace stand-alone scanners with smartphones for
verification and recording proof of delivery.64 Hermes has also added functionality to its
consumer app to allow senders to record a video message that parcel recipients can access
by scanning a barcode on the parcel label when they receive it.65 In June this year, Royal
Mail launched new features in its consumer-facing mobile app allowing users to choose the
online Tracked 24/48 service to send items using the app.66 The app also allows users to
track deliveries, access automatic notifications, and create QR codes for printing postage at
a Customer Service Point (a QR code is a ‘Quick Response’ code, a type of barcode that can,
among other things, be read by cameras and therefore on smartphones).
Mergers and acquisitions activity
4.27 A range of mergers and acquisitions involving companies in the parcels sector have taken
place over the past year. As noted in Section 3, access letters and parcels operator the
Delivery Group acquired ONEPost, another access letters and parcels operator in March
2019. Following previous purchases of companies in the fulfilment sector to develop its
60 The Chartered Institute of Logistics and Transport, 2019, Hermes is first UK carrier to have parcel lockers in ParcelShop network https://ciltuk.org.uk/News/Latest-News/ArtMID/6887/ArticleID/21197/Hermes-is-first-UK-carrier-to-have-parcel-lockers-in-ParcelShop-network 61 BBC News, 2019. Royal Mail to launch parcel postboxes. https://www.bbc.co.uk/news/business-48334721 62 Yodel, 2018. Yodel announces launch of inflight. https://www.yodel.co.uk/news/2018/october/yodel-announces-launch-of-inflight/. 63 Royal Mail Group, 2019. A step change in convenience: Royal Mail launches delivery time notifications the day before. https://www.royalmailgroup.com/en/press-centre/press-releases/royal-mail/a-step-change-in-convenience-royal-mail-launches-delivery-time-notifications-the-day-before/. 64 Scandit, 2019. Hermes UK Delivers the Goods with Smartphone Barcode Scanning Technology from Scandit. https://www.scandit.com/hermes-uk-delivers-the-goods-with-smartphone-barcode-scanning-technology-from-scandit/. 65 SHD Logistics, 2019. Hermes launches unique technology designed to ‘make parcels personal’. https://www.shdlogistics.com/news/hermes-launches-unique-technology-designed-to-make-parcels-personal. 66 Royal Mail Group, 2019. Royal Mail launches new app features including purchasing and printing postage. https://www.royalmailgroup.com/en/press-centre/press-releases/royal-mail/royal-mail-launches-new-app-features-including-purchasing-and-printing-postage/.

26
business in this area, in December 2018 Whistl acquired the Spark Ecommerce Group, a
fulfilment and contact centre company based in Gateshead.67 ‘Fulfilment’ in this context
refers to the services purchased by businesses in order to get their items to customers.
Fulfilment encompasses delivery, but often also involves other services, such as
warehousing and delivery management software. This purchase follows its takeover of
Parcelhub and Mail Workshop in July 2018, and Prism DM in August 2017.
4.28 In September 2018 Smiths News and DHL Parcel UK (part of Deutsche Post DHL) reached
an agreement that saw DHL Parcel UK take over the parcel shop network used by Smith
News’ Pass My Parcel. In contrast to other parcel shop networks, Pass My Parcel allowed
retailers to directly send parcels to local retail outlets for click and collect.68
Environmental sustainability and the parcels sector
4.29 Sustainability has become a highly salient issue for the parcels sector, reflecting societal
concerns about the environment, public policy interventions to reduce carbon emissions
and congestion (especially in urban areas), and the desire for operators to increase
efficiency to maintain or grow their margins.
4.30 The use of congestion and emissions regulation in public policy continues to increase in
urban areas across the UK. In central London the Ultra-Low Emission Zone (ULEZ) was
established in April 2019, expanding on the Low Emissions Zone (LEZ) initially introduced in
February 2008. Other cities around the UK including Bath and Birmingham are also
planning or considering Clean Air Zones, which may require drivers of vehicles which do
not meet scheme emissions standards to pay to enter the area.69
4.31 Operators are investing to reduce the emissions produced by their fleets. One way of doing
this is the replacement of petrol or diesel vehicles with electric vehicles, which a range of
operators are doing. For example, in May 2019 Yodel announced a £15.2 million
investment in their fleet, while DPD has commissioned 10 fully-electric vans and opened
an electric parcels depot in Westminster, with plans for seven more across London and
additional investment in electric vehicles planned in future.70 71 Other operators deploying
electric vehicles in London include Hermes and UPS which has converted its London
delivery fleet to be all electric. Royal Mail, which introduced 100 electric vans into its fleet
in 2018, announced in July 2019 that it had introduced an additional 190 electric vans for
67 Whistl, 2018. Whistl announce the acquisition of The Spark Ecommerce Group. https://www.whistl.co.uk/news/whistl-announce-the-acquisition-of-the-spark-ecommerce-group. 68 Post&Parcel, 2018. Deutsche Post DHL take over operation of The Parcel Shop Network. https://postandparcel.info/98271/news/deutsche-post-dhl-take-over-operation-of-the-parcel-shop-network/. 69 BBC, 2019. Clean air zones: Where will UK drivers pay for polluting? https://www.bbc.co.uk/news/uk-47389830. 70 Yodel, 2019. Yodel makes £152m investment in greener fleet. https://www.yodel.co.uk/news/2019/may/yodel-makes-152m-investment-in-greener-fleet/. 71 DPD, 2019. DPD adds to all-electric fleet with UKs first Mercedes-Benz Evito vans. https://www.dpd.com/group/en/2019/05/09/dpd-adds-to-all-electric-fleet-with-uks-first-mercedes-benz-evito-vans/.

27
deliveries in the London area.72 Gnewt, a last-mile focused operator in London, operates a
fully electric fleet.73
4.32 Sustainability concerns related to the parcel sector go beyond emissions, with policy
makers seeking ways to reduce road congestion, for example by introducing congestion
charges, reducing the number of parking and loading bays or restricting or banning vehicles
from parts of cities. In response to this, researchers are working with operators to examine
ways in which changes in operations (for example by introducing portering, where
individuals on cycles or foot are used for the final element of delivery) or consolidation
(where an operator carries out last mile deliveries on behalf of other operators) may help
to reduce congestion, emissions, and reduce the cost of delivery for operators.
4.33 There is also some evidence to suggest that consumers are actively seeking more
environmentally friendly deliveries. According to the International Post Corporation’s 2018
Cross-Border e-commerce shopper survey 47% respondents across the countries surveyed
(including the UK) stated they would like carbon-neutral delivery for their parcels.74 With
the increases in spending through e-commerce helping to drive the demand for postal
services in the UK there may be an increase in these kinds of consumer demands over
time, as well as an increase in the demands of policy makers on postal operators to reduce
the net carbon emissions produced by their delivery networks.
Parcel pricing
Royal Mail single piece price trends
4.34 As part of our ongoing programme of work we have decided to report on the pricing trends
of some of Royal Mail’s single-piece domestic and international parcels products.
4.35 For delivery within the UK, Royal Mail offers two sizes of untracked parcel (Small and
Medium) within the First Class and Second Class services, and Special Delivery 1pm, within
the USO. Tracked products outside of the USO are also available for purchase.
4.36 Royal Mail offers a range of tracked and untracked international parcels products both
within and outside of the USO. Ofcom has not imposed price controls on these products
with the exception of the price cap on Second Class domestic parcels. The section below
shows the prices of untracked domestic and European parcels products. We also compare
the stamp price of domestic untracked parcels with the price of sending a parcel to Europe.
4.37 Overall we note that the prices of the domestic parcels we report below have stayed
relatively constant in nominal terms in the last five years, compared with more variations
over the years in the prices of parcels sent from the UK to Europe. When comparing
domestic parcels and parcels to Europe, we note that the difference between the domestic
72 SMMT, 2019. Royal Mail delivers on green ambitions with new electric vans. https://www.smmt.co.uk/2019/07/royal-mail-delivers-on-green-ambitions-with-new-electric-vans/ 73 About Gnewt. https://www.gnewt.co.uk/about.html 74 IPC, 2019. Cross-border e-commerce shopper survey 2018.

28
tariff and the Europe Zone75 tariff is smaller for the fastest service (First Class/International
Standard Europe) than the slower service (Second Class/International Europe Economy).
4.38 As can be seen below in Figure 4.5, in the past five years the nominal price of Royal Mail’s
single piece untracked domestic parcel service up to 2kg has remained relatively constant,
sometimes equating to a price reduction in real terms. For example, between March 2015
and March 2019, the price of a 2kg Second Class Small Parcel increased by 20p in nominal
terms to £3.00 – a 0.7% increase in real terms. The real-terms price of its First Class
equivalent fell by 5.2% over the same period, the nominal price having remained constant
since March 2016. A key distinction between First Class and Second Class pricing is that the
price of a 2kg Second Class Small or Medium Parcel is the same as the 1kg equivalent.
Figure 4.5: Selected single piece untracked/unsigned domestic parcels pricing
Source: Royal Mail price lists. Prices are nominal and relate to stamp price and exclude online
discounts where offered. Royal Mail prices as at March each year.
4.39 For its international single piece service, Royal Mail categorises each destination into one
of three price zones for the majority of its products: Europe (which includes both EU and
non-EU countries, including Russia), World Zone 1 (The Americas, Africa and the majority
of Asia), and World Zone 2 (Singapore, Papua New Guinea, Australasia and certain remote
islands). From 25 March 2019, a 1kg parcel cost £8.95 to send to Europe, £13.80 to World
75 One of the three geographic pricing zones used by Royal Mail for international services

29
Zone 1 and £14.55 to World Zone 2 using the Royal Mail International Standard service.
This is an untracked service.
4.40 Royal Mail also offers International Economy, a slower, but less expensive service, which is
also untracked. The price differential between the Economy and Standard service for
Europe zone varies between 5p and 10p but is as much as £8 for 2kg parcel to International
Zone 2.76
4.41 Between March 2015 and March 2019 the price of 2kg parcels to Europe has fallen both in
real and nominal terms, while there has been an increase both in nominal and real terms in
the price of lighter 1kg parcels. Between March 2015 and March 2019 the price of a 1kg
Standard International Parcel from the UK to the Europe Zone rose by 8.4% (1.8% when
adjusted for CPI), compared to a 10.1% nominal fall in the price of the equivalent 2kg
service, a 15.5% reduction in real terms over the period.
Figure 4.6: Selected Royal Mail single-piece untracked/unsigned products pricing: Europe zone
Source: Royal Mail price lists. Figures are nominal and relate to stamp price and exclude online
discount if offered.
4.42 When comparing domestic and Europe zone tariffs, the difference between the domestic
tariff and the Europe Zone tariff is higher for the Second Class/International Europe
Economy than for the First Class/International Standard Europe equivalent. For example, a
76 £20.05 compared £12.05, prices from 25 March 2019. https://www.royalmail.com/sites/default/files/royal-mail-our-prices-25-march-2019.pdf.
6
7
8
9
10
11
12
13
14
2015 2016 2017 2018 2019
1kg parcel: International Standard - Europe Zone 1kg parcel: International Economy - Europe Zone
2kg parcel: International Standard - Europe Zone 2kg parcel: International Economy - Europe Zone
£

30
1kg International Standard parcel is priced at 252% of the 1kg First Class small parcel and
154% of the 1kg First Class Medium Parcel product. In comparison, the Second Class
International Economy Europe/Second Class Small and Medium parcel price difference is
295% and 174% respectively.77
Figure 4.7: Selected Royal Mail domestic and international parcel products: prices from March
2019 and nominal change from prior year
Source: Royal Mail price lists. Figures are nominal and relate to stamp price and exclude online
discount if offered. Note: Maximum size dimensions for international parcels fall between size limits
for domestic small and medium parcels.
Publication of cross-border parcel tariff data
4.43 From January 2019 certain parcel operators in the European Union have been required to
provide the relevant national regulator with their public tariffs as at the 1st of January each
year.78 These public tariffs are then published on the European Commission’s website by 31
March of each year. This measure, set out in Regulation (EU) 2018/644 on cross-border
parcel delivery services, aims to increase transparency of pricing of cross-border parcels
services in the EU.79
77 As the maximum dimensions of an International parcel fall between those of the domestic small and medium parcel, both sizes of domestic parcel are included for comparison. 78 European Commission, 2019. Public tariffs on cross-border parcel delivery services. https://ec.europa.eu/growth/sectors/postal-services/parcel-delivery/public-tariffs-cross-border_en 79 EUR-Lex, 2018. Regulation (EU) 2018/644 of the European Parliament and of the Council of 18 April 2018 on cross-border parcel delivery services. https://eur-lex.europa.eu/legal-content/EN/TXT/?uri=CELEX%3A32018R0644.
£3.00
£5.10
£8.85
£3.55
£5.80
£8.95
£3.00
£5.10
£12.05
£5.50
£8.95
£12.10
1kg small parcel: 2nd class
1kg medium parcel: 2nd class
1kg parcel: International Economy - Europe Zone
1kg small parcel: 1st class
1kg medium parcel: 1st class
1kg parcel: International Standard - Europe Zone
2kg small parcel: 2nd class
2kg medium parcel: 2nd class
2kg parcel: International Economy - Europe Zone
2kg small parcel: 1st class
2kg medium parcel: 1st class
2kg parcel: International Standard - Europe Zone
+ 1.7%
+ 1.0%
+ 3.5%
+ 2.9%
+ 0.9%
+ 3.5%
+ 1.7%
0.0%
+ 1.0%
0.0%
0.0%
0.0%
YoY change (nominal)
2kg: 1s t class /Standard
2kg: 2nd class/Economy
1kg: 1st class/Standard
1kg: 2nd class /Economy

31
4.44 The price to send a parcel of a given weight from the UK to another European country can
vary considerably between operators. This may reflect differences in product specification
(for example size limits, speed of delivery, level of insurance and the presence of tracking),
and differences in business models adopted by operators.
Summary
4.45 Parcels volumes and revenues continued to grow, with total volumes growing 10% year-
on-year, reaching a total of 2.6 billion items, and total revenues increasing by 4% year-on-
year, reaching a total of £10 billion. Online retailing continues to increase its share of all
retail in the UK. E-commerce is likely a major factor in driving the growth in volumes, while
competition in the market may be reducing the rate of growth in revenues.
4.46 The period in the run-up to Christmas (quarter 3 of the financial year) accounts for 30% of
annual volumes for parcel operators. Next day deliveries remain the most popular option
for sending parcels.
4.47 Policy changes and consumer concerns around sustainability have encouraged some parcel
operators to make environmentally friendly investment choices, particularly in electric
vehicles, to meet new demands around emissions and congestion in conurbations across
the UK. Some parcel operators are also trialling innovative methods of final mile delivery to
increase efficiency and to meet these new demands.
4.48 This year we show the prices of some of Royal Mail’s untracked domestic and European
parcels products. Overall prices for many of the domestic products reported on have
remained relatively constant in nominal terms, providing a real term decrease in prices
over time for consumers for some products. There have been more variations over the
years in the prices of parcels sent from the UK to Europe.
32
5. Consumer and business experience of postal services
Introduction
5.1 In this section, we present data from our ongoing market research programme. We run
two separate surveys to track use of and attitudes to post, one focused on residential
consumers and the other focused on small and medium enterprise (SME) business
customers.80 The data reported here is from the period of Q3 2018 to Q2 2019 reflecting
the most up-to-date data we have at the time of publication.
5.2 The data from these surveys is published on our website going back to 2012 when the
research programme began.81 The research was briefly paused in 2015, as a review was
carried out to consider what additional data it might be necessary for us to obtain in light
of changing Residential and SME users’ experience of postal services. Methodological and
questionnaire changes at the start of 2016 for the residential tracker mean that data from
prior to this time are not directly comparable. Comparisons are made to 2017-18 results in
the same period (Q3 2018 to Q2 2019) where relevant.
Residential consumers
5.3 Over eight in ten residential consumers are satisfied with Royal Mail (84%) and postal
services overall (86%), with dissatisfaction levels at 4% and 3% respectively. Three quarters
(76%) are satisfied with the postal services in delivering value for money of sending mail
overall, with 8% dissatisfied. These results are in line with 2017-18. Overall satisfaction
with Royal Mail is at a similar level in each of the UK Nations, at 84% in England, 85% in
Scotland, 85% in Wales and 87% in Northern Ireland. Satisfaction with the postal services in
delivering value for money of sending mail overall stands at 76% in both England and
Scotland, 78% in Wales, and 80% in Northern Ireland. Satisfaction with value for money in
rural locations is comparable to rural (75%) vs urban (77%).
80 Businesses that have under 250 employees. 81 Ofcom, 2017. Communications Market Report. https://www.ofcom.org.uk/__data/assets/pdf_file/0017/105074/cmr-2017-uk.pdf ; our Statistical Release Calendars can be found at https://www.ofcom.org.uk/research-and-data/data/statistics. The Q3 2018-Q2 2019 residential and business postal tracker data is available from our Statistical Release Calendar on 15 August 2019. Our data files show further information on the results of the survey broken down by categories of customers, for instance by age groups or nations. Examples of results by nations, where relevant, are included in footnote.

33
Figure 5.1: Residential consumers’ satisfaction with postal services82
Source: Ofcom Residential Postal Tracker Q3 2018-Q2 2019 (5,956), Q3 2017-Q2 2018 (5,779)
Base: All Respondents
“QG2: How satisfied are you overall with the postal services in terms of delivering value for money
for sending mail? QG5: How would you rate your overall satisfaction with Royal Mail?” “QG6: How
would you rate your overall satisfaction with postal services? (ALL providers)”
5.4 Looking at specific aspects of Royal Mail’s service, as in 2017-18, residential consumers are
most satisfied with items sent reaching their destination (86%), items being delivered
intact/undamaged (85%), the quality of postal delivery to the home (84%) and the delivery
speed (83%).83 Also in line with 2017-2018, the lowest levels of satisfaction were with the
cost of postage (60%), product and service innovation (53%) and easy access to
information, for example about complaints procedures (47%). Easy access to information is
the only aspect of Royal Mail’s service with which less than half of customers are satisfied.
82 1% of repondents say ‘don’t know’ to satisfaction postal services (QG6) , satisfaction with Royal Mail (QG5) and satisfcation with postal services for value for money of sending (QG2) in both years. 83 Respondents in Northern Ireland were more likely to be satisfied with the availability of post office branches than respondents in the UK overall (net satisfaction 80% vs 68%), and respondents in Scotland (63%) Wales (68%) and England (69%) are significantly less satisfied than respondents in Northern Ireland (80%).
39%
38%
47%
46% …
10%
11%
3%
3%
2017/18
2018/19
Overall Satisfaction with Royal Mail(QG5)
39%
39%
48%
47%
9%
10%
2%
2%
2017/18
2018/19
Overall Satisfaction postal services(QG6)
32%
31%
45%
45%
14%
15%
5%
6%
2%
2%
2017/18
2018/19
Very satisfied Fairly satisfied Neither Fairly dissatisfied Very dissatisfied Don’t know
Satisfaction with postal services for Value For Money of sending post (QG2)
86%
87%
NET Satisfied
86%
77%
84%
76%

34
Figure 5.2: Residential consumers’ satisfaction with specific aspects of Royal Mail’s service
Source: Ofcom Residential Postal Tracker), Q3 2018-Q2 2019 (5,779), Q3 2017-Q2 2018 (5,796)
Base: All Respondents
“QG3: How satisfied are you with the following aspects of Royal Mail’s service? (NET: ‘very satisfied’
and ‘fairly satisfied’)”
5.5 About two thirds (65%) of residential consumers think that First Class stamps represent
good value for money, with a lower percentage (56%) thinking that Second Class stamps
are good value. One in five (21%) said that Second Class stamps are poor value, while a
lower proportion said this about First Class stamps (15%). In both cases, perceptions of
good value for money are in line with Q3 2017 to Q2 2018 (67% for First Class stamps, and
58% for Second Class stamps).
49%
54%
62%
70%
74%
78%
83%
84%
85%
86%
47%
53%
60%
68%
72%
77%
83%
84%
85%
86%
Easy to access information e.g. about complaints procedure
Product and service innovation
Cost of postage
Availability of post office branches
Accessibility of services
Availability of postal boxes
Speed of delivery
Quality of postal delivery to your home
Items being delivered intact/undamaged
Items you send reaching their destination
2018-19 2017-18

35
Figure 5.3: Residential consumers’ perception of value for money of stamps
Source: Ofcom Residential Postal Tracker
Base: All Respondents Q3 2018-Q2 2019 (5,779), Q3 2017–Q2 2018 (5,836)
“QF4: A First Class stamp currently costs 67p/70p. How would you rate Royal Mail’s First Class service
in terms of value for money?” “QF5: A Second Class stamp currently costs 58p/61p. How would you
rate Royal Mail’s Second Class service in terms of value for money?”
5.6 Respondents were asked whether they had experienced one or more of a range of
problems with Royal Mail’s service over the past year. Just over half overall (53%) reported
a problem, and problems experienced were similar to those reported in 2017-2018. Just
over a third (36%) said their mail was mis-delivered while just over a fifth (22%) said they
had received a card from Royal Mail saying that an item could not be delivered when
someone was at home and could have taken delivery. In both cases reported experience is
slightly down from last year. Around one in five (18%) reported a problem with delayed
mail.

36
Figure 5.4: Residential consumers’ problems with Royal Mail
Source: Ofcom Residential Postal Tracker
Base: All Respondents Q3 2018-Q2 2019 (3712), Q3 2017-Q2 2018 (5,836)
“QH1: In the last 12 months, have you experienced problems with Royal Mail’s service in terms of...”
5.7 Consumers were asked if they were sending more, less or the same amount of different
types of mail as two years ago. As in previous years, for each of the eight types of post
asked about, the proportion of residential consumers saying that they are sending less
than two years ago was higher than the proportion reporting that they are sending more,
except for tracked post84 where 2% more consumers say they are receiving more than two
years ago.
84 The question refers to post in general and therefore does not distinguish between letters and parcels.

37
Figure 5.5: Consumers say they send different types of post compared to two years ago
Source: Ofcom Residential Postal Tracker
Base: All Respondents Q3 2018-Q2 2019 (3,004)
“QD12: Frequency of sending ... compared to two years ago (note this question was asked in
alternate months)”
5.8 Consumers were also asked if they were receiving more, less or the same amount of
different types of mail as two years ago. A higher proportion of consumers reported
receiving less post than consumers receiving more post (a net decrease) across most types
of letter mail. There was a higher proportion of consumers reporting more post received
than less post received (a net increase) for a minority of types of mail.
5.9 The biggest net decreases in mail received are seen in social mail: 6% say they are receiving
more personal letters compared to three in ten (31%) receiving fewer than 2 years ago.
Similarly, 7% say they are receiving more invitations, greeting cards and postcards than
two years ago compared to 29% receiving fewer. Receipt of transactional mail such as bills,
invoices or statements have also declined considerably, 14% of respondents reported
receiving more of these than two years ago compared to more than a third (35%) who
reported that they are receiving less.
5.10 The biggest net increase reported was for direct mail from unknown organisations, with
three in ten reporting that they are receiving more of this type of mail compared to just
over a fifth receiving less. Net increases are also noted for parcels both large and small.
Just under a quarter (23%) reported receiving more smaller parcels (that will fit through a
letter box), compared to just over one in ten (13%) receiving less, resulting in a net
increase of +10% saying they are receiving more smaller parcels compared to two years
ago. Similarly, just under a quarter (23%) reported receiving more larger parcels (that will
Type of mail Sent more(%)
No change
Sent less (%)
Net more/ Less
Invitations/ greeting cards / postcards 8 56 35 -27
Personal letters (e.g. to a friend/ relative) 7 55 37 -30
Formal letters to organisations/ individuals 9 56 33 -24
Payment for bills 7 54 37 -30
Smaller parcels 17 61 21 -4
Larger parcels 15 62 22 -7
Items requiring a signature 13 66 19 -6
Tracked post 18 65 16 +2
Other items not mentioned 2 30 6 -4

38
not fit through a letter box) compared to 15% who say they receive fewer resulting in an
overall net increase of +8% compared to two years ago.
Figure 5.6: Consumers receiving different types of post compared to two years ago
Source: Ofcom Residential Postal Tracker
Base: All respondents in odd months only Q3 2018-Q2 2019 (3,004)
“QE11. Thinking about these different types of mail, would you say that you now receive them more
or less often than two years ago? Or has there been no change? Please think only about items that
are addressed to you personally.”
5.11 Residential consumers were asked to rate the importance of several different factors when
sending letters. Over four in five (84%) said that guaranteed delivery to recipient was
‘mandatory’ or ‘great to have’. This was followed by ‘low cost’, ‘same price to send
anywhere within the UK’, ‘delivery within three days’, ‘convenient to post’ (around half a
mile), ‘fast delivery’ and ‘daily collection service’, all with more than seven in ten saying
these factors are important to them. The option receiving the lowest level of importance
attached was a next day delivery option (61%). These are broadly in line with 2017-2018
results.

39
Figure 5.7: Factors rated as important for people when sending letters 2018-19
Source: Ofcom Residential Postal Tracker Base: all who use Royal Mail for letters or large letters and
selected a service Q3 2018-Q2 2019 (3,499).
“QD10b. Below, are a list of factors people tell us they consider when sending letters. For each factor,
please tell us how important it is to you in choosing a postal provider or service.”
5.12 The same question was asked about sending parcels. A range of factors were rated as
‘mandatory’ or ‘great to have’ by at least seven in ten respondents. The most important
factors for parcels remain those around knowing the parcel has been sent and arrived
within the desired time frame, i.e. proof of postage/dispatch and guaranteed delivery
(both 80%). Other factors, specifically, low cost (77%), proof of receipt and guarantee that
the parcel will arrive on time (both 76%), same price to anywhere (75%), fast delivery
(71%) and the ability to track delivery (70%) were also very important.
5.13 Others rated as important by at least six in ten people are: convenient options for me to
drop off parcel (64%), convenient options for recipient to accept delivery (62%), and a daily
collection service (61%). The options that were rated as the least important were the
ability to select a specific date/time for delivery (49%) and convenient options for operator
to pick parcel up (47%).
5.14 As with letters, these results are all broadly in line with 2017-18.

40
Figure 5.8: Factors rated as important for people when sending parcels (2018-19)
Source: Ofcom Residential Postal Tracker Q3 2018-Q2 2019.
Base: Those who have sent a parcel or tracked item/item requiring signature in the past month
(3,499)
“QD10a: List of factors people consider when sending parcels... (NET: ‘mandatory’ and ‘great to
have’).”

41
Figure 5.9: Factors rated as important for people when sending parcels (2018-19)
Source: Ofcom Residential Postal Tracker Q3 2018-Q2 2019
Base: Those who have sent a parcel or tracked item/item requiring signature in the past month
(3,499).
“QD10a: List of factors people consider when sending parcels... (NET: ‘mandatory’ and ‘great to
have’).”
5.15 Consumers were also asked about the importance of various factors when choosing a
provider for a letter or parcel they will receive. The results show that consumers are
concerned with the safe delivery of parcels when choosing a provider to deliver to them.
When asked, nine in ten said that the guarantee that the parcel will arrive intact was
“mandatory” or “great to have”, followed by guaranteed delivery to my door (86%),
guarantee that the parcel will arrive on time (81%) and low cost (80%). Most of the other
options were rated important by at least two thirds of consumers. The option that received
the lowest proportion of these responses was the inclusion of insurance, which was rated
as important by half of respondents. These are similar to the results in 2017-18.
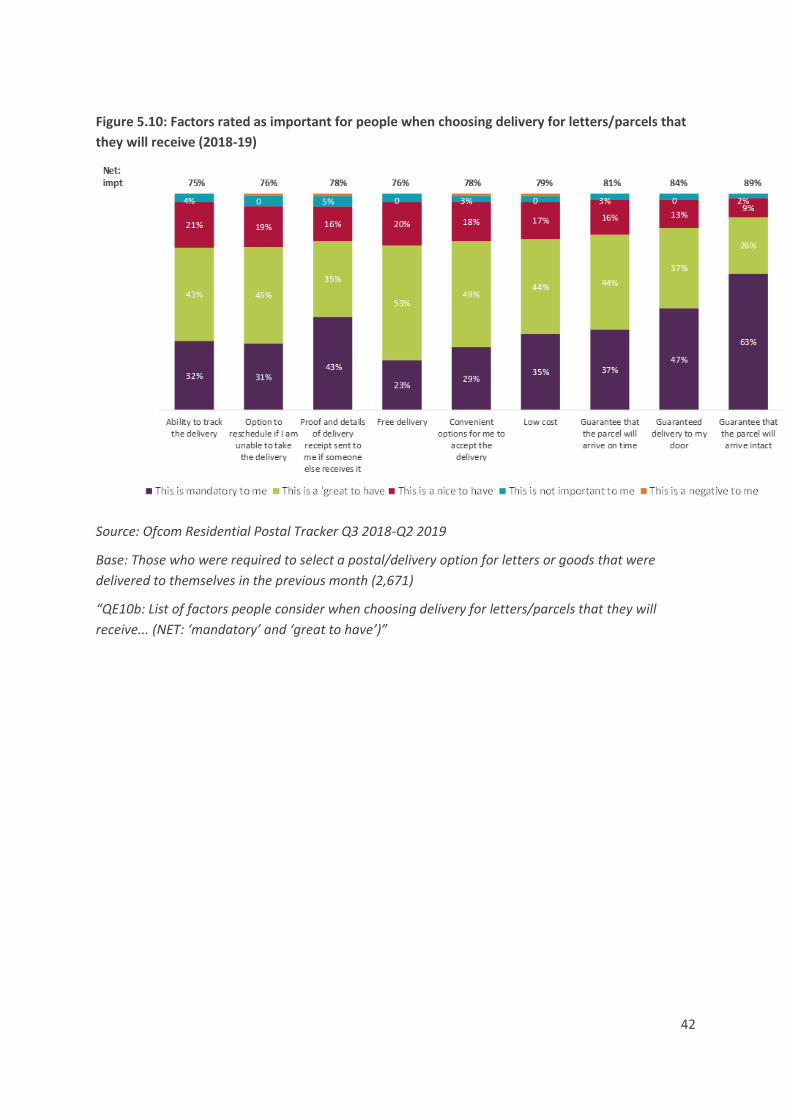
42
Figure 5.10: Factors rated as important for people when choosing delivery for letters/parcels that
they will receive (2018-19)
Source: Ofcom Residential Postal Tracker Q3 2018-Q2 2019
Base: Those who were required to select a postal/delivery option for letters or goods that were
delivered to themselves in the previous month (2,671)
“QE10b: List of factors people consider when choosing delivery for letters/parcels that they will
receive... (NET: ‘mandatory’ and ‘great to have’)”

43
Figure 5.11: Factors rated as important for people when choosing delivery for letters/parcels that
they will receive (2018-19)
Source: Ofcom Residential Postal Tracker Q3 2018-Q2 2019
Base: Those who were required to select a postal/delivery option for letters or goods that were
delivered to themselves in the previous month (2,671)
“QE10b: List of factors people consider when choosing delivery for letters/parcels that they will
receive... (NET: ‘mandatory’ and ‘great to have’)”

44
Figure 5.12: Factors rated as important for people when choosing delivery for letters/parcels that
they will receive. Nets: 2017-18, 2018-19
Source: Ofcom Residential Postal Tracker) Q3 2018–Q2 2019 (2,671), Q3 2017 – Q2 2018 (2,528)
Base: Those who were required to select a postal/delivery option for letters or goods that were
delivered to themselves in the previous month.
“QE10b: List of factors people consider when choosing delivery for letters/parcels that they will
receive... (NET: ‘mandatory’ and ‘great to have’)”
SME consumers
5.16 Similar to residential consumers, when asked about their satisfaction with the service from
their postal provider, over eight in ten SMEs who use Royal Mail (86%) said they were
satisfied, compared with a similar proportion of those who use other providers (84%).
Overall dissatisfaction was higher for other providers (6%) compared to Royal Mail (3%).
The overall level of satisfaction with Royal Mail amongst SMEs remains in line with the
previous year while it is lower amongst SMEs using other providers (84% vs 88%).
49%
54%
62%
66%
67%
68%
75%
75%
75%
76%
77%
78%
78%
78%
80%
81%
86%
90%
50%
54%
61%
64%
67%
65%
74%
74%
77%
75%
76%
78%
76%
78%
79%
81%
84%
89%
Inclusion of insurance
Ability to select an evening/weekend delivery
Ability to choose an express or next day service
Ability to provide a specific time slot or SMS notification of delivery time
Availability of nearby collection points in case of failed delivery
Ability to select a specific date/time for delivery
Proof of postage/dispatch
Fast delivery
Knowledge that they will deliver to a neighbour or safe place if I am not available…
Ability to track the delivery
Option to reschedule if I am unable to take the delivery
Proof and details of delivery receipt sent to me if someone else receives it
Free delivery
Convenient options for me to accept the delivery
Low cost
Guarantee that the parcel will arrive on time
Guaranteed delivery to my door
Guarantee that the parcel will arrive intact
2018/19 2017/18

45
Figure 5.13: SME satisfaction with postal services
Source: Ofcom Business Postal Tracker
Base: Q3 2018–Q2 2019 All who use Royal Mail (1,869), All those who use other providers than RM
(435). Q3 2017–Q2 2018 All who use Royal Mail (2,266), All those who use other providers than RM
(434).
“QRM2: Thinking generally about the service your organisation receives, how satisfied are you with
the overall quality of the services you receive from Royal Mail as a recipient and sender?”
“QOP1a: Thinking generally about the service you receive as a whole… how would you rate the
quality of the services you receive from [QV4 provider]?”
5.17 Looking at specific elements of Royal Mail’s service, similarly to 2017-18, SMEs are most
satisfied with items being ‘delivered intact/undamaged’ (88%), ‘delivery
consistency/reliability’ (82%) and ‘delivery time’ (78%). Satisfaction is lowest with
‘collection time of items being sent’ (60%) and ‘price of postage’ (52%). Satisfaction levels
have dropped for collection factors such as ‘collection reliability’ (to 62% from 72% in
2017-18) and ‘collection time of items you are sending’ (to 60% from 67% in 2017-18).
There have been no big increases year on year; the level of satisfaction for ‘cost of postage’
went up from 49% to 52%.

46
Figure 5.14: SME satisfaction with specific elements of Royal Mail’s service
Source: Ofcom Business Postal Tracker.
Base: All respondents who use Royal Mail Q3 2018-Q2 2019 (1869), Q3 2017–Q2 2018 (1,933).
“QRM3: How would you rate the performance of Royal Mail, as a recipient and sender, in the
following areas on a five-point scale where 1 is ‘very dissatisfied’ and 5 is ‘very satisfied’? NET: %
fairly/very satisfied.”
5.18 SMEs were asked whether they had experienced a list of possible problems with Royal Mail
in the last six months. More than eight in ten (85%) reported that they had not
experienced any problems. This is in line with 87% who said the same in 2017- 2018.
Where problems were reported, as with previous years, the biggest problem was the
‘amount/level of lost mail’ reported. Around four in ten (39%) of those who have had a
problem said it was with the ‘amount/level of lost mail’.
49%
67%
72%
72%
74%
77%
82%
87%
52%
60%
72%
62%
76%
78%
82%
88%
Price of postage
Collection time of items you are sending
Latest collection time
Collection reliability
Amount / level of lost post sent
Delivery time
Delivery consistency / reliability
Items being delivered intact / undamaged
2018-19 2017-18

47
Figure 5.15: SME problems experienced with Royal Mail
Source: Ofcom Business Postal Tracker Q3 2018-Q2 2019 (271), Q3 2017–Q2 2018 (251).
Base: All respondents who use Royal Mail who had reported a problem in the last 6 months.
“QRM4: Have you experienced any problems with your service from Royal Mail (as a sender or
recipient of mail) in the last 6 months?”
5.19 SMEs were asked to rate the importance of various factors when choosing a provider when
sending letters. The most important factors for SMEs are ‘guaranteed delivery’ rated as
‘mandatory/great to have’ by more than two thirds (68%) and ‘convenience of posting
items (within half a mile)’ (63%). ‘Delivery within three days’ and ‘same price to anywhere
in the UK’ were both rated as important by around six in ten SMEs (60% and 59%
respectively), followed by ‘fast delivery’ (57%) and ‘low cost’ (58%). The options that
received the lowest importance ratings were ‘next day delivery option’ (50%) and ‘daily
collection service’ (48%). The importance rating for ‘fast delivery’ has increased from 51%
to 57% while ‘guaranteed delivery’ has also increased from 64% to 68%. There are no
decreases year on year.
39%
18%
11%
11%
10%
4%
2%
1%
31%
18%
10%
15%
10%
3%
2%
1%
Amount/level of lost post
Delivery consistency
Damaged items
Wrong mail delivered
Delivery times
Collection reliability
Collection time
Latest collection time2018-19 2017-18

48
Figure 5.16: Factors rated as important for SMEs when sending letters
Source: Ofcom Business Postal Tracker.
Base: All respondents who use Royal Mail to send letters or large letters and selected a service Q3
2018-Q2 2019 (1326), Q3 2017–Q2 2018 (1,620).
“QD10b. Below, are a list of factors people tell us they consider when sending letters. For each factor,
please tell us how important it is to you in choosing a postal provider or service. (NET: ‘mandatory’
and ‘great to have’).”
48%
50%
51%
59%
58%
58%
62%
64%
48%
50%
57%
58%
59%
60%
63%
68%
Daily collection service
Next day delivery option
Fast delivery
Low cost
Same price to send to anywhere within UK
Delivery within 3 days
Convenient to post(within 1/2 mile)
Guaranteed delivery
2018-19 2017-18
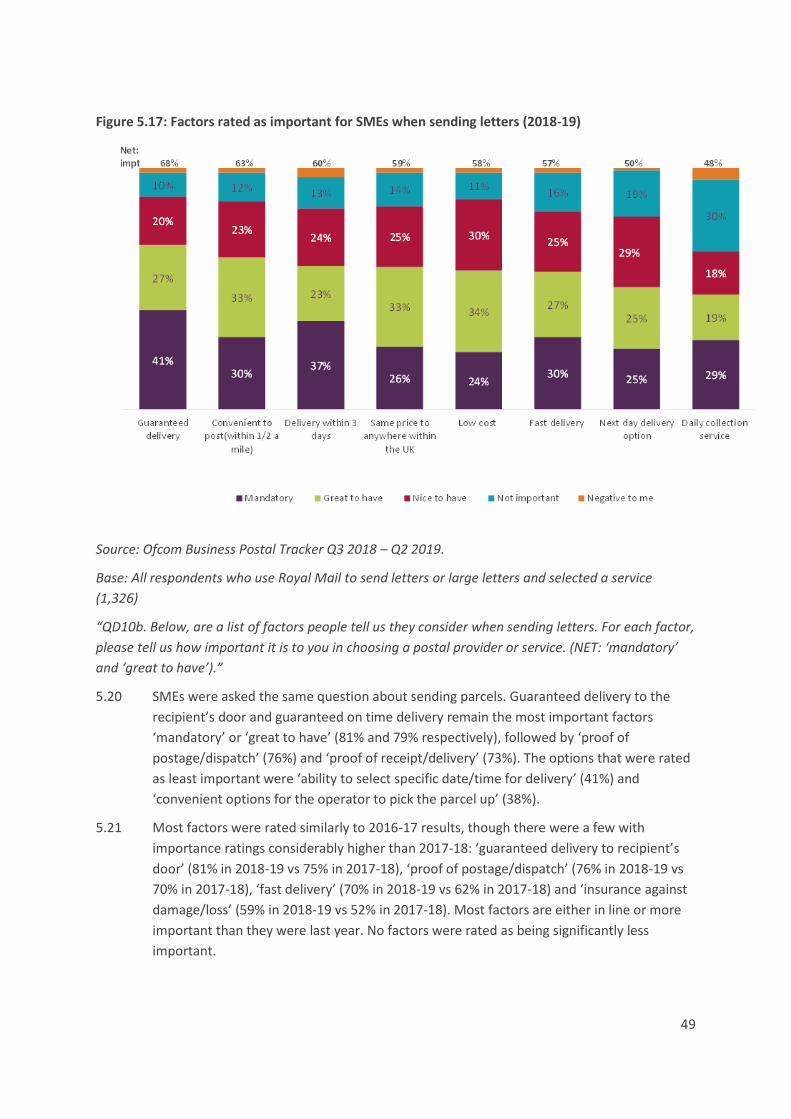
49
Figure 5.17: Factors rated as important for SMEs when sending letters (2018-19)
Source: Ofcom Business Postal Tracker Q3 2018 – Q2 2019.
Base: All respondents who use Royal Mail to send letters or large letters and selected a service
(1,326)
“QD10b. Below, are a list of factors people tell us they consider when sending letters. For each factor,
please tell us how important it is to you in choosing a postal provider or service. (NET: ‘mandatory’
and ‘great to have’).”
5.20 SMEs were asked the same question about sending parcels. Guaranteed delivery to the
recipient’s door and guaranteed on time delivery remain the most important factors
‘mandatory’ or ‘great to have’ (81% and 79% respectively), followed by ‘proof of
postage/dispatch’ (76%) and ‘proof of receipt/delivery’ (73%). The options that were rated
as least important were ‘ability to select specific date/time for delivery’ (41%) and
‘convenient options for the operator to pick the parcel up’ (38%).
5.21 Most factors were rated similarly to 2016-17 results, though there were a few with
importance ratings considerably higher than 2017-18: ‘guaranteed delivery to recipient’s
door’ (81% in 2018-19 vs 75% in 2017-18), ‘proof of postage/dispatch’ (76% in 2018-19 vs
70% in 2017-18), ‘fast delivery’ (70% in 2018-19 vs 62% in 2017-18) and ‘insurance against
damage/loss’ (59% in 2018-19 vs 52% in 2017-18). Most factors are either in line or more
important than they were last year. No factors were rated as being significantly less
important.

50
Figure 5.18: Factors rated as important for SMEs when sending parcels. Nets: 2017-18, 2018-19
Source: Business Postal Tracker.
Base: all using Royal Mail to send parcels and packets Q3 2018-Q2 2019(563), Q2 2017-Q3 2018
(673).
“QD10a. Below, are a list of factors people tell us they consider when sending parcels. For each
factor, please tell us how important it is to you in choosing a postal provider or service.”
Summary
5.22 Residential and SME postal service users continue to be generally satisfied with services
provided by both Royal Mail and other service providers.
5.23 Residential and SME postal users are most satisfied with key features of Royal Mail’s
delivery service relating to reliability and mail integrity. Residential postal users are most
satisfied with ‘sent items reaching their destination’ and ‘sent items being delivered intact
and undamaged’. SMEs are asked about slightly different features, but overall are most
satisfied with ‘the items being delivered intact/undamaged’ and ‘delivery
consistency/reliability’.
5.24 About half of residential postal consumers overall said they have experienced a problem
with their post in the last year. The biggest problem reported was with ‘mis-delivered
38%
40%
53%
54%
57%
56%
52%
62%
66%
66%
62%
68%
70%
77%
75%
38%
41%
53%
56%
57%
58%
59%
60%
64%
65%
70%
73%
76%
79%
81%
Convenient options for the operator pick parcel up
Ability to select specific date/time for delivery
Daily collection service
Convenient options for recipient to accept delivery
Ability to choose express or next day service
Convenient options to drop the parcel off
Insurance against damage/loss
Same price to send to anywhere within UK
Low cost
Ability to track delivery
Fast delivery
Proof of receipt/delivery
Proof of postage/dispatch
Guaranteed on-time delivery
Guaranteed delivery to recipient's door
2018-19 2017-18

51
mail’. Fewer SMEs have experienced problems with their post. SMEs mostly had problems
with the ‘amount/level of lost post’.85
5.25 Residential post users rated ‘proof of postage’ as the most important factor when sending
parcels; SMEs rated guaranteed delivery for both letters and parcels as the most important
factor.
5.26 Residential customers reported continuing to send less post, with the exception of tracked
mail. Residential customers also reported receiving more parcels, but less personal mail.
85 Different questions and codes therefore not directly comparable. SME tracker question wording: “Have you experienced any problems with your service from Royal Mail as a sender or recipient of post in the last 6 months?” Residential consumer tracker question wording: “In the last 12 months, have you experienced problems with Royal Mail’s service in terms of……”
52
6. Efficiency of the Reported Business 6.1 In this section, we discuss efficiency of the Reported Business86 covering:
• Why it is an important aspect of our monitoring regime;
• Our estimate of Royal Mail’s efficiency performance in 2018-19;
• Royal Mail’s views on its efficiency and what it has been doing to improve its efficiency;
and
• Summary of the efficiency of the Reported Business and recent events.
Efficiency is an important aspect of our monitoring regime
6.2 In discharging our duties in relation to post, the Postal Services Act 2011 requires us to
have regard to the need for the provision of a universal service to be financially
sustainable, and for it to become efficient within a reasonable period and then remain
efficient at all subsequent times.
6.3 In the March 2017 Statement, we concluded that the imposition of additional price
controls or efficiency targets on parts of Royal Mail’s business was not necessary. In
reaching our conclusion we considered Royal Mail’s efficiency performance, the incentives
on Royal Mail to make further efficiency improvements in the future and our ability to
intervene if Royal Mail failed to make enough progress on improving its efficiency whilst
exposing customers to higher prices or lower quality of service. We also considered the
challenges Royal Mail faced in the short term, including the pay and pension negotiations,
which were then ongoing. In reaching our conclusion, we highlighted the importance of
our monitoring regime in providing a safeguard.
6.4 The pay and pension negotiations were subsequently concluded in February 2018, when
Royal Mail announced the Pensions, Pay and Pipeline Agreement (later referred to as ‘the
Agreement’) with the Communication Workers Union (CWU). As part of the Agreement,
the Royal Mail Pension Plan (RMPP) closed in March 2018. This avoided an increase in
annual cash contributions of around £800m, according to Royal Mail’s estimation.87 88
Indicators of Royal Mail’s efficiency performance
6.5 In the March 2017 Statement, we set out the metrics and framework we proposed to
adopt to monitor Royal Mail’s efficiency performance.89 We proposed to use a variety of
86 The Reported Business is a part of Royal Mail’s UK Parcels, International and Letters (UKPIL) business unit but excludes the activities and products of Parcelforce International and Royal Mail Estates Ltd. 87 Royal Mail PLC, 2019. Annual Report and Financial Statements for the full year ended 31 March 2019, pages 53- 54. https://www.royalmailgroup.com/media/10924/royal_mail_ar19_190918.pdf. 88 Total pension contributions would have been £1.2bn per year had the deal not been reached. However, because of the new deal this was reduced to £400m, meaning that Royal Mail avoided costs of c. £800m per year. 89 Ofcom, Review of the Regulation of Royal Mail, March 2017, paragraph 3.90.

53
metrics and adopt Royal Mail’s 2015 Business Plan, on which a lot of our analysis was
based, as a reference point to review performance.
6.6 Here we report on our high-level indicators of efficiency: the overall change in real costs;
the change in cost excluding the impact of inflation, volume, and one-off costs (PVEO
analysis outlined in paragraph 6.10 below); frontline gross hours in delivery and
processing; productivity; and the ratio of revenue to average Full-Time Equivalent (FTE)
versus people cost to average FTE.
6.7 Royal Mail reports its financial statements using whole weeks. This means that for the
2018-19 financial year Royal Mail has reported a 53-week year. Where possible, 2018-19
results have therefore been adjusted to 52 weeks to enable a like-for-like year-on-year
comparison. Where we discuss changes, we are referring to the comparisons to the prior
financial year i.e. 2018-19 to 2017-18 on a 52-week basis (unless otherwise stated).
Real cost reduction90
6.8 Real cost reduction provides a high-level simplified view of efficiency as costs change due
to volume and one-off costs are not adjusted for in this metric.
6.9 Figure 6.1 below shows that real costs (excluding transformation costs) did not reduce in
2018-19 on a 52-week basis. They increased by 0.1%, hence, no real cost savings were
realised. See Section 7 for a more detailed discussion on the cost movements driving this
result.
Figure 6.1: Total real and nominal costs (excluding transformation costs) from 2014-15 to 2018-19*
Source: Royal Mail Regulatory Financial Statements and Ofcom analysis
* Adjusted to 52 weeks
90 Total costs (excluding transformation costs) have been adjusted by CPI based on 2014-15 values. Annual CPI change calculated based on average monthly CPI across financial year April to March.

54
Price, Volume, Efficiency and Other (PVEO) Analysis
6.10 PVEO analysis provides a measure of efficiency by disaggregating movements in costs91 in
terms of price changes (i.e. cost inflation), volume effects, efficiencies achieved and other
one-off costs.
6.11 Our analysis assumes an inflation index of CPI across all costs. Cost movements due to
volume (demand drivers) apply to a subset of the total cost base: frontline costs of delivery
and processing, payments to Post Office Limited (POL) and international terminal dues.
Change in frontline costs due to volume are calculated based on the year-on-year change
in workload using Ofcom’s methodology (see paragraph 6.23 below). The remainder of
costs are considered to be fixed. Efficiency is calculated to be the residual cost movement
once price, inflation, volume and one-off items have been taken into account.
6.12 Our PVEO analysis (Figure 6.2 below) shows that Royal Mail did not achieve any efficiencies
in 2018-19 (on 52-week basis) with an increase in total costs (excluding transformation
costs) after accounting for inflation, volume effects/demand drivers and one-off costs. The
PVEO analysis shows an inefficiency of 0.6% (£42m) in 2018-19 on a 52-week basis. This is
significantly lower than the efficiencies achieved in prior years of 2.8% in 2017-18 and 2.3%
in 2016-17.
6.13 The PVEO analysis shows an inefficiency of 0.5% (£21m) on people costs. This was due to
the reduction in gross hours not being sufficient to offset pay increases and the
introduction of the Shorter Working Week in accordance with the Pension, Pay and
Pipeline Agreement (see below). The Agreement, which was agreed with the CWU,
includes a pay increase of 5% for full-time employees, which was backdated to October
2017 (this equates to an annual impact of 2.5% for 2017-18 and 2018-19 respectively).92
Part-time staff received an equivalent pay rise. Additionally, the Agreement included a
reduction in the weekly contract of full-time staff from 39 hours to 38 effective from
October 2018, known as the ‘Shorter Working Week’. The 2018-19 impact of the Shorter
Working Week was a 1.3%93 reduction in full time ordinary hours94 at the same pay. Hence
the Shorter Working Week resulted in an increase in the hourly rate paid, in addition to the
pay rise. The implementation of the Shorter Working Week was intended to incentivise
greater efficiencies, which would offset the cost of it (i.e. increase in hourly rate), however
these efficiencies were not fully achieved, hence the costs of the Agreement were greater
in 2018-19 than expected.
91 Total costs include Reported Business people (adjusted for cash pension rate) and non-people (including depreciation) and exclude transformation costs. 92 Royal Mail PLC, 2019. Annual Report and Financial Statements for the full year ended 31 March 2019, page 27. 93 Calculated as 1 hour reduction as a portion of 39 hours in a working week apportioned for 6 months in 2018-19. 94 Ordinary hours are an employee's regular hours of work, excluding overtime and temporary or casual resource.

55
6.14 However, had the closure of the RMPP not been achieved as part of the Agreement with
the CWU, Royal Mail estimates that it would have incurred additional costs of around
£800m per annum.95
6.15 Furthermore, in addition to inefficiencies on people costs as discussed above, Royal Mail
did not achieve any efficiencies on non-people costs. The PVEO analysis shows an
inefficiency of 1.0% (£21m) on non-people costs. This was largely driven by higher vehicle
repair costs due to adverse weather at the beginning of the year and delays to the delivery
of new vehicles, resulting in higher maintenance costs on older vehicles.96
Figure 6.2: PVEO bridge 2017-18 to 2018-19*
Source: Royal Mail Regulatory Financial Statements, unaudited submissions from Royal Mail and Ofcom
analysis.
* Adjusted to 52 weeks
**ONS 12-month trailing average CPI figures (April to March)
Frontline gross hours (delivery and processing)
6.16 We analysed the hours paid for by Royal Mail for the its frontline delivery and processing
activities which account for the majority of people costs. These are referred to as ‘gross
hours’ and include both worked hours and paid absences such as sickness and leave. The
gross hours metric captures year-on-year changes in hours worked as a result of volume
changes as well as efficiency, both of which are relevant to our analysis.
95Royal Mail PLC, 2019. Annual Report and Financial Statements for the full year ended 31 March 2019, pages 53-54. Total pension contributions would have been £1.2bn per year had the deal not been reached. However, because of the new deal this was reduced to £400m, meaning that Royal Mail avoided costs of c. £800m per year. 96 Ibid, page 42.

56
6.17 Figure 6.3 below shows that Royal Mail achieved a total gross hours’ reduction in delivery
and processing of 1.2%97 in 2018-19 on 52-week basis, slightly up from the prior year
reduction of 0.9% in 2017-18 but down from the 1.9% reduction in 2016-17.
6.18 However, as outlined in paragraph 6.13, the Shorter Working Week was implemented in
2018-19, which resulted in a one hour reduction in ordinary hours (excluding overtime) per
week, without corresponding reduction in pay. Hence, part of the hours’ reduction
achieved in 2018-19 did not give rise to a reduction in costs. The change in contracted
hours equates to a 1.3% reduction in ordinary frontline hours for 2018-19. Excluding the
impact of the Shorter Working Week, gross hours increased by 0.1% for 2018-19 (on a 52-
week basis), which is lower than the hours reduction achieved in 2016-17 and 2017-18.
Figure 6.3: Gross hours’ reduction (excluding RDCs) indexed from 2014-15 to 2018-19*
Source: Royal Mail Regulatory Financial Statements, unaudited submissions from Royal Mail and Ofcom
analysis.
* Adjusted to 52 weeks
Productivity
6.19 The gross hours metric (used as a proxy for costs) captures year-on-year changes in hours
worked that result from both volume changes and efficiency. In order to isolate the
changes in hours worked that result from efficiency only, Royal Mail calculates a
productivity metric whereby it excludes the effect of changes in volume on hours worked.
97 Royal Mail now includes hours related to regional distribution centers (RDCs) in its total hours’ calculation. To present data on a consistent basis, we have excluded these hours from the calculation. If we were to include them in 2018-19, total hours would have decreased by 1.1% on 52-week basis, as stated by Royal Mail, as RDC hours represent a small percentage of total hours and therefore do not influence the calculation significantly.
57
6.20 Royal Mail’s measure of volume is weighted to reflect the change in the product mix which
is delivered by the business. This is done by using appropriate weights that are associated
with each product group. This is to reflect the fact that, for example, it is on average more
time consuming to deliver a parcel than it is to deliver a letter. The workload (or weighted
volumes)98 measure which is used by Royal Mail to calculate productivity reflects the
relative effort required to deliver each of its products.99
6.21 In summary, Royal Mail’s productivity metric100 is calculated as the ratio of workload
(weighted volumes) to gross hours, that is, the ratio of output (workload) to input
(frontline gross hours).
6.22 Royal Mail’s calculation of workload (weighted volumes) depends on the assumptions
made on the relative weightings associated with each product group. To calculate the
weights, Royal Mail uses engineering studies which record the time taken to work a given
volume at a point in its operation. As Royal Mail’s operation changes and it develops its
approach, it updates the weighting and methodology/scope applied, resulting in different
weightings being applied in different years.
6.23 Our approach to calculating productivity differs slightly, in that we apply consistent weights
and methodology/scope for each product group year-on-year. This is to ensure consistent
comparison of workload year-on-year. This results in a different estimate of output or
workload. Specifically, in our calculation of productivity, we use the assumptions and
methodology/scope adopted in the Strategic Business Plan submitted to us by Royal Mail
on 14 May 2015.
6.24 While Royal Mail and our methods both capture people efficiency, our method also
captures efficiency that results from operational structure changes and updated processes,
such as automation. This is because our estimate of workload is not adjusted to account
for operational structure changes or updated processes and as such the resulting
productivity measure captures any efficiency realised as a result of these changes. It is
worth noting that both measures of productivity do not consider pay efficiency nor do they
capture non-people efficiencies.
6.25 Figure 6.4 below presents both estimates of productivity. As seen from the figure, Royal
Mail’s estimated productivity improvement was 0.9% for 2018-19 on 52-week basis.101 Our
98 The weights used to calculate workload derive from the amount of time required for frontline staff to carry out the tasks to process the mail volumes presented in a given Operational Business Process (e.g. indoor delivery, outdoor delivery, inward and outward processing) in a given period, relative to the time taken to process 1000 sequenced letters in all relevant Operational Business Processes. 99 FTI Consulting, 2015. Efficiency Metrics for Royal Mail, paragraph 5.52. https://www.ofcom.org.uk/__data/assets/pdf_file/0023/83723/royal_mail_fti_report_on_efficiency_metrics.pdf 100 Royal Mail PLC, 2019. Annual Report and Financial Statements for the full year ended 31 March 2019, page 38. Defined as “Percentage change year-on-year in the number of weighted items per gross hour paid in Delivery Units and Mail Centre Units (delivery and processing, including regional logistics and collections) and Regional Distribution Centres” 101 Royal Mail includes RDCs in its calculation of productivity. Excluding RDCs, Royal Mail’s estimate of productivity improvement was 0.6% for 2018-19.

58
estimate of productivity of delivery and processing shows no improvement (i.e.
productivity estimate of c. 0%) for 2018-19 on 52-week basis.
6.26 Both productivity measures are below Royal Mail’s target range of 2-3% and this has been
the case for the prior year. Royal Mail stated that this was due to “the after effects of the
industrial dispute, delayed implementation of cost avoidance projects and the complexity
of implementing elements of [its] Agreement with CWU.”102
Figure 6.4: Productivity gains/(deterioration) 2015-16 to 2018-19*
Source: Royal Mail Regulatory Financial Statements, unaudited submissions from Royal Mail and Ofcom
analysis.
* Adjusted to 52 weeks* Adjusted to 52 weeks* Adjusted to 52 weeks* Adjusted to 52 weeks
Revenue and people cost per average FTE
6.27 Comparing revenue per average FTE and people cost per average FTE also provides an
indication of efficiency. For example, if revenue per average FTE increases at a greater rate
than people cost per average FTE, it may suggest that each average FTE is generating
increasing revenues as compared with the expense to the company for that FTE. However,
there may be other contributory factors, such as price changes, which could influence
revenue per average FTE, thereby lessening the direct relationship with people cost per
average FTE.
6.28 People costs represent a significant proportion of Royal Mail’s costs. However, people cost
per average FTE may not provide a reliable indicator of efficiency performance on its own
as a company may have high cost per employee but low cost per customer dependent on
102 Royal Mail PLC, 2019. Annual Report and Financial Statements for the full year ended 31 March 2019, page 24.
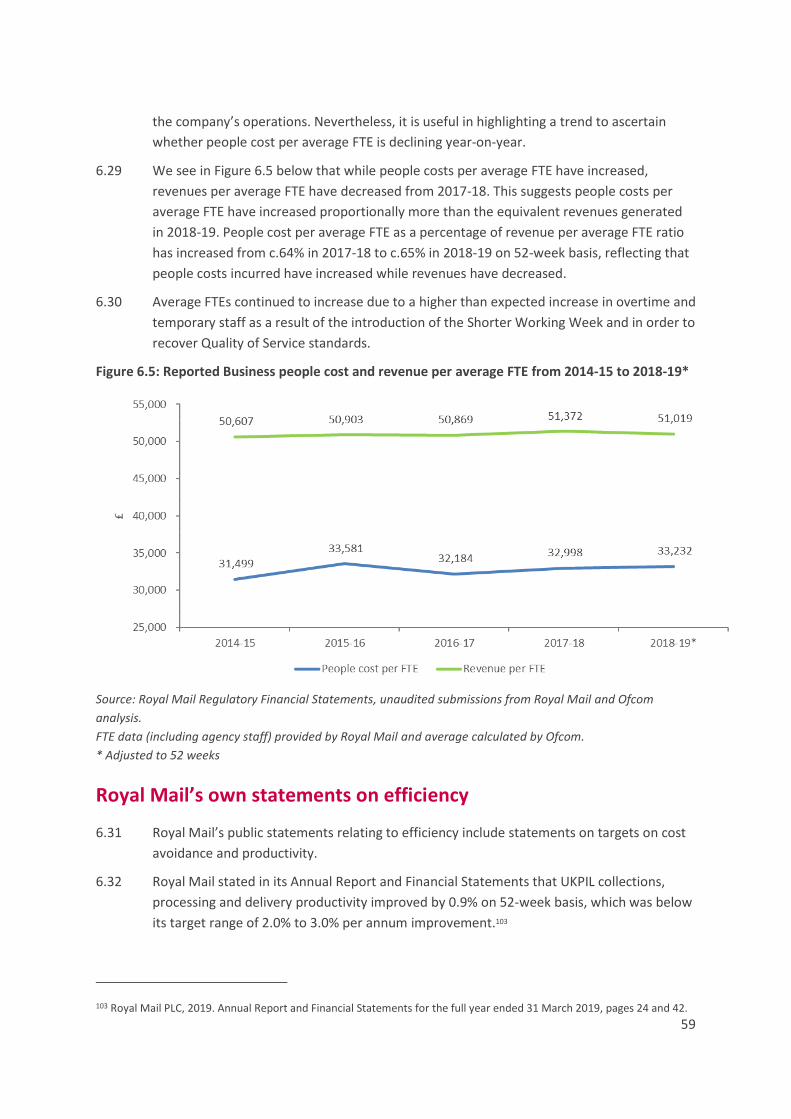
59
the company’s operations. Nevertheless, it is useful in highlighting a trend to ascertain
whether people cost per average FTE is declining year-on-year.
6.29 We see in Figure 6.5 below that while people costs per average FTE have increased,
revenues per average FTE have decreased from 2017-18. This suggests people costs per
average FTE have increased proportionally more than the equivalent revenues generated
in 2018-19. People cost per average FTE as a percentage of revenue per average FTE ratio
has increased from c.64% in 2017-18 to c.65% in 2018-19 on 52-week basis, reflecting that
people costs incurred have increased while revenues have decreased.
6.30 Average FTEs continued to increase due to a higher than expected increase in overtime and
temporary staff as a result of the introduction of the Shorter Working Week and in order to
recover Quality of Service standards.
Figure 6.5: Reported Business people cost and revenue per average FTE from 2014-15 to 2018-19*
Source: Royal Mail Regulatory Financial Statements, unaudited submissions from Royal Mail and Ofcom
analysis.
FTE data (including agency staff) provided by Royal Mail and average calculated by Ofcom.
* Adjusted to 52 weeks
Royal Mail’s own statements on efficiency
6.31 Royal Mail’s public statements relating to efficiency include statements on targets on cost
avoidance and productivity.
6.32 Royal Mail stated in its Annual Report and Financial Statements that UKPIL collections,
processing and delivery productivity improved by 0.9% on 52-week basis, which was below
its target range of 2.0% to 3.0% per annum improvement.103
103 Royal Mail PLC, 2019. Annual Report and Financial Statements for the full year ended 31 March 2019, pages 24 and 42.

60
6.33 Royal Mail’s costs avoidance target for UKPIL for 2018-19 was £230m. This was revised
down in its half year trading update, to £100m. Royal Mail stated that this was due to
difficult industrial relations, delayed implementation of cost avoidance projects and the
complexity of implementing elements of the Agreement with CWU. In its full year results
announcement, Royal Mail said that performance improved in the second half of 2018-19
and it was able to reach its revised target of £100m cost avoided with a performance of
£107m.104
6.34 Royal Mail stated that: “the costs avoided comprised a number of initiatives, including
short-term actions where [it] saw reductions in discretionary spend and central costs. [It]
performed a review of [its] organisational structure and management roles in support and
central functions, which resulted in management headcount reduction that will deliver
financial benefits in 2019-20. [It] also achieved savings through a reduction in core network
hours including partial absorption of the one-hour reduction of the working week,
modernisation of [its] Heathrow Worldwide Distribution Centre, a linehaul review, supplier
contract renegotiation and rationalisation of operations management”.105
6.35 In addition, the Agreement with CWU to close the RMPP on 31 March 2018 avoided an
estimated increase in annual pension cash contributions of £800m by reducing future
annual pension contributions from £1.2bn to £400m (see paragraph 6.14).106
Summary and recent events
6.36 In summary, the key efficiency trends for the 2018-19 financial year showed a
deteriorating trend across most metrics:
• Total real costs for the Reported Business increased by 0.1% on 52-week basis against
a reduction of 3.0% in the prior year.
• The PVEO analysis indicates an underlying inefficiency (excluding transformation costs)
of 0.6% (£42m) on 52-week basis against a 2.8% efficiency in the prior year. People
costs inefficiencies of 0.5% (£21m) were mainly due to gross hours’ reduction not
being sufficient to offset pay increases and the introduction of the Shorter Working
Week. Non-people costs inefficiencies of 1.0% (£21m) were mainly due to higher
vehicle repair and maintenance costs.
• Royal Mail reduced frontline gross hours in delivery and processing by 1.2% on 52-
week basis, higher than the reduction of 0.9% in the prior year. However, the
underlying increase in gross hours of 0.1%, after taking account of the impact of the
Shorter Working Week, was lower than the hours reduction achieved in both 2016-17
and 2017-18.
• Royal Mail estimated productivity improvement of 0.9%107 for 2018-19 on 52-week
basis, whereas our estimate of productivity shows no improvement (i.e. productivity
104 ibid, pages 24 and 42. 105 ibid, page 42. 106 ibid, pages 53- 54. 107 Royal Mail includes RDCs in its calculation of productivity whereas ours does not. Excluding RDCs, Royal Mail’s estimate of productivity improvement was 0.6% for 2018-19.

61
estimate of 0%) for the same period. Both estimates are below Royal Mail’s target
range of 2-3%.
• The ratio of people costs per FTE as a percentage of revenue per FTE increased from
c.64% in 2017-18 to c.65% in 2018-19 on 52-week basis reflecting that people costs
incurred have increased whilst revenue has declined.
• Royal Mail achieved cost avoidance of £107m against an original target of £230m.
• Royal Mail managed to avoid an increase in pension cash contributions of around
£800m in 2018-19 (and onwards), which was due to the closure of the RMPP,
following the completion of the pay and pension negotiations with the CWU in 2018.
6.37 Efficiency performance continues to be concerning as efficiency is critical to the longer-
term sustainability of the universal service.
6.38 Last year, we reported on efficiency against the backdrop of Royal Mail’s UK business
productivity performance being significantly below plan in the first half of 2018-19 and that
full year performance was expected to be significantly below target. We explained this was
a concern to us given our view that continued progress on efficiency was likely to improve
the profitability of the Reported Business and help ensure the financial sustainability of the
universal service.
6.39 In line with Royal Mail’s revised expectation, efficiency performance for 2018-19
deteriorated across the metrics reported. Notably, the Shorter Working Week has not led
to the expected reduction in hours. Royal Mail only reduced gross hours by 1.2% in 2018-
19, leading to its stated productivity improvement of 0.9% being significantly below its
target range of 2-3%.
6.40 However, Royal Mail has strong incentives to improve its efficiency in future to remain
financially sustainable. In particular, in its five-year strategy, Royal Mail announced a goal
of 15-18% productivity improvement over the life of the strategy.
6.41 As noted in Section 7, Royal Mail faces a number of risks to the implementation of its
strategy. It also recently noted in its half-year results that transformation is behind
schedule and this is likely to impact efficiency in the second half of 2019-20.
6.42 Progress on efficiency is key to improving the profitability of the Reported Business and
help ensure the financial sustainability of the universal service. If Royal Mail is successful in
the implementation of its transformation programme (which includes but is not limited to
planned productivity improvement of 15-18%), this will help sustain the universal service in
the longer term. We will continue to monitor Royal Mail’s efficiency and engage with Royal
Mail’s management to understand better their plans to transform the business.

62
7. The financial performance of the Reported Business 7.1 This section summarises the financial performance of the Reported Business108 for 2018-
19, including a five-year trend. We monitor the financial performance of the Reported
Business as we have a duty to have regard to the need for the provision of a universal
service to be financially sustainable, as set out in the March 2012 Statement.109
7.2 We discuss in sequence:
• changes in overall volumes and revenues for the Reported Business and then by
universal service products, product groups and formats to help us understand what is
driving overall revenue and volume changes for the Reported Business;
• changes in the costs of the Reported Business to understand what progress has been
made in relation to cost reduction. This information is also an important input when
considering the efficiency of the universal postal service which is discussed further in
Section 6;
• profit margins for the Reported Business;
• cash flow and financial health metrics110 of Royal Mail Group and Royal Mail Group’s
most recent Viability Statement; and
• summary and our comments on financial sustainability of the Reported Business and
recent events.
7.3 Revenue, prices and cost figures presented in this section are in nominal terms. This is
consistent with Royal Mail’s Regulatory Financial Statements.
7.4 Royal Mail reports its financial statements using whole weeks. This means that for the
2018-19 financial year Royal Mail has reported a 53-week year. Where possible, 2018-19
results have therefore been adjusted to 52 weeks to enable a like-for-like year-on-year
comparison. Where we discuss changes, we are referring to the comparisons to the prior
financial year i.e. 2018-19 to 2017-18 on a 52-week basis (unless otherwise stated).
108 The Reported Business is a part of Royal Mail’s UK Parcels, International and Letters (UKPIL) business unit but excludes the activities and products of Parcelforce International and Royal Mail Estates Ltd. 109 Ofcom, 2012. Securing the Universal Postal Service. https://www.ofcom.org.uk/__data/assets/pdf_file/0029/74279/Securing-the-Universal-Postal-Service-statement.pdf. 110 In the Review of the Regulation of Royal Mail 2017 statement, we committed to monitoring the following short to medium term financial health metrics: Funds from operations/net debt, net debt/EBITDA and EBITDA/interest. While we cannot publish forward looking metrics as these rely on Royal Mail’s confidential Business Plan, we can provide historic metrics as an indicator of financial health over the period considered.

63
Volumes and revenues for the Reported Business fell in 2018-19*
Figure 7.1: Reported Business volumes and revenues split by universal service products, product
groups and formats
Volumes (millions): 14,511m (7.4% decrease) Revenues (£m): £7,105m (0.2% decrease)
Source: Royal Mail Regulatory Financial Statements, unaudited submissions from Royal Mail and Ofcom
analysis.
*Adjusted to 52 weeks
**Other products mainly consists of unaddressed, elections and international mail
***USO products consists of First and Second Class stamp, Meter letters and parcels, First and Second Class
Single Piece Account letters and parcels, Special Delivery Stamp and Meter, Redirections, Royal Mail Signed For,
Local Collect, International Airmail and Surface letters and parcels

64
7.5 Reported Business total volumes (addressed and unaddressed mail) continued to fall in
2018-19 by 7.4% to 14.5bn on a 52-week basis (a higher rate of decline as compared to the
2.8% decline observed in the prior year). The decline in volumes is driven by continuing
structural decline in addressed letter volumes of 7.3% in 2018-19 on a 52-week basis. This
was in line with Royal Mail’s revised expectations of a 7-8% decline. Royal Mail attributes
the decline in letter volumes to structural decline due to e-substitution, business
uncertainty and General Data Protection Regulation (GDPR). 111
7.6 Parcel volumes grew by 7.4%.112 According to Royal Mail, its parcel business benefited from
Royal Mail’s targeting of fast-growing sectors such as online clothing retailers and new
features like estimated delivery times and the extension of customer Latest Acceptance
Times (LATs).113 International parcels also continued to benefit from Royal Mail’s cross
border initiative.114 115
7.7 Total revenue fell by 0.2% to £7.1bn as price increases and change in mix towards parcels
were not sufficient to offset the effect of addressed letter volume decline. This is the sixth
consecutive year in which overall revenue of the Reported Business has fallen, following
the period from 2010-11 to 2013-14 when total revenue grew year-on-year despite volume
decline. See Sections 3, 4 and 8 in particular for more information on prices.
7.8 We discuss below revenues and volumes for each of the splits in Figure 7.1 above (i.e. by
product groups, formats and universal service products).
7.9 Letter and parcel price trends are available as part of the interactive data published on the
Ofcom website.116
Changes in Reported Business volumes and revenue by universal and non-universal services
7.10 The services within the Reported Business include all universal service products and other
products which use the universal service network (for example, retail bulk mail and access).
Page 8 of the interactive data shows longer-term historic trends.117
111 Royal Mail PLC, Annual Report and Financial Statements for the full year ended 31 March 2019, page 42-43. https://www.royalmailgroup.com/media/10924/royal_mail_ar19_190918.pdf. 112 Parcel volumes are based on Royal Mail’s definition of parcels and include RM 24/28 large letters, some fulfilment letters and large letters and are therefore not directly comparable to the parcel market volumes collected by Ofcom and reported in Section 4. 113 Royal Mail has extended the latest time it will accept items on its Tracked 24 products for delivery the next day. 114 The international cross-border initiative allows Royal Mail to increase traffic in Europe from Asia (mostly China). Traffic arrives through their Heathrow processing plant from customs and clearance for onward travels to Europe. Royal Mail is responsible for paying associated terminal dues to local postal operator. 115 Royal Mail PLC, Annual Report and Financial Statements for the full year ended 31 March 2019, page 41-42. 116 Interactive data can be accessed here: https://www.ofcom.org.uk/postal-services/information-for-the-postal-industry/monitoring_reports 117 Interactive data can be accessed here: https://www.ofcom.org.uk/postal-services/information-for-the-postal-industry/monitoring_reports

65
Figure 7.2: Universal and non-universal services volumes and revenues
Source: Royal Mail Regulatory Financial Statements, unaudited submissions from Royal Mail and Ofcom
analysis.
* Adjusted to 52 weeks
7.11 The volumes of both USO and non-USO products (including unaddressed mail) continued
to decline. In 2018-19, they declined by 9.8% and 6.9% respectively. This follows the
historic trend where the volume of USO items has been declining at a faster rate than non-
USO items. Non-USO volumes mainly consist of access, bulk, international and
unaddressed products. The decline in USO volumes was driven by the same factors that
explained the decline in addressed letters generally: as mentioned above, ongoing

66
structural decline due to e-substitution, business uncertainty and GDPR (which particularly
impacted marketing mail). Non-USO volume decline was driven by these factors as well as
‘low average unit revenue (AUR)’ unaddressed letter volumes lapping a period of strong
growth in 2017-18 which benefited from initiatives to encourage incremental volumes.118
7.12 The revenues from USO products declined by 1.7% whilst non-USO revenues increased by
0.7% in 2018-19. For USO products, price increases were not enough to offset the volume
decline in letters described above. For non-USO products, revenues increased due to
business mail price rises implemented in January 2019 and growth in Domestic Account
parcels.119
Changes in Reported Business volumes and revenue by product group
7.13 The analysis below focuses on year-on-year trends. Page 9 of the interactive data provides
longer historic trends.120
Single Piece revenues and volumes
7.14 Single Piece volumes (both letters and parcels) decreased by 10.2% in 2018-19. This decline
was driven by the ongoing structural decline due to e-substitution and business uncertainty
which is affecting Single Piece letter volumes.
7.15 Single Piece revenue decline of 2.5% in 2018-19 was less than that of volume. The impact
of volume decline was partially offset by price increases in both First and Second Class
stamps (2p for both First and Second Class letters from 26 March 2018). See Sections 3, 4
and 8 in particular for more information on prices.
Bulk and Access revenues and volumes
7.16 Bulk Mail121 (excluding Access) letter and parcel volumes declined by 5.5% despite
increased growth in Domestic Account parcels volumes. This decline in letter volumes was
driven by a strong prior year comparative period which benefited from initiatives to
encourage incremental volumes.122 The corresponding increase in revenues of 2.9% was
driven by the business mail price increases implemented in January 2019. See Section 3 for
more detail.
118 Royal Mail PLC, Annual Report and Financial Statements for the full year ended 31 March 2019, page 41-42. ‘Low AUR’ unaddressed letter volumes were up 6% in 2017-18 refecting initiatives to encourage incremental volumes. In 2018-19, ‘low AUR’ unaddressed letter volumes were down 7% on an underlying basis, reflecting strong growth in 2017-18 due to initiatives that encouraged incremental volume growth. There was a once off spike in ‘low AUR’ unaddressed letter volumes in 2017-18. 119 Royal Mail PLC, Annual Report and Financial Statements for the full year ended 31 March 2019, page 41-42. 120 Interactive data can be accessed here: https://www.ofcom.org.uk/postal-services/information-for-the-postal-industry/monitoring_reports 121 Bulk Mail includes RM24&48, Tracked, Tracked Returns and Special Delivery. 122 Royal Mail PLC, Annual Report and Financial Statements for the full year ended 31 March 2019, page 41-42.
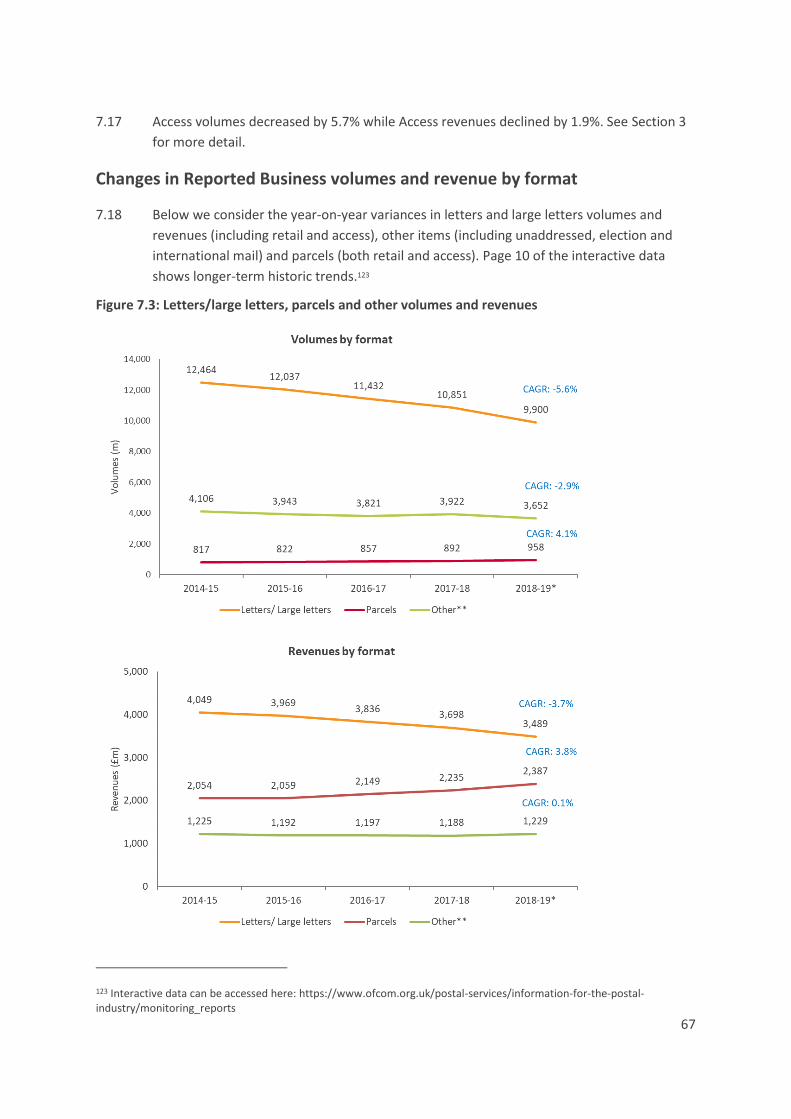
67
7.17 Access volumes decreased by 5.7% while Access revenues declined by 1.9%. See Section 3
for more detail.
Changes in Reported Business volumes and revenue by format
7.18 Below we consider the year-on-year variances in letters and large letters volumes and
revenues (including retail and access), other items (including unaddressed, election and
international mail) and parcels (both retail and access). Page 10 of the interactive data
shows longer-term historic trends.123
Figure 7.3: Letters/large letters, parcels and other volumes and revenues
123 Interactive data can be accessed here: https://www.ofcom.org.uk/postal-services/information-for-the-postal-industry/monitoring_reports

68
Source: Royal Mail Regulatory Financial Statements, unaudited submissions from Royal Mail and Ofcom
analysis.
* Adjusted to 52 weeks
** Other products mainly consist of international, election and unaddressed mail
Letters/large letters revenues and volumes
7.19 Combined letter/large letter volumes reduced by 8.8% in 2018-19 compared to 5.1% in the
prior year. Revenues decreased by 5.7% in 2018-19 compared to 3.6% in the prior year. As
discussed above e-substitution, business uncertainty and GDPR account for declining letter
and large letter volumes and revenues.124
Parcels revenues and volumes
7.20 Reported Business parcel volumes125 increased by 7.4% in 2018-19 compared to 4.1% in the
prior year, while revenues grew by 6.8% in 2018-19 compared to 4.0% in the prior year.
This was the highest parcel volume growth for Royal Mail since 2013.
7.21 As discussed above, this was due to Royal Mail’s targeting of fast-growing sectors such as
online clothing retailers and new features like estimated delivery times and the extension
of customer LATs. In addition, Domestic Account parcels also performed well in 2018-19, as
Royal Mail gained new customers and additional traffic from existing ones.126
Other revenues and volumes
7.22 Other volumes (which mainly consist of unaddressed letters127, election and international
mail) decreased by 6.9% in 2018-19. Unaddressed letter volumes decreased by 7.5% as
Royal Mail had lapped a period of strong growth in the prior year due to initiatives that
encouraged incremental volume growth. International letter and parcel volumes declined
at a rate of 3.2%. This was due to export letter volumes being impacted by business
uncertainty, e-substitution and a competitive international environment. This was partially
offset by growth in import parcel volumes which continued to benefit from Royal Mail’s
cross border initiative.128
7.23 Other revenues increased by 3.4% in 2018-19. This is mainly driven by a 3.6% increase in
international letter and parcel revenues, due to growth from the Asia into Europe cross-
border initiative. This was partially offset by decline in unaddressed letter revenues of
124 Royal Mail PLC, Annual Report and Financial Statements for the full year ended 31 March 2019, page 41-42. 125 Parcel volumes are based on Royal Mail’s definition of parcels and include RM 24/28 large letters, some fulfilment letters and large letters and are therefore not directly comparable to the parcel market volumes collected by Ofcom and reported in Section 4. 126 Royal Mail PLC, Annual Report and Financial Statements for the full year ended 31 March 2019, page 41 -42. 127 Addressed mail is mail which is either addressed to a specific individual or to a generic recipient (for example, ‘to the occupier’). All other mail is categorised as unaddressed mail. 128 Royal Mail PLC, Annual Report and Financial Statements for the full year ended 31 March 2019, page 41-42
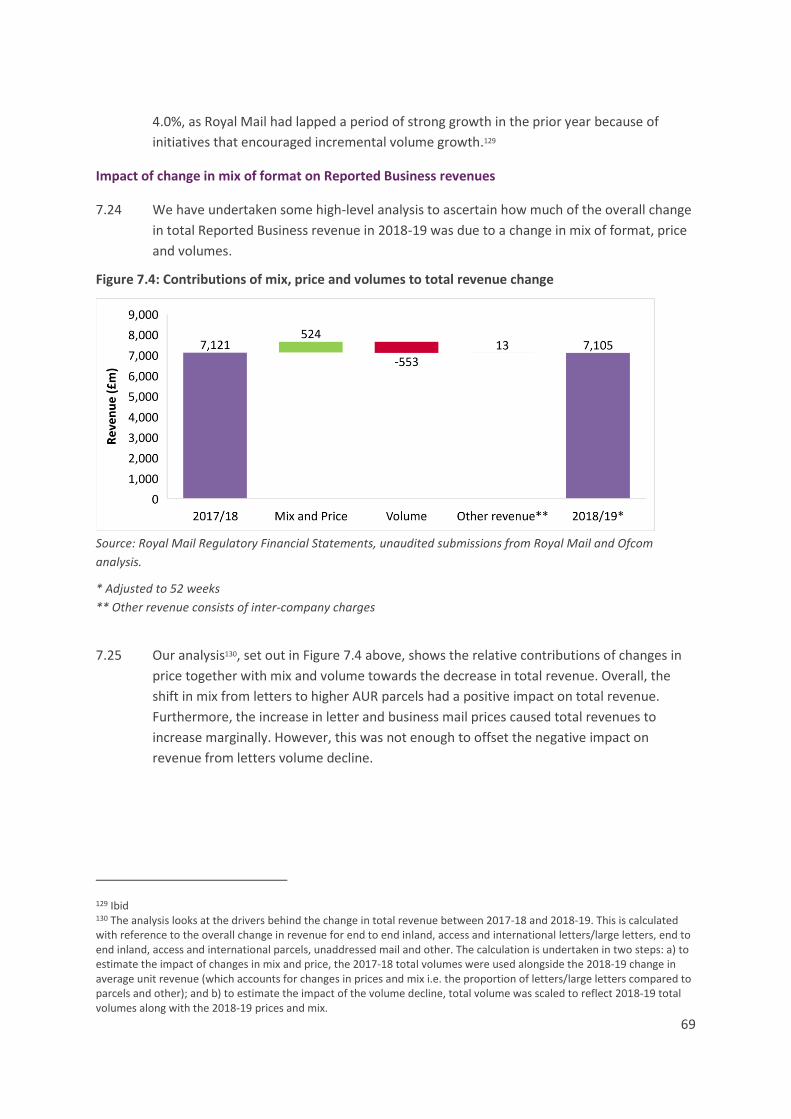
69
4.0%, as Royal Mail had lapped a period of strong growth in the prior year because of
initiatives that encouraged incremental volume growth.129
Impact of change in mix of format on Reported Business revenues
7.24 We have undertaken some high-level analysis to ascertain how much of the overall change
in total Reported Business revenue in 2018-19 was due to a change in mix of format, price
and volumes.
Figure 7.4: Contributions of mix, price and volumes to total revenue change
Source: Royal Mail Regulatory Financial Statements, unaudited submissions from Royal Mail and Ofcom
analysis.
* Adjusted to 52 weeks
** Other revenue consists of inter-company charges
7.25 Our analysis130, set out in Figure 7.4 above, shows the relative contributions of changes in
price together with mix and volume towards the decrease in total revenue. Overall, the
shift in mix from letters to higher AUR parcels had a positive impact on total revenue.
Furthermore, the increase in letter and business mail prices caused total revenues to
increase marginally. However, this was not enough to offset the negative impact on
revenue from letters volume decline.
129 Ibid 130 The analysis looks at the drivers behind the change in total revenue between 2017-18 and 2018-19. This is calculated with reference to the overall change in revenue for end to end inland, access and international letters/large letters, end to end inland, access and international parcels, unaddressed mail and other. The calculation is undertaken in two steps: a) to estimate the impact of changes in mix and price, the 2017-18 total volumes were used alongside the 2018-19 change in average unit revenue (which accounts for changes in prices and mix i.e. the proportion of letters/large letters compared to parcels and other); and b) to estimate the impact of the volume decline, total volume was scaled to reflect 2018-19 total volumes along with the 2018-19 prices and mix.

70
Reported Business costs
Figure 7.5: Reported Business costs131
Source: Royal Mail Regulatory Financial Statements, unaudited submissions from Royal Mail and Ofcom
analysis.
* Adjusted to 52 weeks
7.26 Costs, including transformation costs, for the Reported Business rose by 2.6% in 2018-19 to
£7.0bn. These costs can be broken down into people costs, non-people costs and
transformation costs. The breakdown of costs by these categories is shown in Figure 7.5
above and we note that:
• People costs132 – increased by 1.2% to £4.6bn*. According to Royal Mail this was
mainly driven by the frontline and manager pay award. The frontline pay award
consisted of a 5% salary increase, backdated from October 2017 in accordance with
the Pensions, Pay and Pipeline Agreement133 (equivalent to an annual pay increase of
2.5% in 2018-19). Furthermore, Royal Mail incurred costs related to overtime and
casual resource in order to cover the Shorter Working Week134; high levels of sick
absences; and at the start of 2019, adverse weather conditions. In addition, the
131 People costs are adjusted to reflect the cash cost of the defined benefit pension scheme rather than the accounting charge. 132 Adjusted to reflect the cash cost of the defined benefit pension scheme rather than the accounting charge. 133 As part of the Pensions, Pay and Pipeline Agreement, the Royal Mail Pension Plan (RMPP) closed in March 2018. This avoided an increase in annual cash contributions of around £800m according to Royal Mail’s estimation 134 In 2017-18, Royal Mail agreed a pay deal with the CWU which resulted in 5% pay award from October 2017 to March 2019, a further annual pay rise of 2% from April 2019 and a one-hour reduction in hours worked for the same pay i.e. the Shorter Working Week from October 2018.

71
implementation of LATs for certain account parcels also led to incremental people
costs. This was offset by lower management bonus costs as Royal Mail missed its
threshold profitability level.135
• Non-people costs – increased by 4.9% to £2.2bn*. This was mainly driven by an
increase in infrastructure costs informed by a review of the recoverable amounts of
intangible assets136 which led to the write-off of the historic cost of these intangible
assets. In addition to this, management decided to write-off the historic cost of letter
sorting machines which are to be decommissioned (i.e. increased impairment costs)
due to the higher than expected decline in letter volumes. Technology costs also
increased due to the implementation of data projects and upgrade to IT systems. In
addition, distribution and conveyance costs increased due to higher vehicle repair
costs, higher fuel costs and increased terminal dues.137
• Transformation costs – increased by 18.9% to £0.1bn* in 2018-19. This was mainly
driven by higher project costs to support future productivity improvements and the
cost avoidance programme. These mainly consisted of data projects to support future
productivity improvements, investment to upgrade IT and parcel systems. Voluntary
redundancy costs were also higher due a reduction in management headcount across
support and central functions.138
Reported Business profit margin
7.27 In considering the financial sustainability of the universal postal service, we are required to
take into account the need for the universal service provider to be able to earn a
reasonable commercial rate of return in connection with its provision of the universal
service.139 In our March 2012 and 2017 Statements on the postal regulatory framework140,
we concluded that an earnings before interest and tax (EBIT) margin range of 5-10% was
indicative of a reasonable commercial rate of return.
7.28 We noted that if the forecast EBIT margin was above 5% or showed an increasing trend
that exceeds 5% over the forecast period, then the indications are that the Reported
Business is financially sustainable. We said that, if this was not the case – for example if the
forecast EBIT margin stayed consistently below 5% or had a decreasing trend taking it
below 5% – then there may be indications that the universal postal service faced financial
sustainability issues in the long term. However, concerns about financial sustainability may
not arise if, for example, the EBIT margin went below 5% for a short period due to specific
circumstances which may be addressed by Royal Mail, without affecting its longer-term
135 Royal Mail PLC, Annual Report and Financial Statements for the full year ended 31 March 2019, page 42 136 Intangible assets are non-monetary assets which are without physical substance and identifiable e.g. franchise licences, customer listing, software and brands. 137 Royal Mail PLC, Annual Report and Financial Statements for the full year ended 31 March 2019, page 42-43. 138 Ibid 139 Section 29(4) of the Postal Services Act 2011. 140 Ofcom, 2017. Review of the Regulation of Royal Mail, paragraph 3.60. https://www.ofcom.org.uk/__data/assets/pdf_file/0033/97863/Review-of-the-Regulation-of-Royal-Mail.pdf.

72
financial sustainability.141 We use this range as one factor that leads us to monitor Royal
Mail’s long-term prospects more closely.
7.29 Additionally, in considering the financial sustainability of the universal service provider and
its ability to earn a reasonable commercial rate of return, we also have regard to efficiency.
Progress on efficiency is key to improve the profitability of the Reported Business and help
ensure the financial sustainability of the universal service.
7.30 As in the past, we refer to our particular measure of EBIT margin, which we use as part of
our financial sustainability assessments, as the financeability EBIT.142
7.31 In the March 2017 Statement,143 we confirmed our decision to continue calculating the
financeability EBIT margin by deducting transformation costs144 and restating pension costs
on a cash basis.145 In 2018-19, the accounting pension rate was 18.9% (compared to 41.1%
in 2017-18) whereas the cash pension rate was 15.6% (compared to 17.1% in 2017-18).146
The changes to accounting and cash pension rate were as a result of the closure of the
Royal Mail Pension Plan (see paragraph 6.4). We have reported on the financeability EBIT
margin in each of our annual monitoring updates since 2013-14.147
141 Ofcom, 2016. Review of the Regulation of Royal Mail, A6.92. https://www.ofcom.org.uk/__data/assets/pdf_file/0030/57954/annexes-5-11.pdf. 142 Ibid, paragraph A6.8. 143 Ofcom, 2017. Review of the Regulation of Royal Mail, paragraph 3.46. https://www.ofcom.org.uk/__data/assets/pdf_file/0033/97863/Review-of-the-Regulation-of-Royal-Mail.pdf. 144 Transformation costs are restructuring or redundancy costs which are likely to recur year-on-year and are not considered to be exceptional costs. Exceptional costs are considered to be large and uncommon (non-recurring) costs. See Ofcom, 2012. Securing the Universal Postal Service, paragraph 5.41 and footnote 69. https://www.ofcom.org.uk/__data/assets/pdf_file/0029/74279/Securing-the-Universal-Postal-Service-statement.pdf. 145 In the 2014 Review of End-to-End Competition Statement, we said it was appropriate to adjust Royal Mail’s Reported Business EBIT margin to restate pension costs on a cash basis (i.e. the rate the contributions are actually paid at), rather than the rate calculated using the accounting standards. We considered that this methodology takes account of the true cost of pensions and we refer to this EBIT margin measure as the ‘financeability EBIT margin’. See Ofcom, 2014. Review of end-to-end competition in the postal sector, page 15. https://www.ofcom.org.uk/__data/assets/pdf_file/0024/31956/end-to-end.pdf 146 Royal Mail PLC, 2019. Annual Report and Financial Statements for the full year ended 31 March 2019, page 48. 147 For more explanation of this approach please see earlier annual monitoring updates, in particular Paragraph 6.6 in the 2014-15 Annual monitoring update on the postal market: https://www.ofcom.org.uk/__data/assets/pdf_file/0025/56923/annual_monitoring_update_2014-15.pdf.

73
Figure 7.6: Reported Business financeability EBIT margin
Source: Royal Mail Regulatory Financial Statements, unaudited submissions from Royal Mail and Ofcom
analysis.
*Aadjusted to 52 weeks *Aadjusted to 52 weeks
7.32 Figure 7.6 above shows that the 2018-19 financeability EBIT margin of 1.6% is below the 5-
10% range148 and is substantially lower than the prior year margin of 4.4%.
148 The range that we consider to be consistent with a reasonable commercial rate of return for a financially sustainable universal service in the longer term.
Figure 7.7: Reported Business financeability EBIT margin breakdown Figure 7.7: Reported Business financeability EBIT margin breakdown

74
Source: Royal Mail Regulatory Financial Statements, unaudited submissions from Royal Mail and Ofcom
analysis.
* Other revenue consists of revenue from unaddressed letters, international letters and parcels, and inter-
company charges
** Adjusted to 52 weeks
7.33 Figure 7.7 above breaks down the decrease in profitability year-on-year. As seen from the
graph, the decrease in the EBIT margin was mainly driven by the decrease in letter
revenues not being offset by the increase in parcels revenues, while costs increased
significantly year-on-year (see paragraph 7.26).
Royal Mail Group’s cash flow
Figure 7.8: Royal Mail Group free cash flow*
Source: Source: Royal Mail Regulatory Financial Statements, unaudited submissions from Royal Mail and
Ofcom analysis.
* Free cash flow: net cash flow before financing activities (except finance costs paid), less the net cash
purchase/sale of financial asset investments, including profit on disposal of properties
** Relates to a one-off disposal of a property in the London property portfolio, separately restated in Royal
Mail’s 2015-16 statutory accounts
*** 53-week year (unadjusted)
7.34 Cash flow is also an important component in ensuring the financial sustainability of the
universal service. In 2018-19, free cash flow of the Royal Mail Group decreased by 112.6%
to an outflow of £71m. The main drivers for this were the acquisition of Dicom Canada by
GLS of £212m; the cash payment of the 2017-18 frontline pay award occurring in the 2018-
19 financial year; and the 53rd week in 2018-19, which led to cash outflows in the form of
an additional payroll and VAT payments.149
149 Royal Mail PLC, 2019. Annual Report and Financial Statements for the full year ended 31 March 2019, page 50-51.

75
7.35 Despite the fall in free cash flow in the year, Royal Mail Group had a significant cash
headroom150 of £1.1bn as at 31st March 2019.151 This cash can be drawn upon depending
on business needs.
Financial health metrics and the viability statement
7.36 In the March 2017 Statement,152 we confirmed our decision to supplement the approach
we had previously used for considering sustainablity with consideration of a wider range of
financial health metrics and indicators such as Standard & Poor’s (S&P) credit rating,
including Funds from Operations (FFO)/Adjusted Net Debt, and borrowing covenants
assessed at Royal Mail Group level.
7.37 FFO/Adjusted Net Debt is one of the key metrics that S&P uses in order to assess the credit
worthiness of Royal Mail Group. As part of its assessment, S&P reviews Royal Mail Group’s
historical and forecast performance against a number of metrics including FFO/Adjusted
Net Debt. Royal Mail has also informed us that this is a key metric that it monitors.
7.38 S&P’s latest credit research affirmed Royal Mail Group’s credit rating at BBB as it
considered the outlook stable based on Royal Mail Group’s FFO/Adjusted Net Debt being
above 45% (see Figure 7.9 below) in an operating environment that will remain difficult.
S&P believed that the company will have sufficient cash headroom at the current rating
level to pursue moderate business diversification opportunities and to mitigate volume
risk, which is worsened by its high level of fixed costs. They also considered that Royal Mail
will continue to successfully manage its transformation programme and productivity
improvements to ensure a sustainable profitability enhancement.153 S&P categorised Royal
Mail Group as modest risk from a financial risk viewpoint as its FFO/Adjusted Net Debt
percentage was above 60%.154
7.39 As at 31st March 2019, Royal Mail Group had a revolving credit facility provided by a
syndicate of banks which it uses for general corporate and working capital purposes. The
total undrawn committed borrowing facility with the syndicated credit facility amounts to
£1.05bn, of which £952m expires in March 2022 and £98m in March 2020..155 Since the
year end Royal Mail have renegotiated its revolving credit facility, see paragraph 7.48
below.
7.40 The Net Debt/EBITDA (leverage ratio) and EBITDA/Interest (interest cover) metrics are
used as financial covenants relating to Royal Mail Group’s syndicated credit facility. The
leverage ratio metric helps assess Royal Mail Group’s ability to repay its debts using its
150 The cash headroom is the difference between the available cash resources and required cash resource i.e. total undrawn committed borrowing facility less the amount utilised plus the available cash less the loan-to-value (LTV) constraint. 151 See paragraph 7.39 152 Ofcom, 2017. Review of the Regulation of Royal Mail, paragraph 3.63. 153 Alacra Store, 2019. S&P Global Ratings’ Credit Research: Royal Mail Plc. http://www.alacrastore.com/s-and-p-credit-research/Royal-Mail-PLC-2281986 154 S&P Ratings Direct, 2013. Corporate methodology, page 35. https://www.spratings.com/scenario-builder-portlet/pdfs/CorporateMethodology.pdf. 155 Royal Mail PLC, 2019. Annual Report and Financial Statements for the full year ended 31 March 2019, page 195.
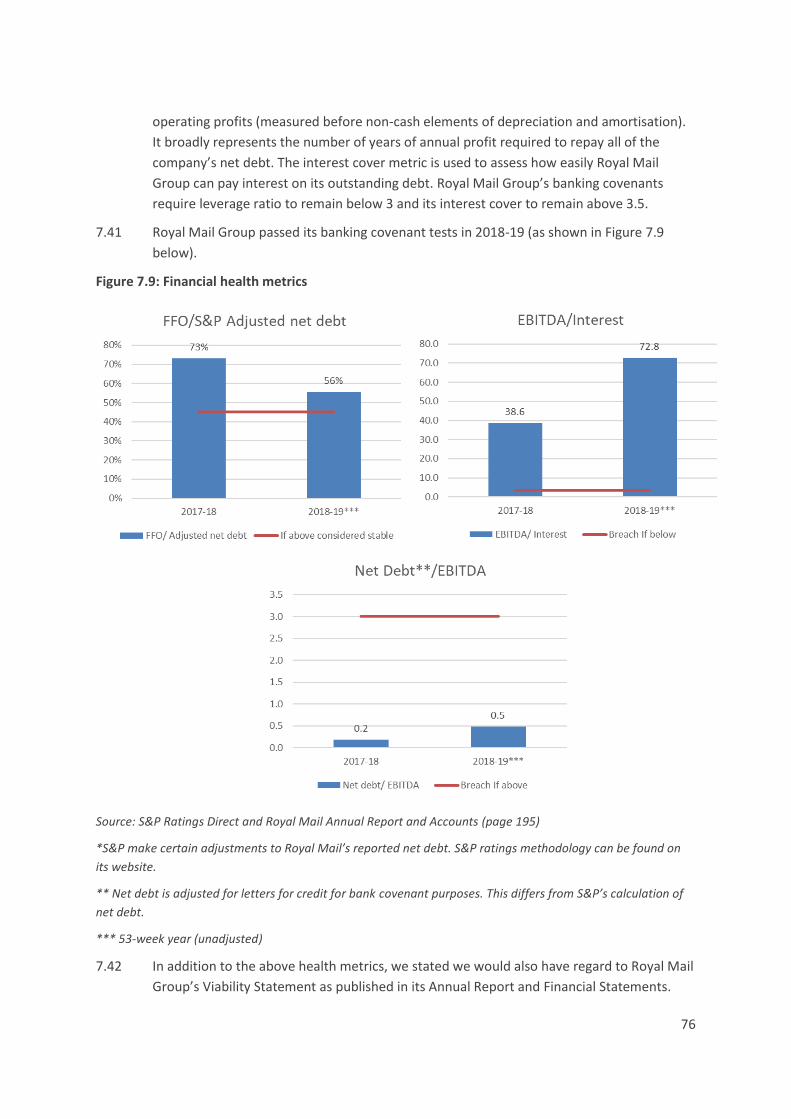
76
operating profits (measured before non-cash elements of depreciation and amortisation).
It broadly represents the number of years of annual profit required to repay all of the
company’s net debt. The interest cover metric is used to assess how easily Royal Mail
Group can pay interest on its outstanding debt. Royal Mail Group’s banking covenants
require leverage ratio to remain below 3 and its interest cover to remain above 3.5.
7.41 Royal Mail Group passed its banking covenant tests in 2018-19 (as shown in Figure 7.9
below).
Figure 7.9: Financial health metrics
Source: S&P Ratings Direct and Royal Mail Annual Report and Accounts (page 195)
*S&P make certain adjustments to Royal Mail’s reported net debt. S&P ratings methodology can be found on
its website.
** Net debt is adjusted for letters for credit for bank covenant purposes. This differs from S&P’s calculation of
net debt.
*** 53-week year (unadjusted)
7.42 In addition to the above health metrics, we stated we would also have regard to Royal Mail
Group’s Viability Statement as published in its Annual Report and Financial Statements.

77
Under the 2014 Corporate Governance Code, directors are required to make a statement
that they have a reasonable expectation that the company will be able to continue in
operation and meet its liabilities as they fall due over the period of their assessment,
drawing attention to any qualifications or assumptions as necessary. In order to do this,
they must take into account the company’s current position and principal risks.
7.43 In its Annual Report and Financial Statements for the year ended 31 March 2019, Royal
Mail Group explained that it stress-tested the key assumptions within its detailed annual
forecasts and projected performance over the next three years and quantified these risks
to create a downside scenario. Key risks considered by the Directors included potential
industrial action, deteriorating economic and market conditions, a no deal Brexit and
increased competition in the UK parcels sector. The downside scenario took into account
committed capital and expenditure as well as other short-term costs and cash actions
which would mitigate the impact of risks (e.g. reducing variable hours and cost of sales,
removing discretionary pay, reducing internal investment and suspending the acquisitions
programme). The downside scenario was tested to determine whether the Group would
remain solvent. Based on the results of their analysis, the Directors have a reasonable
expectation that the Group will be able to continue in operation and meet its liabilities as
they fall due over the period to March 2022.156
Summary and recent events
7.44 In summary, the key trends for the 2018-19 financial year were:
• Reported Business addressed letter volumes and revenues declined by 7.3% and 0.1%
respectively in 2018-19 on a 52-week basis due to e-substitution, business uncertainty
and GDPR. This was in line with Royal Mail’s revised expectations of a 7-8% decline.
• Parcel volumes and revenues grew by 7.4% and 6.8% respectively year-on-year, largely
driven by new contract wins in Domestic Account parcels, Royal Mail’s targeting of
fast-growing sectors, new features like estimated delivery times and the extension of
LATs.
• Reported Business revenues continued to decline by 0.2% as the structural decline in
letter volumes was not offset by increasing parcels revenue.
• Reported Business costs increased by 2.6% year-on-year due to an increase in non-
people costs of 4.9%, an increase in transformation costs of 18.9%, and an increase in
people costs of 1.2%. Cost reductions and efficiency analysis are covered in more
detail in Section 6.
• As a result of the trends noted above, the financeability EBIT margin decreased from
4.4% to 1.6% in 2018-19 on a 52-week basis.
• Free cash flow turned negative to £71m. As at 31 March 2019, Royal Mail Group had
access to c. £1.1bn of funds from its undrawn banking facilities.
156 Royal Mail PLC, 2019. Annual Report and Financial Statements for the full year ended 31 March 2019, page 73.

78
• Royal Mail Group’s FFO/S&P adjusted net debt of 56% in 2018-19 exceeds the 45%
threshold which is considered to be stable by S&P. It also passed its banking covenant
tests in 2018-19.
• In Royal Mail Group’s Viability Statement, the Directors have said they have
reasonable expectation that the Group will be able to continue in operation and meet
its liabilities as they fall due over the period to March 2022.
7.45 As explained above, the financeability EBIT margin for 2018-19 was 1.6% on a 52-week
basis. This is below prior year of 4.4% and the 5-10% range, which we consider as indicative
of a reasonable commercial rate of return and one factor that leads us to monitor Royal
Mail’s long-term prospects more closely. Profitability for 2018-19 was down from the prior
year mainly due to lower letters revenue and higher costs.
7.46 However, we consider that the universal service is likely to be sustainable in the immediate
future. This is because up to now the Reported Business has been profitable, and despite
possible profitability challenges in the 2020-21 financial year as indicated by Royal Mail in
its half-year results (see below), the Group’s financial health metrics do not indicate any
short-term financial health issues. Ultimately the sustainability of the universal service
rests on the long-term prospects for the Reported Business.
7.47 In May 2019, Royal Mail set out its five-year strategy, which envisaged a Group revenue
growth of 2-3% per year from 2019-20 to 2023-24.157 Royal Mail’s strategy has a strong
focus on parcels, which is in line with the strategy of comparable operators internationally
to transform their operations from a letters to a parcels business.158 If the implementation
of the new strategy proceeds as Royal Mail foresees, Royal Mail expects its UK business to
return to revenue growth by 2023-24.159
7.48 In September 2019, Royal Mail renewed its revolving credit facility (overdraft loan facility
provided by a syndicate of banks). The total undrawn facility has been revised down from
£1,050m to £925m. The maturity date of the facility has been extended to September 2024
with options to extend for a further two years. In addition, on 8 October 2019, Royal Mail
issued €550m of Guaranteed Notes with an interest rate of 1.25% with a maturity date of 8
October 2026. This is in addition to its current €500m Eurobond with an interest rate of
2.375% and maturity date of 29 July 2024. The issue of the bond has increased Royal Mail
Group’s cash headroom. The main purpose of the revolving credit facility is to provide
certainty of funding over the period of the new strategy, whilst the bond provides diversity
of funding for the Group and to prefund the additional capital expenditure required under
the new strategy.
157 The 2-3% growth per year is calculated on a Compound Annual Growth Rate (CAGR). See Royal Mail, 2018-19 results and strategy presentation, slide 43: https://www.royalmailgroup.com/media/10705/fy-2018-19-results-and-strategy-presentation.pdf 158 For instance postal operators in the Netherlands, Denmark and Sweden have widely introduced parcel automation 159 Royal Mail reports that between 2015-16 and 2018-19 (on a 52-week basis), UKPIL revenues declined from £7,671bn to £7,595bn (-0.3%). Slide 36, Royal Mail’s 2018-19 results and strategy presentation, https://www.royalmailgroup.com/media/10705/fy-2018-19-results-and-strategy-presentation.pdf

79
7.49 We note that Royal Mail’s strategy is subject to some risks, notably the outcome of
discussions between management and unions on how this will be delivered, as well as
broader market and macro-economic risks which could affect Royal Mail’s ability to grow
parcel revenues at the rate envisaged and/or suppress overall levels of demand for letters
and parcels.
7.50 In its half-year results announcements, Royal Mail noted that transformation is running
behind schedule and is likely to impact productivity in the second half of the year. Royal
Mail also revised its forecast for the full year’s letter volume decline, expecting letter
volumes to decrease by 7-9% in 2019-20, instead of 5-7% as previously forecast. Royal Mail
stated that, combined with the industrial relations situation and lower than anticipated
productivity gains, its UK business is expected to be break-even or loss making in 2020-21.
7.51 Therefore, we believe that uncertainty remains about the longer-term sustainability of the
universal service. As in previous year, and in relation to efficiency, we will continue to
monitor the sustainability of the universal service, and engage with management to
understand better how they plan on mitigating the risks to the sustainability of the
universal service.

80
8. Regulatory compliance 8.1 In this section we discuss Royal Mail’s compliance with its regulatory obligations.
8.2 As part of its role as the designated universal service provider, Royal Mail is subject to a set
of minimum requirements and service standards in the provision of universal services.
These include: maintaining daily delivery (to all UK addresses) and collection (from all
access points)160 of letters (six days a week) and parcels (five days a week), providing
services at affordable prices under uniform public tariffs to all UK addresses, meeting
performance standards for First and Second Class deliveries, and reporting on the most
common causes for complaint.
8.3 As noted in our March 2012 Statement, in addition to matters relating to Royal Mail’s
financial sustainability, we monitor:
• prices of universal service products, with particular focus on any impact on vulnerable
groups and those that rely on postal services. We discuss Royal Mail’s price changes
(as well as noting changes to non-price terms) within this section;
• the quality of service achieved by Royal Mail in the provision of universal services, to
ensure that Royal Mail does not degrade quality, for instance in order to reduce costs
(rather than reducing costs through improving efficiency). Our March 2012 Statement
set out the quality standards that Royal Mail is required to meet to ensure that
appropriate levels of universal service performance are maintained for consumers;
and
• the complaint and compensation figures reported annually by Royal Mail.
Pricing of universal services
8.4 In March 2012, Ofcom removed the majority of price controls to give Royal Mail sufficient
commercial freedom to enable it to return the universal service to a financially sustainable
position. At the same time, we introduced a number of safeguards, including a cap on the
price of Second Class stamps (for letters, large letters and parcels less than 2kg – see
below), so that vulnerable consumers remain able to access a basic universal service.
8.5 While the majority of the analysis in this report relates to 2018-19, the pricing information
detailed below focuses on Royal Mail’s pricing announcements for 2019-20, which is in line
with previous monitoring updates.
160 As defined at section 29(11) of the Postal Services Act 2011: “‘access point’ means any box, receptacle or other facility provided for the purpose of receiving postal packets, or any class of postal packets, for onwards transmission by post.”

81
Royal Mail increased its prices in 2019-20 but most parcel prices fell in real terms
8.6 Royal Mail changed its prices for 2019-20 on 25 March 2019. Page 3 of the interactive data
shows historic trends in prices for letters and large letters, and page 4 shows historic
trends for parcel prices.161
Standard letter stamp and meter prices
8.7 First Class stamp prices rose by 3p to 70p (a 4.5% increase), and meter162 prices rose by 4p
to 64p (a 6.7% increase), in nominal terms. This was a larger increase than last year when
stamp prices rose by 3.1% and meter prices rose by 5.3% in nominal terms. This was also a
real terms price increase compared with last year (from 2018-19 to 2019-20).163 The First
Class stamp price rose by 2.2% in real terms, and the meter price rose in real terms by
4.3%, which is a larger increase than last year.164
8.8 Second Class stamp prices rose by 3p to 61p and meter prices rose by 3p to 47p. This
represents a real terms increase of 2.8% for stamp prices and 4.5% for meter prices, both
greater than last year.
Figure 8.1: Standard letter First and Second Class stamp and meter prices and price rises for 2019-
20 (nominal terms)
161 Interactive data can be accessed here: https://www.ofcom.org.uk/postal-services/information-for-the-postal-industry/monitoring_reports 162 Metered mail refers to a method of payment or payment channel for Royal Mail services where customers pre-pay for postage and apply an impression to the envelope, label or wrapper using a franking machine licensed by Royal Mail. 163 Real terms is the increase in nominal terms minus any increase in price from inflation at 2.3% for 2018-19 calculated as a yearly average based on the ONS CPI calculations. 164 In 2018-19, the First Class stamp price rose by 0.2% and the First Class meter price rose by 2.4% (in real terms).

82
Source: Royal Mail price lists.165 Prices and price rises for 2018-19 to 2019-20 are in nominal terms.
8.9 First Class meter prices for letters moved closer to First Class stamp prices this year, as
Royal Mail increased First Class meter prices by 1p more than stamp prices. The differential
for Second Class letters has stayed the same at 14p and for First Class has decreased from
7p to 6p.
Large letter stamp and meter prices
8.10 There are four weight steps for large letters: 0-100g, 101-250g, 251-500g and 501-750g.
Prices rose in real terms for large letters across all weight steps in 2019-20 compared to
the previous year.
8.11 The average First Class stamp price for large letters166 rose in real terms by 3.3%, and the
average meter price rose by 4.2%. As a result, the weighted average price for First Class
stamps and the weighted average price for First Class meter mail were both £1.24. As
these are weighted averages, the weighted average price of £1.24 reflects not only the
price differences but also the volumes of different weight steps for large letters sent using
stamp and meter; on balance, meter prices are generally lower than stamp prices. Across
First Class products, compared with last year, the largest nominal price rise was 15p, which
applied to metered large letters weighing 501-750g.
8.12 The average Second Class stamp price for large letters rose in real terms by 2.6% and the
average meter price rose by 4.4%. The weighted average price for Second Class stamps was
£1 and for metered mail was 96p. Across Second Class products, compared with last year,
nominal prices rose between 4p and 12p, with the largest price rise of 12p applying to
metered large letters weighing 501-750g.
165 For price lists see: Royal Mail, 2019. Franking prices from 25 March 2019. https://www.royalmail.com/sites/default/files/royal-mail-franking-wallchart--25-march-2019.pdf. For price changes see: Royal Mail, 2019. Prices 2019. https://www.royalmail.com/prices2019. 166 We have calculated a weighted average price using 2018-19 volumes across the four weight steps for large letters. To do so, we have taken the volume for each weight step and multiplied this by the price for that weight step. We have then added this result (for each weight step) together and divided it by the total volumes (across each weight step).
Stamp 70p 3p (4.5%) 61p 3p (5.2%)
Meter 64p 4p (6.7%) 47p 3p (6.8%)

83
Figure 8.2: Large letter First and Second Class stamp and meter prices and price rises for 2019-20
(nominal terms)
Source: Royal Mail price lists.167 Prices and price rises for 2018-19 to 2019-20 are in nominal terms.
8.13 For 2019-20, the differential between stamp and meter prices ranges from 5p to 35p
depending on the type of product, and rises with the increase in product size. There is a
greater differential between stamp and meter prices for Second Class products, and it was
generally the case that Royal Mail made greater price increases for meter prices compared
to stamp prices for both First and Second Class.168
Parcel Prices
8.14 Since March 2016, Royal Mail has offered two prices for each parcel product that it
provides within the universal service, depending on whether postage is purchased via an
online account or at the Post Office. Purchase of parcel postage via an online account is
between 5p and 10p cheaper than purchase via the Post Office. The price differences can
be seen in Figure 8.3 below, along with the price rises for 2018-19 to 2019-20.
167 For price lists see: Royal Mail, 2019. Prices 2019 and Royal Mail, 2019. Business price guide. https://www.royalmail.com/sites/default/files/Business-Price-Guide-September-2019.pdf. For price changes see: Royal Mail, 2019. Prices 2019. 168 However, First Class 101-250g and Second Class 251-500g were exceptions to this rule.
Large Letter Product Stamp Meter
First Class 0-100g £1.06 5p (5.0% ) £1.01 6p (6.3% )
First Class 101-250g £1.50 10p (7.1% ) £1.40 9p (6.9% )
First Class 251-500g £1.97 10p (5.3% ) £1.85 11p (6.3% )
First Class 501-750g £2.72 12p (4.6% ) £2.59 15p (6.1% )
Second Class 0-100g £0.83 4p (5.1% ) £0.77 5p (6.9% )
Second Class 101-250g £1.32 6p (4.8% ) £1.09 7p (6.9% )
Second Class 251-500g £1.72 8p (4.9% ) £1.41 8p (6.0% )
Second Class 501-750g £2.33 11p (5.0% ) £1.98 12p (6.5% )

84
Figure 8.3: Royal Mail parcel prices and price rises for 2019-20 (nominal terms)
Source: Royal Mail price list, March 2019.169 Prices and price rises for 2018-19 to 2019-20 are in
nominal terms.
8.15 In order to ensure a consistent comparison with prior years, we have used Post Office
prices in the interactive data accompanying this report.170
8.16 In 2019-20, most Post Office and online account parcel prices rose by 5p in nominal terms.
As in previous years, Second Class small and medium parcels up to 2kg are priced by size
rather than weight, costing the same in the 0-1kg and 1-2kg weight steps.
8.17 However, prices fell in real terms for all parcel products excluding First Class 0-1kg Post
Office and online small parcel products which rose by 0.6% and 0.7% above inflation
respectively. The largest reduction in price applied to First Class small and medium parcels
weighing 1-2kg (2.2%).
169 For price lists see Royal Mail, 2019. Online prices. https://www.royalmail.com/sites/default/files/royal-mail-our-online-prices-march-2019-47652473.pdf and Royal Mail, 2019. Franking prices from March 2019. https://www.royalmail.com/sites/default/files/royal-mail-franking-wallchart-25-march-2019-40966280.pdf 170 Interactive data can be accessed here: https://www.ofcom.org.uk/postal-services/information-for-the-postal-industry/monitoring_reports
Parcel product Post Office price Royal Mail online account
price
First Class 0-1kg small £3.55 10p (2.9% ) £3.48 10p (3.0% )
First Class 0-1kg medium £5.80 5p (0.9% ) £5.73 5p (0.9% )
First Class 1-2kg small £5.50 0p (0.0%) £5.45 0p (0.0%)
First Class 1-2kg medium £8.95 0p (0.0%) £8.90 0p (0.0%)
Second Class 0-1kg small £3.00 5p (1.7% ) £2.90 5p (1.8% )
Second Class 0-1kg
medium
£5.10 5p (1.0% ) £5.00 5p (1.0% )
Second Class 1-2kg small £3.00 5p (1.7% ) £2.90 5p (1.8% )
Second Class 1-2kg
medium
£5.10 5p (1.0% ) £5.00 5p (1.0% )

85
Safeguard caps in 2018-19
8.18 Ofcom introduced the safeguard cap for Second Class products in 2012. There are two
safeguard caps in place for stamp prices, the basket cap for Second Class large letters and
small and medium parcels up to 2kg,171 and the cap for Second Class standard letters.
8.19 In March 2017, we concluded that the safeguard caps should be retained as an
affordability measure, to ensure that consumers (in particular vulnerable consumers)
continue to have access to a universal service at affordable prices.172 In 2018-19, we
reviewed the levels of the caps, publishing our decision in January 2019. We decided:
• to maintain the basket cap at its current level.173 Royal Mail is currently pricing the
products within the baskect cap at 30.1% below the level of the cap.
• to amend the Second Class standard letters cap to 65p, a 5% real terms rise, which
would take effect on 1 April 2019.
8.20 Both the Second Class basket cap and the Second Class letter cap will increase by CPI
inflation on the 1st of April each year, until they expire on 31 March 2024.174
8.21 In February 2019 Royal Mail announced that it would be raising the price of a Second Class
letter stamp by 3p to 61p on 25 March, exceeding the price cap of 60p which was due to
stay in place until 1 April. Ofcom has determined that there are reasonable grounds for
believing Royal Mail contravened its obligations under DUSP condition 2.2.2 by charging
over the maximum price for Second Class standard letters, from 25 March 2019 to 31
March 2019, and issued a notification to that effect.
8.22 Royal Mail has made representations to Ofcom and we are carefully considering these; we
expect to make a decision on the next steps shortly.
Affordability of universal services
8.23 One of the key safeguards in the current regulatory framework is ensuring that universal
postal services are affordable. In March 2013 we published a report175 which set out that
we considered that universal postal services remained affordable in 2012 and 2013 for
both residential consumers (including low income and other vulnerable consumers) and
businesses (including small and medium businesses). Since then we have been monitoring
the affordability of postal services through the responses to questions in our postal tracker
surveys and where appropriate through reviewing Office for National Statistics (ONS) data.
171 The level of the basket cap is calculated using a weighted average. 172 Ofcom, 2017. Review of the Regulation of Royal Mail, March 2017, paragraphs 3.178-9, 4.44-6. 173 Ofcom, 2019. Review of the Second Class Safeguard Caps 2019. https://www.ofcom.org.uk/__data/assets/pdf_file/0019/133660/Statement-Review-of-the-Second-Class-safeguard-caps-2019.pdf. 174 It is open to Ofcom to make a change before 31 March 2024 if necessary. 175 Ofcom, 2013. The affordability of universal postal services. https://www.ofcom.org.uk/__data/assets/pdf_file/0014/10445/affordability.pdf.

86
8.24 We remain of the view that postal services are currently affordable for most residential
consumers. As noted in Section 5, 60% of residential consumers surveyed were satisfied
with the cost of postage.176 The majority also agree that First and Second Class stamps are
good value for money (65% and 56% of residential respondents respectively).177
8.25 However, a minority (9%) of respondents to our postal tracker survey reported that they
had had to reduce their use of postage stamps to afford essentials like food or heating in
the previous three months.178 Those cutting back on essentials to afford stamps typically
spend more than average on postage.
8.26 A higher proportion of younger people said they reduced their use of postage stamps to
afford essentials compared to the older respondents: 11% of 16-24 year olds and 13% of
25-44 year olds compared with 7% of 45-64 year olds, 5% of 65-74 year olds and 3% of 75+
year olds.
8.27 While we consider that universal service products are currently affordable for most
residential consumers, we will continue to monitor respondents’ views regarding
affordability. As noted in our review of the affordability of universal postal services in 2013,
there are some circumstances where a consumer could be at risk from not being able to
afford these services. This reflects very particular circumstances and severe financial
hardship and it is likely that consumers in such circumstances would unfortunately have
concerns about the prices of universal postal services, even at much lower prices.179
8.28 Separately, Citizens Advice published a research report in August 2018 about the
affordability of redirections.180 Royal Mail provides a redirection service in the UK for
consumers moving house which enables mail to be rerouted to their new address.181
Citizens Advice highlighted that the price of redirections has increased substantially, more
than the prices of First and Second Class stamps. According to their research, 21% of
consumers found the service too expensive or not worth the money, and 8% of consumers
wanted to use redirections but could not afford it.182
8.29 Citizens Advice suggested a number of changes including concessionary rates for
consumers with low incomes and a change in the cost of mail redirections from a ‘per
surname’ to a ‘per household’ basis. From 25 March 2019 Royal Mail have changed the
176 Ofcom, Residential Postal Tracker Q3 2018-Q2 2019, QG3_7: “How satisfied are you with the following aspects of Royal Mail’s service? Cost of postage”. 177 Ofcom, Residential Postal Tracker Q3 2018-Q2 2019, QF4. We can tell you that a First Class stamp for a standard letter currently costs 67/70p. How would you rate Royal Mail’s First Class service in terms of value for money? QF5. We can tell you that a Second Class stamp for a standard letter currently costs 58/61p. How would you rate Royal Mail’s Second Class service in terms of value for money? 178 Ofcom, Residential Postal Tracker Q3 2018-Q2 2019, QF1_1: “In the last 3 months have you had to… Reduce your use of postage stamps so that you can afford essentials like food or heating?” 179 Ofcom, 2013. The affordability of universal postal services, paragraph 6.3. 180 Citizens Advice, 2018. A new redirection? How to make mail redirections fairer and more affordable for consumers. https://www.citizensadvice.org.uk/Global/CitizensAdvice/Post%20and%20Telecoms/Mail%20Redirection%20Research%20Report%20FINAL%20(5).pdf. 181 Consumers pay an upfront fee, and there are three packages available: £33.99 for up to 3 months, £46.99 for up to 6 months, and £66.99 for up to 12 months. 182 Citizens Advice, 2018. A new redirection?, Figure 5.

87
way redirections are priced, charging a ‘lead applicant’ fee and an ‘additional person’ fee,
rather than on a per surname basis. Royal Mail have also introduced a concession scheme
for those who rent and are on certain benefits.183 We will continue to monitor the
affordability of this service.
Non-price terms of universal services
8.30 As part of our monitoring regime, we also consider the impact of non-price changes to the
terms of universal services, which involve changes to Royal Mail’s Postal Schemes.
8.31 Postal Schemes set out the terms and conditions of postal services for consumers and
business customers who use Royal Mail’s services but who do not hold an individual
contract with Royal Mail. Customers who use stamps, online postage or franking meters to
pay for Royal Mail services do so under a Postal Scheme rather than a contractual
arrangement. Details of the Postal Schemes are available on Royal Mail’s website.184
8.32 Before making changes to the Schemes, Royal Mail must consult customers and
stakeholders, including Ofcom, and the consumer advocacy bodies, including Citizens
Advice. This must occur at least one month before the date on which Royal Mail proposes
to implement the change.
8.33 During 2018-19, Royal Mail made one change to non-price items. In April 2018, Royal Mail
confirmed its decision to implement changes to its Schemes to reflect the new data
protection legislation GDPR.185
8.34 We further note that in August 2019, in the context of the Offensive Weapons Act 2019,
Royal Mail made proposals to prohibit bladed items, including knives, to be delivered using
its universal service postal products. Its consultation closed on 12 September, with Royal
Mail stating that it will evaluate responses before finalising its decision.186
8.35 We will continue to monitor any changes Royal Mail makes to non-price terms of universal
services.
Quality of Service
8.36 Royal Mail is subject to annual quality of service (QoS) targets. We monitor its performance
against these targets so that we can take prompt and appropriate action, where we
consider it necessary to do so, if we identify failures.
183 Royal Mail, 2019. Redirection Pricing Guide 25 March 2019. https://www.royalmail.com/sites/default/files/royal-mail-redirection-pricing-guide-25-march-2019.pdf. 184 Roayl Mail. Non-contract terms and conditions. https://www.royalmail.com/non-contract-terms-and-conditions/. 185 Royal Mail, 2018. Royal Mail decision: Changes to postal schemes to reflect new data protection legislation. https://www.royalmailgroup.com/media/9751/gdpr-decision-final.pdf. 186 Royal Mail, 2019. Royal Mail Consultation on Postal Schemes covering changes to the carriage of bladed items due to changes in legislation. https://www.royalmailgroup.com/media/10884/royal-mail-consultation-on-bladed-articles-final.pdf.

88
8.37 Figure 8.4 summarises Royal Mail’s performance in 2018-19 and, for comparison, 2017-18,
against the QoS targets we have set.187 Page 6 of the interactive data shows historic trends
for each target below.188
Figure 8.4: Quality of Service Summary189 190
Source: Royal Mail Quality of Service Reports191, Year End Adjusted 2017-18 and 2018-19
187 The figures cited in this subsection are taken from the Quality of Service reports submitted to Ofcom by Royal Mail and do not include any adjustments that Royal Mail makes to account for force majeure events, such as very severe weather. 188 Interactive data can be accessed here: https://www.ofcom.org.uk/postal-services/information-for-the-postal-industry/monitoring_reports 189 Descending or ascending arrows: Royal Mail performance declined or improved compared with last year, respectively. Green or red arrows: Royal Mail met/exceeded the target, or did not meet the target, respectively. 190 The post code area is the largest geographical postcode unit and forms the initial characters of the alphanumeric UK postcode. 191 Royal Mail. Quality of service. https://www.royalmailgroup.com/en/about-us/regulation/quality-of-service/. [Last accessed 17.11.19]

89
Royal Mail missed key quality of service targets in 2018-19 and we launched an investigation
8.38 Royal Mail is required to deliver 93.0% of all First Class retail items (single piece stamp,
meter and PPI192 letters and parcels) on the next working day after collection, and 98.5% of
all Second Class retail items within three days of collection.193
8.39 Royal Mail did not meet its target for First Class in 2018-19, for the second year running.
Royal Mail reported delivering 91.5% of First Class items next day, missing the target by
1.5%. However, Royal Mail met its Second Class delivery target of 98.5%, achieving a
performance of 98.6%, an improvement of 0.2pp relative to the prior year.
8.40 The Post Code Area (PCA) target requires Royal Mail to deliver 91.5% of First Class mail the
day after collection from a postbox, Post Office or other collection point, to 118 of the 121
postcode areas.194 Royal Mail’s performance has increased slightly compared to the
previous year, but it is still meeting the target in only 75 PCAs, compared to 72 PCAs in
2017-18. Of the 43 PCAs where Royal Mail did not meet the target, 30 were within the
margin of error associated with the survey used to calculate performance. Therefore, Royal
Mail was within the confidence error margin or above the target level (91.5%) in 108 of the
118 postcodes where the PCA target applies.195
8.41 Royal Mail did not meet its Special Delivery target. This has been the case since Ofcom first
began monitoring Royal Mail’s performance in 2011-12, but performance has improved
relative to last year by 0.1 pp.
8.42 Performance against the European International Delivery target improved compared with
last year, although overall performance fell from 95% in 2011-12 to 86.6% in 2018-19. It
remains above the required performance level of 85%.
8.43 Royal Mail exceeded its requirement to ensure at least 99.50% of items are correctly
delivered, achieving 99.76%. It did not meet the target for completing 99.90% of delivery
routes on each working day, a target Royal Mail has only successfully completed once (in
2017-18) since 2010-11 . Royal Mail did not achieve its target to ensure that at least
99.90% of collection points are served each day, achieving 99.85%, which was an
improvement on 2017-18.
192 Printed Postage Impressions, or PPIs, is a printed alternative to a postage stamp or franking to indicate that postage has been (or will be) paid. These are not included in our assessment of PCA targets, which relate only to stamped and metered postal items (see paragraph 8.39). 193 These targets are set below 100% to allow for commonly experienced circumstances that may arise in the transportation, processing and delivery of mail, for example disruption to aircraft flights due to bad weather or missed network connections due to road traffic delays and breakdowns. 194 The HS (Hebrides), KW (Kirkwall, Orkney) and ZE (Shetlands) post code areas are excluded from this target, principally because logistically it is not practical to achieve a next day service for 91.5% of First Class mail sent from across the UK to these remote destinations. In addition, these offshore areas are more frequently subject to weather-related disruption of ferry and air services. 195 The confidence error margin describes the range within which there is a 95% probability of the true result occurring.
90
8.44 These QoS targets aim to ensure people receive a good, reliable service from Royal Mail.
We closely monitor its performance throughout the year and can take action if it fails to
meet these standards. Overall, quality of service performance increased from 2017-18 to
2018-19.
8.45 In 2018-19 we investigated Royal Mail’s failure to meet quality of service targets in 2017-
18. We concluded that Royal Mail had contravened DUSP condition 1.9.1 by not meeting
specified performance targets associated with First Class mail delivery during 2017-18.196
8.46 We are currently investigating Royal Mail’s compliance with the First Class and Post Code
Area targets in 2018-19 and expect to publish a decision in early 2020.197
Competition Act findings
8.47 In August 2018 we published a Decision fining Royal Mail £50 million for abusing its
dominant position in bulk mail delivery services, contrary to EU and UK competition law. In
our Decision, we found that Royal Mail had pursued a deliberate strategy of pricing
discrimination targeted at TNT (now Whistl), which was its only major competitor in end-
to-end bulk mail delivery services.
8.48 In October 2018 Royal Mail appealed against our Decision to the Competition Appeal
Tribunal. On 12 November 2019 the Competition Appeal Tribunal handed down its
judgment dismissing Royal Mail’s appeal in its entirety. A copy of the judgment can be
found on the Tribunal’s dedicated webpage.
8.49 At the time of writing Royal Mail has confirmed that it has asked for permission to appeal
the Competition Appeal Tribunal judgement in the Court of Appeal.198
Complaints data
8.50 Ofcom requires Royal Mail, as the universal service provider, to publish an annual report
setting out the number of complaints received in each financial year and the amount of
compensation paid in relation to those complaints. It is also required to report the top ten
categories of complaint.
Complaints
8.51 Page 7 of the interactive data199 contains the top ten categories of complaint to Royal Mail
since 2013-14 in further detail.
196 Ofcom, 2019. Decision to conclude investigation into Royal Mail’s compliance with its quality of service performance standards in 2017/18. https://www.ofcom.org.uk/__data/assets/pdf_file/0015/152241/decision-non-confidential-royal-mail-quality-of-service-17-18.pdf. 197 Ofcom, 2019. Investigation into Royal Mail’s quality of service performance in 2018/19, open case. https://www.ofcom.org.uk/about-ofcom/latest/bulletins/competition-bulletins/open-cases/cw_01244. [Last accessed 17.11.19] 198 https://otp.tools.investis.com/clients/uk/royal_mail_group/rns/regulatory-story.aspx?cid=2414&newsid=1350106 199 Interactive data can be accessed here: https://www.ofcom.org.uk/postal-services/information-for-the-postal-industry/monitoring_reports

91
Figure 8.5: Royal Mail’s top ten complaint categories, 2018-19 compared to 2017-18
Source: Royal Mail200
*A P739 form is issued by a postal worker when a customer is not at home, or is otherwise unable to
receive an item of mail at the delivery address.
**Other refers to any complaints that do not fall into the top ten and includes a number of
categories.
8.52 Overall complaint volumes increased to 1,120,559 in 2018-19, representing an increase of
7.3% from 2017-18.201 There was an increase in complaints in all of the top ten complaint
categories except for P739 and mis-delivery which both saw small decreases.
8.53 Loss continues to account for the highest proportion of complaints (27.7%) which was an
increase of 3.1% from last year. The second largest specific category, denial of receipt,
increased in terms of volume of complaints but decreased as a proportion of overall
complaints by 0.6%. Complaint numbers for denial of receipt increased by 2.1% year on
year, increasing from 134,712 in 2017-18 to 137,499 in 2018-19.
200 Royal Mail, 2019. Annual Consumer Complaints and Compensation Report 2018-19. https://www.royalmailgroup.com/media/10814/royal-mail-annual-consumer-complaints-2018-19.pdf and Royal Mail, 2018. Annual Consumer Complaints and Compensation Report 2017-18. https://www.royalmailgroup.com/media/9998/royal-mail-annual-consumer-complaints-2017-18.pdf. 201 The total number of complaints in 2017/18 was 1,044,522. This has been calculated by adding the complaints recorded in each category.

92
Compensation
8.54 Royal Mail is required to provide compensation on a fair and reasonable basis where a
customer experiences loss, delay or damage in relation to certain universal postal services.
8.55 When compensation was given, the average compensation paid per complaint increased
by less than £1 to £23.14. The total number of complaints where compensation was paid
increased by 4.8%. Total compensation paid by Royal Mail rose 26.3% from last year, to
approximately £9.8 million.
8.56 We will continue to examine complaints and compensation data on an ongoing basis as
part of our monitoring programme.
Exceptions to the universal service
8.57 Royal Mail is required to collect and deliver letters six days a week, and parcels five days a
week, to all UK addresses as part of the universal service. Ofcom takes exceptions to this
requirement seriously.
8.58 We have put rules in place setting the circumstances which we consider to be exceptional
and in which Royal Mail’s universal service obligations do not need to be met. These
include health and safety of postal staff, security of mail, and access difficulties.202
8.59 To provide transparency, we require Royal Mail to publish an annual report of the
addresses of the delivery points (at postcode area-level) in relation to which exceptional
circumstances have persisted for 12 months or more and the relevant circumstances.203 A
total of 3,485 delivery points were reported by Royal Mail as subject to exceptional
circumstances in its June 2019 annual report, meaning that they are not able to receive
deliveries to the frequency required under the universal service obligation.204 However,
there are around 30 million delivery points in the UK, so excepted delivery points represent
a very small proportion of the total footprint.205 People can appeal decisions made by Royal
Mail to suspend deliveries to their property. Under our rules, Royal Mail considers stage
one and stage two appeals. If the issue remains unresolved, consumers can make a stage
three appeal to Ofcom for a final decision.206
202 Ofcom, 2013. Direction relating to exceptions to the postal deliveries Universal Service Obligation and approval of alternative delivery points. www.ofcom.org.uk/__data/assets/pdf_file/0023/78314/statement_delivery_exceptions.pdf; and https://www.ofcom.org.uk/__data/assets/pdf_file/0033/79656/statement_collections_exceptions.pdf 203 Royal Mail’s most recent Annual Delivery Exceptions Report (published in June 2019) is available here: www.royalmailgroup.com/media/10813/uso-delivery-exceptions-over-12-months-publish-june-2019.pdf. 204 Reported delivery exceptions may include delivery points that receive deliveries but on fewer days a week than required under the universal service obligations. This might be the case where an excepted delivery point is on an island where there is a ferry service only on certain days of the week. Reported delivery exceptions would also include delivery points where daily deliveries are made but to an alternative delivery point (i.e. to a secure box on the perimeter of an address rather than to a building where there may be access difficulties). 205 Royal Mail. Deliver public. https://www.royalmail.com/deliverpublic3 [Last accessed 16.12.19] 206 Royal Mail explains the delivery exceptions policy and the appeals process on its website here: https://personal.help.royalmail.com/app/answers/detail/a_id/277/~/delivery-exceptions
93
8.60 Royal Mail is also required to publish an annual report of the collection points (typically
postboxes or post offices) in relation to which exceptional circumstances have persisted for
12 months or more, and the relevant circumstances preventing the collection of letters (six
days a week) and parcels (five days a week) from these locations. In its June 2019 report
1,748 collection points were subject to such exceptions.207 There are around 115,000
postboxes and 11,500 Post Offices across the UK, so the number subject to exceptions
represents a very small proportion of the total number of access points.208
8.61 We will continue to monitor levels of both exceptions to delivery and collection as part of
our wider monitoring programme.
Summary
8.62 Royal Mail’s Quality of Service (QoS) performance improved on nearly all measures against
the previous year and they met their Second Class target. However, Royal Mail still failed to
meet most of its QoS targets in 2018-19. We are currently undertaking an investigation
into Royal Mail’s compliance with the First Class and Post Code Area targets during 2018-
19.
8.63 Royal Mail increased its prices in January 2019, but in real terms the price of most of its
parcel products fell. Most residential consumers we surveyed are satisfied with the cost of
postage, and we continue to be of the view that the universal service remains affordable.
8.64 Ofcom provisionally found that Royal Mail breached the Second Class letter safeguard cap
between 25 March 2019 when its new prices applied, and 31 March 2019 when the new
cap took effect.
8.65 Customer complaints increased by 7.3% compared with 2017-18 levels, with loss of mail
representing the biggest share of complaints.
207 Royal Mail, June 2019. Annual Collection Exceptions Report. https://www.royalmailgroup.com/media/10810/uso-collection-exceptions-over-12-months-2019.pdf 208 Royal Mail, 2019. Annual report and financial statements 2018-19.

94
A1. Summary of Royal Mail reporting requirements A1.1 The following table sets out the financial information reporting requirements and relevant
deadlines applicable to Royal Mail as the universal service provider.
Table A1.1: Regulatory financial reporting submissions and deadlines
Submissions Submission deadline
Annual regulatory accounts Including income statement, statement of capital employed, and cash flow statement of Reported Business; reconciliation of Relevant Group accounts to Reported Business accounts; Product Profitability Statements (PPSs, proposed to be access products and PAF only); and accompanying notes to include Cost Matrix and PVEO Analysis191
90 days after Financial Year end
Annual cost and volume input and output data at SPHCC level 90 days after Financial Year end
Quarterly regulatory accounts Including income statement of Reported Business; PPSs (proposed to be access and PAF only); and accompanying notes proposed to include Cost Matrix
54 days after Financial Quarter end
Quarterly revenue and volume report
54 days after Financial Quarter end
Quarterly cost metrics report Including RDT to workload bridge
54 days after Financial Quarter end
Quarterly revenue, volume and cost granular data submission
54 days after Financial Quarter end
Management Accounts for the Board for the 6th and 12th Financial Month of the Financial Year
54 days after Financial Month end
Second Class safeguard caps submission One month after the implementation of any
new prices
Top Related