


Languages
Pages
Legal


REPORTCARD
Annual ICRA Mutual Fund Rankings
For the Period ended December 31, 2011

Annual MF Booklet for the period ended December 31, 2011 Page 1
Executive Summary Regulatory Update- Mutual Funds Economic Update Industry Overview Equity Market Overview Should one only invest in large cap stocks? Debt Market Overview Impact Of Interest Rates On Debt Oriented Mutual Funds Small Savings Schemes - From Fixed Income Options To A Market Linked Products Factors Impacting Indian Currency Currency Swaps Rising Crude Oil Prices Hampering India’s Growth Story ICRA Mutual Fund Categories Ranking Synopsis ICRA Award Winners 2012 Ranking Methodology Annexure
FAQ’s
Rankings-Exhaustive List Disclaimer
Annual ICRA
Mutual Fund
Ranking
For
The Period
Ended
December 31,
2011

Annual MF Booklet for the period ended December 31, 2011 Page 2
Living in Interesting Times
This supposed Chinese proverb is reflection of times we live in. On the one hand we have an army of
doomsday advocates with enough ammunition of logic and data suggesting that capitalism as we
know it is in for a sea change. On the other hand there is an increasing vocal minority which believes
that the world may not be always in doom and gloom. The major economies of the world i.e. the G‐
20 are still growing albeit on steroids of exceedingly benign monetary policy, thus providing a small
ray of hope, that all is not lost and that a turnaround could be around the corner.
In this scenario we are presenting the second edition of the “Mutual Fund Industry Review” for the
benevolent consideration of our stakeholders. The positive response of our stakeholders for our
previous edition has given us the courage to make the current issue more inclusive in terms of
coverage and participants.
The Indian asset management industry has been able to maintain investor interest despite the
turbulence experienced in the last year. Gold and liquid funds emerged as star performers which
indicated that investors are allocating their corpus across asset classes, commensurate with their risk
appetite.
The regulators continued their drive to make mutual funds more investor friendly. However, the
moves were more like deft strokes of VVS Laxman vis a vis the almost Sehwagesque onslaught that
the industry felt in 2009‐10. The regulators have raised the investment window in Indian MFs by
allowing foreign retail participation as well as enhancing the ceilings in debt investments. These
measures should allow the industry an alternate source of investments, as in developed markets
MFs are pull products taken under expert advice as against it being a push product in India. The
regulators have also guided the AMCs to disclose their credit evaluation policy to ensure the credit
quality of the securities and enable the investors to take informed decision.
India’s economy reeled under the continued sludge fest between inflation and RBIs
countermeasures. The downdraft got further impetus due to the marked depreciation of the Indian
currency and the government’s express inability to manage fiscal deficit. Given the increasing
correlation with the global economy, recent global macroeconomic developments have ensured that
downside risk to domestic growth stays unabated. On a positive note, the monsoons have done their
bit to calm down the anxieties. In the last two policy review the RBI also has indicated that it would
stop monetary tightening. These factors should help calm some frayed nerves in calendar year 2012.
On the global front, caution continues to prevail. With the US still wobbling into recovery, it is likely
that the Federal Reserve would be required to at least continue with benign monetary policy.
Actions in euro‐zone are also at an interesting juncture and deserve monitoring. However, there
could be an attention‐grabbing scenario where things do not turn out to be as bad as it was assumed
in 2011, and then the FIIs flush with liquidity could again realign their portfolios to at least equal
weight if not going overweight on India.
EXECUTIVE SUMMARY

Annual MF Booklet for the period ended December 31, 2011 Page 3
Debt markets exhibited an almost uniform pattern of rising yields affected by policy action and
tottering resolve on fiscal responsibility. However 2012 could see some moderation if not reversals
in yield curve. These could be good signs, not only for those who are already invested in debt but
also for other asset classes. We have also provided a simple analysis of how interest rates impact
mutual funds and small savings schemes.
Commodities especially crude oil stayed stubbornly up, primarily on account of geopolitical tensions
in the Middle East and North African countries. The sharp decline in Rupee did not help the cause
either. We have presented a small analysis on how these factors impact crude oil prices and also
impact on various macro economic factors.
As previously mentioned, the sharp depreciation of the Indian rupee also had a role in the lowering
of gears of India’s economic engine. We have tried to enlighten our readers on the factors which
impact currency movements and also the importance of currency swaps as instruments of hedging
and risk mitigation.
To conclude, we would again like to re‐iterate our gratitude for the unstinted support of all
stakeholders and would eagerly welcome feedback to make our output a “must‐have” companion
for informed decision making.
Annual MF Booklet for the period ended December 31, 2011 Page 4
MF ‐ REGULATORY UPDATE
SEBI norms to attract more FIIs in Debt Sector
During the year the market regulator SEBI has brought some changes in the MF industry norms to
make it more investor friendly and bring more transparency. It has been observed that, in the
present calendar year the FII investment in MF industry has plunged drastically specially in debt
oriented instruments. There might be several reasons for that. One among the probable reason
might be the continuous rate hike regime followed by RBI. Thus to attract the FII investments in debt
oriented sector, SEBI has undertaken some prominent norms in expectations of bring fresh air in the
industry along with monitoring and regulating the industry.
SEBI has decided to raise the limit of FII investment in government and corporate debt securities by
$5 billion to attract more foreign funds in the domestic economy. Accordingly, the new cap has been
raised to $15 billion for the government securities from the previous amount of $10 billion and
similarly to $20 billion for corporate bonds.
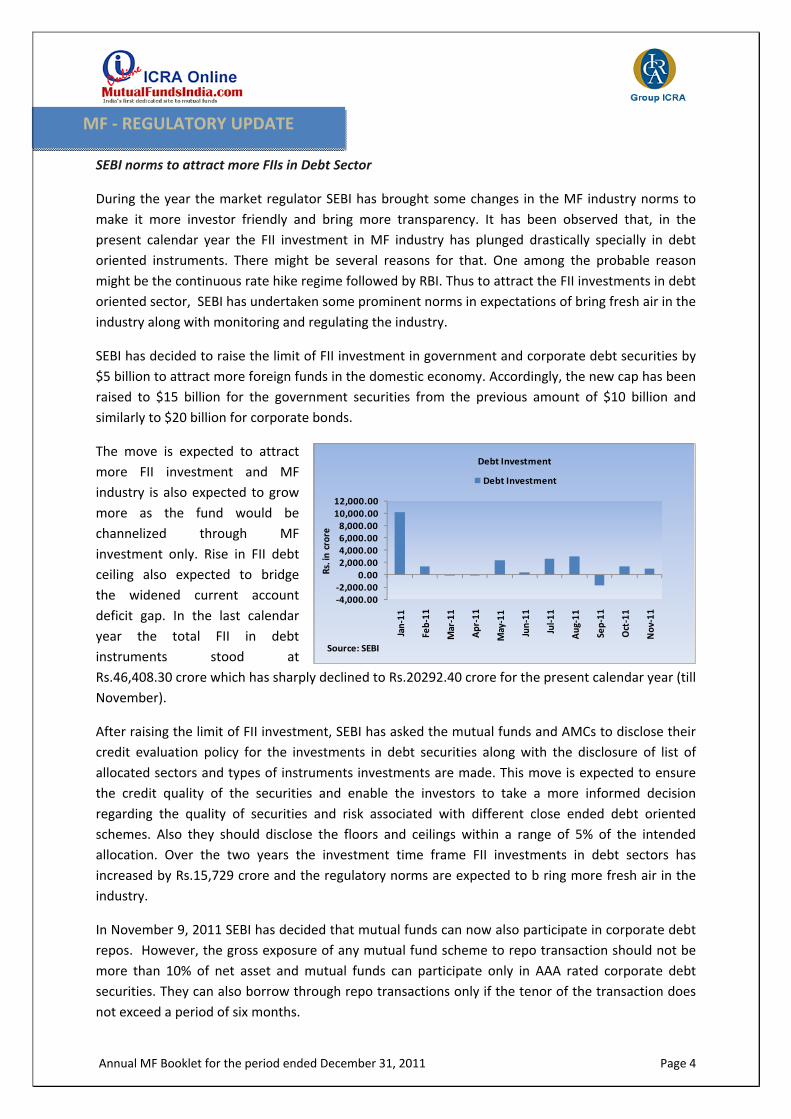
The move is expected to attract
more FII investment and MF
industry is also expected to grow
more as the fund would be
channelized through MF
investment only. Rise in FII debt
ceiling also expected to bridge
the widened current account
deficit gap. In the last calendar
year the total FII in debt
instruments stood at
Rs.46,408.30 crore which has sharply declined to Rs.20292.40 crore for the present calendar year (till
November).
After raising the limit of FII investment, SEBI has asked the mutual funds and AMCs to disclose their
credit evaluation policy for the investments in debt securities along with the disclosure of list of
allocated sectors and types of instruments investments are made. This move is expected to ensure
the credit quality of the securities and enable the investors to take a more informed decision
regarding the quality of securities and risk associated with different close ended debt oriented
schemes. Also they should disclose the floors and ceilings within a range of 5% of the intended
allocation. Over the two years the investment time frame FII investments in debt sectors has
increased by Rs.15,729 crore and the regulatory norms are expected to b ring more fresh air in the
industry.
In November 9, 2011 SEBI has decided that mutual funds can now also participate in corporate debt
repos. However, the gross exposure of any mutual fund scheme to repo transaction should not be
more than 10% of net asset and mutual funds can participate only in AAA rated corporate debt
securities. They can also borrow through repo transactions only if the tenor of the transaction does
not exceed a period of six months.
‐4,000.00‐2,000.00
0.002,000.004,000.006,000.008,000.0010,000.0012,000.00
Jan‐11
Feb‐11
Mar‐11
Apr‐11
May‐11
Jun‐11
Jul‐11
Aug‐11
Sep‐11
Oct‐11
Nov‐11
Debt Investment
Debt Investment
Rs. in crore
Source: SEBI
Annual MF Booklet for the period ended December 31, 2011 Page 5
In addition the category of the counter party, credit rating of the counter party and tenor of
collateral should also be considered. The exposure limit for the scheme and the risk factors
associated with repo transaction should also be disclosed in SID.
Opening the door for QFIs in MF Industry
The government has decided to open the investment doors for foreign investors in MFs. In FY11
budget speech, Finance Minister has indicated to open up the MF industry for foreign investors and
accordingly SEBI took a big move and decided to open the door for the qualified foreign investors
(QFI). QFIs are new category of foreign investors who will be allowed to invest in equity schemes of
Indian mutual funds. This category essentially encompasses foreign individuals, companies and
pension funds that are not separately registered as a foreign institutional investor (FII) or a non‐
resident Indian (NRI) with the Securities and Exchange Board of India (SEBI). The QFIs are compliant
with the Financial Action Task Force (FATF) and that is a signatory to the International Organisation
of Securities Commissions's multilateral MoU.
The total investment by QFIs in equity scheme has been limited to $10 billion while the same for
debt scheme is $3 billion. The investment can be made through two ways‐direct route and indirect
route. Under direct route investors can hold MF units in demat account through a SEBI registered
depository participant (DP) and under indirect route the holding would be via unit conformation
receipt (UCR).
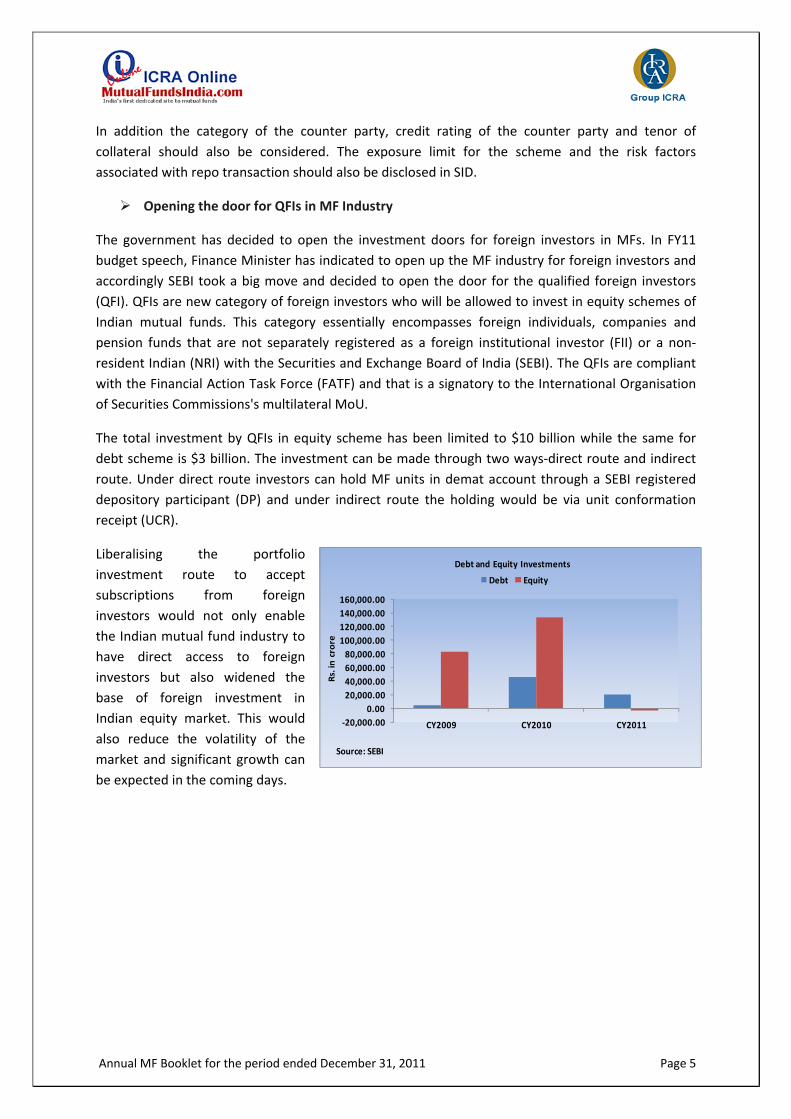
Liberalising the portfolio
investment route to accept
subscriptions from foreign
investors would not only enable
the Indian mutual fund industry to
have direct access to foreign
investors but also widened the
base of foreign investment in
Indian equity market. This would
also reduce the volatility of the
market and significant growth can
be expected in the coming days.
‐20,000.00
0.00
20,000.00
40,000.00
60,000.00
80,000.00
100,000.00
120,000.00
140,000.00
160,000.00
CY2009 CY2010 CY2011
Debt Equity
Debt and Equity Investments
Rs. in crore
Source: SEBI

Annual MF Booklet for the period ended December 31, 2011 Page 6
ECONOMIC UPDATES
Cash Reserve Ratio (CRR) reduced by 50 bps from 6.0% to 5.5%. Key policy rates kept unchanged at 8.50% & 7.50% respectively. GDP forecast lowered to 7.0% for the full fiscal year from earlier projected figure of 7.6%. Inflation projection is kept unchanged at 7.0% till March end.
Overview:
The Reserve Bank of India today cut the CRR by 50 basis points and kept the key benchmark rates unchanged in the “Third Quarter review of Monetary Policy”. Markets opined that Central bank would wait some more time before changing stance on interest rates as core inflation is still high. The central bank had raised rates thirteen times in last year and a half, which made it one of the most hawkish central banks anywhere.
Rationale: To combat galloping inflation, RBI
has raised the key interest rate
which in turn has adversely
impacted the growth trajectory of
the third largest economy of Asia.
In recent times inflation has shown
signs of moderation. This can be
attributed to food prices inflation
decelerating due to the higher
supply of seasonal items. Index of
the manufacturing items, protein
based items and fuel index are still
quite high and there is an upside
risk of rise in global crude oil prices.
Thus in order to balance growth and inflation, the monetary policy stance has now shifted to
growth, although the perennial tussle between growth and managing inflation is expected to
continue for some time. CRR cut will act as the primary and permanent instrument of credit control
and it will alleviate the liquidity in the system and will reduce the structural imbalances in the
economy.
RBI cuts CRR by 50 bps, shifts focus from inflation to growth

Annual MF Booklet for the period ended December 31, 2011 Page 7
The main reasons behind this move ‐
GDP growth moderated from 7.7% in 1QFY12 to 6.9% in 2QFY12 as an almost direct
consequence of tightening monetary policy. RBI has also lowered the projected figure from
7.6% to 7% for FY12. Thus in order to bring the domestic economy back on the growth path,
repo and reverse repo rates have been kept unchanged at 8.50% and 7.50%.
On account of slowdown of production in the manufacturing and mining sectors, high
volatility has been witnessed for the index of industrial production (IIP) which rebounded
from ‐4.9% in October to 5.9% in November.
WPI inflation moderated from 10% in September to 7.47% in December following sharp fall
in food articles. However, manufacturing index still hovers around 7% and fuel index at 14%
level which is also expected to rise in coming days following rise in global crude oil prices and
depreciation of Indian currency.
The size of current account deficit has become a big threat to the economy and gross fiscal
deficit in the current financial year has overshot the budget estimate. The likely slippage in
this year’s fiscal deficit has inflationary implications.
In the global front, US GDP has been revised downwards from 2% to 1.8% while moderation
has also been seen in the emerging and developing economies (EDEs) too. Euro zone debt
crisis has still not resolved fully.
Market Reactions:
The stock market surged drastically after the announcement of CRR cut. Sensex initially
started on a flat note but gained around 244 points after the announcement came. It closed
at 16,995.77, 1.46% above the yesterday’s close.
All the sectoral indices at BSE closed in green. Rate sensitive sectors reacted positively as
Capital Goods and Bankex were the major gainers.
The major gainers were SBI, Axis Bank, ICICI bank which gained by 5.19%, 3.57% and 3.30%
respectively.
Rupee appreciated on the day and traded at 50.02 per dollar after it touched days high and
low at 50.12 and 49.92 a dollar.
Bond yields eased after the announcement of policy review. However it increased after the
RBI Governor’s comment on Open Market Operations. The 10 year benchmark bond closed
the day at 8.35%, 18 bps above the yesterday’s close.

Annual MF Booklet for the period ended December 31, 2011 Page 8
Outlook:
The monetary policy review was not expected to be a game changer in terms of interest rates
however a cut in CRR was doing the rounds among bond traders and economists. A cut of 50 bps was
bonanza for the market as it would release around Rs 32,000 crore in the banking system. The
document released on the eve of the policy titled 'Macroeconomic and Monetary Developments'
,summed up the RBI mood, "Even as growth slowdown emerges as the major challenge, inflation
risks persist, posing a challenge for monetary policy in achieving low and stable inflation with
minimal sacrifice of growth." The cut in CRR will boost liquidity in the system and is likely to decrease
the cost of funding for corporate in the medium term. The Central bank would cut rates only when
there is moderation in the non‐food inflation and signs of fiscal consolidation. The next big trigger for
the market would be Union Budget where more clarity on fiscal deficit is expected. The Monetary
Policy for 2012‐13 will be announced on April 17 and Mid Quarter Review of Monetary Policy would
take place on March 15.
Annual MF Booklet for the period ended December 31, 2011 Page 9
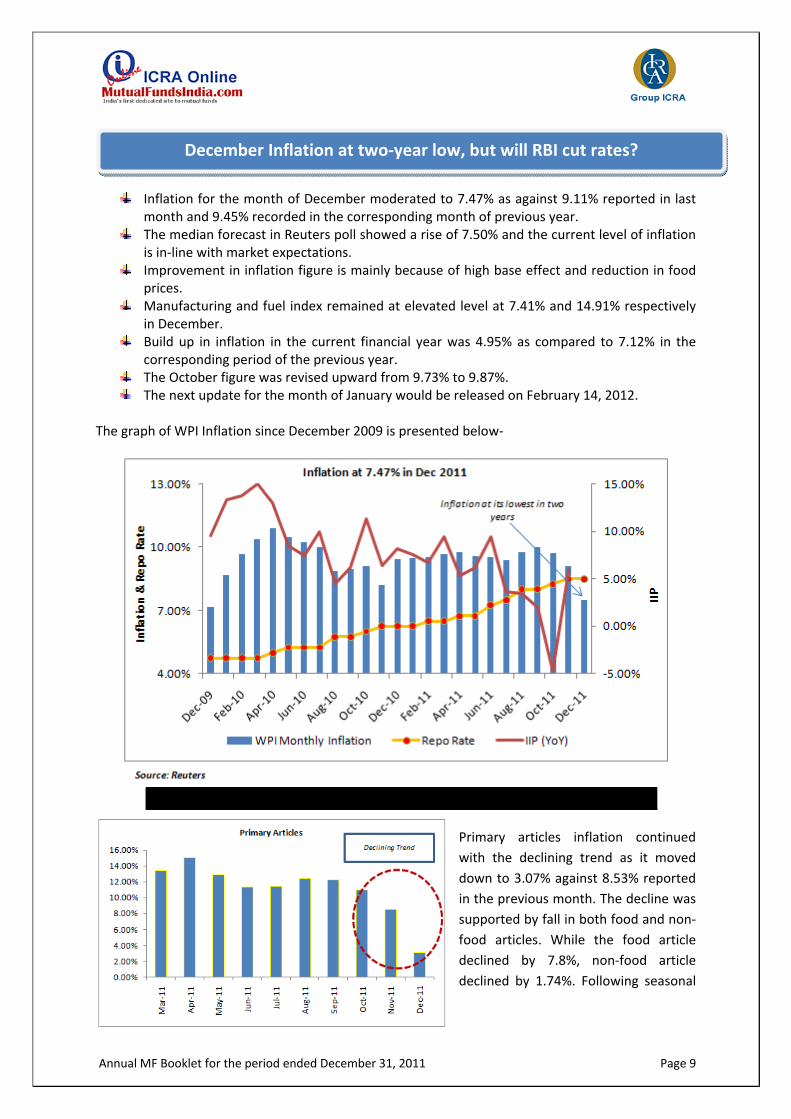
Inflation for the month of December moderated to 7.47% as against 9.11% reported in last month and 9.45% recorded in the corresponding month of previous year.
The median forecast in Reuters poll showed a rise of 7.50% and the current level of inflation is in‐line with market expectations.
Improvement in inflation figure is mainly because of high base effect and reduction in food prices.
Manufacturing and fuel index remained at elevated level at 7.41% and 14.91% respectively in December.
Build up in inflation in the current financial year was 4.95% as compared to 7.12% in the corresponding period of the previous year.
The October figure was revised upward from 9.73% to 9.87%. The next update for the month of January would be released on February 14, 2012.
The graph of WPI Inflation since December 2009 is presented below‐
Primary articles inflation continued
with the declining trend as it moved
down to 3.07% against 8.53% reported
in the previous month. The decline was
supported by fall in both food and non‐
food articles. While the food article
declined by 7.8%, non‐food article
declined by 1.74%. Following seasonal
December Inflation at two‐year low, but will RBI cut rates?
WPI Inflation by Category (%YoY)
Annual MF Booklet for the period ended December 31, 2011 Page 10
supply of vegetables, food price index drastically declined during the month.
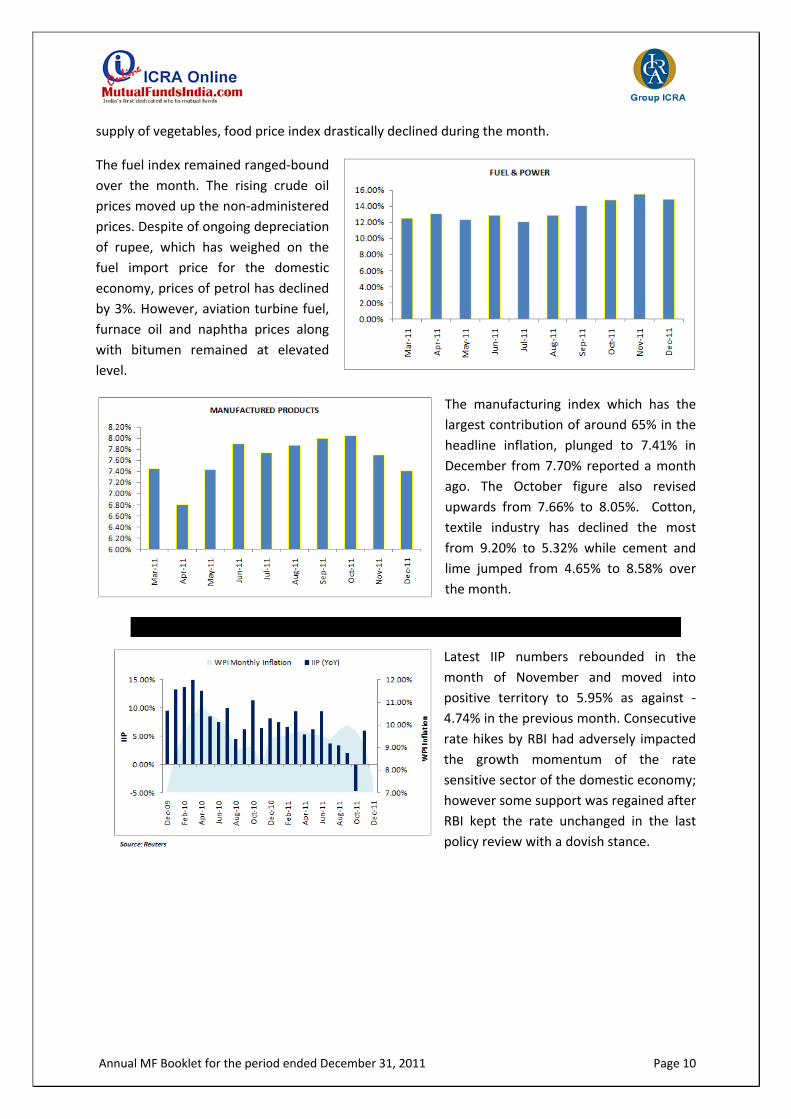
The fuel index remained ranged‐bound
over the month. The rising crude oil
prices moved up the non‐administered
prices. Despite of ongoing depreciation
of rupee, which has weighed on the
fuel import price for the domestic
economy, prices of petrol has declined
by 3%. However, aviation turbine fuel,
furnace oil and naphtha prices along
with bitumen remained at elevated
level.
The manufacturing index which has the
largest contribution of around 65% in the
headline inflation, plunged to 7.41% in
December from 7.70% reported a month
ago. The October figure also revised
upwards from 7.66% to 8.05%. Cotton,
textile industry has declined the most
from 9.20% to 5.32% while cement and
lime jumped from 4.65% to 8.58% over
the month.
Latest IIP numbers rebounded in the
month of November and moved into
positive territory to 5.95% as against ‐
4.74% in the previous month. Consecutive
rate hikes by RBI had adversely impacted
the growth momentum of the rate
sensitive sector of the domestic economy;
however some support was regained after
RBI kept the rate unchanged in the last
policy review with a dovish stance.
IIP and Monthly Inflation

Annual MF Booklet for the period ended December 31, 2011 Page 11
Lower food inflation data supported the WPI to ease below 9% in the present month. Vegetable
prices especially potato and onions cooled off due to seasonal effect which in turn supported the
food price to plunge. Vegetable prices stood at ‐34.18% in the month of December as against 12%
recorded in the last month. Though there was fall in inflation, market responded marginally and
surged only by 0.22%. The BSE Sensex erased early losses and ended 35 points up at 5‐week high of
16,189.36 today as inflation logged a sharp dip, although investors remained cautious because of
weak global cues due to credit downgrade of nine euro‐zone countries by ratings agency S&P.
Among the sectoral indices, rate sensitive sectors Bankex (‐0.30%), Realty (‐0.52%) moved into
negative terrain as market is expecting a reverse policy measure in coming days. India’s 10‐year
bonds declined on speculation the government will exceed its fiscal deficit target, spurring more
borrowings from the market. The yield on the 8.79 percent note due November 2021 rose three
basis points, or 0.03 percentage point, to 8.22%.
Outlook:
The headline WPI inflation rate for December eased to 7.47% due to higher base effect and fall in
food inflation. With IIP data coming better than expectations and WPI inflation in line with market
estimation, it would be interesting to see the policy stance that RBI takes on the upcoming monetary
policy review scheduled on January 24. RBI might go for a 25 basis points reduction in the benchmark
rates to facilitate growth however as core inflation is still high it might also consider a cut in the CRR
rate to inject liquidity into the banking system.

Annual MF Booklet for the period ended December 31, 2011 Page 12
The quick estimate of Index of Industrial Production (IIP) with base 2004‐05 for the month of
November 2011 was released by the Central Statistics Office of the Ministry of Statistics and
Programme Implementation on January 12, 2012. The salient points are‐
IIP growth rate for the month of November grew to 5.9% as against ‐5.1 %( revised to ‐4.7%)
reported in the previous month.
The higher IIP figure is better‐than market expectation.
Cumulative growth for the period of April to November 2011‐12 stood at 3.8% as against
8.4% reported in same period last year.
The October IIP figure has gone through first revision and stood at ‐4.74% versus the earlier
reported figure of ‐5.1%.
Mining and capital goods are the only sectors which have posted negative return for the
month.
In terms of industries, seventeen (17) out of the twenty two (22) industry groups (as per 2‐
digit NIC‐2004) in the manufacturing sector have shown positive growth during the month of
November 2011 as compared to the corresponding month of the previous year.
Release of the index for December 2011 will be at 11.00 hours on the Thursday, 10 February
2012.
India’s IIP growth over past couple of years is presented below‐
Market Reaction to the IIP Data
The 10‐year benchmark bond yield rose earlier but later remained steady at 8.23‐8.24%.
The benchmark index Sensex pared early losses after the data was announced however on a
volatile day, it closed at 0.86% down at 16,037.51.
The INR was little changed at 51.79/80 to the dollar.
India’s November Industrial output beats estimates at 5.9 % Y‐o‐Y.

Annual MF Booklet for the period ended December 31, 2011 Page 13
Sectoral performance
Manufacturing sector
Manufacturing sector which contributes around 75.5% to industrial production posted strong annual
growth (6.6%) for the month of November as against ‐5.6% reported in the previous month. Higher
car sales data which surged to four months high supported the strong numbers also collection of
excise duty rose nearly 10% in December, indicating a possible rebound in manufacturing activity in
the domestic economy.
Mining sector
The mining sector continued to follow the negative trend observed in the previous few months. For
the present month, it contracted to 4.4% as against contraction of 6.06% reported in the earlier
month. In the same period last month the reported figure 6.9% and the cumulative figure for April to
November period stood at ‐2.5% as against 7% in same period last year. Different policy measures
and prevailing uncertainties in the economy impacted the sector.
Electricity The sector has posted highest returns among its peers. Robust growth of the sector is followed by
plenty of monsoon rain received by the country. However, during the same period last year the
growth rate stood at 4.6% and for last month it stood at 5.5%. The good performance of the sector is
because of favourable base effect and improvement in thermal based generation.

Annual MF Booklet for the period ended December 31, 2011 Page 14
Used Based performance
On the use based classification, Consumer Goods led the gainers; the segment reported a growth of
13.1% Y‐o‐Y. Capital goods remained the underperformer for the fifth consecutive time and posted
negative growth of 4.6%.. Intermediate goods marginally moved up to 0.2% while basic goods
performed well and posted higher growth.
Used Based Weight Nov 11(%) Oct 11(%) Nov 10(%) Apr‐Nov’11
Basic Goods 45.68 6.3 1.3 5.7 6.2
Capital Goods 8.83 (4.6) (26.4) 25.7 (1.0)
Intermediate Goods 15.69 0.2 (7.8) 4.3 (0.3)
Consumer Goods 29.81 13.1 0.2 0.7 4.9
Outlook:
The current IIP data is better than market expectation and shows a significant improvement over last
month’s contraction of 4.7%. The IIP growth has been tepid so far and stands at 3.8% for the April‐
November period which is very low as compared to the FY11 figure of 8.3%. With RBI acknowledging
increased downside risks to growth in last monetary policy review, the WPI inflation data would
provide clear direction to where RBI would be heading in the next monetary policy review on 24th Jan,
2012. However, with global uncertainty looming large and commodity prices not showing any sign of
reprieve, a cut of 25 bps in the benchmark rate looks likely.
Annual MF Booklet for the period ended December 31, 2011 Page 15
Central Statistical Organisation (CSO) has released the quarterly GDP numbers for Q2 FY12. The
estimates have been compiled using the new series of Index of IIP with base year of 2004‐05.
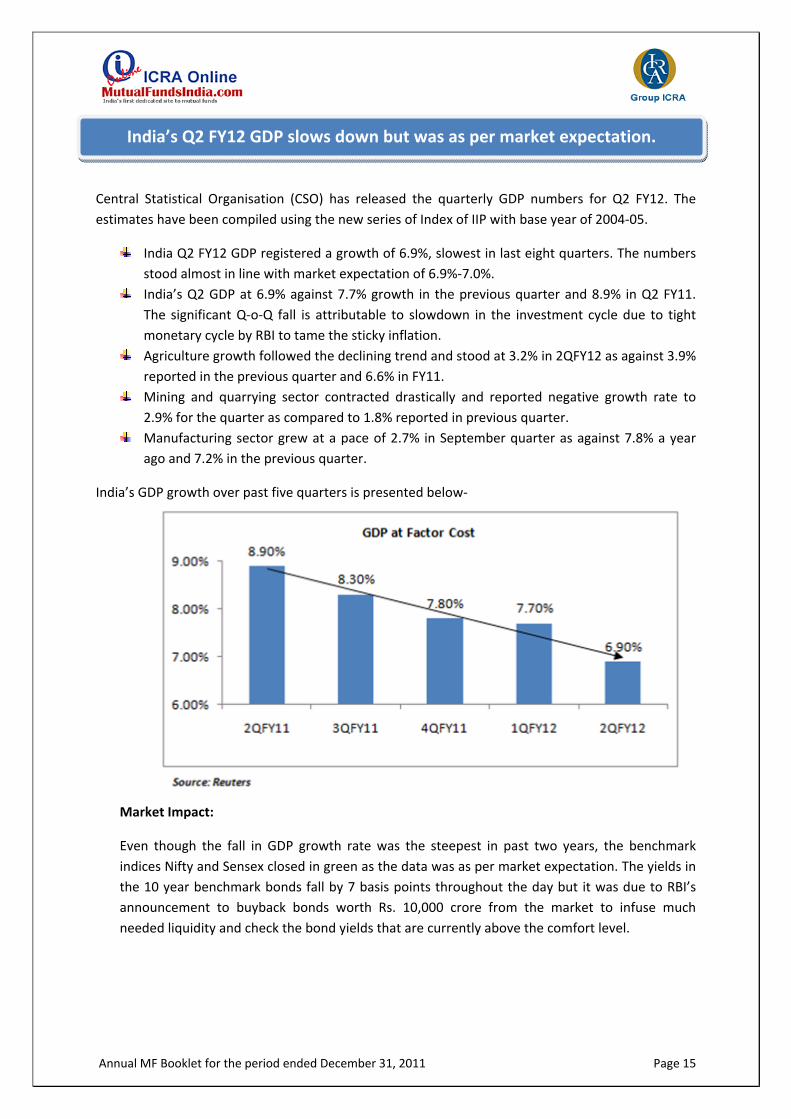
India Q2 FY12 GDP registered a growth of 6.9%, slowest in last eight quarters. The numbers
stood almost in line with market expectation of 6.9%‐7.0%.
India’s Q2 GDP at 6.9% against 7.7% growth in the previous quarter and 8.9% in Q2 FY11.
The significant Q‐o‐Q fall is attributable to slowdown in the investment cycle due to tight
monetary cycle by RBI to tame the sticky inflation.
Agriculture growth followed the declining trend and stood at 3.2% in 2QFY12 as against 3.9%
reported in the previous quarter and 6.6% in FY11.
Mining and quarrying sector contracted drastically and reported negative growth rate to
2.9% for the quarter as compared to 1.8% reported in previous quarter.
Manufacturing sector grew at a pace of 2.7% in September quarter as against 7.8% a year
ago and 7.2% in the previous quarter.
India’s GDP growth over past five quarters is presented below‐
Market Impact:
Even though the fall in GDP growth rate was the steepest in past two years, the benchmark
indices Nifty and Sensex closed in green as the data was as per market expectation. The yields in
the 10 year benchmark bonds fall by 7 basis points throughout the day but it was due to RBI’s
announcement to buyback bonds worth Rs. 10,000 crore from the market to infuse much
needed liquidity and check the bond yields that are currently above the comfort level.
India’s Q2 FY12 GDP slows down but was as per market expectation.
Annual MF Booklet for the period ended December 31, 2011 Page 16
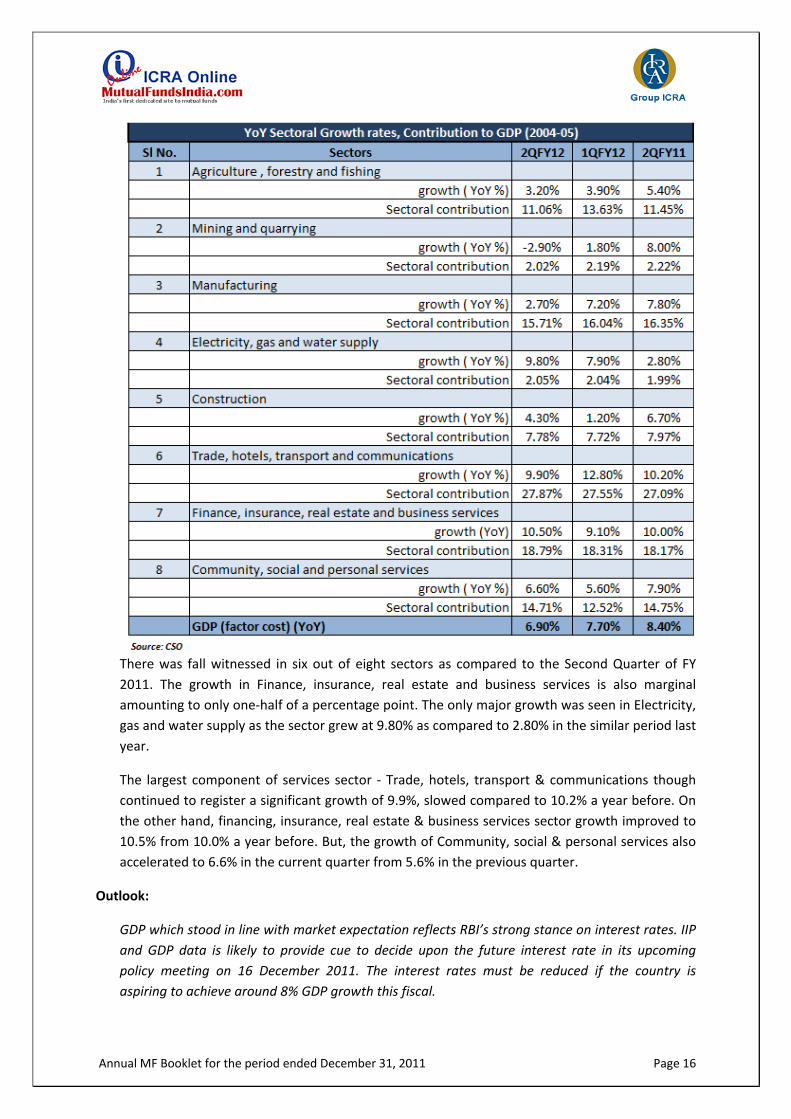
There was fall witnessed in six out of eight sectors as compared to the Second Quarter of FY
2011. The growth in Finance, insurance, real estate and business services is also marginal
amounting to only one‐half of a percentage point. The only major growth was seen in Electricity,
gas and water supply as the sector grew at 9.80% as compared to 2.80% in the similar period last
year.
The largest component of services sector ‐ Trade, hotels, transport & communications though
continued to register a significant growth of 9.9%, slowed compared to 10.2% a year before. On
the other hand, financing, insurance, real estate & business services sector growth improved to
10.5% from 10.0% a year before. But, the growth of Community, social & personal services also
accelerated to 6.6% in the current quarter from 5.6% in the previous quarter.
Outlook:
GDP which stood in line with market expectation reflects RBI’s strong stance on interest rates. IIP
and GDP data is likely to provide cue to decide upon the future interest rate in its upcoming
policy meeting on 16 December 2011. The interest rates must be reduced if the country is
aspiring to achieve around 8% GDP growth this fiscal.

Annual MF Booklet for the period ended December 31, 2011 Page 17
The month end Assets Under
Management (AUM) of the Indian
mutual fund industry has
witnessed a decline of 2.38% to
Rs. 6,11,402 crore (as per AMFI
monthly data) as compared to
last year’s figure of Rs. 6,26,314
crore. The month end AUM stood
at its peak in the month of April
2011, which rose by 32.61% at Rs.
7,85,374 crore, on account of
eased liquidity conditions in the market which paved the way for investors to park their money in
the liquid and income schemes.
Turbulence in the equity market over the course of the financial year subdued the investors’
sentiment that resulted in redemption pressure. The key benchmark index, BSE Sensex and S& P
Nifty fell by almost 25% in the calendar year 2011. Factors such as, tight liquidity condition, advance
tax outflows during the year also impacted the AUM.
The Indian Mutual Fund industry
comprised of 44 players, with
addition of 3 Asset Management
Companies (IIFL, India bulls and
Union KBC) in the year 2011. The
average asset under management
(AUM) of Indian mutual fund
industry during Oct‐Dec 2011
witnessed a marginal surge of
0.91% on Y‐o‐Y basis. The overall
quarterly average AUM of 44 fund
houses stood at Rs. 6,81,707.72 at the end of Oct‐Dec 2011 as compared to Rs. 6,75,578.84 crore
corresponding period last year (Excluding fund of funds).
On Y‐o‐Y basis, AMC’s like Daiwa, IDBI, Edelweiss and Deutsche more than doubled their AUM, while
the AUM of LIC Nomura and Bharti AXA AUM plunged by 66.7% and 60.9%, respectively. On the
AMC’s AUM front, HDFC Mutual fund topped the chart followed by Reliance Mutual Fund with AUM
of Rs. 88,628.03 and Rs. 82,305.81 crore, respectively. Despite being largest on the AUM front,
HDFC MF surged marginally by 0.85%, while Reliance MF fell drastically by 19.36%. Amongst the top
5 AMCs, ICICI Prudential Mutual Fund and Birla Sun Life Mutual Fund were the major gainers as their
average assets rose by 5.4% and 4.7%, respectively.
INDUSTRY OVERVIEW

Annual MF Booklet for the period ended December 31, 2011 Page 18
Interestingly, AMC with lower AUM have scored better than the bigger players. For instance, Sahara
Mutual Fund, Quantum Mutual Fund and Mirae Asset Mutual Fund with lower asset base have
grown up by 49%, 48% and 28% respectively.
The AUM of liquid funds stood at
Rs. 1, 20,713 crore up from Rs.
88,681 crore, Y‐o‐Y basis (ending
December 2011). It has surged by
36.12% as banks and corporates
reinvested into liquid schemes
which were withdrawn to meet
their half yearly advance tax
commitments. Income funds
witnessed marginal rise of 0.21%
in AUM Y‐o‐Y basis. Gilt category
witnessed fall in their AUM by 23.93%. However, gilt schemes are likely to perform well going
forward as interest rates in India tend to move southward. The view was with respect to recent RBI’s
decision to maintain key interest rates steady and further indication in reversal to interest rate cycle.
Capital outflows, lack of policy developments, combined with global economic uncertainties hurt
overall market sentiments. The rollback of FDI on retail coupled with more political figures drawn
into the 2G scam drove the markets down. Sensex and Nifty fell around 25%, year on year (ending
December 2011). The AUM of equity schemes (including ELSS) followed the markets by registering a
20% decline. Also, there was no respite for balance scheme as its AUM too declined by 25%.
The recent launch of gold fund of fund (FoF) schemes by various AMCs has been one of the reasons
for the increase in the AUM. Also, uncertainty in the equity market has pushed investor’s interest to
invest in less risky assets class like gold via ETF route. The AUM of Gold ETF has jumped 160% from
Rs 3,516 crore in December 2010 to Rs 9,153 crore in December 2011.
2012 could see the return of interest in equity funds as markets are expected to respond positively
to policy actions like rate cuts. The funds can also benefit from gradual improvement in confidence
due to policy actions aimed to mitigate concerns emerging out of the euro zone debt crisis. Expected
easing of monetary policy in other emerging markets is also expected to add to the positive
sentiments. We could also see more Wealth Management firms taking the MF route to ensure the
PMS money stay with them as the regulator has hiked the minimum investment amounts for PMS.
Debt funds could witness enhanced interest due to expectation of rate cuts over the short term
which will result in better risk adjusted returns for investors. The tight government fiscals could
however limit the upside over the short term. There is a distinct possibility of FMPs also remaining
attractive in the short term. The recent ruling of reducing the marked to market window from 90
days to 60 days and that all securities in the liquid schemes be valued could ensure that investors
with a longer term investment horizon stand to benefit.
Gold ETFs might witness slight loss of steam due to lower likelihood of 2012 being a repeat of 2011
in terms of spectacular returns that gold provided. A possible reason for gold losing steam is the

Annual MF Booklet for the period ended December 31, 2011 Page 19
increasing feeling of comfort which could be generated by lower inflation numbers and anticipation
of positive policy action especially on the monetary front, increasing the attractiveness of other
asset classes. Another possible reason for a slight cooling down of performance is the fact that
upside gained from gold could increasingly be looked at as collateral to cover for downsides in other
asset classes.

Annual MF Booklet for the period ended December 31, 2011 Page 20
‐800
‐600
‐400
‐200
0
200
400
600
800
0
1000
2000
3000
4000
5000
6000
7000
Jan‐11
Feb‐11
Mar‐11
Apr‐11
May‐11
Jun‐11
Jul‐11
Aug‐11
Sep‐11
Oct‐11
Nov‐11
Dec‐11
S&P Nifty MF Daily Net Investment
S&P Nifty
MF Daily Net Investm
ent (Rs. Crore)
Source: MFI Explorer
After posting a smart recovery
post‐ 2008 crisis, when the equity
market surged 71% in 2009 and
17% in 2010, 2011 was the year of
return to terra firma. High
inflation, growth slowdown, rising
interest rates, political blockage
over retail foreign direct
investments, weakening rupee and
emergence of various industry
related scams provided enough
reasons for equity markets to stay subdued. The benchmark Sensex fell approximately 25% since the
beginning of the year, the second worst annual performance in its history. On the global front, Euro
zone debt crisis, down grade of several European nations by international credit rating agencies and
S&P lowering outlook on US sovereign debt also weighed on domestic market sentiment. The
following graph depicts the movements of BSE Sensex and MF Daily net investment during the year.
The following are the major events which affected the Indian equity markets:
Inflation remained at the elevated levels in the year 2011:
India’s inflation was one of the biggest concerns for the year 2011 and the headline inflation,
measured by WPI remained consistently above 9% throughout 2011 – touching a high of 9.78% in
August 2011. To curb inflation, the Reserve Bank of India (RBI) increased key policy rates 13 times
since March 2010. However, in its recent Mid‐Quarterly Review of Monetary Policy which was held
on December 16, 2011, the RBI took a pause in hiking interest rates and kept the rates unchanged.
Index of Industrial Production (IIP) fell drastically in 2011:
The IIP growth in October fell for the first time on M‐o‐M basis since 28 months due to falling
consumer demand and declining corporate investments. The October IIP moved to negative territory
and came at 5.1%, the worst fall since March 2009.
Gross Domestic Product (GDP):
India’s Gross Domestic Product for July‐September quarter (Q2) declined to 6.9% compared with
7.7% in the first quarter. This was the slowest growth in nine quarters. Rising inflation combined
with global uncertainties was the major cause for the slowdown. The GDP growth of India was
revised down to 7.6 % for the FY 12 by RBI.
EQUITY MARKET OVERVIEW

Annual MF Booklet for the period ended December 31, 2011 Page 21
Indian Currency Depreciation:
The Indian rupee was the worst performing currency in Asia. The rupee saw a record fall of Rs. 54.17
per USD breaking the 54 level for the first time in history.
Global uncertainties led foreign investors to turn away from the Indian market leading to a constant
foreign capital outflow. This has reduced the demand for the Indian currency as compared to other
currencies. The FIIs were net sellers this year pulling out their positions. Also increasing concerns
about domestic economy, negative growth in industrial output recently, sl owing GDP, rising
inflation, and high borrowing costs have been major reasons for the Rupee’s deterioration.
Recently, The RBI and the government took certain measures to support the rupee. The RBI sold
dollars and bought rupees in the last few of months. The government was doing its best in launching
reforms in various sectors in order to boost the economy.
Seven rate hikes were implemented
by the Reserve Bank of India in
2011. This followed six in 2010, in
an attempt to control inflation.
Presently, with inflation slowing,
RBI has signaled the end of the
monetary tightening by hitting the
pause button in December. The
markets will be looking forward to a
few rate cuts in 2012.
On the sector front, FMCG was the only sector
which has delivered positive returns and
emerged as a clear winner during the year.
Despite the fact that, inflation rates hurt the
margins of the companies in the sector, yet, the
consumption story remained intact. However,
the biggest loser was the realty sector which
dropped to nearly 52%. The stock prices in the
sector were largely affected because of
increased debt burdens and rising interest rates.

Annual MF Booklet for the period ended December 31, 2011 Page 22
Global Sentiments:
On the Global front, 2011 was a year that witnessed huge unrest due to financial and political crisis
in majority parts of the world. 2011 got off to a good start for investors as most equity markets
extended 2010’s magnificent gains. However, the markets suffered severe turbulence as natural
disasters afflicted Japan (earthquake and tsunami), while Middle East and North Africa witnessed
political crisis which pushed the markets into a panic mode.
Moreover the Sovereign debt crisis in Europe took the centre stage in pulling the world markets
down. Rising government debt levels and a series of downgrading of government debts made it
difficult for countries like Greece, Portugal and Ireland to finance their debt.
In August, Standard & Poor downgraded the U.S sovereign rating from AAA to AA+ and kept the
outlook at “negative”, this news affected the markets badly. In October 2011 Euro zone leaders
agreed on a package of measures designed to prevent the collapse of peer economies. This included
an agreement with banks to accept a 50% write‐off of Greek debt owed to private creditors,
increasing the EFSF to about 1 trillion euros, and requiring European banks to achieve 9%
capitalization. The promise of a new treaty was not enough to create confidence among investors in
the solidarity of the EU or the European banking system. For that reason the recovery of world
markets did not come through.
Outlook:
Year 2011 was a troublesome year for the Indian equity markets due to stubborn inflation, lack of
reforms, volatility in currency market and this was further heightened by the euro zone debt crisis
leading to a more than 25% decline in Indian equity markets. With weekly food inflation falling to
0.42% in the middle of December from a high of 11.43% in October, RBI has some comfort on the
inflation front. It is expected that RBI will cut policy rates soon. Strong policy decisions and possible
resolution of the euro zone debt crisis could make India an attractive investment economy which may
attract FII investments making the rupee stronger. Post the state elections hopefully Central
government will push reforms more decisively. Inflation, in the longer run is expected to moderate to
levels of around 5%.
Beaten down sectors like Realty, Banking, Capital Goods, Infrastructure and Auto space will be the
core sectors that will be in focus once the economy starts recovering. The next approaching market
determinant would be the upcoming budget for the year 2012. Domestically, the Indian economy
could spot relief in terms of interest rate cuts and lower inflation while higher fiscal
deficit, currency volatility and crude oil could still affect our economic growth.
It is expected that weakening global scenario, economic uncertainty and risk aversion is apparent to
keep gold demand high. The global economic condition is still very weak, and the risks of a renewed
recession in the advanced economies accelerating into a prevalent financial crisis cannot be
completely ruled out.
Annual MF Booklet for the period ended December 31, 2011 Page 23
SHOULD ONE ONLY INVEST IN LARGE CAP STOCKS?
In this article, we are trying to analyze the environment which would be suitable for investments in
large cap and that these are funds for investment for a longer period. Large cap funds are known to
offer better protection to investors in the downturn as well as to build corpus over longer period.
For the purpose of clarity we have trifurcated the articles into ‐
Meaning and significance of large cap stocks?
Classification base on Market capitalization.
Performance of large cap funds.
Large cap stocks exhibit a higher degree of certainty of returns vis‐a‐vis any other capitalization.
Such companies have a reputation for consistency and stability built on a long‐standing track record.
Large caps are well‐researched as information on them is widely available, so there are relatively
fewer surprises for investors. These stocks are the first ones to benefit in a recovering market. Given
below is a comparative table of Large‐cap, mid‐cap and small‐cap companies.
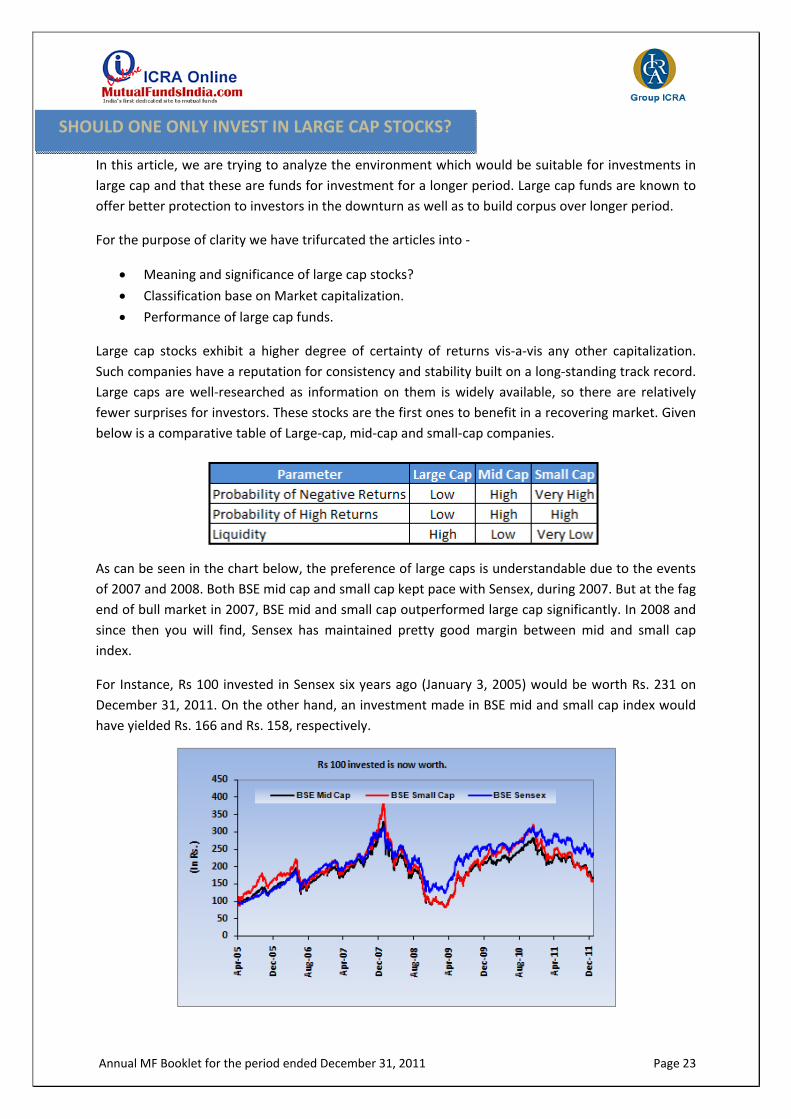
As can be seen in the chart below, the preference of large caps is understandable due to the events
of 2007 and 2008. Both BSE mid cap and small cap kept pace with Sensex, during 2007. But at the fag
end of bull market in 2007, BSE mid and small cap outperformed large cap significantly. In 2008 and
since then you will find, Sensex has maintained pretty good margin between mid and small cap
index.
For Instance, Rs 100 invested in Sensex six years ago (January 3, 2005) would be worth Rs. 231 on
December 31, 2011. On the other hand, an investment made in BSE mid and small cap index would
have yielded Rs. 166 and Rs. 158, respectively.

Annual MF Booklet for the period ended December 31, 2011 Page 24
Of the 214, equity diversified growth
scheme (open ended), we have
considered 46 schemes with an existence
for ten years and more. Out of 46, we
have picked schemes with quarterly
average AUM (December 2011) more
than Rs 1000 crore.
The key trend is that the list of top
performer is majorly dominated by
schemes that focus on large cap stocks,
HDFC Top 200, HDFC equity, Reliance
Growth and Franklin Bluechip. On the
performance front as on the asset front,
these schemes have outpaced Sensex and
Nifty by significant margin. Interestingly,
82% of the schemes have outpaced the key benchmark index. A few funds in the list also have a
flexi‐cap approach and move between mid‐ and large‐cap stocks.
2011, was a disappointing year as
equity market failed to cherish
investors at large. Concerns of a
global economic slowdown,
coupled with escalating worries
within the Eurozone kept the Indian
markets uncertain and
apprehensive about what is going
to happen during the year.
Domestically, the moderation in
economic data and downgrade in
corporate earnings also put
pressure on bourses. However,
there was much relief for investors in large cap space. Large cap counters fell less than their mid cap
counterparts during the year ended on December 2011. Sensex lost 25% during the year, while BSE
Mid cap and BSE Small cap lost, 34% and 43%, respectively.
Similarly, in 2006 and 2008, we can witnessed similar trend as large cap category lost less as
compared to mid and small cap category. Despite the category lagged to beat mid and small cap in
rising market (2007 and 2009); it has outperformed Sensex and Nifty.
Large cap category is known to offer better protection to investors in the downturn but there are
exceptions to the rule. More aggressive racy investors might find themselves dissatisfied with
returns delivered as these schemes may not appear in the top slot when market recovery sharply.
Annual MF Booklet for the period ended December 31, 2011 Page 25
DEBT MARKET OVERVIEW
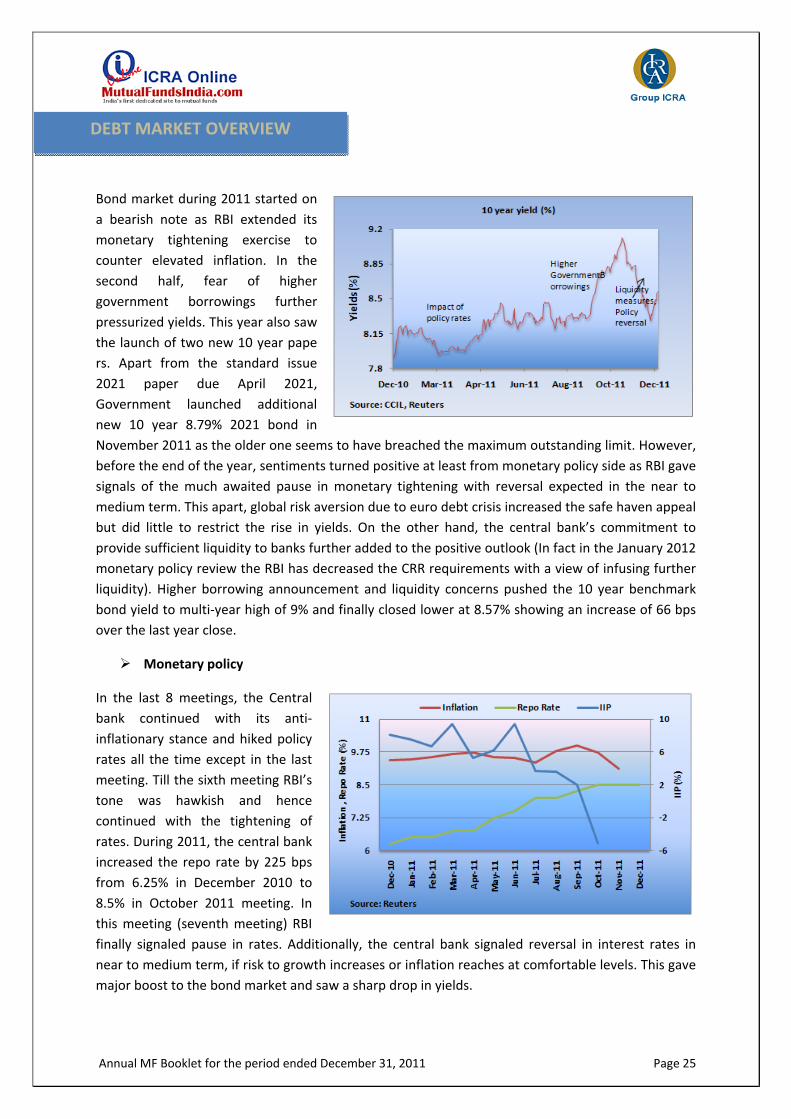
Bond market during 2011 started on
a bearish note as RBI extended its
monetary tightening exercise to
counter elevated inflation. In the
second half, fear of higher
government borrowings further
pressurized yields. This year also saw
the launch of two new 10 year pape
rs. Apart from the standard issue
2021 paper due April 2021,
Government launched additional
new 10 year 8.79% 2021 bond in
November 2011 as the older one seems to have breached the maximum outstanding limit. However,
before the end of the year, sentiments turned positive at least from monetary policy side as RBI gave
signals of the much awaited pause in monetary tightening with reversal expected in the near to
medium term. This apart, global risk aversion due to euro debt crisis increased the safe haven appeal
but did little to restrict the rise in yields. On the other hand, the central bank’s commitment to
provide sufficient liquidity to banks further added to the positive outlook (In fact in the January 2012
monetary policy review the RBI has decreased the CRR requirements with a view of infusing further
liquidity). Higher borrowing announcement and liquidity concerns pushed the 10 year benchmark
bond yield to multi‐year high of 9% and finally closed lower at 8.57% showing an increase of 66 bps
over the last year close.
Monetary policy
In the last 8 meetings, the Central
bank continued with its anti‐
inflationary stance and hiked policy
rates all the time except in the last
meeting. Till the sixth meeting RBI’s
tone was hawkish and hence
continued with the tightening of
rates. During 2011, the central bank
increased the repo rate by 225 bps
from 6.25% in December 2010 to
8.5% in October 2011 meeting. In
this meeting (seventh meeting) RBI
finally signaled pause in rates. Additionally, the central bank signaled reversal in interest rates in
near to medium term, if risk to growth increases or inflation reaches at comfortable levels. This gave
major boost to the bond market and saw a sharp drop in yields.

Annual MF Booklet for the period ended December 31, 2011 Page 26
Government Borrowing
Other major factor that affected the
market adversely and still remains a
major concern is higher fiscal deficit
due to limited revenue collections
emanating from slowdown and
higher expenditure due to increasing
subsidy burden. Initially, the
announcement of lower than
expected government borrowing
program in the Union budget gave a
strong boost to the bond market.
The market borrowings was estimated (net) at Rs 3.43 lakh crore for the FY11‐12 and came lower
than market expectations, despite the hike in social spending. In the absence of one‐time revenue
items such as 3G collections, etc., which had boosted government finances in FY10‐11, the target
seemed tough. The auctions in the first half till June 2011 were conducted smoothly. It was in the
second half of FY11‐12 when the government announced higher than the budgeted borrowings. The
major reasons were slippages in expenditure management and inability to generate commensurate
revenue. The Government planned to borrow Rs 2.2 lakh crore in the second half (October to March)
of FY12, which is significantly higher than the estimated balance gross borrowing of Rs 1.67 lakh
crore. Thereafter, an extra borrowing of Rs 52,872 crore was announced in September 2011. The
upward revision was mainly due to compensate shortfalls from small savings products. Lastly, the
announcement of revised extra borrowing of Rs 40,000 crore for the fourth quarter increased the
concerns over the demand of bond auctions. FII investment limits in corporate and government
bonds were enhanced by $5 billion each the auction for which was fully bid and allotted successfully.
Liquidity analysis
During the year, the average liquidity
deficit situation remained below the
RBI comfortable zone of Rs 60,000
crore. The average daily borrowings
by banks through liquidity
adjustment facility (LAF) stood at Rs
56,838 crore. Liquidity situation
remained comfortable for all three
quarters barring the usual advance
tax period. The last two months,
particularly December saw highest
infusion by RBI due to advance tax outflows, loan slippages (loan restructuring ) and higher
borrowings. Demand for liquidity was also noticed in the call money market as the overnight call
rates crossed 9.5% in December. Looking at the tight liquidity in the third quarter, RBI conducted 5
open market operations (OMO) since 24 November 2011. From the target ceiling of Rs 52,000 crore,
RBI bought Rs 41,210.83 crore worth of bonds. This helped to bring down the liquidity deficit to

Annual MF Booklet for the period ended December 31, 2011 Page 27
some extent. RBI gave assurances of conducting OMO’s in the fourth quarter positively affected the
sentiments.
Macroeconomic Indicators
India’s economic growth continues to slide due to rising interest rates and higher raw global
commodity prices. GDP growth rate dropped to 6.9% in September quarter against 8.6% in the last
year. Buoyancy in service sector helped to push the growth near to 7%. Industrial productivity (IIP)
growth turned negative to 5.10% in October 2011 from a positive of 11.36% in the corresponding
month last year. The major reason for the drop was drastic decline in investment activity and
sluggish manufacturing growth. On the other hand WPI inflation remained elevated at 9.11% in
November 2011 as compared to 8.20% in the corresponding month last year.
Spread analysis
Both Government (Gilt) and
corporate bond yields increased
across maturities. In Gilt, major
change in yields was witnessed in the
1 to 10 years maturity range. In
corporate bond, except one year
maturity all other maturities saw an
average increase of 54 bps. As the
upward movement in gilt was higher
than corporate bond, the spread
contracted in many of the maturities.
Highest contraction was seen in 1 year paper while 4 year maturity saw marginal expansion of 8 bps
over the corresponding last year spread.
Outlook
Inflation
Higher base effect and the benefit of good harvest resulted in a significant drop in food and non‐food
inflation. This helped to lower WPI inflation to some extent and extended in December. Further drop
in inflation is expected to happen if manufacturing prices (highest weight) drop in the coming months
coupled with favorable base effect.
Government Borrowings
After the revised borrowings and comments from the finance minister, achieving fiscal deficit to GDP
target of 4.6% now seems to be out of sight. Practically, the fiscal deficit target could remain in the
range of 5% to 5.5% if appropriate measures are taken to increase revenues in the fourth quarter.
Otherwise, 5.5% will not be surprising.

Annual MF Booklet for the period ended December 31, 2011 Page 28
Money Supply
RBI is expected continue to provide required liquidity in the banking system through liquidity
adjustment facility (LAF) window up to 1% of NDTL (net demand and time liabilities). Liquidity deficit
could remain above the comfortable zone (Rs 60,000 core) of RBI at least in the fourth quarter.
Significant hike in NRE deposits could provide some relief in the banking system. This apart, RBI’s
commitment to hold open market operations (OMO) will ensure liquidity for smooth running of the
bond auctions.
Foreign Exchange
After making a new all‐time low, further weakening in INR against dollar looks unlikely. It could
remain range‐bound between Rs 48‐50 to the USD for some time. The combination of enhanced NRE
deposits, FII investment in g‐sec in December and higher oil imports kept the currency range‐bound.
Historically it is seen that this level is very attractive for foreign investors to invest in the Indian
market.
RBI Policy
In the last monetary policy, the central bank indicated reversal in policy actions if risk to growth
increases. RBI also stated that inflation is moving in line with the projection. Looking at the rebound
in infrastructure productivity during November and jump in HSBC PMI manufacturing index for
December it seems that RBI will unchanged its rates on 26 January 2012. The start of reversal in
interest rate cycle looks possible in the next fiscal year only.
To conclude we could see a much better 2012 for investors with an upside of possible reversal in
interest rates movement. The major downside trigger could be the ballooning fiscal deficit, with the
government throwing the towel with respect to its FRBM targets.
Annual MF Booklet for the period ended December 31, 2011 Page 29
IMPACT OF INTEREST RATES ON DEBT ORIENTED MUTUAL FUNDS
Reserve Bank of India has raised benchmark rates thirteen times since March 2010 to control
inflation and now, since it is below 7.50 per cent; there is stiff competition between two most
anticipated events, on the one hand there is Sachin’s hundredth century and on the other hand the
moment when rates begin downward trajectory. (At least we are certain that there would be no rate
hike; for the maestro’s century we might have to wait for some more time). But the question is –
should a retail investor be so worried about the interest rate fluctuations and does it makes sense to
continuously monitor the Central bank and its frequent monetary policy statements?
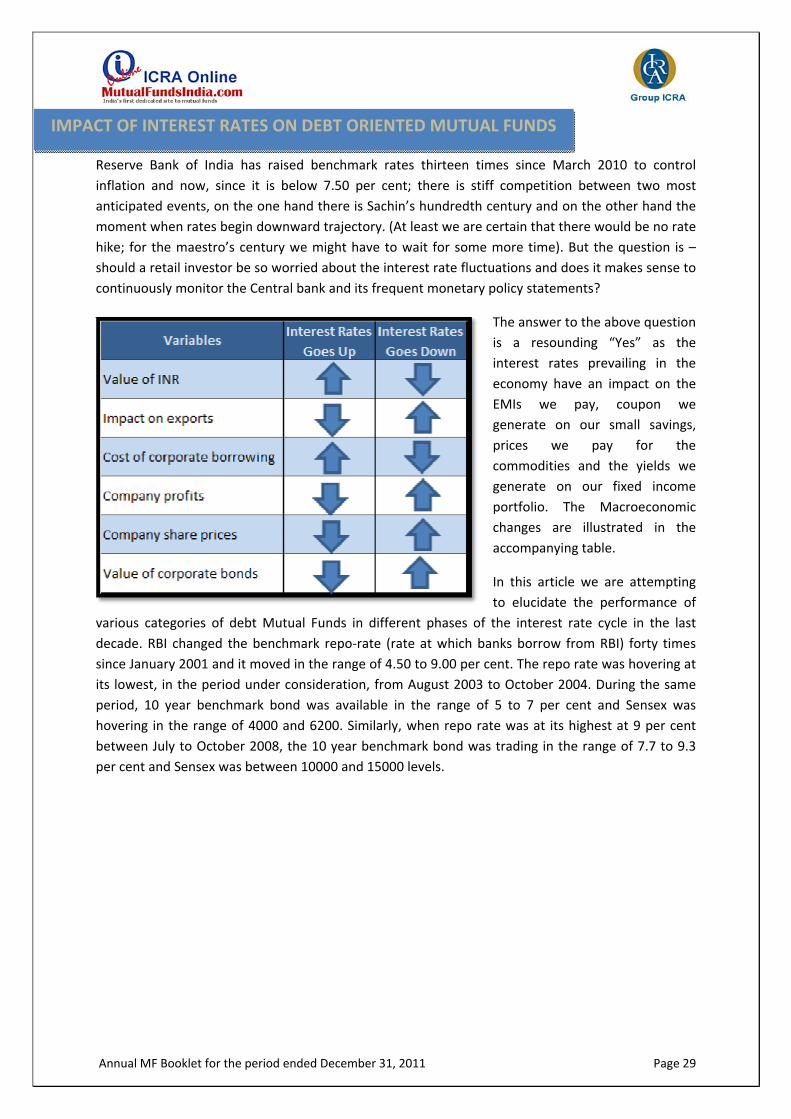
The answer to the above question
is a resounding “Yes” as the
interest rates prevailing in the
economy have an impact on the
EMIs we pay, coupon we
generate on our small savings,
prices we pay for the
commodities and the yields we
generate on our fixed income
portfolio. The Macroeconomic
changes are illustrated in the
accompanying table.
In this article we are attempting
to elucidate the performance of
various categories of debt Mutual Funds in different phases of the interest rate cycle in the last
decade. RBI changed the benchmark repo‐rate (rate at which banks borrow from RBI) forty times
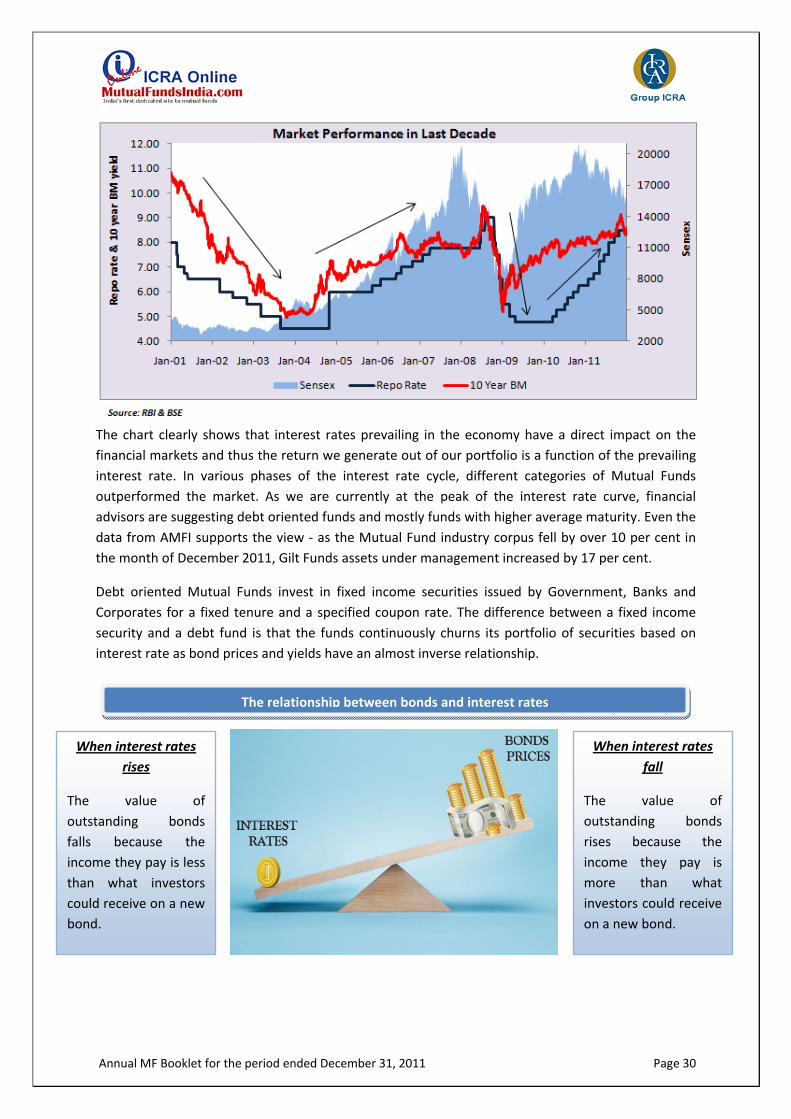
since January 2001 and it moved in the range of 4.50 to 9.00 per cent. The repo rate was hovering at
its lowest, in the period under consideration, from August 2003 to October 2004. During the same
period, 10 year benchmark bond was available in the range of 5 to 7 per cent and Sensex was
hovering in the range of 4000 and 6200. Similarly, when repo rate was at its highest at 9 per cent
between July to October 2008, the 10 year benchmark bond was trading in the range of 7.7 to 9.3
per cent and Sensex was between 10000 and 15000 levels.
Annual MF Booklet for the period ended December 31, 2011 Page 30
When interest rates
rises
The value of
outstanding bonds
falls because the
income they pay is less
than what investors
could receive on a new
bond.
When interest rates
fall
The value of
outstanding bonds
rises because the
income they pay is
more than what
investors could receive
on a new bond.
The chart clearly shows that interest rates prevailing in the economy have a direct impact on the
financial markets and thus the return we generate out of our portfolio is a function of the prevailing
interest rate. In various phases of the interest rate cycle, different categories of Mutual Funds
outperformed the market. As we are currently at the peak of the interest rate curve, financial
advisors are suggesting debt oriented funds and mostly funds with higher average maturity. Even the
data from AMFI supports the view ‐ as the Mutual Fund industry corpus fell by over 10 per cent in
the month of December 2011, Gilt Funds assets under management increased by 17 per cent.
Debt oriented Mutual Funds invest in fixed income securities issued by Government, Banks and
Corporates for a fixed tenure and a specified coupon rate. The difference between a fixed income
security and a debt fund is that the funds continuously churns its portfolio of securities based on
interest rate as bond prices and yields have an almost inverse relationship.
The relationship between bonds and interest rates

Annual MF Booklet for the period ended December 31, 2011 Page 31
Portfolio of debt oriented Mutual Funds for the last decade was studied in detail to look at the
change in the average maturity of a category in different phases of the interest rate cycle. It was
interesting to see that change of interest rate was more prominent in funds with higher average
maturity.
Gilt Funds are Mutual
Funds that primarily
invest in Government
securities. The first Gilt
Fund was set up in
December 1998 to
promote the retail
holding in Government
securities. Since then the
funds have shown
moderate growth and the
total asset under
management of Gilt
Funds as on Dec 2011 stood at around 0.5% of the industry corpus. In the last decade, the average
calendar year returns have been in the range of (‐) 5 per cent to 23 per cent whereas average
maturity has been in between 1000 to 3000 days. The funds have shown the strategy to increase
their average maturity in falling interest rate scenario.
Income Funds by definition emphasize on regular income rather than capital appreciation and hence
invest in fixed income
instruments issued by
Government, Banks and
Corporate. The average
annual yield of the
category has been in the
range of 1 to 17 per cent
between 2001 and 2011.
The yield was lowest in
the calendar year 2004
when benchmark repo
rate was hovering at
around 4.50 per cent. The category has been witnessing net out flows for the last couple of months
due to unfavorable market conditions. The total asset under management of Income Funds as on
Dec 2011 stood at 48.84% of the industry corpus. In the last decade, the average maturity has
ranged between 700 to 2300 days.
Source: MFI Explorer
Source: MFI Explorer

Annual MF Booklet for the period ended December 31, 2011 Page 32
Liquid & Ultra Short Term Funds are the categories that are mostly used for parking surplus cash by
corporate. The difference between the two categories is mostly in the calculation of NAV and the
way they are taxed. There is no MTM (mark to market) component in liquid funds and thus this
category shows the least volatility. Fund Managers by mandate can only invest in securities of
residual maturity of 91 days whereas in Ultra Short Term funds they can invest in securities of higher
maturity. However, Fund Managers rarely increase the residual maturity of portfolio as the category
is used for “capital protection” and “return optimization”.
The average yearly return of Liquid Funds has been in the range of 3.5 to 7.0 per cent whereas for
Ultra Short Term Fund, the return was obviously higher in the range of 3.5 to 10.5 per cent. The
average residual maturity of liquid funds was between 40‐50 days in the last three calendar years
whereas for Ultra Short Term it was in the range of 70‐140 days.
Investors can adopt various strategies in rising and falling interest rate scenario to generate
maximum returns. Some of the strategies could be –
Laddering – It is the best strategy for those who invest in individual bonds as it is helpful in
any kind of interest rate environment. This strategy basically tells to buy bonds that mature
at various points in time. It provides steady cash flows and can be customized to suit a
particular investor.
Buy/Sell Premium/Discount bonds – Bonds that are issued at premium are issued at higher
yields as higher coupon compensates for the lesser maturity value of the bond. Premium
bonds provide advantage in the rising interest rate scenario as they tend to lose less value
compared to other bonds.
Investment in Mutual Funds ‐ In falling interest rate scenario investors can go long on
income and gilt funds as falling interest rate would translate into higher NAV. The impact
would be more on funds with higher average maturity as they are more sensitive to interest
rate changes.
Annual MF Booklet for the period ended December 31, 2011 Page 33
SMALL SAVINGS SCHEMES ‐ FROM FIXED INCOME OPTIONS TO A MARKET
LINKED PRODUCTS
The Government of India accepted almost all the recommendations of the committee formed to
review the various parameter of the National Small Savings Fund (NSSF). The committee was headed
by, the then, Deputy Governor of RBI Smt. Shyamala Gopinath. The terms of reference of the
Committee included review of the existing parameters for the small saving schemes in operation and
recommend mechanisms to make them more flexible and market linked.
Small savings schemes and Bank deposits have a crucial role in public finance, it forms a significant
part of the internal liabilities of the Central Government, and small savings are contractual savings of
the public, which are not part of the Consolidated Fund of India. The Government recently
announced an extra borrowing of Rs.53,000 crore from the market to make up for the shortfall in
small savings.
Let us examine each of the instruments one by one and see how an investor can take the maximum
benefit out of it –
Public Provident Fund
The panel has suggested a smart move by increasing the amount by Rs. 30,000 per annum as mere
changing the interest rate would not have resulted in increasing the small savings corpus for public
finance. Investors use this medium primarily for tax saving and building a corpus for retirement. It is
a very popular avenue as it is a risk‐free and tax‐free product that is also capable of generating
positive returns after accounting for inflation. Also, PPF enjoys the exempt‐exempt‐exempt or EEE
tax status. In other words, the contribution, accumulation and withdrawal are all tax‐exempt.
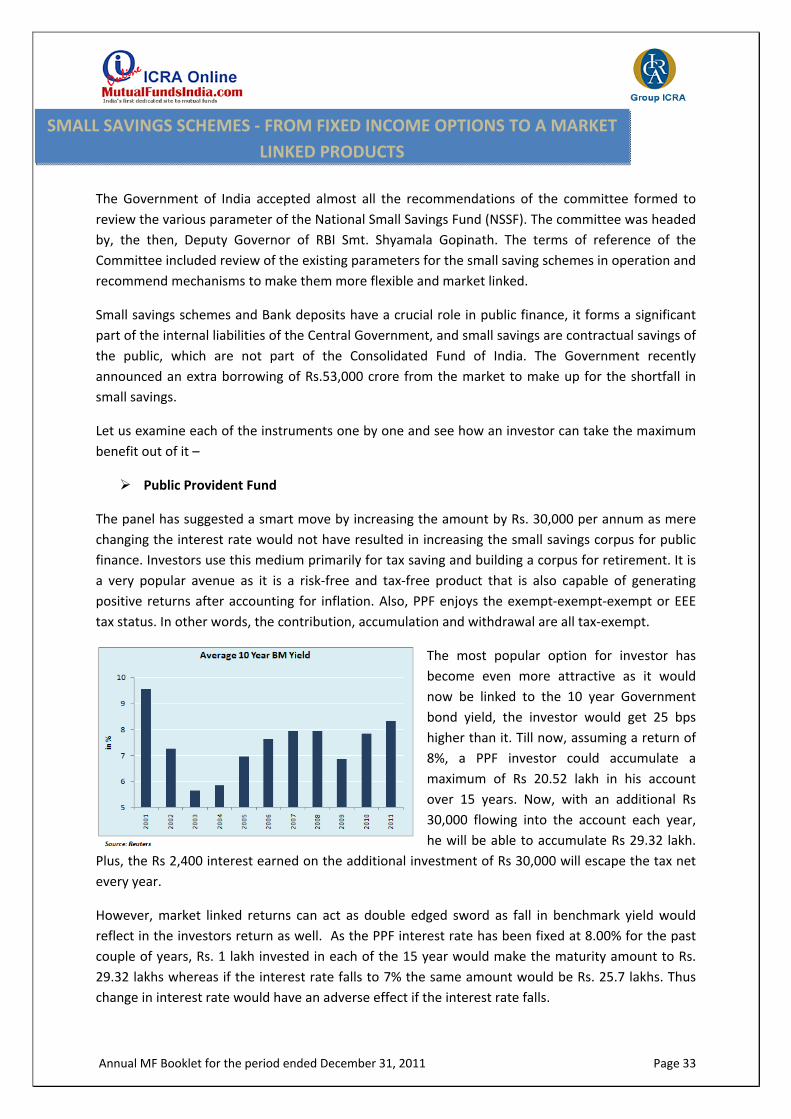
The most popular option for investor has
become even more attractive as it would
now be linked to the 10 year Government
bond yield, the investor would get 25 bps
higher than it. Till now, assuming a return of
8%, a PPF investor could accumulate a
maximum of Rs 20.52 lakh in his account
over 15 years. Now, with an additional Rs
30,000 flowing into the account each year,
he will be able to accumulate Rs 29.32 lakh.
Plus, the Rs 2,400 interest earned on the additional investment of Rs 30,000 will escape the tax net
every year.
However, market linked returns can act as double edged sword as fall in benchmark yield would
reflect in the investors return as well. As the PPF interest rate has been fixed at 8.00% for the past
couple of years, Rs. 1 lakh invested in each of the 15 year would make the maturity amount to Rs.
29.32 lakhs whereas if the interest rate falls to 7% the same amount would be Rs. 25.7 lakhs. Thus
change in interest rate would have an adverse effect if the interest rate falls.

Annual MF Booklet for the period ended December 31, 2011 Page 34
The investment is also eligible for tax deduction under Section 80C of the Income Tax Act as well as
under the Direct Tax Code. If we take into account the tax saved, the return is as high as 12.65% for
taxpayers with an annual income of over Rs 8 lakh. The only negative is that loans from the PPF will
now come at 2% instead of the earlier 1%.
National Savings Certificates (NSC)
It was one of the most popular investment vehicles in the past decade but with introduction of
Corporate Fixed Deposits and Fixed Maturity Plans offered by Mutual Funds, it has lost its sheen
among investors as well as agents. The investor gets higher return even from bank fixed deposit
these days. The Government has used a wise dual strategy of hiking interest rate as well as reducing
the tenure from six years to five years.
Advantages of investing in NSC are ‐
Interest earned every year from NSC is also eligible for tax deduction under section 80C.
The new 10 year NSC can be a good option as it is a new instrument being offered by
Government and is also offering an attractive spread of 50 bps above the 10 year benchmark
bond.
Disadvantages of investing in NSC are ‐
Yields are always less attractive in case of NSC as they get compounded half‐yearly whereas
bank deposits gets compounded quarterly.
Investment upto Rs. 1 lakh in a bank are insured against default.
Bank fixed deposits are more liquid as there is an exit option with a minimum penalty to take
advantage of the higher interest rate scenario.
Senior Citizens Savings Schemes (SCSS) and Post Office MIS
This instrument is mainly used by retired individual and hence protecting them against inflation
should be the prime concern. The spread of 100 basis points above the 5 year Government bond is
being offered to lure the investors.
Advantages of investing in SCSS are ‐
The spread of 100 basis points would act as a protection in the time of high inflation.
The cost of premature withdrawal is lower as compared to a bank.
Disadvantages of investing in SCSS are ‐
Yields for senior citizens in bank are higher as compared to the SCSS.
The tax advantage can change under the forthcoming Direct Tax Code.
The investors can consider other liquid options as debt funds of Mutual Funds like Short
Term bond funds as they are perfect in case of falling interest rate scenario.

Annual MF Booklet for the period ended December 31, 2011 Page 35
Kisan Vikas Patra
The scheme has been discontinued although it accounts for a large share of small savings. The
reason for discontinuation could lie in the nature of such schemes as it allowed free transferability,
no limit on total investment and absence of TDS on interest income thus investor could use it to park
unaccounted money and evade taxes.
Time Deposits and Savings Account
The scheme works like a normal savings and fixed deposit account in a bank. Even the interest rate
in the post office savings account has been raised by 50 bps.
Advantages ‐
Interest income upto Rs. 3,500 for a single account holder and Rs. 7,000 for joint account
holder is tax free
Minimum balance that needs to be maintained is just Rs. 500.
Disadvantages ‐
The interest rate is not as competitive as offered by other private sector banks.
There is no ATM or net banking facility in post office and hence an investor has to personally
visit for any transaction.
There are no other benefits as offered by banks such as debit cards, cash back schemes etc.
The returns offered by small savings schemes are not spectacular but an attempt has been made by
Government to make such schemes attractive and linking them with market returns to reward
investors as per the market scenario and also reduce its interest burden according to the overall
market. The move is not likely to benefit urban investors who have access to internet and other
modes of investments. However this move would have an impact on rural and semi‐urban
population provided there is effective marketing of the announcements.

Annual MF Booklet for the period ended December 31, 2011 Page 36
Not in living memory did currency movement attract such attention as the recent gyration of the
Indian rupee vs. various currencies in the latter half of 2011. From 01 August 2011 to 14 December,
Indian currency against dollar depreciated 21.64%. If we turn the clock back to the financial crisis in
2008, INR deprecated 29.46% from Rs 39.81 on 19 September 2007 to reach Rs 51.54 on 13 March
2009. In numerical terms, the year of 2007‐09 looks much worse than what happened in 2011.
However, it is the speed of depreciation that has become the headline grabber this time around. The
impact of a sharp movement in a very short period resulted in an unsavory situation due to its
import dependent and not an export driven economy.
The most important thing to look here is that depreciation increases the quantum of imports and
aggravates the impact on the current account and currency movement. Increasing interconnectivity
trades between countries and gaining importance of currency derivatives made the task very
difficult to predict the currency movement. The wide swings in the currency movement since last 5
years have increased the importance of hedging and speculative activities. Hence, it is of utmost
importance to look at some of the important factors, to understand how the currency movement is
driven by various factors.
Balance of Payment (BoP)
BoP is an accounting record of all monetary transactions between a country and the rest of the
world which includes payments for export and import of goods, services and financial transfer. The
BoP accounts summarize
international transactions for a
specific period, usually a year, and
are prepared in a single currency,
typically the domestic currency for
the country concerned. BoP
normally has two components, the
current account and the capital
account. Both current account
(exports minus imports) and
capital accoun t (foreign inflow
minus outflow) play a major role
in the movement of domestic currency.
Current Account
As India’s imports are higher than exports the current account has stayed in a deficit mode. Negative
current account always pressurizes the domestic currency to move southwards due to continuous
demand for external currency. Unlike current account which historically has been the major factor
for the currency movement, capital account became visible after significant movement of foreign
flows in the last decade.
FACTORS IMPACTING INDIAN CURRENCY
‐30
‐20
‐10
0
10
20
30
40
‐20
‐10
0
10
20
30
Sep‐02
Sep‐03
Sep‐04
Sep‐05
Sep‐06
Sep‐07
Sep‐08
Sep‐09
Sep‐10
Sep‐11
$ billion
$ billion
Current A/c Capital A/c BOP
Source: Reuters
Annual MF Booklet for the period ended December 31, 2011 Page 37
Capital Account
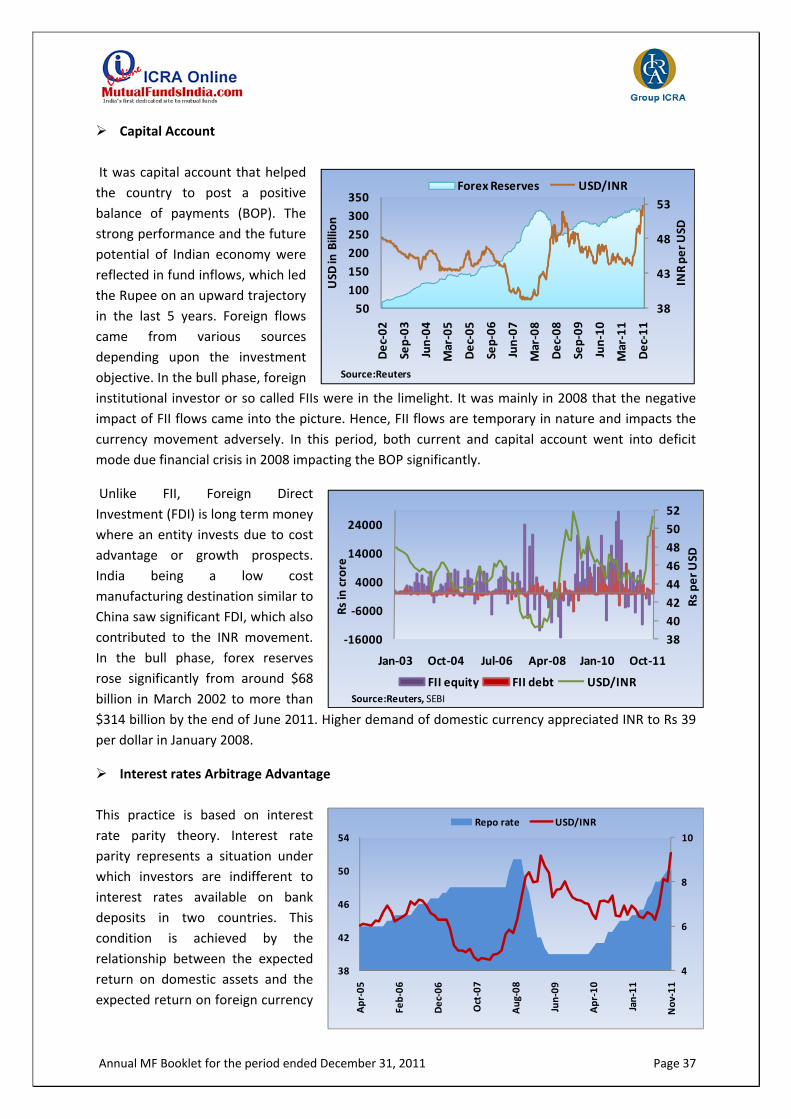
It was capital account that helped
the country to post a positive
balance of payments (BOP). The
strong performance and the future
potential of Indian economy were
reflected in fund inflows, which led
the Rupee on an upward trajectory
in the last 5 years. Foreign flows
came from various sources
depending upon the investment
objective. In the bull phase, foreign
institutional investor or so called FIIs were in the limelight. It was mainly in 2008 that the negative
impact of FII flows came into the picture. Hence, FII flows are temporary in nature and impacts the
currency movement adversely. In this period, both current and capital account went into deficit
mode due financial crisis in 2008 impacting the BOP significantly.
Unlike FII, Foreign Direct
Investment (FDI) is long term money
where an entity invests due to cost
advantage or growth prospects.
India being a low cost
manufacturing destination similar to
China saw significant FDI, which also
contributed to the INR movement.
In the bull phase, forex reserves
rose significantly from around $68
billion in March 2002 to more than
$314 billion by the end of June 2011. Higher demand of domestic currency appreciated INR to Rs 39
per dollar in January 2008.
Interest rates Arbitrage Advantage
This practice is based on interest
rate parity theory. Interest rate
parity represents a situation under
which investors are indifferent to
interest rates available on bank
deposits in two countries. This
condition is achieved by the
relationship between the expected
return on domestic assets and the
expected return on foreign currency
38
43
48
53
50
100
150
200
250
300
350
Dec‐02
Sep‐03
Jun‐04
Mar‐05
Dec‐05
Sep‐06
Jun‐07
Mar‐08
Dec‐08
Sep‐09
Jun‐10
Mar‐11
Dec‐11
INR per USD
USD
in Billion
Forex Reserves USD/INR
Source:Reuters
38
40
42
44
46
48
50
52
‐16000
‐6000
4000
14000
24000
Jan‐03 Oct‐04 Jul‐06 Apr‐08 Jan‐10 Oct‐11
Rs per USD
Rs in crore
FII equity FII debt USD/INRSource:Reuters, SEBI
4
6
8
10
38
42
46
50
54
Apr‐05
Feb‐06
Dec‐06
Oct‐07
Aug‐08
Jun‐09
Apr‐10
Jan‐11
Nov‐11
Repo rate USD/INR
Annual MF Booklet for the period ended December 31, 2011 Page 38
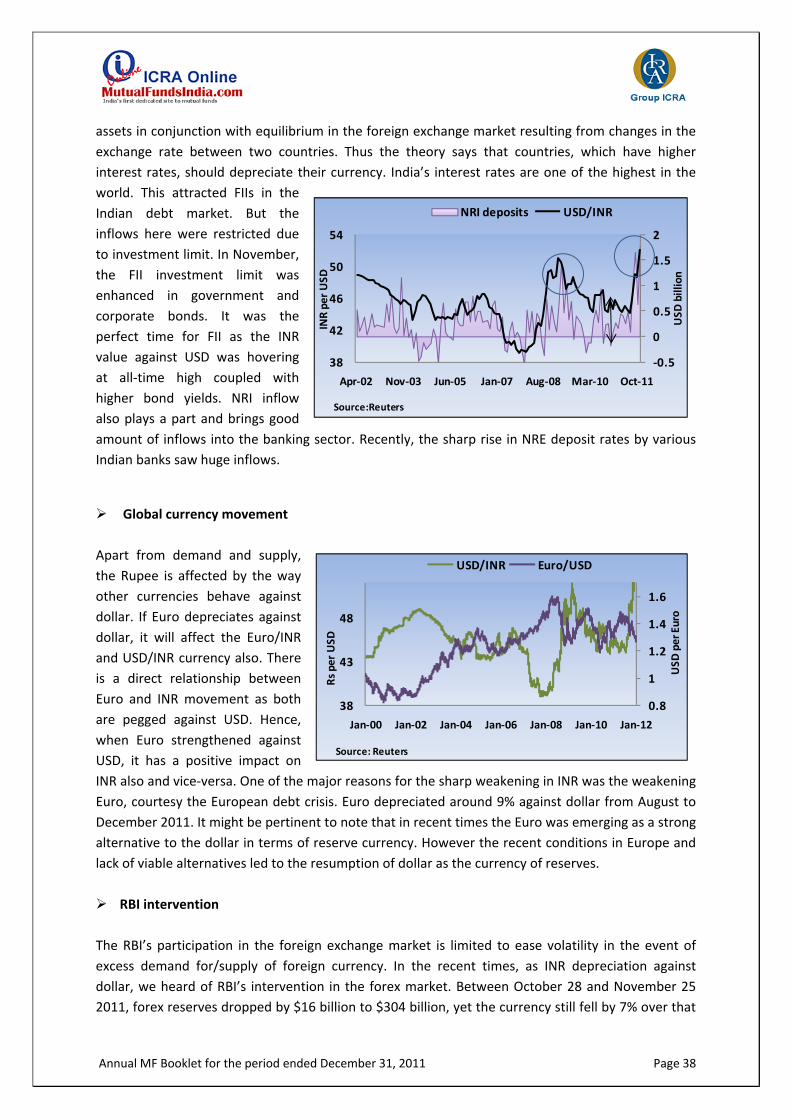
assets in conjunction with equilibrium in the foreign exchange market resulting from changes in the
exchange rate between two countries. Thus the theory says that countries, which have higher
interest rates, should depreciate their currency. India’s interest rates are one of the highest in the
world. This attracted FIIs in the
Indian debt market. But the
inflows here were restricted due
to investment limit. In November,
the FII investment limit was
enhanced in government and
corporate bonds. It was the
perfect time for FII as the INR
value against USD was hovering
at all‐time high coupled with
higher bond yields. NRI inflow
also plays a part and brings good
amount of inflows into the banking sector. Recently, the sharp rise in NRE deposit rates by various
Indian banks saw huge inflows.
Global currency movement
Apart from demand and supply,
the Rupee is affected by the way
other currencies behave against
dollar. If Euro depreciates against
dollar, it will affect the Euro/INR
and USD/INR currency also. There
is a direct relationship between
Euro and INR movement as both
are pegged against USD. Hence,
when Euro strengthened against
USD, it has a positive impact on
INR also and vice‐versa. One of the major reasons for the sharp weakening in INR was the weakening
Euro, courtesy the European debt crisis. Euro depreciated around 9% against dollar from August to
December 2011. It might be pertinent to note that in recent times the Euro was emerging as a strong
alternative to the dollar in terms of reserve currency. However the recent conditions in Europe and
lack of viable alternatives led to the resumption of dollar as the currency of reserves.
RBI intervention
The RBI’s participation in the foreign exchange market is limited to ease volatility in the event of
excess demand for/supply of foreign currency. In the recent times, as INR depreciation against
dollar, we heard of RBI’s intervention in the forex market. Between October 28 and November 25
2011, forex reserves dropped by $16 billion to $304 billion, yet the currency still fell by 7% over that
‐0.5
0
0.5
1
1.5
2
38
42
46
50
54
Apr‐02 Nov‐03 Jun‐05 Jan‐07 Aug‐08 Mar‐10 Oct‐11
USD billion
INR per USD
NRI deposits USD/INR
Source:Reuters
0.8
1
1.2
1.4
1.6
38
43
48
Jan‐00 Jan‐02 Jan‐04 Jan‐06 Jan‐08 Jan‐10 Jan‐12
USD per Euro
Rs per USD
USD/INR Euro/USD
Source: Reuters

Annual MF Booklet for the period ended December 31, 2011 Page 39
period. The volatility in the forex market got restricted after RBI changed the trading limits of banks
on 15 December 2011. For RBI it is difficult to control the direction of the movement as the lower
forex reserves and negative BOP can result in shortage of currency similar to what happened in
1990s. This leaves limited options for RBI. Also comparing the forex reserves with the global trade of
INR (around $75 billion a day), RBI is left with little maneuvering room.
To conclude we can say that the interplay of the aforementioned factors has created a situation
which can be best summarized by the Chinese proverb “May you live in interesting times”, and we
sure are in the midst of an interesting phase.

Annual MF Booklet for the period ended December 31, 2011 Page 40
A currency swap is a foreign‐exchange agreement between two parties to exchange principle and or
interest payments of a loan in one currency for equivalent net present value loan component in
another currency. These are over‐the‐counter derivatives, and are closely related to interest rate
swaps with the major differentiator being, the possibility of exchange of principle.
There are three different ways in which currency swaps usually operate:
The simplest structure is to exchange only the principal with the counterparty at a specified
point in the future at a rate agreed now, much like a forward contract or futures. This type
of currency swap is also known as an FX‐swap.
Another commonly used structure is combining the exchange of loan principal, with an
interest rate swap. In such a swap, interest cash flows are not netted before they are paid to
the counterparty (as they would be in a vanilla interest rate swap) because they are
denominated in different currencies. As each party effectively borrows on the other's behalf.
This type of swap is also known as a back‐to‐back loan.
Last, but not the least, is to exchange only interest payment cash flows on loans of the same
size and term. Again, as this is a currency swap, the exchanged cash flows are in different
denominations and so are not netted. This type of swap is also known as a cross‐currency
interest rate swap, or cross currency swap.
Currency swaps have two main uses:
To secure cheaper debt (by borrowing at the best available rate regardless of currency and
then swapping for debt in desired currency using a back‐to‐back‐loan).
To hedge against (reduce exposure to) exchange rate fluctuations.
Financial Crisis & Currency Swaps
Following the financial crisis in 2007, currency swaps were used in the form of central bank liquidity
swaps. During the financial crisis the US Federal Reserve entered into agreements to establish
temporary reciprocal currency arrangements with a number of foreign central banks to provide
liquidity. Simply put, the US Federal Reserve would sell dollars to a foreign bank at the prevailing
exchange rate and simultaneously enter into an agreement to buy these back at the same exchange
rate, on a future date, for a fee. There have been instances where the US Federal Reserve has
charged as much as 11.96% for an overnight swap. While these swaps were re‐established in May
2010, as shown in Fig 1, the quantum traded has reduced significantly.
The swap lines established by the US Federal Reserve went a long way in ensuring stability in
economies such as Korea. Following the financial crisis, Korea was not able to regain stability in its
financial markets inspite of a large stockpile of foreign exchange reserves. It was only after the Bank
of Korea entered into a 30 billion USD swap agreement with the US Federal Reserve that fears of
illiquidity subsided and stability returned to the Korean financial markets.
CURRENCY SWAPS

Annual MF Booklet for the period ended December 31, 2011 Page 41
Source: US Federal Reserve
Controversies Abound
Currency Swaps have in the past been used to hide borrowings. Greece managed to successfully
hoodwink its lenders by raising 1 billion USD through a currency swap arrangement. In December
2011, the US Federal Reserve came under sharp criticism for covertly bailing out Europe through its
dollar‐swap program. Under its currency swap deal, the US Federal Reserve agreed to lend dollars to
the European Central Bank (ECB); the latter would then use these funds to extend credit lines to
banks in Europe. The argument being that the US Federal Reserve was indirectly lending to banks,
with the ECB taking the credit risk. This prompted the US Federal Reserve to clarify its intention of
extending dollar liquidity to financial institutions in the Euro zone, rather than covertly bailing out
the EU.
Indo‐Japan Currency Swap
In December 2011, India and Japan renewed their currency swap agreement which expired in June
2011. The new agreement saw the amount of the swap increase from 3 billion USD to 15 billion USD.
Under the agreement, in case of an unforeseen situation India will be supplied dollars by the Bank of
Japan. This development has to some extent allayed fears which arose from the sharp weakening in
the Rupee in 2011. The agreement will enable India to tide over short term fluctuations and improve
stability in its foreign exchange markets.
Chiang Mai Initiative
After the Asian financial crisis of 1997, the ASEAN plus three entered into a series of currency swap
agreements to manage regional short‐term liquidity problems. By October 2008 the bilateral swap
agreements were multilateralised under a self‐managed reserve pooling arrangement, governed by
a single contract. However, at present the total quantum that can be borrowed from the dollar
reserve pool is small.
-20,000.0 40,000.0 60,000.0 80,000.0
100,000.0 120,000.0 140,000.0 160,000.0 180,000.0
Am
ou
nt
Ext
end
ed i
n U
SD
Liquidity SwapUS Federal Reserve
Amount extended

Annual MF Booklet for the period ended December 31, 2011 Page 42
Vehicle of Change
China has emerged as the most influential trading partner for most nations. Over the years China has
resisted appreciating its currency and has been under severe pressure by USA to reduce controls
over the Yuan. In order to ensure internationalization of the Yuan, the Chinese government is using
currency swaps to directly trade with countries such as Argentina, Belarus, Hong Kong, Iceland,
Indonesia, Malaysia, Singapore, South Korea, New Zealand and Uzbekistan. Through these swaps the
Yuan is exchanged directly for the foreign currency without first being converted to the dollar. While
these swap agreements have been entered into as contingency measures, wider adoption of such
bilateral agreements will significantly reduce the demand for dollars and possibly lead to the
emergence of the Yuan as a reserve currency. As a result currency swaps have become an important
vehicle for the eventual internationalisation of the Yuan.
Telltale signs of a steady decline in the use of dollars as a reserve currency have emerged. Data
collated by the IMF reflects this trend wherein the proportion of the dollar as the reserve currency
has been dropping since the financial crisis in 2007. While the weakness in the dollar could be one of
the reasons for the visible decline, it would seem that governments across the world have not
cushioned this decline in their reserves from dollar rate fluctuations. A spate of currency swaps are
likely to emerge, since building US reserves no longer offers the kind of succor to an economy as it
once did. This in turn has been a fall out of the global financial crisis, emergence of China as a
dominant trade partner and to some extent the re‐rating of US paper by rating agencies. At such a
time currency swaps such as the Indo‐Japan agreement have emerged as an alternative to hoarding
dollars. However, given that swap arrangements are time bound their use as an alternative to
hoarding dollars is limited and is likely to eventually give way to reserve pooling arrangements such
as the one under the Chiang Mai Initiative.
Source: IMF COFER
0.00%
1.00%
2.00%
3.00%
4.00%
5.00%
6.00%
56.00%
58.00%
60.00%
62.00%
64.00%
66.00%
68.00%Proportion of Allocated Reserves
Reserves in U.S. dollars Reserves in currencies other than Dollar, Pound, Duetsche Mark, Franc, Euro, Yen

Annual MF Booklet for the period ended December 31, 2011 Page 43
Oil is a vital commodity that holds the position of a key factor in each and every economy of the
world. As, both crude oil and its by‐products serve as key input for the transportation sector and for
various industrial applications, every country has its need. If any country doesn’t have much reserves
of oil to meet their domestic demand, these nations’ needs to import the product at any cost. It is
also an important contributor to the export realisations of many countries. Therefore it is also
termed as “Liquid Gold”.
The importance of this liquid metal was observed, when the world’s most strong economies were
shaken up as the oil prices rose up in 1973 and 1979 when the gulf countries refused to supply oil to
the countries that were the supporters of Israel in its war with Egypt and Syria. The impact of supply
disruption of crude oil can result in increased inflation and unemployment rates and reduced
economic growth rate (GDP). The rise in oil price under these conditions leads to hike in import costs
which cause transfer of income from the consuming nations to the producing nations. Being the
primary source of production, it also increases the overall production cost. Overall, increase in oil
prices may turn out to be the main cause of worldwide recession and slowdown in global economic
activity. Not only oil price rise, low oil prices also have a negative impact, as it affects the financial
performance of the country’s oil companies.
India is not among the major producers of crude oil as it lacks oil reserves and thus it has to depend
majorly on imports to meet its increased consumption demand. However, the production of oil and
its by‐products has increased in the recent past due to exploration and findings of new oil reserves.
India currently has an estimated quantity of 5.7 billion barrels (approx.) of oil reserves.
Impact of Crude Oil Prices over the Indian Economy
India, being the major importer of crude oil, importing around 80% of its domestic requirement and
global oil prices touching the alarming mark of $120/barrel, the import bill may cross $100 billion in
the coming periods. In the last three years, the oil prices has rose almost 50% from $71.88/barrel in
January 2009 to $107.38/barrel in December 2011. The effect of hike in oil prices over India’s major
macroeconomic indicators can be discussed hereunder ‐
Fiscal Balance
The balance of a government's tax revenues, plus any proceeds from asset sales, minus government
spending is known as Fiscal Balance. If the balance is positive the government has a fiscal surplus, if
negative a fiscal deficit.
Fiscal deficit is an economic phenomenon, where the Government's total expenditure exceeds the
revenue generated (excluding borrowings). It is an indication of the total borrowings required by the
Government.
The India’s fiscal deficit in the current fiscal year is likely to be higher than the projected figure of
4.6%. One of the main reasons can be cited as rising crude oil prices globally which is touching
RISING CRUDE OIL PRICES HAMPERING INDIA’S GROWTH STORY

Annual MF Booklet for the period ended December 31, 2011 Page 44
almost $112/barrel and expected to reach $120/barrel. The result of this will increase India’s import
bill and fiscal deficit which in turns lead to economy slowdown.
Gross Domestic Product
Gross domestic product (GDP) is one the primary macroeconomic indicators used to measure the
health of a country's economy. It represents the market value of all final goods and services
produced within a country in a given period. Crude oil is the major constituent in India’s GDP, as the
total consumption is relatively high as compared with many developed countries.
The heat of oil price hike has been globally felt as the increase in oil prices has caused decrease in
the GDP growth rate globally. The
economic situation of emerging
countries has been worst effected and
remained gloomy with the hike in oil
prices. In last four years, the average
crude oil price has been in the range of
Rs. 2,727.21/barrel and Rs.
4,329.62/barrel. Average GDP during
this period has followed the similar
trend and it has been in the range of
7.03% and 8.73%.
Inflation
Inflation is a situation where too much money chases too few goods. Inflation is nothing but a rise in
the level of prices of goods and/or services in an economy over a certain period of time.
The crude oil prices share a positive
correlation with the inflation rate. The
Fuel & Power has a weight age of
14.91% in the WPI (Indicator of
Inflation), this indicates that for every
10% rise in the prices of products in the
energy sector, inflation would go up by
1.491 percentage points. Therefore any
hike in crude oil prices will have serious
impact on inflation rate of India.
The rise of crude oil prices also increases the production cost of goods and commodities as well as
transportation costs. This increase in input costs is passed on to the consumers, who ultimately end
up paying higher prices. Thus, a hike in oil prices also increases inflation in an indirect manner.
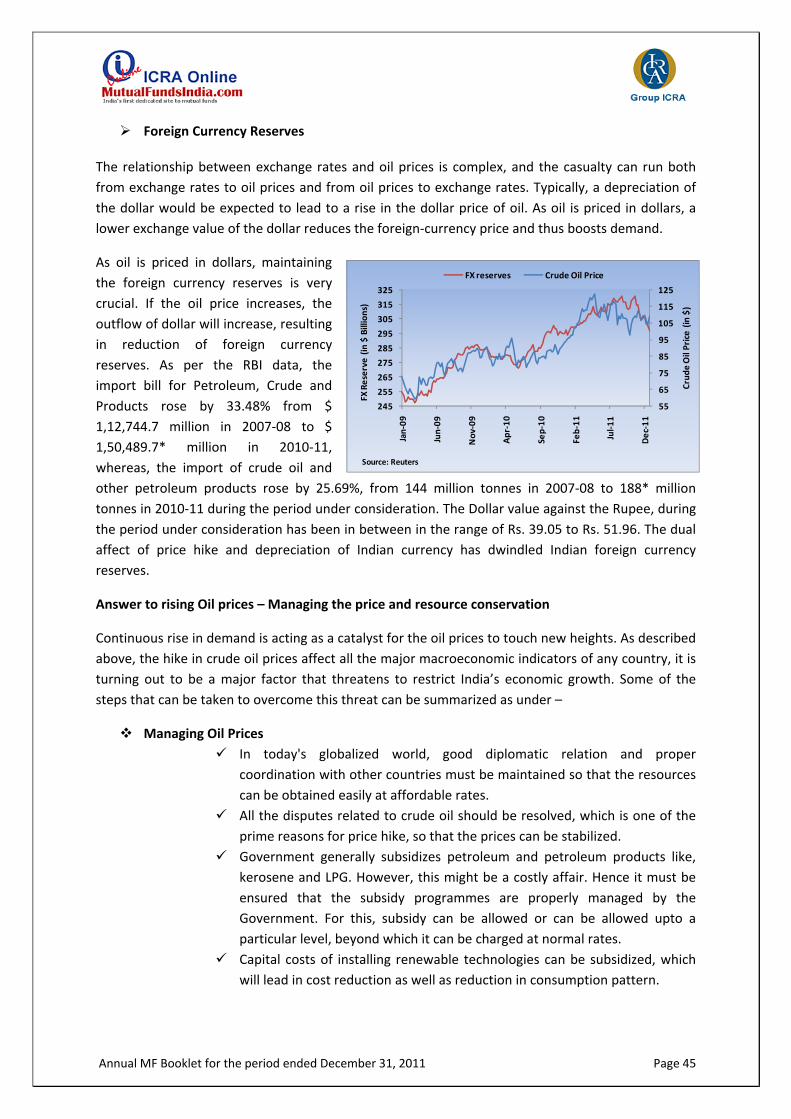
Annual MF Booklet for the period ended December 31, 2011 Page 45
Foreign Currency Reserves
The relationship between exchange rates and oil prices is complex, and the casualty can run both
from exchange rates to oil prices and from oil prices to exchange rates. Typically, a depreciation of
the dollar would be expected to lead to a rise in the dollar price of oil. As oil is priced in dollars, a
lower exchange value of the dollar reduces the foreign‐currency price and thus boosts demand.
As oil is priced in dollars, maintaining
the foreign currency reserves is very
crucial. If the oil price increases, the
outflow of dollar will increase, resulting
in reduction of foreign currency
reserves. As per the RBI data, the
import bill for Petroleum, Crude and
Products rose by 33.48% from $
1,12,744.7 million in 2007‐08 to $
1,50,489.7* million in 2010‐11,
whereas, the import of crude oil and
other petroleum products rose by 25.69%, from 144 million tonnes in 2007‐08 to 188* million
tonnes in 2010‐11 during the period under consideration. The Dollar value against the Rupee, during
the period under consideration has been in between in the range of Rs. 39.05 to Rs. 51.96. The dual
affect of price hike and depreciation of Indian currency has dwindled Indian foreign currency
reserves.
Answer to rising Oil prices – Managing the price and resource conservation
Continuous rise in demand is acting as a catalyst for the oil prices to touch new heights. As described
above, the hike in crude oil prices affect all the major macroeconomic indicators of any country, it is
turning out to be a major factor that threatens to restrict India’s economic growth. Some of the
steps that can be taken to overcome this threat can be summarized as under –
Managing Oil Prices
In today's globalized world, good diplomatic relation and proper
coordination with other countries must be maintained so that the resources
can be obtained easily at affordable rates.
All the disputes related to crude oil should be resolved, which is one of the
prime reasons for price hike, so that the prices can be stabilized.
Government generally subsidizes petroleum and petroleum products like,
kerosene and LPG. However, this might be a costly affair. Hence it must be
ensured that the subsidy programmes are properly managed by the
Government. For this, subsidy can be allowed or can be allowed upto a
particular level, beyond which it can be charged at normal rates.
Capital costs of installing renewable technologies can be subsidized, which
will lead in cost reduction as well as reduction in consumption pattern.
55
65
75
85
95
105
115
125
245
255
265
275
285
295
305
315
325
Jan‐09
Jun‐09
Nov‐09
Apr‐10
Sep‐10
Feb‐11
Jul‐11
Dec‐11
FX reserves Crude Oil Price
FX Reserve(in $ Billions)
Crude Oil Price (in$)
Source: Reuters

Annual MF Booklet for the period ended December 31, 2011 Page 46
Managing Oil Supplies
Monopoly of the crude oil producing countries must be reduced by
exploring new oil producing regions in the country.
Increasing the competition among oil suppliers can also lead to reduction of
oil prices and risk of oil‐availability. This might be done by diversifying the oil
suppliers, by searching new vendors.
Increasing the capacity of existing oil refineries could also enhance oil
supplies.
New technologies can be used to carry out more oil drilling process and
make the best use of the alternative sources.
Reducing the consumption pattern and opting for alternate sources
Since there is limited availability to this natural resource, energy
conservation must be encouraged, rather than to develop and acquire oil
fields.
Alternate source of power like, solar energy, natural gas and other
renewable energy sources must be used. This would also lead our
environment “go‐green”.
Consumption of oil must be optimized. Efficient use of oil must be promoted
by offering tax rebates for energy efficient technologies and increasing tax
on energy wastages.
Private transportation must be used as less as possible, public
transportation must be used, instead.
Fuel efficient vehicles or vehicles which uses liquefied petroleum gas (LPG)
and natural gas as fuel, should be used. In this regard, rules can be
formalized for testing or checking the vehicle over a specified time. If not
found efficient, fine should be imposed and the vehicle should not be
allowed to be on roads.
*Estimated Figures

ICRA Online LimitedEnterprise, Team Spirit, Innovation...
MFI Explorer is a desktop application catering to research and analysis needs of advisors and fund managers with its comprehensive database on all Indian mutual funds. A daily data feed from our server keeps the application updated. Peer group comparison on risk, performance and portfolio helps the sales and market-ing team pitch for their products. Current and time series analysis of the NAV and portfolio helps the asset
Products
managers and advisors understand the portfolio trends in the industry. This product is a must have for any advisor who wants to carry out a thorough and unbiased analysis of available funds for its investors. It helps product teams with fund houses and advisors to build their marketing and promotional materials based on market share and performance. User defined templates and synchronized spread sheets helps reduce report delivery timelines.
Powered by our comprehensive mutual fund data, the application is targeted for treasuries and institutional brokers for whom precision in valuation and returns upto the last decimal is sacrosanct. MFI Portfolio Tracker is being used by some of the largest treasuries in the country to manage their transactions in mutual funds. It facilitates flexibility in setting up report template and also provides inbuilt regulatory reporting. Institutional
brokers rely on its reports to analyze their client’s portfolio performance and send reports on demand. The product has been integrated with ERP solutions for automation in processes. Its exposure reports shows the concentration in various sectors and credit ratings that a portfolio might have through investment in various schemes.
MFI Office Manager is a highly scalable back office system that can smoothly manage transactions for banks and retails funds distribution with huge volumes of transactions. The application is flexible to adopt to highly controlled and policy driven business environment as may be seen in banks and wealth management firms to largely uncontrolled and unregulated practice as seen in larger retail distribution. Its stringent transaction reconciliation
ensures that any erroneous transaction set is immediately highlighted with probable causes of such error. The brokerage and incentive calculation engine is capable of calculating all the types of brokerage currently in practice which can be further used to reconcile with actuals, an important step in checking revenue leakage. The application can manage transaction for mutual funds, life insurance, non-life insurance, IPO, fixed deposit, corporate bonds.
ensures that any erroneous transac
With ICRON’s Smart Track Platform you can manage your client portfolios anytime and from anywhere through web. You can issue logins to your team members, branches and investors to log into the platform through web. Our advisor dashboards consolidate all the important information on the landing page of the advisor. The platform is compatible with various feeds from registrars of mutual funds which can be
imported into the platform directly. Brokerage calculation engines are design to capture all standard brokerage types received from various fund houses and calculate brokerage internally based on transaction data. Our goal based financial planning allows you to identify the fea-sibility of investor’s meeting various user defined life cycle goals and post retirement expenses based on lifestyle and income assumptions.
MFI Insurance Explorer is built on a similar platform as MFI Explorer to give various stake holders in the insurance industry a clear and concise view on various products available in the industry. General features of the policy like its minimum and maximum entry age, premium payment terms, top up details, lock in period, rider details are available in an instance. It gives various comparative reports that can be used by insurance
companies and insurance advisors to analyze the performance of their unit linked policies. It features detailed portfolio reports allowing users to compare fund’s exposure in various instruments, companies, sectors and companies for multiple time periods. With over 650 insurance products, and still counting, the data base is quite comprehensive to deliver broader and deeper analytical reports.

ICRA Online LimitedEnterprise, Team Spirit, Innovation...
Our team of analysts capture all the important news and events across the industry so that the same can be presented in a more concise and understandable format. The news and events range from equity, debt and money market to global markets, oil prices and major economic policy decisions. These reports are available at various frequencies and lengths and are delivered with client’s branding.
Research SolutionsNewsletter
DatasheetsIn order to facilitate efficient, accurate, unbiased and transparent reporting on fund’s performance vis-à-vis its peer group and the benchmark, many banks, advisors and fund houses opt for different types of datasheets. These datasheets are available as white label research and can also be customized to include client’s own parameters and scheme universe. Daily Scorecards are spreadsheets with important risk and return parameters of various funds grouped as per their category. This acts as a quick reference for the sales team to compare the up to date performance. Fund Fact sheets are one page report on a fund with comprising of various risk and return measures, fund size, portfolio allocation across companies and all such information required for investment decision.
Fund AnalysisThese are a analytical reports which consist of some data available in factsheet along with performance analysis from ICRON’s research team. The analysis primarily aims to address the suitability and performance of the funds. Reasons of its performance or otherwise are analysed with reference to its stock selection. This report also analyses fund managers performance and management history.
The application helps advisors plan and manage their investor portfolios efficiently. Finan-cial planner allows one to capture all the demographic and income details of the investor and profiles the client as per her risk appetite. A comparison with model portfolio highlights the gaps in existing portfolio. The platform has integrators built to capture data from diverse back
office systems for all asset classes including secondary market trades. In addition to this advisor can input all such investor transactions which are carried out by an external broker. The holistic view on investments helps advisors and planners take valuable decisions on the portfolio health and keeps it aligned with its objective. Various objectives in terms of goals can be defined in the application.
Fund RankingIn order to simplify the fund selection process for the sales team and the investor brokers usually need the schemes to be ranked. These rankings take care of various portfolio and performance related factors and come out with easy-to-understand ranks assigned to each of the schemes under consideration. ICRON designs the ranking model in consultation with its clients to suite their specific requirement.
Portfolio Allocation and OptimisationOur specialized team of researchers help design optimization models to suite the model portfolio requirements for various risk appetite for wealth managers and advisors. These models incorporate various scenarios on the premise of generating the best returns for an acceptable level of risk, factoring in real life market scenarios for asset classes.
Annual MF Booklet for the period ended December 31, 2011 Page 47
ICRA ranks Mutual Funds in 3 broader categories, which are sub‐classified into 16 sub‐categories.
Debt Funds
ICRA Debt Intermediate
ICRA Debt‐Long Term
ICRA Gilt ‐ Long Term
ICRA Gilt ‐ Short Term
ICRA Liquid
ICRA Liquid ‐ IP
ICRA Ultra Short Term
ICRA Ultra Short Term – IP
Equity Funds
ICRA Equity Sector
ICRA Equity Dynamic
ICRA Equity Index
ICRA Equity Large Cap
ICRA Equity Mid & Small Cap
ICRA Equity‐Tax Planning
Hybrid Funds
ICRA Balanced
ICRA Marginal Equity
* Ranking is done for a period of one year & three years for all the above categories.
ICRA MUTUAL FUND CATEGORIES

Annual MF Booklet for the period ended December 31, 2011 Page 48
The report card for the Indian Mutual Fund industry for the Year 2011 is out. Marginal Equity Funds
and Ultra Short term Funds were the best performers in equity and debt categories, respectively, as
per the latest ICRA Mutual Fund Ranking powered by ICRA Online Limited.
In the Debt Funds category, Ultra Short Term Funds topped the chart followed by Debt Intermediate
Funds and Liquid Funds. This category generated positive returns in the last calendar year as well.
However in 2011 they have significantly outperformed equity funds.
In the Equity Funds category, the average returns for the Calendar Year 2011 were mostly negative
due to high inflation, tight monetary policy and global uncertainty. Marginal Equity Funds performed
the best as their average equity exposure in equity is less than 65%. In the same period benchmark
indices, Nifty & Sensex gave negative return of 24.61% and 24.64% respectively.
RANKING SYNOPSIS

Annual MF Booklet for the period ended December 31, 2011 Page 49
Scheme Name Award
UTI Opportunities Fund
Franklin India Bluechip
ICICI Prudential Focused Bluechip Equity Fund
Scheme Name Award
HDFC Top 200
Franklin India Bluechip
ICICI Prudential Focused Bluechip Equity Fund
Scheme Name Award
IDFC Premier Equity Fund
SBI Magnum Sector Funds Umbrella ‐ Emerg Buss Fund
Scheme Name Award
IDFC Premier Equity Fund
Birla Sun Life MNC Fund
Scheme Name Award
HDFC Equity Fund
Birla Sun Life India GenNext Fund
Reliance Equity Opportunities Fund
Reliance Growth Fund
UTI India Lifestyle Fund
UTI MNC Fund
Scheme Name Award
UTI MNC Fund
HDFC Equity Fund
Quantum Long‐Term Equity Fund
Reliance Equity Opportunities Fund
3 Year
Open Ended Equity Dynamic
1 Year
3 Year
ICRA AWARD WINNERS 2012
Open Ended Equity Large Cap
1 Year
3 Year
Open Ended Equity Mid & Small Cap
1 Year
ICRA AWARD WINNERS 2012

Annual MF Booklet for the period ended December 31, 2011 Page 50
Scheme Name Award
SBI Magnum Tax Gain Scheme 1993
Axis Long Term Equity Fund
Scheme Name Award
ICICI Prudential Taxplan
HDFC Taxsaver Fund
Scheme Name Award
ICICI Prudential FMCG Fund
SBI Magnum Sector Funds Umbrella ‐ FMCG
Scheme Name Award
SBI Magnum Sector Funds Umbrella ‐ FMCG
Scheme Name Award
Axis Triple Advantage Fund
HDFC Multiple Yield Fund
Religare Monthly Income Plan Plus
Taurus MIP Advantage Fund
Scheme Name Award
HDFC Multiple Yield Fund ‐ Plan 2005
Scheme Name Award
UTI Wealth Builder Fund ‐ Series II
HDFC Children's Gift Fund Investment
3 Year
Open Ended Balanced
1 Year
3 Year
Open Ended Equity Sectoral
1 Year
3 Year
Open Ended Marginal Equity
1 Year
Open Ended Equity-Tax Planning
1 Year
ICRA AWARD WINNERS 2012

Annual MF Booklet for the period ended December 31, 2011 Page 51
Scheme Name Award
HDFC Prudence Fund
Scheme Name Award
IDFC Dynamic Bond Fund
SBI Dynamic Bond Fund
Scheme Name Award
DWS Premier Bond Fund
LIC Nomura Bond Fund
Scheme Name Award
HDFC Floating Rate Income Fund ‐ Long Term Fund
Scheme Name Award
Templeton India STIP
Scheme Name Award
UTI Gilt Advantage Fund ‐ Long Term
Scheme Name Award
JM High Liquidity
IDBI Liquid Fund
Pramerica Liquid Fund
Principal Cash Management Fund
Open Ended Liquid
1 Year
3 Year
Open Ended Debt Intermediate
1 Year
3 Year
Open Ended Gilt
1 Year
3 Year
Open Ended Debt-Long Term
1 Year
ICRA AWARD WINNERS 2012

Annual MF Booklet for the period ended December 31, 2011 Page 52
Scheme Name Award
JM High Liquidity ‐ Institutional Plan
Birla Sun Life Floating Rate Fund ‐ Short Term Institutional Plan
Daiwa Liquid Fund ‐ Institutional Plan
Scheme Name Award
JPMorgan India Short Term Income Fund
Scheme Name Award
Reliance Liquidity Fund
JM Money Manager Fund
Scheme Name Award
UTI Treasury Advantage Fund ‐ Institutional Plan
3 Year
Open Ended Ultra Short Term - IP
1 Year
Open Ended Liquid - IP
1 Year
Open Ended Ultra Short Term
1 Year
ICRA AWARD WINNERS 2012

Annual MF Booklet for the period ended December 31, 2011 Page 53
ICRA Mutual Fund Rankings seek to inform investors and intermediaries of the category‐wise relative
performance of Mutual Fund schemes. The schemes are ranked using the methodology developed
by ICRA Online.
Basic Eligibility
The MF scheme should have declared a minimum 222 Net Asset Values (NAVs) for one
year and 666 NAVs for the three year period.
First NAV disclosure should be on or before 365 days for one year and 1095 days for
three year.
Minimum 12 portfolios have been disclosed over the 1‐year period and 12 quarter end
portfolios for the 3‐year period.
A scheme is required to have made full portfolio disclosures (monthly/quarterly) during
the ranking horizon and its average fund size should be larger than the cut‐offs set for
each category, which vary from Rs 10 crore to Rs 500 crore.
Only open‐ended growth schemes are considered for ranking, apart from Liquid and
Ultra Short Term schemes, where Institutional Plans have also been considered.
Scheme Classification
One of the unique characteristic of ICRA rankings is the dynamic classification of schemes,
which is based on the asset allocation and investment pattern across asset classes and
sectors of the schemes, over the ranking periods of one and three years, rather than the
objective stated in their prospectus This kind of approach of investment based scheme
classification holds more relevance as asset allocation and investment pattern determines
the risk level associated with the schemes and also serves as an indicator of the fund
manager’s investment style. The net result is that these rankings reflect market realities,
thereby serving as an effective guide to the users. After classification, the ranks assigned to
the schemes are a result of an in‐depth analysis on certain critical parameters, including:
Risk‐Adjusted Return
Portfolio Concentration Characteristics
Liquidity Analysis
Corpus Size
Average Maturity
Credit Quality
RANKING METHODOLOGY

Annual MF Booklet for the period ended December 31, 2011 Page 54
Risk Adjusted Return Analysis: Risk adjusted return is calculated on the basis of an
internally developed ratio called the Investor Expectation Ratio (IER), which is
defined as the ratio of excess return to the total risk of the portfolio. The excess
return is the average weekly active return of the scheme calculated for the ranking
period over the risk free return.
The downside deviation of the scheme’s return (calculated for the period covered) is
taken as the surrogate of risk. In the case of Index schemes, tracking error is used.
Loads are not taken into consideration during the ranking exercise.
Portfolio Concentration Analysis: MF schemes that do not have an adequately
diversified portfolio carry a higher risk than well‐diversified schemes. While for
equity schemes, company and sector concentration is considered, for debt schemes,
sector concentration is evaluated. Company and Sector concentration in equity
schemes is judged taking the respective scheme benchmark’s portfolio structure to
ascertain the level of concentration of the scheme’s portfolio. For debt schemes, the
sectors considered are: Gilt; Non‐Banking Financial Companies; Manufacturing
Companies; Banks/Financial Institutions/ Development Institutions, Realty,
Securitized Debt and Non‐Financial/Non‐Manufacturing Companies. Overexposure
to any of these sectors is penalized.
Liquidity Analysis: Liquidity analysis is done for equity schemes. In this case, the
liquidity coefficient for a scheme is calculated as the weighted average of the
liquidity coefficients of all scrips in the portfolio. The liquidity coefficient of
individual scrip is calculated as the total number of shares in the portfolio of the
scheme divided by the total daily turnover of the scrip.
Corpus Size: Since a larger size of a scheme's corpus lends stability to it during
periods of high redemption pressure, preference is accorded to large‐size schemes.
Average Maturity: Average maturity is considered in the case of the Debt, Gilt and
Liquid categories. Schemes with higher average maturity carry higher interest rate
risks as compared with schemes with lower average maturity.
Credit Quality: The credit quality of a portfolio is given significant weightages in
deciding the final ranks. This credit quality is ascertained based on ICRA's credit
indicators for companies.
Annual MF Booklet for the period ended December 31, 2011 Page 55
ICRA Mutual Fund Ranking
In order to ensure that the variation in the final scores is captured, the methodology
considers the final scores as a distribution for which random numbers are generated. Based
on these, the final scores are placed on a normal distribution curve. The cumulative
probability distribution ascertained gives the position of the schemes on the bell curve.
Based on the confidence level, the schemes are then assigned star ranks.
ICRA MUTUAL FUNDS RANKING SCALE
Scale Interpretation
7‐Star Best Performance amongst 5‐Star Funds in the respective category
5‐Star Funds with composite score in the top 4.96% confidence* interval in the respective category
4‐Star Funds with composite score lying between 95.4% and 84.38% of the confidence* interval in the respective category
3‐Star Funds with composite score lying between 84.38% and 68.3% of the confidence* interval in the respective category
2‐Star Funds with composite score lying between 68.3% and 38.3% of the confidence* interval in the respective category
1‐Star Funds with composite score below 38.3% of the confidence* interval in the respective category
* Based on the positioning of a scheme in the category’s normal distribution
ICRA 7‐Star Gold Award
The best performing fund amongst the 5‐Stars is ranked as a 7‐Star Fund provided its fund
size is greater than the average of the respective category or Rs. 100 crore, whichever is
lower. Funds are awarded 7‐Star award only in the year end ranking.
Fund House of the Year
Fund House of the Year is determined in the Equity and Debt categories separately. To
qualify for the award a Fund House needs to have at least one scheme ranked 3 Star or
above in at least three of the equity and debt categories, respectively defined by ICRA. The
scoring aims at assessing the number of superior performing schemes managed by the fund
house over the current one‐year period. The result also takes into account qualitative factors
of an AMC’s structure based on their responses to a due diligence questionnaire. Fund
House of the year is selecting only in the year end ranking.
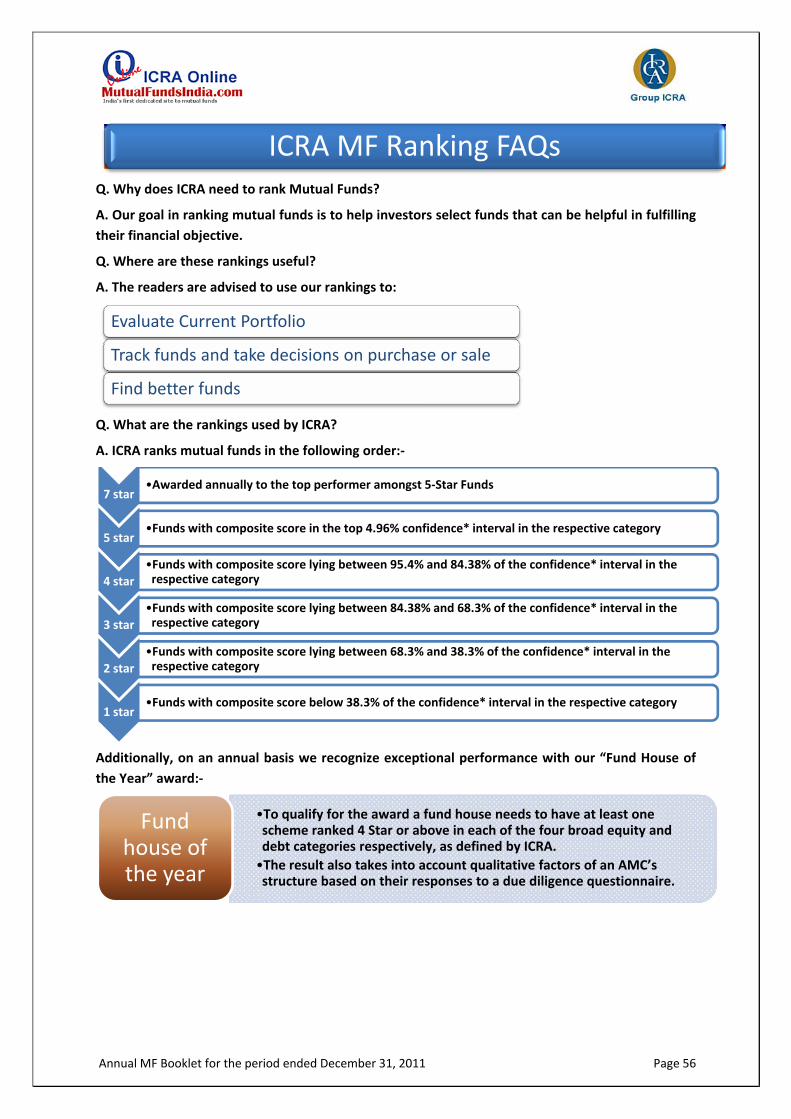
Annual MF Booklet for the period ended December 31, 2011 Page 56
Q. Why does ICRA need to rank Mutual Funds?
A. Our goal in ranking mutual funds is to help investors select funds that can be helpful in fulfilling
their financial objective.
Q. Where are these rankings useful?
A. The readers are advised to use our rankings to:
Q. What are the rankings used by ICRA?
A. ICRA ranks mutual funds in the following order:‐
Additionally, on an annual basis we recognize exceptional performance with our “Fund House of
the Year” award:‐
ICRA MF Ranking FAQs
Evaluate Current Portfolio
Track funds and take decisions on purchase or sale
Find better funds
7 star•Awarded annually to the top performer amongst 5‐Star Funds
5 star•Funds with composite score in the top 4.96% confidence* interval in the respective category
4 star
•Funds with composite score lying between 95.4% and 84.38% of the confidence* interval in the respective category
3 star
•Funds with composite score lying between 84.38% and 68.3% of the confidence* interval in the respective category
2 star
•Funds with composite score lying between 68.3% and 38.3% of the confidence* interval in the respective category
1 star•Funds with composite score below 38.3% of the confidence* interval in the respective category
•To qualify for the award a fund house needs to have at least one scheme ranked 4 Star or above in each of the four broad equity and debt categories respectively, as defined by ICRA.
•The result also takes into account qualitative factors of an AMC’s structure based on their responses to a due diligence questionnaire.
Fund house of the year

Annual MF Booklet for the period ended December 31, 2011 Page 57
Q. What are the eligibility criteria?
A. The ranking takes into consideration various factors like continuity, asset under management,
the level of disclosure etc. to ensure that only those schemes are eligible where the investor can
participate with the intention of fulfilling their financial objectives. The criteria include:
The MF scheme should have declared a minimum 222 Net Asset Values (NAVs) for one
year and 666 NAVs for the three year period.
First NAV disclosure should be on or before 365 days for one year and 1095 days for three
year.
Minimum 12 portfolios have been disclosed over the 1‐year period and 12 quarter end
portfolios for the 3‐year period.
A scheme is required to have made full portfolio disclosures (monthly/quarterly) during
the ranking horizon and its average fund size should be larger than the cut‐offs set for each
category, which vary from Rs 10 crore to Rs 500 crore.
Only open‐ended growth schemes are considered for ranking, apart from Liquid and Ultra
Short Term schemes, where Institutional Plans have also been considered.
Q. What are the key parameters used in your ranking?
A. Our rankings are done on multiple parameters amongst which the most investor relevant
parameters include:
•Evaluates returns against downside risk.
•Relevant with investor pshyche
Risk Adjusted Returns
•To ensure that investors are not impacted by single sector exposure
Portfolio Concentration
•Important in case of redemption needs
Liquidity
•A metric for stability during adverse situations
Corpus size
•To measure interest rate risk associated with debt funds
Average maturity
•Proxy for the ability of the issuer to honour repayment obligations
Credit quality

Annual MF Booklet for the period ended December 31, 2011 Page 58
Q. Are there any steps which the investor need to follow before the investors use the ranking?
It would be advisable for the investor to follow certain steps before and during the process of
investing and consequently while using our ranking
Exit
Exit when your objectives are met
Monitor
Regularly evaluate your portfolio and make suitable revisions
Stay Disciplined
A plan is of no use if there is no discipline in terms of honouring investment commitments
Plan
Involve a specialist to devise a plan for you. Refer to it regularly to know where you stand
Gather Information
Know where you stand in terms of income and expenditure
Set Goals
Where do you see yourself in the future. Keep it measurable and realistic

Annual MF Booklet for the period ended December 31, 2011 Page 59
Q. Can rankings be used to evaluate Investors current portfolio?
The rankings should be used as a ready reference tool for the aforementioned steps, especially for
planning, monitoring and exit stages. To aid the evaluation exercise investors are advised to
combine the annual rankings with our regular quarterly rankings where in we provide updates on
performance across similar criterion.
Investors can do it manually via scanning through our ranking documents over the last 4‐5 years or
using our MFI Explorer product. If the investor chooses to track funds manually then he would be
well advised to look at the ranking guide in the circled area
The circled area represents:‐
How funds have fared in the current edition of rankings
What was their standing in the previous editions
Any gain or loss in terms of position
These parameters should help an investor evaluate performance.
Q. Can the ranking be used for portfolio tracking purposes?
A. The rankings could be used by the investor to review portfolio composition, in consultation with
his/her financial advisor if the following events happen:‐
A fund has consistently slipped in its star ranking over 3 annual rankings
New funds which have a better star ranking over existing funds for at least three
quarters
Funds have the same star rating but the fund’s score on the criterion most important
to you has slipped
If there is a change in methodology, then you need help in analyzing the impact of
these changes on your portfolio
Q. Can rankings be used to evaluate better funds?
A. The rankings could be used by the investor to find better funds:‐
A fund has consistently improved its star ranking over 3 quarterly rankings
A fund with a higher star rating is available
Funds have the same star rating but the fund has a higher score on the criterion most
important to the investor.
To summarize we can say that the rankings are an attempt at helping the investor chose the best possible
fund to satisfy investment objective for a level of risk which is acceptable to them.

Annual MF Booklet for the period ended December 31, 2011 Page 60
1 Year
ICRA Debt Intermediate
Schemes December
Qtr Rank
Change September
Qtr Rank
IER Sector Concentration
Credit Indicator
Average Maturity
Corpus Cut Off
Weightages 35% 10% 30% 15% 10%
Canara Robeco Short Term Fund 4‐Star Up 3‐Star 5 7 25 3 30
Religare Short Term Plan 4‐Star Up 2‐Star 4 21 24 4 19
Reliance Floating Rate Fund ‐ Short Term 4‐Star Up 3‐Star 3 20 22 5 9
HDFC Floating Rate Income Fund ‐ Long Term Fund 5‐Star Up 2‐Star 1 3 11 1 8
Canara Robeco InDiGo Fund 3‐Star Up 2‐Star 21 1 8 10 23
Fidelity Short Term Income Fund 3‐Star 12 16 4 12 21
Birla Sun Life Dynamic Bond Fund 3‐Star Up 1‐Star 10 11 16 26 3
IDFC Money Manager Fund ‐ Investment Plan 3‐Star Down 4‐Star 26 1 1 2 11
Templeton India Income Opportunities Fund 3‐Star Up 2‐Star 7 32 33 21 2
ING Short Term Income Fund 3‐Star Up 2‐Star 8 8 18 8 35
HSBC Income Fund ‐ Short Term Plan 3‐Star Down 5‐Star 16 4 7 7 25
Templeton India STIP 3‐Star Up 2‐Star 6 28 34 17 1
DSP BlackRock Short Term Fund 2‐Star Down 3‐Star 24 14 9 13 17
HSBC Flexi Debt Fund 2‐Star Down 4‐Star 18 9 2 35 34
DWS Short Maturity Fund 2‐Star Up 1‐Star 19 17 29 11 18
Kotak Bond Short Term Plan 2‐Star Same 2‐Star 17 26 23 20 14
ICICI Prudential Regular Savings Fund 2‐Star 14 24 30 15 16
Kotak Credit Opportunities Fund 2‐Star Same 2‐Star 9 33 32 22 20
Religare Active Income Fund 2‐Star Up 1‐Star 22 10 14 9 15
Principal Income Fund ‐ S T P 2‐Star Up 1‐Star 11 31 21 23 36
Birla Sun Life Medium Term Plan 2‐Star Up 1‐Star 13 23 28 14 6
Axis Short Term Fund 2‐Star Same 2‐Star 15 6 5 18 26
Templeton India Income Builder Account 2‐Star Down 4‐Star 2 29 31 36 32
Reliance Short Term Fund 1‐Star Same 1‐Star 36 19 15 34 5
Templeton India Income Fund 1‐Star Same 1‐Star 35 27 19 19 10
Sundaram Flexible Fund ‐ Short Term 1‐Star Same 1‐Star 34 15 26 16 31
BNP Paribas Bond Fund 1‐Star Same 1‐Star 30 35 36 24 29
IDFC Super Saver Income Fund Short Term 1‐Star 33 18 10 31 22
ICICI Prudential Long Term Plan 1‐Star Same 1‐Star 32 25 17 25 28
Reliance Regular Savings Fund ‐ Debt 1‐Star Same 1‐Star 25 36 35 27 4
HDFC High Interest Fund ‐ Short Term Plan 1‐Star Same 1‐Star 29 34 27 32 7
HDFC Short Term Plan 1‐Star Same 1‐Star 27 22 12 28 12
DSP BlackRock Strategic Bond Fund 1‐Star Down 2‐Star 28 13 3 33 24
ANNEXURE – II ‐ RANKINGS
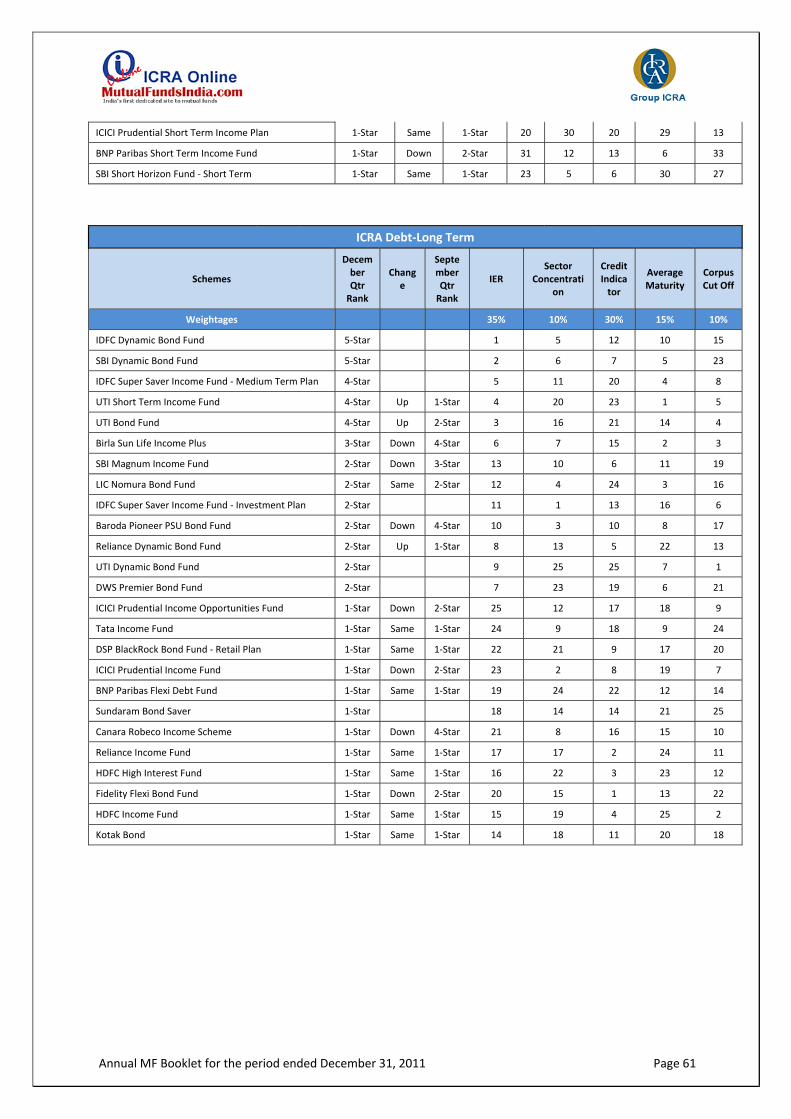
Annual MF Booklet for the period ended December 31, 2011 Page 61
ICICI Prudential Short Term Income Plan 1‐Star Same 1‐Star 20 30 20 29 13
BNP Paribas Short Term Income Fund 1‐Star Down 2‐Star 31 12 13 6 33
SBI Short Horizon Fund ‐ Short Term 1‐Star Same 1‐Star 23 5 6 30 27
ICRA Debt‐Long Term
Schemes
December Qtr Rank
Change
September Qtr Rank
IER Sector
Concentration
Credit Indicator
Average Maturity
Corpus Cut Off
Weightages 35% 10% 30% 15% 10%
IDFC Dynamic Bond Fund 5‐Star 1 5 12 10 15
SBI Dynamic Bond Fund 5‐Star 2 6 7 5 23
IDFC Super Saver Income Fund ‐ Medium Term Plan 4‐Star 5 11 20 4 8
UTI Short Term Income Fund 4‐Star Up 1‐Star 4 20 23 1 5
UTI Bond Fund 4‐Star Up 2‐Star 3 16 21 14 4
Birla Sun Life Income Plus 3‐Star Down 4‐Star 6 7 15 2 3
SBI Magnum Income Fund 2‐Star Down 3‐Star 13 10 6 11 19
LIC Nomura Bond Fund 2‐Star Same 2‐Star 12 4 24 3 16
IDFC Super Saver Income Fund ‐ Investment Plan 2‐Star 11 1 13 16 6
Baroda Pioneer PSU Bond Fund 2‐Star Down 4‐Star 10 3 10 8 17
Reliance Dynamic Bond Fund 2‐Star Up 1‐Star 8 13 5 22 13
UTI Dynamic Bond Fund 2‐Star 9 25 25 7 1
DWS Premier Bond Fund 2‐Star 7 23 19 6 21
ICICI Prudential Income Opportunities Fund 1‐Star Down 2‐Star 25 12 17 18 9
Tata Income Fund 1‐Star Same 1‐Star 24 9 18 9 24
DSP BlackRock Bond Fund ‐ Retail Plan 1‐Star Same 1‐Star 22 21 9 17 20
ICICI Prudential Income Fund 1‐Star Down 2‐Star 23 2 8 19 7
BNP Paribas Flexi Debt Fund 1‐Star Same 1‐Star 19 24 22 12 14
Sundaram Bond Saver 1‐Star 18 14 14 21 25
Canara Robeco Income Scheme 1‐Star Down 4‐Star 21 8 16 15 10
Reliance Income Fund 1‐Star Same 1‐Star 17 17 2 24 11
HDFC High Interest Fund 1‐Star Same 1‐Star 16 22 3 23 12
Fidelity Flexi Bond Fund 1‐Star Down 2‐Star 20 15 1 13 22
HDFC Income Fund 1‐Star Same 1‐Star 15 19 4 25 2
Kotak Bond 1‐Star Same 1‐Star 14 18 11 20 18
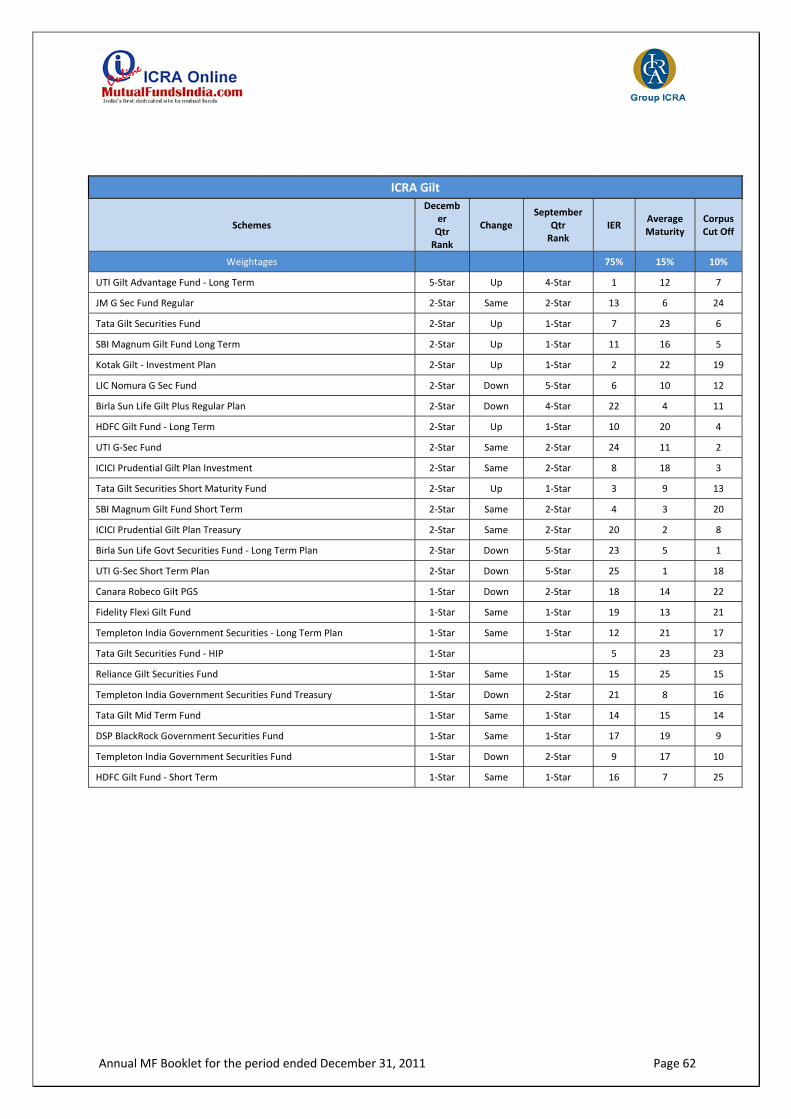
Annual MF Booklet for the period ended December 31, 2011 Page 62
ICRA Gilt
Schemes
December Qtr Rank
Change September
Qtr Rank
IER Average Maturity
Corpus Cut Off
Weightages 75% 15% 10%
UTI Gilt Advantage Fund ‐ Long Term 5‐Star Up 4‐Star 1 12 7
JM G Sec Fund Regular 2‐Star Same 2‐Star 13 6 24
Tata Gilt Securities Fund 2‐Star Up 1‐Star 7 23 6
SBI Magnum Gilt Fund Long Term 2‐Star Up 1‐Star 11 16 5
Kotak Gilt ‐ Investment Plan 2‐Star Up 1‐Star 2 22 19
LIC Nomura G Sec Fund 2‐Star Down 5‐Star 6 10 12
Birla Sun Life Gilt Plus Regular Plan 2‐Star Down 4‐Star 22 4 11
HDFC Gilt Fund ‐ Long Term 2‐Star Up 1‐Star 10 20 4
UTI G‐Sec Fund 2‐Star Same 2‐Star 24 11 2
ICICI Prudential Gilt Plan Investment 2‐Star Same 2‐Star 8 18 3
Tata Gilt Securities Short Maturity Fund 2‐Star Up 1‐Star 3 9 13
SBI Magnum Gilt Fund Short Term 2‐Star Same 2‐Star 4 3 20
ICICI Prudential Gilt Plan Treasury 2‐Star Same 2‐Star 20 2 8
Birla Sun Life Govt Securities Fund ‐ Long Term Plan 2‐Star Down 5‐Star 23 5 1
UTI G‐Sec Short Term Plan 2‐Star Down 5‐Star 25 1 18
Canara Robeco Gilt PGS 1‐Star Down 2‐Star 18 14 22
Fidelity Flexi Gilt Fund 1‐Star Same 1‐Star 19 13 21
Templeton India Government Securities ‐ Long Term Plan 1‐Star Same 1‐Star 12 21 17
Tata Gilt Securities Fund ‐ HIP 1‐Star 5 23 23
Reliance Gilt Securities Fund 1‐Star Same 1‐Star 15 25 15
Templeton India Government Securities Fund Treasury 1‐Star Down 2‐Star 21 8 16
Tata Gilt Mid Term Fund 1‐Star Same 1‐Star 14 15 14
DSP BlackRock Government Securities Fund 1‐Star Same 1‐Star 17 19 9
Templeton India Government Securities Fund 1‐Star Down 2‐Star 9 17 10
HDFC Gilt Fund ‐ Short Term 1‐Star Same 1‐Star 16 7 25

Annual MF Booklet for the period ended December 31, 2011 Page 63
ICRA Liquid
Schemes
December Qtr Rank
Change
September Qtr Rank
IER Sector
Concentration
Credit Indicator
Average Maturity
Corpus Cut Off
Weightages 35% 10% 30% 15% 10%
JM High Liquidity 5‐Star Same 5‐Star 2 1 58 17 24
Principal Cash Management Fund 5‐Star Same 5‐Star 4 8 55 9 50
Pramerica Liquid Fund 5‐Star Up 3‐Star 1 11 66 11 55
IDBI Liquid Fund 5‐Star Same 5‐Star 3 1 39 20 26
Reliance Liquidity Fund 4‐Star Up 3‐Star 9 56 17 48 4
Daiwa Liquid Fund 4‐Star 24 1 2 13 59
JM Money Manager Fund 4‐Star Up 1‐Star 6 1 62 32 64
Birla Sun Life Floating Rate Fund ‐ STP 4‐Star Same 4‐Star 20 1 52 2 46
HDFC Cash Management Fund ‐ Savings Plan 3‐Star Up 2‐Star 14 31 21 41 22
Kotak Floater Fund ‐ Short Term 3‐Star Up 2‐Star 8 67 63 38 23
DSP BlackRock Liquidity Fund 3‐Star Up 2‐Star 18 39 6 18 21
Sahara Liquid Fund 3‐Star 12 15 4 23 66
Reliance Liquid Fund Cash 3‐Star Up 2‐Star 11 65 11 37 15
Baroda Pioneer Liquid Fund 3‐Star Up 2‐Star 7 46 33 39 30
SBI Magnum Insta Cash Fund 3‐Star Down 4‐Star 13 37 5 14 31
HDFC Liquid Fund 3‐Star Same 3‐Star 17 40 28 36 7
Taurus Liquid Fund 3‐Star Up 1‐Star 5 55 47 27 34
IDBI Ultra Short Term Fund 3‐Star Same 3‐Star 15 1 44 58 52
Birla Sun Life Cash Manager 2‐Star Up 1‐Star 41 61 37 54 27
Religare Ultra Short Term Fund 2‐Star Up 1‐Star 34 59 50 52 41
BNP Paribas Overnight Fund 2‐Star Up 1‐Star 38 20 65 12 49
Templeton India Treasury Management Account 2‐Star Same 2‐Star 42 28 31 32 17
Tata Liquid Fund 2‐Star Same 2‐Star 51 10 29 49 11
Canara Robeco Floating Rate Fund 2‐Star Up 1‐Star 23 51 60 55 63
JPMorgan India Treasury Fund 2‐Star Same 2‐Star 21 18 48 67 53
DWS Ultra Short‐Term Fund 2‐Star Up 1‐Star 25 60 43 63 38
ICICI Prudential Flexible Income Plan 2‐Star Same 2‐Star 50 42 23 53 5
Templeton India Ultra Short Bond Fund 2‐Star Up 1‐Star 27 58 40 51 32
Reliance Liquid Fund Treasury 2‐Star 29 41 30 47 29
SBI Magnum Income Fund ‐ FRP ‐ Savings Plus Bond 2‐Star Up 1‐Star 33 33 12 19 68
UTI Money Market 2‐Star Same 2‐Star 28 26 34 29 39
SBI Short Horizon Fund ‐ Ultra Short Term 2‐Star Same 2‐Star 36 35 9 57 10
Reliance Money Manager Fund 2‐Star Same 2‐Star 30 54 19 62 8
ICICI Prudential Money Market Fund 2‐Star Down 4‐Star 60 1 51 7 62
Principal Near‐Term Fund ‐ Conservative Plan 2‐Star Up 1‐Star 19 24 64 29 56
LIC Nomura MF Liquid Fund 2‐Star Same 2‐Star 37 21 35 8 25
Birla Sun Life Ultra Short Term Fund 2‐Star Up 1‐Star 26 30 10 25 44

Annual MF Booklet for the period ended December 31, 2011 Page 64
Axis Liquid Fund 2‐Star Same 2‐Star 31 25 24 15 19
Pramerica Ultra Short Term Bond Fund 2‐Star Up 1‐Star 10 14 67 40 58
IDFC Cash Fund 2‐Star Down 5‐Star 32 13 18 41 9
HDFC Cash Management Fund ‐ Treasury Advantage 2‐Star Down 3‐Star 46 47 16 43 3
Tata Floater Fund 2‐Star Up 1‐Star 16 44 22 68 13
SBI Magnum Insta Cash Fund ‐ Liquid Floater Plan 2‐Star Down 3‐Star 22 12 14 34 60
UTI Liquid Fund ‐ Cash Plan 2‐Star Down 5‐Star 35 38 27 29 6
ICICI Prudential Liquid Plan 2‐Star Down 4‐Star 53 16 8 10 1
Birla Sun Life Cash Plus 1‐Star Down 3‐Star 68 27 41 4 2
DWS Treasury Fund ‐ Cash 1‐Star Same 1‐Star 67 48 54 46 51
Sundaram Money Fund 1‐Star Down 2‐Star 66 22 13 35 43
Peerless Liquid Fund 1‐Star Same 1‐Star 65 9 68 22 18
Axis Treasury Advantage Fund 1‐Star Same 1‐Star 63 63 38 64 47
Templeton India Cash Management Account Fund 1‐Star Down 2‐Star 64 17 1 1 61
UTI Floating Rate Fund ‐ STP 1‐Star Same 1‐Star 61 32 20 61 36
Kotak Liquid Fund 1‐Star Down 2‐Star 62 62 45 44 12
Canara Robeco Liquid Fund 1‐Star Down 2‐Star 57 66 46 20 35
BNP Paribas Money Plus Fund 1‐Star Down 2‐Star 40 68 57 65 54
JPMorgan India Liquid Fund 1‐Star Same 1‐Star 58 23 25 16 37
Religare Liquid Fund 1‐Star Down 2‐Star 55 19 36 27 20
Canara Robeco Treasury Advantage Fund 1‐Star Same 1‐Star 49 64 32 59 42
LIC Nomura MF Floating Rate Fund 1‐Star Same 1‐Star 59 53 59 3 67
LIC Nomura MF Savings Plus Fund 1‐Star Same 1‐Star 56 43 53 6 57
ICICI Prudential Floating Rate Fund 1‐Star Same 1‐Star 54 36 7 24 28
Templeton Floating Rate Income Fund 1‐Star Same 1‐Star 43 45 42 56 48
DWS Insta Cash Plus Fund 1‐Star Down 2‐Star 47 49 56 45 16
DSP BlackRock Money Manager Fund 1‐Star Same 1‐Star 48 52 3 60 33
IDFC Money Manager Fund ‐ Treasury Plan 1‐Star Same 1‐Star 45 29 15 66 14
HDFC Floating Rate Income Fund ‐ Short Term Fund 1‐Star Same 1‐Star 44 57 26 49 40
LIC Nomura MF Income Plus Fund 1‐Star Same 1‐Star 52 50 61 5 45
Principal Near‐Term Fund ‐ Moderate Plan 1‐Star Same 1‐Star 39 34 49 26 65
ICRA Liquid ‐ IP
Schemes
December Qtr Rank
Change
September Qtr Rank
IER Sector
Concentration
Credit Indicator
Average Maturity
Corpus Cut Off
Weightages 35% 10% 30% 15% 10%
JM High Liquidity ‐ Institutional Plan 5‐Star Same 5‐Star 1 1 43 8 20
Birla Sun Life Floating Rate Fund ‐ STP 5‐Star Up 3‐Star 12 1 39 1 38
Daiwa Liquid Fund ‐ Institutional Plan 5‐Star 7 1 1 5 46
Taurus Liquid Fund 4‐Star Up 1‐Star 2 35 36 15 27
UTI Liquid Fund ‐ Cash Plan 4‐Star Down 5‐Star 3 22 19 17 5
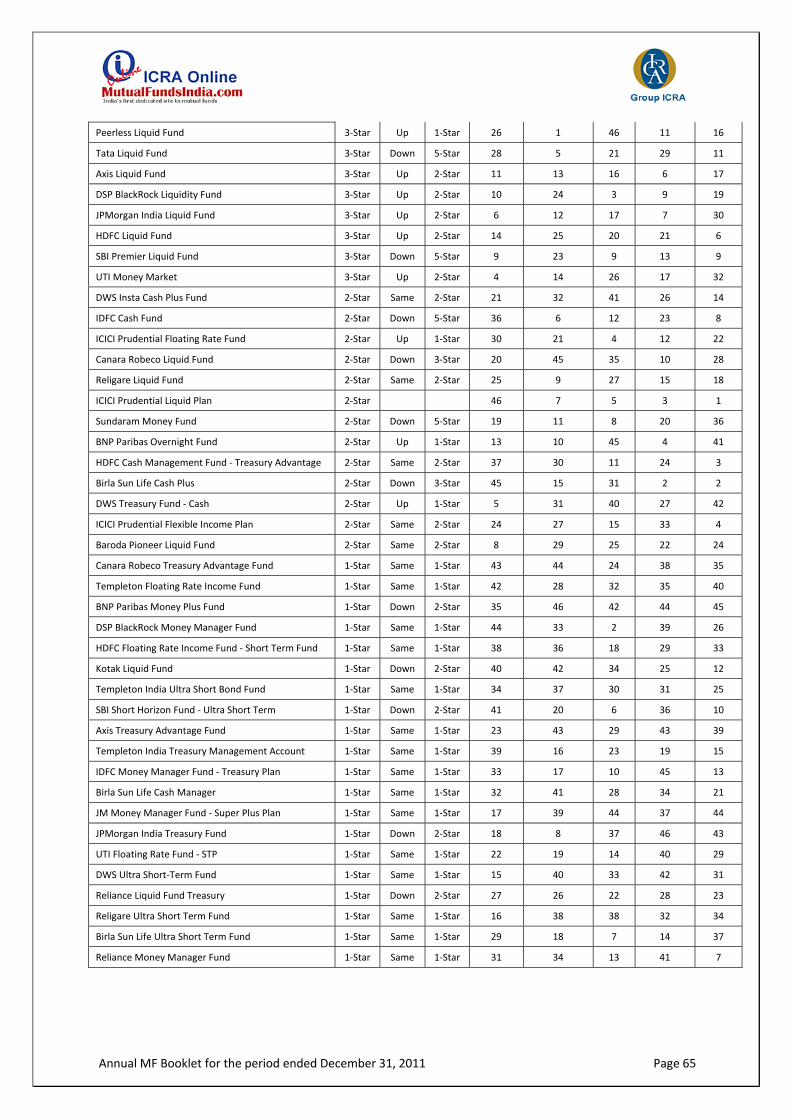
Annual MF Booklet for the period ended December 31, 2011 Page 65
Peerless Liquid Fund 3‐Star Up 1‐Star 26 1 46 11 16
Tata Liquid Fund 3‐Star Down 5‐Star 28 5 21 29 11
Axis Liquid Fund 3‐Star Up 2‐Star 11 13 16 6 17
DSP BlackRock Liquidity Fund 3‐Star Up 2‐Star 10 24 3 9 19
JPMorgan India Liquid Fund 3‐Star Up 2‐Star 6 12 17 7 30
HDFC Liquid Fund 3‐Star Up 2‐Star 14 25 20 21 6
SBI Premier Liquid Fund 3‐Star Down 5‐Star 9 23 9 13 9
UTI Money Market 3‐Star Up 2‐Star 4 14 26 17 32
DWS Insta Cash Plus Fund 2‐Star Same 2‐Star 21 32 41 26 14
IDFC Cash Fund 2‐Star Down 5‐Star 36 6 12 23 8
ICICI Prudential Floating Rate Fund 2‐Star Up 1‐Star 30 21 4 12 22
Canara Robeco Liquid Fund 2‐Star Down 3‐Star 20 45 35 10 28
Religare Liquid Fund 2‐Star Same 2‐Star 25 9 27 15 18
ICICI Prudential Liquid Plan 2‐Star 46 7 5 3 1
Sundaram Money Fund 2‐Star Down 5‐Star 19 11 8 20 36
BNP Paribas Overnight Fund 2‐Star Up 1‐Star 13 10 45 4 41
HDFC Cash Management Fund ‐ Treasury Advantage 2‐Star Same 2‐Star 37 30 11 24 3
Birla Sun Life Cash Plus 2‐Star Down 3‐Star 45 15 31 2 2
DWS Treasury Fund ‐ Cash 2‐Star Up 1‐Star 5 31 40 27 42
ICICI Prudential Flexible Income Plan 2‐Star Same 2‐Star 24 27 15 33 4
Baroda Pioneer Liquid Fund 2‐Star Same 2‐Star 8 29 25 22 24
Canara Robeco Treasury Advantage Fund 1‐Star Same 1‐Star 43 44 24 38 35
Templeton Floating Rate Income Fund 1‐Star Same 1‐Star 42 28 32 35 40
BNP Paribas Money Plus Fund 1‐Star Down 2‐Star 35 46 42 44 45
DSP BlackRock Money Manager Fund 1‐Star Same 1‐Star 44 33 2 39 26
HDFC Floating Rate Income Fund ‐ Short Term Fund 1‐Star Same 1‐Star 38 36 18 29 33
Kotak Liquid Fund 1‐Star Down 2‐Star 40 42 34 25 12
Templeton India Ultra Short Bond Fund 1‐Star Same 1‐Star 34 37 30 31 25
SBI Short Horizon Fund ‐ Ultra Short Term 1‐Star Down 2‐Star 41 20 6 36 10
Axis Treasury Advantage Fund 1‐Star Same 1‐Star 23 43 29 43 39
Templeton India Treasury Management Account 1‐Star Same 1‐Star 39 16 23 19 15
IDFC Money Manager Fund ‐ Treasury Plan 1‐Star Same 1‐Star 33 17 10 45 13
Birla Sun Life Cash Manager 1‐Star Same 1‐Star 32 41 28 34 21
JM Money Manager Fund ‐ Super Plus Plan 1‐Star Same 1‐Star 17 39 44 37 44
JPMorgan India Treasury Fund 1‐Star Down 2‐Star 18 8 37 46 43
UTI Floating Rate Fund ‐ STP 1‐Star Same 1‐Star 22 19 14 40 29
DWS Ultra Short‐Term Fund 1‐Star Same 1‐Star 15 40 33 42 31
Reliance Liquid Fund Treasury 1‐Star Down 2‐Star 27 26 22 28 23
Religare Ultra Short Term Fund 1‐Star Same 1‐Star 16 38 38 32 34
Birla Sun Life Ultra Short Term Fund 1‐Star Same 1‐Star 29 18 7 14 37
Reliance Money Manager Fund 1‐Star Same 1‐Star 31 34 13 41 7

Annual MF Booklet for the period ended December 31, 2011 Page 66
ICRA Ultra Short Term
Schemes
December Qtr Rank
Change
September Qtr Rank
IER Sector
Concentration
Credit Indicator
Average Maturity
Corpus Cut Off
Weightages 35% 10% 30% 15% 10%
JPMorgan India Short Term Income Fund 5‐Star Same 5‐Star 2 1 9 6 15
Peerless Short Term Fund 4‐Star 1 3 12 2 16
IDFC Ultra Short Term Fund 3‐Star Down 4‐Star 5 2 7 8 9
Kotak Floater ‐ Long Term 3‐Star Down 4‐Star 4 11 13 9 3
Birla Sun Life Savings Fund 3‐Star Up 1‐Star 8 10 6 3 2
UTI Treasury Advantage Fund 3‐Star Down 4‐Star 6 8 8 7 1
Baroda Pioneer Treasury Advantage Fund 3‐Star Down 4‐Star 3 15 4 1 11
Taurus Short Term Income Fund 2‐Star Same 2‐Star 7 6 11 15 13
Taurus Ultra Short Term Bond Fund 2‐Star Up 1‐Star 9 12 5 11 8
Sundaram Ultra Short Term 1‐Star Down 2‐Star 16 4 10 10 6
DSP BlackRock Floating Rate Fund 1‐Star Same 1‐Star 15 9 1 14 12
Birla Sun Life Income Fund 1‐Star Same 1‐Star 13 13 2 16 14
Templeton India Low Duration Fund 1‐Star Same 1‐Star 14 14 16 5 7
Kotak Flexi Debt Fund 1‐Star Down 2‐Star 11 16 14 12 5
Reliance Medium Term Fund 1‐Star Same 1‐Star 12 7 3 13 4
Peerless Ultra Short Term Fund 1‐Star 10 5 15 4 10
ICRA Ultra Short Term ‐ IP
Schemes
December Qtr Rank
Change
September Qtr Rank
IER Sector
Concentration
Credit Indicator
Average Maturity
Corpus Cut Off
Weightages 35% 10% 30% 15% 10%
UTI Treasury Advantage Fund 5‐Star Up 4‐Star 3 3 5 4 1
Peerless Ultra Short Term Fund 4‐Star 1 2 8 3 6
Birla Sun Life Savings Fund 3‐Star Up 1‐Star 5 5 4 2 2
Sundaram Ultra Short Term 2‐Star Down 3‐Star 7 1 6 5 4
Baroda Pioneer Treasury Advantage Fund 2‐Star Down 3‐Star 2 7 2 1 7
DSP BlackRock Floating Rate Fund 1‐Star Same 1‐Star 8 4 1 8 8
Taurus Ultra Short Term Bond Fund 1‐Star Down 2‐Star 6 6 3 6 5
Kotak Flexi Debt Fund 1‐Star Down 2‐Star 4 8 7 7 3

Annual MF Booklet for the period ended December 31, 2011 Page 67
ICRA Equity Sectoral
Schemes
December Qtr Rank
Change September
Qtr Rank
IER Liquidity Corpus Cut Off
Weightages 80% 10% 10%
ICICI Prudential FMCG Fund 5‐Star 1 6 9
SBI Magnum Sector Funds Umbrella ‐ FMCG 5‐Star 2 10 16
ICICI Prudential Technology Fund 3‐Star Down 4‐Star 5 9 8
SBI Magnum Sector Funds Umbrella ‐ IT 3‐Star Up 2‐Star 4 14 17
Franklin Infotech Fund 3‐Star Down 4‐Star 3 7 7
Reliance Media & Entertainment Fund 2‐Star 12 3 11
DSP BlackRock Technology.com Fund 2‐Star Up 1‐Star 11 17 12
Birla Sun Life New Millennium 2‐Star Up 1‐Star 10 16 14
UTI Pharma and Healthcare Fund 2‐Star 9 5 10
UTI Transportation and Logistics Fund 2‐Star 8 15 13
SBI Magnum Sector Funds Umbrella ‐ Pharma 2‐Star 6 8 19
Reliance Pharma Fund 2‐Star 7 1 2
Birla Sun Life India Opportunities Fund 1‐Star Same 1‐Star 21 19 18
Sundaram Media & Entert Opp Fund 1‐Star 20 4 15
Sahara Banking and Financial Services Fund 1‐Star Same 1‐Star 19 21 21
Sundaram Financial Services Opportunities Fund 1‐Star Same 1‐Star 17 12 4
Canara Robeco FORCE Fund 1‐Star Down 4‐Star 16 13 5
Reliance Banking Fund 1‐Star Down 4‐Star 18 2 1
UTI Banking Sector Fund 1‐Star Same 1‐Star 15 11 3
ICICI Prudential Banking and Financial Services Fund 1‐Star Down 2‐Star 14 18 6
Religare Banking Fund 1‐Star Down 2‐Star 13 20 20
ICRA Equity Dynamic
Schemes
December Qtr Rank
Change
September Qtr Rank
IER Company Concentrati
on
Sector
Concentration
Liquidity Corpus Cut Off
Weightages 60% 10% 10% 10% 10%
Reliance Growth Fund 5‐Star Up 3‐Star 37 1 1 2 2
HDFC Equity Fund 5‐Star Up 2‐Star 60 21 13 1 1
UTI India Lifestyle Fund 5‐Star Same 5‐Star 2 21 13 50 44
Birla Sun Life India GenNext Fund 5‐Star Up 4‐Star 3 15 3 73 85
Reliance Equity Opportunities Fund 5‐Star Up 4‐Star 8 1 11 6 7
UTI MNC Fund 5‐Star Same 5‐Star 1 21 13 32 61
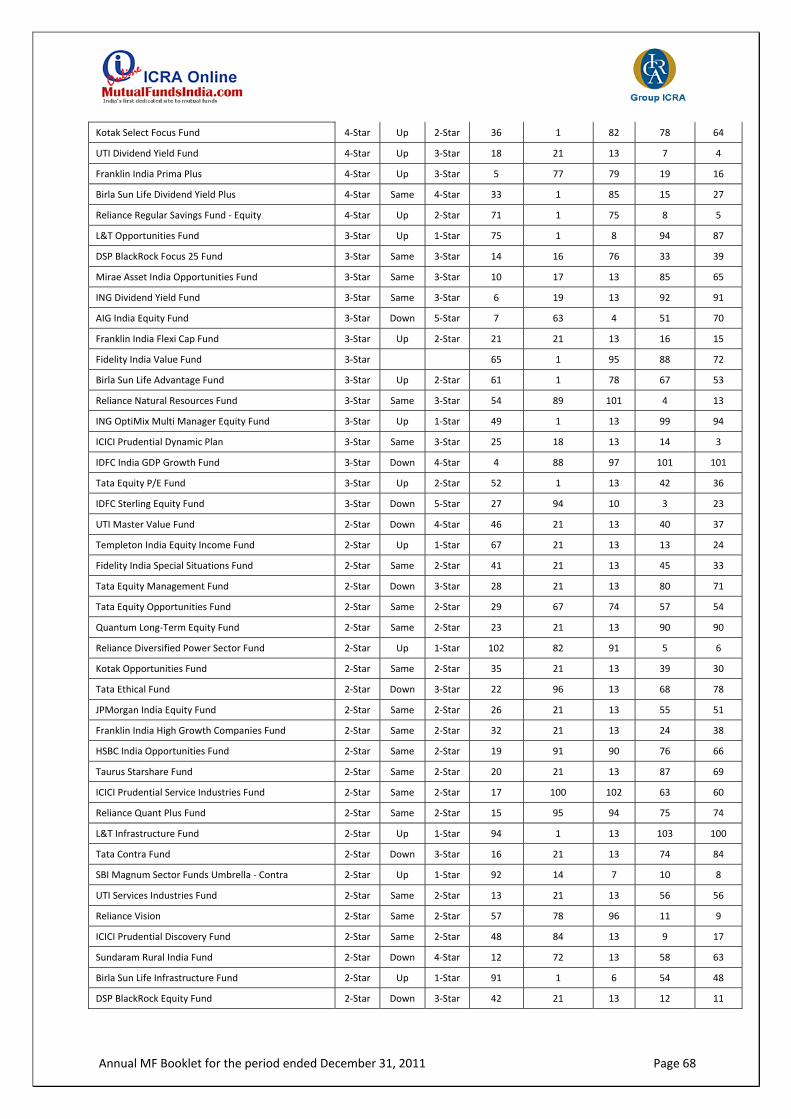
Annual MF Booklet for the period ended December 31, 2011 Page 68
Kotak Select Focus Fund 4‐Star Up 2‐Star 36 1 82 78 64
UTI Dividend Yield Fund 4‐Star Up 3‐Star 18 21 13 7 4
Franklin India Prima Plus 4‐Star Up 3‐Star 5 77 79 19 16
Birla Sun Life Dividend Yield Plus 4‐Star Same 4‐Star 33 1 85 15 27
Reliance Regular Savings Fund ‐ Equity 4‐Star Up 2‐Star 71 1 75 8 5
L&T Opportunities Fund 3‐Star Up 1‐Star 75 1 8 94 87
DSP BlackRock Focus 25 Fund 3‐Star Same 3‐Star 14 16 76 33 39
Mirae Asset India Opportunities Fund 3‐Star Same 3‐Star 10 17 13 85 65
ING Dividend Yield Fund 3‐Star Same 3‐Star 6 19 13 92 91
AIG India Equity Fund 3‐Star Down 5‐Star 7 63 4 51 70
Franklin India Flexi Cap Fund 3‐Star Up 2‐Star 21 21 13 16 15
Fidelity India Value Fund 3‐Star 65 1 95 88 72
Birla Sun Life Advantage Fund 3‐Star Up 2‐Star 61 1 78 67 53
Reliance Natural Resources Fund 3‐Star Same 3‐Star 54 89 101 4 13
ING OptiMix Multi Manager Equity Fund 3‐Star Up 1‐Star 49 1 13 99 94
ICICI Prudential Dynamic Plan 3‐Star Same 3‐Star 25 18 13 14 3
IDFC India GDP Growth Fund 3‐Star Down 4‐Star 4 88 97 101 101
Tata Equity P/E Fund 3‐Star Up 2‐Star 52 1 13 42 36
IDFC Sterling Equity Fund 3‐Star Down 5‐Star 27 94 10 3 23
UTI Master Value Fund 2‐Star Down 4‐Star 46 21 13 40 37
Templeton India Equity Income Fund 2‐Star Up 1‐Star 67 21 13 13 24
Fidelity India Special Situations Fund 2‐Star Same 2‐Star 41 21 13 45 33
Tata Equity Management Fund 2‐Star Down 3‐Star 28 21 13 80 71
Tata Equity Opportunities Fund 2‐Star Same 2‐Star 29 67 74 57 54
Quantum Long‐Term Equity Fund 2‐Star Same 2‐Star 23 21 13 90 90
Reliance Diversified Power Sector Fund 2‐Star Up 1‐Star 102 82 91 5 6
Kotak Opportunities Fund 2‐Star Same 2‐Star 35 21 13 39 30
Tata Ethical Fund 2‐Star Down 3‐Star 22 96 13 68 78
JPMorgan India Equity Fund 2‐Star Same 2‐Star 26 21 13 55 51
Franklin India High Growth Companies Fund 2‐Star Same 2‐Star 32 21 13 24 38
HSBC India Opportunities Fund 2‐Star Same 2‐Star 19 91 90 76 66
Taurus Starshare Fund 2‐Star Same 2‐Star 20 21 13 87 69
ICICI Prudential Service Industries Fund 2‐Star Same 2‐Star 17 100 102 63 60
Reliance Quant Plus Fund 2‐Star Same 2‐Star 15 95 94 75 74
L&T Infrastructure Fund 2‐Star Up 1‐Star 94 1 13 103 100
Tata Contra Fund 2‐Star Down 3‐Star 16 21 13 74 84
SBI Magnum Sector Funds Umbrella ‐ Contra 2‐Star Up 1‐Star 92 14 7 10 8
UTI Services Industries Fund 2‐Star Same 2‐Star 13 21 13 56 56
Reliance Vision 2‐Star Same 2‐Star 57 78 96 11 9
ICICI Prudential Discovery Fund 2‐Star Same 2‐Star 48 84 13 9 17
Sundaram Rural India Fund 2‐Star Down 4‐Star 12 72 13 58 63
Birla Sun Life Infrastructure Fund 2‐Star Up 1‐Star 91 1 6 54 48
DSP BlackRock Equity Fund 2‐Star Down 3‐Star 42 21 13 12 11
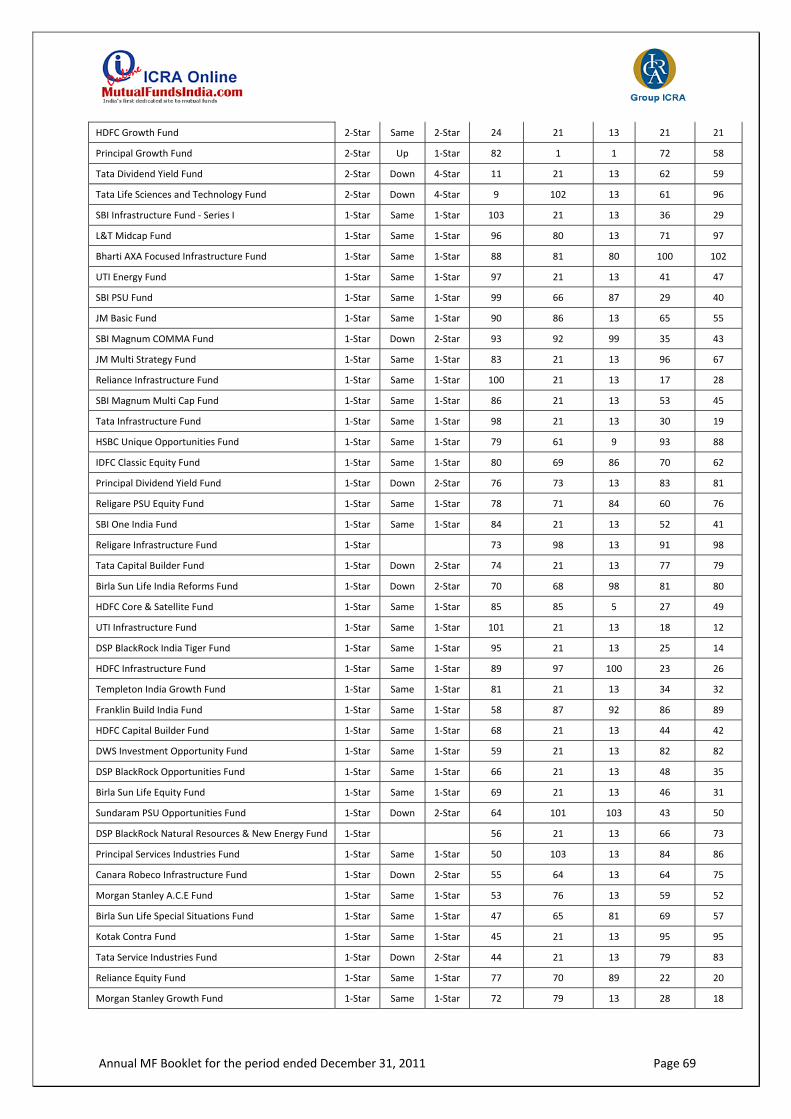
Annual MF Booklet for the period ended December 31, 2011 Page 69
HDFC Growth Fund 2‐Star Same 2‐Star 24 21 13 21 21
Principal Growth Fund 2‐Star Up 1‐Star 82 1 1 72 58
Tata Dividend Yield Fund 2‐Star Down 4‐Star 11 21 13 62 59
Tata Life Sciences and Technology Fund 2‐Star Down 4‐Star 9 102 13 61 96
SBI Infrastructure Fund ‐ Series I 1‐Star Same 1‐Star 103 21 13 36 29
L&T Midcap Fund 1‐Star Same 1‐Star 96 80 13 71 97
Bharti AXA Focused Infrastructure Fund 1‐Star Same 1‐Star 88 81 80 100 102
UTI Energy Fund 1‐Star Same 1‐Star 97 21 13 41 47
SBI PSU Fund 1‐Star Same 1‐Star 99 66 87 29 40
JM Basic Fund 1‐Star Same 1‐Star 90 86 13 65 55
SBI Magnum COMMA Fund 1‐Star Down 2‐Star 93 92 99 35 43
JM Multi Strategy Fund 1‐Star Same 1‐Star 83 21 13 96 67
Reliance Infrastructure Fund 1‐Star Same 1‐Star 100 21 13 17 28
SBI Magnum Multi Cap Fund 1‐Star Same 1‐Star 86 21 13 53 45
Tata Infrastructure Fund 1‐Star Same 1‐Star 98 21 13 30 19
HSBC Unique Opportunities Fund 1‐Star Same 1‐Star 79 61 9 93 88
IDFC Classic Equity Fund 1‐Star Same 1‐Star 80 69 86 70 62
Principal Dividend Yield Fund 1‐Star Down 2‐Star 76 73 13 83 81
Religare PSU Equity Fund 1‐Star Same 1‐Star 78 71 84 60 76
SBI One India Fund 1‐Star Same 1‐Star 84 21 13 52 41
Religare Infrastructure Fund 1‐Star 73 98 13 91 98
Tata Capital Builder Fund 1‐Star Down 2‐Star 74 21 13 77 79
Birla Sun Life India Reforms Fund 1‐Star Down 2‐Star 70 68 98 81 80
HDFC Core & Satellite Fund 1‐Star Same 1‐Star 85 85 5 27 49
UTI Infrastructure Fund 1‐Star Same 1‐Star 101 21 13 18 12
DSP BlackRock India Tiger Fund 1‐Star Same 1‐Star 95 21 13 25 14
HDFC Infrastructure Fund 1‐Star Same 1‐Star 89 97 100 23 26
Templeton India Growth Fund 1‐Star Same 1‐Star 81 21 13 34 32
Franklin Build India Fund 1‐Star Same 1‐Star 58 87 92 86 89
HDFC Capital Builder Fund 1‐Star Same 1‐Star 68 21 13 44 42
DWS Investment Opportunity Fund 1‐Star Same 1‐Star 59 21 13 82 82
DSP BlackRock Opportunities Fund 1‐Star Same 1‐Star 66 21 13 48 35
Birla Sun Life Equity Fund 1‐Star Same 1‐Star 69 21 13 46 31
Sundaram PSU Opportunities Fund 1‐Star Down 2‐Star 64 101 103 43 50
DSP BlackRock Natural Resources & New Energy Fund 1‐Star 56 21 13 66 73
Principal Services Industries Fund 1‐Star Same 1‐Star 50 103 13 84 86
Canara Robeco Infrastructure Fund 1‐Star Down 2‐Star 55 64 13 64 75
Morgan Stanley A.C.E Fund 1‐Star Same 1‐Star 53 76 13 59 52
Birla Sun Life Special Situations Fund 1‐Star Same 1‐Star 47 65 81 69 57
Kotak Contra Fund 1‐Star Same 1‐Star 45 21 13 95 95
Tata Service Industries Fund 1‐Star Down 2‐Star 44 21 13 79 83
Reliance Equity Fund 1‐Star Same 1‐Star 77 70 89 22 20
Morgan Stanley Growth Fund 1‐Star Same 1‐Star 72 79 13 28 18
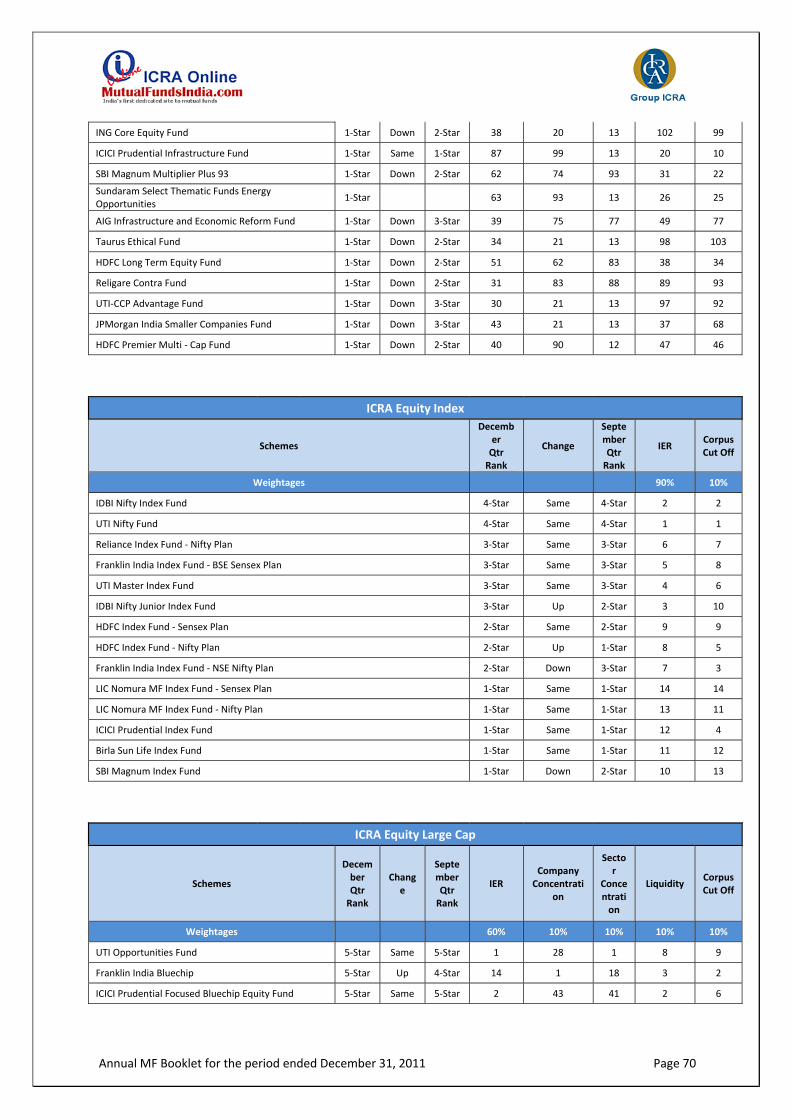
Annual MF Booklet for the period ended December 31, 2011 Page 70
ING Core Equity Fund 1‐Star Down 2‐Star 38 20 13 102 99
ICICI Prudential Infrastructure Fund 1‐Star Same 1‐Star 87 99 13 20 10
SBI Magnum Multiplier Plus 93 1‐Star Down 2‐Star 62 74 93 31 22
Sundaram Select Thematic Funds Energy Opportunities
1‐Star 63 93 13 26 25
AIG Infrastructure and Economic Reform Fund 1‐Star Down 3‐Star 39 75 77 49 77
Taurus Ethical Fund 1‐Star Down 2‐Star 34 21 13 98 103
HDFC Long Term Equity Fund 1‐Star Down 2‐Star 51 62 83 38 34
Religare Contra Fund 1‐Star Down 2‐Star 31 83 88 89 93
UTI‐CCP Advantage Fund 1‐Star Down 3‐Star 30 21 13 97 92
JPMorgan India Smaller Companies Fund 1‐Star Down 3‐Star 43 21 13 37 68
HDFC Premier Multi ‐ Cap Fund 1‐Star Down 2‐Star 40 90 12 47 46
ICRA Equity Index
Schemes
December Qtr Rank
Change
September Qtr Rank
IER Corpus Cut Off
Weightages 90% 10%
IDBI Nifty Index Fund 4‐Star Same 4‐Star 2 2
UTI Nifty Fund 4‐Star Same 4‐Star 1 1
Reliance Index Fund ‐ Nifty Plan 3‐Star Same 3‐Star 6 7
Franklin India Index Fund ‐ BSE Sensex Plan 3‐Star Same 3‐Star 5 8
UTI Master Index Fund 3‐Star Same 3‐Star 4 6
IDBI Nifty Junior Index Fund 3‐Star Up 2‐Star 3 10
HDFC Index Fund ‐ Sensex Plan 2‐Star Same 2‐Star 9 9
HDFC Index Fund ‐ Nifty Plan 2‐Star Up 1‐Star 8 5
Franklin India Index Fund ‐ NSE Nifty Plan 2‐Star Down 3‐Star 7 3
LIC Nomura MF Index Fund ‐ Sensex Plan 1‐Star Same 1‐Star 14 14
LIC Nomura MF Index Fund ‐ Nifty Plan 1‐Star Same 1‐Star 13 11
ICICI Prudential Index Fund 1‐Star Same 1‐Star 12 4
Birla Sun Life Index Fund 1‐Star Same 1‐Star 11 12
SBI Magnum Index Fund 1‐Star Down 2‐Star 10 13
ICRA Equity Large Cap
Schemes
December Qtr Rank
Change
September Qtr Rank
IER Company Concentrati
on
Sector
Concentration
Liquidity Corpus Cut Off
Weightages 60% 10% 10% 10% 10%
UTI Opportunities Fund 5‐Star Same 5‐Star 1 28 1 8 9
Franklin India Bluechip 5‐Star Up 4‐Star 14 1 18 3 2
ICICI Prudential Focused Bluechip Equity Fund 5‐Star Same 5‐Star 2 43 41 2 6
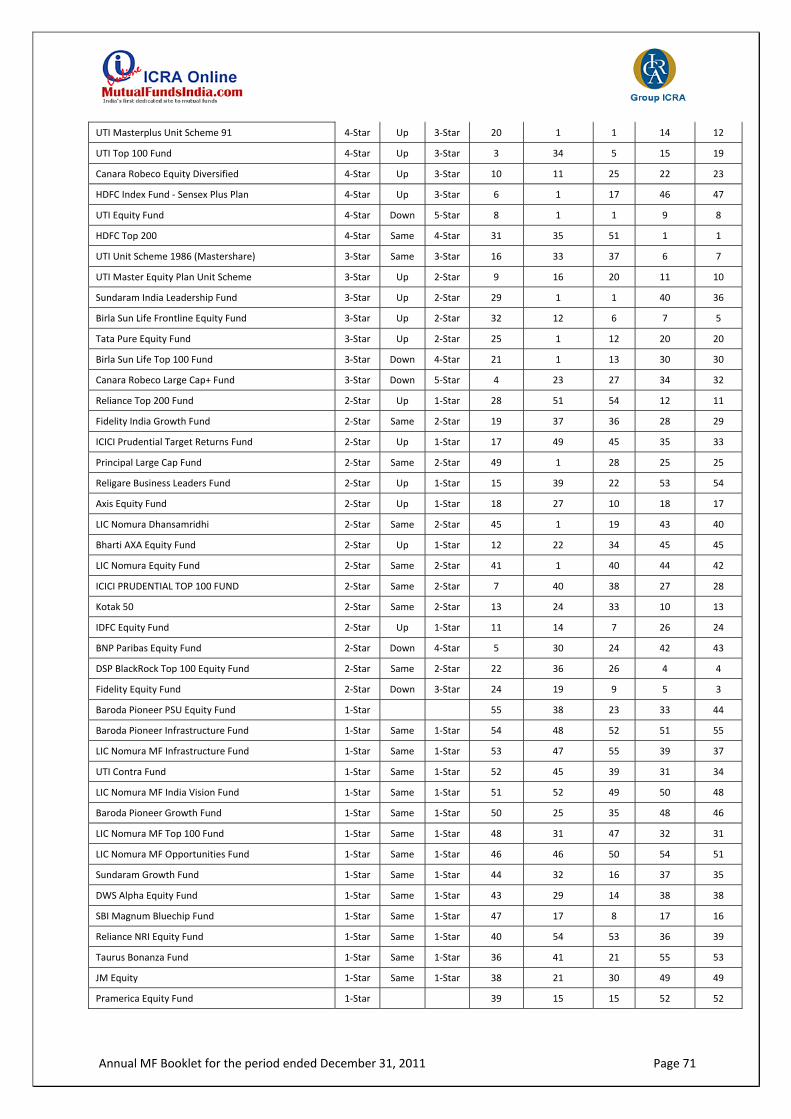
Annual MF Booklet for the period ended December 31, 2011 Page 71
UTI Masterplus Unit Scheme 91 4‐Star Up 3‐Star 20 1 1 14 12
UTI Top 100 Fund 4‐Star Up 3‐Star 3 34 5 15 19
Canara Robeco Equity Diversified 4‐Star Up 3‐Star 10 11 25 22 23
HDFC Index Fund ‐ Sensex Plus Plan 4‐Star Up 3‐Star 6 1 17 46 47
UTI Equity Fund 4‐Star Down 5‐Star 8 1 1 9 8
HDFC Top 200 4‐Star Same 4‐Star 31 35 51 1 1
UTI Unit Scheme 1986 (Mastershare) 3‐Star Same 3‐Star 16 33 37 6 7
UTI Master Equity Plan Unit Scheme 3‐Star Up 2‐Star 9 16 20 11 10
Sundaram India Leadership Fund 3‐Star Up 2‐Star 29 1 1 40 36
Birla Sun Life Frontline Equity Fund 3‐Star Up 2‐Star 32 12 6 7 5
Tata Pure Equity Fund 3‐Star Up 2‐Star 25 1 12 20 20
Birla Sun Life Top 100 Fund 3‐Star Down 4‐Star 21 1 13 30 30
Canara Robeco Large Cap+ Fund 3‐Star Down 5‐Star 4 23 27 34 32
Reliance Top 200 Fund 2‐Star Up 1‐Star 28 51 54 12 11
Fidelity India Growth Fund 2‐Star Same 2‐Star 19 37 36 28 29
ICICI Prudential Target Returns Fund 2‐Star Up 1‐Star 17 49 45 35 33
Principal Large Cap Fund 2‐Star Same 2‐Star 49 1 28 25 25
Religare Business Leaders Fund 2‐Star Up 1‐Star 15 39 22 53 54
Axis Equity Fund 2‐Star Up 1‐Star 18 27 10 18 17
LIC Nomura Dhansamridhi 2‐Star Same 2‐Star 45 1 19 43 40
Bharti AXA Equity Fund 2‐Star Up 1‐Star 12 22 34 45 45
LIC Nomura Equity Fund 2‐Star Same 2‐Star 41 1 40 44 42
ICICI PRUDENTIAL TOP 100 FUND 2‐Star Same 2‐Star 7 40 38 27 28
Kotak 50 2‐Star Same 2‐Star 13 24 33 10 13
IDFC Equity Fund 2‐Star Up 1‐Star 11 14 7 26 24
BNP Paribas Equity Fund 2‐Star Down 4‐Star 5 30 24 42 43
DSP BlackRock Top 100 Equity Fund 2‐Star Same 2‐Star 22 36 26 4 4
Fidelity Equity Fund 2‐Star Down 3‐Star 24 19 9 5 3
Baroda Pioneer PSU Equity Fund 1‐Star 55 38 23 33 44
Baroda Pioneer Infrastructure Fund 1‐Star Same 1‐Star 54 48 52 51 55
LIC Nomura MF Infrastructure Fund 1‐Star Same 1‐Star 53 47 55 39 37
UTI Contra Fund 1‐Star Same 1‐Star 52 45 39 31 34
LIC Nomura MF India Vision Fund 1‐Star Same 1‐Star 51 52 49 50 48
Baroda Pioneer Growth Fund 1‐Star Same 1‐Star 50 25 35 48 46
LIC Nomura MF Top 100 Fund 1‐Star Same 1‐Star 48 31 47 32 31
LIC Nomura MF Opportunities Fund 1‐Star Same 1‐Star 46 46 50 54 51
Sundaram Growth Fund 1‐Star Same 1‐Star 44 32 16 37 35
DWS Alpha Equity Fund 1‐Star Same 1‐Star 43 29 14 38 38
SBI Magnum Bluechip Fund 1‐Star Same 1‐Star 47 17 8 17 16
Reliance NRI Equity Fund 1‐Star Same 1‐Star 40 54 53 36 39
Taurus Bonanza Fund 1‐Star Same 1‐Star 36 41 21 55 53
JM Equity 1‐Star Same 1‐Star 38 21 30 49 49
Pramerica Equity Fund 1‐Star 39 15 15 52 52
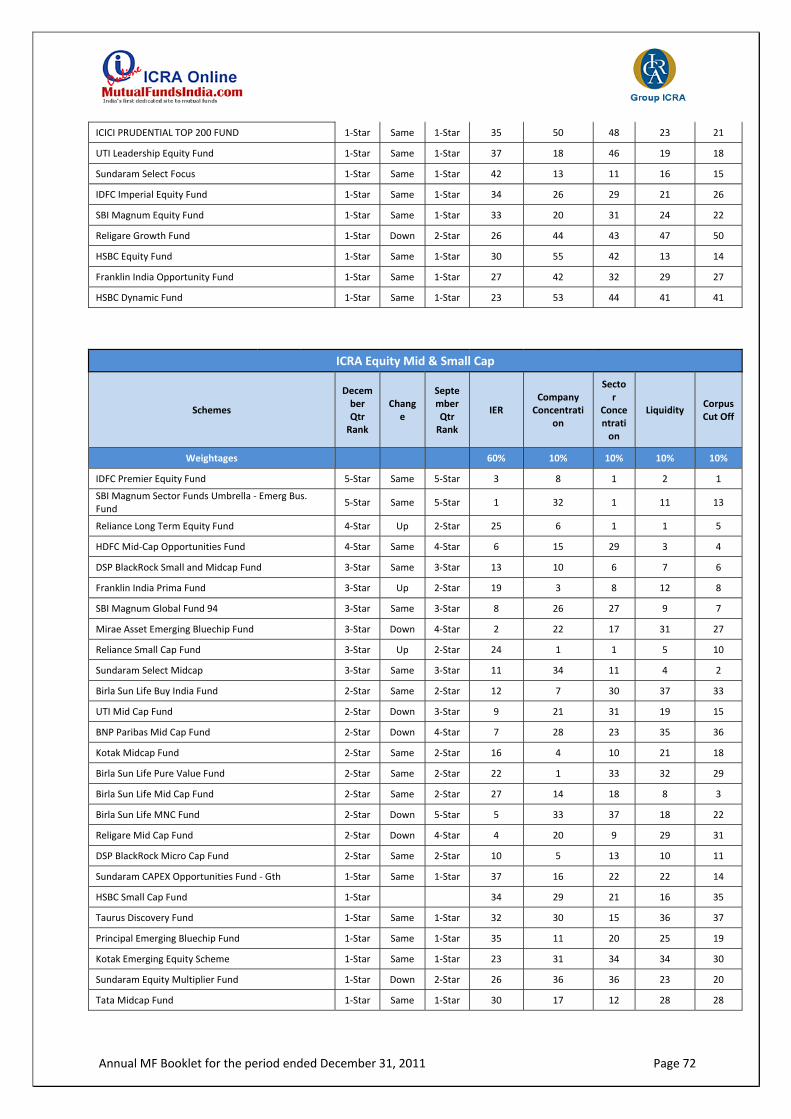
Annual MF Booklet for the period ended December 31, 2011 Page 72
ICICI PRUDENTIAL TOP 200 FUND 1‐Star Same 1‐Star 35 50 48 23 21
UTI Leadership Equity Fund 1‐Star Same 1‐Star 37 18 46 19 18
Sundaram Select Focus 1‐Star Same 1‐Star 42 13 11 16 15
IDFC Imperial Equity Fund 1‐Star Same 1‐Star 34 26 29 21 26
SBI Magnum Equity Fund 1‐Star Same 1‐Star 33 20 31 24 22
Religare Growth Fund 1‐Star Down 2‐Star 26 44 43 47 50
HSBC Equity Fund 1‐Star Same 1‐Star 30 55 42 13 14
Franklin India Opportunity Fund 1‐Star Same 1‐Star 27 42 32 29 27
HSBC Dynamic Fund 1‐Star Same 1‐Star 23 53 44 41 41
ICRA Equity Mid & Small Cap
Schemes
December Qtr Rank
Change
September Qtr Rank
IER Company Concentrati
on
Sector
Concentration
Liquidity Corpus Cut Off
Weightages 60% 10% 10% 10% 10%
IDFC Premier Equity Fund 5‐Star Same 5‐Star 3 8 1 2 1
SBI Magnum Sector Funds Umbrella ‐ Emerg Bus. Fund
5‐Star Same 5‐Star 1 32 1 11 13
Reliance Long Term Equity Fund 4‐Star Up 2‐Star 25 6 1 1 5
HDFC Mid‐Cap Opportunities Fund 4‐Star Same 4‐Star 6 15 29 3 4
DSP BlackRock Small and Midcap Fund 3‐Star Same 3‐Star 13 10 6 7 6
Franklin India Prima Fund 3‐Star Up 2‐Star 19 3 8 12 8
SBI Magnum Global Fund 94 3‐Star Same 3‐Star 8 26 27 9 7
Mirae Asset Emerging Bluechip Fund 3‐Star Down 4‐Star 2 22 17 31 27
Reliance Small Cap Fund 3‐Star Up 2‐Star 24 1 1 5 10
Sundaram Select Midcap 3‐Star Same 3‐Star 11 34 11 4 2
Birla Sun Life Buy India Fund 2‐Star Same 2‐Star 12 7 30 37 33
UTI Mid Cap Fund 2‐Star Down 3‐Star 9 21 31 19 15
BNP Paribas Mid Cap Fund 2‐Star Down 4‐Star 7 28 23 35 36
Kotak Midcap Fund 2‐Star Same 2‐Star 16 4 10 21 18
Birla Sun Life Pure Value Fund 2‐Star Same 2‐Star 22 1 33 32 29
Birla Sun Life Mid Cap Fund 2‐Star Same 2‐Star 27 14 18 8 3
Birla Sun Life MNC Fund 2‐Star Down 5‐Star 5 33 37 18 22
Religare Mid Cap Fund 2‐Star Down 4‐Star 4 20 9 29 31
DSP BlackRock Micro Cap Fund 2‐Star Same 2‐Star 10 5 13 10 11
Sundaram CAPEX Opportunities Fund ‐ Gth 1‐Star Same 1‐Star 37 16 22 22 14
HSBC Small Cap Fund 1‐Star 34 29 21 16 35
Taurus Discovery Fund 1‐Star Same 1‐Star 32 30 15 36 37
Principal Emerging Bluechip Fund 1‐Star Same 1‐Star 35 11 20 25 19
Kotak Emerging Equity Scheme 1‐Star Same 1‐Star 23 31 34 34 30
Sundaram Equity Multiplier Fund 1‐Star Down 2‐Star 26 36 36 23 20
Tata Midcap Fund 1‐Star Same 1‐Star 30 17 12 28 28
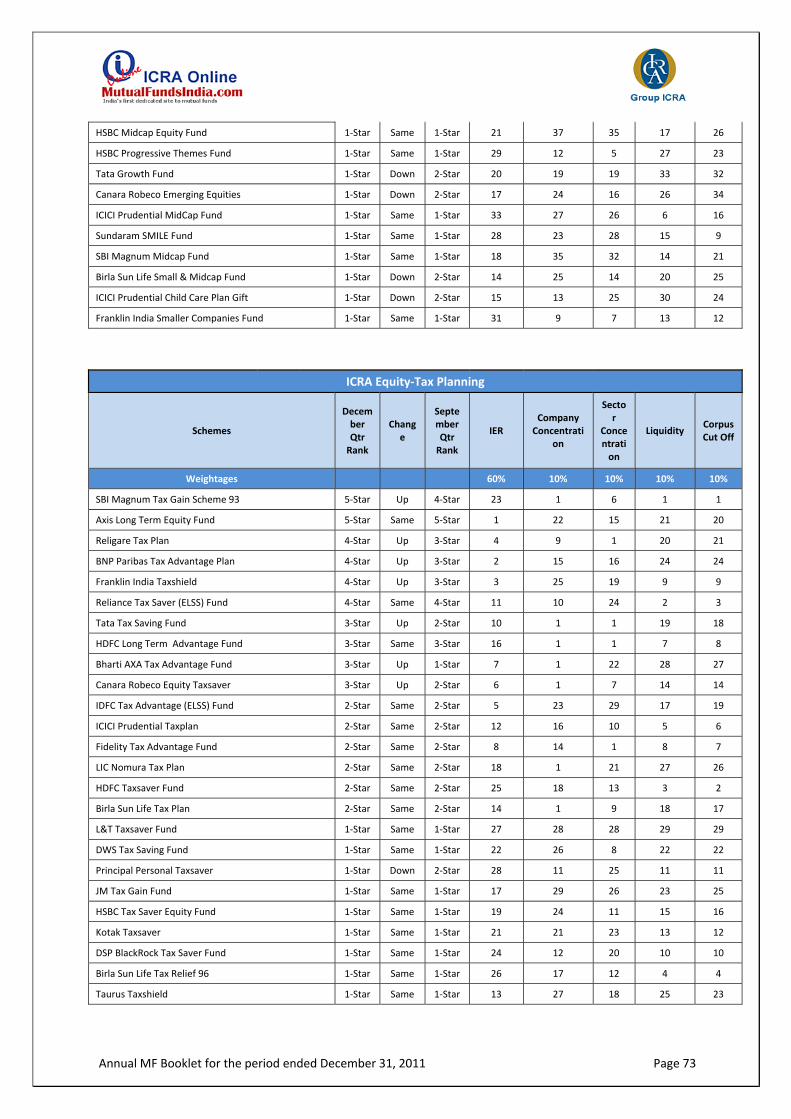
Annual MF Booklet for the period ended December 31, 2011 Page 73
HSBC Midcap Equity Fund 1‐Star Same 1‐Star 21 37 35 17 26
HSBC Progressive Themes Fund 1‐Star Same 1‐Star 29 12 5 27 23
Tata Growth Fund 1‐Star Down 2‐Star 20 19 19 33 32
Canara Robeco Emerging Equities 1‐Star Down 2‐Star 17 24 16 26 34
ICICI Prudential MidCap Fund 1‐Star Same 1‐Star 33 27 26 6 16
Sundaram SMILE Fund 1‐Star Same 1‐Star 28 23 28 15 9
SBI Magnum Midcap Fund 1‐Star Same 1‐Star 18 35 32 14 21
Birla Sun Life Small & Midcap Fund 1‐Star Down 2‐Star 14 25 14 20 25
ICICI Prudential Child Care Plan Gift 1‐Star Down 2‐Star 15 13 25 30 24
Franklin India Smaller Companies Fund 1‐Star Same 1‐Star 31 9 7 13 12
ICRA Equity‐Tax Planning
Schemes
December Qtr Rank
Change
September Qtr Rank
IER Company Concentrati
on
Sector
Concentration
Liquidity Corpus Cut Off
Weightages 60% 10% 10% 10% 10%
SBI Magnum Tax Gain Scheme 93 5‐Star Up 4‐Star 23 1 6 1 1
Axis Long Term Equity Fund 5‐Star Same 5‐Star 1 22 15 21 20
Religare Tax Plan 4‐Star Up 3‐Star 4 9 1 20 21
BNP Paribas Tax Advantage Plan 4‐Star Up 3‐Star 2 15 16 24 24
Franklin India Taxshield 4‐Star Up 3‐Star 3 25 19 9 9
Reliance Tax Saver (ELSS) Fund 4‐Star Same 4‐Star 11 10 24 2 3
Tata Tax Saving Fund 3‐Star Up 2‐Star 10 1 1 19 18
HDFC Long Term Advantage Fund 3‐Star Same 3‐Star 16 1 1 7 8
Bharti AXA Tax Advantage Fund 3‐Star Up 1‐Star 7 1 22 28 27
Canara Robeco Equity Taxsaver 3‐Star Up 2‐Star 6 1 7 14 14
IDFC Tax Advantage (ELSS) Fund 2‐Star Same 2‐Star 5 23 29 17 19
ICICI Prudential Taxplan 2‐Star Same 2‐Star 12 16 10 5 6
Fidelity Tax Advantage Fund 2‐Star Same 2‐Star 8 14 1 8 7
LIC Nomura Tax Plan 2‐Star Same 2‐Star 18 1 21 27 26
HDFC Taxsaver Fund 2‐Star Same 2‐Star 25 18 13 3 2
Birla Sun Life Tax Plan 2‐Star Same 2‐Star 14 1 9 18 17
L&T Taxsaver Fund 1‐Star Same 1‐Star 27 28 28 29 29
DWS Tax Saving Fund 1‐Star Same 1‐Star 22 26 8 22 22
Principal Personal Taxsaver 1‐Star Down 2‐Star 28 11 25 11 11
JM Tax Gain Fund 1‐Star Same 1‐Star 17 29 26 23 25
HSBC Tax Saver Equity Fund 1‐Star Same 1‐Star 19 24 11 15 16
Kotak Taxsaver 1‐Star Same 1‐Star 21 21 23 13 12
DSP BlackRock Tax Saver Fund 1‐Star Same 1‐Star 24 12 20 10 10
Birla Sun Life Tax Relief 96 1‐Star Same 1‐Star 26 17 12 4 4
Taurus Taxshield 1‐Star Same 1‐Star 13 27 18 25 23

Annual MF Booklet for the period ended December 31, 2011 Page 74
UTI Equity Tax Savings Plan 1‐Star Same 1‐Star 15 13 17 12 13
ING Tax Saving Fund 1‐Star Same 1‐Star 9 19 27 26 28
Sundaram Taxsaver 1‐Star Same 1‐Star 20 20 14 6 5
Principal Tax Savings Fund 1‐Star Down 2‐Star 29 1 1 16 15
ICRA Marginal Equity
Schemes
December Qtr Rank
Change
September Qtr Rank
IER Sector
Concentration
Credit Indicator
Average Maturity
Corpus Cut Off
Weightages 65% 5% 10% 10% 10%
Axis Triple Advantage Fund 5‐Star Up 2‐Star 1 2 38 40 18
HDFC Multiple Yield Fund 5‐Star Up 3‐Star 5 9 14 2 36
Taurus MIP Advantage Fund 5‐Star Up 3‐Star 4 6 10 18 35
Religare Monthly Income Plan Plus 5‐Star 3 32 28 3 28
Birla Sun Life MIP ‐ Savings 5 4‐Star Down 5‐Star 7 12 2 20 10
HDFC Multiple Yield Fund ‐ Plan 2005 4‐Star Down 5‐Star 6 18 5 5 21
HDFC Childrens Gift Fund Saving 4‐Star Up 3‐Star 2 23 13 29 33
DWS Money Plus Advantage Fund 3‐Star Same 3‐Star 11 29 8 4 37
FT India Monthly Income Plan 3‐Star Up 2‐Star 8 22 17 19 14
Birla Sun Life MIP 2‐Star Same 2‐Star 19 11 9 13 24
Birla Sun Life MIP ‐ Wealth 25 2‐Star Same 2‐Star 18 8 30 14 17
ICICI Prudential MIP 25 2‐Star Up 1‐Star 16 38 31 12 6
SBI Magnum Income Plus Fund ‐ Investment Plan 2‐Star Same 2‐Star 15 24 12 22 32
DSP BlackRock MIP Fund 2‐Star Same 2‐Star 14 25 27 10 23
Reliance Monthly Income Plan 2‐Star Same 2‐Star 23 19 19 38 2
Peerless Income Plus Fund 2‐Star Down 4‐Star 28 3 32 1 38
UTI Unit Linked Insurance Plan 2‐Star Up 1‐Star 13 7 40 30 4
UTI Childrens Career Balanced Plan 2‐Star Up 1‐Star 12 13 39 37 3
HDFC Monthly Income Plan ‐ Long Term Plan 2‐Star Same 2‐Star 25 10 26 34 1
DWS Twin Advantage Fund 2‐Star Same 2‐Star 10 28 24 6 39
UTI Charitable and Religious Trusts 2‐Star Up 1‐Star 9 26 35 25 15
Principal Debt Savings Fund ‐ MIP 1‐Star Down 3‐Star 41 27 3 17 34
Sundaram MIP ‐ Moderate 1‐Star Same 1‐Star 38 30 25 27 40
LIC Nomura Monthly Income Plan 1‐Star Same 1‐Star 36 36 34 24 30
UTI Mahila Unit Scheme 1‐Star Same 1‐Star 34 34 37 33 22
Principal Debt Savings Fund ‐ Retail Plan 1‐Star Same 1‐Star 40 5 23 15 31
Tata Monthly Income Fund 1‐Star Down 2‐Star 35 37 7 41 41
SBI Magnum Monthly Income Plan 1‐Star Down 2‐Star 37 14 1 35 19
HSBC MIP ‐ Regular Plan 1‐Star Down 2‐Star 39 4 4 28 25
HDFC Monthly Income Plan ‐ Short Term Plan 1‐Star Down 2‐Star 31 35 20 23 13
UTI Monthly Income Scheme 1‐Star Down 2‐Star 29 33 11 32 9
Kotak Monthly Income Plan 1‐Star Same 1‐Star 26 41 29 21 29
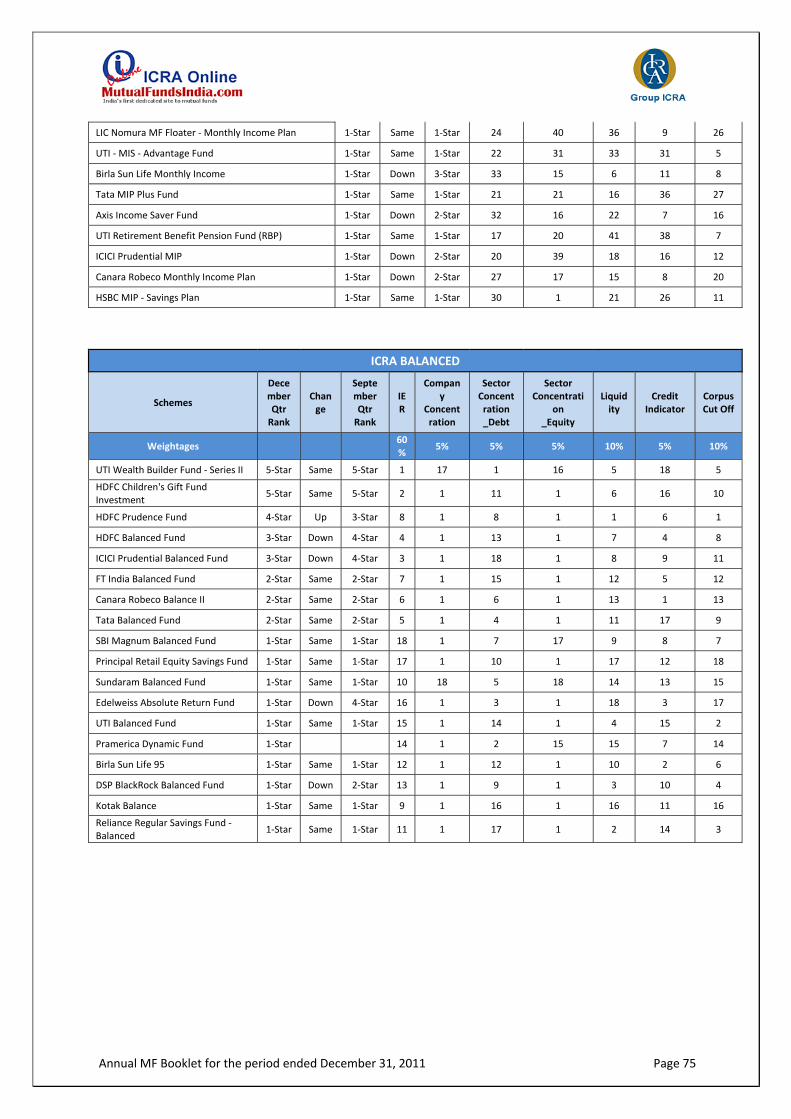
Annual MF Booklet for the period ended December 31, 2011 Page 75
LIC Nomura MF Floater ‐ Monthly Income Plan 1‐Star Same 1‐Star 24 40 36 9 26
UTI ‐ MIS ‐ Advantage Fund 1‐Star Same 1‐Star 22 31 33 31 5
Birla Sun Life Monthly Income 1‐Star Down 3‐Star 33 15 6 11 8
Tata MIP Plus Fund 1‐Star Same 1‐Star 21 21 16 36 27
Axis Income Saver Fund 1‐Star Down 2‐Star 32 16 22 7 16
UTI Retirement Benefit Pension Fund (RBP) 1‐Star Same 1‐Star 17 20 41 38 7
ICICI Prudential MIP 1‐Star Down 2‐Star 20 39 18 16 12
Canara Robeco Monthly Income Plan 1‐Star Down 2‐Star 27 17 15 8 20
HSBC MIP ‐ Savings Plan 1‐Star Same 1‐Star 30 1 21 26 11
ICRA BALANCED
Schemes
December Qtr Rank
Change
September Qtr Rank
IER
Company
Concentration
Sector Concentration _Debt
Sector Concentrati
on _Equity
Liquidity
Credit Indicator
Corpus Cut Off
Weightages 60%
5% 5% 5% 10% 5% 10%
UTI Wealth Builder Fund ‐ Series II 5‐Star Same 5‐Star 1 17 1 16 5 18 5
HDFC Children's Gift Fund Investment
5‐Star Same 5‐Star 2 1 11 1 6 16 10
HDFC Prudence Fund 4‐Star Up 3‐Star 8 1 8 1 1 6 1
HDFC Balanced Fund 3‐Star Down 4‐Star 4 1 13 1 7 4 8
ICICI Prudential Balanced Fund 3‐Star Down 4‐Star 3 1 18 1 8 9 11
FT India Balanced Fund 2‐Star Same 2‐Star 7 1 15 1 12 5 12
Canara Robeco Balance II 2‐Star Same 2‐Star 6 1 6 1 13 1 13
Tata Balanced Fund 2‐Star Same 2‐Star 5 1 4 1 11 17 9
SBI Magnum Balanced Fund 1‐Star Same 1‐Star 18 1 7 17 9 8 7
Principal Retail Equity Savings Fund 1‐Star Same 1‐Star 17 1 10 1 17 12 18
Sundaram Balanced Fund 1‐Star Same 1‐Star 10 18 5 18 14 13 15
Edelweiss Absolute Return Fund 1‐Star Down 4‐Star 16 1 3 1 18 3 17
UTI Balanced Fund 1‐Star Same 1‐Star 15 1 14 1 4 15 2
Pramerica Dynamic Fund 1‐Star 14 1 2 15 15 7 14
Birla Sun Life 95 1‐Star Same 1‐Star 12 1 12 1 10 2 6
DSP BlackRock Balanced Fund 1‐Star Down 2‐Star 13 1 9 1 3 10 4
Kotak Balance 1‐Star Same 1‐Star 9 1 16 1 16 11 16
Reliance Regular Savings Fund ‐ Balanced
1‐Star Same 1‐Star 11 1 17 1 2 14 3
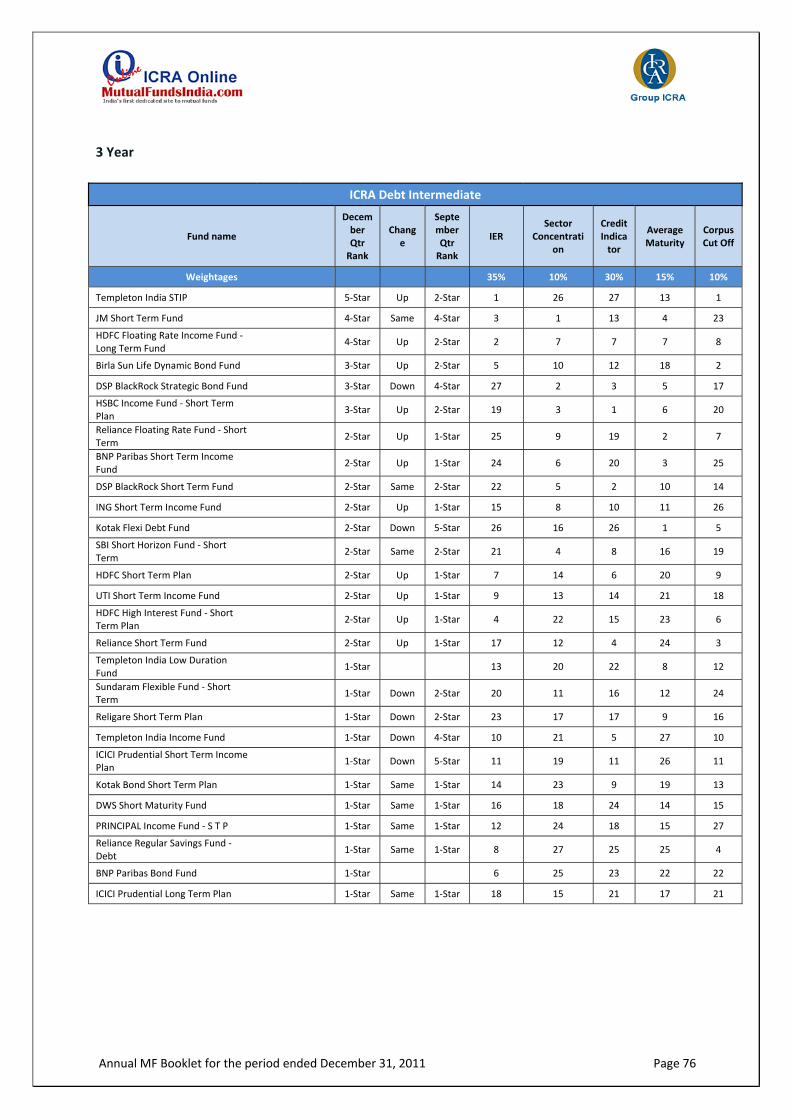
Annual MF Booklet for the period ended December 31, 2011 Page 76
3 Year
ICRA Debt Intermediate
Fund name
December Qtr Rank
Change
September Qtr Rank
IER Sector
Concentration
Credit Indicator
Average Maturity
Corpus Cut Off
Weightages 35% 10% 30% 15% 10%
Templeton India STIP 5‐Star Up 2‐Star 1 26 27 13 1
JM Short Term Fund 4‐Star Same 4‐Star 3 1 13 4 23
HDFC Floating Rate Income Fund ‐Long Term Fund
4‐Star Up 2‐Star 2 7 7 7 8
Birla Sun Life Dynamic Bond Fund 3‐Star Up 2‐Star 5 10 12 18 2
DSP BlackRock Strategic Bond Fund 3‐Star Down 4‐Star 27 2 3 5 17
HSBC Income Fund ‐ Short Term Plan
3‐Star Up 2‐Star 19 3 1 6 20
Reliance Floating Rate Fund ‐ Short Term
2‐Star Up 1‐Star 25 9 19 2 7
BNP Paribas Short Term Income Fund
2‐Star Up 1‐Star 24 6 20 3 25
DSP BlackRock Short Term Fund 2‐Star Same 2‐Star 22 5 2 10 14
ING Short Term Income Fund 2‐Star Up 1‐Star 15 8 10 11 26
Kotak Flexi Debt Fund 2‐Star Down 5‐Star 26 16 26 1 5
SBI Short Horizon Fund ‐ Short Term
2‐Star Same 2‐Star 21 4 8 16 19
HDFC Short Term Plan 2‐Star Up 1‐Star 7 14 6 20 9
UTI Short Term Income Fund 2‐Star Up 1‐Star 9 13 14 21 18
HDFC High Interest Fund ‐ Short Term Plan
2‐Star Up 1‐Star 4 22 15 23 6
Reliance Short Term Fund 2‐Star Up 1‐Star 17 12 4 24 3
Templeton India Low Duration Fund
1‐Star 13 20 22 8 12
Sundaram Flexible Fund ‐ Short Term
1‐Star Down 2‐Star 20 11 16 12 24
Religare Short Term Plan 1‐Star Down 2‐Star 23 17 17 9 16
Templeton India Income Fund 1‐Star Down 4‐Star 10 21 5 27 10
ICICI Prudential Short Term Income Plan
1‐Star Down 5‐Star 11 19 11 26 11
Kotak Bond Short Term Plan 1‐Star Same 1‐Star 14 23 9 19 13
DWS Short Maturity Fund 1‐Star Same 1‐Star 16 18 24 14 15
PRINCIPAL Income Fund ‐ S T P 1‐Star Same 1‐Star 12 24 18 15 27
Reliance Regular Savings Fund ‐ Debt
1‐Star Same 1‐Star 8 27 25 25 4
BNP Paribas Bond Fund 1‐Star 6 25 23 22 22
ICICI Prudential Long Term Plan 1‐Star Same 1‐Star 18 15 21 17 21
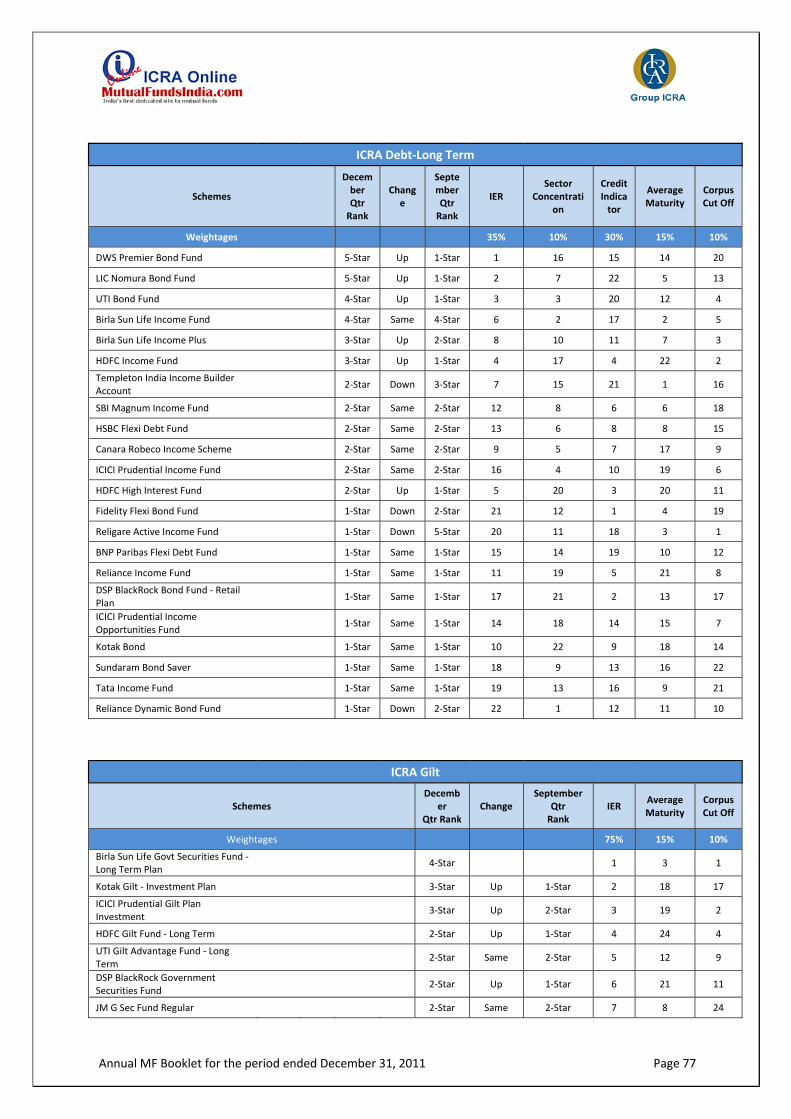
Annual MF Booklet for the period ended December 31, 2011 Page 77
ICRA Debt‐Long Term
Schemes
December Qtr Rank
Change
September Qtr Rank
IER Sector
Concentration
Credit Indicator
Average Maturity
Corpus Cut Off
Weightages 35% 10% 30% 15% 10%
DWS Premier Bond Fund 5‐Star Up 1‐Star 1 16 15 14 20
LIC Nomura Bond Fund 5‐Star Up 1‐Star 2 7 22 5 13
UTI Bond Fund 4‐Star Up 1‐Star 3 3 20 12 4
Birla Sun Life Income Fund 4‐Star Same 4‐Star 6 2 17 2 5
Birla Sun Life Income Plus 3‐Star Up 2‐Star 8 10 11 7 3
HDFC Income Fund 3‐Star Up 1‐Star 4 17 4 22 2
Templeton India Income Builder Account
2‐Star Down 3‐Star 7 15 21 1 16
SBI Magnum Income Fund 2‐Star Same 2‐Star 12 8 6 6 18
HSBC Flexi Debt Fund 2‐Star Same 2‐Star 13 6 8 8 15
Canara Robeco Income Scheme 2‐Star Same 2‐Star 9 5 7 17 9
ICICI Prudential Income Fund 2‐Star Same 2‐Star 16 4 10 19 6
HDFC High Interest Fund 2‐Star Up 1‐Star 5 20 3 20 11
Fidelity Flexi Bond Fund 1‐Star Down 2‐Star 21 12 1 4 19
Religare Active Income Fund 1‐Star Down 5‐Star 20 11 18 3 1
BNP Paribas Flexi Debt Fund 1‐Star Same 1‐Star 15 14 19 10 12
Reliance Income Fund 1‐Star Same 1‐Star 11 19 5 21 8
DSP BlackRock Bond Fund ‐ Retail Plan
1‐Star Same 1‐Star 17 21 2 13 17
ICICI Prudential Income Opportunities Fund
1‐Star Same 1‐Star 14 18 14 15 7
Kotak Bond 1‐Star Same 1‐Star 10 22 9 18 14
Sundaram Bond Saver 1‐Star Same 1‐Star 18 9 13 16 22
Tata Income Fund 1‐Star Same 1‐Star 19 13 16 9 21
Reliance Dynamic Bond Fund 1‐Star Down 2‐Star 22 1 12 11 10
ICRA Gilt
Schemes Decemb
er Qtr Rank
Change September
Qtr Rank
IER Average Maturity
Corpus Cut Off
Weightages 75% 15% 10%
Birla Sun Life Govt Securities Fund ‐ Long Term Plan
4‐Star 1 3 1
Kotak Gilt ‐ Investment Plan 3‐Star Up 1‐Star 2 18 17
ICICI Prudential Gilt Plan Investment
3‐Star Up 2‐Star 3 19 2
HDFC Gilt Fund ‐ Long Term 2‐Star Up 1‐Star 4 24 4
UTI Gilt Advantage Fund ‐ Long Term
2‐Star Same 2‐Star 5 12 9
DSP BlackRock Government Securities Fund
2‐Star Up 1‐Star 6 21 11
JM G Sec Fund Regular 2‐Star Same 2‐Star 7 8 24

Annual MF Booklet for the period ended December 31, 2011 Page 78
Tata Gilt Securities Fund ‐ HIP 2‐Star 8 22 23
Tata Gilt Securities Fund 2‐Star Up 1‐Star 9 22 8
Templeton India Government Securities ‐ Long Term Plan
2‐Star Up 1‐Star 10 20 19
SBI Magnum Gilt Fund Long Term 2‐Star Up 1‐Star 11 15 6
Templeton India Government Securities Fund
2‐Star Same 2‐Star 12 17 13
Reliance Gilt Securities Fund 2‐Star Up 1‐Star 13 25 16
HDFC Gilt Fund ‐ Short Term 2‐Star Up 1‐Star 14 7 26
LIC Nomura G Sec Fund 2‐Star Same 2‐Star 15 26 14
PRINCIPAL Government Securities Fund
2‐Star Up 1‐Star 16 16 5
Birla Sun Life Gilt Plus Regular Plan 2‐Star Same 2‐Star 17 10 7
SBI Magnum Gilt Fund Short Term 2‐Star Up 1‐Star 18 4 20
Tata Gilt Securities Short Maturity Fund
2‐Star Up 1‐Star 19 9 12
Fidelity Flexi Gilt Fund 2‐Star Up 1‐Star 20 13 21
Canara Robeco Gilt PGS 2‐Star Same 2‐Star 21 14 22
ICICI Prudential Gilt Plan Treasury 2‐Star Same 2‐Star 22 6 10
UTI G‐Sec Fund 1‐Star Same 1‐Star 23 11 3
Kotak Gilt Fund ‐ Savings Plan 1‐Star Same 1‐Star 24 5 25
UTI G‐Sec Short Term Plan 1‐Star 25 1 18
Templeton India Government Securities Fund Treasury
1‐Star Down 2‐Star 26 2 15
ICRA Liquid
Schemes
December Qtr Rank
Change
September Qtr Rank
IER Sector
Concentration
Credit Indicator
Average Maturity
Corpus Cut Off
Weightages 35% 10% 30% 15% 10%
JPMorgan India Liquid Fund 4‐Star Up 1‐Star 2 33 24 3 21
Sahara Liquid Fund 4‐Star Up 1‐Star 1 20 13 23 32
Canara Robeco Floating Rate Fund 4‐Star Up 1‐Star 4 5 22 19 30
SBI Magnum Insta Cash Fund ‐ Liquid Floater Plan
4‐Star Same 4‐Star 9 1 3 17 29
Birla Sun Life Floating Rate Fund ‐STP
4‐Star 5 6 17 27 27
ICICI Prudential Liquid Plan 4‐Star Same 4‐Star 28 3 4 33 1
PRINCIPAL Cash Management Fund 3‐Star Up 2‐Star 8 7 21 8 28
HDFC Liquid Fund 3‐Star Same 3‐Star 13 12 9 32 4
JM High Liquidity 3‐Star Down 4‐Star 6 14 31 8 14
BNP Paribas Overnight Fund 3‐Star Up 1‐Star 3 30 32 22 26
ICICI Prudential Money Market Fund
3‐Star 31 1 6 2 31
Reliance Liquid Fund Cash 2‐Star Down 3‐Star 30 10 5 1 11
Birla Sun Life Cash Manager 2‐Star Up 1‐Star 16 4 11 7 16
Baroda Pioneer Liquid Fund 2‐Star 7 22 12 26 19
UTI Liquid Fund ‐ Cash Plan 2‐Star Down 3‐Star 22 9 18 30 3
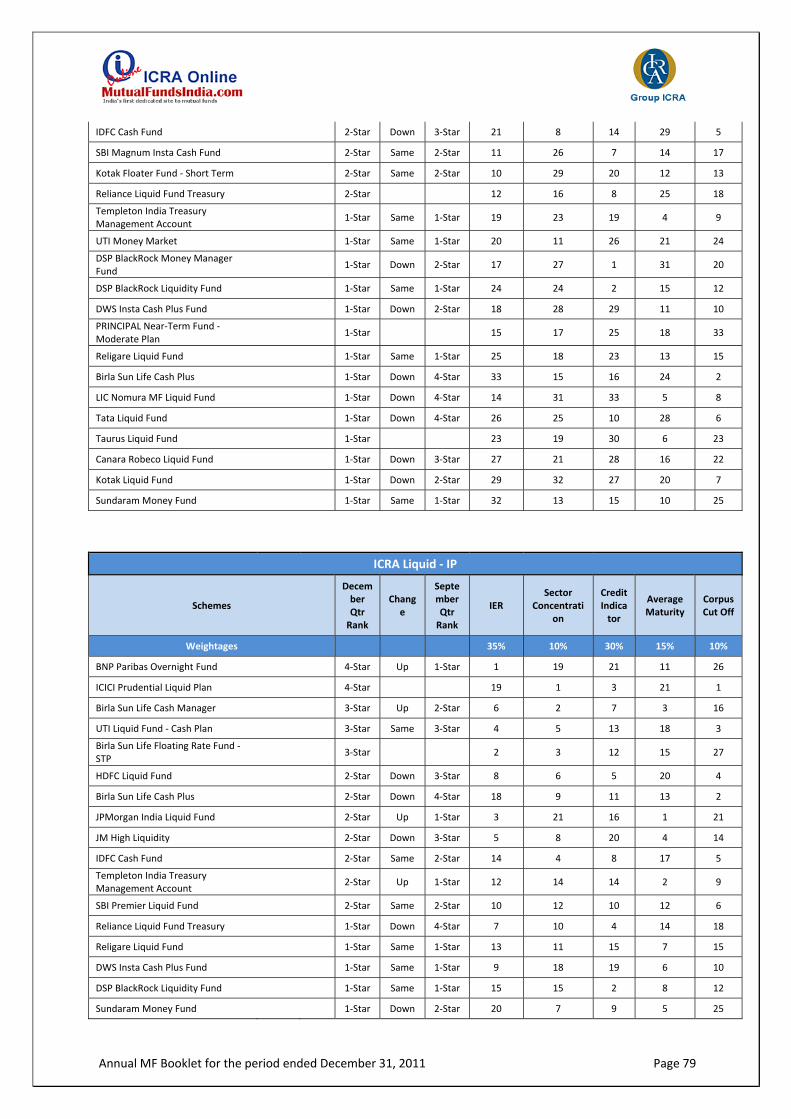
Annual MF Booklet for the period ended December 31, 2011 Page 79
IDFC Cash Fund 2‐Star Down 3‐Star 21 8 14 29 5
SBI Magnum Insta Cash Fund 2‐Star Same 2‐Star 11 26 7 14 17
Kotak Floater Fund ‐ Short Term 2‐Star Same 2‐Star 10 29 20 12 13
Reliance Liquid Fund Treasury 2‐Star 12 16 8 25 18
Templeton India Treasury Management Account
1‐Star Same 1‐Star 19 23 19 4 9
UTI Money Market 1‐Star Same 1‐Star 20 11 26 21 24
DSP BlackRock Money Manager Fund
1‐Star Down 2‐Star 17 27 1 31 20
DSP BlackRock Liquidity Fund 1‐Star Same 1‐Star 24 24 2 15 12
DWS Insta Cash Plus Fund 1‐Star Down 2‐Star 18 28 29 11 10
PRINCIPAL Near‐Term Fund ‐ Moderate Plan
1‐Star 15 17 25 18 33
Religare Liquid Fund 1‐Star Same 1‐Star 25 18 23 13 15
Birla Sun Life Cash Plus 1‐Star Down 4‐Star 33 15 16 24 2
LIC Nomura MF Liquid Fund 1‐Star Down 4‐Star 14 31 33 5 8
Tata Liquid Fund 1‐Star Down 4‐Star 26 25 10 28 6
Taurus Liquid Fund 1‐Star 23 19 30 6 23
Canara Robeco Liquid Fund 1‐Star Down 3‐Star 27 21 28 16 22
Kotak Liquid Fund 1‐Star Down 2‐Star 29 32 27 20 7
Sundaram Money Fund 1‐Star Same 1‐Star 32 13 15 10 25
ICRA Liquid ‐ IP
Schemes
December Qtr Rank
Change
September Qtr Rank
IER Sector
Concentration
Credit Indicator
Average Maturity
Corpus Cut Off
Weightages 35% 10% 30% 15% 10%
BNP Paribas Overnight Fund 4‐Star Up 1‐Star 1 19 21 11 26
ICICI Prudential Liquid Plan 4‐Star 19 1 3 21 1
Birla Sun Life Cash Manager 3‐Star Up 2‐Star 6 2 7 3 16
UTI Liquid Fund ‐ Cash Plan 3‐Star Same 3‐Star 4 5 13 18 3
Birla Sun Life Floating Rate Fund ‐STP
3‐Star 2 3 12 15 27
HDFC Liquid Fund 2‐Star Down 3‐Star 8 6 5 20 4
Birla Sun Life Cash Plus 2‐Star Down 4‐Star 18 9 11 13 2
JPMorgan India Liquid Fund 2‐Star Up 1‐Star 3 21 16 1 21
JM High Liquidity 2‐Star Down 3‐Star 5 8 20 4 14
IDFC Cash Fund 2‐Star Same 2‐Star 14 4 8 17 5
Templeton India Treasury Management Account
2‐Star Up 1‐Star 12 14 14 2 9
SBI Premier Liquid Fund 2‐Star Same 2‐Star 10 12 10 12 6
Reliance Liquid Fund Treasury 1‐Star Down 4‐Star 7 10 4 14 18
Religare Liquid Fund 1‐Star Same 1‐Star 13 11 15 7 15
DWS Insta Cash Plus Fund 1‐Star Same 1‐Star 9 18 19 6 10
DSP BlackRock Liquidity Fund 1‐Star Same 1‐Star 15 15 2 8 12
Sundaram Money Fund 1‐Star Down 2‐Star 20 7 9 5 25
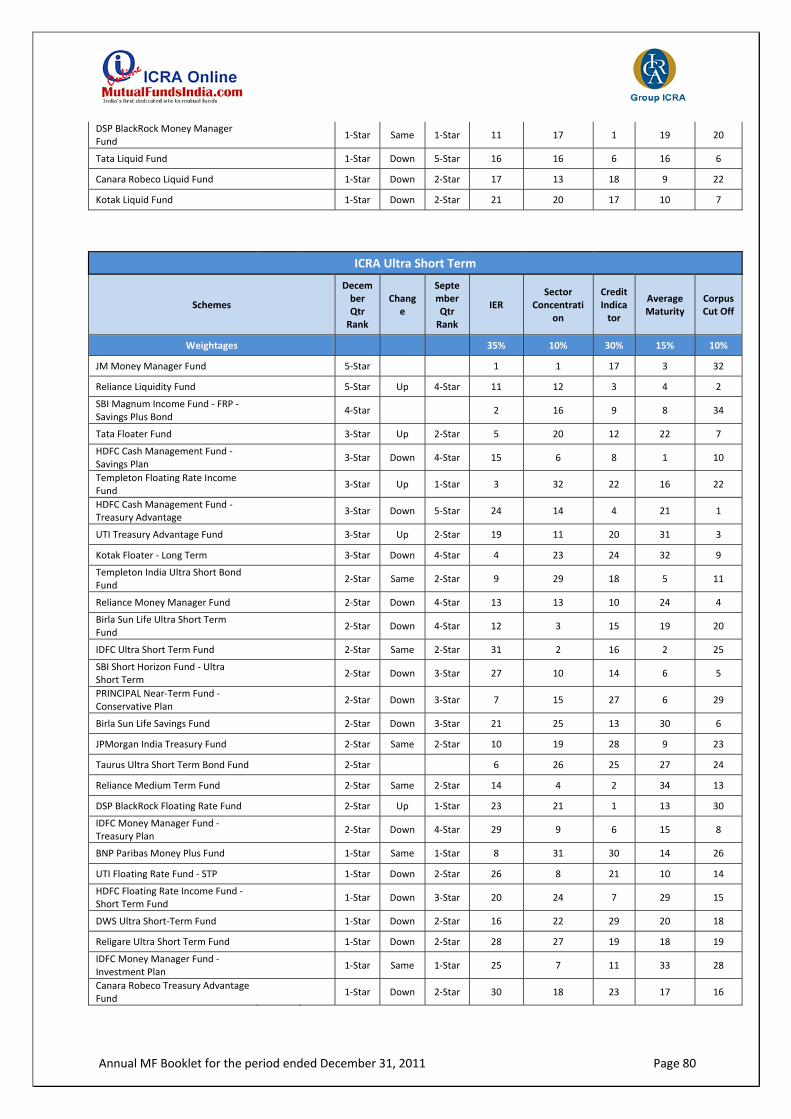
Annual MF Booklet for the period ended December 31, 2011 Page 80
DSP BlackRock Money Manager Fund
1‐Star Same 1‐Star 11 17 1 19 20
Tata Liquid Fund 1‐Star Down 5‐Star 16 16 6 16 6
Canara Robeco Liquid Fund 1‐Star Down 2‐Star 17 13 18 9 22
Kotak Liquid Fund 1‐Star Down 2‐Star 21 20 17 10 7
ICRA Ultra Short Term
Schemes
December Qtr Rank
Change
September Qtr Rank
IER Sector
Concentration
Credit Indicator
Average Maturity
Corpus Cut Off
Weightages 35% 10% 30% 15% 10%
JM Money Manager Fund 5‐Star 1 1 17 3 32
Reliance Liquidity Fund 5‐Star Up 4‐Star 11 12 3 4 2
SBI Magnum Income Fund ‐ FRP ‐Savings Plus Bond
4‐Star 2 16 9 8 34
Tata Floater Fund 3‐Star Up 2‐Star 5 20 12 22 7
HDFC Cash Management Fund ‐Savings Plan
3‐Star Down 4‐Star 15 6 8 1 10
Templeton Floating Rate Income Fund
3‐Star Up 1‐Star 3 32 22 16 22
HDFC Cash Management Fund ‐Treasury Advantage
3‐Star Down 5‐Star 24 14 4 21 1
UTI Treasury Advantage Fund 3‐Star Up 2‐Star 19 11 20 31 3
Kotak Floater ‐ Long Term 3‐Star Down 4‐Star 4 23 24 32 9
Templeton India Ultra Short Bond Fund
2‐Star Same 2‐Star 9 29 18 5 11
Reliance Money Manager Fund 2‐Star Down 4‐Star 13 13 10 24 4
Birla Sun Life Ultra Short Term Fund
2‐Star Down 4‐Star 12 3 15 19 20
IDFC Ultra Short Term Fund 2‐Star Same 2‐Star 31 2 16 2 25
SBI Short Horizon Fund ‐ Ultra Short Term
2‐Star Down 3‐Star 27 10 14 6 5
PRINCIPAL Near‐Term Fund ‐ Conservative Plan
2‐Star Down 3‐Star 7 15 27 6 29
Birla Sun Life Savings Fund 2‐Star Down 3‐Star 21 25 13 30 6
JPMorgan India Treasury Fund 2‐Star Same 2‐Star 10 19 28 9 23
Taurus Ultra Short Term Bond Fund 2‐Star 6 26 25 27 24
Reliance Medium Term Fund 2‐Star Same 2‐Star 14 4 2 34 13
DSP BlackRock Floating Rate Fund 2‐Star Up 1‐Star 23 21 1 13 30
IDFC Money Manager Fund ‐ Treasury Plan
2‐Star Down 4‐Star 29 9 6 15 8
BNP Paribas Money Plus Fund 1‐Star Same 1‐Star 8 31 30 14 26
UTI Floating Rate Fund ‐ STP 1‐Star Down 2‐Star 26 8 21 10 14
HDFC Floating Rate Income Fund ‐Short Term Fund
1‐Star Down 3‐Star 20 24 7 29 15
DWS Ultra Short‐Term Fund 1‐Star Down 2‐Star 16 22 29 20 18
Religare Ultra Short Term Fund 1‐Star Down 2‐Star 28 27 19 18 19
IDFC Money Manager Fund ‐ Investment Plan
1‐Star Same 1‐Star 25 7 11 33 28
Canara Robeco Treasury Advantage Fund
1‐Star Down 2‐Star 30 18 23 17 16

Annual MF Booklet for the period ended December 31, 2011 Page 81
ICICI Prudential Floating Rate Fund 1‐Star Down 2‐Star 32 5 5 28 12
LIC Nomura MF Floating Rate Fund 1‐Star Same 1‐Star 22 34 33 12 31
LIC Nomura MF Savings Plus Fund 1‐Star Same 1‐Star 18 28 32 25 27
Sundaram Ultra Short Term 1‐Star Down 2‐Star 33 17 26 23 21
LIC Nomura MF Income Plus Fund 1‐Star Same 1‐Star 17 30 34 26 17
DWS Money Plus Fund 1‐Star Same 1‐Star 34 33 31 10 33
ICRA Ultra Short Term ‐ IP
Schemes
December Qtr Rank
Change
September Qtr Rank
IER Sector
Concentration
Credit Indicator
Average Maturity
Corpus Cut Off
Weightages 35% 10% 30% 15% 10%
Templeton Floating Rate Income Fund
4‐Star Up 1‐Star 1 22 15 8 22
Birla Sun Life Ultra Short Term Fund
4‐Star Same 4‐Star 12 1 11 11 20
UTI Treasury Advantage Fund 4‐Star Up 2‐Star 9 6 14 21 3
ICICI Prudential Flexible Income Plan
4‐Star 6 7 9 15 2
HDFC Cash Management Fund ‐Treasury Advantage
3‐Star Down 5‐Star 16 9 2 13 1
Reliance Money Manager Fund 3‐Star Down 4‐Star 8 8 6 16 4
Templeton India Ultra Short Bond Fund
3‐Star Up 1‐Star 10 20 12 1 11
Taurus Ultra Short Term Bond Fund 2‐Star 2 18 17 17 24
Birla Sun Life Savings Fund 2‐Star Same 2‐Star 11 17 8 20 6
Religare Ultra Short Term Fund 2‐Star Same 2‐Star 4 19 13 10 19
SBI Short Horizon Fund ‐ Ultra Short Term
2‐Star Same 2‐Star 19 5 10 2 5
IDFC Money Manager Fund ‐ Treasury Plan
2‐Star Down 3‐Star 15 4 4 7 8
JPMorgan India Treasury Fund 2‐Star Same 2‐Star 5 12 20 3 23
BNP Paribas Money Plus Fund 2‐Star Up 1‐Star 3 21 22 6 26
DWS Ultra Short‐Term Fund 1‐Star Same 1‐Star 7 15 21 12 18
JM Money Manager Fund ‐ Super Plus Plan
1‐Star Down 3‐Star 13 13 18 4 20
ICICI Prudential Floating Rate Fund 1‐Star Down 2‐Star 17 2 3 18 12
HDFC Floating Rate Income Fund ‐Short Term Fund
1‐Star Down 2‐Star 14 16 5 19 15
DSP BlackRock Floating Rate Fund 1‐Star Same 1‐Star 20 14 1 5 30
Sundaram Ultra Short Term 1‐Star Same 1‐Star 18 10 19 14 21
Canara Robeco Treasury Advantage Fund
1‐Star Same 1‐Star 22 11 16 9 16
IDFC Money Manager Fund ‐ Investment Plan
1‐Star Same 1‐Star 21 3 7 22 28

Annual MF Booklet for the period ended December 31, 2011 Page 82
ICRA Equity Dynamic
Schemes
December Qtr Rank
Change
September Qtr Rank
IER Company Concentrati
on
Sector
Concentration
Liquidity Corpus Cut Off
Weightages 60% 10% 10% 10% 10%
Quantum Long‐Term Equity Fund 5‐Star Same 5‐Star 2 1 1 86 86
UTI MNC Fund 5‐Star Same 5‐Star 1 97 95 28 63
HDFC Equity Fund 5‐Star Same 5‐Star 14 61 83 2 1
Reliance Equity Opportunities Fund 5‐Star Up 4‐Star 6 35 16 5 8
UTI Equity Fund 4‐Star Same 4‐Star 12 1 10 30 15
Tata Dividend Yield Fund 4‐Star Same 4‐Star 3 74 48 63 60
Reliance Growth Fund 4‐Star Down 5‐Star 44 1 1 1 2
ING Dividend Yield Fund 4‐Star Same 4‐Star 4 25 56 88 87
UTI Dividend Yield Fund 4‐Star Same 4‐Star 9 20 15 7 5
ICICI Prudential Dynamic Plan 4‐Star Same 4‐Star 11 12 11 14 3
Birla Sun Life Dividend Yield Plus 4‐Star Same 4‐Star 7 36 62 11 30
Tata Life Sciences and Technology Fund
4‐Star Up 2‐Star 5 94 96 61 91
UTI Opportunities Fund 4‐Star Up 3‐Star 8 33 9 17 18
HDFC Capital Builder Fund 4‐Star Same 4‐Star 10 82 85 41 38
Tata Equity P/E Fund 3‐Star Same 3‐Star 30 1 20 39 36
HDFC Growth Fund 3‐Star Same 3‐Star 17 14 7 19 22
Tata Ethical Fund 3‐Star Up 2‐Star 13 84 76 64 74
DSP BlackRock Equity Fund 3‐Star Same 3‐Star 24 18 21 12 11
Tata Contra Fund 3‐Star Same 3‐Star 15 89 33 75 80
Reliance Regular Savings Fund ‐ Equity
3‐Star Same 3‐Star 50 1 14 6 6
Templeton India Equity Income Fund
3‐Star Up 2‐Star 21 71 24 13 25
Mirae Asset India Opportunities Fund
3‐Star Up 2‐Star 16 28 27 83 68
HDFC Long Term Equity Fund 3‐Star Same 3‐Star 20 22 31 35 32
Canara Robeco Equity Diversified 3‐Star Same 3‐Star 18 23 75 55 45
UTI India Lifestyle Fund 3‐Star Down 4‐Star 19 86 82 49 40
Birla Sun Life India GenNext Fund 3‐Star Same 3‐Star 23 31 29 73 81
Religare Contra Fund 3‐Star Up 2‐Star 22 70 44 85 90
HDFC Premier Multi ‐ Cap Fund 3‐Star Same 3‐Star 26 88 72 44 42
HDFC Core & Satellite Fund 3‐Star Same 3‐Star 27 77 42 24 46
Birla Sun Life Buy India Fund 3‐Star Same 3‐Star 25 62 74 87 95
Franklin India Prima Plus 3‐Star Up 2‐Star 33 66 45 18 17
DSP BlackRock Opportunities Fund 2‐Star Down 3‐Star 29 27 69 46 34
Morgan Stanley A.C.E Fund 2‐Star Same 2‐Star 28 39 55 59 48
JPMorgan India Smaller Companies 2‐Star Down 3‐Star 31 60 39 31 66
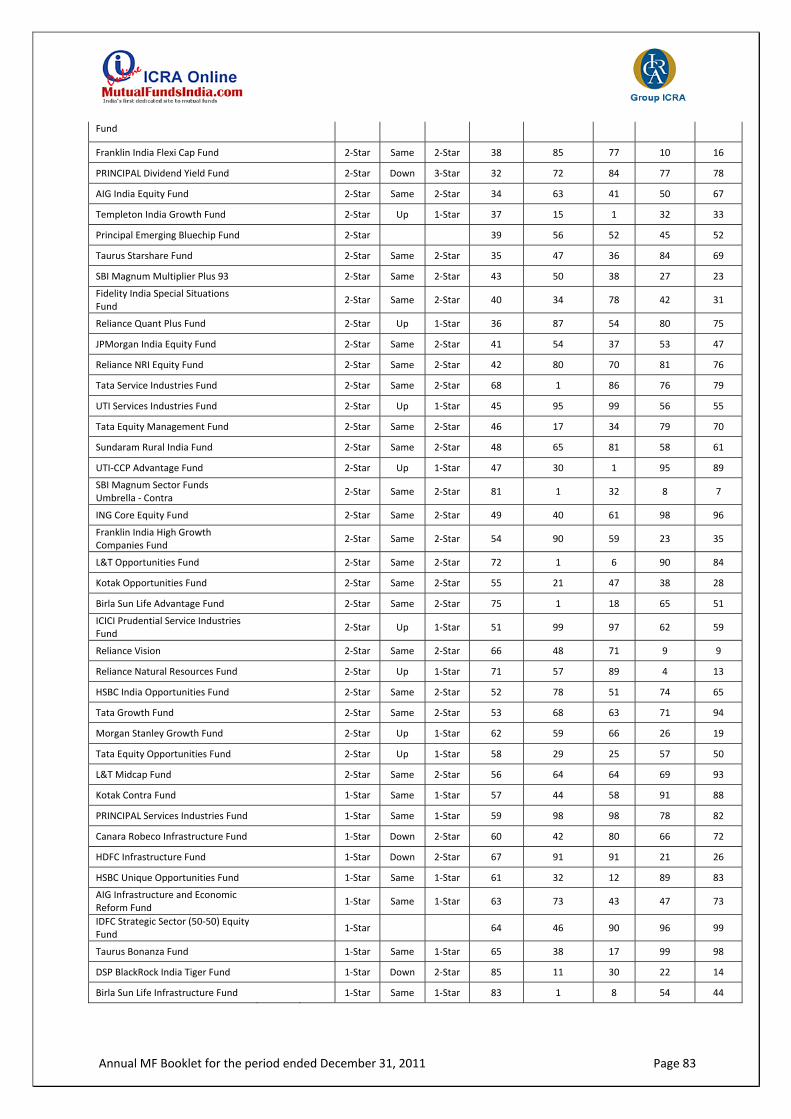
Annual MF Booklet for the period ended December 31, 2011 Page 83
Fund
Franklin India Flexi Cap Fund 2‐Star Same 2‐Star 38 85 77 10 16
PRINCIPAL Dividend Yield Fund 2‐Star Down 3‐Star 32 72 84 77 78
AIG India Equity Fund 2‐Star Same 2‐Star 34 63 41 50 67
Templeton India Growth Fund 2‐Star Up 1‐Star 37 15 1 32 33
Principal Emerging Bluechip Fund 2‐Star 39 56 52 45 52
Taurus Starshare Fund 2‐Star Same 2‐Star 35 47 36 84 69
SBI Magnum Multiplier Plus 93 2‐Star Same 2‐Star 43 50 38 27 23
Fidelity India Special Situations Fund
2‐Star Same 2‐Star 40 34 78 42 31
Reliance Quant Plus Fund 2‐Star Up 1‐Star 36 87 54 80 75
JPMorgan India Equity Fund 2‐Star Same 2‐Star 41 54 37 53 47
Reliance NRI Equity Fund 2‐Star Same 2‐Star 42 80 70 81 76
Tata Service Industries Fund 2‐Star Same 2‐Star 68 1 86 76 79
UTI Services Industries Fund 2‐Star Up 1‐Star 45 95 99 56 55
Tata Equity Management Fund 2‐Star Same 2‐Star 46 17 34 79 70
Sundaram Rural India Fund 2‐Star Same 2‐Star 48 65 81 58 61
UTI‐CCP Advantage Fund 2‐Star Up 1‐Star 47 30 1 95 89
SBI Magnum Sector Funds Umbrella ‐ Contra
2‐Star Same 2‐Star 81 1 32 8 7
ING Core Equity Fund 2‐Star Same 2‐Star 49 40 61 98 96
Franklin India High Growth Companies Fund
2‐Star Same 2‐Star 54 90 59 23 35
L&T Opportunities Fund 2‐Star Same 2‐Star 72 1 6 90 84
Kotak Opportunities Fund 2‐Star Same 2‐Star 55 21 47 38 28
Birla Sun Life Advantage Fund 2‐Star Same 2‐Star 75 1 18 65 51
ICICI Prudential Service Industries Fund
2‐Star Up 1‐Star 51 99 97 62 59
Reliance Vision 2‐Star Same 2‐Star 66 48 71 9 9
Reliance Natural Resources Fund 2‐Star Up 1‐Star 71 57 89 4 13
HSBC India Opportunities Fund 2‐Star Same 2‐Star 52 78 51 74 65
Tata Growth Fund 2‐Star Same 2‐Star 53 68 63 71 94
Morgan Stanley Growth Fund 2‐Star Up 1‐Star 62 59 66 26 19
Tata Equity Opportunities Fund 2‐Star Up 1‐Star 58 29 25 57 50
L&T Midcap Fund 2‐Star Same 2‐Star 56 64 64 69 93
Kotak Contra Fund 1‐Star Same 1‐Star 57 44 58 91 88
PRINCIPAL Services Industries Fund 1‐Star Same 1‐Star 59 98 98 78 82
Canara Robeco Infrastructure Fund 1‐Star Down 2‐Star 60 42 80 66 72
HDFC Infrastructure Fund 1‐Star Down 2‐Star 67 91 91 21 26
HSBC Unique Opportunities Fund 1‐Star Same 1‐Star 61 32 12 89 83
AIG Infrastructure and Economic Reform Fund
1‐Star Same 1‐Star 63 73 43 47 73
IDFC Strategic Sector (50‐50) Equity Fund
1‐Star 64 46 90 96 99
Taurus Bonanza Fund 1‐Star Same 1‐Star 65 38 17 99 98
DSP BlackRock India Tiger Fund 1‐Star Down 2‐Star 85 11 30 22 14
Birla Sun Life Infrastructure Fund 1‐Star Same 1‐Star 83 1 8 54 44

Annual MF Booklet for the period ended December 31, 2011 Page 84
Birla Sun Life Equity Fund 1‐Star Same 1‐Star 70 19 1 43 29
PRINCIPAL Growth Fund 1‐Star Same 1‐Star 69 13 22 72 57
SBI Magnum COMMA Fund 1‐Star Same 1‐Star 73 69 88 33 39
SBI One India Fund 1‐Star Same 1‐Star 74 24 13 48 37
DWS Investment Opportunity Fund 1‐Star Same 1‐Star 76 53 19 82 77
Birla Sun Life Special Situations Fund
1‐Star Same 1‐Star 77 43 28 68 56
Sundaram Equity Multiplier Fund 1‐Star Same 1‐Star 82 93 87 37 54
Reliance Diversified Power Sector Fund
1‐Star Same 1‐Star 90 67 60 3 4
SBI Magnum Multi Cap Fund 1‐Star Same 1‐Star 80 37 40 52 41
UTI Contra Fund 1‐Star Same 1‐Star 78 76 50 67 64
IDFC Classic Equity Fund 1‐Star Same 1‐Star 79 51 53 70 62
ICICI Prudential Infrastructure Fund 1‐Star Same 1‐Star 86 96 94 15 10
Bharti AXA Equity Fund 1‐Star 84 16 23 93 85
JM Equity 1‐Star Same 1‐Star 87 26 26 94 97
LIC Nomura MF India Vision Fund 1‐Star 88 83 57 97 92
Sundaram Select Thematic Funds Energy Opportunities
1‐Star 93 75 93 25 24
Tata Infrastructure Fund 1‐Star Same 1‐Star 94 58 73 29 20
UTI Energy Fund 1‐Star Same 1‐Star 91 81 92 40 43
JM Multi Strategy Fund 1‐Star Same 1‐Star 89 92 46 92 71
HSBC Progressive Themes Fund 1‐Star Same 1‐Star 92 52 49 51 58
UTI Infrastructure Fund 1‐Star Same 1‐Star 96 55 68 20 12
Reliance Equity Fund 1‐Star Same 1‐Star 95 41 35 16 21
Sundaram CAPEX Opportunities Fund ‐ Gth
1‐Star Same 1‐Star 97 49 67 36 49
SBI Infrastructure Fund ‐ Series I 1‐Star Same 1‐Star 98 45 79 34 27
JM Basic Fund 1‐Star Same 1‐Star 99 79 65 60 53
ICRA Equity Index
Schemes Decemb
er Qtr Rank
Change
September Qtr Rank
IER Corpus Cut Off
Weightages 90% 10%
UTI Nifty Fund 4‐Star Same 4‐Star 1 1
Franklin India Index Fund ‐ NSE Nifty Plan
4‐Star Up 3‐Star 2 2
Franklin India Index Fund ‐ BSE Sensex Plan
3‐Star Same 3‐Star 3 6
UTI Master Index Fund 3‐Star Up 2‐Star 4 4
SBI Magnum Index Fund 3‐Star 5 10
Birla Sun Life Index Fund 1‐Star Down 2‐Star 6 9
HDFC Index Fund ‐ Nifty Plan 1‐Star Same 1‐Star 7 5
HDFC Index Fund ‐ Sensex Plan 1‐Star Same 1‐Star 8 7
ICICI Prudential Index Fund 1‐Star Same 1‐Star 9 3
LIC Nomura MF Index Fund ‐ 1‐Star Same 1‐Star 10 11

Annual MF Booklet for the period ended December 31, 2011 Page 85
Sensex Plan
LIC Nomura MF Index Fund ‐ Nifty Plan
1‐Star Same 1‐Star 11 8
ICRA Equity Large Cap
Schemes
December Qtr Rank
Change
September Qtr Rank
IER Company Concentrati
on
Sector
Concentration
Liquidity Corpus Cut Off
Weightages 60% 10% 10% 10% 10%
HDFC Top 200 5‐Star Same 5‐Star 5 26 35 1 1
ICICI Prudential Focused Bluechip Equity Fund
5‐Star Up 4‐Star 1 33 31 2 6
Franklin India Bluechip 5‐Star Same 5‐Star 4 1 8 3 2
Fidelity Equity Fund 4‐Star Down 5‐Star 3 17 16 5 3
Fidelity India Growth Fund 4‐Star Same 4‐Star 2 29 29 22 24
Principal Large Cap Fund 4‐Star Up 3‐Star 6 8 25 21 20
Birla Sun Life Frontline Equity Fund 3‐Star Up 2‐Star 12 9 3 7 5
DSP BlackRock Top 100 Equity Fund 3‐Star Same 3‐Star 9 20 23 4 4
UTI Unit Scheme 1986 (Mastershare)
3‐Star Same 3‐Star 7 24 21 6 7
HDFC Index Fund ‐ Sensex Plus Plan 3‐Star Up 2‐Star 10 13 28 35 37
Religare Growth Fund 3‐Star Down 4‐Star 8 28 37 36 38
Tata Pure Equity Fund 2‐Star Down 3‐Star 16 1 5 17 17
Birla Sun Life Top 100 Fund 2‐Star Down 3‐Star 17 1 1 25 25
UTI Master Equity Plan Unit Scheme
2‐Star Same 2‐Star 14 19 12 9 8
ICICI PRUDENTIAL TOP 200 FUND 2‐Star Same 2‐Star 11 37 32 20 18
SBI Magnum Equity Fund 2‐Star Same 2‐Star 15 15 10 19 19
UTI Masterplus Unit Scheme 91 2‐Star Same 2‐Star 20 1 1 12 11
ICICI PRUDENTIAL TOP 100 FUND 2‐Star Same 2‐Star 13 30 22 23 23
Kotak 50 2‐Star Same 2‐Star 21 1 17 8 13
UTI Top 100 Fund 2‐Star Up 1‐Star 18 22 6 13 16
Reliance Top 200 Fund 2‐Star Same 2‐Star 19 38 36 10 9
Sundaram India Leadership Fund 2‐Star Up 1‐Star 23 14 13 30 29
HSBC Equity Fund 1‐Star Same 1‐Star 22 35 27 11 10
SBI Magnum Bluechip Fund 1‐Star Same 1‐Star 32 11 4 16 14
IDFC Imperial Equity Fund 1‐Star Down 2‐Star 25 18 20 18 21
LIC Nomura Dhansamridhi 1‐Star Same 1‐Star 29 12 18 33 31
BNP Paribas Equity Fund 1‐Star Same 1‐Star 24 25 14 32 34
LIC Nomura Equity Fund 1‐Star Same 1‐Star 33 1 19 34 33
UTI Leadership Equity Fund 1‐Star Same 1‐Star 34 10 26 15 15
Franklin India Opportunity Fund 1‐Star Same 1‐Star 28 27 24 24 22
HSBC Dynamic Fund 1‐Star Same 1‐Star 26 34 30 31 32
Sundaram Growth Fund 1‐Star Same 1‐Star 30 21 11 27 27
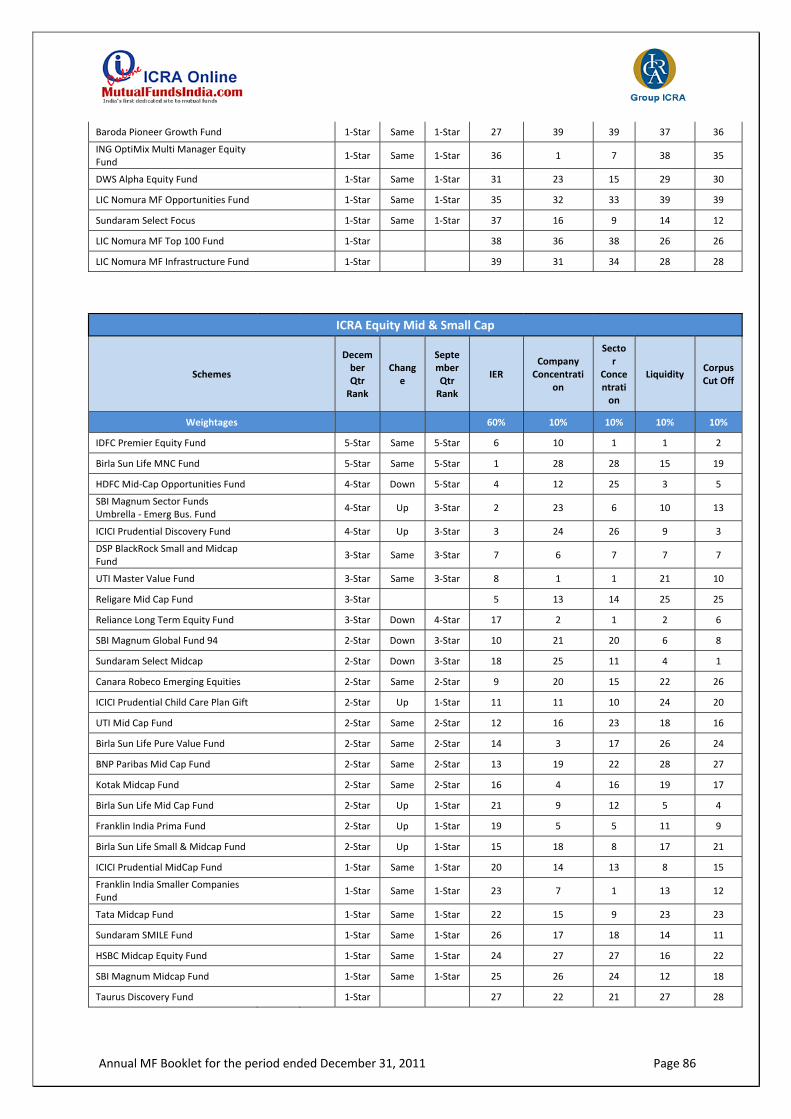
Annual MF Booklet for the period ended December 31, 2011 Page 86
Baroda Pioneer Growth Fund 1‐Star Same 1‐Star 27 39 39 37 36
ING OptiMix Multi Manager Equity Fund
1‐Star Same 1‐Star 36 1 7 38 35
DWS Alpha Equity Fund 1‐Star Same 1‐Star 31 23 15 29 30
LIC Nomura MF Opportunities Fund 1‐Star Same 1‐Star 35 32 33 39 39
Sundaram Select Focus 1‐Star Same 1‐Star 37 16 9 14 12
LIC Nomura MF Top 100 Fund 1‐Star 38 36 38 26 26
LIC Nomura MF Infrastructure Fund 1‐Star 39 31 34 28 28
ICRA Equity Mid & Small Cap
Schemes
December Qtr Rank
Change
September Qtr Rank
IER Company Concentrati
on
Sector
Concentration
Liquidity Corpus Cut Off
Weightages 60% 10% 10% 10% 10%
IDFC Premier Equity Fund 5‐Star Same 5‐Star 6 10 1 1 2
Birla Sun Life MNC Fund 5‐Star Same 5‐Star 1 28 28 15 19
HDFC Mid‐Cap Opportunities Fund 4‐Star Down 5‐Star 4 12 25 3 5
SBI Magnum Sector Funds Umbrella ‐ Emerg Bus. Fund
4‐Star Up 3‐Star 2 23 6 10 13
ICICI Prudential Discovery Fund 4‐Star Up 3‐Star 3 24 26 9 3
DSP BlackRock Small and Midcap Fund
3‐Star Same 3‐Star 7 6 7 7 7
UTI Master Value Fund 3‐Star Same 3‐Star 8 1 1 21 10
Religare Mid Cap Fund 3‐Star 5 13 14 25 25
Reliance Long Term Equity Fund 3‐Star Down 4‐Star 17 2 1 2 6
SBI Magnum Global Fund 94 2‐Star Down 3‐Star 10 21 20 6 8
Sundaram Select Midcap 2‐Star Down 3‐Star 18 25 11 4 1
Canara Robeco Emerging Equities 2‐Star Same 2‐Star 9 20 15 22 26
ICICI Prudential Child Care Plan Gift 2‐Star Up 1‐Star 11 11 10 24 20
UTI Mid Cap Fund 2‐Star Same 2‐Star 12 16 23 18 16
Birla Sun Life Pure Value Fund 2‐Star Same 2‐Star 14 3 17 26 24
BNP Paribas Mid Cap Fund 2‐Star Same 2‐Star 13 19 22 28 27
Kotak Midcap Fund 2‐Star Same 2‐Star 16 4 16 19 17
Birla Sun Life Mid Cap Fund 2‐Star Up 1‐Star 21 9 12 5 4
Franklin India Prima Fund 2‐Star Up 1‐Star 19 5 5 11 9
Birla Sun Life Small & Midcap Fund 2‐Star Up 1‐Star 15 18 8 17 21
ICICI Prudential MidCap Fund 1‐Star Same 1‐Star 20 14 13 8 15
Franklin India Smaller Companies Fund
1‐Star Same 1‐Star 23 7 1 13 12
Tata Midcap Fund 1‐Star Same 1‐Star 22 15 9 23 23
Sundaram SMILE Fund 1‐Star Same 1‐Star 26 17 18 14 11
HSBC Midcap Equity Fund 1‐Star Same 1‐Star 24 27 27 16 22
SBI Magnum Midcap Fund 1‐Star Same 1‐Star 25 26 24 12 18
Taurus Discovery Fund 1‐Star 27 22 21 27 28

Annual MF Booklet for the period ended December 31, 2011 Page 87
ICRA Equity Sectoral
Schemes Decemb
er Qtr Rank
Change September
Qtr Rank
IER Liquidity Corpus Cut Off
Weightages 80% 10% 10%
SBI Magnum Sector Funds Umbrella ‐ FMCG
5‐Star 1 10 18
Reliance Pharma Fund 4‐Star 3 1 2
ICICI Prudential FMCG Fund 4‐Star 2 6 10
ICICI Prudential Technology Fund 4‐Star Same 4‐Star 4 9 8
UTI Pharma and Healthcare Fund 3‐Star 5 5 9
Franklin Infotech Fund 3‐Star Down 4‐Star 6 7 7
UTI Transportation and Logistics Fund
2‐Star 7 16 13
SBI Magnum Sector Funds Umbrella ‐ Pharma
2‐Star 8 8 19
SBI Magnum Sector Funds Umbrella ‐ IT
2‐Star Same 2‐Star 9 13 17
Reliance Banking Fund 2‐Star Down 4‐Star 12 2 1
Sahara Banking and Financial Services Fund
2‐Star Down 3‐Star 10 21 21
DSP BlackRock Technology.com Fund
1‐Star Down 2‐Star 11 15 12
DSP BlackRock Natural Resources & New Energy Fund
1‐Star 13 18 5
Birla Sun Life New Millennium 1‐Star Same 1‐Star 14 14 14
UTI Banking Sector Fund 1‐Star Same 1‐Star 16 11 3
Religare Banking Fund 1‐Star Same 1‐Star 15 20 20
Reliance Media & Entertainment Fund
1‐Star 19 3 11
ICICI Prudential Banking and Financial Services Fund
1‐Star Same 1‐Star 18 17 6
Birla Sun Life India Opportunities Fund
1‐Star Same 1‐Star 17 19 16
Sundaram Financial Services Opportunities Fund
1‐Star Same 1‐Star 20 12 4
Sundaram Media & Entert Opp Fund
1‐Star 21 4 15
ICRA Equity‐Tax Planning
Schemes
December Qtr Rank
Change
September Qtr Rank
IER Company Concentrati
on
Sector
Concentration
Liquidity Corpus Cut Off
Weightages 60% 10% 10% 10% 10%
ICICI Prudential Taxplan 5‐Star Up 4‐Star 1 12 7 5 6
HDFC Taxsaver Fund 5‐Star Up 4‐Star 4 23 23 3 2
HDFC Long Term Advantage Fund 4‐Star Same 4‐Star 6 1 1 7 8
Fidelity Tax Advantage Fund 4‐Star Up 3‐Star 2 13 9 8 7
Religare Tax Plan 4‐Star Same 4‐Star 3 7 4 20 20
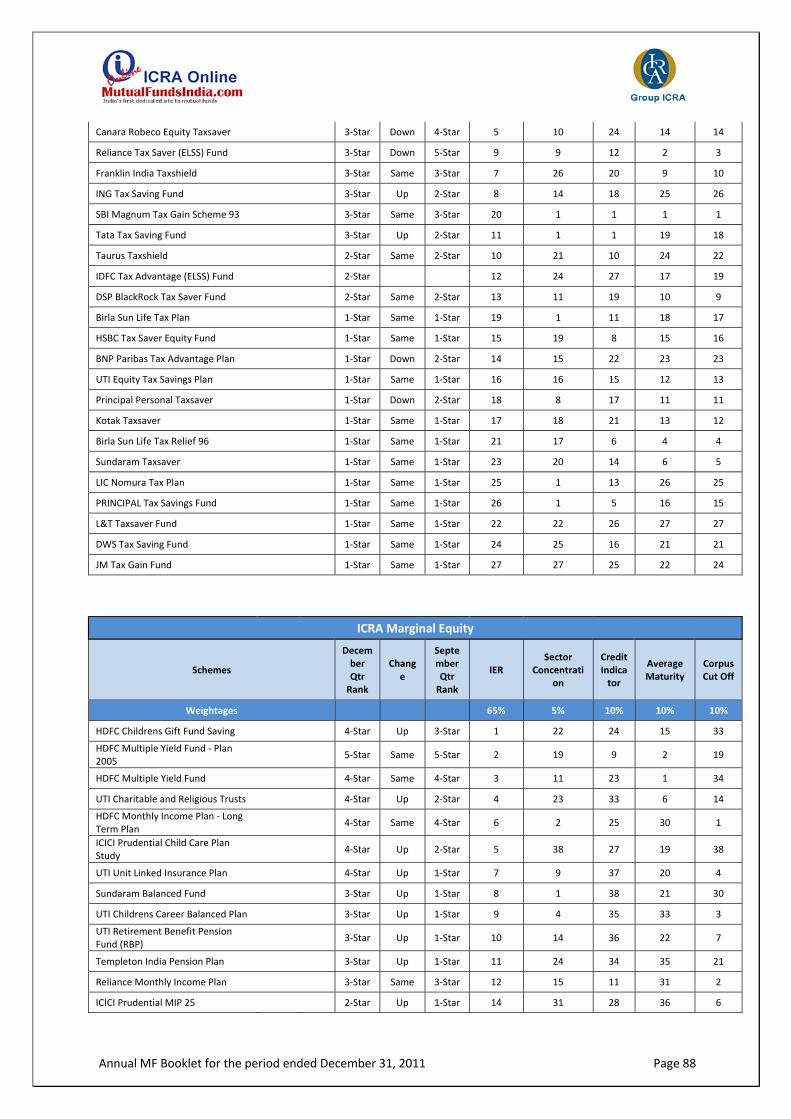
Annual MF Booklet for the period ended December 31, 2011 Page 88
Canara Robeco Equity Taxsaver 3‐Star Down 4‐Star 5 10 24 14 14
Reliance Tax Saver (ELSS) Fund 3‐Star Down 5‐Star 9 9 12 2 3
Franklin India Taxshield 3‐Star Same 3‐Star 7 26 20 9 10
ING Tax Saving Fund 3‐Star Up 2‐Star 8 14 18 25 26
SBI Magnum Tax Gain Scheme 93 3‐Star Same 3‐Star 20 1 1 1 1
Tata Tax Saving Fund 3‐Star Up 2‐Star 11 1 1 19 18
Taurus Taxshield 2‐Star Same 2‐Star 10 21 10 24 22
IDFC Tax Advantage (ELSS) Fund 2‐Star 12 24 27 17 19
DSP BlackRock Tax Saver Fund 2‐Star Same 2‐Star 13 11 19 10 9
Birla Sun Life Tax Plan 1‐Star Same 1‐Star 19 1 11 18 17
HSBC Tax Saver Equity Fund 1‐Star Same 1‐Star 15 19 8 15 16
BNP Paribas Tax Advantage Plan 1‐Star Down 2‐Star 14 15 22 23 23
UTI Equity Tax Savings Plan 1‐Star Same 1‐Star 16 16 15 12 13
Principal Personal Taxsaver 1‐Star Down 2‐Star 18 8 17 11 11
Kotak Taxsaver 1‐Star Same 1‐Star 17 18 21 13 12
Birla Sun Life Tax Relief 96 1‐Star Same 1‐Star 21 17 6 4 4
Sundaram Taxsaver 1‐Star Same 1‐Star 23 20 14 6 5
LIC Nomura Tax Plan 1‐Star Same 1‐Star 25 1 13 26 25
PRINCIPAL Tax Savings Fund 1‐Star Same 1‐Star 26 1 5 16 15
L&T Taxsaver Fund 1‐Star Same 1‐Star 22 22 26 27 27
DWS Tax Saving Fund 1‐Star Same 1‐Star 24 25 16 21 21
JM Tax Gain Fund 1‐Star Same 1‐Star 27 27 25 22 24
ICRA Marginal Equity
Schemes
December Qtr Rank
Change
September Qtr Rank
IER Sector
Concentration
Credit Indicator
Average Maturity
Corpus Cut Off
Weightages 65% 5% 10% 10% 10%
HDFC Childrens Gift Fund Saving 4‐Star Up 3‐Star 1 22 24 15 33
HDFC Multiple Yield Fund ‐ Plan 2005
5‐Star Same 5‐Star 2 19 9 2 19
HDFC Multiple Yield Fund 4‐Star Same 4‐Star 3 11 23 1 34
UTI Charitable and Religious Trusts 4‐Star Up 2‐Star 4 23 33 6 14
HDFC Monthly Income Plan ‐ Long Term Plan
4‐Star Same 4‐Star 6 2 25 30 1
ICICI Prudential Child Care Plan Study
4‐Star Up 2‐Star 5 38 27 19 38
UTI Unit Linked Insurance Plan 4‐Star Up 1‐Star 7 9 37 20 4
Sundaram Balanced Fund 3‐Star Up 1‐Star 8 1 38 21 30
UTI Childrens Career Balanced Plan 3‐Star Up 1‐Star 9 4 35 33 3
UTI Retirement Benefit Pension Fund (RBP)
3‐Star Up 1‐Star 10 14 36 22 7
Templeton India Pension Plan 3‐Star Up 1‐Star 11 24 34 35 21
Reliance Monthly Income Plan 3‐Star Same 3‐Star 12 15 11 31 2
ICICI Prudential MIP 25 2‐Star Up 1‐Star 14 31 28 36 6

Annual MF Booklet for the period ended December 31, 2011 Page 89
UTI Mahila Unit Scheme 2‐Star Up 1‐Star 13 25 31 23 18
DSP BlackRock MIP Fund 2‐Star Same 2‐Star 15 21 20 4 22
UTI ‐ MIS ‐ Advantage Fund 2‐Star 16 29 29 17 5
Birla Sun Life MIP ‐ Wealth 25 2‐Star Up 1‐Star 17 6 26 24 15
UTI Monthly Income Scheme 2‐Star Down 3‐Star 18 35 17 18 10
HDFC Monthly Income Plan ‐ Short Term Plan
2‐Star Down 3‐Star 20 27 19 10 13
HSBC MIP ‐ Savings Plan 2‐Star Up 1‐Star 21 7 15 26 11
LIC Nomura MF Floater ‐ Monthly Income Plan
2‐Star Same 2‐Star 19 37 30 11 25
Birla Sun Life MIP 2‐Star Down 3‐Star 24 8 8 13 20
FT India Monthly Income Plan 2‐Star Same 2‐Star 23 16 22 9 17
Birla Sun Life Monthly Income 2‐Star Down 4‐Star 25 12 7 12 9
Tata MIP Plus Fund 2‐Star Up 1‐Star 22 20 14 37 24
SBI Magnum Income Plus Fund ‐Investment Plan
1‐Star Down 2‐Star 27 17 6 14 29
Kotak Monthly Income Plan 1‐Star Same 1‐Star 26 36 18 8 26
Principal Debt Savings Fund ‐ Retail Plan
1‐Star Same 1‐Star 29 5 13 27 28
DWS Money Plus Advantage Fund 1‐Star Down 4‐Star 30 26 12 3 31
ICICI Prudential MIP 1‐Star Down 2‐Star 28 32 10 34 12
DWS Twin Advantage Fund 1‐Star Same 1‐Star 31 34 21 7 35
LIC Nomura Monthly Income Plan 1‐Star Same 1‐Star 32 33 32 16 27
HSBC MIP ‐ Regular Plan 1‐Star Down 2‐Star 33 10 3 25 23
SBI Magnum Monthly Income Plan 1‐Star Down 2‐Star 34 18 1 29 16
Sundaram MIP ‐ Moderate 1‐Star Same 1‐Star 35 28 16 32 36
Principal Debt Savings Fund ‐ MIP 1‐Star Down 2‐Star 36 13 5 28 32
Birla Sun Life MIP ‐ Savings 5 1‐Star Down 5‐Star 37 3 2 5 8
Tata Monthly Income Fund 1‐Star Same 1‐Star 38 30 4 38 37

Annual MF Booklet for the period ended December 31, 2011 Page 90
ICRA BALANCED
Schemes
December Qtr Rank
Change
September Qtr Rank
IER
Company
Concentration
Sector Concentration _Debt
Sector Concentrati
on _Equity
Liquidity
Credit Indicator
Corpus Cut Off
Weightages 60%
5% 5% 5% 10% 5% 10%
HDFC Prudence Fund 5‐Star Same 5‐Star 3 1 9 1 1 10 1
HDFC Childrens Gift Fund Investment
4‐Star Same 4‐Star 1 1 10 1 6 12 10
HDFC Balanced Fund 4‐Star Same 4‐Star 2 1 15 1 9 9 8
UTI Wealth Builder Fund ‐ Series II 3‐Star 4 14 1 14 3 15 5
ICICI Prudential Balanced Fund 2‐Star Same 2‐Star 5 12 13 1 8 2 11
Birla Sun Life 95 2‐Star Same 2‐Star 6 1 11 1 10 1 7
Tata Balanced Fund 2‐Star Same 2‐Star 7 1 2 1 11 13 9
DSP BlackRock Balanced Fund 2‐Star Same 2‐Star 9 1 6 1 5 8 4
Canara Robeco Balance II 2‐Star Same 2‐Star 8 1 3 15 13 5 13
Reliance Regular Savings Fund ‐ Balanced
1‐Star Down 2‐Star 10 13 4 1 2 6 3
UTI Balanced Fund 1‐Star Same 1‐Star 12 1 12 1 4 14 2
FT India Balanced Fund 1‐Star Same 1‐Star 11 15 14 1 12 7 12
Kotak Balance 1‐Star Same 1‐Star 13 1 7 1 14 4 14
Principal Retail Equity Savings Fund 1‐Star Same 1‐Star 14 1 8 1 15 3 15
SBI Magnum Balanced Fund 1‐Star Same 1‐Star 15 1 5 1 7 11 6

Annual MF Booklet for the period ended December 31, 2011 Page 91
The ranks assigned by ICRA/ICRA Online are based on an objective analysis of information obtained
from the entities concerned as also other sources considered reliable by ICRA/ICRA Online. However,
the ranks must be construed solely as statements of opinion and ICRA/ICRA Online shall not be liable
for any losses incurred by any user from any use of the ranks. Also, the ranks are neither a certificate
of any statutory compliance nor any guarantee on the future performance of the ranked
entities/schemes.
An entity wishing to use the ICRA Online Mutual Funds Rankings for any publicity or in its prospectus
/ offer document / promotional literature / advertisement or wishing to re‐disseminate these
rankings may do so only after obtaining the written permission of ICRA / ICRA Online.
DISCLAIMER

ICRA Limited (formerly Investment Information and Credit Rating Agency of India Limited) was set up in 1991 by leading financial/investment institutions, commercial banks and financial services companies as an independent and professional Investment Information and Credit Rating Agency. Today, ICRA, a full-service credit rating agency with its shares listed on the Bombay Stock Exchange and the National Stock Exchange, has five wholly-owned subsidiaries.
Mr. P. K. Choudhury (Vice-Chairman & Group CEO, ICRA Limited)
Mr. A. K. Basu (Formerly CEO, IDBI AMC; Executive Director, Pegasus Advisory Private Limited)
Mr. Naresh Takkar (Managing Director, ICRA Limited)
Mr. R. Raghuttama Rao (Managing Director, ICRA Management Consulting Services Limited)
Mr. Prateep Kumar Guha (Managing Director, ICRA Techno Analytics Limited)
Mrs. Sushmita Ghatak (Executive Director & COO, ICRA Online Limited)
BOARD OF DIRECTORS
ICRON, a wholly-owned subsidiary of ICRA, was incorporated in January 1999 and has since then established itself as an independent and credible source of authentic information and software solutions.
Today, ICRON is a leading information services and technology solutions provider and caters for some of the biggest names in the financial services sector in India and abroad - a testimony to its product quality, commitment, and credibility. ICRON has two Strategic Business Units (SBUs) with a list of reputed global and domestic clients:
Information Services and Technology Solutions Division (MFI Division); andKnowledge Process Outsourcing Division (KPO Division)
ICRA Online Limited (ICRON)
Management Consulting
Software Solutions and Services
Information Services/KPO
GROUP ICRA
ICRA Limited (ICRA)
PT. ICRA Indonesia(ICRAIndo)
ICRA Lanka(ICRALanka)
www.icra.in
ICRA Management Consulting Services
Limited (IMaCS)
Pragati Development Consulting Services
Limited (PDCSL)
IMaCS Virtus Global Partners,
Inc. (IVGP)
ICRA TechnoAnalytics Limited (ICTEAS)
ICRA Sapphire Inc.(ICSAP)
ICRA Online Limited(ICRON)
www.icraonline.com www.icteas.comwww.imacs.in
Credit Rating/Grading
Group ICRA

IV I
Regd. Office: FMC Fortuna, A-10 & 11, 3rd Floor, 234/3A, AJC Bose Road, Kolkata - 700 020Tel: +91-33-2287 6617/8839/2280 0008, Fax: : +91-33-2287 0728
107, 1st Floor, Raheja Arcade, Plot No.61, Sector-XI, CBD Belapur, Navi Mumbai- 400 614Tel: +91-22-6781 6100, Fax : +91-22-2756 3057
Kolkata Office: 2nd, 3rd, 5th and 6th Floors, Convergence Contact Centre, Plot D 2/2, Block EP & GP, Sector-V, Salt Lake City, Kolkata - 700 091Tel: +91-33-40170100, Fax: +91-33-40170101
Corporate & Sales Office:
ICRA ONLINE LIMITED
Mail us at: For MFI Division: [email protected]
For KPO Division: [email protected]
US Representative Office:
ICRA Sapphire, Inc.101 Merritt Boulevard
Suite 107, TrumbullConnecticut 06611, U.S.A.
Tel: +1 203 375 8668Fax: +1 203 375 1965
Email: Richard Zboray - [email protected]
Visit us at: www.icraonline.com
www.mutualfundsIndia.com
PuneTel: +91 20 2556 1194/0195/0196
Fax: +91 20 2556 1231
AhmedabadTel: +91-79-2658 5049/2008/5494
Fax: +91-79-2658 4924
HyderabadTel: +91-40 2375 3600Fax: +91-40 2373 5152
Enquiries may also be directed to the following ICRA Offices:
This document contains information proprietary to ICRA Online Ltd., and may not be reproduced, disclosed or used in whole or part without the express written consent of ICRA Online Ltd. Copyright©2012. All Rights Reserved.
Bangalore
626, Annasalai, JVL Plaza, 5th Floor, Teynampet,
Chennai - 600018Tel: +91- 044 -3006 1714Fax: +91- 044 -2434 3663
Electric Mansion, 3rd FloorAppasaheb Marathe Marg
Prabhadevi, Mumbai - 400 025Tel: +91-22 24331046/53/62/74/86/87,
2436 2044Fax: +91-22-2433 1390
1105, Kailash Building 11th Floor, 26, Kasturba Gandhi Marg
New Delhi - 110 001Tel: +91-11-2335 7940-50Fax: +91-11-2335 7014
Building No.8,Tower A, ll FloorDLF Cyber City, Phase ll
Gurgaon-122 002Tel: +91-124-454 5300/5850
Fax: +91-124 405 0424
Mumbai GurgaonNew DelhiChennai
Tel: +91-80-2559 7401/4049/2532 7803Fax: +91-80-2559 4065
Top Related