


Languages
Pages
Legal

Annual Business Report
April 1 2018 through March 31 2019
Business Segment 190th period(2018-2019)
189th period(2017-2018) Increase(Decrease)
Railway rolling stock 38049 417 41455 435 (3406) (82)
Transportation equipment and Steel structure 21794 239 22475 236 (681) (30)
Construction equipment 25167 276 24573 258 594 24
Engineering 6006 66 6560 69 (554) (84)
Other 163 02 248 02 (85) (343)
Total 91179 1000 95311 1000 (4132) (43)
NIPPON SHARYO LTD and Consolidated Subsidiaries
Financial Highlights
Comparison of Sales by Segment(Unit millions of yen)
Change in Operating Performance and Asset Status
Note Effective October 1 2018 the Company has implemented a 1-for-10 reverse stock split of common stock Per share of common stock is retroactively adjusted Per share information is disclosed as if the reverse stock split had been effected at the beginning of the fiscal year ended March 31 2018
(Unit millions of yen except Net income per share)
Titles of account 190th period(2018-2019)
189th period(2017-2018)
188th period(2016-2017)
Net sales 91179 95311 101094
Ordinary income (loss) 8862 7315 (5149)
Net income (loss) attributable to owners of the parent 9199 (8271) (5124)
Net income per share (loss) yen63729 (yen57301) (yen3550)
Total assets 134194 127413 129194
Total equity 32446 20954 28109
189th period 188th period
Comparison of Sales by Segment(Millions of Yen)
140000
120000
100000
80000
60000
40000
20000
0
Other
Engineering
Construction equipment
Transportation equipmentand Steel structure
Railway rolling stock
190th period
a
Contents
Message from the President 2
Review by Segment 4
Investment in Plant and Equipment 6
Financing Activities 6
Consolidated Financial Statements and Independent Auditors Report 7
Corporate Information 41
Directory 41
subway cars for Jakarta
1
Review of Business Operations
During the fiscal term under review the Japanese economy had a continuous tendency to improve
in capital investment employment etc supported by the effect of various economic policies as well as
gradual recovery of overseas business conditions However some weaknesses were found in production
and export
Under this business environment our performance for the year showed a decrease in sales of
the transportation equipment and steel structure business segment and our consolidated subsidiary
NIPPON SHARYO USA INC totaling yen91179 million was down 43 from the previous year In
terms of profits provisions for loss on order received recorded in the previous year did not arise and
other business segments showed healthy movement as in the previous year while the reversal of the
amount recorded as provisions for the large railway rolling stock project for the USA in the railway
rolling stock business in the previous year did not exist any longer As a result the operating profit
was yen8500 million up 170 and the ordinary profit yen8862 million up 211 from the previous year
We no longer had an extraordinary loss due to payment of the settlement money for the large railway
rolling stock project for the USA recorded in the previous year Consequently the net profit that
belongs to the stockholders of the parent company was yen9199 million (yen8271 million net loss in the
previous year)
The Outlook
Considering the downturn in recent years losses recorded for four consecutive years until the
previous year and an increasingly severe market environment the Group will seek ldquoenhancement
of the operation control structure and human resources developmentrdquo and promote ldquotechnology
and product development with exertion of our overall capabitiliesrdquo while securing the profit with
ldquobusiness development where we can exhibit our strengthsrdquo Concretely we will seek to enhance the
operation control structure including the quality cost and process with a focus on the railway rolling
stock business or our core business exhibit our strengths in the strong area of each business segment
by providing products and service that match customer needs and gain a competitive edge by cost
reductions to secure stable order receipt with all our strength In such efforts we will develop closer
cooperative ties with the parent company to contribute to improve the corporate value of the entire JR
Central Group as well as to develop our business
In the railway rolling stock business the environment will be continuously difficult in terms of
receiving orders In such a circumstance we will continue to make efforts to gain a competitive
edge concerning various railway rolling stocks with a focus on high speed railways by differentiating
Message from the President
2
ourselves from competitors through technological developments as well as cost reductions through
improvements in efficiency of production processes etc For projects with losses we will make efforts
to improve the circumstances by reviewing the project promotion system etc
In the transportation equipment and steel structure business segment the transportation equipment
business is facing difficulties of receiving orders We will however make efforts to secure orders and
develop new customers by developing products which promptly capture market trends and reducing
costs Our efforts in the steel structure business will be focused on enhancing our ability to propose
technological solutions that match customer specifications in bridge construction work etc and
reducing costs to secure orders At the same time we will expand our business to peripheral areas
such as repairmaintenance projects
In the construction equipment business segment we will capture business opportunities steadily
through maintenanceenhancement of the production system to meet the healthy domestic demand
and by promoting flexible measures to meet the needs of each region in the overseas market with a
focus on Asia
In the engineering business segment we will secure profits by proposing products that cater to
market needs
Concerning existence of events or conditions that may cast significant doubt on the entityrsquos ability
to continue as a going concern the Group recorded net losses that belong to the stockholders of the
parent company for four consecutive years until the previous year however we exhibited our strength
in the strong area of each business segment to deal with it and gained a competitive edge by promotion
of cost reductions to secure stable order receipt with all our strength Consequently we recorded
quarterly net profits that belong to the stockholders of the parent company in succession from the first
quarter consolidated cumulative period totaling yen9199
million net profit in this year
For financing we make efforts to stably secure funds
necessary for business activities and maintain liquidity
while keeping a sound financial balance and secure funds
that will fully meet the demand expected based on the
financial plan
Based on the above we consider that events or conditions
that might cast significant doubt on the entityrsquos ability to
continue as a going concern did not exist any longer in the
first quarter consolidated accounting period
Kazuhiro Igarashi
President and Chief Executive Officer
3
Review by Segment
Railway Rolling Stock Business
In the railway rolling stock business we
had sales of trains for Odakyu Electric
Rai lway Co Ltd Nagoya Rai lroad
Co Ltd Tokyo Metro Co Ltd Keisei
Electric Railway Co Ltd Shin-Keisei
Electric Railway Co Ltd Indonesia
etc in addition to the N700A Shinkansen
trains for JR Central and JR West
Compared with the previous year our
sales of railway cars increased for the public and private
railways and overseas but decreased for JR Companies
Consequently our total sales for the railway rolling stock
business were yen38049 million down 82 from the
previous year
Transportation Equipment and Steel Structure Business
In the transportation equipment business we had sales of
LPG tank lorries consumer-purpose LPG bulk tank lorries
etc however the sales of container flat cars decreased
compared with the previous year As a result sales were
yen8725 million down 223 from the previous year
In the steel structure business sales
included Tokai-Kanjo Expressway
Takatomi IC East Main Line Bridge
Higashi-Fukase Number 4 Viaduct
Higashi-Isshiki Viaduct Nagafuke
N700A Shinkansen trains for JR Central and JR West
Series 2000 train for Tokyo Metro Co Ltd
LPG bulk tank lorry
Tokai-Kanjo Expressway Nagafuke Number 4 Bridge
4
Number 4 Bridge Nishi-Zakura Number 2 Viaduct as well as large-scale repair work for Tokaido
Shinkansen Sales were up 162 from the previous year to yen13068 million
In all sales for the transportation equipment and steel structure businesses were yen21794 million
down 30 from the previous year
Construction Equipment Business
In the construction equipment business domestic
sales continuously showed healthy movement
thanks to demands for reconstruction works from
the Great East Japan Earthquake and construction
work related to the Tokyo Olympic Games As a
result sales in the construction equipment business
reached yen25167 million up 24 from the previous
year
Engineering Business
Our main sales included vehicle inspectionrepair facilities for railway companies mechanical
equipment for Maglev trains for JR Central agricultural plants for Agricultural Cooperatives all over
Japan and paper-manufacturing equipment for household paper manufacturers We had a decrease
in sales for agricultural plants compared with the previous year As a result sales in the engineering
business totaled yen6006 million down 84 from the previous year
The overseas sales for the year under review amount to yen9702 million representing 106 of total
sales which includes yen6483 million for the railway rolling stock business and yen3216 million for the
construction equipment business
The orders on hand at the end of the year under
review reached yen78049 million These comprised
yen48218 million for the railway rolling stock business
yen25015 million for the transportation equipment
and steel structure businesses (yen9428 million for the
transportation equipment business yen15586 million
for the steel structure business) yen2947 million for the
construction equipment business and yen1867 million for
the engineering business
Casing Rotator
Wheelset lifting device
5
Investment in Plant and Equipment
Plant and equipment investment during the year under review totaled yen2065 million Investment
was mainly targeted at renewal of equipment necessary for production of construction machinery
Investment was also made for renewal of equipment to maintainimprove the production capacity at
each plant
On April 20 2017 the Group transferred the plant property of Toyokawa Plant Kinuura Plant
and Narumi Plant to our parent company (Central Japan Railway Company) Since the relevant
transaction is a transaction with our parent company and we concluded a lease contract with our
parent company and continuously use the transferred plant property as plants as before even after
transfer we recorded the ldquolandrdquo and ldquobuildings and structuresrdquo of this plant property as tangible fixed
assets instead of executing sales and purchase accounting The relevant transaction is not a finance
lease transaction so we recorded the transfer price of the plant property as a long-term debt (including
the long-term debt to be cleared within one year)
Therefore equipment investment concerning the transferred plant property was also recorded as
ldquobuildings and structuresrdquo and ldquomachinery and equipmentrdquo and some of the equipment investment
amount as long-term debt (including the long-term debt to be cleared within one year)
Financing Activities
In this year no major borrowing was made
6
NIPPON SHARYO LTD ANDCONSOLIDATED SUBSIDIARIES
CONSOLIDATED FINANCIAL STATEMENTSFOR THE YEAR ENDED MARCH 31 2019
ANDINDEPENDENT AUDITORrsquoS REPORT
7
INDEPENDENT AUDITORrsquoS REPORT
To the Board of Directors of NIPPON SHARYO LTD
We have audited the accompanying consolidated balance sheet of NIPPON SHARYO LTD (the ldquoCompanyrdquo)
and its consolidated subsidiaries as of March 31 2019 and the related consolidated statements of operations
comprehensive income changes in equity and cash flows for the year then ended and a summary of significant
accounting policies and other explanatory information all expressed in Japanese yen
Managementrsquos Responsibility for the Consolidated Financial Statements
Management is responsible for the preparation and fair presentation of these consolidated financial statements in
accordance with accounting principles generally accepted in Japan and for such internal control as management
determines is necessary to enable the preparation of consolidated financial statements that are free from
material misstatement whether due to fraud or error
Auditorrsquos Responsibility
Our responsibility is to express an opinion on these consolidated financial statements based on our audit We
conducted our audit in accordance with auditing standards generally accepted in Japan Those standards require
that we plan and perform the audit to obtain reasonable assurance about whether the consolidated financial
statements are free from material misstatement
An audit involves performing procedures to obtain audit evidence about the amounts and disclosures in the
consolidated financial statements The procedures selected depend on the auditorrsquos judgment including the
assessment of the risks of material misstatement of the consolidated financial statements whether due to fraud or
error In making those risk assessments the auditor considers internal control relevant to the entityrsquos preparation
and fair presentation of the consolidated financial statements in order to design audit procedures that are
8
appropriate in the circumstances but not for the purpose of expressing an opinion on the effectiveness of the
entityrsquos internal control An audit also includes evaluating the appropriateness of accounting policies used and
the reasonableness of accounting estimates made by management as well as evaluating the overall presentation
of the consolidated financial statements
We believe that the audit evidence we have obtained is sufficient and appropriate to provide a basis for our audit
opinion
Opinion
In our opinion the consolidated financial statements referred to above present fairly in all material respects the
consolidated financial position of NIPPON SHARYO LTD and its consolidated subsidiaries as of March 31
2019 and the consolidated results of their operations and their cash flows for the year then ended in accordance
with accounting principles generally accepted in Japan
Convenience Translation
Our audit also comprehended the translation of Japanese yen amounts into US dollar amounts and in our
opinion such translation has been made in accordance with the basis stated in Note 1 to the consolidated
financial statements Such US dollar amounts are presented solely for the convenience of readers outside Japan
June 27 2019
9
Millions of YenThousands of US Dollars
(Note 1)
ASSETS 2019 2018 2019
CURRENT ASSETS
Cash and cash equivalents (Notes 14 and 17) yen 12721 yen 15837 $ 115645
Notes and accounts receivable (Notes 3 14 and 17) 29756 28526 270513
Inventories (Notes 2i and 4) 31484 26705 286219
Other current assets (Note 9) 1039 1146 9443
Total current assets 75000 72214 681820
PROPERTY PLANT AND EQUIPMENT
Land (Note 9) 14971 14996 136102
Buildings and structures (Note 9) 27438 27639 249432
Machinery and equipment 34686 34860 315325
Construction in progress 846 35 7694
Total 77941 77530 708553
Accumulated depreciation (49527) (48966) (450247)
Net property plant and equipment 28414 28564 258306
INVESTMENTS AND OTHER ASSETS
Investment securities (Notes 5 9 and 14) 20381 18632 185281
Investments in an unconsolidated subsidiary and associated companies (Note 14) 795 728 7226
Asset for employeesrsquo retirement benefits (Note 8) 7910 5623 71909
Deferred tax assets (Note 13) 159 136 1442
Other assets (Note 9) 1535 1516 13968
Total investments and other assets 30780 26635 279826
TOTAL yen 134194 yen 127413 $ 1219952
(Concluded)
NIPPON SHARYO LTD and Consolidated SubsidiariesConsolidated Balance SheetMarch 31 2019
10
Millions of YenThousands of US Dollars
(Note 1)LIABILITIES AND EQUITY 2019 2018 2019
CURRENT LIABILITIES
Current portion of long-term debt (Notes 7 14 and 17) yen 296 yen 287 $ 2688
Current portion of lease obligations (Notes 11 and 14) 678 748 6168
Notes and accounts payable (Notes 6 and 14) 22912 24845 208287
Accrued expenses (Note 17) 5422 5003 49291
Advances received 4281 3467 38915
Income taxes payable (Note 14) 538 132 4888
Allowance for work in process on construction contracts 176 36 1600
Provision for loss on orders received (Note 2n) 1837 6128 16702
Other current liabilities 1158 1408 10531
Total current liabilities 37298 42054 339070
LONG-TERM LIABILITIES
Long-term debt (Notes 7 9 14 and 17) 55219 55400 501996
Liability for employeesrsquo retirement benefits (Note 8) 292 273 2656
Lease obligations (Notes 11 and 14) 1650 1725 14996
Allowance for PCB disposal expenses 203 457 1845
Provision for compensation for health damage from asbestos 87 99 791
Deferred tax liabilities (Note 13) 6048 6233 54980
Other long-term liabilities 951 218 8648
Total long-term liabilities 64450 64405 585912
COMMITMENTS AND
CONTINGENT LIABILITIES (Notes 10 and 15)
EQUITY (Note 12)
Common stock
authorized 32800000 and 328000000 shares
issued 14675012 and 146750129 shares in 2019 and 2018 respectively 11811 11811 107370
Capital surplus - 12045 -
Retained earnings 9585 (11659) 87141
Treasury stock at cost 241136 shares in 2019
and 2406621 shares in 2018 (517) (516) (4703)
Accumulated other comprehensive income
Unrealized gain on available-for-sale securities 8919 7708 81082
Deferred loss on derivatives under hedge accounting - (8) -
Foreign currency translation adjustments (2224) (2191) (20215)
Defined retirement benefit plans 4754 3661 43216
Total accumulated other comprehensive income 11449 9170 104083
Noncontrolling interests 118 103 1079
Total equity 32446 20954 294970
TOTAL yen 134194 yen 127413 $ 1219952
(Concluded)Note Effective October 1 2018 the Company has implemented a 1-for-10 reverse stock split of common stock The numbers of authorized or issued shares are not retroactively adjusted See notes to consolidated financial statements
NIPPON SHARYO LTD and Consolidated SubsidiariesConsolidated Balance SheetMarch 31 2019
11
NIPPON SHARYO LTD and Consolidated SubsidiariesConsolidated Statement of OperationsYear Ended March 31 2019
Millions of YenThousands of US Dollars
(Note 1)
2019 2018 2019
NET SALES (Note 17) yen 91179 yen 95311 $ 828904
COST OF SALES (Notes 2i 2m and 2u) 75816 80897 689240
Gross profit 15363 14414 139664
SELLING GENERAL AND ADMINISTRATIVE EXPENSES (Note 2u) 6863 7148 62394
Operating income 8500 7266 77270
OTHER INCOME (EXPENSES)
Interest and dividend income (Note 17) 344 311 3128
Interest expense (Note 17) (344) (212) (3130)
Equity in earnings of associated companies 82 81 742
Gain on sales of investment securities net (Note 5) 3 54 31
Loss on impairment of property plant and equipment (Note 16) (270) (34) (2456)
(Loss) gain on sales and disposals of property plant and equipment net (52) 8950 (470)
Loss on early repayment of long-term debt - (1077) -
Loss on payment for settlement - (26445) -
Other ndash net 284 (134) 2584
Other income (expenses) ndash net 47 (18506) 429
INCOME (LOSS) BEFORE INCOME TAXES 8547 (11240) 77699
INCOME TAXES (Note 13)
Current 543 105 4939
Deferred (1216) (3089) (11057)
Total income taxes (673) (2984) (6118)
NET INCOME (LOSS) 9220 (8256) 83817
NET INCOME ATTRIBUTABLE TO NONCONTROLLING INTERESTS 21 15 193
NET INCOME (LOSS) ATTRIBUTABLE TO OWNERS OF THE PARENT yen 9199 yen (8271) $ 83624
Yen US Dollars
PER SHARE OF COMMON STOCK (Note 2v)
Basic net income (loss) yen 63729 yen (57301) $ 579
Cash dividends applicable to the year - - -
Note Effective October 1 2018 the Company has implemented a 1-for-10 reverse stock split of common stock Per share of common stock is retroactively adjusted Per share information is disclosed as if the reverse stock split had been effected at the beginning of the fiscal year ended March 31 2018
See notes to consolidated financial statements
12
NIPPON SHARYO LTD and Consolidated SubsidiariesConsolidated Statement of Comprehensive IncomeYear Ended March 31 2019
Millions of YenThousands of US Dollars
(Note 1)
2019 2018 2019
NET INCOME (LOSS) yen 9220 yen (8256) $ 83817
OTHER COMPREHENSIVE INCOME (Note 18)
Unrealized gain on available-for-sale securities 1220 777 11090
Deferred gain (loss) on derivatives under hedge accounting 8 (5) 69
Foreign currency translation adjustments (33) (105) (301)
Defined retirement benefit plans 1093 668 9938
Share of other comprehensive (loss) income in associated companies (9) 36 (81)
Total other comprehensive income 2279 1371 20715
COMPREHENSIVE INCOME (LOSS) yen 11499 yen (6885) $ 104532
TOTAL COMPREHENSIVE INCOME (LOSS) ATTRIBUTABLE TO
Owners of the parent yen 11478 yen (6900) $ 104339
Noncontrolling interests 21 15 193
See notes to consolidated financial statements
13
NIPPON SHARYO LTD and Consolidated SubsidiariesConsolidated Statement of Changes in EquityYear Ended March 31 2019
Millions of Yen
Number of shares of
common stock outstanding
Commonstock
Capitalsurplus
Retainedearnings
Treasurystock
BALANCE APRIL 1 2017 144347475 yen 11811 yen 12045 yen (3157) yen (515)
Net loss attributable to owners of the parent - - - (8271) -
Increase in treasury stock net (3967) - 0 - (1)
Change of scope of equity method - - - (231) -
Net changes in the year - - - - -
BALANCE MARCH 31 2018 144343508 11811 12045 (11659) (516)
Disposition of deficit - - (12045) 12045 -
Net income attributable to owners of the parent - - - 9199 -
Increase in treasury stock net (475) - 0 - (1)
Transfer to capital surplus from retained earnings - - 0 (0) -
Net changes in the year (129909157) - - - -
BALANCE MARCH 31 2019 14433876 yen 11811 yen - yen 9585 yen (517)
Thousands of US Dollars (Note 1)
Commonstock
Capitalsurplus
Retainedearnings
Treasurystock
BALANCE MARCH 31 2018 $ 107370 $ 109511 $ (105994) $ (4691)
Disposition of deficit - (109511) 109511 -
Net income attributable to owners of the parent - - 83624 -
Increase in treasury stock net - 0 - (12)
Transfer to capital surplus from retained earnings - 0 (0) -
Net changes in the year - - - -
BALANCE MARCH 31 2019 $ 107370 $ - $ 87141 $ (4703)
Effective October 1 2018 the Company has implemented a 1-for-10 reverse stock split of common stock The number of shares of common stock outstanding is not retroactively adjusted
See notes to consolidated financial statements
14
Millions of Yen
Accumulated other comprehensive income
Unrealized gain on available-for-
sale securities
Deferred loss on derivatives under hedge accounting
Foreign currency
translation adjustments
Defined retirement
benefit plans
Total accumulated
other comprehensive
income
Noncontrollinginterests
Totalequity
yen 6905 yen 5 yen (2068) yen 2993 yen 7835 yen 90 yen 28109
- - - - - - (8271)
- - - - - - (1)
- 5 (42) - (37) - (268)
803 (18) (81) 668 1372 13 1385
7708 (8) (2191) 3661 9170 103 20954
- - - - - - -
- - - - - - 9199
- - - - - - (1)
- - - - - - -
1211 8 (33) 1093 2279 15 2294
yen 8919 yen - yen (2224) yen 4754 yen 11449 yen 118 yen 32446
Thousands of US Dollars (Note 1)
Accumulated other comprehensive income
Unrealized gain on available-for-
sale securities
Deferred gain (loss) on
derivatives under hedge accounting
Foreign currency
translation adjustments
Defined retirement
benefit plans
Total accumulated
other comprehensive
income
Noncontrollinginterests
Totalequity
$ 70073 $ (69) $ (19914) $ 33277 $ 83367 $ 932 $ 190495
- - - - - - -
- - - - - - 83624
- - - - - - (12)
- - - - - - -
11009 69 (301) 9939 20716 147 20863
$ 81082 $ - $ (20215) $ 43216 $ 104083 $ 1079 $ 294970
15
Millions of Yen Thousands of US Dollars(Note 1)
2019 2018 2019
OPERATING ACTIVITIES
Income (loss) before income taxes yen 8547 yen (11240) $ 77699
Adjustments for
Income taxes-paid (5) (750) (42)
Loss on early repayment of long-term debt - 1077 -
Loss on payment for settlement - 26445 -
Depreciation 2370 2728 21549
Loss on impairment of property plant and equipment 270 34 2456
Loss (gain) on sales and disposals of property plant and equipment 21 (9067) 195
Gain on sales of investment securities (3) (54) (31)
Changes in assets and liabilities
(Increase) decrease in trade notes and accounts receivable (1029) 3367 (9352)
(Increase) decrease in inventories (4792) 3248 (43561)
(Decrease) increase in trade notes and accounts payable (2053) 1146 (18661)
Increase (decrease) in allowance for work in process on construction contracts 140 (394) 1272
Decrease in provision for loss on orders received (4248) (10159) (38616)
(Decrease) increase in provision for compensation for health damage from asbestos (12) 7 (109)
Increase (decrease) in advances received 814 (1208) 7401
Increase in liability for employeesrsquo retirement benefits 20 14 178
Other-net (1376) (4308) (12529)
Sub-total (1336) 886 (12151)
Payments for loss on early repayment of long-term debt - (1077) -
Settlement paid - (37001) -
Net cash used in operating activities (1336) (37192) (12151)
INVESTING ACTIVITIES
Purchases of property plant and equipment (1235) (1001) (11224)
Proceeds from sales of property plant and equipment 46 12827 417
Purchases of investment securities (3) (3) (31)
Proceeds from sales of investment securities 11 100 99
Other-net (66) (130) (593)
Net cash(used in)provided by investing activities (1247) 11793 (11332)
FINANCING ACTIVITIES
Net decrease in short-term borrowings - (1595) -
Proceeds from long-term debt 118 56000 1072
Repayments of long-term debt (289) (24487) (2631)
Dividends paid (0) (3) (1)
Other-net (303) (84) (2746)
Net cash (used in) provided by financing activities (474) 29831 (4306)
FOREIGN CURRENCY TRANSLATION ADJUSTMENTS ON CASH AND CASH EQUIVALENTS (59) (308) (542)
NET (DECREASE) INCREASE IN CASH AND CASH EQUIVALENTS (3116) 4124 (28331)
CASH AND CASH EQUIVALENTS BEGINNING OF YEAR 15837 11713 143976
CASH AND CASH EQUIVALENTS END OF YEAR yen 12721 yen 15837 $ 115645
(Concluded)See notes to consolidated financial statements
NIPPON SHARYO LTD and Consolidated SubsidiariesConsolidated Statement of Cash Flows Year Ended March 31 2019
16
NIPPON SHARYO LTD and Consolidated SubsidiariesNotes to Consolidated Financial StatementsYear Ended March 31 2019
the equity method of accounting had been applied to the
investments in these companies the effect on the accompanying
consolidated financial statements would not be material
All significant intercompany balances and transactions have
been eliminated in consolidation All material unrealized profit
included in assets resulting from transactions within the Group
is also eliminated
The number of the consolidated subsidiaries unconsolidated
subsidiary and associated companies for the years ended March
31 2019 and 2018 was as follows
2019 2018Consolidated subsidiaries 6 6Unconsolidated subsidiary stated at cost 1 1Associated companies accounted for by the equity method 2 2Associated company stated at cost 1 1
The fiscal year-end of NIPPON SHARYO USA INC and its
subsidiaries NIPPON SHARYO MANUFACTURING LLC
and NIPPON SHARYO ENGINEERING amp MARKETING
LLC is December 31 and their financial statements with the
closest closing date prior to that of the Company are used for
consolidation purposes Necessary adjustments for significant
transactions from January 1 to March 31 are made for
consolidation purposes
For the equity method associated companies that have a
different fiscal year from that of the Company the associated
companiesrsquo financial statements with the closest closing date
prior to that of the Company are used for consolidation
purposes
b Unification of accounting policies applied to foreign subsidiaries
for the consolidated financial statements
Under Accounting Standards Board of Japan (ldquoASBJrdquo)
Practical Issues Task Force (ldquoPITFrdquo) No 18 ldquoPractical
Solution on Unification of Accounting Policies Applied
to Foreign Subsidiaries for the Consolidated Financial
Statementsrdquo the accounting policies and procedures applied to
a parent company and its subsidiaries for similar transactions
and events under similar circumstances should in principle
be unified for the preparation of the consolidated financial
statements However financial statements prepared by foreign
subsidiaries in accordance with either IFRS or generally
accepted accounting principles in the United States of America
1 BASIS OF PR ESENTATION OF CONSOLIDATED
FINANCIAL STATEMENTS
The accompanying consolidated financial statements have
been prepared in accordance with the provisions set forth in
the Japanese Financial Instruments and Exchange Act and
its related accounting regulations and in accordance with
accounting principles generally accepted in Japan (ldquoJapanese
GAAPrdquo) which are different in certain respects as to the
application and disclosure requirements of International
Financial Reporting Standards (IFRS)
In preparing these consolidated financial statements certain
reclassifications and rearrangements have been made to the
consolidated financial statements issued domestically in order
to present them in a form which is more familiar to readers
outside Japan In addition certain reclassifications have been
made in the 2018 consolidated financial statements to conform
to the classifications used in 2019
The consolidated financial statements are stated in Japanese
yen the currency of the country in which NIPPON SHARYO
LTD (the ldquoCompanyrdquo) is incorporated and operates The
translations of Japanese yen amounts into US dollar amounts
are included solely for the convenience of readers outside Japan
and have been made at the rate of yen110 to $1 the approximate
rate of exchange at March 31 2019 Such translations should not
be construed as representations that the Japanese yen amounts
could be converted into US dollars at that or any other rate
2 SUMMARY OF SIGNIFICANT ACCOUNTING POLICIES
a Consolidation
The consolidated financial statements as of March 31 2019
include the accounts of the Company and its significant
subsidiaries (together the ldquoGrouprdquo) Under the control and
influence concepts those companies in which the Company
directly or indirectly is able to exercise control over operations
are fully consolidated and those companies over which the
Group has the ability to exercise significant influence are
accounted for by the equity method
Investment in associated companies are accounted for by the
equity method Investments in the remaining unconsolidated
subsidiary and associated company are stated at cost If
17
(Financial Accounting Standards Board Accounting Standards
CodificationmdashldquoFASB ASCrdquo) tentatively may be used for the
consolidation process except for the following items that
should be adjusted in the consolidation process so that net
income is accounted for in accordance with Japanese GAAP
unless they are not material (a) amortization of goodwill (b)
scheduled amortization of actuarial gain or loss of pensions
that has been recorded in equity through other comprehensive
income (c) expensing capitalized development costs of research
and development (RampD) and (d) cancellation of the fair value
model of accounting for property plant and equipment and
investment properties and incorporation of the cost model
accounting
c Unification of accounting policies applied to associated
companies for the equity method
ASBJ Statement No 16 ldquoAccounting Standard for Equity
Method of Accounting for Investmentsrdquo requires adjustments
to be made to conform the associatersquos accounting policies for
similar transactions and events under similar circumstances
to those of the parent company when the associatersquos financial
statements are used in applying the equity method unless it is
impracticable to determine adjustments
d Business combinations
Business combinations are accounted for using the purchase
method Acquisition-related costs such as advisory fees or
professional fees are accounted for as expenses in the periods
in which the costs are incurred If the initial accounting for a
business combination is incomplete by the end of the reporting
period in which the business combination occurs an acquirer
shall report in its financial statements provisional amounts for
the items for which the accounting is incomplete During the
measurement period which shall not exceed one year from
the acquisition the acquirer shall retrospectively adjust the
provisional amounts recognized at the acquisition date to reflect
new information obtained about facts and circumstances that
existed as of the acquisition date and that would have affected
the measurement of the amounts recognized as of that date
Such adjustments shall be recognized as if the accounting for
the business combination had been completed at the acquisition
date A parentrsquos ownership interest in a subsidiary might
change if the parent purchases or sells ownership interests in its
subsidiary The carrying amount of noncontrolling interest is
adjusted to reflect the change in the parentrsquos ownership interest
in its subsidiary while the parent retains its controlling interest
in its subsidiary Any difference between the fair value of the
consideration received or paid and the amount by which the
noncontrolling interest is adjusted is accounted for as capital
surplus as long as the parent retains control over its subsidiary
e Cash equivalents
Cash equivalents are short-term investments that are readily
convertible into cash and exposed to insignificant risk of
changes in value
Cash equivalents include time deposits and Cash Management
System (ldquoCMSrdquo) funds due from Central Japan Railway
Company (ldquoCJRrdquo) group all of which mature or become due
within three months from the date of acquisition CJR is the
parent company of the Company
f Investment securities
Investment securities are classif ied and accounted for
depending on managementrsquos intent as follows
Available-for-sale securities are reported at fair value with
unrealized gains and losses net of applicable taxes reported in
a separate component of equity
Nonmarketable available-for-sale securities are stated at cost
determined by the moving-average method For other-than-
temporary declines in fair value investment securities are
reduced to net realizable value by a charge to income
g Derivatives and hedging activities
The Group uses derivative financial instruments to manage its
exposures to fluctuations in foreign exchange and interest rates
Forward foreign currency contracts are utilized by the Group
to reduce foreign currency exchange risks The Group does not
enter into derivatives for trading or speculative purposes
Derivative f inancial instruments and foreign currency
transactions are classified and accounted for as follows 1)
all derivatives are recognized as either assets or liabilities
and measured at fair value and gains and losses on derivative
transactions are recognized in the consolidated statement of
operations and 2) for derivatives used for hedging purposes if
such derivatives qualify for hedge accounting because of high
correlation and effectiveness between the hedging instruments
and the hedged items gains and losses on derivatives are
deferred until maturity of the hedged transactions
The forward foreign currency contracts are utilized to hedge
foreign currency exposures in sales of merchandise and
finished goods to overseas customers and procurement of
raw materials from overseas suppliers Trade receivables and
payables denominated in foreign currencies are translated at
the contracted rates if the forward contracts qualify for hedge
accounting
18
h Allowance for doubtful accounts
An allowance for doubtful accounts is provided for at the
aggregate amount of estimated credit loss based on an
individual analysis of certain doubtful or troubled receivables
and a general reserve for other receivables is calculated based
on the historical loss experience
i Inventories
Inventories are stated at the lower of cost determined
pr inc ipa l ly by the spec i f ic ident i f icat ion method for
merchandise finished goods and work in process and by the
moving-average method for semi-finished goods raw materials
and supplies or net selling value which is defined as the selling
price less additional estimated manufacturing costs and
estimated direct selling expenses The replacement cost may be
used in place of the net selling value if appropriate Reversal of
write-downs of inventories in the amounts of yen(1157) million
($(10521) thousand) and yen(10135) million for the years ended
March 31 2019 and 2018 respectively were included in cost of
sales
j Property plant and equipment
Property plant and equipment including significant renewals
and additions are stated at cost and are depreciated principally
by the straight-l ine method for bui ldings and bui lding
improvements and structures acquired on or after April 1 2016
and by the declining-balance method for other property at rates
based on the estimated useful lives of the assets
Depreciation of leased assets relating to financial lease
transactions without transfer of ownership is computed by the
straight-line method over the leased period
The range of useful lives is principally from 10 to 60 years for
buildings and structures and from six to 17 years for machinery
and equipment
The Company has transferred its factory assets of Toyokawa
Plant Kinuura Plant and Narumi Plant to CJR on April 20
2017 The transfer was not treated as a buying and selling
transaction since the relevant factory assets were transferred to
CJR and the Company continues to utilize these factory assets
as before based on a lease agreement concluded between the
Company and CJR The relevant factory assets were therefore
still recorded under property plant and equipment of the
Company As the relevant transactions do not fall under a
finance lease transaction the total transfer price was recorded
as long-term debt (including the current portion) In addition
capital expenditure related to the transferred factory assets was
recorded under ldquobuildings and structuresrdquo and ldquomachinery and
equipmentrdquo and a part of the capital expenditure was recorded
as long-term debt (including the current portion) for the year
ended March 31 2019
As a result the relevant factory assets as of March 31 2019
were recorded under property plant and equipment in the
carrying amount of yen11975 million ($108867 thousand) as
land of yen3827 million ($34794 thousand) as buildings and
structures and yen7 million ($68 thousand) as machinery and
equipment while long-term debt (including the current portion)
was recorded in the carrying amount of yen20515 million
($186501 thousand) as of March 31 2019 As of March 31
2018 the relevant factory assets were recorded under property
plant and equipment in the carrying amount of yen11975 million
as land and of yen4022 million as buildings (net) while long-
term debt (including the current portion) was recorded in the
carrying amount of yen20687 million
k Long-lived assets
The Group reviews its long-lived assets for impairment
whenever events or changes in circumstance indicate that
the carrying amount of an asset or asset group may not be
recoverable An impairment loss is recognized if the carrying
amount of an asset or asset group exceeds the sum of the
undiscounted future cash f lows expected to result from
the continued use and eventual disposition of the asset or
asset group The impairment loss would be measured as the
amount by which the carrying amount of the asset exceeds its
recoverable amount which is the higher of the discounted cash
flows from the continued use and eventual disposition of the
asset or the net selling value at disposition
l Intangible assets
Intangible assets that are included in other assets are amortized
by the straight-line method Software costs are amortized over
five years
m Allowance for work in process on construction contracts
An allowance for work in process on construction contracts
is provided based on an estimate of the total loss in respect
to construction projects on which eventual losses are deemed
inevitable and the amounts of the loss can be reasonably
estimated Provisions and (reversal of provision) for work
in process on construction contracts in the amounts of yen140
million ($1272 thousand) and yen(394) million for the years
ended March 31 2019 and 2018 respectively were included in
cost of sales
n Provision for loss on orders received
A provision for loss on orders received except for construction
contracts is recorded based on an estimate of the total loss
in respect to contracts on which eventual losses are deemed
19
inevitable and the amounts of the loss can be reasonably
estimated
o Retirement and pension plans
The Company has a lump-sum retirement benefit plan a
defined contribution pension plan and a defined benefit pension
plan The Companyrsquos domestic consolidated subsidiaries have
similar retirement benefit plans
Liabilities for employeesrsquo retirement benefits are calculated
based on the projected benefit obligations and plan assets at
the consolidated balance sheet date The projected benefit
obligations are attributed to periods on a benefit formula basis
Prior service costs are amortized on a straight-line basis over
15 years which is within the average remaining service period
Actuarial gains and losses are amortized on a straight-line basis
mainly over 15 years which is within the average remaining
service period in the following the fiscal year
p Allowance for Polychlorinated Biphenyl (PCB) disposal expenses
An allowance for PCB disposal expenses has been provided
based on the published estimated disposal fee schedule issued
by the Japan Environmental Safety Corporation
q Provision for compensation for health damage from asbestos
A provision for compensation for health damage from asbestos
has been recorded based on the estimated compensation
amount for former employees who suffered health damage from
asbestos
r Income taxes
The provision for income taxes is computed based on the pretax
income included in the consolidated statement of operations
The asset and l iabi l it y approach is used to recognize
deferred tax assets and liabilities for the expected future tax
consequences of temporary differences between the carrying
amounts and the tax bases of assets and liabilities Deferred
taxes are measured by applying currently enacted tax rates to
the temporary differences
s Foreign currency transactions
All short-term and long-term monetary receivables and
payables denominated in foreign currencies are translated
into Japanese yen at the exchange rates at the consolidated
balance sheet date The foreign exchange gains and losses from
translation are recognized in the consolidated statement of
operations to the extent that they are not hedged by forward
exchange contracts
t Foreign currency financial statements
The balance sheet accounts of the consolidated foreign
subsidiaries are translated into Japanese yen at the current
exchange rate as of the consolidated balance sheet date except
for equity which is translated at the historical rate Revenue
and expense accounts of consolidated foreign subsidiaries
are translated into yen at the average exchange rate
Differences arising from such translation are shown as foreign
currency translation adjustments under accumulated other
comprehensive income in a separate component of equity
u RampD expenses
Expenses related to RampD activities are charged to income as
incurred RampD expenses amounted to yen1344 million ($12214
thousand) and yen1261 million for the years ended March
31 2019 and 2018 respectively and are included in general
and administrative expenses and manufacturing costs in the
accompanying consolidated statement of operations
v Per share information
Basic net income (loss) per share is computed by dividing
net income (loss) attributable to common shareholders by
the weighted-average number of shares of common stock
outstanding during the respective year Weighted-average
number of shares of common stock for the years ended March
31 2019 and 2018 were 14434 thousand shares Diluted net
income (loss) per share for the years ended March 31 2019
and 2018 was not applicable because the Company had no
dilutive common shares Cash dividends per share presented
in the accompanying consolidated statement of operations are
dividends applicable to the respective years including dividends
to be paid after the end of the year
Effective October 1 2018 the Company has implemented
a 1-for-10 reverse stock split of common stock Per share of
common stock is retroactively adjusted as if the reverse stock
split had been effected at the beginning of the fiscal year ended
March 31 2018
w Construction contracts
Construction revenue and construction costs are recognized
by the percentage-of-completion method if the outcome of a
construction contract can be estimated reliably When total
construction revenue total construction costs and the stage of
completion of the contract at the consolidated balance sheet
date can be reliably measured the outcome of a construction
contract is deemed to be estimated reliably If the outcome
of a construction contract cannot be reliably estimated the
completed-contract method should be applied When it is
probable that the total construction costs will exceed total
construction revenue an estimated loss on the contract should
be immediately recognized by providing for a loss on such
construction contracts
20
x Accounting changes and error corrections
Under ASBJ Statement No 24 ldquoAccounting Standard for
Accounting Changes and Error Correctionsrdquo and ASBJ
Guidance No 24 ldquoGuidance on Accounting Standard for
Accounting Changes and Error Correctionsrdquo accounting
treatments are required as follows (1) Changes in Accounting
PoliciesmdashWhen a new accounting policy is applied following
revision of an accounting standard the new policy is applied
retrospectively unless the revised accounting standard includes
specific transitional provisions in which case the entity shall
comply with the specific transitional provisions (2) Changes in
PresentationmdashWhen the presentation of financial statements
is changed prior-period financial statements are reclassified
in accordance with the new presentation (3) Changes in
Accounting EstimatesmdashA change in an accounting estimate
is accounted for in the period of the change if the change
affects that period only and is accounted for prospectively if
the change affects both the period of the change and future
periods (4) Corrections of Prior-Period ErrorsmdashWhen an error
in prior-period consolidated financial statements is discovered
those statements are restated
y New accounting pronouncement
Accounting Standard for Revenue Recognition etc
- Accounting Standard for Revenue Recognition (ASBJ
Statement No 29 issued on March 30 2018)
- Implementation Guidance on Accounting Standard for
Revenue Recognition (ASBJ Guidance No 30 issued on
March 30 2018)
(a) Overview
The International Accounting Standards Board (ldquoIASBrdquo) and
the Financial Accounting Standards Board (ldquoFASBrdquo) have
jointly developed a comprehensive accounting standard for
revenue recognition and issued it as converged guidance on
recognizing revenue in contracts with customers in May 2014
as IFRS 15 (IASB) and Topic 606 (FASB) respectively To
respond to both IFRS 15 and Topic 606 effective from the fiscal
years beginning on or after January 1 2018 and December
15 2017 respectively ASBJ has developed a comprehensive
accounting standard for revenue recognition and issued it with
the respective implementation guidance
In developing the accounting standard for revenue recognition
ASBJ basically integrated the core principle of IFRS 15 from a
comparability point of view of the financial statements which
is one of the benefits of ensuring consistency with IFRS 15
ASBJ on the other side considered additional alternative
treatments where current practices under Japanese GAAP are
to be reflected as far as such treatments would not significantly
impair international comparability
(b) Effective date
The above standard and guidance are scheduled to be applied
from the beginning of the fiscal year ending March 31 2022
(c) Effects of application of the standards
The effects of the application of the above standard and
guidance on the consolidated financial statements are currently
being assessed
z Change in presentation
Application of ldquoPartial Amendments to Accounting Standard for
Tax Effect Accountingrdquo
On February 16 2018 the ASBJ issued ASBJ Statement No 28
Partial Amendments to Accounting Standard for Tax Effect
Accounting which requires deferred tax assets and deferred
tax liabilities to be classified as investments and other assets
and long-term liabilities respectively Deferred tax assets were
previously classified as current assets and investments and other
assets and deferred tax liabilities were previously classified as
current liabilities and long-term liabilities under the previous
accounting standard The revised accounting standard is
effective for annual periods beginning on or after April 1 2018
The Group retrospectively applied the revised accounting
standard effective April 1 2018 and deferred tax assets of yen51
million which were previously classified as current assets as of
March 31 2018 have been reclassified as investments and other
assets in the accompanying consolidated balance sheet In
accordance with transitional treatment allowed for the adoption
of the revised accounting standard the note information
of valuation allowances for tax loss carryforwards and for
temporary differences for the year ended March 31 2018 was
not separately disclosed
21
3 NOTES AND ACCOUNTS RECEIVABLE
Notes and accounts receivable as of March 31 2019 and 2018 consisted of the following
Millions of Yen Thousands ofUS Dollars
2019 2018 2019Trade notes receivable yen 5022 yen 4848 $ 45654
- Unconsolidated subsidiary and associated companies 215 198 1956Trade accounts receivable 17600 16793 160001
- CJR unconsolidated subsidiary and associated companies 6054 6051 55040Other 911 640 8277Less allowance for doubtful accounts (46) (4) (415)
Total yen 29756 yen 28526 $ 270513
Note Allowance for doubtful accounts was not recognized for accounts receivable-other which was included in Other above
4 INVENTORIES
Inventories as of March 31 2019 and 2018 consisted of the following
Millions of Yen Thousands ofUS Dollars
2019 2018 2019Merchandise yen 224 yen 258 $ 2039Finished goods 1303 1642 11841Work in process and semi-finished goods 28676 23450 260695Raw materials 1281 1355 11644
Total yen 31484 yen 26705 $ 286219
Work in process and allowance for work in process on construction contracts are presented in the gross amount in the consolidated balance sheet At March 31 2019 and 2018 allowance for work in process on construction contracts of yen80 million ($725 thousand) and none respectively was provided and included in work in process and semi-finished goods above
5 INVESTMENT SECURITIES
Investment securities as of March 31 2019 and 2018 consisted of the following
Millions of Yen Thousands ofUS Dollars
2019 2018 2019Equity securities yen 20381 yen 18632 $ 185281
Total yen 20381 yen 18632 $ 185281
The costs and aggregate fair values of investment securities as of March 31 2019 and 2018 were as follows
Millions of Yen2019
Cost Gross unrealized gains
Gross unrealized losses
Fair and carrying value
Securities classified as available-for-saleEquity securities yen 6063 yen 12743 yen (25) yen 18781
Total yen 6063 yen 12743 yen (25) yen 18781
22
Millions of Yen2018
Cost Gross unrealized gains
Gross unrealized losses
Fair and carrying value
Securities classified as available-for-saleEquity securities yen 6059 yen 10965 yen - yen 17024
Total yen 6059 yen 10965 yen - yen 17024
Thousands of US Dollars2019
Cost Gross unrealized gains
Gross unrealized losses
Fair and carrying value
Securities classified as available-for-saleEquity securities $ 55117 $ 115842 $ (226) $ 170733
Total $ 55117 $ 115842 $ (226) $ 170733
The information of available-for-sale securities which were sold for the years ended March 31 2019 and 2018 was as follows
Millions of Yen2019
Proceeds Realized gains Realized lossesAvailable-for-sale
Equity securities yen 10 yen 3 yen (0)Total yen 10 yen 3 yen (0)
Millions of Yen2018
Proceeds Realized gains Realized lossesAvailable-for-sale
Equity securities yen 100 yen 54 yen -Total yen 100 yen 54 yen -
Thousands of US Dollars2019
Proceeds Realized gains Realized lossesAvailable-for-sale
Equity securities $ 90 $ 31 $ (9)Total $ 90 $ 31 $ (9)
No impairment losses were recognized on available-for-sale equity securities for the years ended March 31 2019 and 2018
6 NOTES AND ACCOUNTS PAYABLE
Notes and accounts payable as of March 31 2019 and 2018 consisted of the following
Millions of Yen Thousands ofUS Dollars
2019 2018 2019Trade notes payable yen 1418 yen 1208 $ 12890Electronically recorded obligations-operating 10670 10667 96993-Unconsolidated subsidiary and associated companies 25 17 226Trade accounts payable 8001 10323 72740-Unconsolidated subsidiary and associated companies 94 50 857Other 2704 2580 24581
Total yen 22912 yen 24845 $ 208287
23
7 SHORT-TERM BORROWINGS AND LONG-TERM DEBT
There was no balance of short-term borrowings as of March 31 2019 and 2018
Long-term debt as of March 31 2019 and 2018 consisted of the following
Millions of Yen Thousands ofUS Dollars
2019 2018 2019Loans from CJR due through 2027 (Note) with average interest rate of 061 yen 55515 yen 55687 $ 504684
Less current portion (296) (287) (2688)Total yen 55219 yen 55400 $ 501996
The aggregate annual maturities of long-term debt as of March 31 2019 were as follows
Years ending March 31 Millions of Yen Thousands of US Dollars
2020 - -2021 - -2022 yen 2900 $ 263642023 2900 263642024 2900 263642025 and thereafter 26300 239090
Total yen 35000 $ 318182
Note Long-term debt recorded for the transfer price of the factory assets transferred to CJR and for a part of capital expenditure related to the transferred factory assets in the total amount of yen20219 million ($183814 thousand) was not reflected
8 RETIREMENT AND PENSION PLANS
Employees who terminate their service with the Company and its domestic consolidated subsidiaries are entitled to retirement benefits generally determined by reference to the basic rate of pay at the time of termination length of service and conditions under which the termination occurs The Company has a lump-sum retirement benefit plan a defined contribution pension plan and a defined benefit pension plan which are assumed to cover retirement benefits for employees who have retired voluntarily The Company contributed certain assets to the employee retirement benefit trust The Companyrsquos domestic consolidated subsidiaries have similar retirement benefit plans
(1) Defined benefit plans
(a) The changes in defined benefit obligation for the years ended March 31 2019 and 2018 were as follows
Millions of Yen Thousands ofUS Dollars
2019 2018 2019Balance at beginning of year yen 13359 yen 13445 $ 121448
Current service cost 738 724 6709Interest cost 118 119 1071Actuarial gains (93) (42) (844) Benefits paid (484) (838) (4406) Prior service cost - (49) -
Balance at end of year yen 13638 yen 13359 $ 123978
Note The domestic consolidated subsidiaries of the Company apply the simplified method in calculating the defined benefit obligation
24
(b) The changes in plan assets for the years ended March 31 2019 and 2018 were as follows
Millions of Yen Thousands ofUS Dollars
2019 2018 2019Balance at beginning of year yen 18710 yen 17269 $ 170088
Expected return on plan assets 245 232 2232 Actuarial gains 2123 1305 19300 Contribution from the employer 380 383 3449 Benefits paid (202) (479) (1838)
Balance at end of year yen 21256 yen 18710 $ 193231
(c) Reconciliation between the liability (asset) recorded in the consolidated balance sheet and the balances of defined benefit obligation and plan assets as of March 31 2019 and 2018 was as follows
Millions of Yen Thousands ofUS Dollars
2019 2018 2019Funded defined benefit obligation yen 13346 yen 13086 $ 121322 Plan assets (21256) (18709) (193231)
Total (7910) (5623) (71909)Unfunded defined benefit obligation 292 273 2656 Net asset arising from defined benefit obligation yen (7618) yen (5350) $ (69253)
Asset for employeesrsquo retirement benefits yen (7910) yen (5623) $ (71909)Liability for employeesrsquo retirement benefits 292 273 2656 Net asset arising from defined benefit obligation yen (7618) yen (5350) $ (69253)
(d) The components of net periodic benefit costs for the years ended March 31 2019 and 2018 were as follows
Millions of Yen Thousands ofUS Dollars
2019 2018 2019Service cost (Note) yen 738 yen 728 $ 6709 Interest cost 118 118 1071 Expected return on plan assets (245) (232) (2232)Recognized actuarial gains (640) (426) (5817)Amortization of prior service cost (8) (5) (70)Net periodic benefit costs yen (37) yen 183 $ (339)
Note Retirement benefit costs of the consolidated subsidiaries applying the simplified method are included in service cost
(e) Amounts recognized in other comprehensive income (before income tax effect) in respect of defined retirement benefit plans for the years ended March 31 2019 and 2018
Millions of Yen Thousands ofUS Dollars
2019 2018 2019Prior service cost yen 8 yen (44) $ 70Actuarial (gains) losses (1576) (920) (14329)
Total yen (1568) yen (964) $ (14259)
25
(f) Amounts recognized in accumulated other comprehensive income (before income tax effect) in respect of defined retirement benefit plans as of March 31 2019 and 2018
Millions of Yen Thousands ofUS Dollars
2019 2018 2019Unrecognized prior service cost yen (71) yen (79) $ (647)Unrecognized actuarial gains (6749) (5173) (61355)
Total yen (6820) yen (5252) $ (62002)
(g) Plan assets
(i) Components of plan assets Plan assets consisted of the following
2019 2018Debt investments 12 14Equity investments 80 78Cash and deposits 3 3Other 5 5
Total 100 100
Note The employeesrsquo retirement benefit trusts for the contributory pension plans accounted for 18 of total plan assets for the years ended March 31 2019 and 2018
(ii) Method of determining the expected rate of return on plan assetsThe expected rate of return on plan assets is determined considering the current and future asset portfolio and the long-term rates of return which are expected currently and in the future from the various components of the plan assets
(h) Assumptions used for the years ended March 31 2019 and 2018 were set forth as follows
2019 2018Discount rate 09 09Expected rate of return on plan assets 20 20
(2) Defined contribution plans
The required contribution of the Company and its consolidated subsidiaries amounted to yen139 million ($1265 thousand) and yen133 million for the years ended March 31 2019 and 2018 respectively
26
9 ASSETS PLEDGED AS COLLATERAL
(1)Assets pledged as collateral for long-term debt from CJR in the amount of yen35000 million ($318182 thousand) for the payment of settlement money related to a large railway rolling stock project in the USA as of March 31 2019 and 2018 were as follows
Millions of Yen Thousands ofUS Dollars
2019 2018 2019Buildings and structures yen 261 yen 277 $ 2372Land 15 15 136Investment securities 12606 12338 114598
Total yen 12882 yen 12630 $ 117106
(2)Other assets pledged as collateral as of March 31 2019 and 2018 were as follows
Millions of Yen Thousands ofUS Dollars
2019 2018 2019Other current assets (Note 1) yen 56 yen 56 $ 505Other assets under Investments and Other Assets (Note 2) 10 10 91Investment securities (Note 3) 5887 4487 53525
Total yen 5953 yen 4553 $ 54121
Notes 1 Deposit required by insurance contracts 2 Guarantee deposit required by the Building Lots and Buildings Transaction Business Law 3 Deposit for letter of credit
10 CONTINGENT LIABILITIES
In some cases the Company sells its construction equipment products through leasing companies Some of these leasing companies request that the Company enters into lease credit guarantee contracts Under these contracts if the lease credits are unrecoverable from users of the Companyrsquos construction equipment products the Company guarantees payment of the amount defined by the contract to the leasing companies Such guarantees as of March 31 2019 and 2018 amounted to yen226 million ($2056 thousand) and yen389 million respectively
11 LEASE TRANSACTIONS
The Group uses certain machinery and equipment under finance lease contracts
All finance lease transactions are accounted for in a manner similar to ordinary sale or purchase transactions
The aggregate annual maturities of lease obligations as of March 31 2019 were as follows
Years ending March 31 Millions of Yen Thousands ofUS Dollars
2020 yen 678 $ 6168 2021 651 5913 2022 665 6045 2023 244 2221 2024 90 817 2025 and thereafter - -
Total yen 2328 $ 21164
27
A consolidated subsidiary subleases machinery
Investments in leases and lease obligations which include an interest portion resulting from sublease transactions as of March 31 2019 and 2018 were as follows
Millions of Yen Thousands ofUS Dollars
2019 2018 2019 Investments in leases
Due within one year yen 122 yen 154 $ 1112Due after one year 205 327 1859
Total yen 327 yen 481 $ 2971
Millions of Yen Thousands ofUS Dollars
2019 2018 2019Lease obligations
Due within one year yen 140 yen 170 $ 1272 Due after one year 235 375 2139
Total yen 375 yen 545 $ 3411
12 EQUITY
Japanese companies are subject to the Companies Act of Japan (the ldquoCompanies Actrdquo) The significant provisions in the Companies Act that affect financial and accounting matters are summarized below
(1) Dividends
Under the Companies Act companies can pay dividends at any time during the fiscal year in addition to the year-end dividend upon resolution at the shareholdersrsquo meeting Additionally for companies that meet certain criteria including (1) having a Board of Directors (2) having independent auditors (3) having an Audit amp Supervisory Board and (4) the term of service of the directors being prescribed as one year rather than the normal two-year term by its articles of incorporation the Board of Directors may declare dividends (except for dividends-in-kind) at any time during the fiscal year if the company has prescribed so in its articles of incorporation However the Company cannot do so because it does not meet all the above criteria
The Companies Act permits companies to distribute dividends-in-kind (noncash assets) to shareholders subject to a certain limitation and additional requirements
Semiannual interim dividends may also be paid once a year upon resolution by the Board of Directors if the articles of incorporation of the company so stipulate The Companies Act provides certain limitations on the amounts available for dividends or the purchase of treasury stock The limitation is defined as the amount available for distribution to the shareholders but the amount of net assets after dividends must be maintained at no less than yen3 million
(2) Increasesdecreases and transfer of common stock reserve and surplus
The Companies Act requires that an amount equal to 10 of dividends must be appropriated as a legal reserve (a component of retained earnings) or as additional paid-in capital (a component of capital surplus) depending on the equity account charged upon the payment of such dividends until the aggregate amount of legal reserve and additional paid-in capital equals 25 of the common stock Under the Companies Act the total amount of additional paid-in capital and legal reserve may be reversed without limitation The Companies Act also provides that common stock legal reserve additional paid-in capital other capital surplus and retained earnings can be transferred among the accounts within equity under certain conditions upon resolution of the shareholders
28
(3) Treasury stock and treasury stock acquisition rights
The Companies Act also provides for companies to purchase treasury stock and dispose of such treasury stock by resolution of the Board of Directors The amount of treasury stock purchased cannot exceed the amount available for distribution to the shareholders which is determined by a specific formula Under the Companies Act stock acquisition rights are presented as a separate component of equity The Companies Act also provides that companies can purchase both treasury stock acquisition rights and treasury stock Such treasury stock acquisition rights are presented as a separate component of equity or deducted directly from stock acquisition rights
Effective June 28 2018 the Company transferred capital surplus to retained earnings based on the resolution of the Shareholdersrsquo Meeting held on June 28 2018
Effective October 1 2018 the Company has implemented a 1-for-10 reverse stock split of common stock based on the resolution of the Shareholdersrsquo Meeting held on June 28 2018
13 INCOME TAXES
The Company and its domestic subsidiaries are subject to Japanese national and local income taxes which in the aggregate resulted in a normal effective statutory tax rate of approximately 302 and 305 for the years ended March 31 2019 and 2018 respectively
The tax effects of significant temporary differences and tax loss carryforwards that resulted in deferred tax assets and liabilities as of March 31 2019 and 2018 were as follows
Millions of Yen Thousands ofUS Dollars
2019 2018 2019
Deferred tax assetsTax loss carryforwards (Note 2) yen 3630 yen 3642 $ 32999 Liability for employeesrsquo retirement benefits 2510 2528 22815 Loss on write-downs of inventories 1761 2101 16013 Land and building of plants 1458 1487 13253 Loss on impairment of fixed assets 1155 1218 10502 Accrued bonuses to employees 485 446 4411 Provision for loss on orders received 273 1682 2485 Other 1834 2352 16664
Sub-total 13106 15456 119142
Less valuation allowance for tax loss crryforwards (Note 2) (3630) - (32999)
Less valuation allowance pertaining to total amount of deductible temporary differences (7974) - (72493)Valuation allowance total (Note 1) (11604) (15320) (105492)
Total yen 1502 yen 136 $ 13650
Deferred tax liabilitiesUnrealized gain on available-for-sale securities yen (3842) yen (3308) $ (34924)Deferred gain on sales of property - (22) -Other (3549) (2903) (32264)
Total (7391) (6233) (67188)Net deferred tax liabilities yen (5889) yen (6097) $ (53538)
Notes 1 Valuation allowance decreased by yen3716 million ($33779 thousand) during the year ended March 31 2019 This is mainly due to the decrease of deductible temporary differences on the one hand On the other hand the respective deferred tax assets related to tax loss carryforwards were partly judged as recoverable as a result of careful consideration taking into account the current and estimated future taxable income
2 Expected maturity of the deferred tax assets after the balance sheet date for tax loss carryforwards as of March 31 2019 was as follows
29
The expiration of tax loss carryforwards the related valuation allowances and the resulting net deferred tax assets as of March 31 2019 were as follows
Millions of Yen
2019 Within 1 year
Over 1 year but within
2 years
Over 2 years but within
3 years
Over 3 years but within
4 years
Over 4 years but within
5 years
Over 5 years Total
Deferred tax assets relating to tax loss carryforwards () - - - - - yen 3630 yen 3630
Less valuation allowance for tax loss carry forwards - - - - - (3630) (3630)
Net deferred tax assets relating to tax loss carry forwards - - - - - - -
Thousands of US Dollars
2019 Within 1 year
Over 1 year but within
2 years
Over 2 years but within
3 years
Over 3 years but within
4 years
Over 4 years but within
5 years
Over 5 years Total
Tax loss carryforwards () - - - - - $ 32999 $ 32999
Valuation allowance - - - - - (32999) (32999)
Deferred tax assets - - - - - - -
()The amount of tax loss carryforwards was calculated by using the statutory tax rate
A reconciliation between the normal effective statutory tax rates and the actual effective tax rates reflected in the accompanying consolidated statement of operations for the year ended March 31 2019 with the corresponding figures for 2018 is as follows
2019 2018Normal effective statutory tax rate 302 305 Increase (decrease) due to
Expenses not deductible for income tax purposes 39 (290)Tax-exempt income (03) 02Changes in valuation allowance (376) 156Per capita inhabitant tax 04 (03)Transfer price adjustments on consolidation (54) 91Higher (lower) income tax rates applicable to income in certain foreign countries 18 (07)
Other (09) 12Actual effective income tax rate (79) 266
14 FINANCIAL INSTRUMENTS AND RELATED DISCLOSURES
(1) Group policy for financial instruments
The Group finances capital investments and necessary funds mainly internally and with CMS provided by a consolidated subsidiary of CJR The Company also operates funds by utilizing CMS Derivative transactions are used not for speculative purposes but to manage exposure to financial risks as described in (2) below
(2) Nature and extent of risks arising from financial instruments
Receivables such as notes and accounts receivable are exposed to customer credit risk Although receivables in foreign currencies are exposed to the risk of fluctuation in foreign currency exchange rates the position net of payables in foreign currencies is hedged by using forward foreign currency contracts Investment securities mainly equity instruments of customers and suppliers of the Group are exposed to the risk of market price fluctuations
30
Payment terms of payables such as trade notes and trade accounts are less than one year Although payables in foreign currencies are exposed to the risk of fluctuation in foreign currency exchange rates the position net of receivables in foreign currencies is hedged by using forward foreign currency contracts
Long-term debt recorded for the transfer price of the factory assets transferred to CJR and for a part of capital expenditure related to the transferred factory assets is not exposed to market risks from changes in variable interest rates since the Company repays a constant lease fee including the interest portion based on the lease agreement Long-term debt from CJR for the payment of settlement money related to a large railway rolling stock project in the USA is also not exposed to market risks from changes in variable interest rates due to the fixed interest rate Lease obligations are primarily used for financing capital investments
Derivatives mainly include forward foreign currency contracts which are used to manage exposure to risks associated with fluctuations in foreign currency exchange rates related to receivables and payables denominated in foreign currencies and forecasted transactions denominated in foreign currencies Please see Note 15 for more information about derivatives
(3)Risk management for financial instruments
Credit risk management
Credit risk is the risk of economic loss arising from a counterpartyrsquos failure to repay or service debt according to the contractual terms The Group manages its credit risk from receivables by monitoring financial position payment terms and balances of customers to identify default risk of customers at an early stage
Market risk management (foreign exchange risk and interest rate risk)
Foreign currency trade receivables and payables are exposed to market risk resulting from fluctuations in foreign currency exchange rates Such foreign exchange risk is hedged principally by forward foreign currency contracts In addition when foreign currency trade receivables and payables are expected from forecasted transactions forward foreign currency contracts may be used
Investment securities are managed by monitoring the market values and the financial position of issuers on a regular basis
Liquidity risk management
The Group establishes or updates its cash management plan according to the monthly cash management plan from each subsidiary in order to monitor its liquidity risk associated with operating payables and short-term borrowings and long-term debt
(4)Fair values of financial instruments
Fair values of financial instruments are based on quoted prices in active markets If quoted prices are not available other rational valuation techniques are used instead Please see Note 15 for the details of the fair value of derivatives
(a) Fair value of financial instrumentsMillions of Yen
2019Carrying amount Fair value Unrealized
gain (loss)Cash and cash equivalents yen 12721 yen 12721 -Notes and accounts receivable 29756 29756 -Investment securities 18781 18781 -
Total yen 61258 yen 61258 -
Notes and accounts payable yen 22912 yen 22912 -Income taxes payable 538 538 -Long-term debt including current portion 35000 35609 yen (609)Lease obligations including current portion 2328 2315 13
Total yen 60778 yen 61374 yen (596)
31
Millions of Yen2018
Carrying amount Fair value Unrealized
gain (loss)Cash and cash equivalents yen 15837 yen 15837 -Notes and accounts receivable 28526 28526 -Investment securities 17024 17024 -
Total yen 61387 yen 61387 -
Notes and accounts payable yen 24845 yen 24845 -Income taxes payable 132 132 -Long-term debt including current portion 35000 35127 yen (127)Lease obligations including current portion 2473 2454 19
Total yen 62450 yen 62558 yen (108)
Thousands of US Dollars2019
Carrying amount Fair value Unrealized
gain (loss)Cash and cash equivalents $ 115645 $ 115645 -Notes and accounts receivable 270513 270513 -Investment securities 170733 170733 -
Total $ 556891 $ 556891 -
Notes and accounts payable $ 208287 $ 208287 -Income taxes payable 4888 4888 -Long-term debt including current portion 318183 323721 $ (5538)Lease obligations including current portion 21164 21046 118
Total $ 552522 $ 557942 $ (5420)
AssetsCash and cash equivalents and notes and accounts receivableThe carrying values of cash and cash equivalents and notes and accounts receivable approximate fair value because of their short maturities
Investment securitiesThe fair values of investment securities are measured at the quoted market prices of the stock exchange The information on the fair value of investment securities by classification is included in Note 5
LiabilitiesNotes and accounts payable and income taxes payableThe carrying values of notes and accounts payable and income taxes payable approximate fair value since they are scheduled to be settled in a short period of time
Long-term debt and lease obligationsThe fair values of long-term debt (including the current portion) and lease obligations are measured at the present value of the total of the principal and interest discounted by the interest rate applied to new loans
Derivative transactionsInformation on the fair value of derivatives is included in Note 15
32
(b)Carrying amount of financial instruments whose fair value cannot be reliably determined
Millions of Yen Thousands ofUS Dollars
2019 2018 2019Unlisted securities yen 1600 yen 1608 $ 14548Investments in an unconsolidated subsidiary and
associated companies 795 728 7226
Long-term debt recorded for the transfer price of the factory assets transferred to CJR and for a part of capital expenditure related to the transferred factory assets (including the current portion)
20515 20687 186501
(5)Maturity analysis for financial assets and securities with contractual maturities
Millions of Yen2019
Due in one year or less
Due after one year through
five years
Due after five years through
10 years
Due after 10 years
Cash and cash equivalents yen 12721 - - -Notes and accounts receivable 29402 yen 354 yen - -
Total yen 42123 yen 354 yen - -
Thousands of US Dollars2019
Due in oneyear or less
Due after one year through
five years
Due after five years through
10 years
Due after 10 years
Cash and cash equivalents $ 115645 - - -Notes and accounts receivable 267294 $ 3219 $ - -
Total $ 382939 $ 3219 $ - -
Please see Note 7 for annual maturities of long-term debt and Note 11 for obligations under finance leases
15 DERIVATIVE TRANSACTIONS
The Group enters into forward foreign currency contracts to hedge foreign exchange risk associated with certain assets and liabilities denominated in foreign currencies
All derivative transactions are entered into to hedge interest and foreign currency exposures incorporated within its business Accordingly market risk in these derivatives is basically offset by opposite movements in the value of hedged assets or liabilities
Derivative transactions entered into by the Group have been made in accordance with internal policies which regulate the authorization and credit limit amount
33
There was no derivative transaction to which hedge accounting was applied for the year ended March 31 2019 Derivative transactions to which hedge accounting was applied for the year ended March 31 2018 were as follows
Millions of Yen2018
Hedgeditem
Contractamount
Contract amount due
after one yearFairvalue
CurrencyForward foreign currency contracts
Buying
USD Advance payments yen 152 - yen (8)
16 LOSS ON IMPAIRMENT OF PROPERTY PLANT AND EQUIPMENT
The Group recognized impairment losses on the following asset groups
For the year ended March 31 2019Millions of Yen Thousands of US Dollars
Asset group Location Account 2019 2019Idle assets Shinanomachi Nagano Land yen 14 $ 133Idle assets Nagoya Aichi Buildings and structures etc 17 153Idle assets Illinois USA Machinery and equipment 239 2170
Total yen 270 $ 2456
For the year ended March 31 2018Millions of Yen
Asset group Location Account 2018
Idle assets Nakatsugawa Gifu Buildings and structures land etc yen 34
Total yen 34
The Group reviewed its long-lived assets for impairment as of March 31 2019 and 2018
For the years ended March 31 2019 and 2018 the Group recognized an impairment loss for idle assets by writing down the property to its net selling value (based on reasonably adjusted amount of property tax assessment value)
Upon the decision to close the manufacturing plant of an US subsidiary NIPPON SHARYO USA INC in Rochelle Illinois USA on July 24 2018 the sale of the plant to a third party has been considered Therefore we recognized an impairment loss on the manufacturing plant at its net selling value for the year ended March 31 2019
Impairment losses other than the above were not disclosed as they were immaterial
17 RELATED-PARTY DISCLOSURES
(1)Parent and major shareholders
CJR directly owned 512 of the total shares of the Company as of March 31 2019 and 2018 The Company distributes transportation vehicles to CJR
34
Transactions of the Company with CJR for the years ended March 31 2019 and 2018 were as follows
For the year ended March 31 2019 Millions of Yen Thousands ofUS Dollars
2019 2019Sales yen 19955 $ 181413Borrowing of funds 117 1072Repayment of debt 289 2631Interest expense 337 3067
Borrowing of funds repayment of debt and interest expense of yen117 million ($1072 thousand) yen289 million ($2631 thousand) and yen127 million ($1158 thousand) respectively were recorded for the transfer of the factory assets transferred to CJR and for a part of capital expenditure related to the transferred factory assets
For the year ended March 31 2018 Millions of Yen
2018Sales yen 24001Borrowing of funds 56000Repayment of debt 313Interest expense 193
Borrowing of funds repayment of debt and interest expense of yen21000 million yen313 million and yen122 million respectively were recorded for the transfer of the factory assets transferred to CJR and for a part of capital expenditure related to the transferred factory assets
The balances due to or from CJR as of March 31 2019 and 2018 were as follows
As of March 31 2019 Millions of Yen Thousands ofUS Dollars
2019 2019Accounts receivable yen 5993 $ 54483Current portion of long-term debt 296 2688Long-term debt 55219 501996Accrued expenses 43 392
Current portion of long-term debt long-term debt and accrued expenses of yen296 million ($2688 thousand) yen20220 million ($183815 thousand) and yen42 million ($381 thousand) respectively were the balances related to long-term debt for the transfer price of the factory assets transferred to CJR and for a part of capital expenditure related to the transferred factory assets
As of March 31 2018 Millions of Yen
2018Accounts receivable yen 5947Current portion of long-term debt 287Long-term debt 55400Accrued expenses 43
Current portion of long-term debt long-term debt and accrued expenses of yen287 million yen20400 million and yen42 million respectively were the balances related to long-term debt for the transfer price of the factory assets transferred to CJR and for a part of capital expenditure related to the transferred factory assets
(2)Fellow subsidiaries and subsidiaries of other affiliates
35
Transactions of the Company with the fellow subsidiaries for the years ended March 31 2019 and 2018 were as follows
For the year ended March 31 2019Millions of Yen Thousands of
US Dollars2019 2019
JR Central Financial Management Co Ltd Interest income yen 5 $ 45
For the year ended March 31 2018Millions of Yen
2018JR Central Financial Management Co Ltd Interest income yen 2
The balances due to or from the fellow subsidiaries as of March 31 2019 and 2018 were as follows
As of March 31 2019Millions of Yen Thousands of
US Dollars2019 2019
JR Central Financial Management Co LtdCash and cash equivalents yen 7398 $ 67255
As of March 31 2018Millions of Yen
2018JR Central Financial Management Co LtdCash and cash equivalents yen 7534
36
18 OTHER COMPREHENSIVE INCOME
The components of other comprehensive income for the years ended March 31 2019 and 2018 were as follows
Millions of Yen Thousands of US Dollars
2019 2018 2019Unrealized gain on available-for-sale securities
Gains arising during the year yen 1753 yen 1131 $ 15938Reclassification adjustments to profit or loss - (0) -Amount before income tax effect 1753 1131 15938Income tax effect (533) (354) (4848)
Total yen 1220 yen 777 $ 11090Deferred gain (loss) on derivatives under hedge accounting
Gains (losses) arising during the year yen 8 yen (5) $ 69Income tax effect - - -
Total yen 8 yen (5) $ 69Foreign currency translation adjustments
Adjustments arising during the year yen (33) yen (105) $ (301)Total yen (33) yen (105) $ (301)
Defined retirement benefit plansAdjustments arising during the year yen 2216 yen 1396 $ 20145Reclassification adjustments to profit or loss (648) (432) (5887)Amount before income tax effect 1568 964 14258Income tax effect (475) (296) (4320)
Total yen 1093 yen 668 $ 9938Share of other comprehensive (loss) income in associated companies
Gains arising during the year yen (9) yen 36 $ (81)Income tax effect - - -
Total yen (9) yen 36 $ (81)
Total other comprehensive income yen 2279 yen 1371 $ 20715
19 SEGMENT INFORMATION
Under ASBJ Statement No 17 ldquoAccounting Standard for Segment Information Disclosuresrdquo and ASBJ Guidance No 20 ldquoGuidance on Accounting Standard for Segment Information Disclosuresrdquo an entity is required to report financial and descriptive information about its reportable segments Reportable segments are operating segments or aggregations of operating segments that meet specified criteria Operating segments are components of an entity about which separate financial information is available and such information is evaluated regularly by the chief operating decision maker in deciding how to allocate resources and in assessing performance Generally segment information is required to be reported on the same basis as is used internally for evaluating operating segment performance and deciding how to allocate resources to operating segments
(1)Description of reportable segments
The Grouprsquos reportable segments are those for which separate financial information is available and regular evaluation by the Companyrsquos management is being performed in order to decide how resources are allocated among the Group
The Group has operational headquarters by each product or service Each of the operational headquarters develops comprehensive strategies and engages in business activities relating to each product and service Accordingly the Group is comprised of segments organized by products or services based on the operational headquarters and there are four reportable segments ldquoRailway Rolling Stockrdquo ldquoTransportation Equipment and Steel Structurerdquo ldquoConstruction Equipmentrdquo and ldquoEngineeringrdquo
37
ldquoRailway Rolling Stockrdquo consists of manufacture and sales of rolling stock such as EMUs and railway motor cars
ldquoTransportation Equipment and Steel Structurerdquo consists of manufacture and sales of transportation equipment such as freight cars tank trucks heavy-duty industrial vehicles and manufacture and construction of roadway and railway bridges
ldquoConstruction Equipmentrdquo consists of manufacture and sales of pile driving rigs crawler cranes casing rotators portable diesel generator sets and emergency generators
ldquoEngineeringrdquo consists of manufacture and sales of railway rolling stock inspectionmaintenance systems agricultural plants and pulp and paper plants
(2)Method of measurement for the amount of sales profit (loss) assets and other items for each reportable segment
The accounting policies of each reportable segment are consistent with those disclosed in Note 2 ldquoSummary of Significant Accounting Policiesrdquo Reporting segment profit represents operating income Intersegment transactions are based upon armrsquos-length transactions
(3)Information of sales profit (loss) assets and other items was as follows
Millions of Yen2019
Reportable segmentRailway Rolling Stock
Transportation Equipment and Steel Structure
Construction Equipment Engineering Other Total Reconciliations Consolidated
Net salesSales to external customers yen 38049 yen 21794 yen 25167 yen 6006 yen 163 yen 91179 - yen 91179Intersegment sales or transfers 129 187 13 67 185 581 yen (581) -
Total yen 38178 yen 21981 yen 25180 yen 6073 yen 348 yen 91760 yen (581) yen 91179
Segment profit (loss) yen 2034 yen 2040 yen 4887 yen 386 yen (27) yen 9320 yen (820) yen 8500Segment assets yen 47448 yen 22556 yen 22978 yen 2906 yen 645 yen 96533 yen 37661 yen 134194Other
Depreciation yen 1046 yen 276 yen 779 yen 15 yen 2 yen 2118 yen 252 yen 2370Increase in property plant and
equipment and intangible assets 1010 937 740 22 2 2711 160 2871
Millions of Yen2018
Reportable segmentRailway Rolling Stock
Transportation Equipment and Steel Structure
Construction Equipment Engineering Other Total Reconciliations Consolidated
Net salesSales to external customers yen 41455 yen 22475 yen 24573 yen 6560 yen 248 yen 95311 - yen 95311Intersegment sales or transfers 261 331 10 23 192 817 yen (817) -
Total yen 41716 yen 22806 yen 24583 yen 6583 yen 440 yen 96128 yen (817) yen 95311
Segment profit (loss) yen 1413 yen 1991 yen 5270 yen (75) yen (93) yen 8506 yen (1240) yen 7266Segment assets yen 46176 yen 19734 yen 22724 yen 4684 yen 669 yen 93987 yen 33426 yen 127413Other
Depreciation yen 1340 yen 319 yen 760 yen 14 yen 2 yen 2435 yen 293 yen 2728Increase in property plant and
equipment and intangible assets 563 143 962 5 0 1673 107 1780
38
Thousands of US Dollars2019
Reportable segmentRailway Rolling Stock
Transportation Equipment and Steel Structure
Construction Equipment Engineering Other Total Reconciliations Consolidated
Net salesSales to external customers $ 345904 $ 198128 $ 228791 $ 54601 $ 1480 $ 828904 - $ 828904Intersegment sales or transfers 1169 1696 122 608 1682 5277 $ (5277) -
Total $ 347073 $ 199824 $ 228913 $ 55209 $ 3162 $ 834181 $ (5277) $ 828904
Segment profit (loss) $ 18494 $ 18548 $ 44423 $ 3512 $ (248) $ 84729 $ (7459) $ 77270Segment assets $ 431340 $ 205056 $ 208891 $ 26422 $ 5859 $ 877568 $ 342384 $ 1219952Other
Depreciation $ 9513 $ 2515 $ 7080 $ 133 $ 14 $ 19255 $ 2294 $ 21549Increase in property plant and
equipment and intangible assets 9186 8514 6725 202 15 24642 1461 26103
Notes 1 ldquoOtherrdquo represents businesses that are not included in any reportable segment which includes manufacture and sales of laser processing system sales of railroad-related merchandise and real estate rental
2 ldquoReconciliationsrdquo in segment profit (loss) include corporate expenses of yen(854) million ($(7766) thousand) and yen(1294) million for the years ended March 31 2019 and 2018 respectively elimination of intersegment transactions of yen27 million ($246 thousand) and yen42 million for the years ended March 31 2019 and 2018 Corporate expenses principally consist of general and administrative expenses that are not attributable to any reportable segment
3 ldquoReconciliationsrdquo in segment assets include total corporate assets of yen32158 million ($292350 thousand) and yen29889 million elimination of intersegment balances of yen(116) million ($(1051) thousand) and yen(136) million and adjustments in inventories of yen(61) million ($(556) thousand) and yen(68) million as of March 31 2019 and 2018 respectively Total corporate assets principally consist of investment securities and general management properties as of March 31 2019 and 2018
4 Segment profit (loss) is reconciled to operating income in the consolidated statement of operations
Associated Information
(1) Information about products and services is not disclosed since similar information is disclosed above
(2) Information about geographical areas for the year ended March 31 2019 was as follows
Millions of Yen2019
Japan USA Asia Other TotalNet sales yen 81477 yen 156 yen 9503 yen 43 yen 91179
Note Sales are based on the location of the customers and grouped by country or area
Information about net sales by geographical areas for the year ended March 31 2018 is not disclosed since net sales to external customers in Japan exceeds 90 of consolidated net sales
Millions of Yen2019
Japan USA Asia Other TotalProperty plant and equipment yen 24784 yen 3630 yen 0 yen 0 yen 28414
39
Millions of Yen2018
Japan USA Asia Other TotalProperty plant and equipment yen 24306 yen 4258 yen 0 yen 0 yen 28564
Thousands of US Dollars2019
Japan USA Asia Other TotalProperty plant and equipment $ 225304 $ 33001 $ 1 $ 0 $ 258306
(3) Information about major customers Net sales
Millions of Yen Thousands of US Dollars
Relatedsegment
Name of major customer 2019 2018 2019
CJR yen 19955 yen 24001 $ 181413Railway Rolling Stock
Transportation Equipment and Steel Structure
(4) Information about loss on impairment of property plant and equipment by reportable segment
Millions of Yen2019
Reportable segmentRailwayRolling Stock
TransportationEquipment andSteel Structure
ConstructionEquipment
Engineer-ing Other Total
Recon-ciliations
Consoli-dated
Impairment loss yen 238 - - - - yen 238 32 yen 270
Millions of Yen2018
Reportable segmentRailwayRolling Stock
TransportationEquipment andSteel Structure
ConstructionEquipment
Engineer-ing Other Total
Recon-ciliations
Consoli-dated
Impairment loss yen - - - - - yen - 34 yen 34
Thousands of US Dollars2019
Reportable segmentRailwayRolling Stock
TransportationEquipment andSteel Structure
ConstructionEquipment
Engineer-ing Other Total
Recon-ciliations
Consoli-dated
Impairment loss $ 2168 - - - - $ 2168 288 $ 2456
Note The amount of ldquoReconciliationsrdquo is related to idle assets which are not attributable to any reporting segment
40
Corporate Profile
Line of Business
Overview of the Main SegmentsNIPPON SHARYO manufactures and sells the following products
Business segment Lines of business
Railway rolling stock EMUs DMUs Passenger Cars Linear Motor Cars Track Maintenance Machines Rolling Stock Components and Automated Guideway Transit Systems
Transportation equipment and Steel structure
Freight Cars Locomotives Tank Trucks Tank Trailers Storage Tanks Heavy-duty Industrial Vehicles Containers Automated Guided Vehicles Roadway Bridges Railway Bridges Water Gates
Construction equipmentPile Driving Rigs Crawler Cranes Hydraulic Hammers Casing Rotators Other Products Related to Foundation Work Portable Diesel Generator Sets Emergency Generators Various Products Related to Electric Machines
Engineering Agricultural Plants Grain Complex Seed Processing Plants Railway Rolling Stock InspectionMaintenance System Pulp and Paper Plants
OFFICE
PLANT
Company Name NIPPON SHARYO LTD
Capital Stock
Common StockAuthorized 32800000 shares
Common StockIssued 14675012 shares
Number of Shareholders 12509 persons
(March 31 2019)
Company History
Sep 1896 Established in Nagoya CityJun 1938 Founded Narumi PlantMay 1949 Re-listed on Tokyo Stock ExchangeJan 1959 Began Construction Machinery BusinessOct 1961 Started Bridge ManufacturingJul 1964 Founded Toyokawa PlantJun 1975 Founded Kinuura PlantSep 1996 100th AnniversaryAug 2008 Equity and business tie-up entered into with Central Japan Railway CompanyAug 2019 Manufactured 4000th Shinkansen EMU
HEAD OFFICE (NAGOYA)
1-1 Sanbonmatsu-choAtsuta-ku Nagoya 456-8691 JAPANPhone +81-52-882-3316Fax +81-52-882-3781
TOKYO OFFICE OSAKA BRANCH
14th FLNorth Gate Building3-1-3 UmedaKita-ku Osaka 530-0001 JAPANPhone +81-6-6341-4455Fax +81-6-6341-4487
12th Fl Marunouchi Central Bldg1-9-1 MarunouchiChiyoda-ku Tokyo 100-0005 JAPANPhone +81-3-6688-6808Fax +81-3-6688-6813
TOYOKAWA PLANT
2-20 HonoharaToyokawa Aichi-pref 442-8502 JAPANPhone +81-533-85-4900Fax +81-533-85-4123
(Railway rolling stock amp other transportation equipment)NARUMI PLANT
80 Ryucho Narumi-choMidori-ku Nagoya 458-8502 JAPANPhone +81-52-623-3529Fax +81-52-623-4349
(Construction equipment)KINUURA PLANT
20 11-gouchiHanda Aichi 475-0831 JAPAN
(Steel structure)
NIPPON SHARYO USA INC
2340 S Arlington Heights Road Suite 605 Arlington Heights IL 60005 USAAttn NIPPON SHARYO ENGINEERING amp MARKETING LLCPhone +1-847-228-2700Fax +1-847-228-5530
Corporate Information
Directory
41
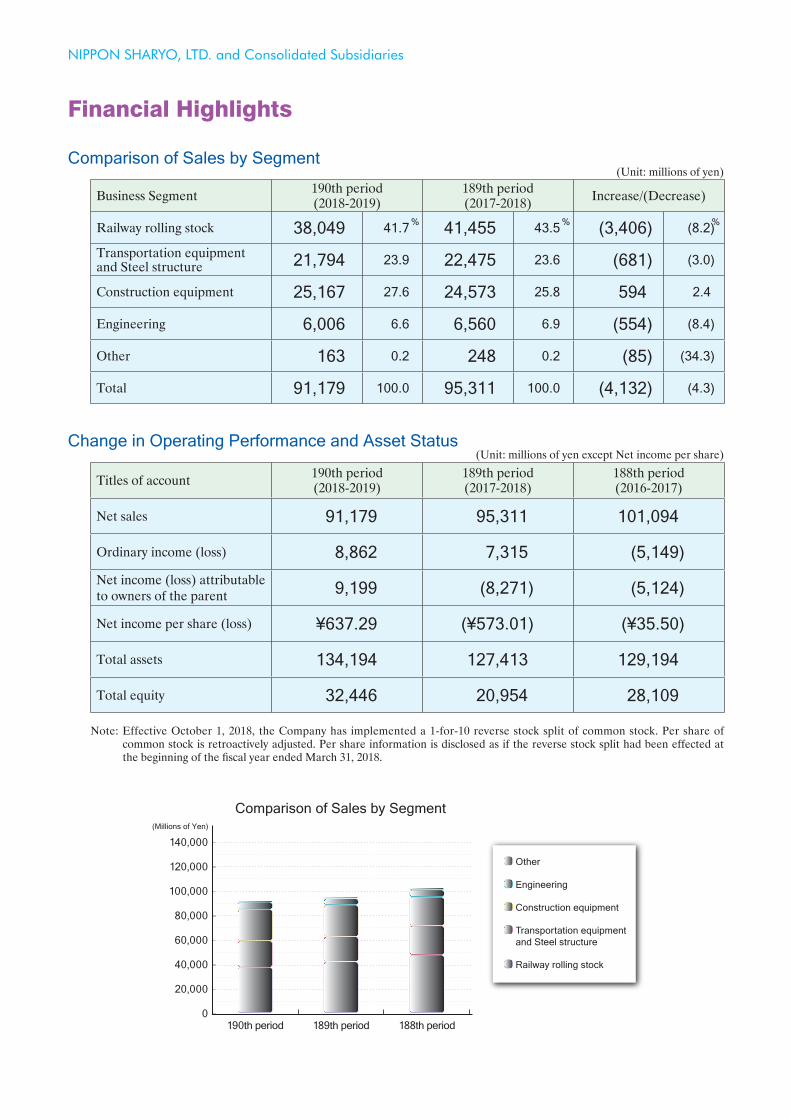
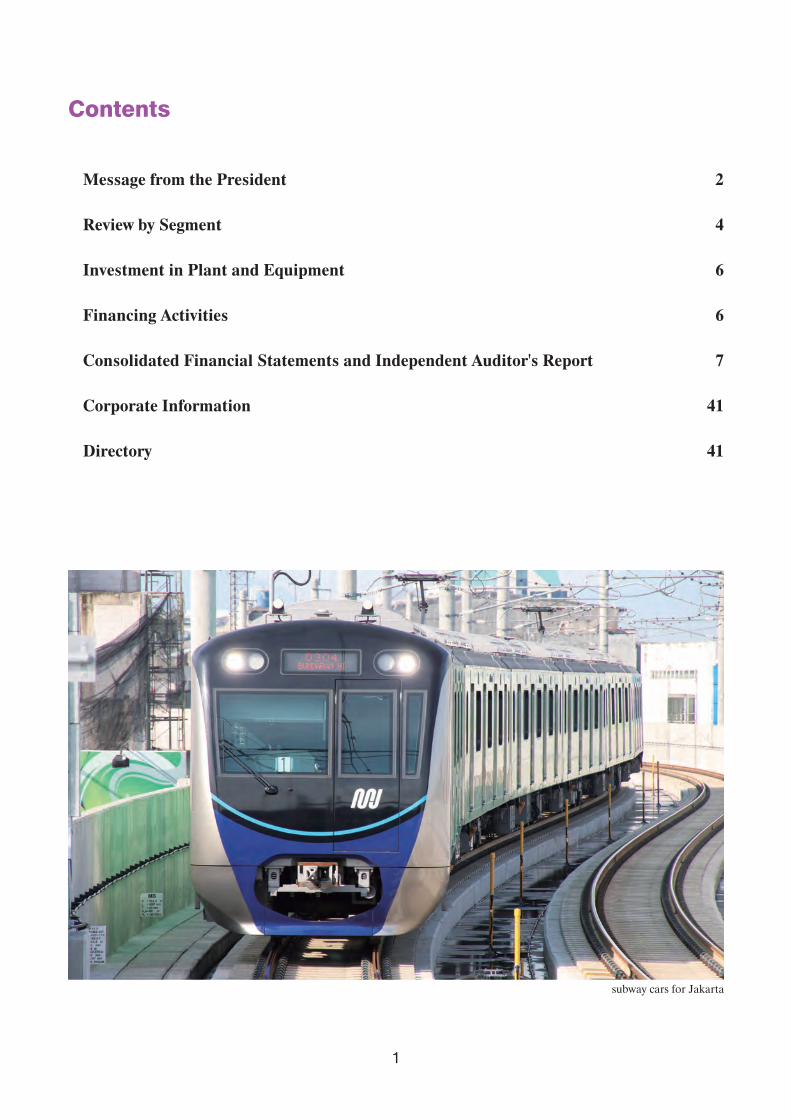
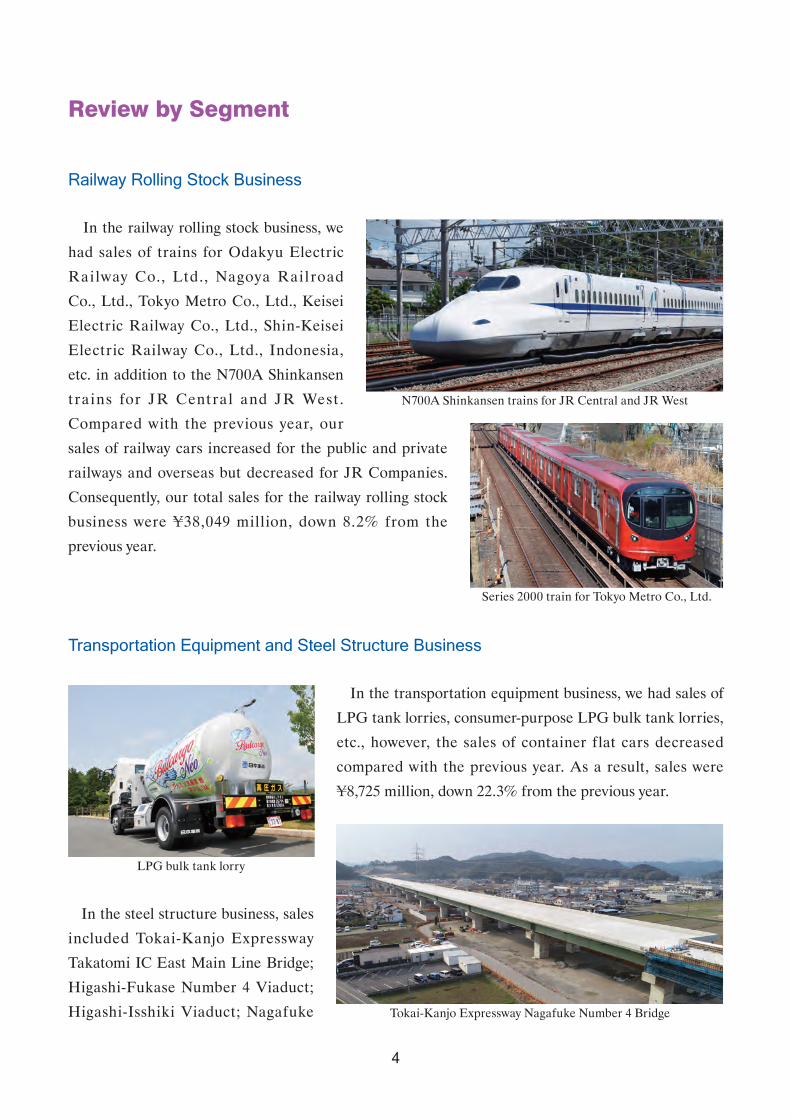
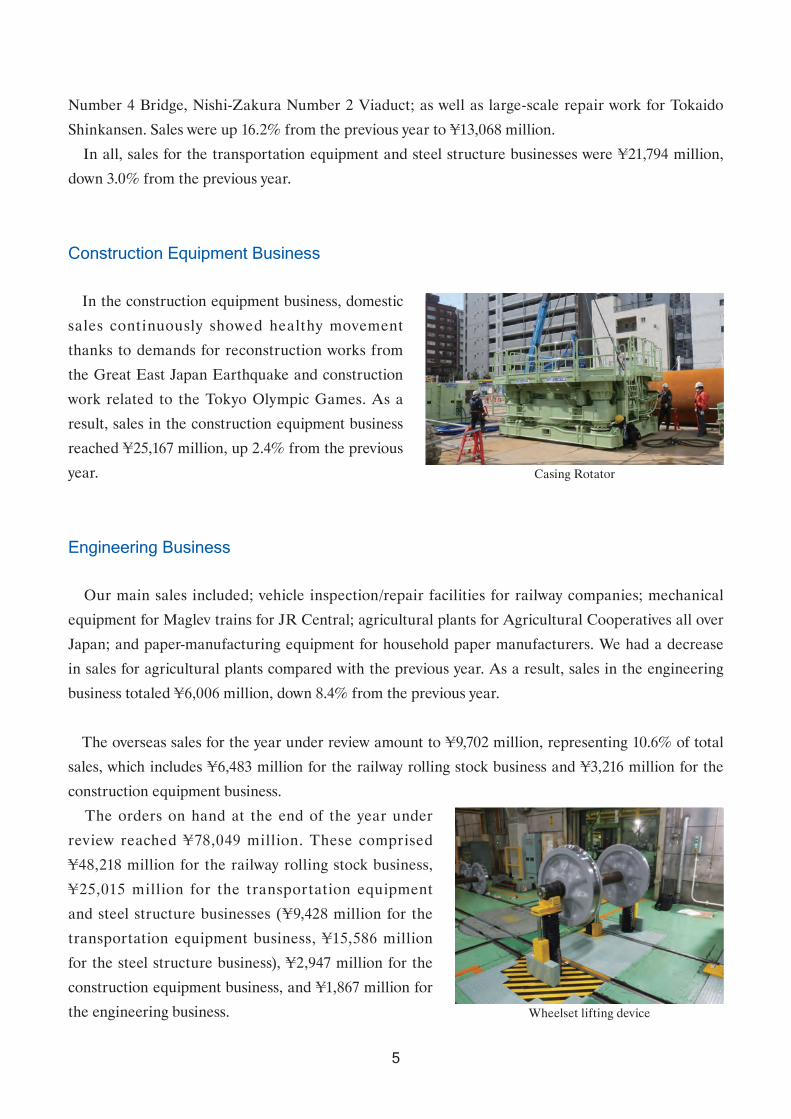
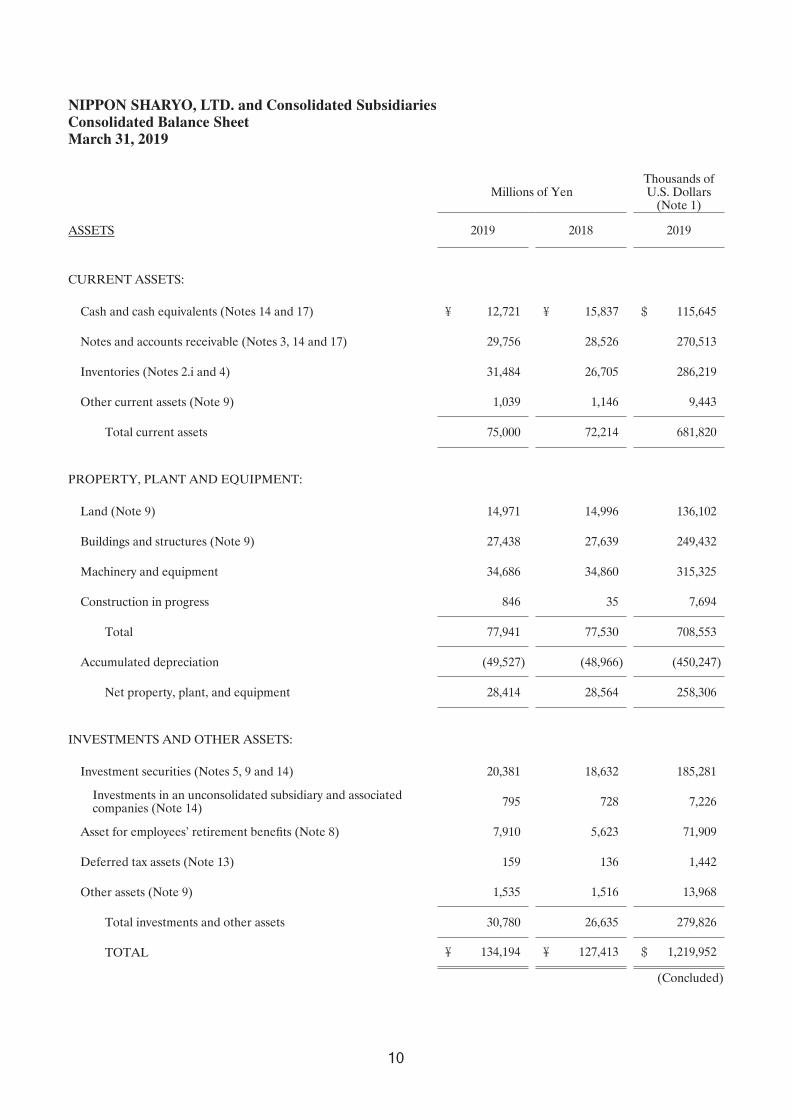
Millions of YenThousands of US Dollars
(Note 1)
ASSETS 2019 2018 2019
CURRENT ASSETS
Cash and cash equivalents (Notes 14 and 17) yen 12721 yen 15837 $ 115645
Notes and accounts receivable (Notes 3 14 and 17) 29756 28526 270513
Inventories (Notes 2i and 4) 31484 26705 286219
Other current assets (Note 9) 1039 1146 9443
Total current assets 75000 72214 681820
PROPERTY PLANT AND EQUIPMENT
Land (Note 9) 14971 14996 136102
Buildings and structures (Note 9) 27438 27639 249432
Machinery and equipment 34686 34860 315325
Construction in progress 846 35 7694
Total 77941 77530 708553
Accumulated depreciation (49527) (48966) (450247)
Net property plant and equipment 28414 28564 258306
INVESTMENTS AND OTHER ASSETS
Investment securities (Notes 5 9 and 14) 20381 18632 185281
Investments in an unconsolidated subsidiary and associated companies (Note 14) 795 728 7226
Asset for employeesrsquo retirement benefits (Note 8) 7910 5623 71909
Deferred tax assets (Note 13) 159 136 1442
Other assets (Note 9) 1535 1516 13968
Total investments and other assets 30780 26635 279826
TOTAL yen 134194 yen 127413 $ 1219952
(Concluded)
NIPPON SHARYO LTD and Consolidated SubsidiariesConsolidated Balance SheetMarch 31 2019
10
Millions of YenThousands of US Dollars
(Note 1)LIABILITIES AND EQUITY 2019 2018 2019
CURRENT LIABILITIES
Current portion of long-term debt (Notes 7 14 and 17) yen 296 yen 287 $ 2688
Current portion of lease obligations (Notes 11 and 14) 678 748 6168
Notes and accounts payable (Notes 6 and 14) 22912 24845 208287
Accrued expenses (Note 17) 5422 5003 49291
Advances received 4281 3467 38915
Income taxes payable (Note 14) 538 132 4888
Allowance for work in process on construction contracts 176 36 1600
Provision for loss on orders received (Note 2n) 1837 6128 16702
Other current liabilities 1158 1408 10531
Total current liabilities 37298 42054 339070
LONG-TERM LIABILITIES
Long-term debt (Notes 7 9 14 and 17) 55219 55400 501996
Liability for employeesrsquo retirement benefits (Note 8) 292 273 2656
Lease obligations (Notes 11 and 14) 1650 1725 14996
Allowance for PCB disposal expenses 203 457 1845
Provision for compensation for health damage from asbestos 87 99 791
Deferred tax liabilities (Note 13) 6048 6233 54980
Other long-term liabilities 951 218 8648
Total long-term liabilities 64450 64405 585912
COMMITMENTS AND
CONTINGENT LIABILITIES (Notes 10 and 15)
EQUITY (Note 12)
Common stock
authorized 32800000 and 328000000 shares
issued 14675012 and 146750129 shares in 2019 and 2018 respectively 11811 11811 107370
Capital surplus - 12045 -
Retained earnings 9585 (11659) 87141
Treasury stock at cost 241136 shares in 2019
and 2406621 shares in 2018 (517) (516) (4703)
Accumulated other comprehensive income
Unrealized gain on available-for-sale securities 8919 7708 81082
Deferred loss on derivatives under hedge accounting - (8) -
Foreign currency translation adjustments (2224) (2191) (20215)
Defined retirement benefit plans 4754 3661 43216
Total accumulated other comprehensive income 11449 9170 104083
Noncontrolling interests 118 103 1079
Total equity 32446 20954 294970
TOTAL yen 134194 yen 127413 $ 1219952
(Concluded)Note Effective October 1 2018 the Company has implemented a 1-for-10 reverse stock split of common stock The numbers of authorized or issued shares are not retroactively adjusted See notes to consolidated financial statements
NIPPON SHARYO LTD and Consolidated SubsidiariesConsolidated Balance SheetMarch 31 2019
11
NIPPON SHARYO LTD and Consolidated SubsidiariesConsolidated Statement of OperationsYear Ended March 31 2019
Millions of YenThousands of US Dollars
(Note 1)
2019 2018 2019
NET SALES (Note 17) yen 91179 yen 95311 $ 828904
COST OF SALES (Notes 2i 2m and 2u) 75816 80897 689240
Gross profit 15363 14414 139664
SELLING GENERAL AND ADMINISTRATIVE EXPENSES (Note 2u) 6863 7148 62394
Operating income 8500 7266 77270
OTHER INCOME (EXPENSES)
Interest and dividend income (Note 17) 344 311 3128
Interest expense (Note 17) (344) (212) (3130)
Equity in earnings of associated companies 82 81 742
Gain on sales of investment securities net (Note 5) 3 54 31
Loss on impairment of property plant and equipment (Note 16) (270) (34) (2456)
(Loss) gain on sales and disposals of property plant and equipment net (52) 8950 (470)
Loss on early repayment of long-term debt - (1077) -
Loss on payment for settlement - (26445) -
Other ndash net 284 (134) 2584
Other income (expenses) ndash net 47 (18506) 429
INCOME (LOSS) BEFORE INCOME TAXES 8547 (11240) 77699
INCOME TAXES (Note 13)
Current 543 105 4939
Deferred (1216) (3089) (11057)
Total income taxes (673) (2984) (6118)
NET INCOME (LOSS) 9220 (8256) 83817
NET INCOME ATTRIBUTABLE TO NONCONTROLLING INTERESTS 21 15 193
NET INCOME (LOSS) ATTRIBUTABLE TO OWNERS OF THE PARENT yen 9199 yen (8271) $ 83624
Yen US Dollars
PER SHARE OF COMMON STOCK (Note 2v)
Basic net income (loss) yen 63729 yen (57301) $ 579
Cash dividends applicable to the year - - -
Note Effective October 1 2018 the Company has implemented a 1-for-10 reverse stock split of common stock Per share of common stock is retroactively adjusted Per share information is disclosed as if the reverse stock split had been effected at the beginning of the fiscal year ended March 31 2018
See notes to consolidated financial statements
12
NIPPON SHARYO LTD and Consolidated SubsidiariesConsolidated Statement of Comprehensive IncomeYear Ended March 31 2019
Millions of YenThousands of US Dollars
(Note 1)
2019 2018 2019
NET INCOME (LOSS) yen 9220 yen (8256) $ 83817
OTHER COMPREHENSIVE INCOME (Note 18)
Unrealized gain on available-for-sale securities 1220 777 11090
Deferred gain (loss) on derivatives under hedge accounting 8 (5) 69
Foreign currency translation adjustments (33) (105) (301)
Defined retirement benefit plans 1093 668 9938
Share of other comprehensive (loss) income in associated companies (9) 36 (81)
Total other comprehensive income 2279 1371 20715
COMPREHENSIVE INCOME (LOSS) yen 11499 yen (6885) $ 104532
TOTAL COMPREHENSIVE INCOME (LOSS) ATTRIBUTABLE TO
Owners of the parent yen 11478 yen (6900) $ 104339
Noncontrolling interests 21 15 193
See notes to consolidated financial statements
13
NIPPON SHARYO LTD and Consolidated SubsidiariesConsolidated Statement of Changes in EquityYear Ended March 31 2019
Millions of Yen
Number of shares of
common stock outstanding
Commonstock
Capitalsurplus
Retainedearnings
Treasurystock
BALANCE APRIL 1 2017 144347475 yen 11811 yen 12045 yen (3157) yen (515)
Net loss attributable to owners of the parent - - - (8271) -
Increase in treasury stock net (3967) - 0 - (1)
Change of scope of equity method - - - (231) -
Net changes in the year - - - - -
BALANCE MARCH 31 2018 144343508 11811 12045 (11659) (516)
Disposition of deficit - - (12045) 12045 -
Net income attributable to owners of the parent - - - 9199 -
Increase in treasury stock net (475) - 0 - (1)
Transfer to capital surplus from retained earnings - - 0 (0) -
Net changes in the year (129909157) - - - -
BALANCE MARCH 31 2019 14433876 yen 11811 yen - yen 9585 yen (517)
Thousands of US Dollars (Note 1)
Commonstock
Capitalsurplus
Retainedearnings
Treasurystock
BALANCE MARCH 31 2018 $ 107370 $ 109511 $ (105994) $ (4691)
Disposition of deficit - (109511) 109511 -
Net income attributable to owners of the parent - - 83624 -
Increase in treasury stock net - 0 - (12)
Transfer to capital surplus from retained earnings - 0 (0) -
Net changes in the year - - - -
BALANCE MARCH 31 2019 $ 107370 $ - $ 87141 $ (4703)
Effective October 1 2018 the Company has implemented a 1-for-10 reverse stock split of common stock The number of shares of common stock outstanding is not retroactively adjusted
See notes to consolidated financial statements
14
Millions of Yen
Accumulated other comprehensive income
Unrealized gain on available-for-
sale securities
Deferred loss on derivatives under hedge accounting
Foreign currency
translation adjustments
Defined retirement
benefit plans
Total accumulated
other comprehensive
income
Noncontrollinginterests
Totalequity
yen 6905 yen 5 yen (2068) yen 2993 yen 7835 yen 90 yen 28109
- - - - - - (8271)
- - - - - - (1)
- 5 (42) - (37) - (268)
803 (18) (81) 668 1372 13 1385
7708 (8) (2191) 3661 9170 103 20954
- - - - - - -
- - - - - - 9199
- - - - - - (1)
- - - - - - -
1211 8 (33) 1093 2279 15 2294
yen 8919 yen - yen (2224) yen 4754 yen 11449 yen 118 yen 32446
Thousands of US Dollars (Note 1)
Accumulated other comprehensive income
Unrealized gain on available-for-
sale securities
Deferred gain (loss) on
derivatives under hedge accounting
Foreign currency
translation adjustments
Defined retirement
benefit plans
Total accumulated
other comprehensive
income
Noncontrollinginterests
Totalequity
$ 70073 $ (69) $ (19914) $ 33277 $ 83367 $ 932 $ 190495
- - - - - - -
- - - - - - 83624
- - - - - - (12)
- - - - - - -
11009 69 (301) 9939 20716 147 20863
$ 81082 $ - $ (20215) $ 43216 $ 104083 $ 1079 $ 294970
15
Millions of Yen Thousands of US Dollars(Note 1)
2019 2018 2019
OPERATING ACTIVITIES
Income (loss) before income taxes yen 8547 yen (11240) $ 77699
Adjustments for
Income taxes-paid (5) (750) (42)
Loss on early repayment of long-term debt - 1077 -
Loss on payment for settlement - 26445 -
Depreciation 2370 2728 21549
Loss on impairment of property plant and equipment 270 34 2456
Loss (gain) on sales and disposals of property plant and equipment 21 (9067) 195
Gain on sales of investment securities (3) (54) (31)
Changes in assets and liabilities
(Increase) decrease in trade notes and accounts receivable (1029) 3367 (9352)
(Increase) decrease in inventories (4792) 3248 (43561)
(Decrease) increase in trade notes and accounts payable (2053) 1146 (18661)
Increase (decrease) in allowance for work in process on construction contracts 140 (394) 1272
Decrease in provision for loss on orders received (4248) (10159) (38616)
(Decrease) increase in provision for compensation for health damage from asbestos (12) 7 (109)
Increase (decrease) in advances received 814 (1208) 7401
Increase in liability for employeesrsquo retirement benefits 20 14 178
Other-net (1376) (4308) (12529)
Sub-total (1336) 886 (12151)
Payments for loss on early repayment of long-term debt - (1077) -
Settlement paid - (37001) -
Net cash used in operating activities (1336) (37192) (12151)
INVESTING ACTIVITIES
Purchases of property plant and equipment (1235) (1001) (11224)
Proceeds from sales of property plant and equipment 46 12827 417
Purchases of investment securities (3) (3) (31)
Proceeds from sales of investment securities 11 100 99
Other-net (66) (130) (593)
Net cash(used in)provided by investing activities (1247) 11793 (11332)
FINANCING ACTIVITIES
Net decrease in short-term borrowings - (1595) -
Proceeds from long-term debt 118 56000 1072
Repayments of long-term debt (289) (24487) (2631)
Dividends paid (0) (3) (1)
Other-net (303) (84) (2746)
Net cash (used in) provided by financing activities (474) 29831 (4306)
FOREIGN CURRENCY TRANSLATION ADJUSTMENTS ON CASH AND CASH EQUIVALENTS (59) (308) (542)
NET (DECREASE) INCREASE IN CASH AND CASH EQUIVALENTS (3116) 4124 (28331)
CASH AND CASH EQUIVALENTS BEGINNING OF YEAR 15837 11713 143976
CASH AND CASH EQUIVALENTS END OF YEAR yen 12721 yen 15837 $ 115645
(Concluded)See notes to consolidated financial statements
NIPPON SHARYO LTD and Consolidated SubsidiariesConsolidated Statement of Cash Flows Year Ended March 31 2019
16
NIPPON SHARYO LTD and Consolidated SubsidiariesNotes to Consolidated Financial StatementsYear Ended March 31 2019
the equity method of accounting had been applied to the
investments in these companies the effect on the accompanying
consolidated financial statements would not be material
All significant intercompany balances and transactions have
been eliminated in consolidation All material unrealized profit
included in assets resulting from transactions within the Group
is also eliminated
The number of the consolidated subsidiaries unconsolidated
subsidiary and associated companies for the years ended March
31 2019 and 2018 was as follows
2019 2018Consolidated subsidiaries 6 6Unconsolidated subsidiary stated at cost 1 1Associated companies accounted for by the equity method 2 2Associated company stated at cost 1 1
The fiscal year-end of NIPPON SHARYO USA INC and its
subsidiaries NIPPON SHARYO MANUFACTURING LLC
and NIPPON SHARYO ENGINEERING amp MARKETING
LLC is December 31 and their financial statements with the
closest closing date prior to that of the Company are used for
consolidation purposes Necessary adjustments for significant
transactions from January 1 to March 31 are made for
consolidation purposes
For the equity method associated companies that have a
different fiscal year from that of the Company the associated
companiesrsquo financial statements with the closest closing date
prior to that of the Company are used for consolidation
purposes
b Unification of accounting policies applied to foreign subsidiaries
for the consolidated financial statements
Under Accounting Standards Board of Japan (ldquoASBJrdquo)
Practical Issues Task Force (ldquoPITFrdquo) No 18 ldquoPractical
Solution on Unification of Accounting Policies Applied
to Foreign Subsidiaries for the Consolidated Financial
Statementsrdquo the accounting policies and procedures applied to
a parent company and its subsidiaries for similar transactions
and events under similar circumstances should in principle
be unified for the preparation of the consolidated financial
statements However financial statements prepared by foreign
subsidiaries in accordance with either IFRS or generally
accepted accounting principles in the United States of America
1 BASIS OF PR ESENTATION OF CONSOLIDATED
FINANCIAL STATEMENTS
The accompanying consolidated financial statements have
been prepared in accordance with the provisions set forth in
the Japanese Financial Instruments and Exchange Act and
its related accounting regulations and in accordance with
accounting principles generally accepted in Japan (ldquoJapanese
GAAPrdquo) which are different in certain respects as to the
application and disclosure requirements of International
Financial Reporting Standards (IFRS)
In preparing these consolidated financial statements certain
reclassifications and rearrangements have been made to the
consolidated financial statements issued domestically in order
to present them in a form which is more familiar to readers
outside Japan In addition certain reclassifications have been
made in the 2018 consolidated financial statements to conform
to the classifications used in 2019
The consolidated financial statements are stated in Japanese
yen the currency of the country in which NIPPON SHARYO
LTD (the ldquoCompanyrdquo) is incorporated and operates The
translations of Japanese yen amounts into US dollar amounts
are included solely for the convenience of readers outside Japan
and have been made at the rate of yen110 to $1 the approximate
rate of exchange at March 31 2019 Such translations should not
be construed as representations that the Japanese yen amounts
could be converted into US dollars at that or any other rate
2 SUMMARY OF SIGNIFICANT ACCOUNTING POLICIES
a Consolidation
The consolidated financial statements as of March 31 2019
include the accounts of the Company and its significant
subsidiaries (together the ldquoGrouprdquo) Under the control and
influence concepts those companies in which the Company
directly or indirectly is able to exercise control over operations
are fully consolidated and those companies over which the
Group has the ability to exercise significant influence are
accounted for by the equity method
Investment in associated companies are accounted for by the
equity method Investments in the remaining unconsolidated
subsidiary and associated company are stated at cost If
17
(Financial Accounting Standards Board Accounting Standards
CodificationmdashldquoFASB ASCrdquo) tentatively may be used for the
consolidation process except for the following items that
should be adjusted in the consolidation process so that net
income is accounted for in accordance with Japanese GAAP
unless they are not material (a) amortization of goodwill (b)
scheduled amortization of actuarial gain or loss of pensions
that has been recorded in equity through other comprehensive
income (c) expensing capitalized development costs of research
and development (RampD) and (d) cancellation of the fair value
model of accounting for property plant and equipment and
investment properties and incorporation of the cost model
accounting
c Unification of accounting policies applied to associated
companies for the equity method
ASBJ Statement No 16 ldquoAccounting Standard for Equity
Method of Accounting for Investmentsrdquo requires adjustments
to be made to conform the associatersquos accounting policies for
similar transactions and events under similar circumstances
to those of the parent company when the associatersquos financial
statements are used in applying the equity method unless it is
impracticable to determine adjustments
d Business combinations
Business combinations are accounted for using the purchase
method Acquisition-related costs such as advisory fees or
professional fees are accounted for as expenses in the periods
in which the costs are incurred If the initial accounting for a
business combination is incomplete by the end of the reporting
period in which the business combination occurs an acquirer
shall report in its financial statements provisional amounts for
the items for which the accounting is incomplete During the
measurement period which shall not exceed one year from
the acquisition the acquirer shall retrospectively adjust the
provisional amounts recognized at the acquisition date to reflect
new information obtained about facts and circumstances that
existed as of the acquisition date and that would have affected
the measurement of the amounts recognized as of that date
Such adjustments shall be recognized as if the accounting for
the business combination had been completed at the acquisition
date A parentrsquos ownership interest in a subsidiary might
change if the parent purchases or sells ownership interests in its
subsidiary The carrying amount of noncontrolling interest is
adjusted to reflect the change in the parentrsquos ownership interest
in its subsidiary while the parent retains its controlling interest
in its subsidiary Any difference between the fair value of the
consideration received or paid and the amount by which the
noncontrolling interest is adjusted is accounted for as capital
surplus as long as the parent retains control over its subsidiary
e Cash equivalents
Cash equivalents are short-term investments that are readily
convertible into cash and exposed to insignificant risk of
changes in value
Cash equivalents include time deposits and Cash Management
System (ldquoCMSrdquo) funds due from Central Japan Railway
Company (ldquoCJRrdquo) group all of which mature or become due
within three months from the date of acquisition CJR is the
parent company of the Company
f Investment securities
Investment securities are classif ied and accounted for
depending on managementrsquos intent as follows
Available-for-sale securities are reported at fair value with
unrealized gains and losses net of applicable taxes reported in
a separate component of equity
Nonmarketable available-for-sale securities are stated at cost
determined by the moving-average method For other-than-
temporary declines in fair value investment securities are
reduced to net realizable value by a charge to income
g Derivatives and hedging activities
The Group uses derivative financial instruments to manage its
exposures to fluctuations in foreign exchange and interest rates
Forward foreign currency contracts are utilized by the Group
to reduce foreign currency exchange risks The Group does not
enter into derivatives for trading or speculative purposes
Derivative f inancial instruments and foreign currency
transactions are classified and accounted for as follows 1)
all derivatives are recognized as either assets or liabilities
and measured at fair value and gains and losses on derivative
transactions are recognized in the consolidated statement of
operations and 2) for derivatives used for hedging purposes if
such derivatives qualify for hedge accounting because of high
correlation and effectiveness between the hedging instruments
and the hedged items gains and losses on derivatives are
deferred until maturity of the hedged transactions
The forward foreign currency contracts are utilized to hedge
foreign currency exposures in sales of merchandise and
finished goods to overseas customers and procurement of
raw materials from overseas suppliers Trade receivables and
payables denominated in foreign currencies are translated at
the contracted rates if the forward contracts qualify for hedge
accounting
18
h Allowance for doubtful accounts
An allowance for doubtful accounts is provided for at the
aggregate amount of estimated credit loss based on an
individual analysis of certain doubtful or troubled receivables
and a general reserve for other receivables is calculated based
on the historical loss experience
i Inventories
Inventories are stated at the lower of cost determined
pr inc ipa l ly by the spec i f ic ident i f icat ion method for
merchandise finished goods and work in process and by the
moving-average method for semi-finished goods raw materials
and supplies or net selling value which is defined as the selling
price less additional estimated manufacturing costs and
estimated direct selling expenses The replacement cost may be
used in place of the net selling value if appropriate Reversal of
write-downs of inventories in the amounts of yen(1157) million
($(10521) thousand) and yen(10135) million for the years ended
March 31 2019 and 2018 respectively were included in cost of
sales
j Property plant and equipment
Property plant and equipment including significant renewals
and additions are stated at cost and are depreciated principally
by the straight-l ine method for bui ldings and bui lding
improvements and structures acquired on or after April 1 2016
and by the declining-balance method for other property at rates
based on the estimated useful lives of the assets
Depreciation of leased assets relating to financial lease
transactions without transfer of ownership is computed by the
straight-line method over the leased period
The range of useful lives is principally from 10 to 60 years for
buildings and structures and from six to 17 years for machinery
and equipment
The Company has transferred its factory assets of Toyokawa
Plant Kinuura Plant and Narumi Plant to CJR on April 20
2017 The transfer was not treated as a buying and selling
transaction since the relevant factory assets were transferred to
CJR and the Company continues to utilize these factory assets
as before based on a lease agreement concluded between the
Company and CJR The relevant factory assets were therefore
still recorded under property plant and equipment of the
Company As the relevant transactions do not fall under a
finance lease transaction the total transfer price was recorded
as long-term debt (including the current portion) In addition
capital expenditure related to the transferred factory assets was
recorded under ldquobuildings and structuresrdquo and ldquomachinery and
equipmentrdquo and a part of the capital expenditure was recorded
as long-term debt (including the current portion) for the year
ended March 31 2019
As a result the relevant factory assets as of March 31 2019
were recorded under property plant and equipment in the
carrying amount of yen11975 million ($108867 thousand) as
land of yen3827 million ($34794 thousand) as buildings and
structures and yen7 million ($68 thousand) as machinery and
equipment while long-term debt (including the current portion)
was recorded in the carrying amount of yen20515 million
($186501 thousand) as of March 31 2019 As of March 31
2018 the relevant factory assets were recorded under property
plant and equipment in the carrying amount of yen11975 million
as land and of yen4022 million as buildings (net) while long-
term debt (including the current portion) was recorded in the
carrying amount of yen20687 million
k Long-lived assets
The Group reviews its long-lived assets for impairment
whenever events or changes in circumstance indicate that
the carrying amount of an asset or asset group may not be
recoverable An impairment loss is recognized if the carrying
amount of an asset or asset group exceeds the sum of the
undiscounted future cash f lows expected to result from
the continued use and eventual disposition of the asset or
asset group The impairment loss would be measured as the
amount by which the carrying amount of the asset exceeds its
recoverable amount which is the higher of the discounted cash
flows from the continued use and eventual disposition of the
asset or the net selling value at disposition
l Intangible assets
Intangible assets that are included in other assets are amortized
by the straight-line method Software costs are amortized over
five years
m Allowance for work in process on construction contracts
An allowance for work in process on construction contracts
is provided based on an estimate of the total loss in respect
to construction projects on which eventual losses are deemed
inevitable and the amounts of the loss can be reasonably
estimated Provisions and (reversal of provision) for work
in process on construction contracts in the amounts of yen140
million ($1272 thousand) and yen(394) million for the years
ended March 31 2019 and 2018 respectively were included in
cost of sales
n Provision for loss on orders received
A provision for loss on orders received except for construction
contracts is recorded based on an estimate of the total loss
in respect to contracts on which eventual losses are deemed
19
inevitable and the amounts of the loss can be reasonably
estimated
o Retirement and pension plans
The Company has a lump-sum retirement benefit plan a
defined contribution pension plan and a defined benefit pension
plan The Companyrsquos domestic consolidated subsidiaries have
similar retirement benefit plans
Liabilities for employeesrsquo retirement benefits are calculated
based on the projected benefit obligations and plan assets at
the consolidated balance sheet date The projected benefit
obligations are attributed to periods on a benefit formula basis
Prior service costs are amortized on a straight-line basis over
15 years which is within the average remaining service period
Actuarial gains and losses are amortized on a straight-line basis
mainly over 15 years which is within the average remaining
service period in the following the fiscal year
p Allowance for Polychlorinated Biphenyl (PCB) disposal expenses
An allowance for PCB disposal expenses has been provided
based on the published estimated disposal fee schedule issued
by the Japan Environmental Safety Corporation
q Provision for compensation for health damage from asbestos
A provision for compensation for health damage from asbestos
has been recorded based on the estimated compensation
amount for former employees who suffered health damage from
asbestos
r Income taxes
The provision for income taxes is computed based on the pretax
income included in the consolidated statement of operations
The asset and l iabi l it y approach is used to recognize
deferred tax assets and liabilities for the expected future tax
consequences of temporary differences between the carrying
amounts and the tax bases of assets and liabilities Deferred
taxes are measured by applying currently enacted tax rates to
the temporary differences
s Foreign currency transactions
All short-term and long-term monetary receivables and
payables denominated in foreign currencies are translated
into Japanese yen at the exchange rates at the consolidated
balance sheet date The foreign exchange gains and losses from
translation are recognized in the consolidated statement of
operations to the extent that they are not hedged by forward
exchange contracts
t Foreign currency financial statements
The balance sheet accounts of the consolidated foreign
subsidiaries are translated into Japanese yen at the current
exchange rate as of the consolidated balance sheet date except
for equity which is translated at the historical rate Revenue
and expense accounts of consolidated foreign subsidiaries
are translated into yen at the average exchange rate
Differences arising from such translation are shown as foreign
currency translation adjustments under accumulated other
comprehensive income in a separate component of equity
u RampD expenses
Expenses related to RampD activities are charged to income as
incurred RampD expenses amounted to yen1344 million ($12214
thousand) and yen1261 million for the years ended March
31 2019 and 2018 respectively and are included in general
and administrative expenses and manufacturing costs in the
accompanying consolidated statement of operations
v Per share information
Basic net income (loss) per share is computed by dividing
net income (loss) attributable to common shareholders by
the weighted-average number of shares of common stock
outstanding during the respective year Weighted-average
number of shares of common stock for the years ended March
31 2019 and 2018 were 14434 thousand shares Diluted net
income (loss) per share for the years ended March 31 2019
and 2018 was not applicable because the Company had no
dilutive common shares Cash dividends per share presented
in the accompanying consolidated statement of operations are
dividends applicable to the respective years including dividends
to be paid after the end of the year
Effective October 1 2018 the Company has implemented
a 1-for-10 reverse stock split of common stock Per share of
common stock is retroactively adjusted as if the reverse stock
split had been effected at the beginning of the fiscal year ended
March 31 2018
w Construction contracts
Construction revenue and construction costs are recognized
by the percentage-of-completion method if the outcome of a
construction contract can be estimated reliably When total
construction revenue total construction costs and the stage of
completion of the contract at the consolidated balance sheet
date can be reliably measured the outcome of a construction
contract is deemed to be estimated reliably If the outcome
of a construction contract cannot be reliably estimated the
completed-contract method should be applied When it is
probable that the total construction costs will exceed total
construction revenue an estimated loss on the contract should
be immediately recognized by providing for a loss on such
construction contracts
20
x Accounting changes and error corrections
Under ASBJ Statement No 24 ldquoAccounting Standard for
Accounting Changes and Error Correctionsrdquo and ASBJ
Guidance No 24 ldquoGuidance on Accounting Standard for
Accounting Changes and Error Correctionsrdquo accounting
treatments are required as follows (1) Changes in Accounting
PoliciesmdashWhen a new accounting policy is applied following
revision of an accounting standard the new policy is applied
retrospectively unless the revised accounting standard includes
specific transitional provisions in which case the entity shall
comply with the specific transitional provisions (2) Changes in
PresentationmdashWhen the presentation of financial statements
is changed prior-period financial statements are reclassified
in accordance with the new presentation (3) Changes in
Accounting EstimatesmdashA change in an accounting estimate
is accounted for in the period of the change if the change
affects that period only and is accounted for prospectively if
the change affects both the period of the change and future
periods (4) Corrections of Prior-Period ErrorsmdashWhen an error
in prior-period consolidated financial statements is discovered
those statements are restated
y New accounting pronouncement
Accounting Standard for Revenue Recognition etc
- Accounting Standard for Revenue Recognition (ASBJ
Statement No 29 issued on March 30 2018)
- Implementation Guidance on Accounting Standard for
Revenue Recognition (ASBJ Guidance No 30 issued on
March 30 2018)
(a) Overview
The International Accounting Standards Board (ldquoIASBrdquo) and
the Financial Accounting Standards Board (ldquoFASBrdquo) have
jointly developed a comprehensive accounting standard for
revenue recognition and issued it as converged guidance on
recognizing revenue in contracts with customers in May 2014
as IFRS 15 (IASB) and Topic 606 (FASB) respectively To
respond to both IFRS 15 and Topic 606 effective from the fiscal
years beginning on or after January 1 2018 and December
15 2017 respectively ASBJ has developed a comprehensive
accounting standard for revenue recognition and issued it with
the respective implementation guidance
In developing the accounting standard for revenue recognition
ASBJ basically integrated the core principle of IFRS 15 from a
comparability point of view of the financial statements which
is one of the benefits of ensuring consistency with IFRS 15
ASBJ on the other side considered additional alternative
treatments where current practices under Japanese GAAP are
to be reflected as far as such treatments would not significantly
impair international comparability
(b) Effective date
The above standard and guidance are scheduled to be applied
from the beginning of the fiscal year ending March 31 2022
(c) Effects of application of the standards
The effects of the application of the above standard and
guidance on the consolidated financial statements are currently
being assessed
z Change in presentation
Application of ldquoPartial Amendments to Accounting Standard for
Tax Effect Accountingrdquo
On February 16 2018 the ASBJ issued ASBJ Statement No 28
Partial Amendments to Accounting Standard for Tax Effect
Accounting which requires deferred tax assets and deferred
tax liabilities to be classified as investments and other assets
and long-term liabilities respectively Deferred tax assets were
previously classified as current assets and investments and other
assets and deferred tax liabilities were previously classified as
current liabilities and long-term liabilities under the previous
accounting standard The revised accounting standard is
effective for annual periods beginning on or after April 1 2018
The Group retrospectively applied the revised accounting
standard effective April 1 2018 and deferred tax assets of yen51
million which were previously classified as current assets as of
March 31 2018 have been reclassified as investments and other
assets in the accompanying consolidated balance sheet In
accordance with transitional treatment allowed for the adoption
of the revised accounting standard the note information
of valuation allowances for tax loss carryforwards and for
temporary differences for the year ended March 31 2018 was
not separately disclosed
21
3 NOTES AND ACCOUNTS RECEIVABLE
Notes and accounts receivable as of March 31 2019 and 2018 consisted of the following
Millions of Yen Thousands ofUS Dollars
2019 2018 2019Trade notes receivable yen 5022 yen 4848 $ 45654
- Unconsolidated subsidiary and associated companies 215 198 1956Trade accounts receivable 17600 16793 160001
- CJR unconsolidated subsidiary and associated companies 6054 6051 55040Other 911 640 8277Less allowance for doubtful accounts (46) (4) (415)
Total yen 29756 yen 28526 $ 270513
Note Allowance for doubtful accounts was not recognized for accounts receivable-other which was included in Other above
4 INVENTORIES
Inventories as of March 31 2019 and 2018 consisted of the following
Millions of Yen Thousands ofUS Dollars
2019 2018 2019Merchandise yen 224 yen 258 $ 2039Finished goods 1303 1642 11841Work in process and semi-finished goods 28676 23450 260695Raw materials 1281 1355 11644
Total yen 31484 yen 26705 $ 286219
Work in process and allowance for work in process on construction contracts are presented in the gross amount in the consolidated balance sheet At March 31 2019 and 2018 allowance for work in process on construction contracts of yen80 million ($725 thousand) and none respectively was provided and included in work in process and semi-finished goods above
5 INVESTMENT SECURITIES
Investment securities as of March 31 2019 and 2018 consisted of the following
Millions of Yen Thousands ofUS Dollars
2019 2018 2019Equity securities yen 20381 yen 18632 $ 185281
Total yen 20381 yen 18632 $ 185281
The costs and aggregate fair values of investment securities as of March 31 2019 and 2018 were as follows
Millions of Yen2019
Cost Gross unrealized gains
Gross unrealized losses
Fair and carrying value
Securities classified as available-for-saleEquity securities yen 6063 yen 12743 yen (25) yen 18781
Total yen 6063 yen 12743 yen (25) yen 18781
22
Millions of Yen2018
Cost Gross unrealized gains
Gross unrealized losses
Fair and carrying value
Securities classified as available-for-saleEquity securities yen 6059 yen 10965 yen - yen 17024
Total yen 6059 yen 10965 yen - yen 17024
Thousands of US Dollars2019
Cost Gross unrealized gains
Gross unrealized losses
Fair and carrying value
Securities classified as available-for-saleEquity securities $ 55117 $ 115842 $ (226) $ 170733
Total $ 55117 $ 115842 $ (226) $ 170733
The information of available-for-sale securities which were sold for the years ended March 31 2019 and 2018 was as follows
Millions of Yen2019
Proceeds Realized gains Realized lossesAvailable-for-sale
Equity securities yen 10 yen 3 yen (0)Total yen 10 yen 3 yen (0)
Millions of Yen2018
Proceeds Realized gains Realized lossesAvailable-for-sale
Equity securities yen 100 yen 54 yen -Total yen 100 yen 54 yen -
Thousands of US Dollars2019
Proceeds Realized gains Realized lossesAvailable-for-sale
Equity securities $ 90 $ 31 $ (9)Total $ 90 $ 31 $ (9)
No impairment losses were recognized on available-for-sale equity securities for the years ended March 31 2019 and 2018
6 NOTES AND ACCOUNTS PAYABLE
Notes and accounts payable as of March 31 2019 and 2018 consisted of the following
Millions of Yen Thousands ofUS Dollars
2019 2018 2019Trade notes payable yen 1418 yen 1208 $ 12890Electronically recorded obligations-operating 10670 10667 96993-Unconsolidated subsidiary and associated companies 25 17 226Trade accounts payable 8001 10323 72740-Unconsolidated subsidiary and associated companies 94 50 857Other 2704 2580 24581
Total yen 22912 yen 24845 $ 208287
23
7 SHORT-TERM BORROWINGS AND LONG-TERM DEBT
There was no balance of short-term borrowings as of March 31 2019 and 2018
Long-term debt as of March 31 2019 and 2018 consisted of the following
Millions of Yen Thousands ofUS Dollars
2019 2018 2019Loans from CJR due through 2027 (Note) with average interest rate of 061 yen 55515 yen 55687 $ 504684
Less current portion (296) (287) (2688)Total yen 55219 yen 55400 $ 501996
The aggregate annual maturities of long-term debt as of March 31 2019 were as follows
Years ending March 31 Millions of Yen Thousands of US Dollars
2020 - -2021 - -2022 yen 2900 $ 263642023 2900 263642024 2900 263642025 and thereafter 26300 239090
Total yen 35000 $ 318182
Note Long-term debt recorded for the transfer price of the factory assets transferred to CJR and for a part of capital expenditure related to the transferred factory assets in the total amount of yen20219 million ($183814 thousand) was not reflected
8 RETIREMENT AND PENSION PLANS
Employees who terminate their service with the Company and its domestic consolidated subsidiaries are entitled to retirement benefits generally determined by reference to the basic rate of pay at the time of termination length of service and conditions under which the termination occurs The Company has a lump-sum retirement benefit plan a defined contribution pension plan and a defined benefit pension plan which are assumed to cover retirement benefits for employees who have retired voluntarily The Company contributed certain assets to the employee retirement benefit trust The Companyrsquos domestic consolidated subsidiaries have similar retirement benefit plans
(1) Defined benefit plans
(a) The changes in defined benefit obligation for the years ended March 31 2019 and 2018 were as follows
Millions of Yen Thousands ofUS Dollars
2019 2018 2019Balance at beginning of year yen 13359 yen 13445 $ 121448
Current service cost 738 724 6709Interest cost 118 119 1071Actuarial gains (93) (42) (844) Benefits paid (484) (838) (4406) Prior service cost - (49) -
Balance at end of year yen 13638 yen 13359 $ 123978
Note The domestic consolidated subsidiaries of the Company apply the simplified method in calculating the defined benefit obligation
24
(b) The changes in plan assets for the years ended March 31 2019 and 2018 were as follows
Millions of Yen Thousands ofUS Dollars
2019 2018 2019Balance at beginning of year yen 18710 yen 17269 $ 170088
Expected return on plan assets 245 232 2232 Actuarial gains 2123 1305 19300 Contribution from the employer 380 383 3449 Benefits paid (202) (479) (1838)
Balance at end of year yen 21256 yen 18710 $ 193231
(c) Reconciliation between the liability (asset) recorded in the consolidated balance sheet and the balances of defined benefit obligation and plan assets as of March 31 2019 and 2018 was as follows
Millions of Yen Thousands ofUS Dollars
2019 2018 2019Funded defined benefit obligation yen 13346 yen 13086 $ 121322 Plan assets (21256) (18709) (193231)
Total (7910) (5623) (71909)Unfunded defined benefit obligation 292 273 2656 Net asset arising from defined benefit obligation yen (7618) yen (5350) $ (69253)
Asset for employeesrsquo retirement benefits yen (7910) yen (5623) $ (71909)Liability for employeesrsquo retirement benefits 292 273 2656 Net asset arising from defined benefit obligation yen (7618) yen (5350) $ (69253)
(d) The components of net periodic benefit costs for the years ended March 31 2019 and 2018 were as follows
Millions of Yen Thousands ofUS Dollars
2019 2018 2019Service cost (Note) yen 738 yen 728 $ 6709 Interest cost 118 118 1071 Expected return on plan assets (245) (232) (2232)Recognized actuarial gains (640) (426) (5817)Amortization of prior service cost (8) (5) (70)Net periodic benefit costs yen (37) yen 183 $ (339)
Note Retirement benefit costs of the consolidated subsidiaries applying the simplified method are included in service cost
(e) Amounts recognized in other comprehensive income (before income tax effect) in respect of defined retirement benefit plans for the years ended March 31 2019 and 2018
Millions of Yen Thousands ofUS Dollars
2019 2018 2019Prior service cost yen 8 yen (44) $ 70Actuarial (gains) losses (1576) (920) (14329)
Total yen (1568) yen (964) $ (14259)
25
(f) Amounts recognized in accumulated other comprehensive income (before income tax effect) in respect of defined retirement benefit plans as of March 31 2019 and 2018
Millions of Yen Thousands ofUS Dollars
2019 2018 2019Unrecognized prior service cost yen (71) yen (79) $ (647)Unrecognized actuarial gains (6749) (5173) (61355)
Total yen (6820) yen (5252) $ (62002)
(g) Plan assets
(i) Components of plan assets Plan assets consisted of the following
2019 2018Debt investments 12 14Equity investments 80 78Cash and deposits 3 3Other 5 5
Total 100 100
Note The employeesrsquo retirement benefit trusts for the contributory pension plans accounted for 18 of total plan assets for the years ended March 31 2019 and 2018
(ii) Method of determining the expected rate of return on plan assetsThe expected rate of return on plan assets is determined considering the current and future asset portfolio and the long-term rates of return which are expected currently and in the future from the various components of the plan assets
(h) Assumptions used for the years ended March 31 2019 and 2018 were set forth as follows
2019 2018Discount rate 09 09Expected rate of return on plan assets 20 20
(2) Defined contribution plans
The required contribution of the Company and its consolidated subsidiaries amounted to yen139 million ($1265 thousand) and yen133 million for the years ended March 31 2019 and 2018 respectively
26
9 ASSETS PLEDGED AS COLLATERAL
(1)Assets pledged as collateral for long-term debt from CJR in the amount of yen35000 million ($318182 thousand) for the payment of settlement money related to a large railway rolling stock project in the USA as of March 31 2019 and 2018 were as follows
Millions of Yen Thousands ofUS Dollars
2019 2018 2019Buildings and structures yen 261 yen 277 $ 2372Land 15 15 136Investment securities 12606 12338 114598
Total yen 12882 yen 12630 $ 117106
(2)Other assets pledged as collateral as of March 31 2019 and 2018 were as follows
Millions of Yen Thousands ofUS Dollars
2019 2018 2019Other current assets (Note 1) yen 56 yen 56 $ 505Other assets under Investments and Other Assets (Note 2) 10 10 91Investment securities (Note 3) 5887 4487 53525
Total yen 5953 yen 4553 $ 54121
Notes 1 Deposit required by insurance contracts 2 Guarantee deposit required by the Building Lots and Buildings Transaction Business Law 3 Deposit for letter of credit
10 CONTINGENT LIABILITIES
In some cases the Company sells its construction equipment products through leasing companies Some of these leasing companies request that the Company enters into lease credit guarantee contracts Under these contracts if the lease credits are unrecoverable from users of the Companyrsquos construction equipment products the Company guarantees payment of the amount defined by the contract to the leasing companies Such guarantees as of March 31 2019 and 2018 amounted to yen226 million ($2056 thousand) and yen389 million respectively
11 LEASE TRANSACTIONS
The Group uses certain machinery and equipment under finance lease contracts
All finance lease transactions are accounted for in a manner similar to ordinary sale or purchase transactions
The aggregate annual maturities of lease obligations as of March 31 2019 were as follows
Years ending March 31 Millions of Yen Thousands ofUS Dollars
2020 yen 678 $ 6168 2021 651 5913 2022 665 6045 2023 244 2221 2024 90 817 2025 and thereafter - -
Total yen 2328 $ 21164
27
A consolidated subsidiary subleases machinery
Investments in leases and lease obligations which include an interest portion resulting from sublease transactions as of March 31 2019 and 2018 were as follows
Millions of Yen Thousands ofUS Dollars
2019 2018 2019 Investments in leases
Due within one year yen 122 yen 154 $ 1112Due after one year 205 327 1859
Total yen 327 yen 481 $ 2971
Millions of Yen Thousands ofUS Dollars
2019 2018 2019Lease obligations
Due within one year yen 140 yen 170 $ 1272 Due after one year 235 375 2139
Total yen 375 yen 545 $ 3411
12 EQUITY
Japanese companies are subject to the Companies Act of Japan (the ldquoCompanies Actrdquo) The significant provisions in the Companies Act that affect financial and accounting matters are summarized below
(1) Dividends
Under the Companies Act companies can pay dividends at any time during the fiscal year in addition to the year-end dividend upon resolution at the shareholdersrsquo meeting Additionally for companies that meet certain criteria including (1) having a Board of Directors (2) having independent auditors (3) having an Audit amp Supervisory Board and (4) the term of service of the directors being prescribed as one year rather than the normal two-year term by its articles of incorporation the Board of Directors may declare dividends (except for dividends-in-kind) at any time during the fiscal year if the company has prescribed so in its articles of incorporation However the Company cannot do so because it does not meet all the above criteria
The Companies Act permits companies to distribute dividends-in-kind (noncash assets) to shareholders subject to a certain limitation and additional requirements
Semiannual interim dividends may also be paid once a year upon resolution by the Board of Directors if the articles of incorporation of the company so stipulate The Companies Act provides certain limitations on the amounts available for dividends or the purchase of treasury stock The limitation is defined as the amount available for distribution to the shareholders but the amount of net assets after dividends must be maintained at no less than yen3 million
(2) Increasesdecreases and transfer of common stock reserve and surplus
The Companies Act requires that an amount equal to 10 of dividends must be appropriated as a legal reserve (a component of retained earnings) or as additional paid-in capital (a component of capital surplus) depending on the equity account charged upon the payment of such dividends until the aggregate amount of legal reserve and additional paid-in capital equals 25 of the common stock Under the Companies Act the total amount of additional paid-in capital and legal reserve may be reversed without limitation The Companies Act also provides that common stock legal reserve additional paid-in capital other capital surplus and retained earnings can be transferred among the accounts within equity under certain conditions upon resolution of the shareholders
28
(3) Treasury stock and treasury stock acquisition rights
The Companies Act also provides for companies to purchase treasury stock and dispose of such treasury stock by resolution of the Board of Directors The amount of treasury stock purchased cannot exceed the amount available for distribution to the shareholders which is determined by a specific formula Under the Companies Act stock acquisition rights are presented as a separate component of equity The Companies Act also provides that companies can purchase both treasury stock acquisition rights and treasury stock Such treasury stock acquisition rights are presented as a separate component of equity or deducted directly from stock acquisition rights
Effective June 28 2018 the Company transferred capital surplus to retained earnings based on the resolution of the Shareholdersrsquo Meeting held on June 28 2018
Effective October 1 2018 the Company has implemented a 1-for-10 reverse stock split of common stock based on the resolution of the Shareholdersrsquo Meeting held on June 28 2018
13 INCOME TAXES
The Company and its domestic subsidiaries are subject to Japanese national and local income taxes which in the aggregate resulted in a normal effective statutory tax rate of approximately 302 and 305 for the years ended March 31 2019 and 2018 respectively
The tax effects of significant temporary differences and tax loss carryforwards that resulted in deferred tax assets and liabilities as of March 31 2019 and 2018 were as follows
Millions of Yen Thousands ofUS Dollars
2019 2018 2019
Deferred tax assetsTax loss carryforwards (Note 2) yen 3630 yen 3642 $ 32999 Liability for employeesrsquo retirement benefits 2510 2528 22815 Loss on write-downs of inventories 1761 2101 16013 Land and building of plants 1458 1487 13253 Loss on impairment of fixed assets 1155 1218 10502 Accrued bonuses to employees 485 446 4411 Provision for loss on orders received 273 1682 2485 Other 1834 2352 16664
Sub-total 13106 15456 119142
Less valuation allowance for tax loss crryforwards (Note 2) (3630) - (32999)
Less valuation allowance pertaining to total amount of deductible temporary differences (7974) - (72493)Valuation allowance total (Note 1) (11604) (15320) (105492)
Total yen 1502 yen 136 $ 13650
Deferred tax liabilitiesUnrealized gain on available-for-sale securities yen (3842) yen (3308) $ (34924)Deferred gain on sales of property - (22) -Other (3549) (2903) (32264)
Total (7391) (6233) (67188)Net deferred tax liabilities yen (5889) yen (6097) $ (53538)
Notes 1 Valuation allowance decreased by yen3716 million ($33779 thousand) during the year ended March 31 2019 This is mainly due to the decrease of deductible temporary differences on the one hand On the other hand the respective deferred tax assets related to tax loss carryforwards were partly judged as recoverable as a result of careful consideration taking into account the current and estimated future taxable income
2 Expected maturity of the deferred tax assets after the balance sheet date for tax loss carryforwards as of March 31 2019 was as follows
29
The expiration of tax loss carryforwards the related valuation allowances and the resulting net deferred tax assets as of March 31 2019 were as follows
Millions of Yen
2019 Within 1 year
Over 1 year but within
2 years
Over 2 years but within
3 years
Over 3 years but within
4 years
Over 4 years but within
5 years
Over 5 years Total
Deferred tax assets relating to tax loss carryforwards () - - - - - yen 3630 yen 3630
Less valuation allowance for tax loss carry forwards - - - - - (3630) (3630)
Net deferred tax assets relating to tax loss carry forwards - - - - - - -
Thousands of US Dollars
2019 Within 1 year
Over 1 year but within
2 years
Over 2 years but within
3 years
Over 3 years but within
4 years
Over 4 years but within
5 years
Over 5 years Total
Tax loss carryforwards () - - - - - $ 32999 $ 32999
Valuation allowance - - - - - (32999) (32999)
Deferred tax assets - - - - - - -
()The amount of tax loss carryforwards was calculated by using the statutory tax rate
A reconciliation between the normal effective statutory tax rates and the actual effective tax rates reflected in the accompanying consolidated statement of operations for the year ended March 31 2019 with the corresponding figures for 2018 is as follows
2019 2018Normal effective statutory tax rate 302 305 Increase (decrease) due to
Expenses not deductible for income tax purposes 39 (290)Tax-exempt income (03) 02Changes in valuation allowance (376) 156Per capita inhabitant tax 04 (03)Transfer price adjustments on consolidation (54) 91Higher (lower) income tax rates applicable to income in certain foreign countries 18 (07)
Other (09) 12Actual effective income tax rate (79) 266
14 FINANCIAL INSTRUMENTS AND RELATED DISCLOSURES
(1) Group policy for financial instruments
The Group finances capital investments and necessary funds mainly internally and with CMS provided by a consolidated subsidiary of CJR The Company also operates funds by utilizing CMS Derivative transactions are used not for speculative purposes but to manage exposure to financial risks as described in (2) below
(2) Nature and extent of risks arising from financial instruments
Receivables such as notes and accounts receivable are exposed to customer credit risk Although receivables in foreign currencies are exposed to the risk of fluctuation in foreign currency exchange rates the position net of payables in foreign currencies is hedged by using forward foreign currency contracts Investment securities mainly equity instruments of customers and suppliers of the Group are exposed to the risk of market price fluctuations
30
Payment terms of payables such as trade notes and trade accounts are less than one year Although payables in foreign currencies are exposed to the risk of fluctuation in foreign currency exchange rates the position net of receivables in foreign currencies is hedged by using forward foreign currency contracts
Long-term debt recorded for the transfer price of the factory assets transferred to CJR and for a part of capital expenditure related to the transferred factory assets is not exposed to market risks from changes in variable interest rates since the Company repays a constant lease fee including the interest portion based on the lease agreement Long-term debt from CJR for the payment of settlement money related to a large railway rolling stock project in the USA is also not exposed to market risks from changes in variable interest rates due to the fixed interest rate Lease obligations are primarily used for financing capital investments
Derivatives mainly include forward foreign currency contracts which are used to manage exposure to risks associated with fluctuations in foreign currency exchange rates related to receivables and payables denominated in foreign currencies and forecasted transactions denominated in foreign currencies Please see Note 15 for more information about derivatives
(3)Risk management for financial instruments
Credit risk management
Credit risk is the risk of economic loss arising from a counterpartyrsquos failure to repay or service debt according to the contractual terms The Group manages its credit risk from receivables by monitoring financial position payment terms and balances of customers to identify default risk of customers at an early stage
Market risk management (foreign exchange risk and interest rate risk)
Foreign currency trade receivables and payables are exposed to market risk resulting from fluctuations in foreign currency exchange rates Such foreign exchange risk is hedged principally by forward foreign currency contracts In addition when foreign currency trade receivables and payables are expected from forecasted transactions forward foreign currency contracts may be used
Investment securities are managed by monitoring the market values and the financial position of issuers on a regular basis
Liquidity risk management
The Group establishes or updates its cash management plan according to the monthly cash management plan from each subsidiary in order to monitor its liquidity risk associated with operating payables and short-term borrowings and long-term debt
(4)Fair values of financial instruments
Fair values of financial instruments are based on quoted prices in active markets If quoted prices are not available other rational valuation techniques are used instead Please see Note 15 for the details of the fair value of derivatives
(a) Fair value of financial instrumentsMillions of Yen
2019Carrying amount Fair value Unrealized
gain (loss)Cash and cash equivalents yen 12721 yen 12721 -Notes and accounts receivable 29756 29756 -Investment securities 18781 18781 -
Total yen 61258 yen 61258 -
Notes and accounts payable yen 22912 yen 22912 -Income taxes payable 538 538 -Long-term debt including current portion 35000 35609 yen (609)Lease obligations including current portion 2328 2315 13
Total yen 60778 yen 61374 yen (596)
31
Millions of Yen2018
Carrying amount Fair value Unrealized
gain (loss)Cash and cash equivalents yen 15837 yen 15837 -Notes and accounts receivable 28526 28526 -Investment securities 17024 17024 -
Total yen 61387 yen 61387 -
Notes and accounts payable yen 24845 yen 24845 -Income taxes payable 132 132 -Long-term debt including current portion 35000 35127 yen (127)Lease obligations including current portion 2473 2454 19
Total yen 62450 yen 62558 yen (108)
Thousands of US Dollars2019
Carrying amount Fair value Unrealized
gain (loss)Cash and cash equivalents $ 115645 $ 115645 -Notes and accounts receivable 270513 270513 -Investment securities 170733 170733 -
Total $ 556891 $ 556891 -
Notes and accounts payable $ 208287 $ 208287 -Income taxes payable 4888 4888 -Long-term debt including current portion 318183 323721 $ (5538)Lease obligations including current portion 21164 21046 118
Total $ 552522 $ 557942 $ (5420)
AssetsCash and cash equivalents and notes and accounts receivableThe carrying values of cash and cash equivalents and notes and accounts receivable approximate fair value because of their short maturities
Investment securitiesThe fair values of investment securities are measured at the quoted market prices of the stock exchange The information on the fair value of investment securities by classification is included in Note 5
LiabilitiesNotes and accounts payable and income taxes payableThe carrying values of notes and accounts payable and income taxes payable approximate fair value since they are scheduled to be settled in a short period of time
Long-term debt and lease obligationsThe fair values of long-term debt (including the current portion) and lease obligations are measured at the present value of the total of the principal and interest discounted by the interest rate applied to new loans
Derivative transactionsInformation on the fair value of derivatives is included in Note 15
32
(b)Carrying amount of financial instruments whose fair value cannot be reliably determined
Millions of Yen Thousands ofUS Dollars
2019 2018 2019Unlisted securities yen 1600 yen 1608 $ 14548Investments in an unconsolidated subsidiary and
associated companies 795 728 7226
Long-term debt recorded for the transfer price of the factory assets transferred to CJR and for a part of capital expenditure related to the transferred factory assets (including the current portion)
20515 20687 186501
(5)Maturity analysis for financial assets and securities with contractual maturities
Millions of Yen2019
Due in one year or less
Due after one year through
five years
Due after five years through
10 years
Due after 10 years
Cash and cash equivalents yen 12721 - - -Notes and accounts receivable 29402 yen 354 yen - -
Total yen 42123 yen 354 yen - -
Thousands of US Dollars2019
Due in oneyear or less
Due after one year through
five years
Due after five years through
10 years
Due after 10 years
Cash and cash equivalents $ 115645 - - -Notes and accounts receivable 267294 $ 3219 $ - -
Total $ 382939 $ 3219 $ - -
Please see Note 7 for annual maturities of long-term debt and Note 11 for obligations under finance leases
15 DERIVATIVE TRANSACTIONS
The Group enters into forward foreign currency contracts to hedge foreign exchange risk associated with certain assets and liabilities denominated in foreign currencies
All derivative transactions are entered into to hedge interest and foreign currency exposures incorporated within its business Accordingly market risk in these derivatives is basically offset by opposite movements in the value of hedged assets or liabilities
Derivative transactions entered into by the Group have been made in accordance with internal policies which regulate the authorization and credit limit amount
33
There was no derivative transaction to which hedge accounting was applied for the year ended March 31 2019 Derivative transactions to which hedge accounting was applied for the year ended March 31 2018 were as follows
Millions of Yen2018
Hedgeditem
Contractamount
Contract amount due
after one yearFairvalue
CurrencyForward foreign currency contracts
Buying
USD Advance payments yen 152 - yen (8)
16 LOSS ON IMPAIRMENT OF PROPERTY PLANT AND EQUIPMENT
The Group recognized impairment losses on the following asset groups
For the year ended March 31 2019Millions of Yen Thousands of US Dollars
Asset group Location Account 2019 2019Idle assets Shinanomachi Nagano Land yen 14 $ 133Idle assets Nagoya Aichi Buildings and structures etc 17 153Idle assets Illinois USA Machinery and equipment 239 2170
Total yen 270 $ 2456
For the year ended March 31 2018Millions of Yen
Asset group Location Account 2018
Idle assets Nakatsugawa Gifu Buildings and structures land etc yen 34
Total yen 34
The Group reviewed its long-lived assets for impairment as of March 31 2019 and 2018
For the years ended March 31 2019 and 2018 the Group recognized an impairment loss for idle assets by writing down the property to its net selling value (based on reasonably adjusted amount of property tax assessment value)
Upon the decision to close the manufacturing plant of an US subsidiary NIPPON SHARYO USA INC in Rochelle Illinois USA on July 24 2018 the sale of the plant to a third party has been considered Therefore we recognized an impairment loss on the manufacturing plant at its net selling value for the year ended March 31 2019
Impairment losses other than the above were not disclosed as they were immaterial
17 RELATED-PARTY DISCLOSURES
(1)Parent and major shareholders
CJR directly owned 512 of the total shares of the Company as of March 31 2019 and 2018 The Company distributes transportation vehicles to CJR
34
Transactions of the Company with CJR for the years ended March 31 2019 and 2018 were as follows
For the year ended March 31 2019 Millions of Yen Thousands ofUS Dollars
2019 2019Sales yen 19955 $ 181413Borrowing of funds 117 1072Repayment of debt 289 2631Interest expense 337 3067
Borrowing of funds repayment of debt and interest expense of yen117 million ($1072 thousand) yen289 million ($2631 thousand) and yen127 million ($1158 thousand) respectively were recorded for the transfer of the factory assets transferred to CJR and for a part of capital expenditure related to the transferred factory assets
For the year ended March 31 2018 Millions of Yen
2018Sales yen 24001Borrowing of funds 56000Repayment of debt 313Interest expense 193
Borrowing of funds repayment of debt and interest expense of yen21000 million yen313 million and yen122 million respectively were recorded for the transfer of the factory assets transferred to CJR and for a part of capital expenditure related to the transferred factory assets
The balances due to or from CJR as of March 31 2019 and 2018 were as follows
As of March 31 2019 Millions of Yen Thousands ofUS Dollars
2019 2019Accounts receivable yen 5993 $ 54483Current portion of long-term debt 296 2688Long-term debt 55219 501996Accrued expenses 43 392
Current portion of long-term debt long-term debt and accrued expenses of yen296 million ($2688 thousand) yen20220 million ($183815 thousand) and yen42 million ($381 thousand) respectively were the balances related to long-term debt for the transfer price of the factory assets transferred to CJR and for a part of capital expenditure related to the transferred factory assets
As of March 31 2018 Millions of Yen
2018Accounts receivable yen 5947Current portion of long-term debt 287Long-term debt 55400Accrued expenses 43
Current portion of long-term debt long-term debt and accrued expenses of yen287 million yen20400 million and yen42 million respectively were the balances related to long-term debt for the transfer price of the factory assets transferred to CJR and for a part of capital expenditure related to the transferred factory assets
(2)Fellow subsidiaries and subsidiaries of other affiliates
35
Transactions of the Company with the fellow subsidiaries for the years ended March 31 2019 and 2018 were as follows
For the year ended March 31 2019Millions of Yen Thousands of
US Dollars2019 2019
JR Central Financial Management Co Ltd Interest income yen 5 $ 45
For the year ended March 31 2018Millions of Yen
2018JR Central Financial Management Co Ltd Interest income yen 2
The balances due to or from the fellow subsidiaries as of March 31 2019 and 2018 were as follows
As of March 31 2019Millions of Yen Thousands of
US Dollars2019 2019
JR Central Financial Management Co LtdCash and cash equivalents yen 7398 $ 67255
As of March 31 2018Millions of Yen
2018JR Central Financial Management Co LtdCash and cash equivalents yen 7534
36
18 OTHER COMPREHENSIVE INCOME
The components of other comprehensive income for the years ended March 31 2019 and 2018 were as follows
Millions of Yen Thousands of US Dollars
2019 2018 2019Unrealized gain on available-for-sale securities
Gains arising during the year yen 1753 yen 1131 $ 15938Reclassification adjustments to profit or loss - (0) -Amount before income tax effect 1753 1131 15938Income tax effect (533) (354) (4848)
Total yen 1220 yen 777 $ 11090Deferred gain (loss) on derivatives under hedge accounting
Gains (losses) arising during the year yen 8 yen (5) $ 69Income tax effect - - -
Total yen 8 yen (5) $ 69Foreign currency translation adjustments
Adjustments arising during the year yen (33) yen (105) $ (301)Total yen (33) yen (105) $ (301)
Defined retirement benefit plansAdjustments arising during the year yen 2216 yen 1396 $ 20145Reclassification adjustments to profit or loss (648) (432) (5887)Amount before income tax effect 1568 964 14258Income tax effect (475) (296) (4320)
Total yen 1093 yen 668 $ 9938Share of other comprehensive (loss) income in associated companies
Gains arising during the year yen (9) yen 36 $ (81)Income tax effect - - -
Total yen (9) yen 36 $ (81)
Total other comprehensive income yen 2279 yen 1371 $ 20715
19 SEGMENT INFORMATION
Under ASBJ Statement No 17 ldquoAccounting Standard for Segment Information Disclosuresrdquo and ASBJ Guidance No 20 ldquoGuidance on Accounting Standard for Segment Information Disclosuresrdquo an entity is required to report financial and descriptive information about its reportable segments Reportable segments are operating segments or aggregations of operating segments that meet specified criteria Operating segments are components of an entity about which separate financial information is available and such information is evaluated regularly by the chief operating decision maker in deciding how to allocate resources and in assessing performance Generally segment information is required to be reported on the same basis as is used internally for evaluating operating segment performance and deciding how to allocate resources to operating segments
(1)Description of reportable segments
The Grouprsquos reportable segments are those for which separate financial information is available and regular evaluation by the Companyrsquos management is being performed in order to decide how resources are allocated among the Group
The Group has operational headquarters by each product or service Each of the operational headquarters develops comprehensive strategies and engages in business activities relating to each product and service Accordingly the Group is comprised of segments organized by products or services based on the operational headquarters and there are four reportable segments ldquoRailway Rolling Stockrdquo ldquoTransportation Equipment and Steel Structurerdquo ldquoConstruction Equipmentrdquo and ldquoEngineeringrdquo
37
ldquoRailway Rolling Stockrdquo consists of manufacture and sales of rolling stock such as EMUs and railway motor cars
ldquoTransportation Equipment and Steel Structurerdquo consists of manufacture and sales of transportation equipment such as freight cars tank trucks heavy-duty industrial vehicles and manufacture and construction of roadway and railway bridges
ldquoConstruction Equipmentrdquo consists of manufacture and sales of pile driving rigs crawler cranes casing rotators portable diesel generator sets and emergency generators
ldquoEngineeringrdquo consists of manufacture and sales of railway rolling stock inspectionmaintenance systems agricultural plants and pulp and paper plants
(2)Method of measurement for the amount of sales profit (loss) assets and other items for each reportable segment
The accounting policies of each reportable segment are consistent with those disclosed in Note 2 ldquoSummary of Significant Accounting Policiesrdquo Reporting segment profit represents operating income Intersegment transactions are based upon armrsquos-length transactions
(3)Information of sales profit (loss) assets and other items was as follows
Millions of Yen2019
Reportable segmentRailway Rolling Stock
Transportation Equipment and Steel Structure
Construction Equipment Engineering Other Total Reconciliations Consolidated
Net salesSales to external customers yen 38049 yen 21794 yen 25167 yen 6006 yen 163 yen 91179 - yen 91179Intersegment sales or transfers 129 187 13 67 185 581 yen (581) -
Total yen 38178 yen 21981 yen 25180 yen 6073 yen 348 yen 91760 yen (581) yen 91179
Segment profit (loss) yen 2034 yen 2040 yen 4887 yen 386 yen (27) yen 9320 yen (820) yen 8500Segment assets yen 47448 yen 22556 yen 22978 yen 2906 yen 645 yen 96533 yen 37661 yen 134194Other
Depreciation yen 1046 yen 276 yen 779 yen 15 yen 2 yen 2118 yen 252 yen 2370Increase in property plant and
equipment and intangible assets 1010 937 740 22 2 2711 160 2871
Millions of Yen2018
Reportable segmentRailway Rolling Stock
Transportation Equipment and Steel Structure
Construction Equipment Engineering Other Total Reconciliations Consolidated
Net salesSales to external customers yen 41455 yen 22475 yen 24573 yen 6560 yen 248 yen 95311 - yen 95311Intersegment sales or transfers 261 331 10 23 192 817 yen (817) -
Total yen 41716 yen 22806 yen 24583 yen 6583 yen 440 yen 96128 yen (817) yen 95311
Segment profit (loss) yen 1413 yen 1991 yen 5270 yen (75) yen (93) yen 8506 yen (1240) yen 7266Segment assets yen 46176 yen 19734 yen 22724 yen 4684 yen 669 yen 93987 yen 33426 yen 127413Other
Depreciation yen 1340 yen 319 yen 760 yen 14 yen 2 yen 2435 yen 293 yen 2728Increase in property plant and
equipment and intangible assets 563 143 962 5 0 1673 107 1780
38
Thousands of US Dollars2019
Reportable segmentRailway Rolling Stock
Transportation Equipment and Steel Structure
Construction Equipment Engineering Other Total Reconciliations Consolidated
Net salesSales to external customers $ 345904 $ 198128 $ 228791 $ 54601 $ 1480 $ 828904 - $ 828904Intersegment sales or transfers 1169 1696 122 608 1682 5277 $ (5277) -
Total $ 347073 $ 199824 $ 228913 $ 55209 $ 3162 $ 834181 $ (5277) $ 828904
Segment profit (loss) $ 18494 $ 18548 $ 44423 $ 3512 $ (248) $ 84729 $ (7459) $ 77270Segment assets $ 431340 $ 205056 $ 208891 $ 26422 $ 5859 $ 877568 $ 342384 $ 1219952Other
Depreciation $ 9513 $ 2515 $ 7080 $ 133 $ 14 $ 19255 $ 2294 $ 21549Increase in property plant and
equipment and intangible assets 9186 8514 6725 202 15 24642 1461 26103
Notes 1 ldquoOtherrdquo represents businesses that are not included in any reportable segment which includes manufacture and sales of laser processing system sales of railroad-related merchandise and real estate rental
2 ldquoReconciliationsrdquo in segment profit (loss) include corporate expenses of yen(854) million ($(7766) thousand) and yen(1294) million for the years ended March 31 2019 and 2018 respectively elimination of intersegment transactions of yen27 million ($246 thousand) and yen42 million for the years ended March 31 2019 and 2018 Corporate expenses principally consist of general and administrative expenses that are not attributable to any reportable segment
3 ldquoReconciliationsrdquo in segment assets include total corporate assets of yen32158 million ($292350 thousand) and yen29889 million elimination of intersegment balances of yen(116) million ($(1051) thousand) and yen(136) million and adjustments in inventories of yen(61) million ($(556) thousand) and yen(68) million as of March 31 2019 and 2018 respectively Total corporate assets principally consist of investment securities and general management properties as of March 31 2019 and 2018
4 Segment profit (loss) is reconciled to operating income in the consolidated statement of operations
Associated Information
(1) Information about products and services is not disclosed since similar information is disclosed above
(2) Information about geographical areas for the year ended March 31 2019 was as follows
Millions of Yen2019
Japan USA Asia Other TotalNet sales yen 81477 yen 156 yen 9503 yen 43 yen 91179
Note Sales are based on the location of the customers and grouped by country or area
Information about net sales by geographical areas for the year ended March 31 2018 is not disclosed since net sales to external customers in Japan exceeds 90 of consolidated net sales
Millions of Yen2019
Japan USA Asia Other TotalProperty plant and equipment yen 24784 yen 3630 yen 0 yen 0 yen 28414
39
Millions of Yen2018
Japan USA Asia Other TotalProperty plant and equipment yen 24306 yen 4258 yen 0 yen 0 yen 28564
Thousands of US Dollars2019
Japan USA Asia Other TotalProperty plant and equipment $ 225304 $ 33001 $ 1 $ 0 $ 258306
(3) Information about major customers Net sales
Millions of Yen Thousands of US Dollars
Relatedsegment
Name of major customer 2019 2018 2019
CJR yen 19955 yen 24001 $ 181413Railway Rolling Stock
Transportation Equipment and Steel Structure
(4) Information about loss on impairment of property plant and equipment by reportable segment
Millions of Yen2019
Reportable segmentRailwayRolling Stock
TransportationEquipment andSteel Structure
ConstructionEquipment
Engineer-ing Other Total
Recon-ciliations
Consoli-dated
Impairment loss yen 238 - - - - yen 238 32 yen 270
Millions of Yen2018
Reportable segmentRailwayRolling Stock
TransportationEquipment andSteel Structure
ConstructionEquipment
Engineer-ing Other Total
Recon-ciliations
Consoli-dated
Impairment loss yen - - - - - yen - 34 yen 34
Thousands of US Dollars2019
Reportable segmentRailwayRolling Stock
TransportationEquipment andSteel Structure
ConstructionEquipment
Engineer-ing Other Total
Recon-ciliations
Consoli-dated
Impairment loss $ 2168 - - - - $ 2168 288 $ 2456
Note The amount of ldquoReconciliationsrdquo is related to idle assets which are not attributable to any reporting segment
40
Corporate Profile
Line of Business
Overview of the Main SegmentsNIPPON SHARYO manufactures and sells the following products
Business segment Lines of business
Railway rolling stock EMUs DMUs Passenger Cars Linear Motor Cars Track Maintenance Machines Rolling Stock Components and Automated Guideway Transit Systems
Transportation equipment and Steel structure
Freight Cars Locomotives Tank Trucks Tank Trailers Storage Tanks Heavy-duty Industrial Vehicles Containers Automated Guided Vehicles Roadway Bridges Railway Bridges Water Gates
Construction equipmentPile Driving Rigs Crawler Cranes Hydraulic Hammers Casing Rotators Other Products Related to Foundation Work Portable Diesel Generator Sets Emergency Generators Various Products Related to Electric Machines
Engineering Agricultural Plants Grain Complex Seed Processing Plants Railway Rolling Stock InspectionMaintenance System Pulp and Paper Plants
OFFICE
PLANT
Company Name NIPPON SHARYO LTD
Capital Stock
Common StockAuthorized 32800000 shares
Common StockIssued 14675012 shares
Number of Shareholders 12509 persons
(March 31 2019)
Company History
Sep 1896 Established in Nagoya CityJun 1938 Founded Narumi PlantMay 1949 Re-listed on Tokyo Stock ExchangeJan 1959 Began Construction Machinery BusinessOct 1961 Started Bridge ManufacturingJul 1964 Founded Toyokawa PlantJun 1975 Founded Kinuura PlantSep 1996 100th AnniversaryAug 2008 Equity and business tie-up entered into with Central Japan Railway CompanyAug 2019 Manufactured 4000th Shinkansen EMU
HEAD OFFICE (NAGOYA)
1-1 Sanbonmatsu-choAtsuta-ku Nagoya 456-8691 JAPANPhone +81-52-882-3316Fax +81-52-882-3781
TOKYO OFFICE OSAKA BRANCH
14th FLNorth Gate Building3-1-3 UmedaKita-ku Osaka 530-0001 JAPANPhone +81-6-6341-4455Fax +81-6-6341-4487
12th Fl Marunouchi Central Bldg1-9-1 MarunouchiChiyoda-ku Tokyo 100-0005 JAPANPhone +81-3-6688-6808Fax +81-3-6688-6813
TOYOKAWA PLANT
2-20 HonoharaToyokawa Aichi-pref 442-8502 JAPANPhone +81-533-85-4900Fax +81-533-85-4123
(Railway rolling stock amp other transportation equipment)NARUMI PLANT
80 Ryucho Narumi-choMidori-ku Nagoya 458-8502 JAPANPhone +81-52-623-3529Fax +81-52-623-4349
(Construction equipment)KINUURA PLANT
20 11-gouchiHanda Aichi 475-0831 JAPAN
(Steel structure)
NIPPON SHARYO USA INC
2340 S Arlington Heights Road Suite 605 Arlington Heights IL 60005 USAAttn NIPPON SHARYO ENGINEERING amp MARKETING LLCPhone +1-847-228-2700Fax +1-847-228-5530
Corporate Information
Directory
41
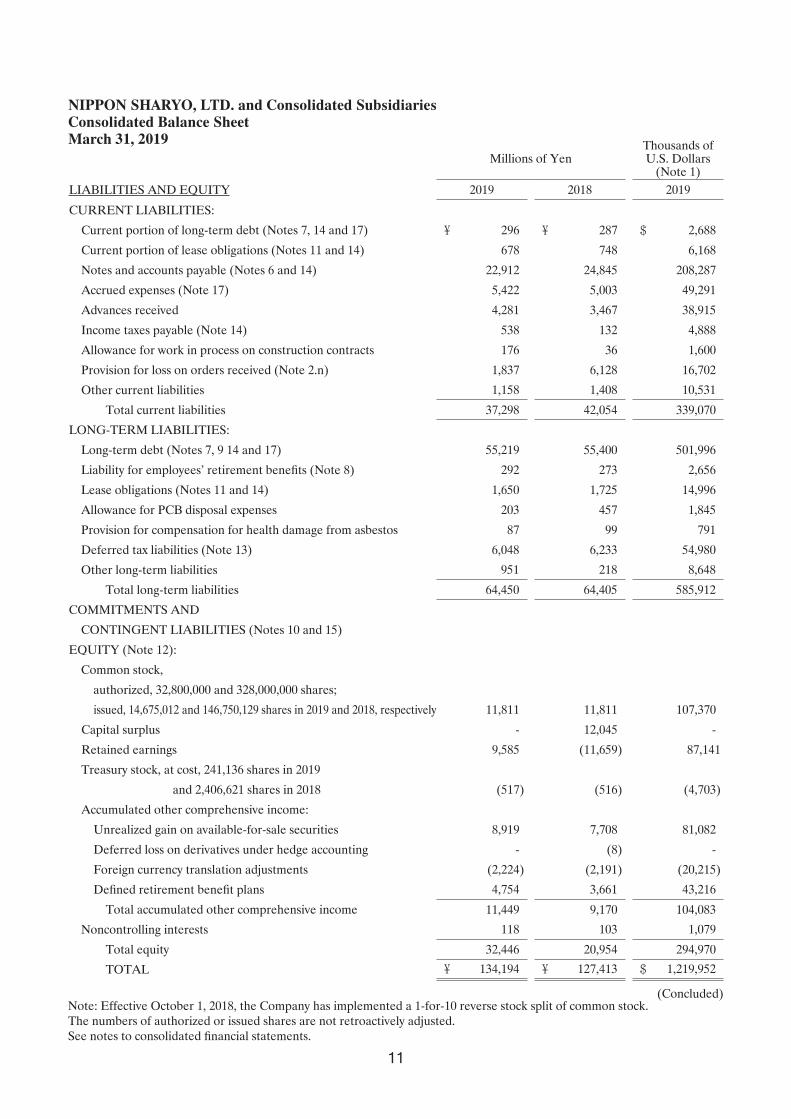
Millions of YenThousands of US Dollars
(Note 1)LIABILITIES AND EQUITY 2019 2018 2019
CURRENT LIABILITIES
Current portion of long-term debt (Notes 7 14 and 17) yen 296 yen 287 $ 2688
Current portion of lease obligations (Notes 11 and 14) 678 748 6168
Notes and accounts payable (Notes 6 and 14) 22912 24845 208287
Accrued expenses (Note 17) 5422 5003 49291
Advances received 4281 3467 38915
Income taxes payable (Note 14) 538 132 4888
Allowance for work in process on construction contracts 176 36 1600
Provision for loss on orders received (Note 2n) 1837 6128 16702
Other current liabilities 1158 1408 10531
Total current liabilities 37298 42054 339070
LONG-TERM LIABILITIES
Long-term debt (Notes 7 9 14 and 17) 55219 55400 501996
Liability for employeesrsquo retirement benefits (Note 8) 292 273 2656
Lease obligations (Notes 11 and 14) 1650 1725 14996
Allowance for PCB disposal expenses 203 457 1845
Provision for compensation for health damage from asbestos 87 99 791
Deferred tax liabilities (Note 13) 6048 6233 54980
Other long-term liabilities 951 218 8648
Total long-term liabilities 64450 64405 585912
COMMITMENTS AND
CONTINGENT LIABILITIES (Notes 10 and 15)
EQUITY (Note 12)
Common stock
authorized 32800000 and 328000000 shares
issued 14675012 and 146750129 shares in 2019 and 2018 respectively 11811 11811 107370
Capital surplus - 12045 -
Retained earnings 9585 (11659) 87141
Treasury stock at cost 241136 shares in 2019
and 2406621 shares in 2018 (517) (516) (4703)
Accumulated other comprehensive income
Unrealized gain on available-for-sale securities 8919 7708 81082
Deferred loss on derivatives under hedge accounting - (8) -
Foreign currency translation adjustments (2224) (2191) (20215)
Defined retirement benefit plans 4754 3661 43216
Total accumulated other comprehensive income 11449 9170 104083
Noncontrolling interests 118 103 1079
Total equity 32446 20954 294970
TOTAL yen 134194 yen 127413 $ 1219952
(Concluded)Note Effective October 1 2018 the Company has implemented a 1-for-10 reverse stock split of common stock The numbers of authorized or issued shares are not retroactively adjusted See notes to consolidated financial statements
NIPPON SHARYO LTD and Consolidated SubsidiariesConsolidated Balance SheetMarch 31 2019
11
NIPPON SHARYO LTD and Consolidated SubsidiariesConsolidated Statement of OperationsYear Ended March 31 2019
Millions of YenThousands of US Dollars
(Note 1)
2019 2018 2019
NET SALES (Note 17) yen 91179 yen 95311 $ 828904
COST OF SALES (Notes 2i 2m and 2u) 75816 80897 689240
Gross profit 15363 14414 139664
SELLING GENERAL AND ADMINISTRATIVE EXPENSES (Note 2u) 6863 7148 62394
Operating income 8500 7266 77270
OTHER INCOME (EXPENSES)
Interest and dividend income (Note 17) 344 311 3128
Interest expense (Note 17) (344) (212) (3130)
Equity in earnings of associated companies 82 81 742
Gain on sales of investment securities net (Note 5) 3 54 31
Loss on impairment of property plant and equipment (Note 16) (270) (34) (2456)
(Loss) gain on sales and disposals of property plant and equipment net (52) 8950 (470)
Loss on early repayment of long-term debt - (1077) -
Loss on payment for settlement - (26445) -
Other ndash net 284 (134) 2584
Other income (expenses) ndash net 47 (18506) 429
INCOME (LOSS) BEFORE INCOME TAXES 8547 (11240) 77699
INCOME TAXES (Note 13)
Current 543 105 4939
Deferred (1216) (3089) (11057)
Total income taxes (673) (2984) (6118)
NET INCOME (LOSS) 9220 (8256) 83817
NET INCOME ATTRIBUTABLE TO NONCONTROLLING INTERESTS 21 15 193
NET INCOME (LOSS) ATTRIBUTABLE TO OWNERS OF THE PARENT yen 9199 yen (8271) $ 83624
Yen US Dollars
PER SHARE OF COMMON STOCK (Note 2v)
Basic net income (loss) yen 63729 yen (57301) $ 579
Cash dividends applicable to the year - - -
Note Effective October 1 2018 the Company has implemented a 1-for-10 reverse stock split of common stock Per share of common stock is retroactively adjusted Per share information is disclosed as if the reverse stock split had been effected at the beginning of the fiscal year ended March 31 2018
See notes to consolidated financial statements
12
NIPPON SHARYO LTD and Consolidated SubsidiariesConsolidated Statement of Comprehensive IncomeYear Ended March 31 2019
Millions of YenThousands of US Dollars
(Note 1)
2019 2018 2019
NET INCOME (LOSS) yen 9220 yen (8256) $ 83817
OTHER COMPREHENSIVE INCOME (Note 18)
Unrealized gain on available-for-sale securities 1220 777 11090
Deferred gain (loss) on derivatives under hedge accounting 8 (5) 69
Foreign currency translation adjustments (33) (105) (301)
Defined retirement benefit plans 1093 668 9938
Share of other comprehensive (loss) income in associated companies (9) 36 (81)
Total other comprehensive income 2279 1371 20715
COMPREHENSIVE INCOME (LOSS) yen 11499 yen (6885) $ 104532
TOTAL COMPREHENSIVE INCOME (LOSS) ATTRIBUTABLE TO
Owners of the parent yen 11478 yen (6900) $ 104339
Noncontrolling interests 21 15 193
See notes to consolidated financial statements
13
NIPPON SHARYO LTD and Consolidated SubsidiariesConsolidated Statement of Changes in EquityYear Ended March 31 2019
Millions of Yen
Number of shares of
common stock outstanding
Commonstock
Capitalsurplus
Retainedearnings
Treasurystock
BALANCE APRIL 1 2017 144347475 yen 11811 yen 12045 yen (3157) yen (515)
Net loss attributable to owners of the parent - - - (8271) -
Increase in treasury stock net (3967) - 0 - (1)
Change of scope of equity method - - - (231) -
Net changes in the year - - - - -
BALANCE MARCH 31 2018 144343508 11811 12045 (11659) (516)
Disposition of deficit - - (12045) 12045 -
Net income attributable to owners of the parent - - - 9199 -
Increase in treasury stock net (475) - 0 - (1)
Transfer to capital surplus from retained earnings - - 0 (0) -
Net changes in the year (129909157) - - - -
BALANCE MARCH 31 2019 14433876 yen 11811 yen - yen 9585 yen (517)
Thousands of US Dollars (Note 1)
Commonstock
Capitalsurplus
Retainedearnings
Treasurystock
BALANCE MARCH 31 2018 $ 107370 $ 109511 $ (105994) $ (4691)
Disposition of deficit - (109511) 109511 -
Net income attributable to owners of the parent - - 83624 -
Increase in treasury stock net - 0 - (12)
Transfer to capital surplus from retained earnings - 0 (0) -
Net changes in the year - - - -
BALANCE MARCH 31 2019 $ 107370 $ - $ 87141 $ (4703)
Effective October 1 2018 the Company has implemented a 1-for-10 reverse stock split of common stock The number of shares of common stock outstanding is not retroactively adjusted
See notes to consolidated financial statements
14
Millions of Yen
Accumulated other comprehensive income
Unrealized gain on available-for-
sale securities
Deferred loss on derivatives under hedge accounting
Foreign currency
translation adjustments
Defined retirement
benefit plans
Total accumulated
other comprehensive
income
Noncontrollinginterests
Totalequity
yen 6905 yen 5 yen (2068) yen 2993 yen 7835 yen 90 yen 28109
- - - - - - (8271)
- - - - - - (1)
- 5 (42) - (37) - (268)
803 (18) (81) 668 1372 13 1385
7708 (8) (2191) 3661 9170 103 20954
- - - - - - -
- - - - - - 9199
- - - - - - (1)
- - - - - - -
1211 8 (33) 1093 2279 15 2294
yen 8919 yen - yen (2224) yen 4754 yen 11449 yen 118 yen 32446
Thousands of US Dollars (Note 1)
Accumulated other comprehensive income
Unrealized gain on available-for-
sale securities
Deferred gain (loss) on
derivatives under hedge accounting
Foreign currency
translation adjustments
Defined retirement
benefit plans
Total accumulated
other comprehensive
income
Noncontrollinginterests
Totalequity
$ 70073 $ (69) $ (19914) $ 33277 $ 83367 $ 932 $ 190495
- - - - - - -
- - - - - - 83624
- - - - - - (12)
- - - - - - -
11009 69 (301) 9939 20716 147 20863
$ 81082 $ - $ (20215) $ 43216 $ 104083 $ 1079 $ 294970
15
Millions of Yen Thousands of US Dollars(Note 1)
2019 2018 2019
OPERATING ACTIVITIES
Income (loss) before income taxes yen 8547 yen (11240) $ 77699
Adjustments for
Income taxes-paid (5) (750) (42)
Loss on early repayment of long-term debt - 1077 -
Loss on payment for settlement - 26445 -
Depreciation 2370 2728 21549
Loss on impairment of property plant and equipment 270 34 2456
Loss (gain) on sales and disposals of property plant and equipment 21 (9067) 195
Gain on sales of investment securities (3) (54) (31)
Changes in assets and liabilities
(Increase) decrease in trade notes and accounts receivable (1029) 3367 (9352)
(Increase) decrease in inventories (4792) 3248 (43561)
(Decrease) increase in trade notes and accounts payable (2053) 1146 (18661)
Increase (decrease) in allowance for work in process on construction contracts 140 (394) 1272
Decrease in provision for loss on orders received (4248) (10159) (38616)
(Decrease) increase in provision for compensation for health damage from asbestos (12) 7 (109)
Increase (decrease) in advances received 814 (1208) 7401
Increase in liability for employeesrsquo retirement benefits 20 14 178
Other-net (1376) (4308) (12529)
Sub-total (1336) 886 (12151)
Payments for loss on early repayment of long-term debt - (1077) -
Settlement paid - (37001) -
Net cash used in operating activities (1336) (37192) (12151)
INVESTING ACTIVITIES
Purchases of property plant and equipment (1235) (1001) (11224)
Proceeds from sales of property plant and equipment 46 12827 417
Purchases of investment securities (3) (3) (31)
Proceeds from sales of investment securities 11 100 99
Other-net (66) (130) (593)
Net cash(used in)provided by investing activities (1247) 11793 (11332)
FINANCING ACTIVITIES
Net decrease in short-term borrowings - (1595) -
Proceeds from long-term debt 118 56000 1072
Repayments of long-term debt (289) (24487) (2631)
Dividends paid (0) (3) (1)
Other-net (303) (84) (2746)
Net cash (used in) provided by financing activities (474) 29831 (4306)
FOREIGN CURRENCY TRANSLATION ADJUSTMENTS ON CASH AND CASH EQUIVALENTS (59) (308) (542)
NET (DECREASE) INCREASE IN CASH AND CASH EQUIVALENTS (3116) 4124 (28331)
CASH AND CASH EQUIVALENTS BEGINNING OF YEAR 15837 11713 143976
CASH AND CASH EQUIVALENTS END OF YEAR yen 12721 yen 15837 $ 115645
(Concluded)See notes to consolidated financial statements
NIPPON SHARYO LTD and Consolidated SubsidiariesConsolidated Statement of Cash Flows Year Ended March 31 2019
16
NIPPON SHARYO LTD and Consolidated SubsidiariesNotes to Consolidated Financial StatementsYear Ended March 31 2019
the equity method of accounting had been applied to the
investments in these companies the effect on the accompanying
consolidated financial statements would not be material
All significant intercompany balances and transactions have
been eliminated in consolidation All material unrealized profit
included in assets resulting from transactions within the Group
is also eliminated
The number of the consolidated subsidiaries unconsolidated
subsidiary and associated companies for the years ended March
31 2019 and 2018 was as follows
2019 2018Consolidated subsidiaries 6 6Unconsolidated subsidiary stated at cost 1 1Associated companies accounted for by the equity method 2 2Associated company stated at cost 1 1
The fiscal year-end of NIPPON SHARYO USA INC and its
subsidiaries NIPPON SHARYO MANUFACTURING LLC
and NIPPON SHARYO ENGINEERING amp MARKETING
LLC is December 31 and their financial statements with the
closest closing date prior to that of the Company are used for
consolidation purposes Necessary adjustments for significant
transactions from January 1 to March 31 are made for
consolidation purposes
For the equity method associated companies that have a
different fiscal year from that of the Company the associated
companiesrsquo financial statements with the closest closing date
prior to that of the Company are used for consolidation
purposes
b Unification of accounting policies applied to foreign subsidiaries
for the consolidated financial statements
Under Accounting Standards Board of Japan (ldquoASBJrdquo)
Practical Issues Task Force (ldquoPITFrdquo) No 18 ldquoPractical
Solution on Unification of Accounting Policies Applied
to Foreign Subsidiaries for the Consolidated Financial
Statementsrdquo the accounting policies and procedures applied to
a parent company and its subsidiaries for similar transactions
and events under similar circumstances should in principle
be unified for the preparation of the consolidated financial
statements However financial statements prepared by foreign
subsidiaries in accordance with either IFRS or generally
accepted accounting principles in the United States of America
1 BASIS OF PR ESENTATION OF CONSOLIDATED
FINANCIAL STATEMENTS
The accompanying consolidated financial statements have
been prepared in accordance with the provisions set forth in
the Japanese Financial Instruments and Exchange Act and
its related accounting regulations and in accordance with
accounting principles generally accepted in Japan (ldquoJapanese
GAAPrdquo) which are different in certain respects as to the
application and disclosure requirements of International
Financial Reporting Standards (IFRS)
In preparing these consolidated financial statements certain
reclassifications and rearrangements have been made to the
consolidated financial statements issued domestically in order
to present them in a form which is more familiar to readers
outside Japan In addition certain reclassifications have been
made in the 2018 consolidated financial statements to conform
to the classifications used in 2019
The consolidated financial statements are stated in Japanese
yen the currency of the country in which NIPPON SHARYO
LTD (the ldquoCompanyrdquo) is incorporated and operates The
translations of Japanese yen amounts into US dollar amounts
are included solely for the convenience of readers outside Japan
and have been made at the rate of yen110 to $1 the approximate
rate of exchange at March 31 2019 Such translations should not
be construed as representations that the Japanese yen amounts
could be converted into US dollars at that or any other rate
2 SUMMARY OF SIGNIFICANT ACCOUNTING POLICIES
a Consolidation
The consolidated financial statements as of March 31 2019
include the accounts of the Company and its significant
subsidiaries (together the ldquoGrouprdquo) Under the control and
influence concepts those companies in which the Company
directly or indirectly is able to exercise control over operations
are fully consolidated and those companies over which the
Group has the ability to exercise significant influence are
accounted for by the equity method
Investment in associated companies are accounted for by the
equity method Investments in the remaining unconsolidated
subsidiary and associated company are stated at cost If
17
(Financial Accounting Standards Board Accounting Standards
CodificationmdashldquoFASB ASCrdquo) tentatively may be used for the
consolidation process except for the following items that
should be adjusted in the consolidation process so that net
income is accounted for in accordance with Japanese GAAP
unless they are not material (a) amortization of goodwill (b)
scheduled amortization of actuarial gain or loss of pensions
that has been recorded in equity through other comprehensive
income (c) expensing capitalized development costs of research
and development (RampD) and (d) cancellation of the fair value
model of accounting for property plant and equipment and
investment properties and incorporation of the cost model
accounting
c Unification of accounting policies applied to associated
companies for the equity method
ASBJ Statement No 16 ldquoAccounting Standard for Equity
Method of Accounting for Investmentsrdquo requires adjustments
to be made to conform the associatersquos accounting policies for
similar transactions and events under similar circumstances
to those of the parent company when the associatersquos financial
statements are used in applying the equity method unless it is
impracticable to determine adjustments
d Business combinations
Business combinations are accounted for using the purchase
method Acquisition-related costs such as advisory fees or
professional fees are accounted for as expenses in the periods
in which the costs are incurred If the initial accounting for a
business combination is incomplete by the end of the reporting
period in which the business combination occurs an acquirer
shall report in its financial statements provisional amounts for
the items for which the accounting is incomplete During the
measurement period which shall not exceed one year from
the acquisition the acquirer shall retrospectively adjust the
provisional amounts recognized at the acquisition date to reflect
new information obtained about facts and circumstances that
existed as of the acquisition date and that would have affected
the measurement of the amounts recognized as of that date
Such adjustments shall be recognized as if the accounting for
the business combination had been completed at the acquisition
date A parentrsquos ownership interest in a subsidiary might
change if the parent purchases or sells ownership interests in its
subsidiary The carrying amount of noncontrolling interest is
adjusted to reflect the change in the parentrsquos ownership interest
in its subsidiary while the parent retains its controlling interest
in its subsidiary Any difference between the fair value of the
consideration received or paid and the amount by which the
noncontrolling interest is adjusted is accounted for as capital
surplus as long as the parent retains control over its subsidiary
e Cash equivalents
Cash equivalents are short-term investments that are readily
convertible into cash and exposed to insignificant risk of
changes in value
Cash equivalents include time deposits and Cash Management
System (ldquoCMSrdquo) funds due from Central Japan Railway
Company (ldquoCJRrdquo) group all of which mature or become due
within three months from the date of acquisition CJR is the
parent company of the Company
f Investment securities
Investment securities are classif ied and accounted for
depending on managementrsquos intent as follows
Available-for-sale securities are reported at fair value with
unrealized gains and losses net of applicable taxes reported in
a separate component of equity
Nonmarketable available-for-sale securities are stated at cost
determined by the moving-average method For other-than-
temporary declines in fair value investment securities are
reduced to net realizable value by a charge to income
g Derivatives and hedging activities
The Group uses derivative financial instruments to manage its
exposures to fluctuations in foreign exchange and interest rates
Forward foreign currency contracts are utilized by the Group
to reduce foreign currency exchange risks The Group does not
enter into derivatives for trading or speculative purposes
Derivative f inancial instruments and foreign currency
transactions are classified and accounted for as follows 1)
all derivatives are recognized as either assets or liabilities
and measured at fair value and gains and losses on derivative
transactions are recognized in the consolidated statement of
operations and 2) for derivatives used for hedging purposes if
such derivatives qualify for hedge accounting because of high
correlation and effectiveness between the hedging instruments
and the hedged items gains and losses on derivatives are
deferred until maturity of the hedged transactions
The forward foreign currency contracts are utilized to hedge
foreign currency exposures in sales of merchandise and
finished goods to overseas customers and procurement of
raw materials from overseas suppliers Trade receivables and
payables denominated in foreign currencies are translated at
the contracted rates if the forward contracts qualify for hedge
accounting
18
h Allowance for doubtful accounts
An allowance for doubtful accounts is provided for at the
aggregate amount of estimated credit loss based on an
individual analysis of certain doubtful or troubled receivables
and a general reserve for other receivables is calculated based
on the historical loss experience
i Inventories
Inventories are stated at the lower of cost determined
pr inc ipa l ly by the spec i f ic ident i f icat ion method for
merchandise finished goods and work in process and by the
moving-average method for semi-finished goods raw materials
and supplies or net selling value which is defined as the selling
price less additional estimated manufacturing costs and
estimated direct selling expenses The replacement cost may be
used in place of the net selling value if appropriate Reversal of
write-downs of inventories in the amounts of yen(1157) million
($(10521) thousand) and yen(10135) million for the years ended
March 31 2019 and 2018 respectively were included in cost of
sales
j Property plant and equipment
Property plant and equipment including significant renewals
and additions are stated at cost and are depreciated principally
by the straight-l ine method for bui ldings and bui lding
improvements and structures acquired on or after April 1 2016
and by the declining-balance method for other property at rates
based on the estimated useful lives of the assets
Depreciation of leased assets relating to financial lease
transactions without transfer of ownership is computed by the
straight-line method over the leased period
The range of useful lives is principally from 10 to 60 years for
buildings and structures and from six to 17 years for machinery
and equipment
The Company has transferred its factory assets of Toyokawa
Plant Kinuura Plant and Narumi Plant to CJR on April 20
2017 The transfer was not treated as a buying and selling
transaction since the relevant factory assets were transferred to
CJR and the Company continues to utilize these factory assets
as before based on a lease agreement concluded between the
Company and CJR The relevant factory assets were therefore
still recorded under property plant and equipment of the
Company As the relevant transactions do not fall under a
finance lease transaction the total transfer price was recorded
as long-term debt (including the current portion) In addition
capital expenditure related to the transferred factory assets was
recorded under ldquobuildings and structuresrdquo and ldquomachinery and
equipmentrdquo and a part of the capital expenditure was recorded
as long-term debt (including the current portion) for the year
ended March 31 2019
As a result the relevant factory assets as of March 31 2019
were recorded under property plant and equipment in the
carrying amount of yen11975 million ($108867 thousand) as
land of yen3827 million ($34794 thousand) as buildings and
structures and yen7 million ($68 thousand) as machinery and
equipment while long-term debt (including the current portion)
was recorded in the carrying amount of yen20515 million
($186501 thousand) as of March 31 2019 As of March 31
2018 the relevant factory assets were recorded under property
plant and equipment in the carrying amount of yen11975 million
as land and of yen4022 million as buildings (net) while long-
term debt (including the current portion) was recorded in the
carrying amount of yen20687 million
k Long-lived assets
The Group reviews its long-lived assets for impairment
whenever events or changes in circumstance indicate that
the carrying amount of an asset or asset group may not be
recoverable An impairment loss is recognized if the carrying
amount of an asset or asset group exceeds the sum of the
undiscounted future cash f lows expected to result from
the continued use and eventual disposition of the asset or
asset group The impairment loss would be measured as the
amount by which the carrying amount of the asset exceeds its
recoverable amount which is the higher of the discounted cash
flows from the continued use and eventual disposition of the
asset or the net selling value at disposition
l Intangible assets
Intangible assets that are included in other assets are amortized
by the straight-line method Software costs are amortized over
five years
m Allowance for work in process on construction contracts
An allowance for work in process on construction contracts
is provided based on an estimate of the total loss in respect
to construction projects on which eventual losses are deemed
inevitable and the amounts of the loss can be reasonably
estimated Provisions and (reversal of provision) for work
in process on construction contracts in the amounts of yen140
million ($1272 thousand) and yen(394) million for the years
ended March 31 2019 and 2018 respectively were included in
cost of sales
n Provision for loss on orders received
A provision for loss on orders received except for construction
contracts is recorded based on an estimate of the total loss
in respect to contracts on which eventual losses are deemed
19
inevitable and the amounts of the loss can be reasonably
estimated
o Retirement and pension plans
The Company has a lump-sum retirement benefit plan a
defined contribution pension plan and a defined benefit pension
plan The Companyrsquos domestic consolidated subsidiaries have
similar retirement benefit plans
Liabilities for employeesrsquo retirement benefits are calculated
based on the projected benefit obligations and plan assets at
the consolidated balance sheet date The projected benefit
obligations are attributed to periods on a benefit formula basis
Prior service costs are amortized on a straight-line basis over
15 years which is within the average remaining service period
Actuarial gains and losses are amortized on a straight-line basis
mainly over 15 years which is within the average remaining
service period in the following the fiscal year
p Allowance for Polychlorinated Biphenyl (PCB) disposal expenses
An allowance for PCB disposal expenses has been provided
based on the published estimated disposal fee schedule issued
by the Japan Environmental Safety Corporation
q Provision for compensation for health damage from asbestos
A provision for compensation for health damage from asbestos
has been recorded based on the estimated compensation
amount for former employees who suffered health damage from
asbestos
r Income taxes
The provision for income taxes is computed based on the pretax
income included in the consolidated statement of operations
The asset and l iabi l it y approach is used to recognize
deferred tax assets and liabilities for the expected future tax
consequences of temporary differences between the carrying
amounts and the tax bases of assets and liabilities Deferred
taxes are measured by applying currently enacted tax rates to
the temporary differences
s Foreign currency transactions
All short-term and long-term monetary receivables and
payables denominated in foreign currencies are translated
into Japanese yen at the exchange rates at the consolidated
balance sheet date The foreign exchange gains and losses from
translation are recognized in the consolidated statement of
operations to the extent that they are not hedged by forward
exchange contracts
t Foreign currency financial statements
The balance sheet accounts of the consolidated foreign
subsidiaries are translated into Japanese yen at the current
exchange rate as of the consolidated balance sheet date except
for equity which is translated at the historical rate Revenue
and expense accounts of consolidated foreign subsidiaries
are translated into yen at the average exchange rate
Differences arising from such translation are shown as foreign
currency translation adjustments under accumulated other
comprehensive income in a separate component of equity
u RampD expenses
Expenses related to RampD activities are charged to income as
incurred RampD expenses amounted to yen1344 million ($12214
thousand) and yen1261 million for the years ended March
31 2019 and 2018 respectively and are included in general
and administrative expenses and manufacturing costs in the
accompanying consolidated statement of operations
v Per share information
Basic net income (loss) per share is computed by dividing
net income (loss) attributable to common shareholders by
the weighted-average number of shares of common stock
outstanding during the respective year Weighted-average
number of shares of common stock for the years ended March
31 2019 and 2018 were 14434 thousand shares Diluted net
income (loss) per share for the years ended March 31 2019
and 2018 was not applicable because the Company had no
dilutive common shares Cash dividends per share presented
in the accompanying consolidated statement of operations are
dividends applicable to the respective years including dividends
to be paid after the end of the year
Effective October 1 2018 the Company has implemented
a 1-for-10 reverse stock split of common stock Per share of
common stock is retroactively adjusted as if the reverse stock
split had been effected at the beginning of the fiscal year ended
March 31 2018
w Construction contracts
Construction revenue and construction costs are recognized
by the percentage-of-completion method if the outcome of a
construction contract can be estimated reliably When total
construction revenue total construction costs and the stage of
completion of the contract at the consolidated balance sheet
date can be reliably measured the outcome of a construction
contract is deemed to be estimated reliably If the outcome
of a construction contract cannot be reliably estimated the
completed-contract method should be applied When it is
probable that the total construction costs will exceed total
construction revenue an estimated loss on the contract should
be immediately recognized by providing for a loss on such
construction contracts
20
x Accounting changes and error corrections
Under ASBJ Statement No 24 ldquoAccounting Standard for
Accounting Changes and Error Correctionsrdquo and ASBJ
Guidance No 24 ldquoGuidance on Accounting Standard for
Accounting Changes and Error Correctionsrdquo accounting
treatments are required as follows (1) Changes in Accounting
PoliciesmdashWhen a new accounting policy is applied following
revision of an accounting standard the new policy is applied
retrospectively unless the revised accounting standard includes
specific transitional provisions in which case the entity shall
comply with the specific transitional provisions (2) Changes in
PresentationmdashWhen the presentation of financial statements
is changed prior-period financial statements are reclassified
in accordance with the new presentation (3) Changes in
Accounting EstimatesmdashA change in an accounting estimate
is accounted for in the period of the change if the change
affects that period only and is accounted for prospectively if
the change affects both the period of the change and future
periods (4) Corrections of Prior-Period ErrorsmdashWhen an error
in prior-period consolidated financial statements is discovered
those statements are restated
y New accounting pronouncement
Accounting Standard for Revenue Recognition etc
- Accounting Standard for Revenue Recognition (ASBJ
Statement No 29 issued on March 30 2018)
- Implementation Guidance on Accounting Standard for
Revenue Recognition (ASBJ Guidance No 30 issued on
March 30 2018)
(a) Overview
The International Accounting Standards Board (ldquoIASBrdquo) and
the Financial Accounting Standards Board (ldquoFASBrdquo) have
jointly developed a comprehensive accounting standard for
revenue recognition and issued it as converged guidance on
recognizing revenue in contracts with customers in May 2014
as IFRS 15 (IASB) and Topic 606 (FASB) respectively To
respond to both IFRS 15 and Topic 606 effective from the fiscal
years beginning on or after January 1 2018 and December
15 2017 respectively ASBJ has developed a comprehensive
accounting standard for revenue recognition and issued it with
the respective implementation guidance
In developing the accounting standard for revenue recognition
ASBJ basically integrated the core principle of IFRS 15 from a
comparability point of view of the financial statements which
is one of the benefits of ensuring consistency with IFRS 15
ASBJ on the other side considered additional alternative
treatments where current practices under Japanese GAAP are
to be reflected as far as such treatments would not significantly
impair international comparability
(b) Effective date
The above standard and guidance are scheduled to be applied
from the beginning of the fiscal year ending March 31 2022
(c) Effects of application of the standards
The effects of the application of the above standard and
guidance on the consolidated financial statements are currently
being assessed
z Change in presentation
Application of ldquoPartial Amendments to Accounting Standard for
Tax Effect Accountingrdquo
On February 16 2018 the ASBJ issued ASBJ Statement No 28
Partial Amendments to Accounting Standard for Tax Effect
Accounting which requires deferred tax assets and deferred
tax liabilities to be classified as investments and other assets
and long-term liabilities respectively Deferred tax assets were
previously classified as current assets and investments and other
assets and deferred tax liabilities were previously classified as
current liabilities and long-term liabilities under the previous
accounting standard The revised accounting standard is
effective for annual periods beginning on or after April 1 2018
The Group retrospectively applied the revised accounting
standard effective April 1 2018 and deferred tax assets of yen51
million which were previously classified as current assets as of
March 31 2018 have been reclassified as investments and other
assets in the accompanying consolidated balance sheet In
accordance with transitional treatment allowed for the adoption
of the revised accounting standard the note information
of valuation allowances for tax loss carryforwards and for
temporary differences for the year ended March 31 2018 was
not separately disclosed
21
3 NOTES AND ACCOUNTS RECEIVABLE
Notes and accounts receivable as of March 31 2019 and 2018 consisted of the following
Millions of Yen Thousands ofUS Dollars
2019 2018 2019Trade notes receivable yen 5022 yen 4848 $ 45654
- Unconsolidated subsidiary and associated companies 215 198 1956Trade accounts receivable 17600 16793 160001
- CJR unconsolidated subsidiary and associated companies 6054 6051 55040Other 911 640 8277Less allowance for doubtful accounts (46) (4) (415)
Total yen 29756 yen 28526 $ 270513
Note Allowance for doubtful accounts was not recognized for accounts receivable-other which was included in Other above
4 INVENTORIES
Inventories as of March 31 2019 and 2018 consisted of the following
Millions of Yen Thousands ofUS Dollars
2019 2018 2019Merchandise yen 224 yen 258 $ 2039Finished goods 1303 1642 11841Work in process and semi-finished goods 28676 23450 260695Raw materials 1281 1355 11644
Total yen 31484 yen 26705 $ 286219
Work in process and allowance for work in process on construction contracts are presented in the gross amount in the consolidated balance sheet At March 31 2019 and 2018 allowance for work in process on construction contracts of yen80 million ($725 thousand) and none respectively was provided and included in work in process and semi-finished goods above
5 INVESTMENT SECURITIES
Investment securities as of March 31 2019 and 2018 consisted of the following
Millions of Yen Thousands ofUS Dollars
2019 2018 2019Equity securities yen 20381 yen 18632 $ 185281
Total yen 20381 yen 18632 $ 185281
The costs and aggregate fair values of investment securities as of March 31 2019 and 2018 were as follows
Millions of Yen2019
Cost Gross unrealized gains
Gross unrealized losses
Fair and carrying value
Securities classified as available-for-saleEquity securities yen 6063 yen 12743 yen (25) yen 18781
Total yen 6063 yen 12743 yen (25) yen 18781
22
Millions of Yen2018
Cost Gross unrealized gains
Gross unrealized losses
Fair and carrying value
Securities classified as available-for-saleEquity securities yen 6059 yen 10965 yen - yen 17024
Total yen 6059 yen 10965 yen - yen 17024
Thousands of US Dollars2019
Cost Gross unrealized gains
Gross unrealized losses
Fair and carrying value
Securities classified as available-for-saleEquity securities $ 55117 $ 115842 $ (226) $ 170733
Total $ 55117 $ 115842 $ (226) $ 170733
The information of available-for-sale securities which were sold for the years ended March 31 2019 and 2018 was as follows
Millions of Yen2019
Proceeds Realized gains Realized lossesAvailable-for-sale
Equity securities yen 10 yen 3 yen (0)Total yen 10 yen 3 yen (0)
Millions of Yen2018
Proceeds Realized gains Realized lossesAvailable-for-sale
Equity securities yen 100 yen 54 yen -Total yen 100 yen 54 yen -
Thousands of US Dollars2019
Proceeds Realized gains Realized lossesAvailable-for-sale
Equity securities $ 90 $ 31 $ (9)Total $ 90 $ 31 $ (9)
No impairment losses were recognized on available-for-sale equity securities for the years ended March 31 2019 and 2018
6 NOTES AND ACCOUNTS PAYABLE
Notes and accounts payable as of March 31 2019 and 2018 consisted of the following
Millions of Yen Thousands ofUS Dollars
2019 2018 2019Trade notes payable yen 1418 yen 1208 $ 12890Electronically recorded obligations-operating 10670 10667 96993-Unconsolidated subsidiary and associated companies 25 17 226Trade accounts payable 8001 10323 72740-Unconsolidated subsidiary and associated companies 94 50 857Other 2704 2580 24581
Total yen 22912 yen 24845 $ 208287
23
7 SHORT-TERM BORROWINGS AND LONG-TERM DEBT
There was no balance of short-term borrowings as of March 31 2019 and 2018
Long-term debt as of March 31 2019 and 2018 consisted of the following
Millions of Yen Thousands ofUS Dollars
2019 2018 2019Loans from CJR due through 2027 (Note) with average interest rate of 061 yen 55515 yen 55687 $ 504684
Less current portion (296) (287) (2688)Total yen 55219 yen 55400 $ 501996
The aggregate annual maturities of long-term debt as of March 31 2019 were as follows
Years ending March 31 Millions of Yen Thousands of US Dollars
2020 - -2021 - -2022 yen 2900 $ 263642023 2900 263642024 2900 263642025 and thereafter 26300 239090
Total yen 35000 $ 318182
Note Long-term debt recorded for the transfer price of the factory assets transferred to CJR and for a part of capital expenditure related to the transferred factory assets in the total amount of yen20219 million ($183814 thousand) was not reflected
8 RETIREMENT AND PENSION PLANS
Employees who terminate their service with the Company and its domestic consolidated subsidiaries are entitled to retirement benefits generally determined by reference to the basic rate of pay at the time of termination length of service and conditions under which the termination occurs The Company has a lump-sum retirement benefit plan a defined contribution pension plan and a defined benefit pension plan which are assumed to cover retirement benefits for employees who have retired voluntarily The Company contributed certain assets to the employee retirement benefit trust The Companyrsquos domestic consolidated subsidiaries have similar retirement benefit plans
(1) Defined benefit plans
(a) The changes in defined benefit obligation for the years ended March 31 2019 and 2018 were as follows
Millions of Yen Thousands ofUS Dollars
2019 2018 2019Balance at beginning of year yen 13359 yen 13445 $ 121448
Current service cost 738 724 6709Interest cost 118 119 1071Actuarial gains (93) (42) (844) Benefits paid (484) (838) (4406) Prior service cost - (49) -
Balance at end of year yen 13638 yen 13359 $ 123978
Note The domestic consolidated subsidiaries of the Company apply the simplified method in calculating the defined benefit obligation
24
(b) The changes in plan assets for the years ended March 31 2019 and 2018 were as follows
Millions of Yen Thousands ofUS Dollars
2019 2018 2019Balance at beginning of year yen 18710 yen 17269 $ 170088
Expected return on plan assets 245 232 2232 Actuarial gains 2123 1305 19300 Contribution from the employer 380 383 3449 Benefits paid (202) (479) (1838)
Balance at end of year yen 21256 yen 18710 $ 193231
(c) Reconciliation between the liability (asset) recorded in the consolidated balance sheet and the balances of defined benefit obligation and plan assets as of March 31 2019 and 2018 was as follows
Millions of Yen Thousands ofUS Dollars
2019 2018 2019Funded defined benefit obligation yen 13346 yen 13086 $ 121322 Plan assets (21256) (18709) (193231)
Total (7910) (5623) (71909)Unfunded defined benefit obligation 292 273 2656 Net asset arising from defined benefit obligation yen (7618) yen (5350) $ (69253)
Asset for employeesrsquo retirement benefits yen (7910) yen (5623) $ (71909)Liability for employeesrsquo retirement benefits 292 273 2656 Net asset arising from defined benefit obligation yen (7618) yen (5350) $ (69253)
(d) The components of net periodic benefit costs for the years ended March 31 2019 and 2018 were as follows
Millions of Yen Thousands ofUS Dollars
2019 2018 2019Service cost (Note) yen 738 yen 728 $ 6709 Interest cost 118 118 1071 Expected return on plan assets (245) (232) (2232)Recognized actuarial gains (640) (426) (5817)Amortization of prior service cost (8) (5) (70)Net periodic benefit costs yen (37) yen 183 $ (339)
Note Retirement benefit costs of the consolidated subsidiaries applying the simplified method are included in service cost
(e) Amounts recognized in other comprehensive income (before income tax effect) in respect of defined retirement benefit plans for the years ended March 31 2019 and 2018
Millions of Yen Thousands ofUS Dollars
2019 2018 2019Prior service cost yen 8 yen (44) $ 70Actuarial (gains) losses (1576) (920) (14329)
Total yen (1568) yen (964) $ (14259)
25
(f) Amounts recognized in accumulated other comprehensive income (before income tax effect) in respect of defined retirement benefit plans as of March 31 2019 and 2018
Millions of Yen Thousands ofUS Dollars
2019 2018 2019Unrecognized prior service cost yen (71) yen (79) $ (647)Unrecognized actuarial gains (6749) (5173) (61355)
Total yen (6820) yen (5252) $ (62002)
(g) Plan assets
(i) Components of plan assets Plan assets consisted of the following
2019 2018Debt investments 12 14Equity investments 80 78Cash and deposits 3 3Other 5 5
Total 100 100
Note The employeesrsquo retirement benefit trusts for the contributory pension plans accounted for 18 of total plan assets for the years ended March 31 2019 and 2018
(ii) Method of determining the expected rate of return on plan assetsThe expected rate of return on plan assets is determined considering the current and future asset portfolio and the long-term rates of return which are expected currently and in the future from the various components of the plan assets
(h) Assumptions used for the years ended March 31 2019 and 2018 were set forth as follows
2019 2018Discount rate 09 09Expected rate of return on plan assets 20 20
(2) Defined contribution plans
The required contribution of the Company and its consolidated subsidiaries amounted to yen139 million ($1265 thousand) and yen133 million for the years ended March 31 2019 and 2018 respectively
26
9 ASSETS PLEDGED AS COLLATERAL
(1)Assets pledged as collateral for long-term debt from CJR in the amount of yen35000 million ($318182 thousand) for the payment of settlement money related to a large railway rolling stock project in the USA as of March 31 2019 and 2018 were as follows
Millions of Yen Thousands ofUS Dollars
2019 2018 2019Buildings and structures yen 261 yen 277 $ 2372Land 15 15 136Investment securities 12606 12338 114598
Total yen 12882 yen 12630 $ 117106
(2)Other assets pledged as collateral as of March 31 2019 and 2018 were as follows
Millions of Yen Thousands ofUS Dollars
2019 2018 2019Other current assets (Note 1) yen 56 yen 56 $ 505Other assets under Investments and Other Assets (Note 2) 10 10 91Investment securities (Note 3) 5887 4487 53525
Total yen 5953 yen 4553 $ 54121
Notes 1 Deposit required by insurance contracts 2 Guarantee deposit required by the Building Lots and Buildings Transaction Business Law 3 Deposit for letter of credit
10 CONTINGENT LIABILITIES
In some cases the Company sells its construction equipment products through leasing companies Some of these leasing companies request that the Company enters into lease credit guarantee contracts Under these contracts if the lease credits are unrecoverable from users of the Companyrsquos construction equipment products the Company guarantees payment of the amount defined by the contract to the leasing companies Such guarantees as of March 31 2019 and 2018 amounted to yen226 million ($2056 thousand) and yen389 million respectively
11 LEASE TRANSACTIONS
The Group uses certain machinery and equipment under finance lease contracts
All finance lease transactions are accounted for in a manner similar to ordinary sale or purchase transactions
The aggregate annual maturities of lease obligations as of March 31 2019 were as follows
Years ending March 31 Millions of Yen Thousands ofUS Dollars
2020 yen 678 $ 6168 2021 651 5913 2022 665 6045 2023 244 2221 2024 90 817 2025 and thereafter - -
Total yen 2328 $ 21164
27
A consolidated subsidiary subleases machinery
Investments in leases and lease obligations which include an interest portion resulting from sublease transactions as of March 31 2019 and 2018 were as follows
Millions of Yen Thousands ofUS Dollars
2019 2018 2019 Investments in leases
Due within one year yen 122 yen 154 $ 1112Due after one year 205 327 1859
Total yen 327 yen 481 $ 2971
Millions of Yen Thousands ofUS Dollars
2019 2018 2019Lease obligations
Due within one year yen 140 yen 170 $ 1272 Due after one year 235 375 2139
Total yen 375 yen 545 $ 3411
12 EQUITY
Japanese companies are subject to the Companies Act of Japan (the ldquoCompanies Actrdquo) The significant provisions in the Companies Act that affect financial and accounting matters are summarized below
(1) Dividends
Under the Companies Act companies can pay dividends at any time during the fiscal year in addition to the year-end dividend upon resolution at the shareholdersrsquo meeting Additionally for companies that meet certain criteria including (1) having a Board of Directors (2) having independent auditors (3) having an Audit amp Supervisory Board and (4) the term of service of the directors being prescribed as one year rather than the normal two-year term by its articles of incorporation the Board of Directors may declare dividends (except for dividends-in-kind) at any time during the fiscal year if the company has prescribed so in its articles of incorporation However the Company cannot do so because it does not meet all the above criteria
The Companies Act permits companies to distribute dividends-in-kind (noncash assets) to shareholders subject to a certain limitation and additional requirements
Semiannual interim dividends may also be paid once a year upon resolution by the Board of Directors if the articles of incorporation of the company so stipulate The Companies Act provides certain limitations on the amounts available for dividends or the purchase of treasury stock The limitation is defined as the amount available for distribution to the shareholders but the amount of net assets after dividends must be maintained at no less than yen3 million
(2) Increasesdecreases and transfer of common stock reserve and surplus
The Companies Act requires that an amount equal to 10 of dividends must be appropriated as a legal reserve (a component of retained earnings) or as additional paid-in capital (a component of capital surplus) depending on the equity account charged upon the payment of such dividends until the aggregate amount of legal reserve and additional paid-in capital equals 25 of the common stock Under the Companies Act the total amount of additional paid-in capital and legal reserve may be reversed without limitation The Companies Act also provides that common stock legal reserve additional paid-in capital other capital surplus and retained earnings can be transferred among the accounts within equity under certain conditions upon resolution of the shareholders
28
(3) Treasury stock and treasury stock acquisition rights
The Companies Act also provides for companies to purchase treasury stock and dispose of such treasury stock by resolution of the Board of Directors The amount of treasury stock purchased cannot exceed the amount available for distribution to the shareholders which is determined by a specific formula Under the Companies Act stock acquisition rights are presented as a separate component of equity The Companies Act also provides that companies can purchase both treasury stock acquisition rights and treasury stock Such treasury stock acquisition rights are presented as a separate component of equity or deducted directly from stock acquisition rights
Effective June 28 2018 the Company transferred capital surplus to retained earnings based on the resolution of the Shareholdersrsquo Meeting held on June 28 2018
Effective October 1 2018 the Company has implemented a 1-for-10 reverse stock split of common stock based on the resolution of the Shareholdersrsquo Meeting held on June 28 2018
13 INCOME TAXES
The Company and its domestic subsidiaries are subject to Japanese national and local income taxes which in the aggregate resulted in a normal effective statutory tax rate of approximately 302 and 305 for the years ended March 31 2019 and 2018 respectively
The tax effects of significant temporary differences and tax loss carryforwards that resulted in deferred tax assets and liabilities as of March 31 2019 and 2018 were as follows
Millions of Yen Thousands ofUS Dollars
2019 2018 2019
Deferred tax assetsTax loss carryforwards (Note 2) yen 3630 yen 3642 $ 32999 Liability for employeesrsquo retirement benefits 2510 2528 22815 Loss on write-downs of inventories 1761 2101 16013 Land and building of plants 1458 1487 13253 Loss on impairment of fixed assets 1155 1218 10502 Accrued bonuses to employees 485 446 4411 Provision for loss on orders received 273 1682 2485 Other 1834 2352 16664
Sub-total 13106 15456 119142
Less valuation allowance for tax loss crryforwards (Note 2) (3630) - (32999)
Less valuation allowance pertaining to total amount of deductible temporary differences (7974) - (72493)Valuation allowance total (Note 1) (11604) (15320) (105492)
Total yen 1502 yen 136 $ 13650
Deferred tax liabilitiesUnrealized gain on available-for-sale securities yen (3842) yen (3308) $ (34924)Deferred gain on sales of property - (22) -Other (3549) (2903) (32264)
Total (7391) (6233) (67188)Net deferred tax liabilities yen (5889) yen (6097) $ (53538)
Notes 1 Valuation allowance decreased by yen3716 million ($33779 thousand) during the year ended March 31 2019 This is mainly due to the decrease of deductible temporary differences on the one hand On the other hand the respective deferred tax assets related to tax loss carryforwards were partly judged as recoverable as a result of careful consideration taking into account the current and estimated future taxable income
2 Expected maturity of the deferred tax assets after the balance sheet date for tax loss carryforwards as of March 31 2019 was as follows
29
The expiration of tax loss carryforwards the related valuation allowances and the resulting net deferred tax assets as of March 31 2019 were as follows
Millions of Yen
2019 Within 1 year
Over 1 year but within
2 years
Over 2 years but within
3 years
Over 3 years but within
4 years
Over 4 years but within
5 years
Over 5 years Total
Deferred tax assets relating to tax loss carryforwards () - - - - - yen 3630 yen 3630
Less valuation allowance for tax loss carry forwards - - - - - (3630) (3630)
Net deferred tax assets relating to tax loss carry forwards - - - - - - -
Thousands of US Dollars
2019 Within 1 year
Over 1 year but within
2 years
Over 2 years but within
3 years
Over 3 years but within
4 years
Over 4 years but within
5 years
Over 5 years Total
Tax loss carryforwards () - - - - - $ 32999 $ 32999
Valuation allowance - - - - - (32999) (32999)
Deferred tax assets - - - - - - -
()The amount of tax loss carryforwards was calculated by using the statutory tax rate
A reconciliation between the normal effective statutory tax rates and the actual effective tax rates reflected in the accompanying consolidated statement of operations for the year ended March 31 2019 with the corresponding figures for 2018 is as follows
2019 2018Normal effective statutory tax rate 302 305 Increase (decrease) due to
Expenses not deductible for income tax purposes 39 (290)Tax-exempt income (03) 02Changes in valuation allowance (376) 156Per capita inhabitant tax 04 (03)Transfer price adjustments on consolidation (54) 91Higher (lower) income tax rates applicable to income in certain foreign countries 18 (07)
Other (09) 12Actual effective income tax rate (79) 266
14 FINANCIAL INSTRUMENTS AND RELATED DISCLOSURES
(1) Group policy for financial instruments
The Group finances capital investments and necessary funds mainly internally and with CMS provided by a consolidated subsidiary of CJR The Company also operates funds by utilizing CMS Derivative transactions are used not for speculative purposes but to manage exposure to financial risks as described in (2) below
(2) Nature and extent of risks arising from financial instruments
Receivables such as notes and accounts receivable are exposed to customer credit risk Although receivables in foreign currencies are exposed to the risk of fluctuation in foreign currency exchange rates the position net of payables in foreign currencies is hedged by using forward foreign currency contracts Investment securities mainly equity instruments of customers and suppliers of the Group are exposed to the risk of market price fluctuations
30
Payment terms of payables such as trade notes and trade accounts are less than one year Although payables in foreign currencies are exposed to the risk of fluctuation in foreign currency exchange rates the position net of receivables in foreign currencies is hedged by using forward foreign currency contracts
Long-term debt recorded for the transfer price of the factory assets transferred to CJR and for a part of capital expenditure related to the transferred factory assets is not exposed to market risks from changes in variable interest rates since the Company repays a constant lease fee including the interest portion based on the lease agreement Long-term debt from CJR for the payment of settlement money related to a large railway rolling stock project in the USA is also not exposed to market risks from changes in variable interest rates due to the fixed interest rate Lease obligations are primarily used for financing capital investments
Derivatives mainly include forward foreign currency contracts which are used to manage exposure to risks associated with fluctuations in foreign currency exchange rates related to receivables and payables denominated in foreign currencies and forecasted transactions denominated in foreign currencies Please see Note 15 for more information about derivatives
(3)Risk management for financial instruments
Credit risk management
Credit risk is the risk of economic loss arising from a counterpartyrsquos failure to repay or service debt according to the contractual terms The Group manages its credit risk from receivables by monitoring financial position payment terms and balances of customers to identify default risk of customers at an early stage
Market risk management (foreign exchange risk and interest rate risk)
Foreign currency trade receivables and payables are exposed to market risk resulting from fluctuations in foreign currency exchange rates Such foreign exchange risk is hedged principally by forward foreign currency contracts In addition when foreign currency trade receivables and payables are expected from forecasted transactions forward foreign currency contracts may be used
Investment securities are managed by monitoring the market values and the financial position of issuers on a regular basis
Liquidity risk management
The Group establishes or updates its cash management plan according to the monthly cash management plan from each subsidiary in order to monitor its liquidity risk associated with operating payables and short-term borrowings and long-term debt
(4)Fair values of financial instruments
Fair values of financial instruments are based on quoted prices in active markets If quoted prices are not available other rational valuation techniques are used instead Please see Note 15 for the details of the fair value of derivatives
(a) Fair value of financial instrumentsMillions of Yen
2019Carrying amount Fair value Unrealized
gain (loss)Cash and cash equivalents yen 12721 yen 12721 -Notes and accounts receivable 29756 29756 -Investment securities 18781 18781 -
Total yen 61258 yen 61258 -
Notes and accounts payable yen 22912 yen 22912 -Income taxes payable 538 538 -Long-term debt including current portion 35000 35609 yen (609)Lease obligations including current portion 2328 2315 13
Total yen 60778 yen 61374 yen (596)
31
Millions of Yen2018
Carrying amount Fair value Unrealized
gain (loss)Cash and cash equivalents yen 15837 yen 15837 -Notes and accounts receivable 28526 28526 -Investment securities 17024 17024 -
Total yen 61387 yen 61387 -
Notes and accounts payable yen 24845 yen 24845 -Income taxes payable 132 132 -Long-term debt including current portion 35000 35127 yen (127)Lease obligations including current portion 2473 2454 19
Total yen 62450 yen 62558 yen (108)
Thousands of US Dollars2019
Carrying amount Fair value Unrealized
gain (loss)Cash and cash equivalents $ 115645 $ 115645 -Notes and accounts receivable 270513 270513 -Investment securities 170733 170733 -
Total $ 556891 $ 556891 -
Notes and accounts payable $ 208287 $ 208287 -Income taxes payable 4888 4888 -Long-term debt including current portion 318183 323721 $ (5538)Lease obligations including current portion 21164 21046 118
Total $ 552522 $ 557942 $ (5420)
AssetsCash and cash equivalents and notes and accounts receivableThe carrying values of cash and cash equivalents and notes and accounts receivable approximate fair value because of their short maturities
Investment securitiesThe fair values of investment securities are measured at the quoted market prices of the stock exchange The information on the fair value of investment securities by classification is included in Note 5
LiabilitiesNotes and accounts payable and income taxes payableThe carrying values of notes and accounts payable and income taxes payable approximate fair value since they are scheduled to be settled in a short period of time
Long-term debt and lease obligationsThe fair values of long-term debt (including the current portion) and lease obligations are measured at the present value of the total of the principal and interest discounted by the interest rate applied to new loans
Derivative transactionsInformation on the fair value of derivatives is included in Note 15
32
(b)Carrying amount of financial instruments whose fair value cannot be reliably determined
Millions of Yen Thousands ofUS Dollars
2019 2018 2019Unlisted securities yen 1600 yen 1608 $ 14548Investments in an unconsolidated subsidiary and
associated companies 795 728 7226
Long-term debt recorded for the transfer price of the factory assets transferred to CJR and for a part of capital expenditure related to the transferred factory assets (including the current portion)
20515 20687 186501
(5)Maturity analysis for financial assets and securities with contractual maturities
Millions of Yen2019
Due in one year or less
Due after one year through
five years
Due after five years through
10 years
Due after 10 years
Cash and cash equivalents yen 12721 - - -Notes and accounts receivable 29402 yen 354 yen - -
Total yen 42123 yen 354 yen - -
Thousands of US Dollars2019
Due in oneyear or less
Due after one year through
five years
Due after five years through
10 years
Due after 10 years
Cash and cash equivalents $ 115645 - - -Notes and accounts receivable 267294 $ 3219 $ - -
Total $ 382939 $ 3219 $ - -
Please see Note 7 for annual maturities of long-term debt and Note 11 for obligations under finance leases
15 DERIVATIVE TRANSACTIONS
The Group enters into forward foreign currency contracts to hedge foreign exchange risk associated with certain assets and liabilities denominated in foreign currencies
All derivative transactions are entered into to hedge interest and foreign currency exposures incorporated within its business Accordingly market risk in these derivatives is basically offset by opposite movements in the value of hedged assets or liabilities
Derivative transactions entered into by the Group have been made in accordance with internal policies which regulate the authorization and credit limit amount
33
There was no derivative transaction to which hedge accounting was applied for the year ended March 31 2019 Derivative transactions to which hedge accounting was applied for the year ended March 31 2018 were as follows
Millions of Yen2018
Hedgeditem
Contractamount
Contract amount due
after one yearFairvalue
CurrencyForward foreign currency contracts
Buying
USD Advance payments yen 152 - yen (8)
16 LOSS ON IMPAIRMENT OF PROPERTY PLANT AND EQUIPMENT
The Group recognized impairment losses on the following asset groups
For the year ended March 31 2019Millions of Yen Thousands of US Dollars
Asset group Location Account 2019 2019Idle assets Shinanomachi Nagano Land yen 14 $ 133Idle assets Nagoya Aichi Buildings and structures etc 17 153Idle assets Illinois USA Machinery and equipment 239 2170
Total yen 270 $ 2456
For the year ended March 31 2018Millions of Yen
Asset group Location Account 2018
Idle assets Nakatsugawa Gifu Buildings and structures land etc yen 34
Total yen 34
The Group reviewed its long-lived assets for impairment as of March 31 2019 and 2018
For the years ended March 31 2019 and 2018 the Group recognized an impairment loss for idle assets by writing down the property to its net selling value (based on reasonably adjusted amount of property tax assessment value)
Upon the decision to close the manufacturing plant of an US subsidiary NIPPON SHARYO USA INC in Rochelle Illinois USA on July 24 2018 the sale of the plant to a third party has been considered Therefore we recognized an impairment loss on the manufacturing plant at its net selling value for the year ended March 31 2019
Impairment losses other than the above were not disclosed as they were immaterial
17 RELATED-PARTY DISCLOSURES
(1)Parent and major shareholders
CJR directly owned 512 of the total shares of the Company as of March 31 2019 and 2018 The Company distributes transportation vehicles to CJR
34
Transactions of the Company with CJR for the years ended March 31 2019 and 2018 were as follows
For the year ended March 31 2019 Millions of Yen Thousands ofUS Dollars
2019 2019Sales yen 19955 $ 181413Borrowing of funds 117 1072Repayment of debt 289 2631Interest expense 337 3067
Borrowing of funds repayment of debt and interest expense of yen117 million ($1072 thousand) yen289 million ($2631 thousand) and yen127 million ($1158 thousand) respectively were recorded for the transfer of the factory assets transferred to CJR and for a part of capital expenditure related to the transferred factory assets
For the year ended March 31 2018 Millions of Yen
2018Sales yen 24001Borrowing of funds 56000Repayment of debt 313Interest expense 193
Borrowing of funds repayment of debt and interest expense of yen21000 million yen313 million and yen122 million respectively were recorded for the transfer of the factory assets transferred to CJR and for a part of capital expenditure related to the transferred factory assets
The balances due to or from CJR as of March 31 2019 and 2018 were as follows
As of March 31 2019 Millions of Yen Thousands ofUS Dollars
2019 2019Accounts receivable yen 5993 $ 54483Current portion of long-term debt 296 2688Long-term debt 55219 501996Accrued expenses 43 392
Current portion of long-term debt long-term debt and accrued expenses of yen296 million ($2688 thousand) yen20220 million ($183815 thousand) and yen42 million ($381 thousand) respectively were the balances related to long-term debt for the transfer price of the factory assets transferred to CJR and for a part of capital expenditure related to the transferred factory assets
As of March 31 2018 Millions of Yen
2018Accounts receivable yen 5947Current portion of long-term debt 287Long-term debt 55400Accrued expenses 43
Current portion of long-term debt long-term debt and accrued expenses of yen287 million yen20400 million and yen42 million respectively were the balances related to long-term debt for the transfer price of the factory assets transferred to CJR and for a part of capital expenditure related to the transferred factory assets
(2)Fellow subsidiaries and subsidiaries of other affiliates
35
Transactions of the Company with the fellow subsidiaries for the years ended March 31 2019 and 2018 were as follows
For the year ended March 31 2019Millions of Yen Thousands of
US Dollars2019 2019
JR Central Financial Management Co Ltd Interest income yen 5 $ 45
For the year ended March 31 2018Millions of Yen
2018JR Central Financial Management Co Ltd Interest income yen 2
The balances due to or from the fellow subsidiaries as of March 31 2019 and 2018 were as follows
As of March 31 2019Millions of Yen Thousands of
US Dollars2019 2019
JR Central Financial Management Co LtdCash and cash equivalents yen 7398 $ 67255
As of March 31 2018Millions of Yen
2018JR Central Financial Management Co LtdCash and cash equivalents yen 7534
36
18 OTHER COMPREHENSIVE INCOME
The components of other comprehensive income for the years ended March 31 2019 and 2018 were as follows
Millions of Yen Thousands of US Dollars
2019 2018 2019Unrealized gain on available-for-sale securities
Gains arising during the year yen 1753 yen 1131 $ 15938Reclassification adjustments to profit or loss - (0) -Amount before income tax effect 1753 1131 15938Income tax effect (533) (354) (4848)
Total yen 1220 yen 777 $ 11090Deferred gain (loss) on derivatives under hedge accounting
Gains (losses) arising during the year yen 8 yen (5) $ 69Income tax effect - - -
Total yen 8 yen (5) $ 69Foreign currency translation adjustments
Adjustments arising during the year yen (33) yen (105) $ (301)Total yen (33) yen (105) $ (301)
Defined retirement benefit plansAdjustments arising during the year yen 2216 yen 1396 $ 20145Reclassification adjustments to profit or loss (648) (432) (5887)Amount before income tax effect 1568 964 14258Income tax effect (475) (296) (4320)
Total yen 1093 yen 668 $ 9938Share of other comprehensive (loss) income in associated companies
Gains arising during the year yen (9) yen 36 $ (81)Income tax effect - - -
Total yen (9) yen 36 $ (81)
Total other comprehensive income yen 2279 yen 1371 $ 20715
19 SEGMENT INFORMATION
Under ASBJ Statement No 17 ldquoAccounting Standard for Segment Information Disclosuresrdquo and ASBJ Guidance No 20 ldquoGuidance on Accounting Standard for Segment Information Disclosuresrdquo an entity is required to report financial and descriptive information about its reportable segments Reportable segments are operating segments or aggregations of operating segments that meet specified criteria Operating segments are components of an entity about which separate financial information is available and such information is evaluated regularly by the chief operating decision maker in deciding how to allocate resources and in assessing performance Generally segment information is required to be reported on the same basis as is used internally for evaluating operating segment performance and deciding how to allocate resources to operating segments
(1)Description of reportable segments
The Grouprsquos reportable segments are those for which separate financial information is available and regular evaluation by the Companyrsquos management is being performed in order to decide how resources are allocated among the Group
The Group has operational headquarters by each product or service Each of the operational headquarters develops comprehensive strategies and engages in business activities relating to each product and service Accordingly the Group is comprised of segments organized by products or services based on the operational headquarters and there are four reportable segments ldquoRailway Rolling Stockrdquo ldquoTransportation Equipment and Steel Structurerdquo ldquoConstruction Equipmentrdquo and ldquoEngineeringrdquo
37
ldquoRailway Rolling Stockrdquo consists of manufacture and sales of rolling stock such as EMUs and railway motor cars
ldquoTransportation Equipment and Steel Structurerdquo consists of manufacture and sales of transportation equipment such as freight cars tank trucks heavy-duty industrial vehicles and manufacture and construction of roadway and railway bridges
ldquoConstruction Equipmentrdquo consists of manufacture and sales of pile driving rigs crawler cranes casing rotators portable diesel generator sets and emergency generators
ldquoEngineeringrdquo consists of manufacture and sales of railway rolling stock inspectionmaintenance systems agricultural plants and pulp and paper plants
(2)Method of measurement for the amount of sales profit (loss) assets and other items for each reportable segment
The accounting policies of each reportable segment are consistent with those disclosed in Note 2 ldquoSummary of Significant Accounting Policiesrdquo Reporting segment profit represents operating income Intersegment transactions are based upon armrsquos-length transactions
(3)Information of sales profit (loss) assets and other items was as follows
Millions of Yen2019
Reportable segmentRailway Rolling Stock
Transportation Equipment and Steel Structure
Construction Equipment Engineering Other Total Reconciliations Consolidated
Net salesSales to external customers yen 38049 yen 21794 yen 25167 yen 6006 yen 163 yen 91179 - yen 91179Intersegment sales or transfers 129 187 13 67 185 581 yen (581) -
Total yen 38178 yen 21981 yen 25180 yen 6073 yen 348 yen 91760 yen (581) yen 91179
Segment profit (loss) yen 2034 yen 2040 yen 4887 yen 386 yen (27) yen 9320 yen (820) yen 8500Segment assets yen 47448 yen 22556 yen 22978 yen 2906 yen 645 yen 96533 yen 37661 yen 134194Other
Depreciation yen 1046 yen 276 yen 779 yen 15 yen 2 yen 2118 yen 252 yen 2370Increase in property plant and
equipment and intangible assets 1010 937 740 22 2 2711 160 2871
Millions of Yen2018
Reportable segmentRailway Rolling Stock
Transportation Equipment and Steel Structure
Construction Equipment Engineering Other Total Reconciliations Consolidated
Net salesSales to external customers yen 41455 yen 22475 yen 24573 yen 6560 yen 248 yen 95311 - yen 95311Intersegment sales or transfers 261 331 10 23 192 817 yen (817) -
Total yen 41716 yen 22806 yen 24583 yen 6583 yen 440 yen 96128 yen (817) yen 95311
Segment profit (loss) yen 1413 yen 1991 yen 5270 yen (75) yen (93) yen 8506 yen (1240) yen 7266Segment assets yen 46176 yen 19734 yen 22724 yen 4684 yen 669 yen 93987 yen 33426 yen 127413Other
Depreciation yen 1340 yen 319 yen 760 yen 14 yen 2 yen 2435 yen 293 yen 2728Increase in property plant and
equipment and intangible assets 563 143 962 5 0 1673 107 1780
38
Thousands of US Dollars2019
Reportable segmentRailway Rolling Stock
Transportation Equipment and Steel Structure
Construction Equipment Engineering Other Total Reconciliations Consolidated
Net salesSales to external customers $ 345904 $ 198128 $ 228791 $ 54601 $ 1480 $ 828904 - $ 828904Intersegment sales or transfers 1169 1696 122 608 1682 5277 $ (5277) -
Total $ 347073 $ 199824 $ 228913 $ 55209 $ 3162 $ 834181 $ (5277) $ 828904
Segment profit (loss) $ 18494 $ 18548 $ 44423 $ 3512 $ (248) $ 84729 $ (7459) $ 77270Segment assets $ 431340 $ 205056 $ 208891 $ 26422 $ 5859 $ 877568 $ 342384 $ 1219952Other
Depreciation $ 9513 $ 2515 $ 7080 $ 133 $ 14 $ 19255 $ 2294 $ 21549Increase in property plant and
equipment and intangible assets 9186 8514 6725 202 15 24642 1461 26103
Notes 1 ldquoOtherrdquo represents businesses that are not included in any reportable segment which includes manufacture and sales of laser processing system sales of railroad-related merchandise and real estate rental
2 ldquoReconciliationsrdquo in segment profit (loss) include corporate expenses of yen(854) million ($(7766) thousand) and yen(1294) million for the years ended March 31 2019 and 2018 respectively elimination of intersegment transactions of yen27 million ($246 thousand) and yen42 million for the years ended March 31 2019 and 2018 Corporate expenses principally consist of general and administrative expenses that are not attributable to any reportable segment
3 ldquoReconciliationsrdquo in segment assets include total corporate assets of yen32158 million ($292350 thousand) and yen29889 million elimination of intersegment balances of yen(116) million ($(1051) thousand) and yen(136) million and adjustments in inventories of yen(61) million ($(556) thousand) and yen(68) million as of March 31 2019 and 2018 respectively Total corporate assets principally consist of investment securities and general management properties as of March 31 2019 and 2018
4 Segment profit (loss) is reconciled to operating income in the consolidated statement of operations
Associated Information
(1) Information about products and services is not disclosed since similar information is disclosed above
(2) Information about geographical areas for the year ended March 31 2019 was as follows
Millions of Yen2019
Japan USA Asia Other TotalNet sales yen 81477 yen 156 yen 9503 yen 43 yen 91179
Note Sales are based on the location of the customers and grouped by country or area
Information about net sales by geographical areas for the year ended March 31 2018 is not disclosed since net sales to external customers in Japan exceeds 90 of consolidated net sales
Millions of Yen2019
Japan USA Asia Other TotalProperty plant and equipment yen 24784 yen 3630 yen 0 yen 0 yen 28414
39
Millions of Yen2018
Japan USA Asia Other TotalProperty plant and equipment yen 24306 yen 4258 yen 0 yen 0 yen 28564
Thousands of US Dollars2019
Japan USA Asia Other TotalProperty plant and equipment $ 225304 $ 33001 $ 1 $ 0 $ 258306
(3) Information about major customers Net sales
Millions of Yen Thousands of US Dollars
Relatedsegment
Name of major customer 2019 2018 2019
CJR yen 19955 yen 24001 $ 181413Railway Rolling Stock
Transportation Equipment and Steel Structure
(4) Information about loss on impairment of property plant and equipment by reportable segment
Millions of Yen2019
Reportable segmentRailwayRolling Stock
TransportationEquipment andSteel Structure
ConstructionEquipment
Engineer-ing Other Total
Recon-ciliations
Consoli-dated
Impairment loss yen 238 - - - - yen 238 32 yen 270
Millions of Yen2018
Reportable segmentRailwayRolling Stock
TransportationEquipment andSteel Structure
ConstructionEquipment
Engineer-ing Other Total
Recon-ciliations
Consoli-dated
Impairment loss yen - - - - - yen - 34 yen 34
Thousands of US Dollars2019
Reportable segmentRailwayRolling Stock
TransportationEquipment andSteel Structure
ConstructionEquipment
Engineer-ing Other Total
Recon-ciliations
Consoli-dated
Impairment loss $ 2168 - - - - $ 2168 288 $ 2456
Note The amount of ldquoReconciliationsrdquo is related to idle assets which are not attributable to any reporting segment
40
Corporate Profile
Line of Business
Overview of the Main SegmentsNIPPON SHARYO manufactures and sells the following products
Business segment Lines of business
Railway rolling stock EMUs DMUs Passenger Cars Linear Motor Cars Track Maintenance Machines Rolling Stock Components and Automated Guideway Transit Systems
Transportation equipment and Steel structure
Freight Cars Locomotives Tank Trucks Tank Trailers Storage Tanks Heavy-duty Industrial Vehicles Containers Automated Guided Vehicles Roadway Bridges Railway Bridges Water Gates
Construction equipmentPile Driving Rigs Crawler Cranes Hydraulic Hammers Casing Rotators Other Products Related to Foundation Work Portable Diesel Generator Sets Emergency Generators Various Products Related to Electric Machines
Engineering Agricultural Plants Grain Complex Seed Processing Plants Railway Rolling Stock InspectionMaintenance System Pulp and Paper Plants
OFFICE
PLANT
Company Name NIPPON SHARYO LTD
Capital Stock
Common StockAuthorized 32800000 shares
Common StockIssued 14675012 shares
Number of Shareholders 12509 persons
(March 31 2019)
Company History
Sep 1896 Established in Nagoya CityJun 1938 Founded Narumi PlantMay 1949 Re-listed on Tokyo Stock ExchangeJan 1959 Began Construction Machinery BusinessOct 1961 Started Bridge ManufacturingJul 1964 Founded Toyokawa PlantJun 1975 Founded Kinuura PlantSep 1996 100th AnniversaryAug 2008 Equity and business tie-up entered into with Central Japan Railway CompanyAug 2019 Manufactured 4000th Shinkansen EMU
HEAD OFFICE (NAGOYA)
1-1 Sanbonmatsu-choAtsuta-ku Nagoya 456-8691 JAPANPhone +81-52-882-3316Fax +81-52-882-3781
TOKYO OFFICE OSAKA BRANCH
14th FLNorth Gate Building3-1-3 UmedaKita-ku Osaka 530-0001 JAPANPhone +81-6-6341-4455Fax +81-6-6341-4487
12th Fl Marunouchi Central Bldg1-9-1 MarunouchiChiyoda-ku Tokyo 100-0005 JAPANPhone +81-3-6688-6808Fax +81-3-6688-6813
TOYOKAWA PLANT
2-20 HonoharaToyokawa Aichi-pref 442-8502 JAPANPhone +81-533-85-4900Fax +81-533-85-4123
(Railway rolling stock amp other transportation equipment)NARUMI PLANT
80 Ryucho Narumi-choMidori-ku Nagoya 458-8502 JAPANPhone +81-52-623-3529Fax +81-52-623-4349
(Construction equipment)KINUURA PLANT
20 11-gouchiHanda Aichi 475-0831 JAPAN
(Steel structure)
NIPPON SHARYO USA INC
2340 S Arlington Heights Road Suite 605 Arlington Heights IL 60005 USAAttn NIPPON SHARYO ENGINEERING amp MARKETING LLCPhone +1-847-228-2700Fax +1-847-228-5530
Corporate Information
Directory
41
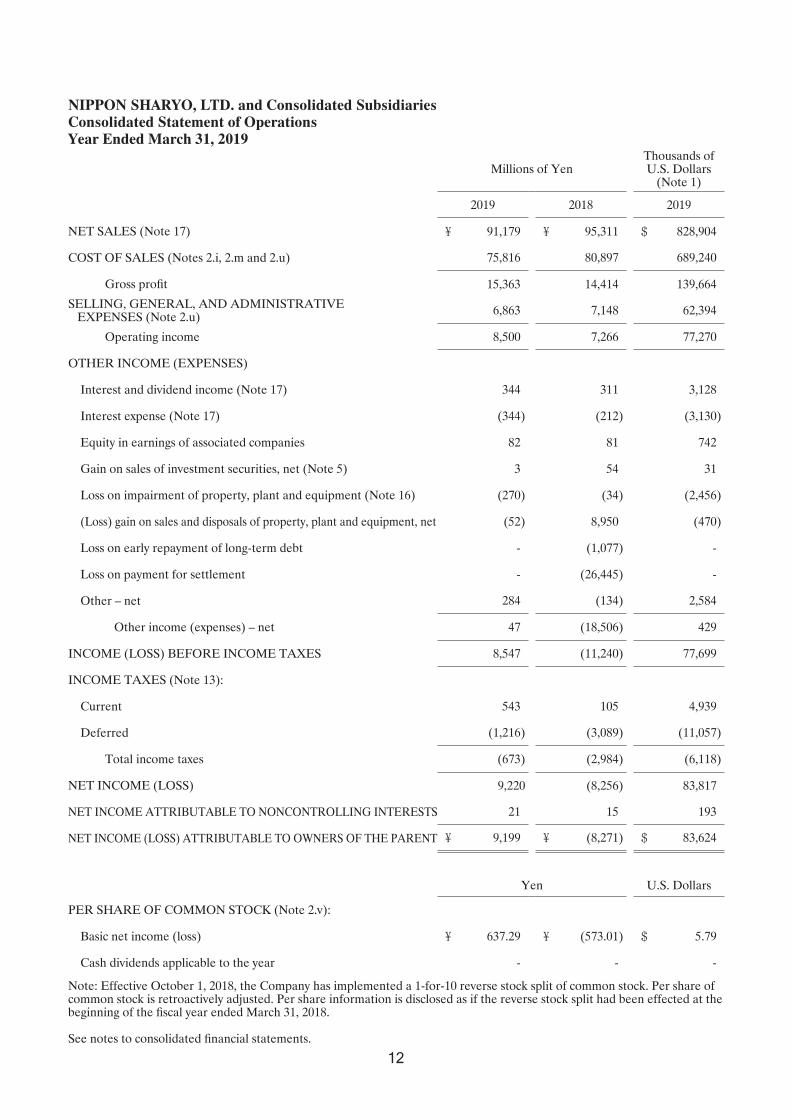
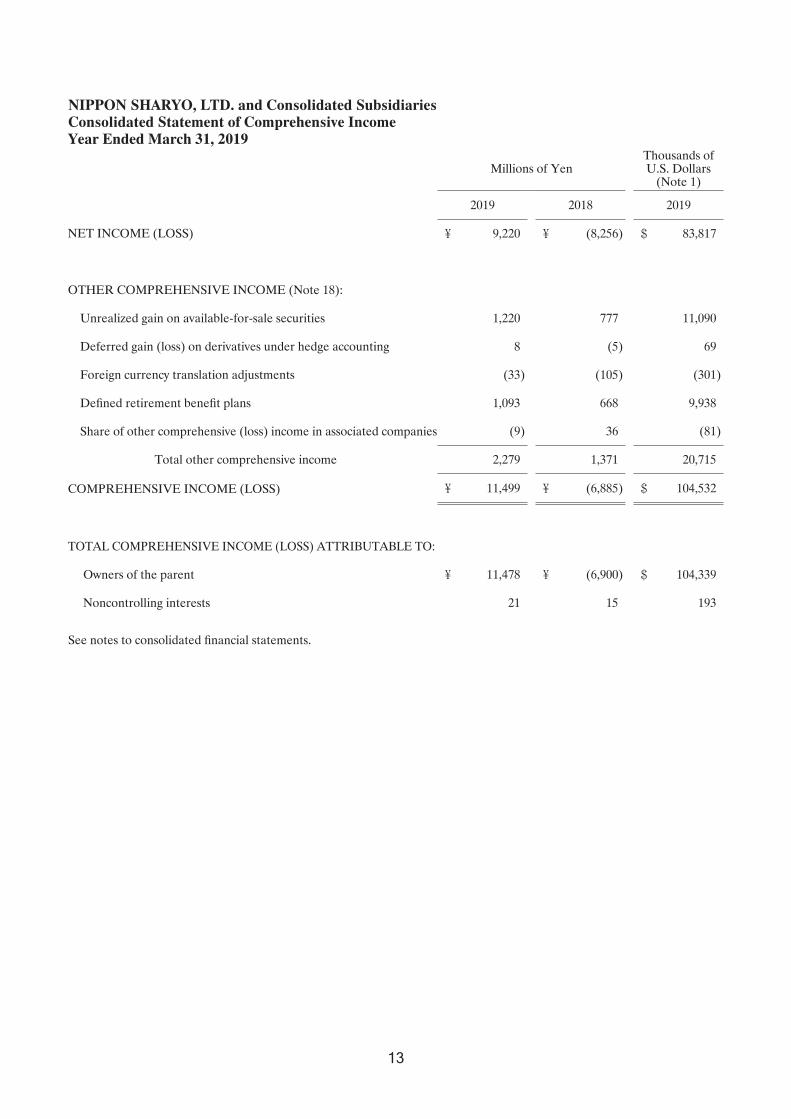
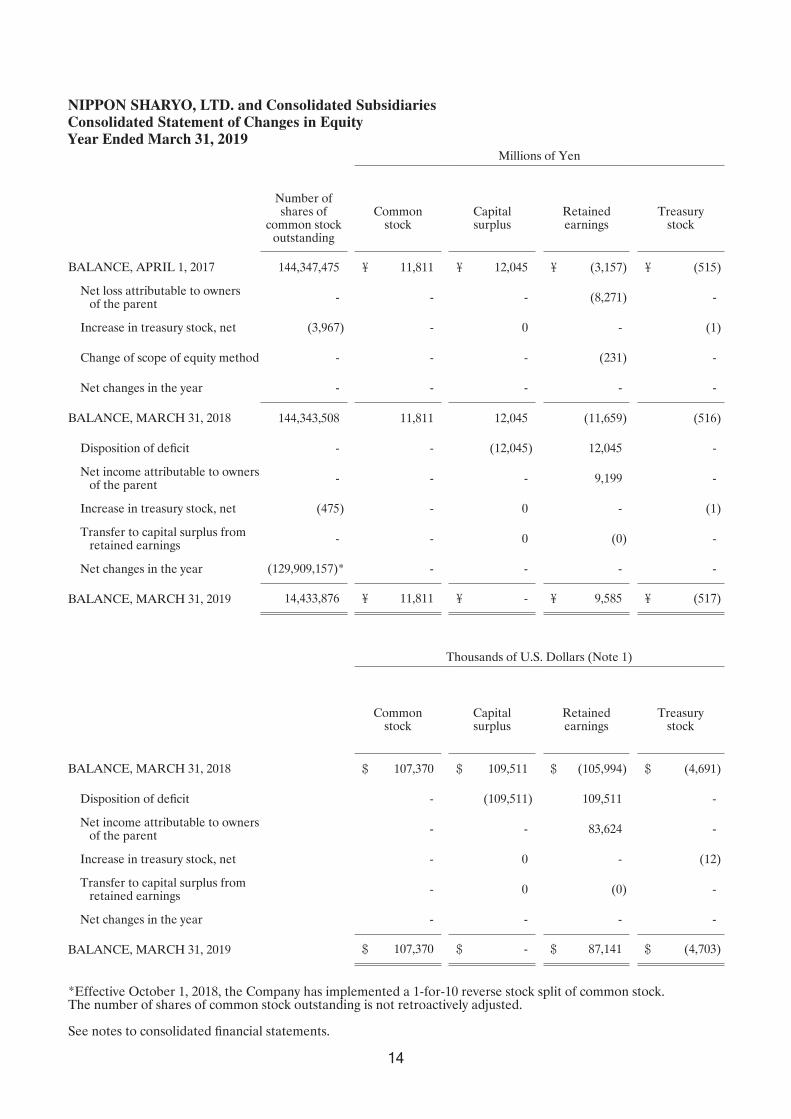
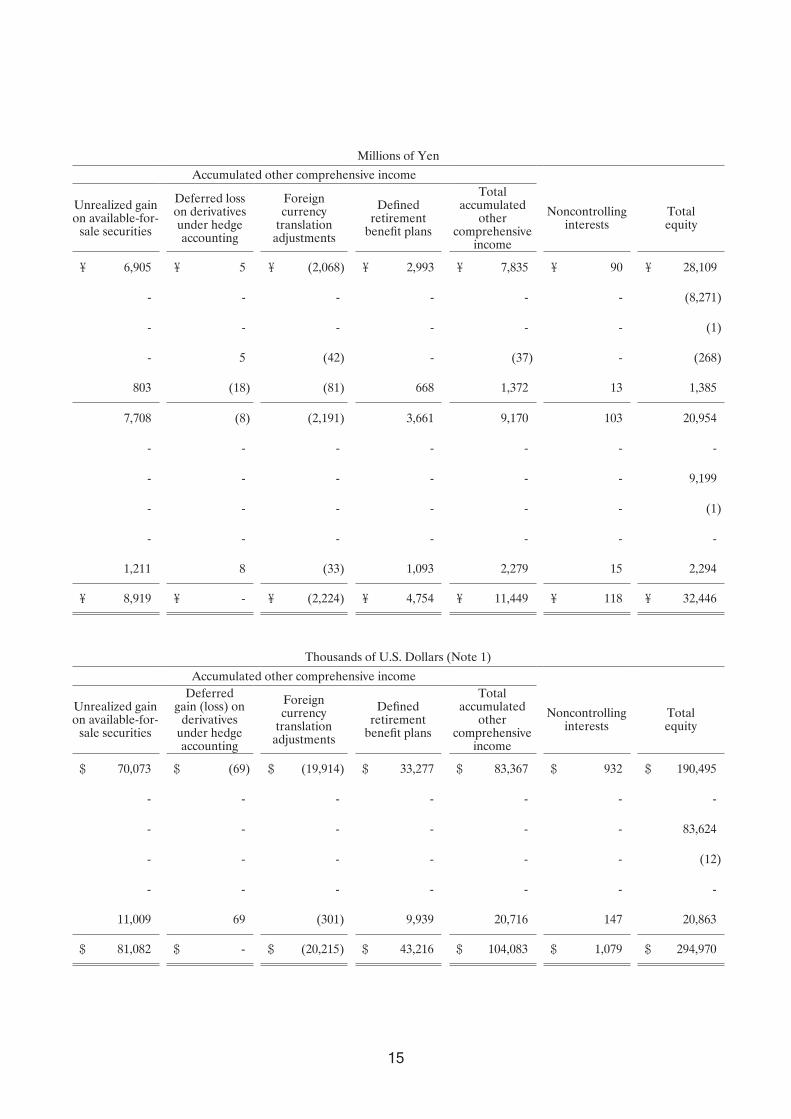
Millions of Yen
Accumulated other comprehensive income
Unrealized gain on available-for-
sale securities
Deferred loss on derivatives under hedge accounting
Foreign currency
translation adjustments
Defined retirement
benefit plans
Total accumulated
other comprehensive
income
Noncontrollinginterests
Totalequity
yen 6905 yen 5 yen (2068) yen 2993 yen 7835 yen 90 yen 28109
- - - - - - (8271)
- - - - - - (1)
- 5 (42) - (37) - (268)
803 (18) (81) 668 1372 13 1385
7708 (8) (2191) 3661 9170 103 20954
- - - - - - -
- - - - - - 9199
- - - - - - (1)
- - - - - - -
1211 8 (33) 1093 2279 15 2294
yen 8919 yen - yen (2224) yen 4754 yen 11449 yen 118 yen 32446
Thousands of US Dollars (Note 1)
Accumulated other comprehensive income
Unrealized gain on available-for-
sale securities
Deferred gain (loss) on
derivatives under hedge accounting
Foreign currency
translation adjustments
Defined retirement
benefit plans
Total accumulated
other comprehensive
income
Noncontrollinginterests
Totalequity
$ 70073 $ (69) $ (19914) $ 33277 $ 83367 $ 932 $ 190495
- - - - - - -
- - - - - - 83624
- - - - - - (12)
- - - - - - -
11009 69 (301) 9939 20716 147 20863
$ 81082 $ - $ (20215) $ 43216 $ 104083 $ 1079 $ 294970
15
Millions of Yen Thousands of US Dollars(Note 1)
2019 2018 2019
OPERATING ACTIVITIES
Income (loss) before income taxes yen 8547 yen (11240) $ 77699
Adjustments for
Income taxes-paid (5) (750) (42)
Loss on early repayment of long-term debt - 1077 -
Loss on payment for settlement - 26445 -
Depreciation 2370 2728 21549
Loss on impairment of property plant and equipment 270 34 2456
Loss (gain) on sales and disposals of property plant and equipment 21 (9067) 195
Gain on sales of investment securities (3) (54) (31)
Changes in assets and liabilities
(Increase) decrease in trade notes and accounts receivable (1029) 3367 (9352)
(Increase) decrease in inventories (4792) 3248 (43561)
(Decrease) increase in trade notes and accounts payable (2053) 1146 (18661)
Increase (decrease) in allowance for work in process on construction contracts 140 (394) 1272
Decrease in provision for loss on orders received (4248) (10159) (38616)
(Decrease) increase in provision for compensation for health damage from asbestos (12) 7 (109)
Increase (decrease) in advances received 814 (1208) 7401
Increase in liability for employeesrsquo retirement benefits 20 14 178
Other-net (1376) (4308) (12529)
Sub-total (1336) 886 (12151)
Payments for loss on early repayment of long-term debt - (1077) -
Settlement paid - (37001) -
Net cash used in operating activities (1336) (37192) (12151)
INVESTING ACTIVITIES
Purchases of property plant and equipment (1235) (1001) (11224)
Proceeds from sales of property plant and equipment 46 12827 417
Purchases of investment securities (3) (3) (31)
Proceeds from sales of investment securities 11 100 99
Other-net (66) (130) (593)
Net cash(used in)provided by investing activities (1247) 11793 (11332)
FINANCING ACTIVITIES
Net decrease in short-term borrowings - (1595) -
Proceeds from long-term debt 118 56000 1072
Repayments of long-term debt (289) (24487) (2631)
Dividends paid (0) (3) (1)
Other-net (303) (84) (2746)
Net cash (used in) provided by financing activities (474) 29831 (4306)
FOREIGN CURRENCY TRANSLATION ADJUSTMENTS ON CASH AND CASH EQUIVALENTS (59) (308) (542)
NET (DECREASE) INCREASE IN CASH AND CASH EQUIVALENTS (3116) 4124 (28331)
CASH AND CASH EQUIVALENTS BEGINNING OF YEAR 15837 11713 143976
CASH AND CASH EQUIVALENTS END OF YEAR yen 12721 yen 15837 $ 115645
(Concluded)See notes to consolidated financial statements
NIPPON SHARYO LTD and Consolidated SubsidiariesConsolidated Statement of Cash Flows Year Ended March 31 2019
16
NIPPON SHARYO LTD and Consolidated SubsidiariesNotes to Consolidated Financial StatementsYear Ended March 31 2019
the equity method of accounting had been applied to the
investments in these companies the effect on the accompanying
consolidated financial statements would not be material
All significant intercompany balances and transactions have
been eliminated in consolidation All material unrealized profit
included in assets resulting from transactions within the Group
is also eliminated
The number of the consolidated subsidiaries unconsolidated
subsidiary and associated companies for the years ended March
31 2019 and 2018 was as follows
2019 2018Consolidated subsidiaries 6 6Unconsolidated subsidiary stated at cost 1 1Associated companies accounted for by the equity method 2 2Associated company stated at cost 1 1
The fiscal year-end of NIPPON SHARYO USA INC and its
subsidiaries NIPPON SHARYO MANUFACTURING LLC
and NIPPON SHARYO ENGINEERING amp MARKETING
LLC is December 31 and their financial statements with the
closest closing date prior to that of the Company are used for
consolidation purposes Necessary adjustments for significant
transactions from January 1 to March 31 are made for
consolidation purposes
For the equity method associated companies that have a
different fiscal year from that of the Company the associated
companiesrsquo financial statements with the closest closing date
prior to that of the Company are used for consolidation
purposes
b Unification of accounting policies applied to foreign subsidiaries
for the consolidated financial statements
Under Accounting Standards Board of Japan (ldquoASBJrdquo)
Practical Issues Task Force (ldquoPITFrdquo) No 18 ldquoPractical
Solution on Unification of Accounting Policies Applied
to Foreign Subsidiaries for the Consolidated Financial
Statementsrdquo the accounting policies and procedures applied to
a parent company and its subsidiaries for similar transactions
and events under similar circumstances should in principle
be unified for the preparation of the consolidated financial
statements However financial statements prepared by foreign
subsidiaries in accordance with either IFRS or generally
accepted accounting principles in the United States of America
1 BASIS OF PR ESENTATION OF CONSOLIDATED
FINANCIAL STATEMENTS
The accompanying consolidated financial statements have
been prepared in accordance with the provisions set forth in
the Japanese Financial Instruments and Exchange Act and
its related accounting regulations and in accordance with
accounting principles generally accepted in Japan (ldquoJapanese
GAAPrdquo) which are different in certain respects as to the
application and disclosure requirements of International
Financial Reporting Standards (IFRS)
In preparing these consolidated financial statements certain
reclassifications and rearrangements have been made to the
consolidated financial statements issued domestically in order
to present them in a form which is more familiar to readers
outside Japan In addition certain reclassifications have been
made in the 2018 consolidated financial statements to conform
to the classifications used in 2019
The consolidated financial statements are stated in Japanese
yen the currency of the country in which NIPPON SHARYO
LTD (the ldquoCompanyrdquo) is incorporated and operates The
translations of Japanese yen amounts into US dollar amounts
are included solely for the convenience of readers outside Japan
and have been made at the rate of yen110 to $1 the approximate
rate of exchange at March 31 2019 Such translations should not
be construed as representations that the Japanese yen amounts
could be converted into US dollars at that or any other rate
2 SUMMARY OF SIGNIFICANT ACCOUNTING POLICIES
a Consolidation
The consolidated financial statements as of March 31 2019
include the accounts of the Company and its significant
subsidiaries (together the ldquoGrouprdquo) Under the control and
influence concepts those companies in which the Company
directly or indirectly is able to exercise control over operations
are fully consolidated and those companies over which the
Group has the ability to exercise significant influence are
accounted for by the equity method
Investment in associated companies are accounted for by the
equity method Investments in the remaining unconsolidated
subsidiary and associated company are stated at cost If
17
(Financial Accounting Standards Board Accounting Standards
CodificationmdashldquoFASB ASCrdquo) tentatively may be used for the
consolidation process except for the following items that
should be adjusted in the consolidation process so that net
income is accounted for in accordance with Japanese GAAP
unless they are not material (a) amortization of goodwill (b)
scheduled amortization of actuarial gain or loss of pensions
that has been recorded in equity through other comprehensive
income (c) expensing capitalized development costs of research
and development (RampD) and (d) cancellation of the fair value
model of accounting for property plant and equipment and
investment properties and incorporation of the cost model
accounting
c Unification of accounting policies applied to associated
companies for the equity method
ASBJ Statement No 16 ldquoAccounting Standard for Equity
Method of Accounting for Investmentsrdquo requires adjustments
to be made to conform the associatersquos accounting policies for
similar transactions and events under similar circumstances
to those of the parent company when the associatersquos financial
statements are used in applying the equity method unless it is
impracticable to determine adjustments
d Business combinations
Business combinations are accounted for using the purchase
method Acquisition-related costs such as advisory fees or
professional fees are accounted for as expenses in the periods
in which the costs are incurred If the initial accounting for a
business combination is incomplete by the end of the reporting
period in which the business combination occurs an acquirer
shall report in its financial statements provisional amounts for
the items for which the accounting is incomplete During the
measurement period which shall not exceed one year from
the acquisition the acquirer shall retrospectively adjust the
provisional amounts recognized at the acquisition date to reflect
new information obtained about facts and circumstances that
existed as of the acquisition date and that would have affected
the measurement of the amounts recognized as of that date
Such adjustments shall be recognized as if the accounting for
the business combination had been completed at the acquisition
date A parentrsquos ownership interest in a subsidiary might
change if the parent purchases or sells ownership interests in its
subsidiary The carrying amount of noncontrolling interest is
adjusted to reflect the change in the parentrsquos ownership interest
in its subsidiary while the parent retains its controlling interest
in its subsidiary Any difference between the fair value of the
consideration received or paid and the amount by which the
noncontrolling interest is adjusted is accounted for as capital
surplus as long as the parent retains control over its subsidiary
e Cash equivalents
Cash equivalents are short-term investments that are readily
convertible into cash and exposed to insignificant risk of
changes in value
Cash equivalents include time deposits and Cash Management
System (ldquoCMSrdquo) funds due from Central Japan Railway
Company (ldquoCJRrdquo) group all of which mature or become due
within three months from the date of acquisition CJR is the
parent company of the Company
f Investment securities
Investment securities are classif ied and accounted for
depending on managementrsquos intent as follows
Available-for-sale securities are reported at fair value with
unrealized gains and losses net of applicable taxes reported in
a separate component of equity
Nonmarketable available-for-sale securities are stated at cost
determined by the moving-average method For other-than-
temporary declines in fair value investment securities are
reduced to net realizable value by a charge to income
g Derivatives and hedging activities
The Group uses derivative financial instruments to manage its
exposures to fluctuations in foreign exchange and interest rates
Forward foreign currency contracts are utilized by the Group
to reduce foreign currency exchange risks The Group does not
enter into derivatives for trading or speculative purposes
Derivative f inancial instruments and foreign currency
transactions are classified and accounted for as follows 1)
all derivatives are recognized as either assets or liabilities
and measured at fair value and gains and losses on derivative
transactions are recognized in the consolidated statement of
operations and 2) for derivatives used for hedging purposes if
such derivatives qualify for hedge accounting because of high
correlation and effectiveness between the hedging instruments
and the hedged items gains and losses on derivatives are
deferred until maturity of the hedged transactions
The forward foreign currency contracts are utilized to hedge
foreign currency exposures in sales of merchandise and
finished goods to overseas customers and procurement of
raw materials from overseas suppliers Trade receivables and
payables denominated in foreign currencies are translated at
the contracted rates if the forward contracts qualify for hedge
accounting
18
h Allowance for doubtful accounts
An allowance for doubtful accounts is provided for at the
aggregate amount of estimated credit loss based on an
individual analysis of certain doubtful or troubled receivables
and a general reserve for other receivables is calculated based
on the historical loss experience
i Inventories
Inventories are stated at the lower of cost determined
pr inc ipa l ly by the spec i f ic ident i f icat ion method for
merchandise finished goods and work in process and by the
moving-average method for semi-finished goods raw materials
and supplies or net selling value which is defined as the selling
price less additional estimated manufacturing costs and
estimated direct selling expenses The replacement cost may be
used in place of the net selling value if appropriate Reversal of
write-downs of inventories in the amounts of yen(1157) million
($(10521) thousand) and yen(10135) million for the years ended
March 31 2019 and 2018 respectively were included in cost of
sales
j Property plant and equipment
Property plant and equipment including significant renewals
and additions are stated at cost and are depreciated principally
by the straight-l ine method for bui ldings and bui lding
improvements and structures acquired on or after April 1 2016
and by the declining-balance method for other property at rates
based on the estimated useful lives of the assets
Depreciation of leased assets relating to financial lease
transactions without transfer of ownership is computed by the
straight-line method over the leased period
The range of useful lives is principally from 10 to 60 years for
buildings and structures and from six to 17 years for machinery
and equipment
The Company has transferred its factory assets of Toyokawa
Plant Kinuura Plant and Narumi Plant to CJR on April 20
2017 The transfer was not treated as a buying and selling
transaction since the relevant factory assets were transferred to
CJR and the Company continues to utilize these factory assets
as before based on a lease agreement concluded between the
Company and CJR The relevant factory assets were therefore
still recorded under property plant and equipment of the
Company As the relevant transactions do not fall under a
finance lease transaction the total transfer price was recorded
as long-term debt (including the current portion) In addition
capital expenditure related to the transferred factory assets was
recorded under ldquobuildings and structuresrdquo and ldquomachinery and
equipmentrdquo and a part of the capital expenditure was recorded
as long-term debt (including the current portion) for the year
ended March 31 2019
As a result the relevant factory assets as of March 31 2019
were recorded under property plant and equipment in the
carrying amount of yen11975 million ($108867 thousand) as
land of yen3827 million ($34794 thousand) as buildings and
structures and yen7 million ($68 thousand) as machinery and
equipment while long-term debt (including the current portion)
was recorded in the carrying amount of yen20515 million
($186501 thousand) as of March 31 2019 As of March 31
2018 the relevant factory assets were recorded under property
plant and equipment in the carrying amount of yen11975 million
as land and of yen4022 million as buildings (net) while long-
term debt (including the current portion) was recorded in the
carrying amount of yen20687 million
k Long-lived assets
The Group reviews its long-lived assets for impairment
whenever events or changes in circumstance indicate that
the carrying amount of an asset or asset group may not be
recoverable An impairment loss is recognized if the carrying
amount of an asset or asset group exceeds the sum of the
undiscounted future cash f lows expected to result from
the continued use and eventual disposition of the asset or
asset group The impairment loss would be measured as the
amount by which the carrying amount of the asset exceeds its
recoverable amount which is the higher of the discounted cash
flows from the continued use and eventual disposition of the
asset or the net selling value at disposition
l Intangible assets
Intangible assets that are included in other assets are amortized
by the straight-line method Software costs are amortized over
five years
m Allowance for work in process on construction contracts
An allowance for work in process on construction contracts
is provided based on an estimate of the total loss in respect
to construction projects on which eventual losses are deemed
inevitable and the amounts of the loss can be reasonably
estimated Provisions and (reversal of provision) for work
in process on construction contracts in the amounts of yen140
million ($1272 thousand) and yen(394) million for the years
ended March 31 2019 and 2018 respectively were included in
cost of sales
n Provision for loss on orders received
A provision for loss on orders received except for construction
contracts is recorded based on an estimate of the total loss
in respect to contracts on which eventual losses are deemed
19
inevitable and the amounts of the loss can be reasonably
estimated
o Retirement and pension plans
The Company has a lump-sum retirement benefit plan a
defined contribution pension plan and a defined benefit pension
plan The Companyrsquos domestic consolidated subsidiaries have
similar retirement benefit plans
Liabilities for employeesrsquo retirement benefits are calculated
based on the projected benefit obligations and plan assets at
the consolidated balance sheet date The projected benefit
obligations are attributed to periods on a benefit formula basis
Prior service costs are amortized on a straight-line basis over
15 years which is within the average remaining service period
Actuarial gains and losses are amortized on a straight-line basis
mainly over 15 years which is within the average remaining
service period in the following the fiscal year
p Allowance for Polychlorinated Biphenyl (PCB) disposal expenses
An allowance for PCB disposal expenses has been provided
based on the published estimated disposal fee schedule issued
by the Japan Environmental Safety Corporation
q Provision for compensation for health damage from asbestos
A provision for compensation for health damage from asbestos
has been recorded based on the estimated compensation
amount for former employees who suffered health damage from
asbestos
r Income taxes
The provision for income taxes is computed based on the pretax
income included in the consolidated statement of operations
The asset and l iabi l it y approach is used to recognize
deferred tax assets and liabilities for the expected future tax
consequences of temporary differences between the carrying
amounts and the tax bases of assets and liabilities Deferred
taxes are measured by applying currently enacted tax rates to
the temporary differences
s Foreign currency transactions
All short-term and long-term monetary receivables and
payables denominated in foreign currencies are translated
into Japanese yen at the exchange rates at the consolidated
balance sheet date The foreign exchange gains and losses from
translation are recognized in the consolidated statement of
operations to the extent that they are not hedged by forward
exchange contracts
t Foreign currency financial statements
The balance sheet accounts of the consolidated foreign
subsidiaries are translated into Japanese yen at the current
exchange rate as of the consolidated balance sheet date except
for equity which is translated at the historical rate Revenue
and expense accounts of consolidated foreign subsidiaries
are translated into yen at the average exchange rate
Differences arising from such translation are shown as foreign
currency translation adjustments under accumulated other
comprehensive income in a separate component of equity
u RampD expenses
Expenses related to RampD activities are charged to income as
incurred RampD expenses amounted to yen1344 million ($12214
thousand) and yen1261 million for the years ended March
31 2019 and 2018 respectively and are included in general
and administrative expenses and manufacturing costs in the
accompanying consolidated statement of operations
v Per share information
Basic net income (loss) per share is computed by dividing
net income (loss) attributable to common shareholders by
the weighted-average number of shares of common stock
outstanding during the respective year Weighted-average
number of shares of common stock for the years ended March
31 2019 and 2018 were 14434 thousand shares Diluted net
income (loss) per share for the years ended March 31 2019
and 2018 was not applicable because the Company had no
dilutive common shares Cash dividends per share presented
in the accompanying consolidated statement of operations are
dividends applicable to the respective years including dividends
to be paid after the end of the year
Effective October 1 2018 the Company has implemented
a 1-for-10 reverse stock split of common stock Per share of
common stock is retroactively adjusted as if the reverse stock
split had been effected at the beginning of the fiscal year ended
March 31 2018
w Construction contracts
Construction revenue and construction costs are recognized
by the percentage-of-completion method if the outcome of a
construction contract can be estimated reliably When total
construction revenue total construction costs and the stage of
completion of the contract at the consolidated balance sheet
date can be reliably measured the outcome of a construction
contract is deemed to be estimated reliably If the outcome
of a construction contract cannot be reliably estimated the
completed-contract method should be applied When it is
probable that the total construction costs will exceed total
construction revenue an estimated loss on the contract should
be immediately recognized by providing for a loss on such
construction contracts
20
x Accounting changes and error corrections
Under ASBJ Statement No 24 ldquoAccounting Standard for
Accounting Changes and Error Correctionsrdquo and ASBJ
Guidance No 24 ldquoGuidance on Accounting Standard for
Accounting Changes and Error Correctionsrdquo accounting
treatments are required as follows (1) Changes in Accounting
PoliciesmdashWhen a new accounting policy is applied following
revision of an accounting standard the new policy is applied
retrospectively unless the revised accounting standard includes
specific transitional provisions in which case the entity shall
comply with the specific transitional provisions (2) Changes in
PresentationmdashWhen the presentation of financial statements
is changed prior-period financial statements are reclassified
in accordance with the new presentation (3) Changes in
Accounting EstimatesmdashA change in an accounting estimate
is accounted for in the period of the change if the change
affects that period only and is accounted for prospectively if
the change affects both the period of the change and future
periods (4) Corrections of Prior-Period ErrorsmdashWhen an error
in prior-period consolidated financial statements is discovered
those statements are restated
y New accounting pronouncement
Accounting Standard for Revenue Recognition etc
- Accounting Standard for Revenue Recognition (ASBJ
Statement No 29 issued on March 30 2018)
- Implementation Guidance on Accounting Standard for
Revenue Recognition (ASBJ Guidance No 30 issued on
March 30 2018)
(a) Overview
The International Accounting Standards Board (ldquoIASBrdquo) and
the Financial Accounting Standards Board (ldquoFASBrdquo) have
jointly developed a comprehensive accounting standard for
revenue recognition and issued it as converged guidance on
recognizing revenue in contracts with customers in May 2014
as IFRS 15 (IASB) and Topic 606 (FASB) respectively To
respond to both IFRS 15 and Topic 606 effective from the fiscal
years beginning on or after January 1 2018 and December
15 2017 respectively ASBJ has developed a comprehensive
accounting standard for revenue recognition and issued it with
the respective implementation guidance
In developing the accounting standard for revenue recognition
ASBJ basically integrated the core principle of IFRS 15 from a
comparability point of view of the financial statements which
is one of the benefits of ensuring consistency with IFRS 15
ASBJ on the other side considered additional alternative
treatments where current practices under Japanese GAAP are
to be reflected as far as such treatments would not significantly
impair international comparability
(b) Effective date
The above standard and guidance are scheduled to be applied
from the beginning of the fiscal year ending March 31 2022
(c) Effects of application of the standards
The effects of the application of the above standard and
guidance on the consolidated financial statements are currently
being assessed
z Change in presentation
Application of ldquoPartial Amendments to Accounting Standard for
Tax Effect Accountingrdquo
On February 16 2018 the ASBJ issued ASBJ Statement No 28
Partial Amendments to Accounting Standard for Tax Effect
Accounting which requires deferred tax assets and deferred
tax liabilities to be classified as investments and other assets
and long-term liabilities respectively Deferred tax assets were
previously classified as current assets and investments and other
assets and deferred tax liabilities were previously classified as
current liabilities and long-term liabilities under the previous
accounting standard The revised accounting standard is
effective for annual periods beginning on or after April 1 2018
The Group retrospectively applied the revised accounting
standard effective April 1 2018 and deferred tax assets of yen51
million which were previously classified as current assets as of
March 31 2018 have been reclassified as investments and other
assets in the accompanying consolidated balance sheet In
accordance with transitional treatment allowed for the adoption
of the revised accounting standard the note information
of valuation allowances for tax loss carryforwards and for
temporary differences for the year ended March 31 2018 was
not separately disclosed
21
3 NOTES AND ACCOUNTS RECEIVABLE
Notes and accounts receivable as of March 31 2019 and 2018 consisted of the following
Millions of Yen Thousands ofUS Dollars
2019 2018 2019Trade notes receivable yen 5022 yen 4848 $ 45654
- Unconsolidated subsidiary and associated companies 215 198 1956Trade accounts receivable 17600 16793 160001
- CJR unconsolidated subsidiary and associated companies 6054 6051 55040Other 911 640 8277Less allowance for doubtful accounts (46) (4) (415)
Total yen 29756 yen 28526 $ 270513
Note Allowance for doubtful accounts was not recognized for accounts receivable-other which was included in Other above
4 INVENTORIES
Inventories as of March 31 2019 and 2018 consisted of the following
Millions of Yen Thousands ofUS Dollars
2019 2018 2019Merchandise yen 224 yen 258 $ 2039Finished goods 1303 1642 11841Work in process and semi-finished goods 28676 23450 260695Raw materials 1281 1355 11644
Total yen 31484 yen 26705 $ 286219
Work in process and allowance for work in process on construction contracts are presented in the gross amount in the consolidated balance sheet At March 31 2019 and 2018 allowance for work in process on construction contracts of yen80 million ($725 thousand) and none respectively was provided and included in work in process and semi-finished goods above
5 INVESTMENT SECURITIES
Investment securities as of March 31 2019 and 2018 consisted of the following
Millions of Yen Thousands ofUS Dollars
2019 2018 2019Equity securities yen 20381 yen 18632 $ 185281
Total yen 20381 yen 18632 $ 185281
The costs and aggregate fair values of investment securities as of March 31 2019 and 2018 were as follows
Millions of Yen2019
Cost Gross unrealized gains
Gross unrealized losses
Fair and carrying value
Securities classified as available-for-saleEquity securities yen 6063 yen 12743 yen (25) yen 18781
Total yen 6063 yen 12743 yen (25) yen 18781
22
Millions of Yen2018
Cost Gross unrealized gains
Gross unrealized losses
Fair and carrying value
Securities classified as available-for-saleEquity securities yen 6059 yen 10965 yen - yen 17024
Total yen 6059 yen 10965 yen - yen 17024
Thousands of US Dollars2019
Cost Gross unrealized gains
Gross unrealized losses
Fair and carrying value
Securities classified as available-for-saleEquity securities $ 55117 $ 115842 $ (226) $ 170733
Total $ 55117 $ 115842 $ (226) $ 170733
The information of available-for-sale securities which were sold for the years ended March 31 2019 and 2018 was as follows
Millions of Yen2019
Proceeds Realized gains Realized lossesAvailable-for-sale
Equity securities yen 10 yen 3 yen (0)Total yen 10 yen 3 yen (0)
Millions of Yen2018
Proceeds Realized gains Realized lossesAvailable-for-sale
Equity securities yen 100 yen 54 yen -Total yen 100 yen 54 yen -
Thousands of US Dollars2019
Proceeds Realized gains Realized lossesAvailable-for-sale
Equity securities $ 90 $ 31 $ (9)Total $ 90 $ 31 $ (9)
No impairment losses were recognized on available-for-sale equity securities for the years ended March 31 2019 and 2018
6 NOTES AND ACCOUNTS PAYABLE
Notes and accounts payable as of March 31 2019 and 2018 consisted of the following
Millions of Yen Thousands ofUS Dollars
2019 2018 2019Trade notes payable yen 1418 yen 1208 $ 12890Electronically recorded obligations-operating 10670 10667 96993-Unconsolidated subsidiary and associated companies 25 17 226Trade accounts payable 8001 10323 72740-Unconsolidated subsidiary and associated companies 94 50 857Other 2704 2580 24581
Total yen 22912 yen 24845 $ 208287
23
7 SHORT-TERM BORROWINGS AND LONG-TERM DEBT
There was no balance of short-term borrowings as of March 31 2019 and 2018
Long-term debt as of March 31 2019 and 2018 consisted of the following
Millions of Yen Thousands ofUS Dollars
2019 2018 2019Loans from CJR due through 2027 (Note) with average interest rate of 061 yen 55515 yen 55687 $ 504684
Less current portion (296) (287) (2688)Total yen 55219 yen 55400 $ 501996
The aggregate annual maturities of long-term debt as of March 31 2019 were as follows
Years ending March 31 Millions of Yen Thousands of US Dollars
2020 - -2021 - -2022 yen 2900 $ 263642023 2900 263642024 2900 263642025 and thereafter 26300 239090
Total yen 35000 $ 318182
Note Long-term debt recorded for the transfer price of the factory assets transferred to CJR and for a part of capital expenditure related to the transferred factory assets in the total amount of yen20219 million ($183814 thousand) was not reflected
8 RETIREMENT AND PENSION PLANS
Employees who terminate their service with the Company and its domestic consolidated subsidiaries are entitled to retirement benefits generally determined by reference to the basic rate of pay at the time of termination length of service and conditions under which the termination occurs The Company has a lump-sum retirement benefit plan a defined contribution pension plan and a defined benefit pension plan which are assumed to cover retirement benefits for employees who have retired voluntarily The Company contributed certain assets to the employee retirement benefit trust The Companyrsquos domestic consolidated subsidiaries have similar retirement benefit plans
(1) Defined benefit plans
(a) The changes in defined benefit obligation for the years ended March 31 2019 and 2018 were as follows
Millions of Yen Thousands ofUS Dollars
2019 2018 2019Balance at beginning of year yen 13359 yen 13445 $ 121448
Current service cost 738 724 6709Interest cost 118 119 1071Actuarial gains (93) (42) (844) Benefits paid (484) (838) (4406) Prior service cost - (49) -
Balance at end of year yen 13638 yen 13359 $ 123978
Note The domestic consolidated subsidiaries of the Company apply the simplified method in calculating the defined benefit obligation
24
(b) The changes in plan assets for the years ended March 31 2019 and 2018 were as follows
Millions of Yen Thousands ofUS Dollars
2019 2018 2019Balance at beginning of year yen 18710 yen 17269 $ 170088
Expected return on plan assets 245 232 2232 Actuarial gains 2123 1305 19300 Contribution from the employer 380 383 3449 Benefits paid (202) (479) (1838)
Balance at end of year yen 21256 yen 18710 $ 193231
(c) Reconciliation between the liability (asset) recorded in the consolidated balance sheet and the balances of defined benefit obligation and plan assets as of March 31 2019 and 2018 was as follows
Millions of Yen Thousands ofUS Dollars
2019 2018 2019Funded defined benefit obligation yen 13346 yen 13086 $ 121322 Plan assets (21256) (18709) (193231)
Total (7910) (5623) (71909)Unfunded defined benefit obligation 292 273 2656 Net asset arising from defined benefit obligation yen (7618) yen (5350) $ (69253)
Asset for employeesrsquo retirement benefits yen (7910) yen (5623) $ (71909)Liability for employeesrsquo retirement benefits 292 273 2656 Net asset arising from defined benefit obligation yen (7618) yen (5350) $ (69253)
(d) The components of net periodic benefit costs for the years ended March 31 2019 and 2018 were as follows
Millions of Yen Thousands ofUS Dollars
2019 2018 2019Service cost (Note) yen 738 yen 728 $ 6709 Interest cost 118 118 1071 Expected return on plan assets (245) (232) (2232)Recognized actuarial gains (640) (426) (5817)Amortization of prior service cost (8) (5) (70)Net periodic benefit costs yen (37) yen 183 $ (339)
Note Retirement benefit costs of the consolidated subsidiaries applying the simplified method are included in service cost
(e) Amounts recognized in other comprehensive income (before income tax effect) in respect of defined retirement benefit plans for the years ended March 31 2019 and 2018
Millions of Yen Thousands ofUS Dollars
2019 2018 2019Prior service cost yen 8 yen (44) $ 70Actuarial (gains) losses (1576) (920) (14329)
Total yen (1568) yen (964) $ (14259)
25
(f) Amounts recognized in accumulated other comprehensive income (before income tax effect) in respect of defined retirement benefit plans as of March 31 2019 and 2018
Millions of Yen Thousands ofUS Dollars
2019 2018 2019Unrecognized prior service cost yen (71) yen (79) $ (647)Unrecognized actuarial gains (6749) (5173) (61355)
Total yen (6820) yen (5252) $ (62002)
(g) Plan assets
(i) Components of plan assets Plan assets consisted of the following
2019 2018Debt investments 12 14Equity investments 80 78Cash and deposits 3 3Other 5 5
Total 100 100
Note The employeesrsquo retirement benefit trusts for the contributory pension plans accounted for 18 of total plan assets for the years ended March 31 2019 and 2018
(ii) Method of determining the expected rate of return on plan assetsThe expected rate of return on plan assets is determined considering the current and future asset portfolio and the long-term rates of return which are expected currently and in the future from the various components of the plan assets
(h) Assumptions used for the years ended March 31 2019 and 2018 were set forth as follows
2019 2018Discount rate 09 09Expected rate of return on plan assets 20 20
(2) Defined contribution plans
The required contribution of the Company and its consolidated subsidiaries amounted to yen139 million ($1265 thousand) and yen133 million for the years ended March 31 2019 and 2018 respectively
26
9 ASSETS PLEDGED AS COLLATERAL
(1)Assets pledged as collateral for long-term debt from CJR in the amount of yen35000 million ($318182 thousand) for the payment of settlement money related to a large railway rolling stock project in the USA as of March 31 2019 and 2018 were as follows
Millions of Yen Thousands ofUS Dollars
2019 2018 2019Buildings and structures yen 261 yen 277 $ 2372Land 15 15 136Investment securities 12606 12338 114598
Total yen 12882 yen 12630 $ 117106
(2)Other assets pledged as collateral as of March 31 2019 and 2018 were as follows
Millions of Yen Thousands ofUS Dollars
2019 2018 2019Other current assets (Note 1) yen 56 yen 56 $ 505Other assets under Investments and Other Assets (Note 2) 10 10 91Investment securities (Note 3) 5887 4487 53525
Total yen 5953 yen 4553 $ 54121
Notes 1 Deposit required by insurance contracts 2 Guarantee deposit required by the Building Lots and Buildings Transaction Business Law 3 Deposit for letter of credit
10 CONTINGENT LIABILITIES
In some cases the Company sells its construction equipment products through leasing companies Some of these leasing companies request that the Company enters into lease credit guarantee contracts Under these contracts if the lease credits are unrecoverable from users of the Companyrsquos construction equipment products the Company guarantees payment of the amount defined by the contract to the leasing companies Such guarantees as of March 31 2019 and 2018 amounted to yen226 million ($2056 thousand) and yen389 million respectively
11 LEASE TRANSACTIONS
The Group uses certain machinery and equipment under finance lease contracts
All finance lease transactions are accounted for in a manner similar to ordinary sale or purchase transactions
The aggregate annual maturities of lease obligations as of March 31 2019 were as follows
Years ending March 31 Millions of Yen Thousands ofUS Dollars
2020 yen 678 $ 6168 2021 651 5913 2022 665 6045 2023 244 2221 2024 90 817 2025 and thereafter - -
Total yen 2328 $ 21164
27
A consolidated subsidiary subleases machinery
Investments in leases and lease obligations which include an interest portion resulting from sublease transactions as of March 31 2019 and 2018 were as follows
Millions of Yen Thousands ofUS Dollars
2019 2018 2019 Investments in leases
Due within one year yen 122 yen 154 $ 1112Due after one year 205 327 1859
Total yen 327 yen 481 $ 2971
Millions of Yen Thousands ofUS Dollars
2019 2018 2019Lease obligations
Due within one year yen 140 yen 170 $ 1272 Due after one year 235 375 2139
Total yen 375 yen 545 $ 3411
12 EQUITY
Japanese companies are subject to the Companies Act of Japan (the ldquoCompanies Actrdquo) The significant provisions in the Companies Act that affect financial and accounting matters are summarized below
(1) Dividends
Under the Companies Act companies can pay dividends at any time during the fiscal year in addition to the year-end dividend upon resolution at the shareholdersrsquo meeting Additionally for companies that meet certain criteria including (1) having a Board of Directors (2) having independent auditors (3) having an Audit amp Supervisory Board and (4) the term of service of the directors being prescribed as one year rather than the normal two-year term by its articles of incorporation the Board of Directors may declare dividends (except for dividends-in-kind) at any time during the fiscal year if the company has prescribed so in its articles of incorporation However the Company cannot do so because it does not meet all the above criteria
The Companies Act permits companies to distribute dividends-in-kind (noncash assets) to shareholders subject to a certain limitation and additional requirements
Semiannual interim dividends may also be paid once a year upon resolution by the Board of Directors if the articles of incorporation of the company so stipulate The Companies Act provides certain limitations on the amounts available for dividends or the purchase of treasury stock The limitation is defined as the amount available for distribution to the shareholders but the amount of net assets after dividends must be maintained at no less than yen3 million
(2) Increasesdecreases and transfer of common stock reserve and surplus
The Companies Act requires that an amount equal to 10 of dividends must be appropriated as a legal reserve (a component of retained earnings) or as additional paid-in capital (a component of capital surplus) depending on the equity account charged upon the payment of such dividends until the aggregate amount of legal reserve and additional paid-in capital equals 25 of the common stock Under the Companies Act the total amount of additional paid-in capital and legal reserve may be reversed without limitation The Companies Act also provides that common stock legal reserve additional paid-in capital other capital surplus and retained earnings can be transferred among the accounts within equity under certain conditions upon resolution of the shareholders
28
(3) Treasury stock and treasury stock acquisition rights
The Companies Act also provides for companies to purchase treasury stock and dispose of such treasury stock by resolution of the Board of Directors The amount of treasury stock purchased cannot exceed the amount available for distribution to the shareholders which is determined by a specific formula Under the Companies Act stock acquisition rights are presented as a separate component of equity The Companies Act also provides that companies can purchase both treasury stock acquisition rights and treasury stock Such treasury stock acquisition rights are presented as a separate component of equity or deducted directly from stock acquisition rights
Effective June 28 2018 the Company transferred capital surplus to retained earnings based on the resolution of the Shareholdersrsquo Meeting held on June 28 2018
Effective October 1 2018 the Company has implemented a 1-for-10 reverse stock split of common stock based on the resolution of the Shareholdersrsquo Meeting held on June 28 2018
13 INCOME TAXES
The Company and its domestic subsidiaries are subject to Japanese national and local income taxes which in the aggregate resulted in a normal effective statutory tax rate of approximately 302 and 305 for the years ended March 31 2019 and 2018 respectively
The tax effects of significant temporary differences and tax loss carryforwards that resulted in deferred tax assets and liabilities as of March 31 2019 and 2018 were as follows
Millions of Yen Thousands ofUS Dollars
2019 2018 2019
Deferred tax assetsTax loss carryforwards (Note 2) yen 3630 yen 3642 $ 32999 Liability for employeesrsquo retirement benefits 2510 2528 22815 Loss on write-downs of inventories 1761 2101 16013 Land and building of plants 1458 1487 13253 Loss on impairment of fixed assets 1155 1218 10502 Accrued bonuses to employees 485 446 4411 Provision for loss on orders received 273 1682 2485 Other 1834 2352 16664
Sub-total 13106 15456 119142
Less valuation allowance for tax loss crryforwards (Note 2) (3630) - (32999)
Less valuation allowance pertaining to total amount of deductible temporary differences (7974) - (72493)Valuation allowance total (Note 1) (11604) (15320) (105492)
Total yen 1502 yen 136 $ 13650
Deferred tax liabilitiesUnrealized gain on available-for-sale securities yen (3842) yen (3308) $ (34924)Deferred gain on sales of property - (22) -Other (3549) (2903) (32264)
Total (7391) (6233) (67188)Net deferred tax liabilities yen (5889) yen (6097) $ (53538)
Notes 1 Valuation allowance decreased by yen3716 million ($33779 thousand) during the year ended March 31 2019 This is mainly due to the decrease of deductible temporary differences on the one hand On the other hand the respective deferred tax assets related to tax loss carryforwards were partly judged as recoverable as a result of careful consideration taking into account the current and estimated future taxable income
2 Expected maturity of the deferred tax assets after the balance sheet date for tax loss carryforwards as of March 31 2019 was as follows
29
The expiration of tax loss carryforwards the related valuation allowances and the resulting net deferred tax assets as of March 31 2019 were as follows
Millions of Yen
2019 Within 1 year
Over 1 year but within
2 years
Over 2 years but within
3 years
Over 3 years but within
4 years
Over 4 years but within
5 years
Over 5 years Total
Deferred tax assets relating to tax loss carryforwards () - - - - - yen 3630 yen 3630
Less valuation allowance for tax loss carry forwards - - - - - (3630) (3630)
Net deferred tax assets relating to tax loss carry forwards - - - - - - -
Thousands of US Dollars
2019 Within 1 year
Over 1 year but within
2 years
Over 2 years but within
3 years
Over 3 years but within
4 years
Over 4 years but within
5 years
Over 5 years Total
Tax loss carryforwards () - - - - - $ 32999 $ 32999
Valuation allowance - - - - - (32999) (32999)
Deferred tax assets - - - - - - -
()The amount of tax loss carryforwards was calculated by using the statutory tax rate
A reconciliation between the normal effective statutory tax rates and the actual effective tax rates reflected in the accompanying consolidated statement of operations for the year ended March 31 2019 with the corresponding figures for 2018 is as follows
2019 2018Normal effective statutory tax rate 302 305 Increase (decrease) due to
Expenses not deductible for income tax purposes 39 (290)Tax-exempt income (03) 02Changes in valuation allowance (376) 156Per capita inhabitant tax 04 (03)Transfer price adjustments on consolidation (54) 91Higher (lower) income tax rates applicable to income in certain foreign countries 18 (07)
Other (09) 12Actual effective income tax rate (79) 266
14 FINANCIAL INSTRUMENTS AND RELATED DISCLOSURES
(1) Group policy for financial instruments
The Group finances capital investments and necessary funds mainly internally and with CMS provided by a consolidated subsidiary of CJR The Company also operates funds by utilizing CMS Derivative transactions are used not for speculative purposes but to manage exposure to financial risks as described in (2) below
(2) Nature and extent of risks arising from financial instruments
Receivables such as notes and accounts receivable are exposed to customer credit risk Although receivables in foreign currencies are exposed to the risk of fluctuation in foreign currency exchange rates the position net of payables in foreign currencies is hedged by using forward foreign currency contracts Investment securities mainly equity instruments of customers and suppliers of the Group are exposed to the risk of market price fluctuations
30
Payment terms of payables such as trade notes and trade accounts are less than one year Although payables in foreign currencies are exposed to the risk of fluctuation in foreign currency exchange rates the position net of receivables in foreign currencies is hedged by using forward foreign currency contracts
Long-term debt recorded for the transfer price of the factory assets transferred to CJR and for a part of capital expenditure related to the transferred factory assets is not exposed to market risks from changes in variable interest rates since the Company repays a constant lease fee including the interest portion based on the lease agreement Long-term debt from CJR for the payment of settlement money related to a large railway rolling stock project in the USA is also not exposed to market risks from changes in variable interest rates due to the fixed interest rate Lease obligations are primarily used for financing capital investments
Derivatives mainly include forward foreign currency contracts which are used to manage exposure to risks associated with fluctuations in foreign currency exchange rates related to receivables and payables denominated in foreign currencies and forecasted transactions denominated in foreign currencies Please see Note 15 for more information about derivatives
(3)Risk management for financial instruments
Credit risk management
Credit risk is the risk of economic loss arising from a counterpartyrsquos failure to repay or service debt according to the contractual terms The Group manages its credit risk from receivables by monitoring financial position payment terms and balances of customers to identify default risk of customers at an early stage
Market risk management (foreign exchange risk and interest rate risk)
Foreign currency trade receivables and payables are exposed to market risk resulting from fluctuations in foreign currency exchange rates Such foreign exchange risk is hedged principally by forward foreign currency contracts In addition when foreign currency trade receivables and payables are expected from forecasted transactions forward foreign currency contracts may be used
Investment securities are managed by monitoring the market values and the financial position of issuers on a regular basis
Liquidity risk management
The Group establishes or updates its cash management plan according to the monthly cash management plan from each subsidiary in order to monitor its liquidity risk associated with operating payables and short-term borrowings and long-term debt
(4)Fair values of financial instruments
Fair values of financial instruments are based on quoted prices in active markets If quoted prices are not available other rational valuation techniques are used instead Please see Note 15 for the details of the fair value of derivatives
(a) Fair value of financial instrumentsMillions of Yen
2019Carrying amount Fair value Unrealized
gain (loss)Cash and cash equivalents yen 12721 yen 12721 -Notes and accounts receivable 29756 29756 -Investment securities 18781 18781 -
Total yen 61258 yen 61258 -
Notes and accounts payable yen 22912 yen 22912 -Income taxes payable 538 538 -Long-term debt including current portion 35000 35609 yen (609)Lease obligations including current portion 2328 2315 13
Total yen 60778 yen 61374 yen (596)
31
Millions of Yen2018
Carrying amount Fair value Unrealized
gain (loss)Cash and cash equivalents yen 15837 yen 15837 -Notes and accounts receivable 28526 28526 -Investment securities 17024 17024 -
Total yen 61387 yen 61387 -
Notes and accounts payable yen 24845 yen 24845 -Income taxes payable 132 132 -Long-term debt including current portion 35000 35127 yen (127)Lease obligations including current portion 2473 2454 19
Total yen 62450 yen 62558 yen (108)
Thousands of US Dollars2019
Carrying amount Fair value Unrealized
gain (loss)Cash and cash equivalents $ 115645 $ 115645 -Notes and accounts receivable 270513 270513 -Investment securities 170733 170733 -
Total $ 556891 $ 556891 -
Notes and accounts payable $ 208287 $ 208287 -Income taxes payable 4888 4888 -Long-term debt including current portion 318183 323721 $ (5538)Lease obligations including current portion 21164 21046 118
Total $ 552522 $ 557942 $ (5420)
AssetsCash and cash equivalents and notes and accounts receivableThe carrying values of cash and cash equivalents and notes and accounts receivable approximate fair value because of their short maturities
Investment securitiesThe fair values of investment securities are measured at the quoted market prices of the stock exchange The information on the fair value of investment securities by classification is included in Note 5
LiabilitiesNotes and accounts payable and income taxes payableThe carrying values of notes and accounts payable and income taxes payable approximate fair value since they are scheduled to be settled in a short period of time
Long-term debt and lease obligationsThe fair values of long-term debt (including the current portion) and lease obligations are measured at the present value of the total of the principal and interest discounted by the interest rate applied to new loans
Derivative transactionsInformation on the fair value of derivatives is included in Note 15
32
(b)Carrying amount of financial instruments whose fair value cannot be reliably determined
Millions of Yen Thousands ofUS Dollars
2019 2018 2019Unlisted securities yen 1600 yen 1608 $ 14548Investments in an unconsolidated subsidiary and
associated companies 795 728 7226
Long-term debt recorded for the transfer price of the factory assets transferred to CJR and for a part of capital expenditure related to the transferred factory assets (including the current portion)
20515 20687 186501
(5)Maturity analysis for financial assets and securities with contractual maturities
Millions of Yen2019
Due in one year or less
Due after one year through
five years
Due after five years through
10 years
Due after 10 years
Cash and cash equivalents yen 12721 - - -Notes and accounts receivable 29402 yen 354 yen - -
Total yen 42123 yen 354 yen - -
Thousands of US Dollars2019
Due in oneyear or less
Due after one year through
five years
Due after five years through
10 years
Due after 10 years
Cash and cash equivalents $ 115645 - - -Notes and accounts receivable 267294 $ 3219 $ - -
Total $ 382939 $ 3219 $ - -
Please see Note 7 for annual maturities of long-term debt and Note 11 for obligations under finance leases
15 DERIVATIVE TRANSACTIONS
The Group enters into forward foreign currency contracts to hedge foreign exchange risk associated with certain assets and liabilities denominated in foreign currencies
All derivative transactions are entered into to hedge interest and foreign currency exposures incorporated within its business Accordingly market risk in these derivatives is basically offset by opposite movements in the value of hedged assets or liabilities
Derivative transactions entered into by the Group have been made in accordance with internal policies which regulate the authorization and credit limit amount
33
There was no derivative transaction to which hedge accounting was applied for the year ended March 31 2019 Derivative transactions to which hedge accounting was applied for the year ended March 31 2018 were as follows
Millions of Yen2018
Hedgeditem
Contractamount
Contract amount due
after one yearFairvalue
CurrencyForward foreign currency contracts
Buying
USD Advance payments yen 152 - yen (8)
16 LOSS ON IMPAIRMENT OF PROPERTY PLANT AND EQUIPMENT
The Group recognized impairment losses on the following asset groups
For the year ended March 31 2019Millions of Yen Thousands of US Dollars
Asset group Location Account 2019 2019Idle assets Shinanomachi Nagano Land yen 14 $ 133Idle assets Nagoya Aichi Buildings and structures etc 17 153Idle assets Illinois USA Machinery and equipment 239 2170
Total yen 270 $ 2456
For the year ended March 31 2018Millions of Yen
Asset group Location Account 2018
Idle assets Nakatsugawa Gifu Buildings and structures land etc yen 34
Total yen 34
The Group reviewed its long-lived assets for impairment as of March 31 2019 and 2018
For the years ended March 31 2019 and 2018 the Group recognized an impairment loss for idle assets by writing down the property to its net selling value (based on reasonably adjusted amount of property tax assessment value)
Upon the decision to close the manufacturing plant of an US subsidiary NIPPON SHARYO USA INC in Rochelle Illinois USA on July 24 2018 the sale of the plant to a third party has been considered Therefore we recognized an impairment loss on the manufacturing plant at its net selling value for the year ended March 31 2019
Impairment losses other than the above were not disclosed as they were immaterial
17 RELATED-PARTY DISCLOSURES
(1)Parent and major shareholders
CJR directly owned 512 of the total shares of the Company as of March 31 2019 and 2018 The Company distributes transportation vehicles to CJR
34
Transactions of the Company with CJR for the years ended March 31 2019 and 2018 were as follows
For the year ended March 31 2019 Millions of Yen Thousands ofUS Dollars
2019 2019Sales yen 19955 $ 181413Borrowing of funds 117 1072Repayment of debt 289 2631Interest expense 337 3067
Borrowing of funds repayment of debt and interest expense of yen117 million ($1072 thousand) yen289 million ($2631 thousand) and yen127 million ($1158 thousand) respectively were recorded for the transfer of the factory assets transferred to CJR and for a part of capital expenditure related to the transferred factory assets
For the year ended March 31 2018 Millions of Yen
2018Sales yen 24001Borrowing of funds 56000Repayment of debt 313Interest expense 193
Borrowing of funds repayment of debt and interest expense of yen21000 million yen313 million and yen122 million respectively were recorded for the transfer of the factory assets transferred to CJR and for a part of capital expenditure related to the transferred factory assets
The balances due to or from CJR as of March 31 2019 and 2018 were as follows
As of March 31 2019 Millions of Yen Thousands ofUS Dollars
2019 2019Accounts receivable yen 5993 $ 54483Current portion of long-term debt 296 2688Long-term debt 55219 501996Accrued expenses 43 392
Current portion of long-term debt long-term debt and accrued expenses of yen296 million ($2688 thousand) yen20220 million ($183815 thousand) and yen42 million ($381 thousand) respectively were the balances related to long-term debt for the transfer price of the factory assets transferred to CJR and for a part of capital expenditure related to the transferred factory assets
As of March 31 2018 Millions of Yen
2018Accounts receivable yen 5947Current portion of long-term debt 287Long-term debt 55400Accrued expenses 43
Current portion of long-term debt long-term debt and accrued expenses of yen287 million yen20400 million and yen42 million respectively were the balances related to long-term debt for the transfer price of the factory assets transferred to CJR and for a part of capital expenditure related to the transferred factory assets
(2)Fellow subsidiaries and subsidiaries of other affiliates
35
Transactions of the Company with the fellow subsidiaries for the years ended March 31 2019 and 2018 were as follows
For the year ended March 31 2019Millions of Yen Thousands of
US Dollars2019 2019
JR Central Financial Management Co Ltd Interest income yen 5 $ 45
For the year ended March 31 2018Millions of Yen
2018JR Central Financial Management Co Ltd Interest income yen 2
The balances due to or from the fellow subsidiaries as of March 31 2019 and 2018 were as follows
As of March 31 2019Millions of Yen Thousands of
US Dollars2019 2019
JR Central Financial Management Co LtdCash and cash equivalents yen 7398 $ 67255
As of March 31 2018Millions of Yen
2018JR Central Financial Management Co LtdCash and cash equivalents yen 7534
36
18 OTHER COMPREHENSIVE INCOME
The components of other comprehensive income for the years ended March 31 2019 and 2018 were as follows
Millions of Yen Thousands of US Dollars
2019 2018 2019Unrealized gain on available-for-sale securities
Gains arising during the year yen 1753 yen 1131 $ 15938Reclassification adjustments to profit or loss - (0) -Amount before income tax effect 1753 1131 15938Income tax effect (533) (354) (4848)
Total yen 1220 yen 777 $ 11090Deferred gain (loss) on derivatives under hedge accounting
Gains (losses) arising during the year yen 8 yen (5) $ 69Income tax effect - - -
Total yen 8 yen (5) $ 69Foreign currency translation adjustments
Adjustments arising during the year yen (33) yen (105) $ (301)Total yen (33) yen (105) $ (301)
Defined retirement benefit plansAdjustments arising during the year yen 2216 yen 1396 $ 20145Reclassification adjustments to profit or loss (648) (432) (5887)Amount before income tax effect 1568 964 14258Income tax effect (475) (296) (4320)
Total yen 1093 yen 668 $ 9938Share of other comprehensive (loss) income in associated companies
Gains arising during the year yen (9) yen 36 $ (81)Income tax effect - - -
Total yen (9) yen 36 $ (81)
Total other comprehensive income yen 2279 yen 1371 $ 20715
19 SEGMENT INFORMATION
Under ASBJ Statement No 17 ldquoAccounting Standard for Segment Information Disclosuresrdquo and ASBJ Guidance No 20 ldquoGuidance on Accounting Standard for Segment Information Disclosuresrdquo an entity is required to report financial and descriptive information about its reportable segments Reportable segments are operating segments or aggregations of operating segments that meet specified criteria Operating segments are components of an entity about which separate financial information is available and such information is evaluated regularly by the chief operating decision maker in deciding how to allocate resources and in assessing performance Generally segment information is required to be reported on the same basis as is used internally for evaluating operating segment performance and deciding how to allocate resources to operating segments
(1)Description of reportable segments
The Grouprsquos reportable segments are those for which separate financial information is available and regular evaluation by the Companyrsquos management is being performed in order to decide how resources are allocated among the Group
The Group has operational headquarters by each product or service Each of the operational headquarters develops comprehensive strategies and engages in business activities relating to each product and service Accordingly the Group is comprised of segments organized by products or services based on the operational headquarters and there are four reportable segments ldquoRailway Rolling Stockrdquo ldquoTransportation Equipment and Steel Structurerdquo ldquoConstruction Equipmentrdquo and ldquoEngineeringrdquo
37
ldquoRailway Rolling Stockrdquo consists of manufacture and sales of rolling stock such as EMUs and railway motor cars
ldquoTransportation Equipment and Steel Structurerdquo consists of manufacture and sales of transportation equipment such as freight cars tank trucks heavy-duty industrial vehicles and manufacture and construction of roadway and railway bridges
ldquoConstruction Equipmentrdquo consists of manufacture and sales of pile driving rigs crawler cranes casing rotators portable diesel generator sets and emergency generators
ldquoEngineeringrdquo consists of manufacture and sales of railway rolling stock inspectionmaintenance systems agricultural plants and pulp and paper plants
(2)Method of measurement for the amount of sales profit (loss) assets and other items for each reportable segment
The accounting policies of each reportable segment are consistent with those disclosed in Note 2 ldquoSummary of Significant Accounting Policiesrdquo Reporting segment profit represents operating income Intersegment transactions are based upon armrsquos-length transactions
(3)Information of sales profit (loss) assets and other items was as follows
Millions of Yen2019
Reportable segmentRailway Rolling Stock
Transportation Equipment and Steel Structure
Construction Equipment Engineering Other Total Reconciliations Consolidated
Net salesSales to external customers yen 38049 yen 21794 yen 25167 yen 6006 yen 163 yen 91179 - yen 91179Intersegment sales or transfers 129 187 13 67 185 581 yen (581) -
Total yen 38178 yen 21981 yen 25180 yen 6073 yen 348 yen 91760 yen (581) yen 91179
Segment profit (loss) yen 2034 yen 2040 yen 4887 yen 386 yen (27) yen 9320 yen (820) yen 8500Segment assets yen 47448 yen 22556 yen 22978 yen 2906 yen 645 yen 96533 yen 37661 yen 134194Other
Depreciation yen 1046 yen 276 yen 779 yen 15 yen 2 yen 2118 yen 252 yen 2370Increase in property plant and
equipment and intangible assets 1010 937 740 22 2 2711 160 2871
Millions of Yen2018
Reportable segmentRailway Rolling Stock
Transportation Equipment and Steel Structure
Construction Equipment Engineering Other Total Reconciliations Consolidated
Net salesSales to external customers yen 41455 yen 22475 yen 24573 yen 6560 yen 248 yen 95311 - yen 95311Intersegment sales or transfers 261 331 10 23 192 817 yen (817) -
Total yen 41716 yen 22806 yen 24583 yen 6583 yen 440 yen 96128 yen (817) yen 95311
Segment profit (loss) yen 1413 yen 1991 yen 5270 yen (75) yen (93) yen 8506 yen (1240) yen 7266Segment assets yen 46176 yen 19734 yen 22724 yen 4684 yen 669 yen 93987 yen 33426 yen 127413Other
Depreciation yen 1340 yen 319 yen 760 yen 14 yen 2 yen 2435 yen 293 yen 2728Increase in property plant and
equipment and intangible assets 563 143 962 5 0 1673 107 1780
38
Thousands of US Dollars2019
Reportable segmentRailway Rolling Stock
Transportation Equipment and Steel Structure
Construction Equipment Engineering Other Total Reconciliations Consolidated
Net salesSales to external customers $ 345904 $ 198128 $ 228791 $ 54601 $ 1480 $ 828904 - $ 828904Intersegment sales or transfers 1169 1696 122 608 1682 5277 $ (5277) -
Total $ 347073 $ 199824 $ 228913 $ 55209 $ 3162 $ 834181 $ (5277) $ 828904
Segment profit (loss) $ 18494 $ 18548 $ 44423 $ 3512 $ (248) $ 84729 $ (7459) $ 77270Segment assets $ 431340 $ 205056 $ 208891 $ 26422 $ 5859 $ 877568 $ 342384 $ 1219952Other
Depreciation $ 9513 $ 2515 $ 7080 $ 133 $ 14 $ 19255 $ 2294 $ 21549Increase in property plant and
equipment and intangible assets 9186 8514 6725 202 15 24642 1461 26103
Notes 1 ldquoOtherrdquo represents businesses that are not included in any reportable segment which includes manufacture and sales of laser processing system sales of railroad-related merchandise and real estate rental
2 ldquoReconciliationsrdquo in segment profit (loss) include corporate expenses of yen(854) million ($(7766) thousand) and yen(1294) million for the years ended March 31 2019 and 2018 respectively elimination of intersegment transactions of yen27 million ($246 thousand) and yen42 million for the years ended March 31 2019 and 2018 Corporate expenses principally consist of general and administrative expenses that are not attributable to any reportable segment
3 ldquoReconciliationsrdquo in segment assets include total corporate assets of yen32158 million ($292350 thousand) and yen29889 million elimination of intersegment balances of yen(116) million ($(1051) thousand) and yen(136) million and adjustments in inventories of yen(61) million ($(556) thousand) and yen(68) million as of March 31 2019 and 2018 respectively Total corporate assets principally consist of investment securities and general management properties as of March 31 2019 and 2018
4 Segment profit (loss) is reconciled to operating income in the consolidated statement of operations
Associated Information
(1) Information about products and services is not disclosed since similar information is disclosed above
(2) Information about geographical areas for the year ended March 31 2019 was as follows
Millions of Yen2019
Japan USA Asia Other TotalNet sales yen 81477 yen 156 yen 9503 yen 43 yen 91179
Note Sales are based on the location of the customers and grouped by country or area
Information about net sales by geographical areas for the year ended March 31 2018 is not disclosed since net sales to external customers in Japan exceeds 90 of consolidated net sales
Millions of Yen2019
Japan USA Asia Other TotalProperty plant and equipment yen 24784 yen 3630 yen 0 yen 0 yen 28414
39
Millions of Yen2018
Japan USA Asia Other TotalProperty plant and equipment yen 24306 yen 4258 yen 0 yen 0 yen 28564
Thousands of US Dollars2019
Japan USA Asia Other TotalProperty plant and equipment $ 225304 $ 33001 $ 1 $ 0 $ 258306
(3) Information about major customers Net sales
Millions of Yen Thousands of US Dollars
Relatedsegment
Name of major customer 2019 2018 2019
CJR yen 19955 yen 24001 $ 181413Railway Rolling Stock
Transportation Equipment and Steel Structure
(4) Information about loss on impairment of property plant and equipment by reportable segment
Millions of Yen2019
Reportable segmentRailwayRolling Stock
TransportationEquipment andSteel Structure
ConstructionEquipment
Engineer-ing Other Total
Recon-ciliations
Consoli-dated
Impairment loss yen 238 - - - - yen 238 32 yen 270
Millions of Yen2018
Reportable segmentRailwayRolling Stock
TransportationEquipment andSteel Structure
ConstructionEquipment
Engineer-ing Other Total
Recon-ciliations
Consoli-dated
Impairment loss yen - - - - - yen - 34 yen 34
Thousands of US Dollars2019
Reportable segmentRailwayRolling Stock
TransportationEquipment andSteel Structure
ConstructionEquipment
Engineer-ing Other Total
Recon-ciliations
Consoli-dated
Impairment loss $ 2168 - - - - $ 2168 288 $ 2456
Note The amount of ldquoReconciliationsrdquo is related to idle assets which are not attributable to any reporting segment
40
Corporate Profile
Line of Business
Overview of the Main SegmentsNIPPON SHARYO manufactures and sells the following products
Business segment Lines of business
Railway rolling stock EMUs DMUs Passenger Cars Linear Motor Cars Track Maintenance Machines Rolling Stock Components and Automated Guideway Transit Systems
Transportation equipment and Steel structure
Freight Cars Locomotives Tank Trucks Tank Trailers Storage Tanks Heavy-duty Industrial Vehicles Containers Automated Guided Vehicles Roadway Bridges Railway Bridges Water Gates
Construction equipmentPile Driving Rigs Crawler Cranes Hydraulic Hammers Casing Rotators Other Products Related to Foundation Work Portable Diesel Generator Sets Emergency Generators Various Products Related to Electric Machines
Engineering Agricultural Plants Grain Complex Seed Processing Plants Railway Rolling Stock InspectionMaintenance System Pulp and Paper Plants
OFFICE
PLANT
Company Name NIPPON SHARYO LTD
Capital Stock
Common StockAuthorized 32800000 shares
Common StockIssued 14675012 shares
Number of Shareholders 12509 persons
(March 31 2019)
Company History
Sep 1896 Established in Nagoya CityJun 1938 Founded Narumi PlantMay 1949 Re-listed on Tokyo Stock ExchangeJan 1959 Began Construction Machinery BusinessOct 1961 Started Bridge ManufacturingJul 1964 Founded Toyokawa PlantJun 1975 Founded Kinuura PlantSep 1996 100th AnniversaryAug 2008 Equity and business tie-up entered into with Central Japan Railway CompanyAug 2019 Manufactured 4000th Shinkansen EMU
HEAD OFFICE (NAGOYA)
1-1 Sanbonmatsu-choAtsuta-ku Nagoya 456-8691 JAPANPhone +81-52-882-3316Fax +81-52-882-3781
TOKYO OFFICE OSAKA BRANCH
14th FLNorth Gate Building3-1-3 UmedaKita-ku Osaka 530-0001 JAPANPhone +81-6-6341-4455Fax +81-6-6341-4487
12th Fl Marunouchi Central Bldg1-9-1 MarunouchiChiyoda-ku Tokyo 100-0005 JAPANPhone +81-3-6688-6808Fax +81-3-6688-6813
TOYOKAWA PLANT
2-20 HonoharaToyokawa Aichi-pref 442-8502 JAPANPhone +81-533-85-4900Fax +81-533-85-4123
(Railway rolling stock amp other transportation equipment)NARUMI PLANT
80 Ryucho Narumi-choMidori-ku Nagoya 458-8502 JAPANPhone +81-52-623-3529Fax +81-52-623-4349
(Construction equipment)KINUURA PLANT
20 11-gouchiHanda Aichi 475-0831 JAPAN
(Steel structure)
NIPPON SHARYO USA INC
2340 S Arlington Heights Road Suite 605 Arlington Heights IL 60005 USAAttn NIPPON SHARYO ENGINEERING amp MARKETING LLCPhone +1-847-228-2700Fax +1-847-228-5530
Corporate Information
Directory
41
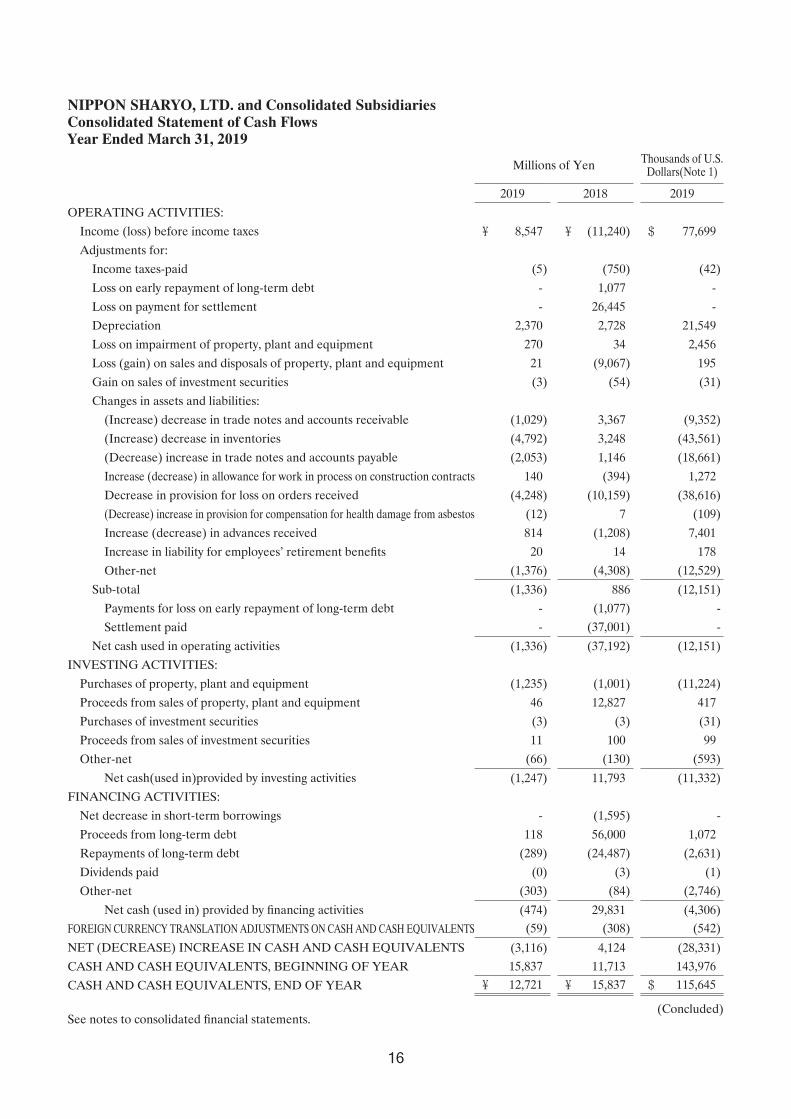
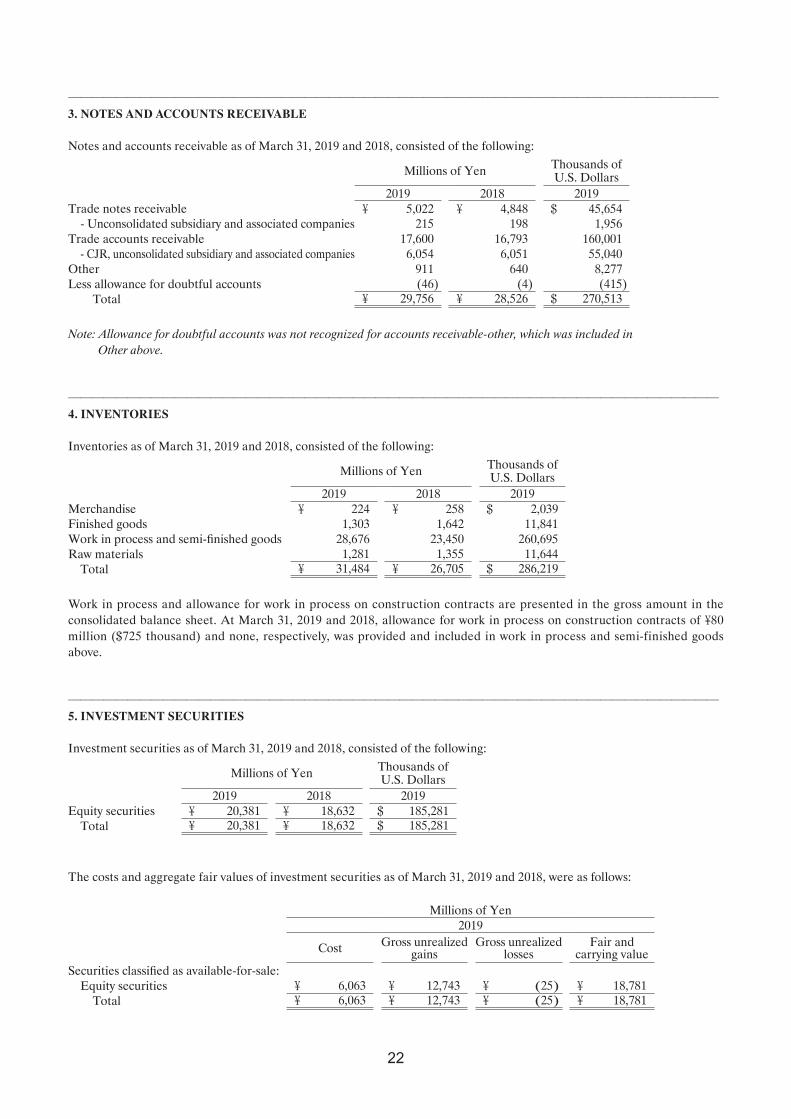
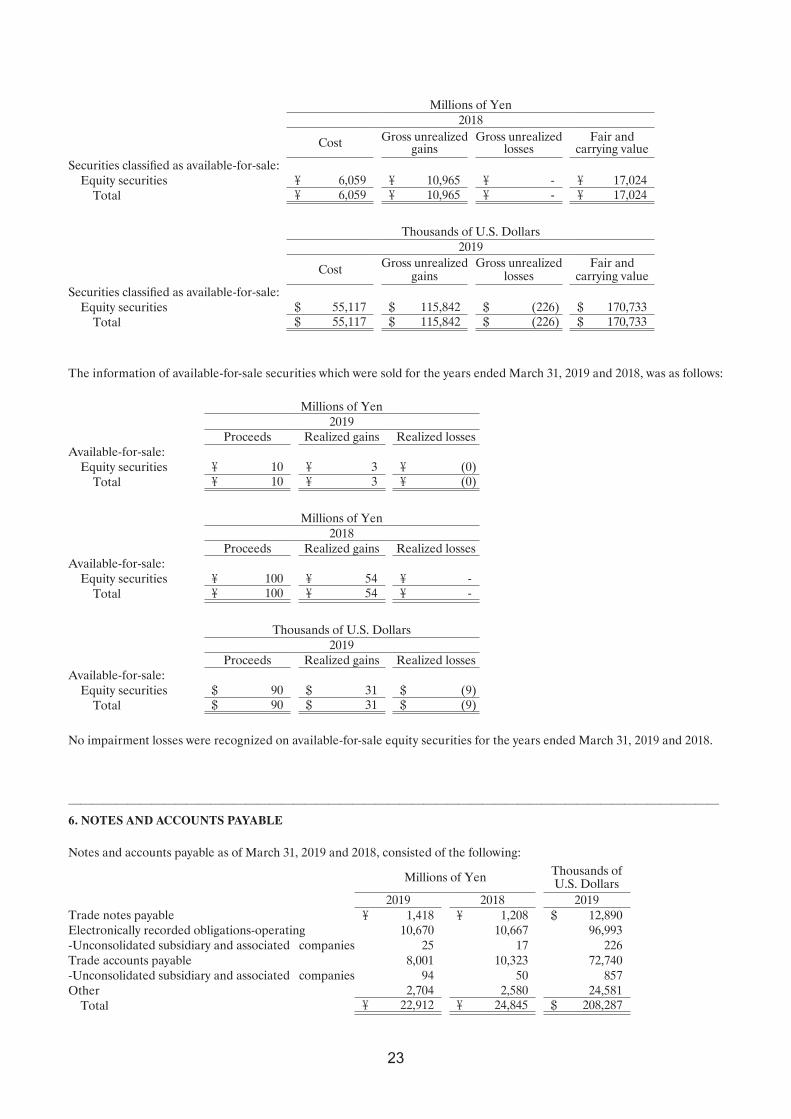
Millions of Yen2018
Cost Gross unrealized gains
Gross unrealized losses
Fair and carrying value
Securities classified as available-for-saleEquity securities yen 6059 yen 10965 yen - yen 17024
Total yen 6059 yen 10965 yen - yen 17024
Thousands of US Dollars2019
Cost Gross unrealized gains
Gross unrealized losses
Fair and carrying value
Securities classified as available-for-saleEquity securities $ 55117 $ 115842 $ (226) $ 170733
Total $ 55117 $ 115842 $ (226) $ 170733
The information of available-for-sale securities which were sold for the years ended March 31 2019 and 2018 was as follows
Millions of Yen2019
Proceeds Realized gains Realized lossesAvailable-for-sale
Equity securities yen 10 yen 3 yen (0)Total yen 10 yen 3 yen (0)
Millions of Yen2018
Proceeds Realized gains Realized lossesAvailable-for-sale
Equity securities yen 100 yen 54 yen -Total yen 100 yen 54 yen -
Thousands of US Dollars2019
Proceeds Realized gains Realized lossesAvailable-for-sale
Equity securities $ 90 $ 31 $ (9)Total $ 90 $ 31 $ (9)
No impairment losses were recognized on available-for-sale equity securities for the years ended March 31 2019 and 2018
6 NOTES AND ACCOUNTS PAYABLE
Notes and accounts payable as of March 31 2019 and 2018 consisted of the following
Millions of Yen Thousands ofUS Dollars
2019 2018 2019Trade notes payable yen 1418 yen 1208 $ 12890Electronically recorded obligations-operating 10670 10667 96993-Unconsolidated subsidiary and associated companies 25 17 226Trade accounts payable 8001 10323 72740-Unconsolidated subsidiary and associated companies 94 50 857Other 2704 2580 24581
Total yen 22912 yen 24845 $ 208287
23
7 SHORT-TERM BORROWINGS AND LONG-TERM DEBT
There was no balance of short-term borrowings as of March 31 2019 and 2018
Long-term debt as of March 31 2019 and 2018 consisted of the following
Millions of Yen Thousands ofUS Dollars
2019 2018 2019Loans from CJR due through 2027 (Note) with average interest rate of 061 yen 55515 yen 55687 $ 504684
Less current portion (296) (287) (2688)Total yen 55219 yen 55400 $ 501996
The aggregate annual maturities of long-term debt as of March 31 2019 were as follows
Years ending March 31 Millions of Yen Thousands of US Dollars
2020 - -2021 - -2022 yen 2900 $ 263642023 2900 263642024 2900 263642025 and thereafter 26300 239090
Total yen 35000 $ 318182
Note Long-term debt recorded for the transfer price of the factory assets transferred to CJR and for a part of capital expenditure related to the transferred factory assets in the total amount of yen20219 million ($183814 thousand) was not reflected
8 RETIREMENT AND PENSION PLANS
Employees who terminate their service with the Company and its domestic consolidated subsidiaries are entitled to retirement benefits generally determined by reference to the basic rate of pay at the time of termination length of service and conditions under which the termination occurs The Company has a lump-sum retirement benefit plan a defined contribution pension plan and a defined benefit pension plan which are assumed to cover retirement benefits for employees who have retired voluntarily The Company contributed certain assets to the employee retirement benefit trust The Companyrsquos domestic consolidated subsidiaries have similar retirement benefit plans
(1) Defined benefit plans
(a) The changes in defined benefit obligation for the years ended March 31 2019 and 2018 were as follows
Millions of Yen Thousands ofUS Dollars
2019 2018 2019Balance at beginning of year yen 13359 yen 13445 $ 121448
Current service cost 738 724 6709Interest cost 118 119 1071Actuarial gains (93) (42) (844) Benefits paid (484) (838) (4406) Prior service cost - (49) -
Balance at end of year yen 13638 yen 13359 $ 123978
Note The domestic consolidated subsidiaries of the Company apply the simplified method in calculating the defined benefit obligation
24
(b) The changes in plan assets for the years ended March 31 2019 and 2018 were as follows
Millions of Yen Thousands ofUS Dollars
2019 2018 2019Balance at beginning of year yen 18710 yen 17269 $ 170088
Expected return on plan assets 245 232 2232 Actuarial gains 2123 1305 19300 Contribution from the employer 380 383 3449 Benefits paid (202) (479) (1838)
Balance at end of year yen 21256 yen 18710 $ 193231
(c) Reconciliation between the liability (asset) recorded in the consolidated balance sheet and the balances of defined benefit obligation and plan assets as of March 31 2019 and 2018 was as follows
Millions of Yen Thousands ofUS Dollars
2019 2018 2019Funded defined benefit obligation yen 13346 yen 13086 $ 121322 Plan assets (21256) (18709) (193231)
Total (7910) (5623) (71909)Unfunded defined benefit obligation 292 273 2656 Net asset arising from defined benefit obligation yen (7618) yen (5350) $ (69253)
Asset for employeesrsquo retirement benefits yen (7910) yen (5623) $ (71909)Liability for employeesrsquo retirement benefits 292 273 2656 Net asset arising from defined benefit obligation yen (7618) yen (5350) $ (69253)
(d) The components of net periodic benefit costs for the years ended March 31 2019 and 2018 were as follows
Millions of Yen Thousands ofUS Dollars
2019 2018 2019Service cost (Note) yen 738 yen 728 $ 6709 Interest cost 118 118 1071 Expected return on plan assets (245) (232) (2232)Recognized actuarial gains (640) (426) (5817)Amortization of prior service cost (8) (5) (70)Net periodic benefit costs yen (37) yen 183 $ (339)
Note Retirement benefit costs of the consolidated subsidiaries applying the simplified method are included in service cost
(e) Amounts recognized in other comprehensive income (before income tax effect) in respect of defined retirement benefit plans for the years ended March 31 2019 and 2018
Millions of Yen Thousands ofUS Dollars
2019 2018 2019Prior service cost yen 8 yen (44) $ 70Actuarial (gains) losses (1576) (920) (14329)
Total yen (1568) yen (964) $ (14259)
25
(f) Amounts recognized in accumulated other comprehensive income (before income tax effect) in respect of defined retirement benefit plans as of March 31 2019 and 2018
Millions of Yen Thousands ofUS Dollars
2019 2018 2019Unrecognized prior service cost yen (71) yen (79) $ (647)Unrecognized actuarial gains (6749) (5173) (61355)
Total yen (6820) yen (5252) $ (62002)
(g) Plan assets
(i) Components of plan assets Plan assets consisted of the following
2019 2018Debt investments 12 14Equity investments 80 78Cash and deposits 3 3Other 5 5
Total 100 100
Note The employeesrsquo retirement benefit trusts for the contributory pension plans accounted for 18 of total plan assets for the years ended March 31 2019 and 2018
(ii) Method of determining the expected rate of return on plan assetsThe expected rate of return on plan assets is determined considering the current and future asset portfolio and the long-term rates of return which are expected currently and in the future from the various components of the plan assets
(h) Assumptions used for the years ended March 31 2019 and 2018 were set forth as follows
2019 2018Discount rate 09 09Expected rate of return on plan assets 20 20
(2) Defined contribution plans
The required contribution of the Company and its consolidated subsidiaries amounted to yen139 million ($1265 thousand) and yen133 million for the years ended March 31 2019 and 2018 respectively
26
9 ASSETS PLEDGED AS COLLATERAL
(1)Assets pledged as collateral for long-term debt from CJR in the amount of yen35000 million ($318182 thousand) for the payment of settlement money related to a large railway rolling stock project in the USA as of March 31 2019 and 2018 were as follows
Millions of Yen Thousands ofUS Dollars
2019 2018 2019Buildings and structures yen 261 yen 277 $ 2372Land 15 15 136Investment securities 12606 12338 114598
Total yen 12882 yen 12630 $ 117106
(2)Other assets pledged as collateral as of March 31 2019 and 2018 were as follows
Millions of Yen Thousands ofUS Dollars
2019 2018 2019Other current assets (Note 1) yen 56 yen 56 $ 505Other assets under Investments and Other Assets (Note 2) 10 10 91Investment securities (Note 3) 5887 4487 53525
Total yen 5953 yen 4553 $ 54121
Notes 1 Deposit required by insurance contracts 2 Guarantee deposit required by the Building Lots and Buildings Transaction Business Law 3 Deposit for letter of credit
10 CONTINGENT LIABILITIES
In some cases the Company sells its construction equipment products through leasing companies Some of these leasing companies request that the Company enters into lease credit guarantee contracts Under these contracts if the lease credits are unrecoverable from users of the Companyrsquos construction equipment products the Company guarantees payment of the amount defined by the contract to the leasing companies Such guarantees as of March 31 2019 and 2018 amounted to yen226 million ($2056 thousand) and yen389 million respectively
11 LEASE TRANSACTIONS
The Group uses certain machinery and equipment under finance lease contracts
All finance lease transactions are accounted for in a manner similar to ordinary sale or purchase transactions
The aggregate annual maturities of lease obligations as of March 31 2019 were as follows
Years ending March 31 Millions of Yen Thousands ofUS Dollars
2020 yen 678 $ 6168 2021 651 5913 2022 665 6045 2023 244 2221 2024 90 817 2025 and thereafter - -
Total yen 2328 $ 21164
27
A consolidated subsidiary subleases machinery
Investments in leases and lease obligations which include an interest portion resulting from sublease transactions as of March 31 2019 and 2018 were as follows
Millions of Yen Thousands ofUS Dollars
2019 2018 2019 Investments in leases
Due within one year yen 122 yen 154 $ 1112Due after one year 205 327 1859
Total yen 327 yen 481 $ 2971
Millions of Yen Thousands ofUS Dollars
2019 2018 2019Lease obligations
Due within one year yen 140 yen 170 $ 1272 Due after one year 235 375 2139
Total yen 375 yen 545 $ 3411
12 EQUITY
Japanese companies are subject to the Companies Act of Japan (the ldquoCompanies Actrdquo) The significant provisions in the Companies Act that affect financial and accounting matters are summarized below
(1) Dividends
Under the Companies Act companies can pay dividends at any time during the fiscal year in addition to the year-end dividend upon resolution at the shareholdersrsquo meeting Additionally for companies that meet certain criteria including (1) having a Board of Directors (2) having independent auditors (3) having an Audit amp Supervisory Board and (4) the term of service of the directors being prescribed as one year rather than the normal two-year term by its articles of incorporation the Board of Directors may declare dividends (except for dividends-in-kind) at any time during the fiscal year if the company has prescribed so in its articles of incorporation However the Company cannot do so because it does not meet all the above criteria
The Companies Act permits companies to distribute dividends-in-kind (noncash assets) to shareholders subject to a certain limitation and additional requirements
Semiannual interim dividends may also be paid once a year upon resolution by the Board of Directors if the articles of incorporation of the company so stipulate The Companies Act provides certain limitations on the amounts available for dividends or the purchase of treasury stock The limitation is defined as the amount available for distribution to the shareholders but the amount of net assets after dividends must be maintained at no less than yen3 million
(2) Increasesdecreases and transfer of common stock reserve and surplus
The Companies Act requires that an amount equal to 10 of dividends must be appropriated as a legal reserve (a component of retained earnings) or as additional paid-in capital (a component of capital surplus) depending on the equity account charged upon the payment of such dividends until the aggregate amount of legal reserve and additional paid-in capital equals 25 of the common stock Under the Companies Act the total amount of additional paid-in capital and legal reserve may be reversed without limitation The Companies Act also provides that common stock legal reserve additional paid-in capital other capital surplus and retained earnings can be transferred among the accounts within equity under certain conditions upon resolution of the shareholders
28
(3) Treasury stock and treasury stock acquisition rights
The Companies Act also provides for companies to purchase treasury stock and dispose of such treasury stock by resolution of the Board of Directors The amount of treasury stock purchased cannot exceed the amount available for distribution to the shareholders which is determined by a specific formula Under the Companies Act stock acquisition rights are presented as a separate component of equity The Companies Act also provides that companies can purchase both treasury stock acquisition rights and treasury stock Such treasury stock acquisition rights are presented as a separate component of equity or deducted directly from stock acquisition rights
Effective June 28 2018 the Company transferred capital surplus to retained earnings based on the resolution of the Shareholdersrsquo Meeting held on June 28 2018
Effective October 1 2018 the Company has implemented a 1-for-10 reverse stock split of common stock based on the resolution of the Shareholdersrsquo Meeting held on June 28 2018
13 INCOME TAXES
The Company and its domestic subsidiaries are subject to Japanese national and local income taxes which in the aggregate resulted in a normal effective statutory tax rate of approximately 302 and 305 for the years ended March 31 2019 and 2018 respectively
The tax effects of significant temporary differences and tax loss carryforwards that resulted in deferred tax assets and liabilities as of March 31 2019 and 2018 were as follows
Millions of Yen Thousands ofUS Dollars
2019 2018 2019
Deferred tax assetsTax loss carryforwards (Note 2) yen 3630 yen 3642 $ 32999 Liability for employeesrsquo retirement benefits 2510 2528 22815 Loss on write-downs of inventories 1761 2101 16013 Land and building of plants 1458 1487 13253 Loss on impairment of fixed assets 1155 1218 10502 Accrued bonuses to employees 485 446 4411 Provision for loss on orders received 273 1682 2485 Other 1834 2352 16664
Sub-total 13106 15456 119142
Less valuation allowance for tax loss crryforwards (Note 2) (3630) - (32999)
Less valuation allowance pertaining to total amount of deductible temporary differences (7974) - (72493)Valuation allowance total (Note 1) (11604) (15320) (105492)
Total yen 1502 yen 136 $ 13650
Deferred tax liabilitiesUnrealized gain on available-for-sale securities yen (3842) yen (3308) $ (34924)Deferred gain on sales of property - (22) -Other (3549) (2903) (32264)
Total (7391) (6233) (67188)Net deferred tax liabilities yen (5889) yen (6097) $ (53538)
Notes 1 Valuation allowance decreased by yen3716 million ($33779 thousand) during the year ended March 31 2019 This is mainly due to the decrease of deductible temporary differences on the one hand On the other hand the respective deferred tax assets related to tax loss carryforwards were partly judged as recoverable as a result of careful consideration taking into account the current and estimated future taxable income
2 Expected maturity of the deferred tax assets after the balance sheet date for tax loss carryforwards as of March 31 2019 was as follows
29
The expiration of tax loss carryforwards the related valuation allowances and the resulting net deferred tax assets as of March 31 2019 were as follows
Millions of Yen
2019 Within 1 year
Over 1 year but within
2 years
Over 2 years but within
3 years
Over 3 years but within
4 years
Over 4 years but within
5 years
Over 5 years Total
Deferred tax assets relating to tax loss carryforwards () - - - - - yen 3630 yen 3630
Less valuation allowance for tax loss carry forwards - - - - - (3630) (3630)
Net deferred tax assets relating to tax loss carry forwards - - - - - - -
Thousands of US Dollars
2019 Within 1 year
Over 1 year but within
2 years
Over 2 years but within
3 years
Over 3 years but within
4 years
Over 4 years but within
5 years
Over 5 years Total
Tax loss carryforwards () - - - - - $ 32999 $ 32999
Valuation allowance - - - - - (32999) (32999)
Deferred tax assets - - - - - - -
()The amount of tax loss carryforwards was calculated by using the statutory tax rate
A reconciliation between the normal effective statutory tax rates and the actual effective tax rates reflected in the accompanying consolidated statement of operations for the year ended March 31 2019 with the corresponding figures for 2018 is as follows
2019 2018Normal effective statutory tax rate 302 305 Increase (decrease) due to
Expenses not deductible for income tax purposes 39 (290)Tax-exempt income (03) 02Changes in valuation allowance (376) 156Per capita inhabitant tax 04 (03)Transfer price adjustments on consolidation (54) 91Higher (lower) income tax rates applicable to income in certain foreign countries 18 (07)
Other (09) 12Actual effective income tax rate (79) 266
14 FINANCIAL INSTRUMENTS AND RELATED DISCLOSURES
(1) Group policy for financial instruments
The Group finances capital investments and necessary funds mainly internally and with CMS provided by a consolidated subsidiary of CJR The Company also operates funds by utilizing CMS Derivative transactions are used not for speculative purposes but to manage exposure to financial risks as described in (2) below
(2) Nature and extent of risks arising from financial instruments
Receivables such as notes and accounts receivable are exposed to customer credit risk Although receivables in foreign currencies are exposed to the risk of fluctuation in foreign currency exchange rates the position net of payables in foreign currencies is hedged by using forward foreign currency contracts Investment securities mainly equity instruments of customers and suppliers of the Group are exposed to the risk of market price fluctuations
30
Payment terms of payables such as trade notes and trade accounts are less than one year Although payables in foreign currencies are exposed to the risk of fluctuation in foreign currency exchange rates the position net of receivables in foreign currencies is hedged by using forward foreign currency contracts
Long-term debt recorded for the transfer price of the factory assets transferred to CJR and for a part of capital expenditure related to the transferred factory assets is not exposed to market risks from changes in variable interest rates since the Company repays a constant lease fee including the interest portion based on the lease agreement Long-term debt from CJR for the payment of settlement money related to a large railway rolling stock project in the USA is also not exposed to market risks from changes in variable interest rates due to the fixed interest rate Lease obligations are primarily used for financing capital investments
Derivatives mainly include forward foreign currency contracts which are used to manage exposure to risks associated with fluctuations in foreign currency exchange rates related to receivables and payables denominated in foreign currencies and forecasted transactions denominated in foreign currencies Please see Note 15 for more information about derivatives
(3)Risk management for financial instruments
Credit risk management
Credit risk is the risk of economic loss arising from a counterpartyrsquos failure to repay or service debt according to the contractual terms The Group manages its credit risk from receivables by monitoring financial position payment terms and balances of customers to identify default risk of customers at an early stage
Market risk management (foreign exchange risk and interest rate risk)
Foreign currency trade receivables and payables are exposed to market risk resulting from fluctuations in foreign currency exchange rates Such foreign exchange risk is hedged principally by forward foreign currency contracts In addition when foreign currency trade receivables and payables are expected from forecasted transactions forward foreign currency contracts may be used
Investment securities are managed by monitoring the market values and the financial position of issuers on a regular basis
Liquidity risk management
The Group establishes or updates its cash management plan according to the monthly cash management plan from each subsidiary in order to monitor its liquidity risk associated with operating payables and short-term borrowings and long-term debt
(4)Fair values of financial instruments
Fair values of financial instruments are based on quoted prices in active markets If quoted prices are not available other rational valuation techniques are used instead Please see Note 15 for the details of the fair value of derivatives
(a) Fair value of financial instrumentsMillions of Yen
2019Carrying amount Fair value Unrealized
gain (loss)Cash and cash equivalents yen 12721 yen 12721 -Notes and accounts receivable 29756 29756 -Investment securities 18781 18781 -
Total yen 61258 yen 61258 -
Notes and accounts payable yen 22912 yen 22912 -Income taxes payable 538 538 -Long-term debt including current portion 35000 35609 yen (609)Lease obligations including current portion 2328 2315 13
Total yen 60778 yen 61374 yen (596)
31
Millions of Yen2018
Carrying amount Fair value Unrealized
gain (loss)Cash and cash equivalents yen 15837 yen 15837 -Notes and accounts receivable 28526 28526 -Investment securities 17024 17024 -
Total yen 61387 yen 61387 -
Notes and accounts payable yen 24845 yen 24845 -Income taxes payable 132 132 -Long-term debt including current portion 35000 35127 yen (127)Lease obligations including current portion 2473 2454 19
Total yen 62450 yen 62558 yen (108)
Thousands of US Dollars2019
Carrying amount Fair value Unrealized
gain (loss)Cash and cash equivalents $ 115645 $ 115645 -Notes and accounts receivable 270513 270513 -Investment securities 170733 170733 -
Total $ 556891 $ 556891 -
Notes and accounts payable $ 208287 $ 208287 -Income taxes payable 4888 4888 -Long-term debt including current portion 318183 323721 $ (5538)Lease obligations including current portion 21164 21046 118
Total $ 552522 $ 557942 $ (5420)
AssetsCash and cash equivalents and notes and accounts receivableThe carrying values of cash and cash equivalents and notes and accounts receivable approximate fair value because of their short maturities
Investment securitiesThe fair values of investment securities are measured at the quoted market prices of the stock exchange The information on the fair value of investment securities by classification is included in Note 5
LiabilitiesNotes and accounts payable and income taxes payableThe carrying values of notes and accounts payable and income taxes payable approximate fair value since they are scheduled to be settled in a short period of time
Long-term debt and lease obligationsThe fair values of long-term debt (including the current portion) and lease obligations are measured at the present value of the total of the principal and interest discounted by the interest rate applied to new loans
Derivative transactionsInformation on the fair value of derivatives is included in Note 15
32
(b)Carrying amount of financial instruments whose fair value cannot be reliably determined
Millions of Yen Thousands ofUS Dollars
2019 2018 2019Unlisted securities yen 1600 yen 1608 $ 14548Investments in an unconsolidated subsidiary and
associated companies 795 728 7226
Long-term debt recorded for the transfer price of the factory assets transferred to CJR and for a part of capital expenditure related to the transferred factory assets (including the current portion)
20515 20687 186501
(5)Maturity analysis for financial assets and securities with contractual maturities
Millions of Yen2019
Due in one year or less
Due after one year through
five years
Due after five years through
10 years
Due after 10 years
Cash and cash equivalents yen 12721 - - -Notes and accounts receivable 29402 yen 354 yen - -
Total yen 42123 yen 354 yen - -
Thousands of US Dollars2019
Due in oneyear or less
Due after one year through
five years
Due after five years through
10 years
Due after 10 years
Cash and cash equivalents $ 115645 - - -Notes and accounts receivable 267294 $ 3219 $ - -
Total $ 382939 $ 3219 $ - -
Please see Note 7 for annual maturities of long-term debt and Note 11 for obligations under finance leases
15 DERIVATIVE TRANSACTIONS
The Group enters into forward foreign currency contracts to hedge foreign exchange risk associated with certain assets and liabilities denominated in foreign currencies
All derivative transactions are entered into to hedge interest and foreign currency exposures incorporated within its business Accordingly market risk in these derivatives is basically offset by opposite movements in the value of hedged assets or liabilities
Derivative transactions entered into by the Group have been made in accordance with internal policies which regulate the authorization and credit limit amount
33
There was no derivative transaction to which hedge accounting was applied for the year ended March 31 2019 Derivative transactions to which hedge accounting was applied for the year ended March 31 2018 were as follows
Millions of Yen2018
Hedgeditem
Contractamount
Contract amount due
after one yearFairvalue
CurrencyForward foreign currency contracts
Buying
USD Advance payments yen 152 - yen (8)
16 LOSS ON IMPAIRMENT OF PROPERTY PLANT AND EQUIPMENT
The Group recognized impairment losses on the following asset groups
For the year ended March 31 2019Millions of Yen Thousands of US Dollars
Asset group Location Account 2019 2019Idle assets Shinanomachi Nagano Land yen 14 $ 133Idle assets Nagoya Aichi Buildings and structures etc 17 153Idle assets Illinois USA Machinery and equipment 239 2170
Total yen 270 $ 2456
For the year ended March 31 2018Millions of Yen
Asset group Location Account 2018
Idle assets Nakatsugawa Gifu Buildings and structures land etc yen 34
Total yen 34
The Group reviewed its long-lived assets for impairment as of March 31 2019 and 2018
For the years ended March 31 2019 and 2018 the Group recognized an impairment loss for idle assets by writing down the property to its net selling value (based on reasonably adjusted amount of property tax assessment value)
Upon the decision to close the manufacturing plant of an US subsidiary NIPPON SHARYO USA INC in Rochelle Illinois USA on July 24 2018 the sale of the plant to a third party has been considered Therefore we recognized an impairment loss on the manufacturing plant at its net selling value for the year ended March 31 2019
Impairment losses other than the above were not disclosed as they were immaterial
17 RELATED-PARTY DISCLOSURES
(1)Parent and major shareholders
CJR directly owned 512 of the total shares of the Company as of March 31 2019 and 2018 The Company distributes transportation vehicles to CJR
34
Transactions of the Company with CJR for the years ended March 31 2019 and 2018 were as follows
For the year ended March 31 2019 Millions of Yen Thousands ofUS Dollars
2019 2019Sales yen 19955 $ 181413Borrowing of funds 117 1072Repayment of debt 289 2631Interest expense 337 3067
Borrowing of funds repayment of debt and interest expense of yen117 million ($1072 thousand) yen289 million ($2631 thousand) and yen127 million ($1158 thousand) respectively were recorded for the transfer of the factory assets transferred to CJR and for a part of capital expenditure related to the transferred factory assets
For the year ended March 31 2018 Millions of Yen
2018Sales yen 24001Borrowing of funds 56000Repayment of debt 313Interest expense 193
Borrowing of funds repayment of debt and interest expense of yen21000 million yen313 million and yen122 million respectively were recorded for the transfer of the factory assets transferred to CJR and for a part of capital expenditure related to the transferred factory assets
The balances due to or from CJR as of March 31 2019 and 2018 were as follows
As of March 31 2019 Millions of Yen Thousands ofUS Dollars
2019 2019Accounts receivable yen 5993 $ 54483Current portion of long-term debt 296 2688Long-term debt 55219 501996Accrued expenses 43 392
Current portion of long-term debt long-term debt and accrued expenses of yen296 million ($2688 thousand) yen20220 million ($183815 thousand) and yen42 million ($381 thousand) respectively were the balances related to long-term debt for the transfer price of the factory assets transferred to CJR and for a part of capital expenditure related to the transferred factory assets
As of March 31 2018 Millions of Yen
2018Accounts receivable yen 5947Current portion of long-term debt 287Long-term debt 55400Accrued expenses 43
Current portion of long-term debt long-term debt and accrued expenses of yen287 million yen20400 million and yen42 million respectively were the balances related to long-term debt for the transfer price of the factory assets transferred to CJR and for a part of capital expenditure related to the transferred factory assets
(2)Fellow subsidiaries and subsidiaries of other affiliates
35
Transactions of the Company with the fellow subsidiaries for the years ended March 31 2019 and 2018 were as follows
For the year ended March 31 2019Millions of Yen Thousands of
US Dollars2019 2019
JR Central Financial Management Co Ltd Interest income yen 5 $ 45
For the year ended March 31 2018Millions of Yen
2018JR Central Financial Management Co Ltd Interest income yen 2
The balances due to or from the fellow subsidiaries as of March 31 2019 and 2018 were as follows
As of March 31 2019Millions of Yen Thousands of
US Dollars2019 2019
JR Central Financial Management Co LtdCash and cash equivalents yen 7398 $ 67255
As of March 31 2018Millions of Yen
2018JR Central Financial Management Co LtdCash and cash equivalents yen 7534
36
18 OTHER COMPREHENSIVE INCOME
The components of other comprehensive income for the years ended March 31 2019 and 2018 were as follows
Millions of Yen Thousands of US Dollars
2019 2018 2019Unrealized gain on available-for-sale securities
Gains arising during the year yen 1753 yen 1131 $ 15938Reclassification adjustments to profit or loss - (0) -Amount before income tax effect 1753 1131 15938Income tax effect (533) (354) (4848)
Total yen 1220 yen 777 $ 11090Deferred gain (loss) on derivatives under hedge accounting
Gains (losses) arising during the year yen 8 yen (5) $ 69Income tax effect - - -
Total yen 8 yen (5) $ 69Foreign currency translation adjustments
Adjustments arising during the year yen (33) yen (105) $ (301)Total yen (33) yen (105) $ (301)
Defined retirement benefit plansAdjustments arising during the year yen 2216 yen 1396 $ 20145Reclassification adjustments to profit or loss (648) (432) (5887)Amount before income tax effect 1568 964 14258Income tax effect (475) (296) (4320)
Total yen 1093 yen 668 $ 9938Share of other comprehensive (loss) income in associated companies
Gains arising during the year yen (9) yen 36 $ (81)Income tax effect - - -
Total yen (9) yen 36 $ (81)
Total other comprehensive income yen 2279 yen 1371 $ 20715
19 SEGMENT INFORMATION
Under ASBJ Statement No 17 ldquoAccounting Standard for Segment Information Disclosuresrdquo and ASBJ Guidance No 20 ldquoGuidance on Accounting Standard for Segment Information Disclosuresrdquo an entity is required to report financial and descriptive information about its reportable segments Reportable segments are operating segments or aggregations of operating segments that meet specified criteria Operating segments are components of an entity about which separate financial information is available and such information is evaluated regularly by the chief operating decision maker in deciding how to allocate resources and in assessing performance Generally segment information is required to be reported on the same basis as is used internally for evaluating operating segment performance and deciding how to allocate resources to operating segments
(1)Description of reportable segments
The Grouprsquos reportable segments are those for which separate financial information is available and regular evaluation by the Companyrsquos management is being performed in order to decide how resources are allocated among the Group
The Group has operational headquarters by each product or service Each of the operational headquarters develops comprehensive strategies and engages in business activities relating to each product and service Accordingly the Group is comprised of segments organized by products or services based on the operational headquarters and there are four reportable segments ldquoRailway Rolling Stockrdquo ldquoTransportation Equipment and Steel Structurerdquo ldquoConstruction Equipmentrdquo and ldquoEngineeringrdquo
37
ldquoRailway Rolling Stockrdquo consists of manufacture and sales of rolling stock such as EMUs and railway motor cars
ldquoTransportation Equipment and Steel Structurerdquo consists of manufacture and sales of transportation equipment such as freight cars tank trucks heavy-duty industrial vehicles and manufacture and construction of roadway and railway bridges
ldquoConstruction Equipmentrdquo consists of manufacture and sales of pile driving rigs crawler cranes casing rotators portable diesel generator sets and emergency generators
ldquoEngineeringrdquo consists of manufacture and sales of railway rolling stock inspectionmaintenance systems agricultural plants and pulp and paper plants
(2)Method of measurement for the amount of sales profit (loss) assets and other items for each reportable segment
The accounting policies of each reportable segment are consistent with those disclosed in Note 2 ldquoSummary of Significant Accounting Policiesrdquo Reporting segment profit represents operating income Intersegment transactions are based upon armrsquos-length transactions
(3)Information of sales profit (loss) assets and other items was as follows
Millions of Yen2019
Reportable segmentRailway Rolling Stock
Transportation Equipment and Steel Structure
Construction Equipment Engineering Other Total Reconciliations Consolidated
Net salesSales to external customers yen 38049 yen 21794 yen 25167 yen 6006 yen 163 yen 91179 - yen 91179Intersegment sales or transfers 129 187 13 67 185 581 yen (581) -
Total yen 38178 yen 21981 yen 25180 yen 6073 yen 348 yen 91760 yen (581) yen 91179
Segment profit (loss) yen 2034 yen 2040 yen 4887 yen 386 yen (27) yen 9320 yen (820) yen 8500Segment assets yen 47448 yen 22556 yen 22978 yen 2906 yen 645 yen 96533 yen 37661 yen 134194Other
Depreciation yen 1046 yen 276 yen 779 yen 15 yen 2 yen 2118 yen 252 yen 2370Increase in property plant and
equipment and intangible assets 1010 937 740 22 2 2711 160 2871
Millions of Yen2018
Reportable segmentRailway Rolling Stock
Transportation Equipment and Steel Structure
Construction Equipment Engineering Other Total Reconciliations Consolidated
Net salesSales to external customers yen 41455 yen 22475 yen 24573 yen 6560 yen 248 yen 95311 - yen 95311Intersegment sales or transfers 261 331 10 23 192 817 yen (817) -
Total yen 41716 yen 22806 yen 24583 yen 6583 yen 440 yen 96128 yen (817) yen 95311
Segment profit (loss) yen 1413 yen 1991 yen 5270 yen (75) yen (93) yen 8506 yen (1240) yen 7266Segment assets yen 46176 yen 19734 yen 22724 yen 4684 yen 669 yen 93987 yen 33426 yen 127413Other
Depreciation yen 1340 yen 319 yen 760 yen 14 yen 2 yen 2435 yen 293 yen 2728Increase in property plant and
equipment and intangible assets 563 143 962 5 0 1673 107 1780
38
Thousands of US Dollars2019
Reportable segmentRailway Rolling Stock
Transportation Equipment and Steel Structure
Construction Equipment Engineering Other Total Reconciliations Consolidated
Net salesSales to external customers $ 345904 $ 198128 $ 228791 $ 54601 $ 1480 $ 828904 - $ 828904Intersegment sales or transfers 1169 1696 122 608 1682 5277 $ (5277) -
Total $ 347073 $ 199824 $ 228913 $ 55209 $ 3162 $ 834181 $ (5277) $ 828904
Segment profit (loss) $ 18494 $ 18548 $ 44423 $ 3512 $ (248) $ 84729 $ (7459) $ 77270Segment assets $ 431340 $ 205056 $ 208891 $ 26422 $ 5859 $ 877568 $ 342384 $ 1219952Other
Depreciation $ 9513 $ 2515 $ 7080 $ 133 $ 14 $ 19255 $ 2294 $ 21549Increase in property plant and
equipment and intangible assets 9186 8514 6725 202 15 24642 1461 26103
Notes 1 ldquoOtherrdquo represents businesses that are not included in any reportable segment which includes manufacture and sales of laser processing system sales of railroad-related merchandise and real estate rental
2 ldquoReconciliationsrdquo in segment profit (loss) include corporate expenses of yen(854) million ($(7766) thousand) and yen(1294) million for the years ended March 31 2019 and 2018 respectively elimination of intersegment transactions of yen27 million ($246 thousand) and yen42 million for the years ended March 31 2019 and 2018 Corporate expenses principally consist of general and administrative expenses that are not attributable to any reportable segment
3 ldquoReconciliationsrdquo in segment assets include total corporate assets of yen32158 million ($292350 thousand) and yen29889 million elimination of intersegment balances of yen(116) million ($(1051) thousand) and yen(136) million and adjustments in inventories of yen(61) million ($(556) thousand) and yen(68) million as of March 31 2019 and 2018 respectively Total corporate assets principally consist of investment securities and general management properties as of March 31 2019 and 2018
4 Segment profit (loss) is reconciled to operating income in the consolidated statement of operations
Associated Information
(1) Information about products and services is not disclosed since similar information is disclosed above
(2) Information about geographical areas for the year ended March 31 2019 was as follows
Millions of Yen2019
Japan USA Asia Other TotalNet sales yen 81477 yen 156 yen 9503 yen 43 yen 91179
Note Sales are based on the location of the customers and grouped by country or area
Information about net sales by geographical areas for the year ended March 31 2018 is not disclosed since net sales to external customers in Japan exceeds 90 of consolidated net sales
Millions of Yen2019
Japan USA Asia Other TotalProperty plant and equipment yen 24784 yen 3630 yen 0 yen 0 yen 28414
39
Millions of Yen2018
Japan USA Asia Other TotalProperty plant and equipment yen 24306 yen 4258 yen 0 yen 0 yen 28564
Thousands of US Dollars2019
Japan USA Asia Other TotalProperty plant and equipment $ 225304 $ 33001 $ 1 $ 0 $ 258306
(3) Information about major customers Net sales
Millions of Yen Thousands of US Dollars
Relatedsegment
Name of major customer 2019 2018 2019
CJR yen 19955 yen 24001 $ 181413Railway Rolling Stock
Transportation Equipment and Steel Structure
(4) Information about loss on impairment of property plant and equipment by reportable segment
Millions of Yen2019
Reportable segmentRailwayRolling Stock
TransportationEquipment andSteel Structure
ConstructionEquipment
Engineer-ing Other Total
Recon-ciliations
Consoli-dated
Impairment loss yen 238 - - - - yen 238 32 yen 270
Millions of Yen2018
Reportable segmentRailwayRolling Stock
TransportationEquipment andSteel Structure
ConstructionEquipment
Engineer-ing Other Total
Recon-ciliations
Consoli-dated
Impairment loss yen - - - - - yen - 34 yen 34
Thousands of US Dollars2019
Reportable segmentRailwayRolling Stock
TransportationEquipment andSteel Structure
ConstructionEquipment
Engineer-ing Other Total
Recon-ciliations
Consoli-dated
Impairment loss $ 2168 - - - - $ 2168 288 $ 2456
Note The amount of ldquoReconciliationsrdquo is related to idle assets which are not attributable to any reporting segment
40
Corporate Profile
Line of Business
Overview of the Main SegmentsNIPPON SHARYO manufactures and sells the following products
Business segment Lines of business
Railway rolling stock EMUs DMUs Passenger Cars Linear Motor Cars Track Maintenance Machines Rolling Stock Components and Automated Guideway Transit Systems
Transportation equipment and Steel structure
Freight Cars Locomotives Tank Trucks Tank Trailers Storage Tanks Heavy-duty Industrial Vehicles Containers Automated Guided Vehicles Roadway Bridges Railway Bridges Water Gates
Construction equipmentPile Driving Rigs Crawler Cranes Hydraulic Hammers Casing Rotators Other Products Related to Foundation Work Portable Diesel Generator Sets Emergency Generators Various Products Related to Electric Machines
Engineering Agricultural Plants Grain Complex Seed Processing Plants Railway Rolling Stock InspectionMaintenance System Pulp and Paper Plants
OFFICE
PLANT
Company Name NIPPON SHARYO LTD
Capital Stock
Common StockAuthorized 32800000 shares
Common StockIssued 14675012 shares
Number of Shareholders 12509 persons
(March 31 2019)
Company History
Sep 1896 Established in Nagoya CityJun 1938 Founded Narumi PlantMay 1949 Re-listed on Tokyo Stock ExchangeJan 1959 Began Construction Machinery BusinessOct 1961 Started Bridge ManufacturingJul 1964 Founded Toyokawa PlantJun 1975 Founded Kinuura PlantSep 1996 100th AnniversaryAug 2008 Equity and business tie-up entered into with Central Japan Railway CompanyAug 2019 Manufactured 4000th Shinkansen EMU
HEAD OFFICE (NAGOYA)
1-1 Sanbonmatsu-choAtsuta-ku Nagoya 456-8691 JAPANPhone +81-52-882-3316Fax +81-52-882-3781
TOKYO OFFICE OSAKA BRANCH
14th FLNorth Gate Building3-1-3 UmedaKita-ku Osaka 530-0001 JAPANPhone +81-6-6341-4455Fax +81-6-6341-4487
12th Fl Marunouchi Central Bldg1-9-1 MarunouchiChiyoda-ku Tokyo 100-0005 JAPANPhone +81-3-6688-6808Fax +81-3-6688-6813
TOYOKAWA PLANT
2-20 HonoharaToyokawa Aichi-pref 442-8502 JAPANPhone +81-533-85-4900Fax +81-533-85-4123
(Railway rolling stock amp other transportation equipment)NARUMI PLANT
80 Ryucho Narumi-choMidori-ku Nagoya 458-8502 JAPANPhone +81-52-623-3529Fax +81-52-623-4349
(Construction equipment)KINUURA PLANT
20 11-gouchiHanda Aichi 475-0831 JAPAN
(Steel structure)
NIPPON SHARYO USA INC
2340 S Arlington Heights Road Suite 605 Arlington Heights IL 60005 USAAttn NIPPON SHARYO ENGINEERING amp MARKETING LLCPhone +1-847-228-2700Fax +1-847-228-5530
Corporate Information
Directory
41
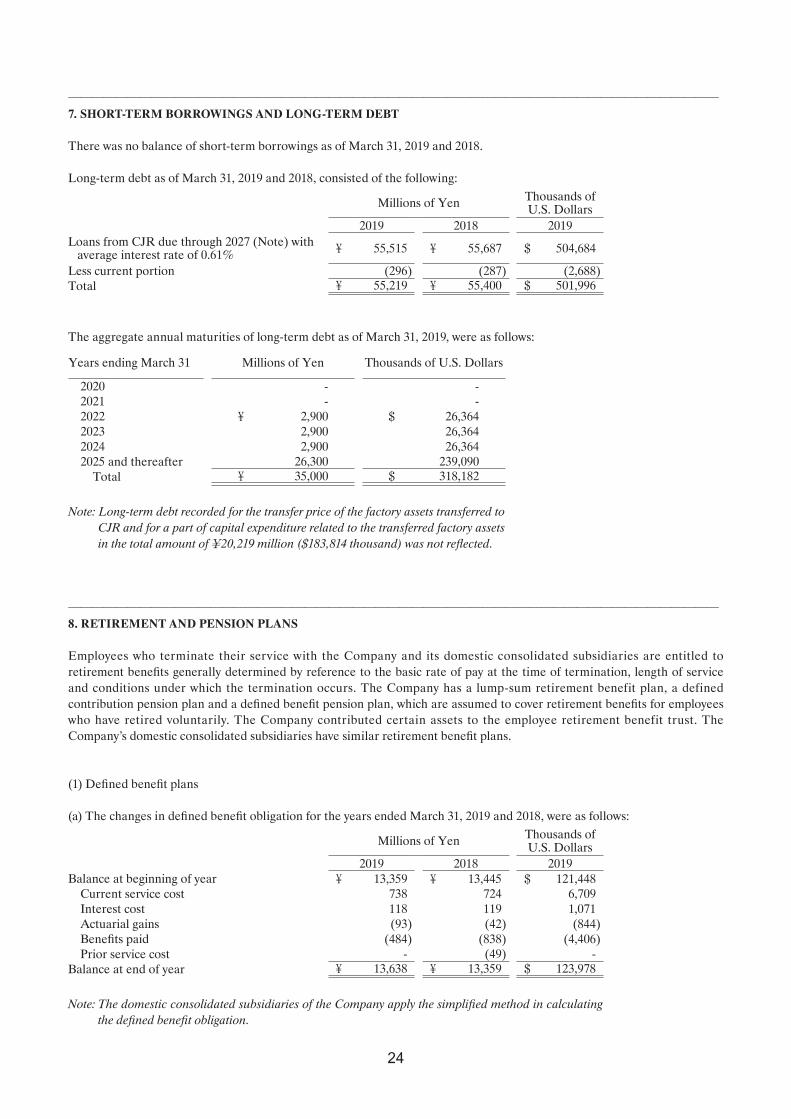
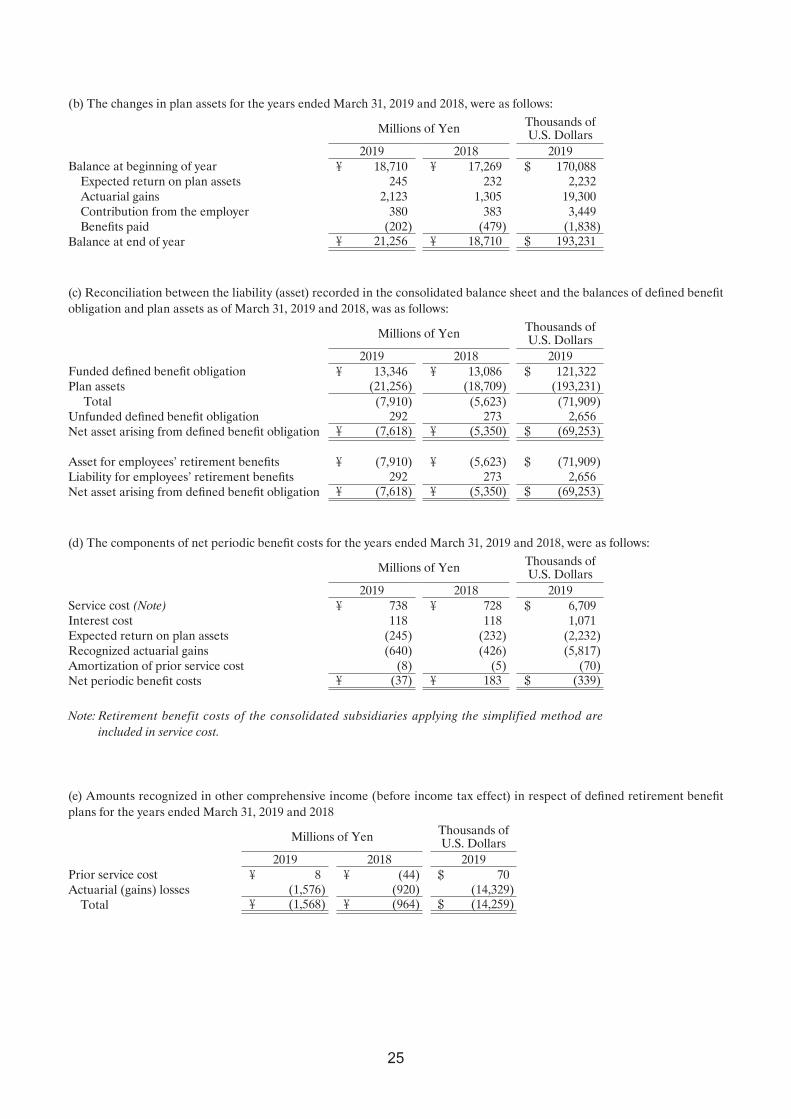
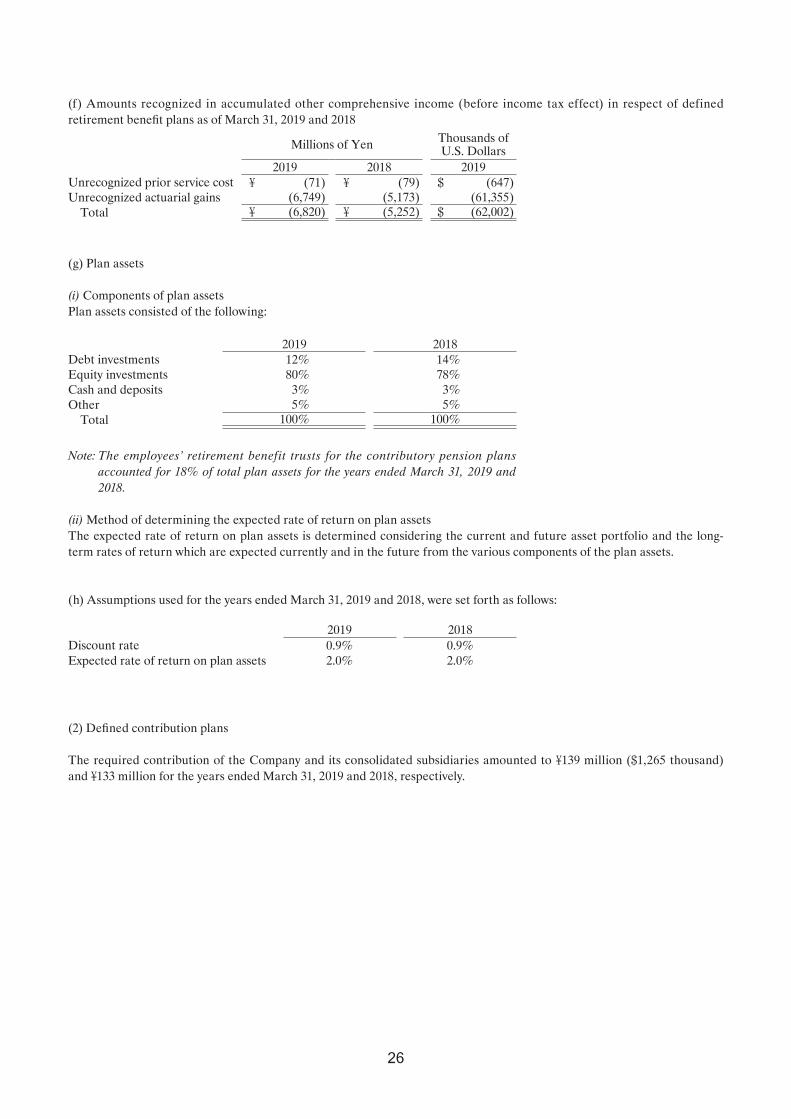
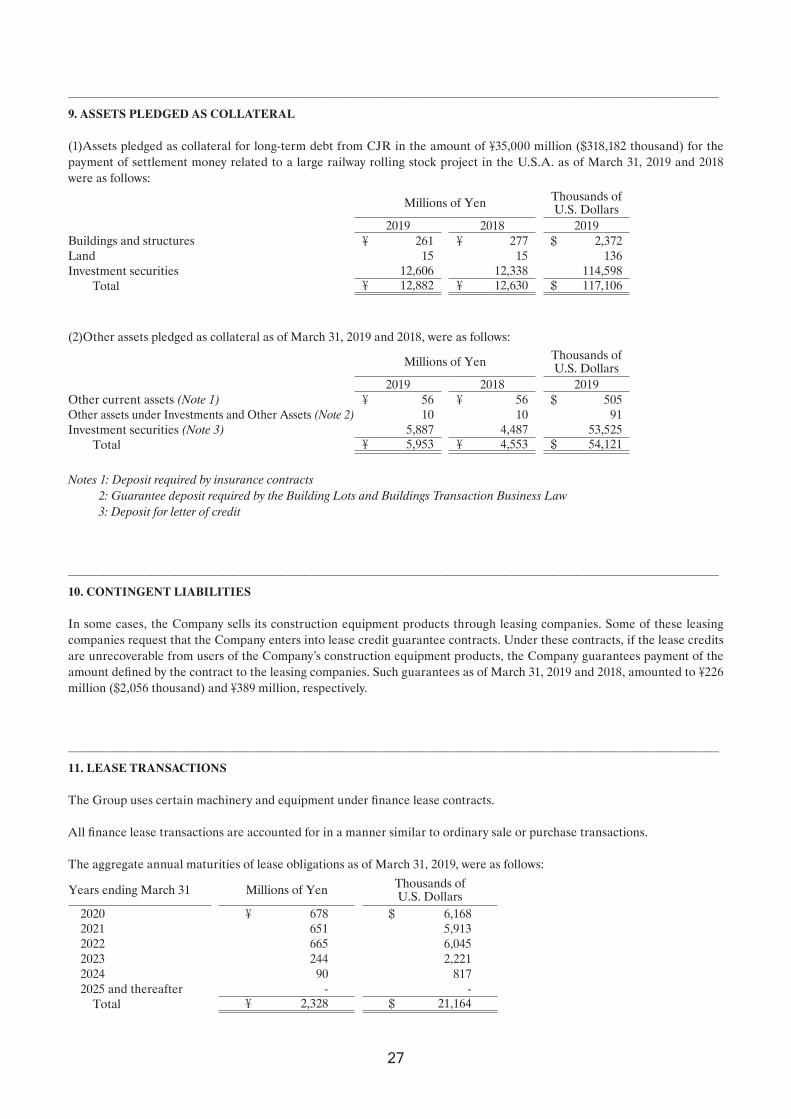
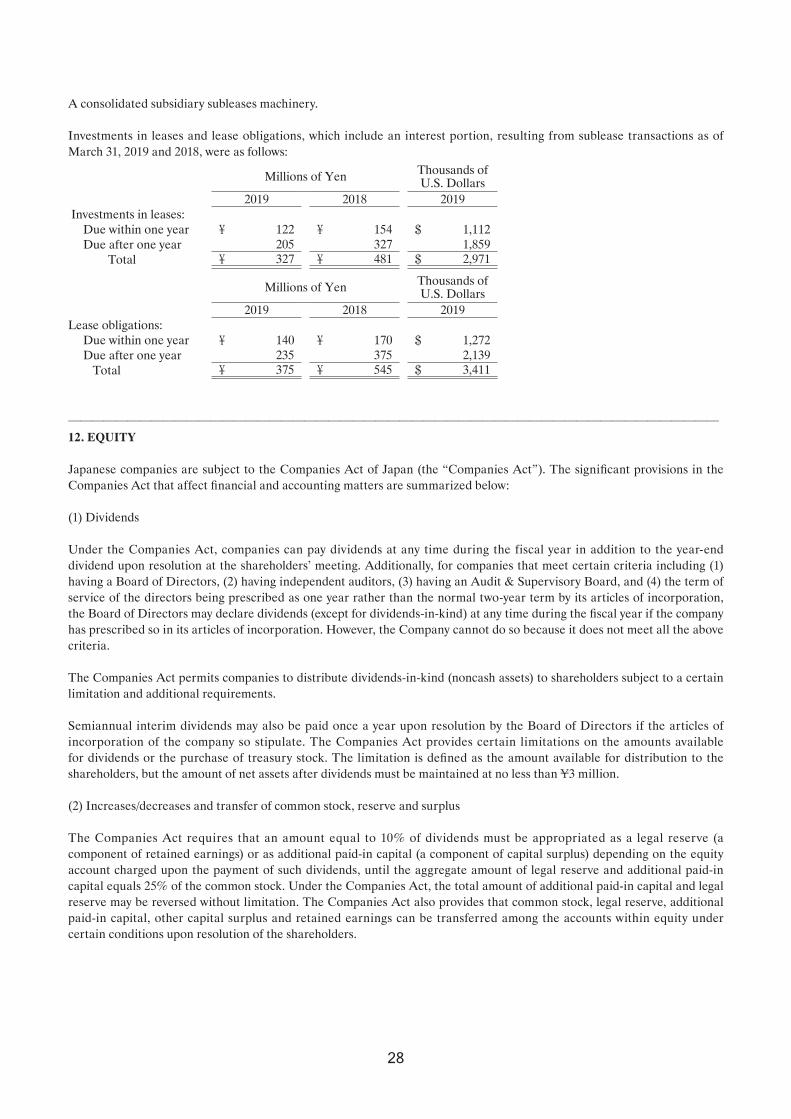
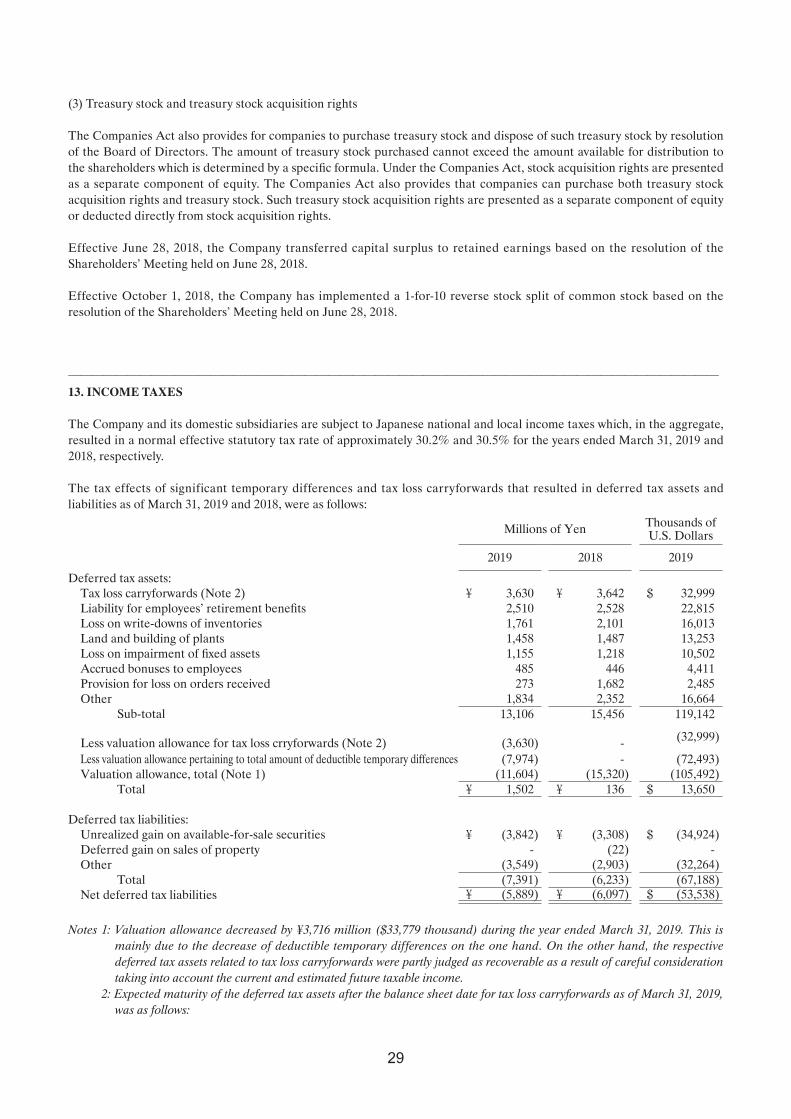
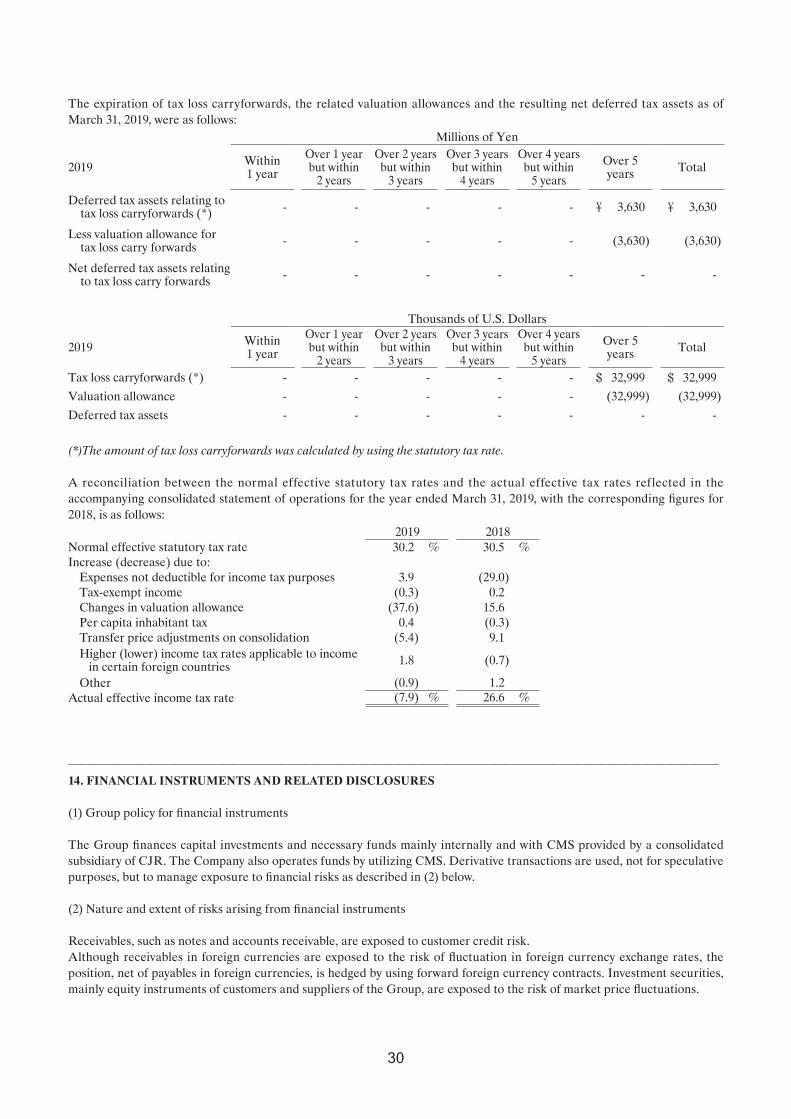
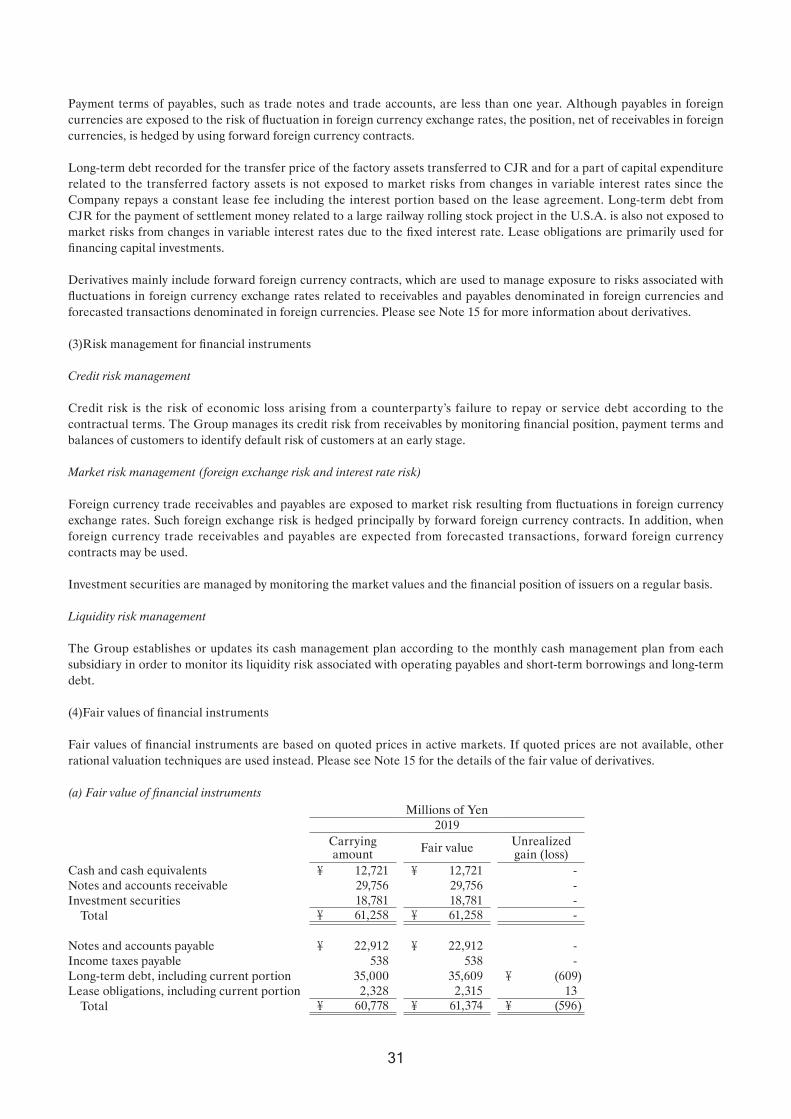
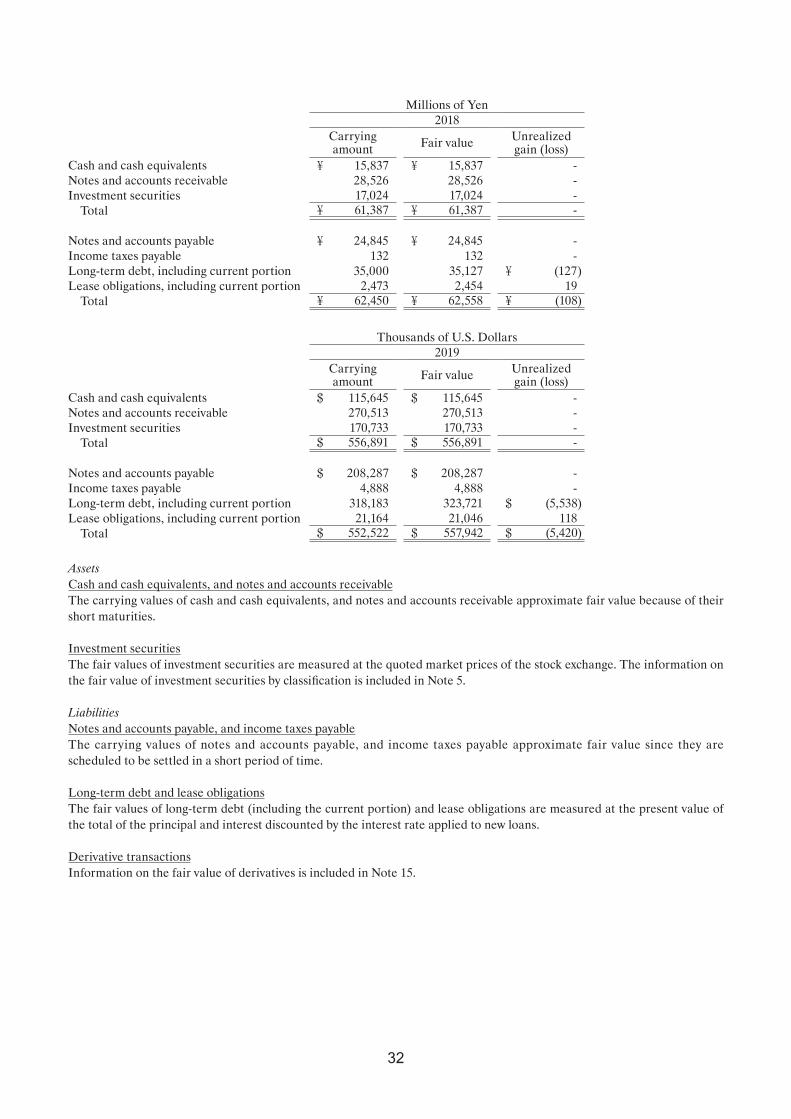
Millions of Yen2018
Carrying amount Fair value Unrealized
gain (loss)Cash and cash equivalents yen 15837 yen 15837 -Notes and accounts receivable 28526 28526 -Investment securities 17024 17024 -
Total yen 61387 yen 61387 -
Notes and accounts payable yen 24845 yen 24845 -Income taxes payable 132 132 -Long-term debt including current portion 35000 35127 yen (127)Lease obligations including current portion 2473 2454 19
Total yen 62450 yen 62558 yen (108)
Thousands of US Dollars2019
Carrying amount Fair value Unrealized
gain (loss)Cash and cash equivalents $ 115645 $ 115645 -Notes and accounts receivable 270513 270513 -Investment securities 170733 170733 -
Total $ 556891 $ 556891 -
Notes and accounts payable $ 208287 $ 208287 -Income taxes payable 4888 4888 -Long-term debt including current portion 318183 323721 $ (5538)Lease obligations including current portion 21164 21046 118
Total $ 552522 $ 557942 $ (5420)
AssetsCash and cash equivalents and notes and accounts receivableThe carrying values of cash and cash equivalents and notes and accounts receivable approximate fair value because of their short maturities
Investment securitiesThe fair values of investment securities are measured at the quoted market prices of the stock exchange The information on the fair value of investment securities by classification is included in Note 5
LiabilitiesNotes and accounts payable and income taxes payableThe carrying values of notes and accounts payable and income taxes payable approximate fair value since they are scheduled to be settled in a short period of time
Long-term debt and lease obligationsThe fair values of long-term debt (including the current portion) and lease obligations are measured at the present value of the total of the principal and interest discounted by the interest rate applied to new loans
Derivative transactionsInformation on the fair value of derivatives is included in Note 15
32
(b)Carrying amount of financial instruments whose fair value cannot be reliably determined
Millions of Yen Thousands ofUS Dollars
2019 2018 2019Unlisted securities yen 1600 yen 1608 $ 14548Investments in an unconsolidated subsidiary and
associated companies 795 728 7226
Long-term debt recorded for the transfer price of the factory assets transferred to CJR and for a part of capital expenditure related to the transferred factory assets (including the current portion)
20515 20687 186501
(5)Maturity analysis for financial assets and securities with contractual maturities
Millions of Yen2019
Due in one year or less
Due after one year through
five years
Due after five years through
10 years
Due after 10 years
Cash and cash equivalents yen 12721 - - -Notes and accounts receivable 29402 yen 354 yen - -
Total yen 42123 yen 354 yen - -
Thousands of US Dollars2019
Due in oneyear or less
Due after one year through
five years
Due after five years through
10 years
Due after 10 years
Cash and cash equivalents $ 115645 - - -Notes and accounts receivable 267294 $ 3219 $ - -
Total $ 382939 $ 3219 $ - -
Please see Note 7 for annual maturities of long-term debt and Note 11 for obligations under finance leases
15 DERIVATIVE TRANSACTIONS
The Group enters into forward foreign currency contracts to hedge foreign exchange risk associated with certain assets and liabilities denominated in foreign currencies
All derivative transactions are entered into to hedge interest and foreign currency exposures incorporated within its business Accordingly market risk in these derivatives is basically offset by opposite movements in the value of hedged assets or liabilities
Derivative transactions entered into by the Group have been made in accordance with internal policies which regulate the authorization and credit limit amount
33
There was no derivative transaction to which hedge accounting was applied for the year ended March 31 2019 Derivative transactions to which hedge accounting was applied for the year ended March 31 2018 were as follows
Millions of Yen2018
Hedgeditem
Contractamount
Contract amount due
after one yearFairvalue
CurrencyForward foreign currency contracts
Buying
USD Advance payments yen 152 - yen (8)
16 LOSS ON IMPAIRMENT OF PROPERTY PLANT AND EQUIPMENT
The Group recognized impairment losses on the following asset groups
For the year ended March 31 2019Millions of Yen Thousands of US Dollars
Asset group Location Account 2019 2019Idle assets Shinanomachi Nagano Land yen 14 $ 133Idle assets Nagoya Aichi Buildings and structures etc 17 153Idle assets Illinois USA Machinery and equipment 239 2170
Total yen 270 $ 2456
For the year ended March 31 2018Millions of Yen
Asset group Location Account 2018
Idle assets Nakatsugawa Gifu Buildings and structures land etc yen 34
Total yen 34
The Group reviewed its long-lived assets for impairment as of March 31 2019 and 2018
For the years ended March 31 2019 and 2018 the Group recognized an impairment loss for idle assets by writing down the property to its net selling value (based on reasonably adjusted amount of property tax assessment value)
Upon the decision to close the manufacturing plant of an US subsidiary NIPPON SHARYO USA INC in Rochelle Illinois USA on July 24 2018 the sale of the plant to a third party has been considered Therefore we recognized an impairment loss on the manufacturing plant at its net selling value for the year ended March 31 2019
Impairment losses other than the above were not disclosed as they were immaterial
17 RELATED-PARTY DISCLOSURES
(1)Parent and major shareholders
CJR directly owned 512 of the total shares of the Company as of March 31 2019 and 2018 The Company distributes transportation vehicles to CJR
34
Transactions of the Company with CJR for the years ended March 31 2019 and 2018 were as follows
For the year ended March 31 2019 Millions of Yen Thousands ofUS Dollars
2019 2019Sales yen 19955 $ 181413Borrowing of funds 117 1072Repayment of debt 289 2631Interest expense 337 3067
Borrowing of funds repayment of debt and interest expense of yen117 million ($1072 thousand) yen289 million ($2631 thousand) and yen127 million ($1158 thousand) respectively were recorded for the transfer of the factory assets transferred to CJR and for a part of capital expenditure related to the transferred factory assets
For the year ended March 31 2018 Millions of Yen
2018Sales yen 24001Borrowing of funds 56000Repayment of debt 313Interest expense 193
Borrowing of funds repayment of debt and interest expense of yen21000 million yen313 million and yen122 million respectively were recorded for the transfer of the factory assets transferred to CJR and for a part of capital expenditure related to the transferred factory assets
The balances due to or from CJR as of March 31 2019 and 2018 were as follows
As of March 31 2019 Millions of Yen Thousands ofUS Dollars
2019 2019Accounts receivable yen 5993 $ 54483Current portion of long-term debt 296 2688Long-term debt 55219 501996Accrued expenses 43 392
Current portion of long-term debt long-term debt and accrued expenses of yen296 million ($2688 thousand) yen20220 million ($183815 thousand) and yen42 million ($381 thousand) respectively were the balances related to long-term debt for the transfer price of the factory assets transferred to CJR and for a part of capital expenditure related to the transferred factory assets
As of March 31 2018 Millions of Yen
2018Accounts receivable yen 5947Current portion of long-term debt 287Long-term debt 55400Accrued expenses 43
Current portion of long-term debt long-term debt and accrued expenses of yen287 million yen20400 million and yen42 million respectively were the balances related to long-term debt for the transfer price of the factory assets transferred to CJR and for a part of capital expenditure related to the transferred factory assets
(2)Fellow subsidiaries and subsidiaries of other affiliates
35
Transactions of the Company with the fellow subsidiaries for the years ended March 31 2019 and 2018 were as follows
For the year ended March 31 2019Millions of Yen Thousands of
US Dollars2019 2019
JR Central Financial Management Co Ltd Interest income yen 5 $ 45
For the year ended March 31 2018Millions of Yen
2018JR Central Financial Management Co Ltd Interest income yen 2
The balances due to or from the fellow subsidiaries as of March 31 2019 and 2018 were as follows
As of March 31 2019Millions of Yen Thousands of
US Dollars2019 2019
JR Central Financial Management Co LtdCash and cash equivalents yen 7398 $ 67255
As of March 31 2018Millions of Yen
2018JR Central Financial Management Co LtdCash and cash equivalents yen 7534
36
18 OTHER COMPREHENSIVE INCOME
The components of other comprehensive income for the years ended March 31 2019 and 2018 were as follows
Millions of Yen Thousands of US Dollars
2019 2018 2019Unrealized gain on available-for-sale securities
Gains arising during the year yen 1753 yen 1131 $ 15938Reclassification adjustments to profit or loss - (0) -Amount before income tax effect 1753 1131 15938Income tax effect (533) (354) (4848)
Total yen 1220 yen 777 $ 11090Deferred gain (loss) on derivatives under hedge accounting
Gains (losses) arising during the year yen 8 yen (5) $ 69Income tax effect - - -
Total yen 8 yen (5) $ 69Foreign currency translation adjustments
Adjustments arising during the year yen (33) yen (105) $ (301)Total yen (33) yen (105) $ (301)
Defined retirement benefit plansAdjustments arising during the year yen 2216 yen 1396 $ 20145Reclassification adjustments to profit or loss (648) (432) (5887)Amount before income tax effect 1568 964 14258Income tax effect (475) (296) (4320)
Total yen 1093 yen 668 $ 9938Share of other comprehensive (loss) income in associated companies
Gains arising during the year yen (9) yen 36 $ (81)Income tax effect - - -
Total yen (9) yen 36 $ (81)
Total other comprehensive income yen 2279 yen 1371 $ 20715
19 SEGMENT INFORMATION
Under ASBJ Statement No 17 ldquoAccounting Standard for Segment Information Disclosuresrdquo and ASBJ Guidance No 20 ldquoGuidance on Accounting Standard for Segment Information Disclosuresrdquo an entity is required to report financial and descriptive information about its reportable segments Reportable segments are operating segments or aggregations of operating segments that meet specified criteria Operating segments are components of an entity about which separate financial information is available and such information is evaluated regularly by the chief operating decision maker in deciding how to allocate resources and in assessing performance Generally segment information is required to be reported on the same basis as is used internally for evaluating operating segment performance and deciding how to allocate resources to operating segments
(1)Description of reportable segments
The Grouprsquos reportable segments are those for which separate financial information is available and regular evaluation by the Companyrsquos management is being performed in order to decide how resources are allocated among the Group
The Group has operational headquarters by each product or service Each of the operational headquarters develops comprehensive strategies and engages in business activities relating to each product and service Accordingly the Group is comprised of segments organized by products or services based on the operational headquarters and there are four reportable segments ldquoRailway Rolling Stockrdquo ldquoTransportation Equipment and Steel Structurerdquo ldquoConstruction Equipmentrdquo and ldquoEngineeringrdquo
37
ldquoRailway Rolling Stockrdquo consists of manufacture and sales of rolling stock such as EMUs and railway motor cars
ldquoTransportation Equipment and Steel Structurerdquo consists of manufacture and sales of transportation equipment such as freight cars tank trucks heavy-duty industrial vehicles and manufacture and construction of roadway and railway bridges
ldquoConstruction Equipmentrdquo consists of manufacture and sales of pile driving rigs crawler cranes casing rotators portable diesel generator sets and emergency generators
ldquoEngineeringrdquo consists of manufacture and sales of railway rolling stock inspectionmaintenance systems agricultural plants and pulp and paper plants
(2)Method of measurement for the amount of sales profit (loss) assets and other items for each reportable segment
The accounting policies of each reportable segment are consistent with those disclosed in Note 2 ldquoSummary of Significant Accounting Policiesrdquo Reporting segment profit represents operating income Intersegment transactions are based upon armrsquos-length transactions
(3)Information of sales profit (loss) assets and other items was as follows
Millions of Yen2019
Reportable segmentRailway Rolling Stock
Transportation Equipment and Steel Structure
Construction Equipment Engineering Other Total Reconciliations Consolidated
Net salesSales to external customers yen 38049 yen 21794 yen 25167 yen 6006 yen 163 yen 91179 - yen 91179Intersegment sales or transfers 129 187 13 67 185 581 yen (581) -
Total yen 38178 yen 21981 yen 25180 yen 6073 yen 348 yen 91760 yen (581) yen 91179
Segment profit (loss) yen 2034 yen 2040 yen 4887 yen 386 yen (27) yen 9320 yen (820) yen 8500Segment assets yen 47448 yen 22556 yen 22978 yen 2906 yen 645 yen 96533 yen 37661 yen 134194Other
Depreciation yen 1046 yen 276 yen 779 yen 15 yen 2 yen 2118 yen 252 yen 2370Increase in property plant and
equipment and intangible assets 1010 937 740 22 2 2711 160 2871
Millions of Yen2018
Reportable segmentRailway Rolling Stock
Transportation Equipment and Steel Structure
Construction Equipment Engineering Other Total Reconciliations Consolidated
Net salesSales to external customers yen 41455 yen 22475 yen 24573 yen 6560 yen 248 yen 95311 - yen 95311Intersegment sales or transfers 261 331 10 23 192 817 yen (817) -
Total yen 41716 yen 22806 yen 24583 yen 6583 yen 440 yen 96128 yen (817) yen 95311
Segment profit (loss) yen 1413 yen 1991 yen 5270 yen (75) yen (93) yen 8506 yen (1240) yen 7266Segment assets yen 46176 yen 19734 yen 22724 yen 4684 yen 669 yen 93987 yen 33426 yen 127413Other
Depreciation yen 1340 yen 319 yen 760 yen 14 yen 2 yen 2435 yen 293 yen 2728Increase in property plant and
equipment and intangible assets 563 143 962 5 0 1673 107 1780
38
Thousands of US Dollars2019
Reportable segmentRailway Rolling Stock
Transportation Equipment and Steel Structure
Construction Equipment Engineering Other Total Reconciliations Consolidated
Net salesSales to external customers $ 345904 $ 198128 $ 228791 $ 54601 $ 1480 $ 828904 - $ 828904Intersegment sales or transfers 1169 1696 122 608 1682 5277 $ (5277) -
Total $ 347073 $ 199824 $ 228913 $ 55209 $ 3162 $ 834181 $ (5277) $ 828904
Segment profit (loss) $ 18494 $ 18548 $ 44423 $ 3512 $ (248) $ 84729 $ (7459) $ 77270Segment assets $ 431340 $ 205056 $ 208891 $ 26422 $ 5859 $ 877568 $ 342384 $ 1219952Other
Depreciation $ 9513 $ 2515 $ 7080 $ 133 $ 14 $ 19255 $ 2294 $ 21549Increase in property plant and
equipment and intangible assets 9186 8514 6725 202 15 24642 1461 26103
Notes 1 ldquoOtherrdquo represents businesses that are not included in any reportable segment which includes manufacture and sales of laser processing system sales of railroad-related merchandise and real estate rental
2 ldquoReconciliationsrdquo in segment profit (loss) include corporate expenses of yen(854) million ($(7766) thousand) and yen(1294) million for the years ended March 31 2019 and 2018 respectively elimination of intersegment transactions of yen27 million ($246 thousand) and yen42 million for the years ended March 31 2019 and 2018 Corporate expenses principally consist of general and administrative expenses that are not attributable to any reportable segment
3 ldquoReconciliationsrdquo in segment assets include total corporate assets of yen32158 million ($292350 thousand) and yen29889 million elimination of intersegment balances of yen(116) million ($(1051) thousand) and yen(136) million and adjustments in inventories of yen(61) million ($(556) thousand) and yen(68) million as of March 31 2019 and 2018 respectively Total corporate assets principally consist of investment securities and general management properties as of March 31 2019 and 2018
4 Segment profit (loss) is reconciled to operating income in the consolidated statement of operations
Associated Information
(1) Information about products and services is not disclosed since similar information is disclosed above
(2) Information about geographical areas for the year ended March 31 2019 was as follows
Millions of Yen2019
Japan USA Asia Other TotalNet sales yen 81477 yen 156 yen 9503 yen 43 yen 91179
Note Sales are based on the location of the customers and grouped by country or area
Information about net sales by geographical areas for the year ended March 31 2018 is not disclosed since net sales to external customers in Japan exceeds 90 of consolidated net sales
Millions of Yen2019
Japan USA Asia Other TotalProperty plant and equipment yen 24784 yen 3630 yen 0 yen 0 yen 28414
39
Millions of Yen2018
Japan USA Asia Other TotalProperty plant and equipment yen 24306 yen 4258 yen 0 yen 0 yen 28564
Thousands of US Dollars2019
Japan USA Asia Other TotalProperty plant and equipment $ 225304 $ 33001 $ 1 $ 0 $ 258306
(3) Information about major customers Net sales
Millions of Yen Thousands of US Dollars
Relatedsegment
Name of major customer 2019 2018 2019
CJR yen 19955 yen 24001 $ 181413Railway Rolling Stock
Transportation Equipment and Steel Structure
(4) Information about loss on impairment of property plant and equipment by reportable segment
Millions of Yen2019
Reportable segmentRailwayRolling Stock
TransportationEquipment andSteel Structure
ConstructionEquipment
Engineer-ing Other Total
Recon-ciliations
Consoli-dated
Impairment loss yen 238 - - - - yen 238 32 yen 270
Millions of Yen2018
Reportable segmentRailwayRolling Stock
TransportationEquipment andSteel Structure
ConstructionEquipment
Engineer-ing Other Total
Recon-ciliations
Consoli-dated
Impairment loss yen - - - - - yen - 34 yen 34
Thousands of US Dollars2019
Reportable segmentRailwayRolling Stock
TransportationEquipment andSteel Structure
ConstructionEquipment
Engineer-ing Other Total
Recon-ciliations
Consoli-dated
Impairment loss $ 2168 - - - - $ 2168 288 $ 2456
Note The amount of ldquoReconciliationsrdquo is related to idle assets which are not attributable to any reporting segment
40
Corporate Profile
Line of Business
Overview of the Main SegmentsNIPPON SHARYO manufactures and sells the following products
Business segment Lines of business
Railway rolling stock EMUs DMUs Passenger Cars Linear Motor Cars Track Maintenance Machines Rolling Stock Components and Automated Guideway Transit Systems
Transportation equipment and Steel structure
Freight Cars Locomotives Tank Trucks Tank Trailers Storage Tanks Heavy-duty Industrial Vehicles Containers Automated Guided Vehicles Roadway Bridges Railway Bridges Water Gates
Construction equipmentPile Driving Rigs Crawler Cranes Hydraulic Hammers Casing Rotators Other Products Related to Foundation Work Portable Diesel Generator Sets Emergency Generators Various Products Related to Electric Machines
Engineering Agricultural Plants Grain Complex Seed Processing Plants Railway Rolling Stock InspectionMaintenance System Pulp and Paper Plants
OFFICE
PLANT
Company Name NIPPON SHARYO LTD
Capital Stock
Common StockAuthorized 32800000 shares
Common StockIssued 14675012 shares
Number of Shareholders 12509 persons
(March 31 2019)
Company History
Sep 1896 Established in Nagoya CityJun 1938 Founded Narumi PlantMay 1949 Re-listed on Tokyo Stock ExchangeJan 1959 Began Construction Machinery BusinessOct 1961 Started Bridge ManufacturingJul 1964 Founded Toyokawa PlantJun 1975 Founded Kinuura PlantSep 1996 100th AnniversaryAug 2008 Equity and business tie-up entered into with Central Japan Railway CompanyAug 2019 Manufactured 4000th Shinkansen EMU
HEAD OFFICE (NAGOYA)
1-1 Sanbonmatsu-choAtsuta-ku Nagoya 456-8691 JAPANPhone +81-52-882-3316Fax +81-52-882-3781
TOKYO OFFICE OSAKA BRANCH
14th FLNorth Gate Building3-1-3 UmedaKita-ku Osaka 530-0001 JAPANPhone +81-6-6341-4455Fax +81-6-6341-4487
12th Fl Marunouchi Central Bldg1-9-1 MarunouchiChiyoda-ku Tokyo 100-0005 JAPANPhone +81-3-6688-6808Fax +81-3-6688-6813
TOYOKAWA PLANT
2-20 HonoharaToyokawa Aichi-pref 442-8502 JAPANPhone +81-533-85-4900Fax +81-533-85-4123
(Railway rolling stock amp other transportation equipment)NARUMI PLANT
80 Ryucho Narumi-choMidori-ku Nagoya 458-8502 JAPANPhone +81-52-623-3529Fax +81-52-623-4349
(Construction equipment)KINUURA PLANT
20 11-gouchiHanda Aichi 475-0831 JAPAN
(Steel structure)
NIPPON SHARYO USA INC
2340 S Arlington Heights Road Suite 605 Arlington Heights IL 60005 USAAttn NIPPON SHARYO ENGINEERING amp MARKETING LLCPhone +1-847-228-2700Fax +1-847-228-5530
Corporate Information
Directory
41
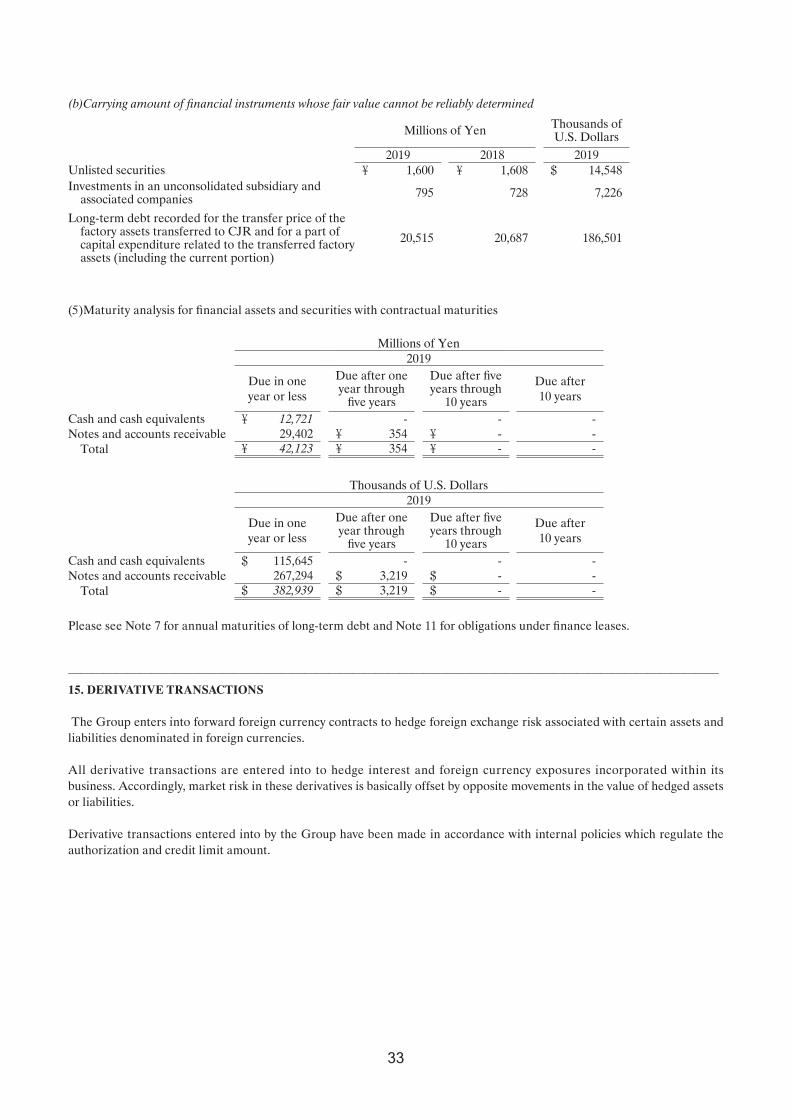
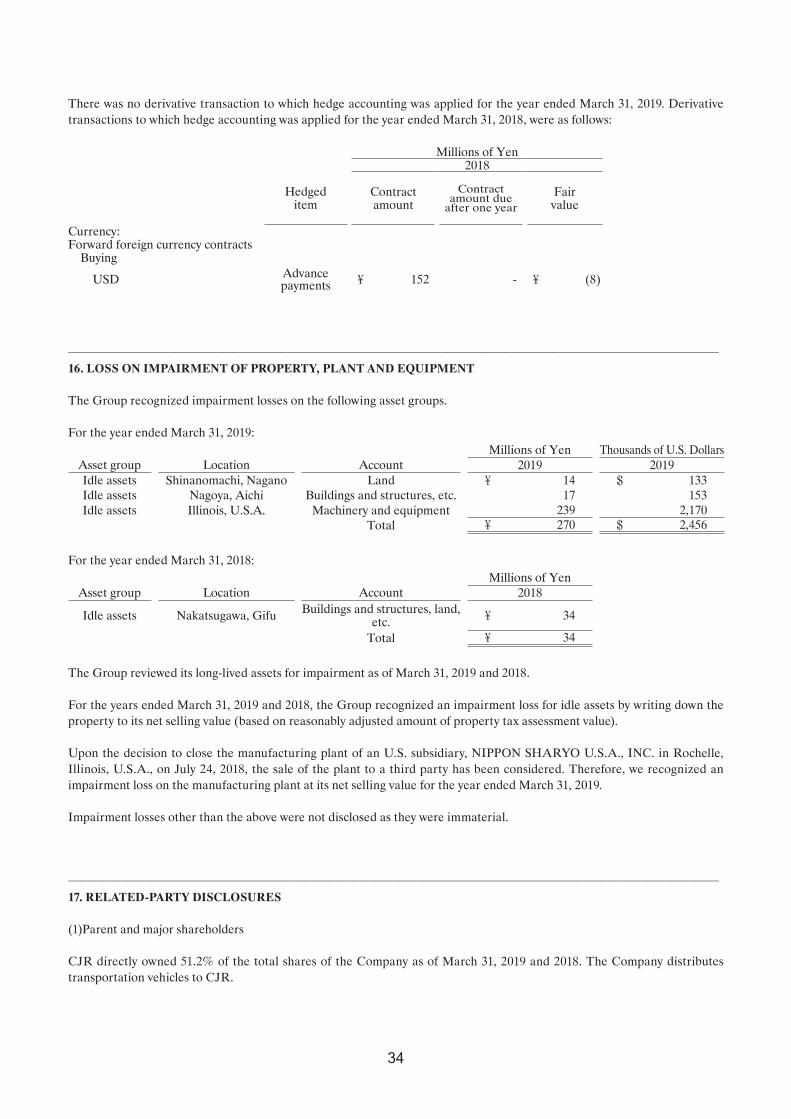
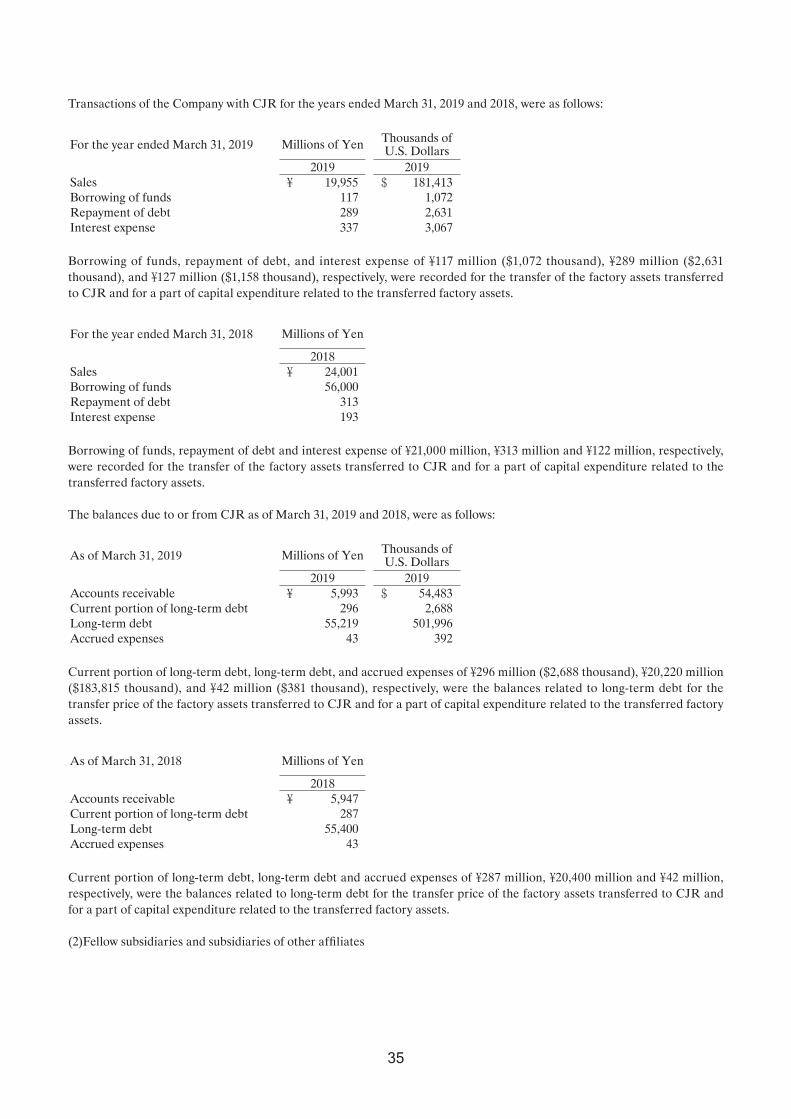
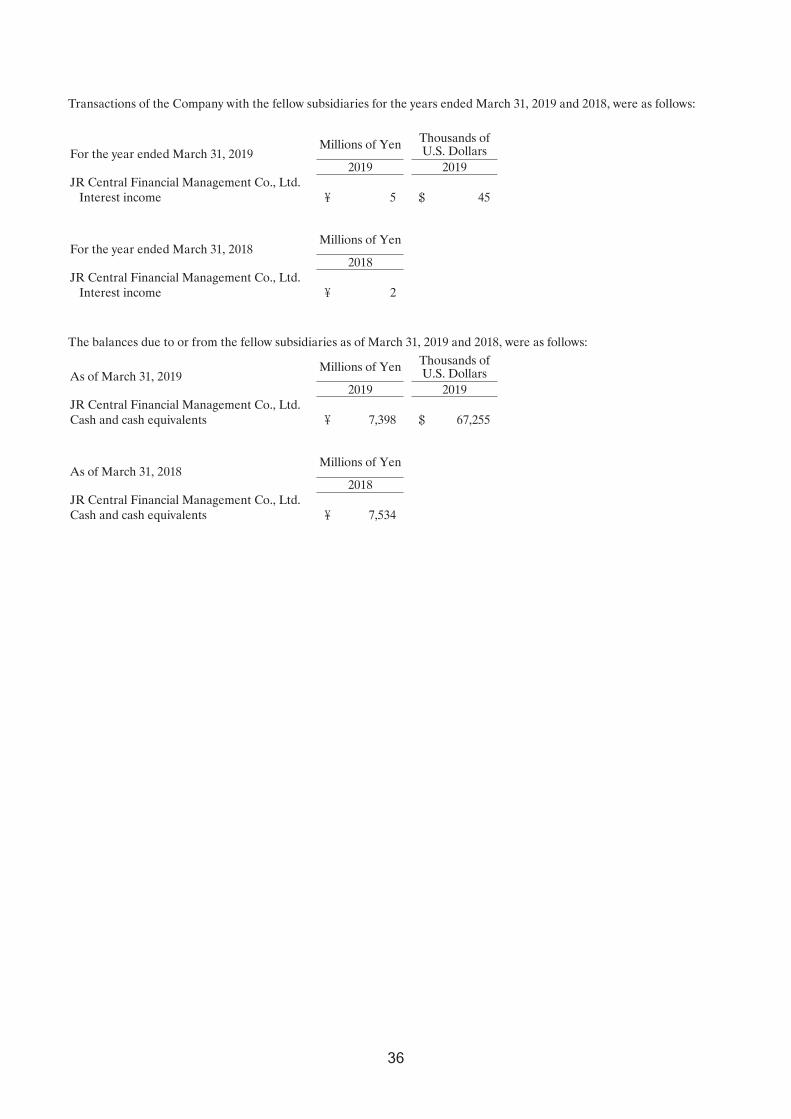
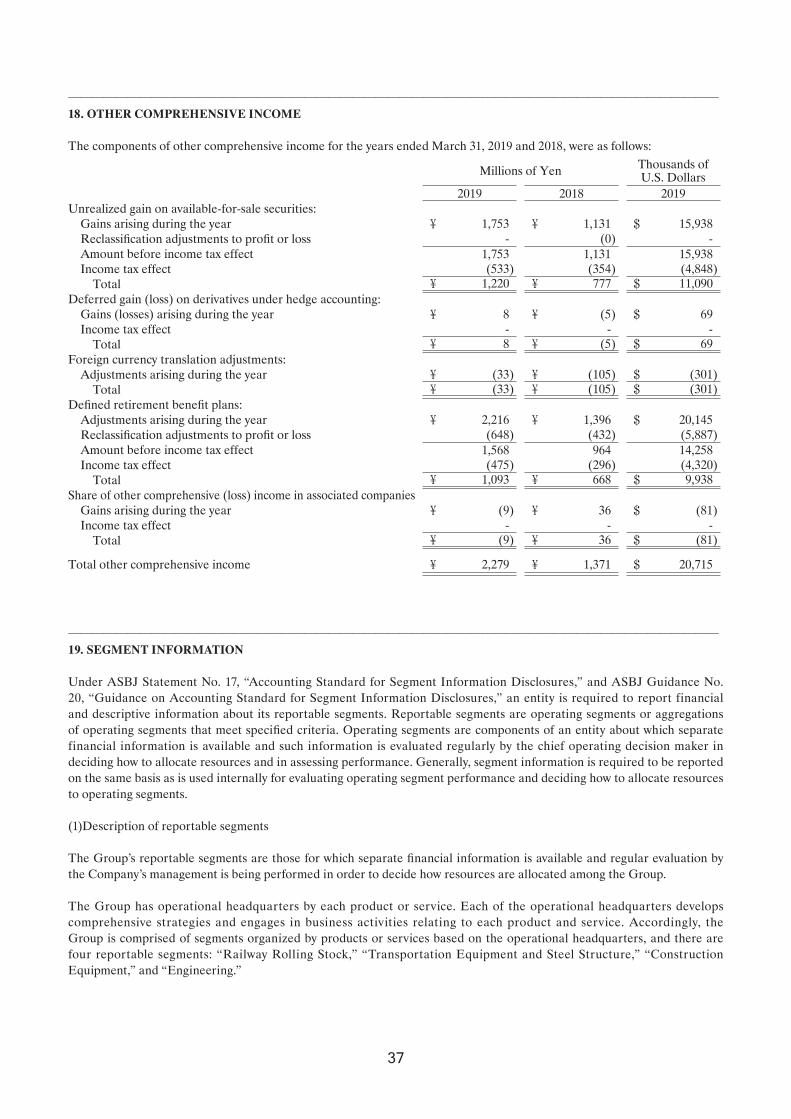
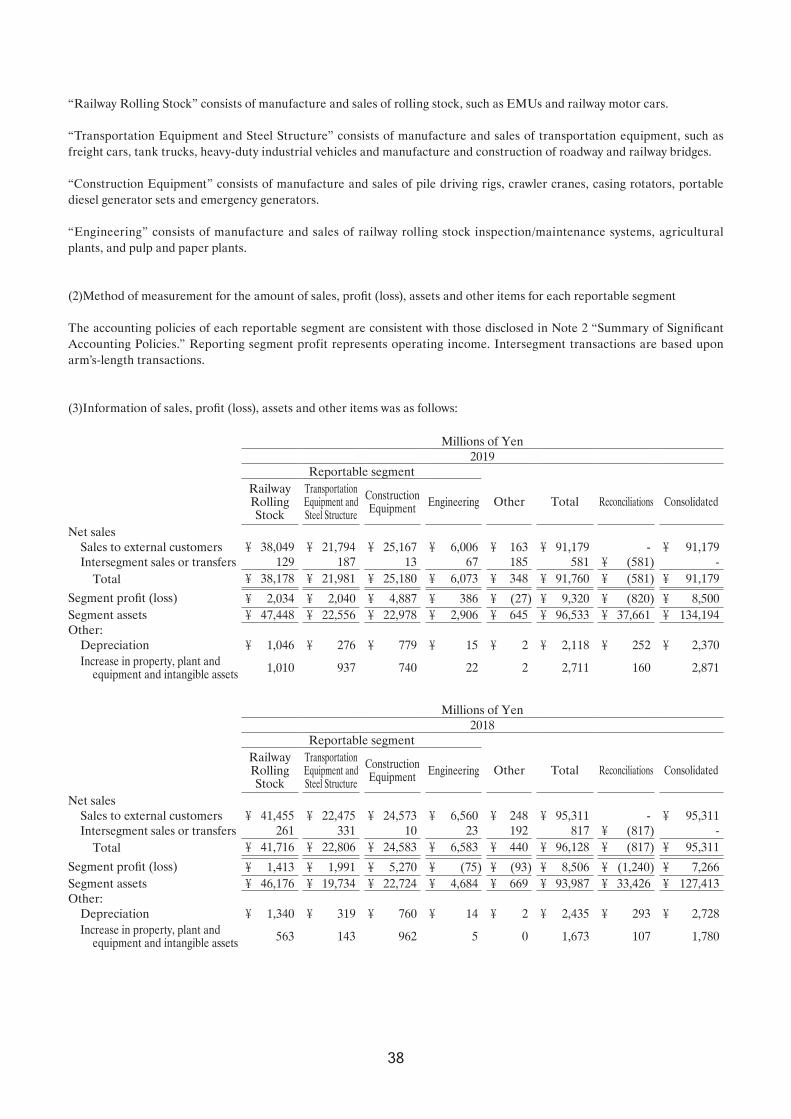
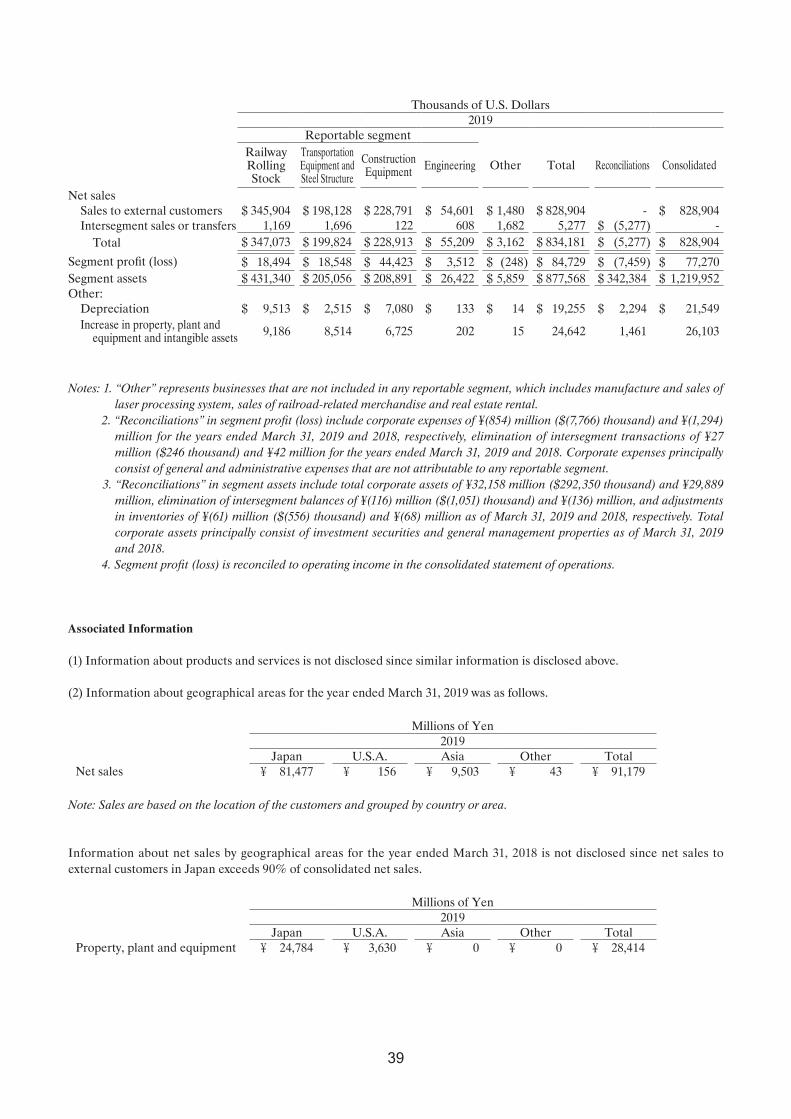
Thousands of US Dollars2019
Reportable segmentRailway Rolling Stock
Transportation Equipment and Steel Structure
Construction Equipment Engineering Other Total Reconciliations Consolidated
Net salesSales to external customers $ 345904 $ 198128 $ 228791 $ 54601 $ 1480 $ 828904 - $ 828904Intersegment sales or transfers 1169 1696 122 608 1682 5277 $ (5277) -
Total $ 347073 $ 199824 $ 228913 $ 55209 $ 3162 $ 834181 $ (5277) $ 828904
Segment profit (loss) $ 18494 $ 18548 $ 44423 $ 3512 $ (248) $ 84729 $ (7459) $ 77270Segment assets $ 431340 $ 205056 $ 208891 $ 26422 $ 5859 $ 877568 $ 342384 $ 1219952Other
Depreciation $ 9513 $ 2515 $ 7080 $ 133 $ 14 $ 19255 $ 2294 $ 21549Increase in property plant and
equipment and intangible assets 9186 8514 6725 202 15 24642 1461 26103
Notes 1 ldquoOtherrdquo represents businesses that are not included in any reportable segment which includes manufacture and sales of laser processing system sales of railroad-related merchandise and real estate rental
2 ldquoReconciliationsrdquo in segment profit (loss) include corporate expenses of yen(854) million ($(7766) thousand) and yen(1294) million for the years ended March 31 2019 and 2018 respectively elimination of intersegment transactions of yen27 million ($246 thousand) and yen42 million for the years ended March 31 2019 and 2018 Corporate expenses principally consist of general and administrative expenses that are not attributable to any reportable segment
3 ldquoReconciliationsrdquo in segment assets include total corporate assets of yen32158 million ($292350 thousand) and yen29889 million elimination of intersegment balances of yen(116) million ($(1051) thousand) and yen(136) million and adjustments in inventories of yen(61) million ($(556) thousand) and yen(68) million as of March 31 2019 and 2018 respectively Total corporate assets principally consist of investment securities and general management properties as of March 31 2019 and 2018
4 Segment profit (loss) is reconciled to operating income in the consolidated statement of operations
Associated Information
(1) Information about products and services is not disclosed since similar information is disclosed above
(2) Information about geographical areas for the year ended March 31 2019 was as follows
Millions of Yen2019
Japan USA Asia Other TotalNet sales yen 81477 yen 156 yen 9503 yen 43 yen 91179
Note Sales are based on the location of the customers and grouped by country or area
Information about net sales by geographical areas for the year ended March 31 2018 is not disclosed since net sales to external customers in Japan exceeds 90 of consolidated net sales
Millions of Yen2019
Japan USA Asia Other TotalProperty plant and equipment yen 24784 yen 3630 yen 0 yen 0 yen 28414
39
Millions of Yen2018
Japan USA Asia Other TotalProperty plant and equipment yen 24306 yen 4258 yen 0 yen 0 yen 28564
Thousands of US Dollars2019
Japan USA Asia Other TotalProperty plant and equipment $ 225304 $ 33001 $ 1 $ 0 $ 258306
(3) Information about major customers Net sales
Millions of Yen Thousands of US Dollars
Relatedsegment
Name of major customer 2019 2018 2019
CJR yen 19955 yen 24001 $ 181413Railway Rolling Stock
Transportation Equipment and Steel Structure
(4) Information about loss on impairment of property plant and equipment by reportable segment
Millions of Yen2019
Reportable segmentRailwayRolling Stock
TransportationEquipment andSteel Structure
ConstructionEquipment
Engineer-ing Other Total
Recon-ciliations
Consoli-dated
Impairment loss yen 238 - - - - yen 238 32 yen 270
Millions of Yen2018
Reportable segmentRailwayRolling Stock
TransportationEquipment andSteel Structure
ConstructionEquipment
Engineer-ing Other Total
Recon-ciliations
Consoli-dated
Impairment loss yen - - - - - yen - 34 yen 34
Thousands of US Dollars2019
Reportable segmentRailwayRolling Stock
TransportationEquipment andSteel Structure
ConstructionEquipment
Engineer-ing Other Total
Recon-ciliations
Consoli-dated
Impairment loss $ 2168 - - - - $ 2168 288 $ 2456
Note The amount of ldquoReconciliationsrdquo is related to idle assets which are not attributable to any reporting segment
40
Corporate Profile
Line of Business
Overview of the Main SegmentsNIPPON SHARYO manufactures and sells the following products
Business segment Lines of business
Railway rolling stock EMUs DMUs Passenger Cars Linear Motor Cars Track Maintenance Machines Rolling Stock Components and Automated Guideway Transit Systems
Transportation equipment and Steel structure
Freight Cars Locomotives Tank Trucks Tank Trailers Storage Tanks Heavy-duty Industrial Vehicles Containers Automated Guided Vehicles Roadway Bridges Railway Bridges Water Gates
Construction equipmentPile Driving Rigs Crawler Cranes Hydraulic Hammers Casing Rotators Other Products Related to Foundation Work Portable Diesel Generator Sets Emergency Generators Various Products Related to Electric Machines
Engineering Agricultural Plants Grain Complex Seed Processing Plants Railway Rolling Stock InspectionMaintenance System Pulp and Paper Plants
OFFICE
PLANT
Company Name NIPPON SHARYO LTD
Capital Stock
Common StockAuthorized 32800000 shares
Common StockIssued 14675012 shares
Number of Shareholders 12509 persons
(March 31 2019)
Company History
Sep 1896 Established in Nagoya CityJun 1938 Founded Narumi PlantMay 1949 Re-listed on Tokyo Stock ExchangeJan 1959 Began Construction Machinery BusinessOct 1961 Started Bridge ManufacturingJul 1964 Founded Toyokawa PlantJun 1975 Founded Kinuura PlantSep 1996 100th AnniversaryAug 2008 Equity and business tie-up entered into with Central Japan Railway CompanyAug 2019 Manufactured 4000th Shinkansen EMU
HEAD OFFICE (NAGOYA)
1-1 Sanbonmatsu-choAtsuta-ku Nagoya 456-8691 JAPANPhone +81-52-882-3316Fax +81-52-882-3781
TOKYO OFFICE OSAKA BRANCH
14th FLNorth Gate Building3-1-3 UmedaKita-ku Osaka 530-0001 JAPANPhone +81-6-6341-4455Fax +81-6-6341-4487
12th Fl Marunouchi Central Bldg1-9-1 MarunouchiChiyoda-ku Tokyo 100-0005 JAPANPhone +81-3-6688-6808Fax +81-3-6688-6813
TOYOKAWA PLANT
2-20 HonoharaToyokawa Aichi-pref 442-8502 JAPANPhone +81-533-85-4900Fax +81-533-85-4123
(Railway rolling stock amp other transportation equipment)NARUMI PLANT
80 Ryucho Narumi-choMidori-ku Nagoya 458-8502 JAPANPhone +81-52-623-3529Fax +81-52-623-4349
(Construction equipment)KINUURA PLANT
20 11-gouchiHanda Aichi 475-0831 JAPAN
(Steel structure)
NIPPON SHARYO USA INC
2340 S Arlington Heights Road Suite 605 Arlington Heights IL 60005 USAAttn NIPPON SHARYO ENGINEERING amp MARKETING LLCPhone +1-847-228-2700Fax +1-847-228-5530
Corporate Information
Directory
41
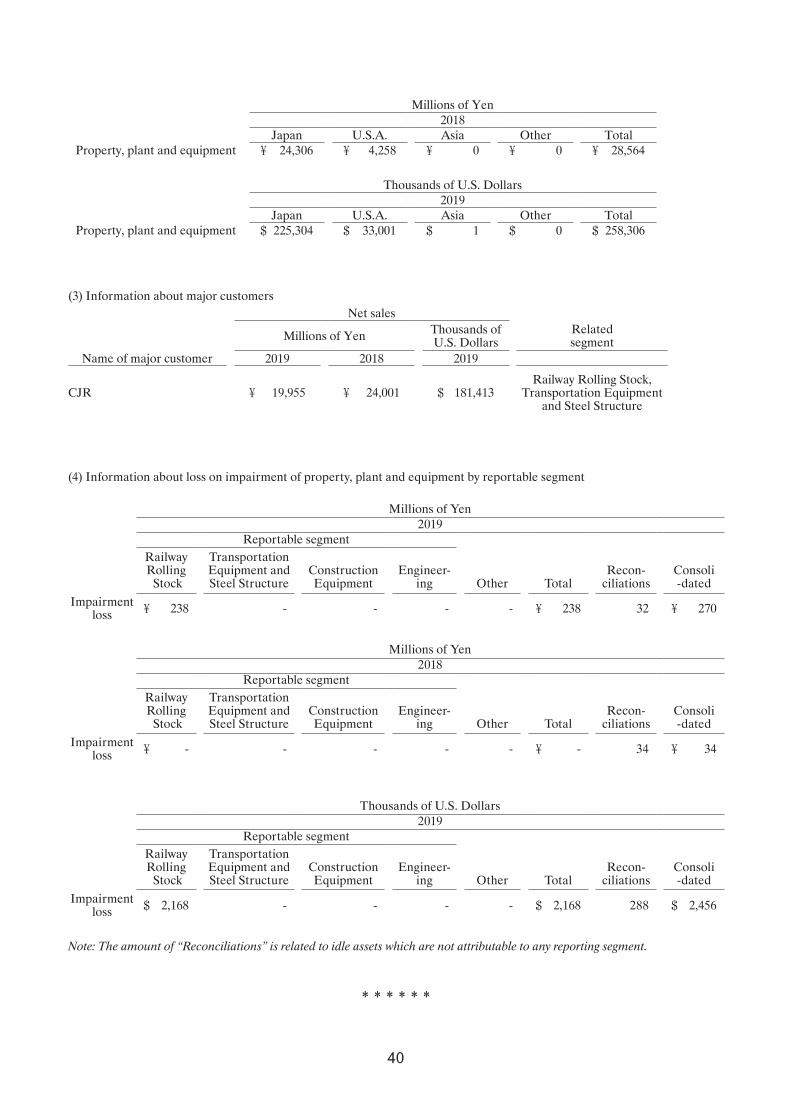
Millions of Yen2018
Japan USA Asia Other TotalProperty plant and equipment yen 24306 yen 4258 yen 0 yen 0 yen 28564
Thousands of US Dollars2019
Japan USA Asia Other TotalProperty plant and equipment $ 225304 $ 33001 $ 1 $ 0 $ 258306
(3) Information about major customers Net sales
Millions of Yen Thousands of US Dollars
Relatedsegment
Name of major customer 2019 2018 2019
CJR yen 19955 yen 24001 $ 181413Railway Rolling Stock
Transportation Equipment and Steel Structure
(4) Information about loss on impairment of property plant and equipment by reportable segment
Millions of Yen2019
Reportable segmentRailwayRolling Stock
TransportationEquipment andSteel Structure
ConstructionEquipment
Engineer-ing Other Total
Recon-ciliations
Consoli-dated
Impairment loss yen 238 - - - - yen 238 32 yen 270
Millions of Yen2018
Reportable segmentRailwayRolling Stock
TransportationEquipment andSteel Structure
ConstructionEquipment
Engineer-ing Other Total
Recon-ciliations
Consoli-dated
Impairment loss yen - - - - - yen - 34 yen 34
Thousands of US Dollars2019
Reportable segmentRailwayRolling Stock
TransportationEquipment andSteel Structure
ConstructionEquipment
Engineer-ing Other Total
Recon-ciliations
Consoli-dated
Impairment loss $ 2168 - - - - $ 2168 288 $ 2456
Note The amount of ldquoReconciliationsrdquo is related to idle assets which are not attributable to any reporting segment
40
Corporate Profile
Line of Business
Overview of the Main SegmentsNIPPON SHARYO manufactures and sells the following products
Business segment Lines of business
Railway rolling stock EMUs DMUs Passenger Cars Linear Motor Cars Track Maintenance Machines Rolling Stock Components and Automated Guideway Transit Systems
Transportation equipment and Steel structure
Freight Cars Locomotives Tank Trucks Tank Trailers Storage Tanks Heavy-duty Industrial Vehicles Containers Automated Guided Vehicles Roadway Bridges Railway Bridges Water Gates
Construction equipmentPile Driving Rigs Crawler Cranes Hydraulic Hammers Casing Rotators Other Products Related to Foundation Work Portable Diesel Generator Sets Emergency Generators Various Products Related to Electric Machines
Engineering Agricultural Plants Grain Complex Seed Processing Plants Railway Rolling Stock InspectionMaintenance System Pulp and Paper Plants
OFFICE
PLANT
Company Name NIPPON SHARYO LTD
Capital Stock
Common StockAuthorized 32800000 shares
Common StockIssued 14675012 shares
Number of Shareholders 12509 persons
(March 31 2019)
Company History
Sep 1896 Established in Nagoya CityJun 1938 Founded Narumi PlantMay 1949 Re-listed on Tokyo Stock ExchangeJan 1959 Began Construction Machinery BusinessOct 1961 Started Bridge ManufacturingJul 1964 Founded Toyokawa PlantJun 1975 Founded Kinuura PlantSep 1996 100th AnniversaryAug 2008 Equity and business tie-up entered into with Central Japan Railway CompanyAug 2019 Manufactured 4000th Shinkansen EMU
HEAD OFFICE (NAGOYA)
1-1 Sanbonmatsu-choAtsuta-ku Nagoya 456-8691 JAPANPhone +81-52-882-3316Fax +81-52-882-3781
TOKYO OFFICE OSAKA BRANCH
14th FLNorth Gate Building3-1-3 UmedaKita-ku Osaka 530-0001 JAPANPhone +81-6-6341-4455Fax +81-6-6341-4487
12th Fl Marunouchi Central Bldg1-9-1 MarunouchiChiyoda-ku Tokyo 100-0005 JAPANPhone +81-3-6688-6808Fax +81-3-6688-6813
TOYOKAWA PLANT
2-20 HonoharaToyokawa Aichi-pref 442-8502 JAPANPhone +81-533-85-4900Fax +81-533-85-4123
(Railway rolling stock amp other transportation equipment)NARUMI PLANT
80 Ryucho Narumi-choMidori-ku Nagoya 458-8502 JAPANPhone +81-52-623-3529Fax +81-52-623-4349
(Construction equipment)KINUURA PLANT
20 11-gouchiHanda Aichi 475-0831 JAPAN
(Steel structure)
NIPPON SHARYO USA INC
2340 S Arlington Heights Road Suite 605 Arlington Heights IL 60005 USAAttn NIPPON SHARYO ENGINEERING amp MARKETING LLCPhone +1-847-228-2700Fax +1-847-228-5530
Corporate Information
Directory
41
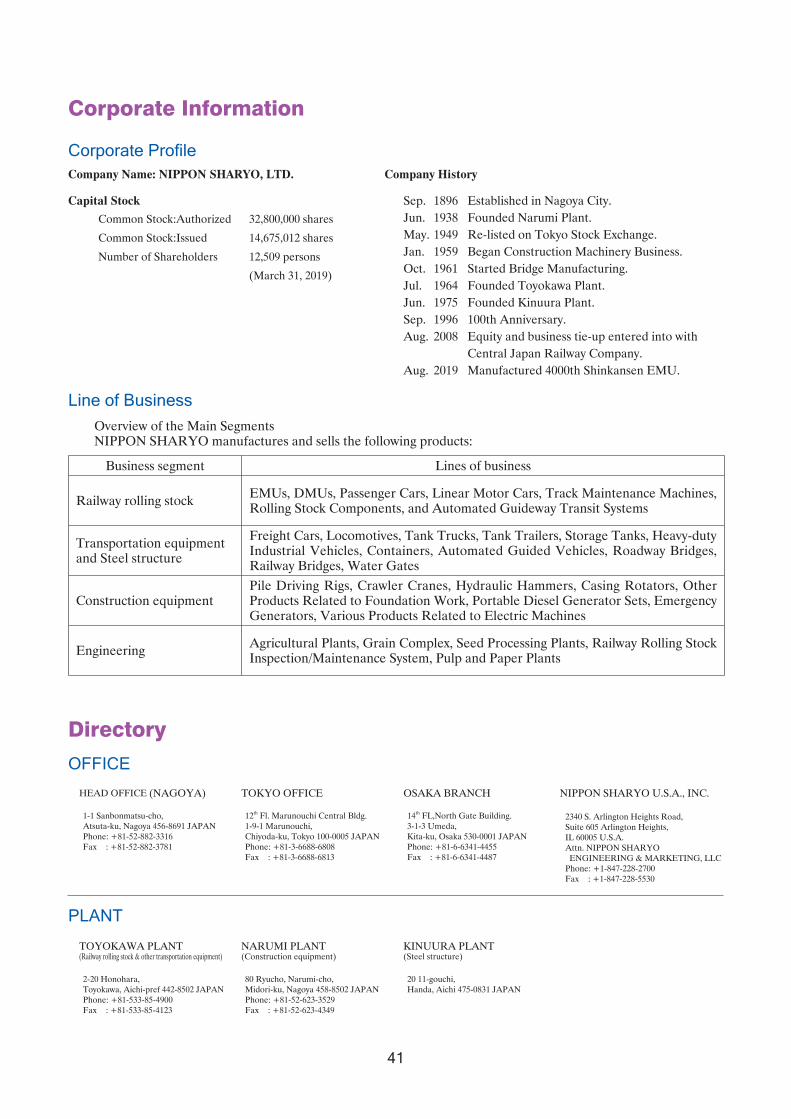
Top Related