


Languages
Pages
Legal


NNEEPPAALL RRAASSTTRRAA BBAANNKK
BBAANNKK SSUUPPEERRVVIISSIIOONN RREEPPOORRTT--22001111
The Bank Supervision Report 2011 is an
annual report published by the Bank
Supervision Department of the Nepal Rastra
Bank (NRB). It reviews policy and operational
issues affecting the banking sector and its
regulators/supervisors and aims at
BBaannkk SSuuppeerrvviissiioonn RReeppoorrtt
22001111
NNeeppaall RRaassttrraa BBaannkk
BBaannkk SSuuppeerrvviissiioonn DDeeppaarrttmmeenntt
BBaalluuwwaattaarr,, KKaatthhmmaanndduu,, NNeeppaall
JJuullyy 22001122

ii
NNEEPPAALL RRAASSTTRRAA BBAANNKK
BBAANNKK SSUUPPEERRVVIISSIIOONN RREEPPOORRTT--22001111
The Bank Supervision Report 2011 is an annual report
published by the Bank Supervision Department of the
Nepal Rastra Bank (NRB). It reviews policy and
operational issues affecting the banking sector and its
regulators/supervisors and aims at disseminating
information on supervision of commercial banks and
other issues affecting the financial sector.
All enquiries about the publication should be directed to
Policy, Planning and Analysis Unit and the Executive
Director of the Bank Supervision Department, NRB.
Nepal Rastra Bank,
Central Office,
P.O. Box No.73
Baluwatar, Kathmandu, Nepal
Telephone: 00-977-14417497
Facsimile: 00-977-14412306
E-mail: [email protected]

iii
EExxeeccuuttiivvee DDiirreeccttoorr''ss PPeenn
Dear valued readers,
It is my pleasure to present the annual series of bank supervision report for the year
2011. This report is an attempt to cover various aspects of the Nepalese banking
industry in a nutshell. It also incorporates the activities of the Bank Supervision
Department during the fiscal year 2010/11 with an aim to benefit the readers by
providing information on Nepalese banking industry in general and supervisory
functions of Nepal Rastra Bank (NRB) in particular. Further, it attempts to cover the
trends observed in the Nepalese banking industry and challenges posed to NRB in
the course of regulation and supervision.
The overall performance of the banking industry during the year has remained
satisfactory. The capital adequacy position of the banking industry as a whole
improved significantly. All the banks, except two public sector banks namely Nepal
Bank Limited (NBL) and Rastriya Banijya Bank Limited (RBBL) have met minimum
regulatory capital. Similarly, the assets quality of the banks remains at the
acceptable level.
The number of banks and financial institutions in the country rose significantly during
the review periods. This has in turn intensified the level of competition in the local
market. The increasing complexity of the banking business due to competition,
service proliferation, intense use of information technology, service diversification
with new markets, increasing banking habit of the public coupled with growing
supervisory concern have brought about a paradigm shift in the Nepalese banking.
With this sophistication, the risk exposure of the overall banking industry has
augmented which necessitates the banks to come up with sound risk management
practices. Risk management in the modern banking has gained a momentum due to
the high degree of bank failures worldwide. The reverberation of global financial
crisis is still shaking the economies and many of them are still paying for it. Keeping
that in mind, Nepal Rastra Bank has already introduced and handed over Risk

iv
Management Guidelines to commercial banks and instructed them to develop and
implement risk management practices in their business effectively.
In the last two decades, we have witnessed dramatic changes in banking practices,
banking regulation and supervision. In the same two decades the world witnessed
the maximum number of banking crises. The consequences of such crisis are far-
reaching. Against this backdrop, it can be said that there is always a need for
effective, sound and forward looking regulatory and supervisory authority to ensure
the financial stability. Nepal Rastra Bank Act 2002 mandates Nepal Rastra Bank to
act as the supervisor of the banks and financial institutions (BFIs). Hence, it is our
obligation to maintain financial stability in the country irrespective of all the hardships
and bottlenecks.
Effective implementation of New Capital Adequacy Framework with more advance
approaches, reforming the government owned banks and providing level playing field
to all commercial banks with an assurance of equal treatment remain the prime
concerns of NRB. Strengthening supervisory capacity commensurate with huge
number of BFIs and moving towards risk based supervision in the context of
mounting risks and limited supervisory resources are again a big challenge.
Similarly, encouraging banks for self-regulation, and making them more sensitive
towards risk are some of the mammoth tasks. In the same way, increasing consumer
credit, personal loans and multiple banking issues, difficulty in defining big
borrowers, ever increasing degree and magnitude of shadow banking are yet some
of the factors hindering prudent banking practices in the country. Again, lack of co-
ordination among various economic sectors, lack of rating agency, inability to ensure
strong corporate governance in the banking sector and inadequate or even obsolete
institutional and legal arrangements are some of the issues that NRB needs to
address immediately to maintain financial stability in the country. Maintaining
financial stability, thus, is a Herculean task as the desired stability can be achieved
only if the aforementioned problems are resolved in an effective and timely manner.

v
The planned activities of the Bank Supervision Department for the next five years are
incorporated in NRB’s Five Year Strategic Plan 2012-2016. As a part of the plan,
Bank Supervision Department (BSD) has initiated to move towards risk-based
supervision from its compliance based supervision approach. Ground works are
being done in this respect with Technical Assistance from the IMF. Similarly,
adopting advanced approaches of Basel II, preparing for Basel III and complying with
the Basel Core Principles over the period are some of the major tasks to be
performed. The global financial crises had taught us that the banking regulations
should be formulated with consideration of the relationship between macroeconomic
variables and banking parameters. On that realm, Bank Supervision Department
(BSD) along with other concerned departments has worked towards publishing the
first draft of "Financial Stability Report" for further deliberations. Likewise, operating
manuals for Problem Bank Resolution Framework is being drafted under the
technical assistance of the World Bank. Stress Testing guidelines have been
implemented fully and the background analysis is being done for implementing
liquidity based Prompt Corrective Action.
Finally, I would like to thank the staff of Bank Supervision Department for working
diligently for accomplishing supervisory objectives effectively. Similarly, I also
appreciate the cooperation of commercial banks, public and other stakeholders in
enhancing the credibility of central bank and achieving the supervisory goals. Last
but not the least; I would like to thank my friends of Policy Planning Unit for their
endeavor in preparing this report for publication.
Lok Bahadur Khadka
Executive Director
vi
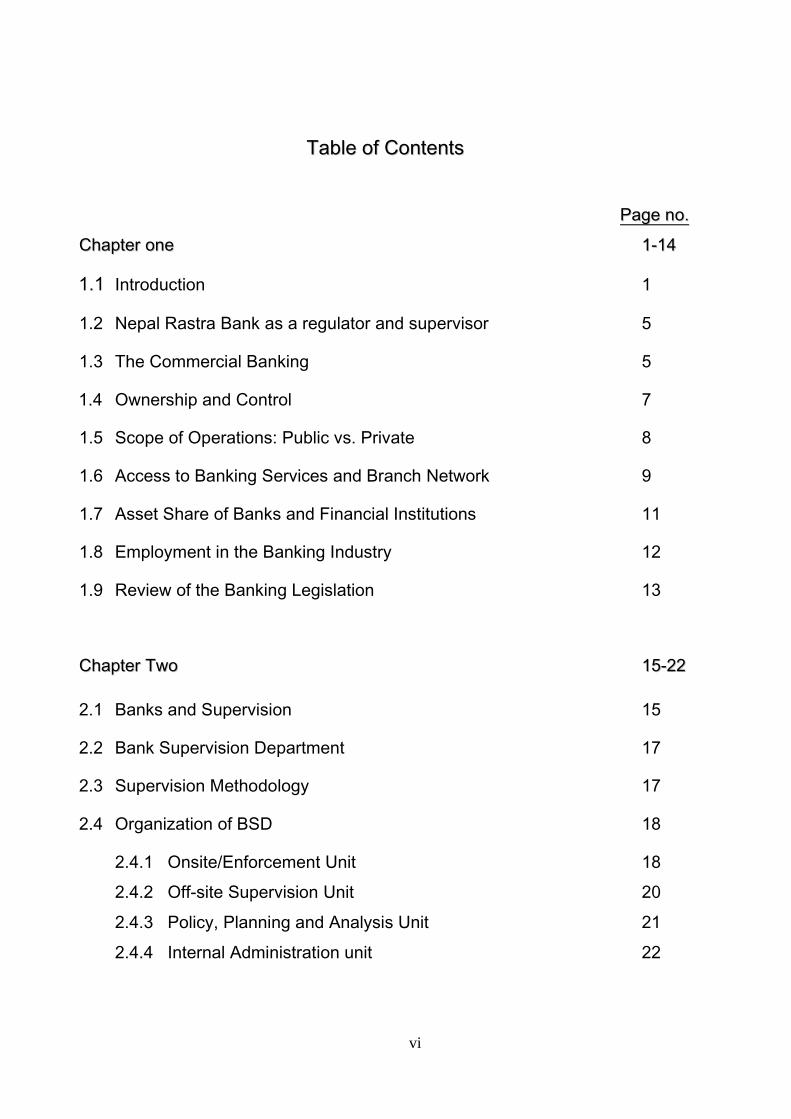
TTaabbllee ooff CCoonntteennttss
PPaaggee nnoo..
CChhaapptteerr oonnee 11--1144
1.1 Introduction 1
1.2 Nepal Rastra Bank as a regulator and supervisor 5
1.3 The Commercial Banking 5
1.4 Ownership and Control 7
1.5 Scope of Operations: Public vs. Private 8
1.6 Access to Banking Services and Branch Network 9
1.7 Asset Share of Banks and Financial Institutions 11
1.8 Employment in the Banking Industry 12
1.9 Review of the Banking Legislation 13
CChhaapptteerr TTwwoo 1155--2222
2.1 Banks and Supervision 15
2.2 Bank Supervision Department 17
2.3 Supervision Methodology 17
2.4 Organization of BSD 18
2.4.1 Onsite/Enforcement Unit 18
2.4.2 Off-site Supervision Unit 20
2.4.3 Policy, Planning and Analysis Unit 21
2.4.4 Internal Administration unit 22

vii
CChhaapptteerr TThhrreeee 2233--3388
3.1 Background 23
3.2 Risk Based Supervision 24
3.3 Basel Core Principles (BCP) 25
3.4 Capital Adequacy Framework and its Implication in Nepal 27
3.4.1 Internal Capital Adequacy Assessment Process (ICAAP) 28
3.4.2 Prompt Corrective Action 29
3.5 Bank Exit Mechanism 31
3.6 Macro-Prudential Supervision 32
3.7 Financial Safety Net or Deposit Guarantee 32
3.8 Stress Testing 32
3.9 E-banking in Nepalese Commercial Banks 34
CChhaapptteerr FFoouurr 3399--4488
4.1 Annual Action Plan of Bank Supervision Department 39
4.2 Corporate On-site Inspection Programs 40
4.3 Off-site Supervision 44
4.3.1 Cash Reserve Ratio (CRR) and Daily Liquidity Monitoring 44
4.3.2 Directed Lending 45
4.3.3 Statutory Liquidity Ratio (SLR) 45
4.3.4 Capital Adequacy Ratio 45
4.3.5 Annual Clearance for Publication of Financial Statements 46
4.4 Enforcement Activities 47
4.5 Policy and Planning Activities 47
4.5.1 Liquidity Monitoring Framework and Stress Testing Guidelines 47

viii
4.5.2 Trainings, Seminars and Interaction Programs 48
4.5.3 Working Group for Nepal Contingency Planning Project 48
CChhaapptteerr FFiivvee 4499--6644
5.1 Assets of the commercial banks 49
5.2. Composition of Assets 50
5.3 Composition of Liabilities 51
5.4 Capital 52
5.5 Deposit 53
5.6 Loans and Advances 54
5.6.1 Loans and Advances to Different Economic Sectors 55
5.6.2 Security used to Secure Loans and Advances 55
5.6.3 Types of Loans and Advances 56
5.7 Non-performing Loans 57
5.8 Non-Banking Assets 58
5.9 Investment 59
5.10 Earnings 61
5.11 Liquidity 63

ix
CChhaapptteerr SSiixx 6666--7733
6.1 Background 65
6.2 Enforcing Capital Adequacy to Ensure a Level Playing Field 66
6.3 Enhancing Good Corporate Governance 67
6.4 Strengthening Supervisory Capacity 67
6.5 Coordination between Supervisors and Regulators 68
6.6 Basel Core Principles and adoption of International Best Practices 78
6.7 Implementation of Best Practices of Anti-Money Laundering 69
6.8 Promoting Self-regulation in Banking 70
6.9 Contingency Planning and Supervisory Strategies 70
6.10 Institutional Arrangement and Capacity Building 71
6.11 Strengthening Management Information System 71
6.12 Supervision of Systemically Important Financial Institutions 71
6.13 Controlling Ever-greening of Loans 72
6.14 Developing and Retaining Human Resources 72
6.15 Macroeconomic Environment 72
6.16 Changing Global Environment 73
Appendix
x
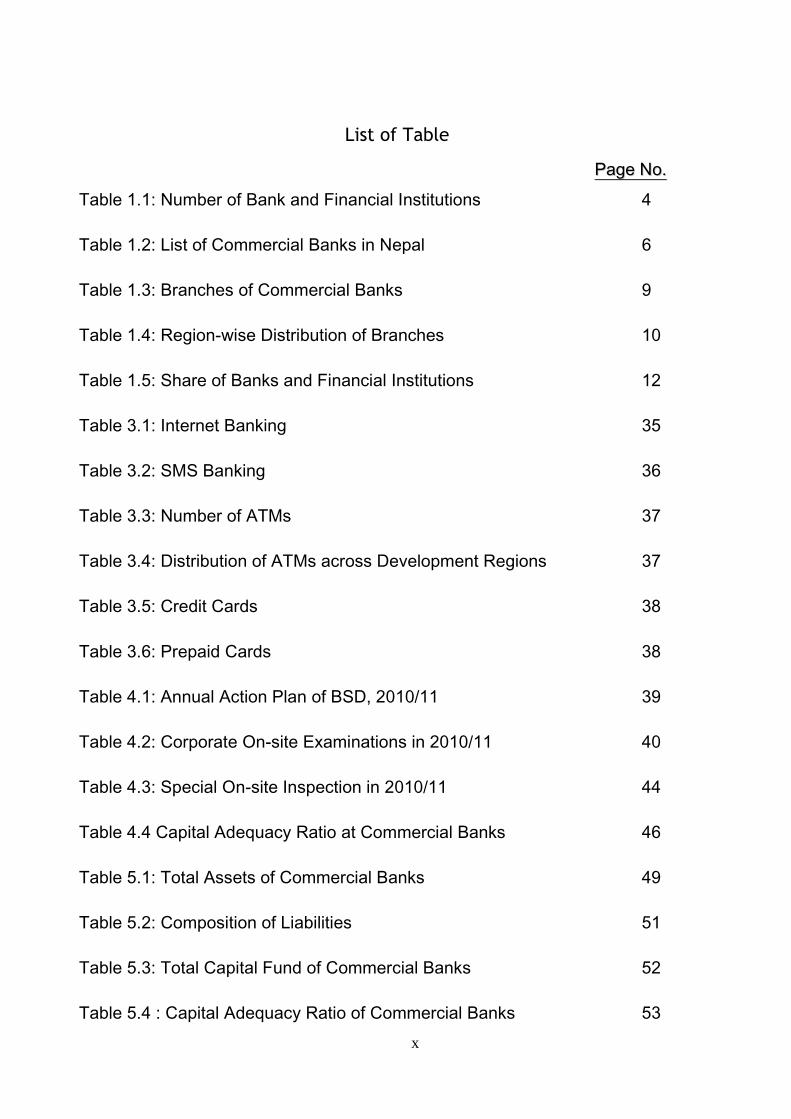
List of Table
PPaaggee NNoo..
Table 1.1: Number of Bank and Financial Institutions 4
Table 1.2: List of Commercial Banks in Nepal 6
Table 1.3: Branches of Commercial Banks 9
Table 1.4: Region-wise Distribution of Branches 10
Table 1.5: Share of Banks and Financial Institutions 12
Table 3.1: Internet Banking 35
Table 3.2: SMS Banking 36
Table 3.3: Number of ATMs 37
Table 3.4: Distribution of ATMs across Development Regions 37
Table 3.5: Credit Cards 38
Table 3.6: Prepaid Cards 38
Table 4.1: Annual Action Plan of BSD, 2010/11 39
Table 4.2: Corporate On-site Examinations in 2010/11 40
Table 4.3: Special On-site Inspection in 2010/11 44
Table 4.4 Capital Adequacy Ratio at Commercial Banks 46
Table 5.1: Total Assets of Commercial Banks 49
Table 5.2: Composition of Liabilities 51
Table 5.3: Total Capital Fund of Commercial Banks 52
Table 5.4 : Capital Adequacy Ratio of Commercial Banks 53

xi
Table 5.5: Deposit Mix of Commercial Banks 54
Table 5.6: Loans and Advances of Commercial Banks 54
Table 5.7: Loans and Advances to Different Economic Sectors 55
Table 5.8: Security used to Secure Loans and Advances 56
Table 5.9: Types of Loans and Advances 56
Table 5.10: Non-performing Loans of Commercial Banks 57
Table 5.11: NPL Ratio of Public and Private Banks 58
Table 5.12: Composition of NBAs of Commercial Banks 59
Table 5.13: Investment Portfolio of Banking Industry 60
Table 5.14: Composition of Total Income 61
Table 5.15: Liquid Assets and Deposit of the Banks 64
Table 5.16: Liquid Assets and Total Assets of the Banks 64

xii
List of Charts
PPaaggee NNoo..
Chart 1.1: Banking Operations: Public vs. Private 9
Chart 1.2: Number of Bank Branches (Region- wise) 11
Chart 1.3: Employment in Private and Public Sector Banks 13
Chart 5.1: Total Assets of Commercial Banks 49
Chart 5.2: Composition of Assets of Commercial Banks 50
Chart 5.3: Composition of Liabilities of Commercial Banks 52
Chart 5.4: NPL Ratio of Public banks, Private banks & Industry 58
Chart 5.5: Composition of NBAs of the Commercial Banks 59
Chart 5.6: Investment Portfolio of Banking Industry 60
Chart 5.7: Interest Spread of Banks 62
Chart 5.8: Operating Efficiency of Banks 63
Chart 5.9: Liquidity Position of Commercial Banks 64

xiii
AAbbbbrreevviiaattiioonn
AIG Accord Implementation Group
ALCO Asset Liability Committee
AMC Asset Management Company
AML Anti Money Laundering
ATMs Automated Teller Machines
BAFIA Bank and Financial Institutions Act
BCBS Basel Committee on Banking Supervision
BCP Basel Core Principles
BOD Board of Directors
BSD Bank Supervision Department
CAELS Capital, Asset quality, Earning, Liquidity and Sensitivity to
Market risk
CAMELS Capital, Asset quality, Management, Earning, Liquidity and
Sensitivity to Market risk
CEO Chief Executive Officer
CIC Credit Information Centre
CPG Credit Policy Guidelines
CRA Credit Rating Agency
CRR Cash Reserve Ratio
DFID Department for International Development
DRT Debt Recovery Tribunal
DSL Deprived Sector Lending

xiv
EWS Early Warning Signals
HLCC High level Co-ordination Committee
ICAAP Internal Capital Adequacy Assessment Process
KYC Know Your Customer
LC Letter of Credit
LFAR Long Form Audit Report
MIS Management Information System
IT Information Technology
NCPP Nepal Contingency Planning Project
NPL Non Performing Loan
NRB Nepal Rastra Bank
PCA Prompt Corrective Action
POT Point of Transaction
RBS Risk Based Supervision
RWE Risk-weighted Exposures
SEBON Securities Board of Nepal
SIFI Systemically Important Financial Institution
SLR Statutory Liquidity Ratio
SMS Short Message Service
SOL Single Obligor Limit
SPG Senior Policy Group
SREP Supervisory Review and Evaluation Process

1
CHAPTER-ONE
Nepalese Banking Industry
1.1 Introduction
Maintaining financial sector stability is a major challenge for bank regulators and
supervisors throughout the world. Nepal Rastra Bank, being the Central Bank of
Nepal understands the importance of maintaining financial stability as this has been
expressed explicitly as one of the objectives of NRB in the NRB Act, 2002. A strong
and sound financial system acts as a catalyst in promoting economic growth through
efficient allocation of resources. It also makes capital more productive and creates
additional employment opportunities. It is also important in reducing vulnerabilities to
financial crisis and thereby helping the economy to save the social costs that
accompany financial disruption. A sound and efficient financial system also allows
better risk hedging and risk diversification opportunities.
Nepalese financial system is posed with more challenges in the last two decades
owing to a rapid growth both vertically and horizontally. Increasing number of banks
and financial institutions, their deposits, credits and total assets and other indicators
have proved this fact. Following the growth, the Nepalese financial system has
experienced many changes such as launching new financial products, modern
technology and new market participants. While service proliferations and innovative
ideas have undoubtedly demand better risk-management practices, they have also
led challenges to Nepal Rastra Bank (NRB) in ensuring systemic stability through
financial regulation and supervision. Moreover, due to a rapid growth in the number
of non-banking financial institutions (which do not fall within the regulatory and
supervisory realm of Nepal Rastra Bank) indulging in parallel banking activities,
ensuring effective surveillance and maintain financial stability have proved to be
more difficult.

2
Risk Management is an inevitable component of successful banking. Banking is a
complex job made more complex by the fact that it runs on public money. Hence, the
success of any bank depends largely on its ability to take prudent decisions at the
backdrop of secure and reliable services and sound operational practices. Sound
risk management strategies can be implemented by integrating effective bank-level
management, operational supervision and market discipline. It is also imperative for
the banks to update their risk management practices in accordance with NRB
regulations and sound international practices.
Consumers today are more demanding than they were a decade ago. Hence, the
trend and scope of commercial banking has been changing rapidly. Competition is
getting stiffer thus warranting banks to enhance their competitiveness and efficiency
by improving profitability, service quality, customer responsiveness and public
accountability. Similarly, the banks also require adopting the prudent and self
regulating practices for achieving banking efficiency, reducing overall risks and
ensuring the safety of public deposits. Banks also need to encourage healthy
competition and avoid risky behavior and practices for long-term sustainability. This
can be attained by understanding the volatile nature of the business and working
collectively for uplifting public confidence in the banking system.
The dynamism of the global financial environment requires Nepalese banks and
financial institutions to support their operations with more robust tools and skills in
order to mitigate risks arising from the ever evolving financial landscape coupled with
an unprecedented development of technology. As such, the banks are obliged to
adopt adequate and appropriate risk management practices and promote self-
regulated internal environment. Effective risk management has always been central
to safe and sound banking activities for various reasons. First, new technologies,
product innovation, size and speed of financial transactions have changed the nature
of banking. Second, there is a need to comply fully with the Basel Core Principles on

3
Banking Supervision and to prepare an enabling environment for the implementation
of the New Capital Adequacy Framework (Updated in July 2008). Thirdly, it is
imperative to move gradually towards Basel III, albeit with necessary customizations
in the days to come.
Supervisory assessments based on the CAMELS (Capital, Asset quality,
Management, Earning, Liquidity and Sensitivity to market risk) rating, compliance of
prudential norms, gradual implementation of Basel core principles and enhancement
in disclosure standards have more closely aligned the Nepalese banking system with
international best practices. The adoption of various emerging international
supervisory practices, although with necessary customization, has juxtaposed the
Nepalese banking with the global banking practices. However, the compliance
based supervision approach is seemingly inadequate in the face of increasing
sophistication in the banking industry. Nepal’s transaction and compliance-based
approach to banking supervision, is largely reactive, narrow in scope and is uniformly
applied to all institutions. Furthermore, it is uniformly applied to all financial
institutions to be supervised regardless of their size and scope of operation. Besides,
it is largely on-site based, but complemented by off-site monitoring. The average
cycle of inspection, of once a year, is the same for all institutions regardless of their
perceived risks. The compliance-based supervision does not provide clear yardsticks
for risk assessment and allocation of resources in the supervisory processes. In this
background supervisory approach and techniques stipulate the need for prioritizing
the supervisory work based on the results of assessment of risks to which individual
banks or banking groups are exposed. Therefore, NRB is planning to move towards
risk-based supervision on which supervisory resources are allocated towards more
risk sensitive areas in the most efficient and productive manner possible.
Several empirical evidences show that countries with more credit extended to the
private sector experienced stronger economic growth. In this sense, economic
4
growth depends on a country's financial sector’s capability to develop institutions. At
this juncture, the NRB’s challenges are supporting the building of a financial system
that is supportive to growth, while being dynamic to change for meeting the evolving
needs of the economy.
The NRB, as the apex body of banking system in Nepal, has been working to build a
healthy and efficient financial sector by improving regulation to make it at par with
international standards. The implementation of the New Capital Adequacy
Framework in Nepalese commercial banks has remained effective in terms of
ensuring adequate level of capital in banking sector and almost all banks have
developed reporting system. NRB has focused its activities to ensure prudent
banking practices in a self-regulated environment while trying to shift towards risk-
based supervision for the effective utilization of scarce supervisory resources.
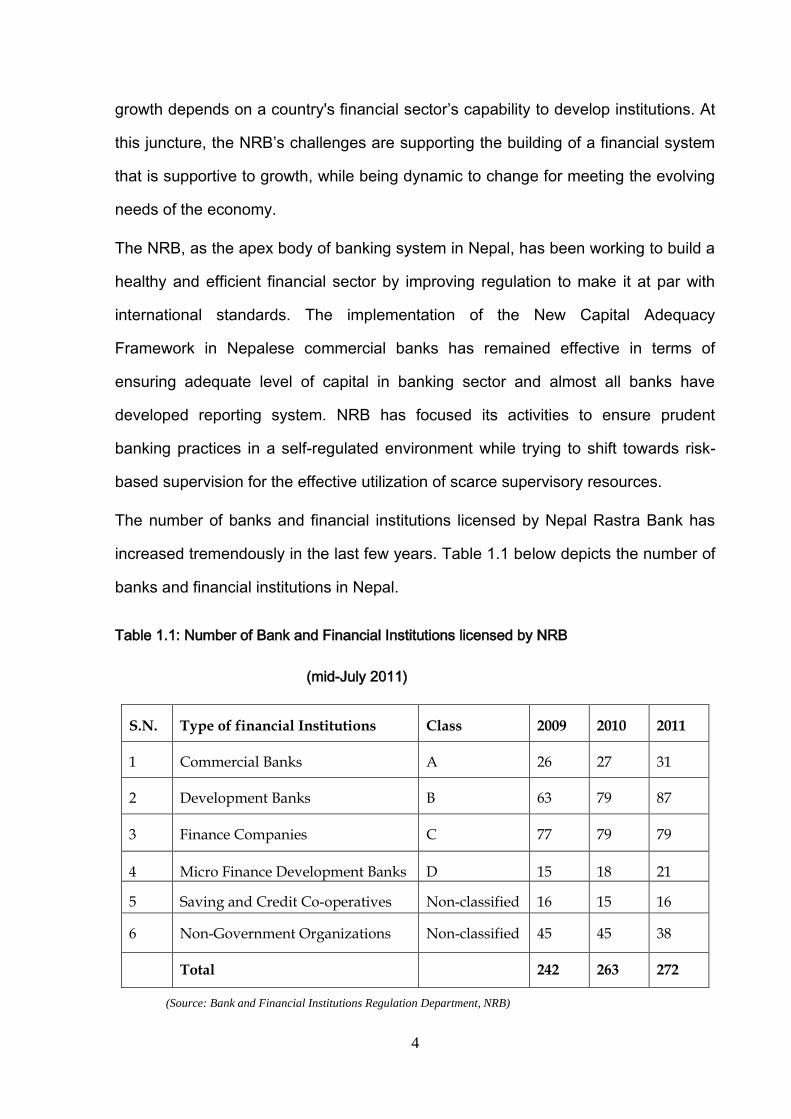
The number of banks and financial institutions licensed by Nepal Rastra Bank has
increased tremendously in the last few years. Table 1.1 below depicts the number of
banks and financial institutions in Nepal.
Table 1.1: Number of Bank and Financial Institutions licensed by NRB
(mid-July 2011)
S.N. Type of financial Institutions Class 2009 2010 2011
1 Commercial Banks A 26 27 31
2 Development Banks B 63 79 87
3 Finance Companies C 77 79 79
4 Micro Finance Development Banks D 15 18 21
5 Saving and Credit Co-operatives Non-classified 16 15 16
6 Non-Government Organizations Non-classified 45 45 38
Total 242 263 272
(Source: Bank and Financial Institutions Regulation Department, NRB)

5
1.2 Nepal Rastra Bank as a regulator and supervisor
The NRB Act, 2002, has made NRB an autonomous institution empowered to
regulate and supervise Nepal’s banking industry. As a regulator, it issues various
policies, directives and circulars that are in line with international standards but also
customized to match the local. As a supervisor, it supervises the activities of the
banks and financial institutions based on the existing legal framework and guiding
polices. At present there are four supervisory departments within NRB, viz, Bank
Supervision Department, Development Bank Supervision Department, Finance
Company Supervision Department and Micro Finance Promotion and Supervision
Department. These departments have been established with the purpose of
supervising the activities of the concerned bank and financial institutions. These
supervision departments basically monitor compliance to rules, regulations and
directives.
1.3 The Commercial Banking
Nepal Bank Limited (NBL), the first commercial bank of the country, was established
in 1937 with an objective of attracting people to formal banking system from the
costly services of pre-dominant moneylenders. The second commercial bank, a fully
government-owned, the Rastriya Banijya Bank Limited (RBBL) was established on
23 January 1966. In the early 1970s, NRB encouraged both NBL and RBBL to
expand their branches to various parts of the country. For this purpose, NRB itself
had conducted feasibility study and adopted the policy to subsidize the losses
incurred by the branches established under the "Banking Development Program". In
1975, NRB achieved its target of having at least one branch of commercial bank in
each district head quarter.
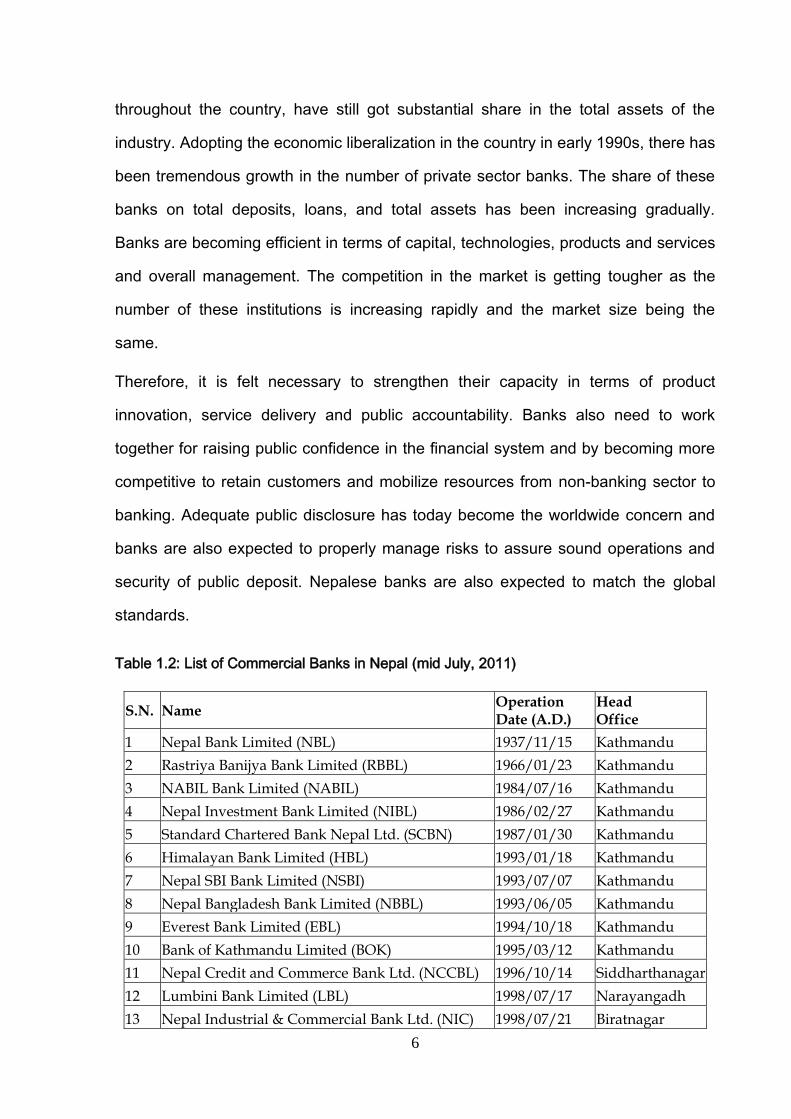
As at mid July 2011, the numbers of commercial banks in Nepal were thirty-one. The
public sector banks, which are three in number and have large branch networks
6
throughout the country, have still got substantial share in the total assets of the
industry. Adopting the economic liberalization in the country in early 1990s, there has
been tremendous growth in the number of private sector banks. The share of these
banks on total deposits, loans, and total assets has been increasing gradually.
Banks are becoming efficient in terms of capital, technologies, products and services
and overall management. The competition in the market is getting tougher as the
number of these institutions is increasing rapidly and the market size being the
same.
Therefore, it is felt necessary to strengthen their capacity in terms of product
innovation, service delivery and public accountability. Banks also need to work
together for raising public confidence in the financial system and by becoming more
competitive to retain customers and mobilize resources from non-banking sector to
banking. Adequate public disclosure has today become the worldwide concern and
banks are also expected to properly manage risks to assure sound operations and
security of public deposit. Nepalese banks are also expected to match the global
standards.
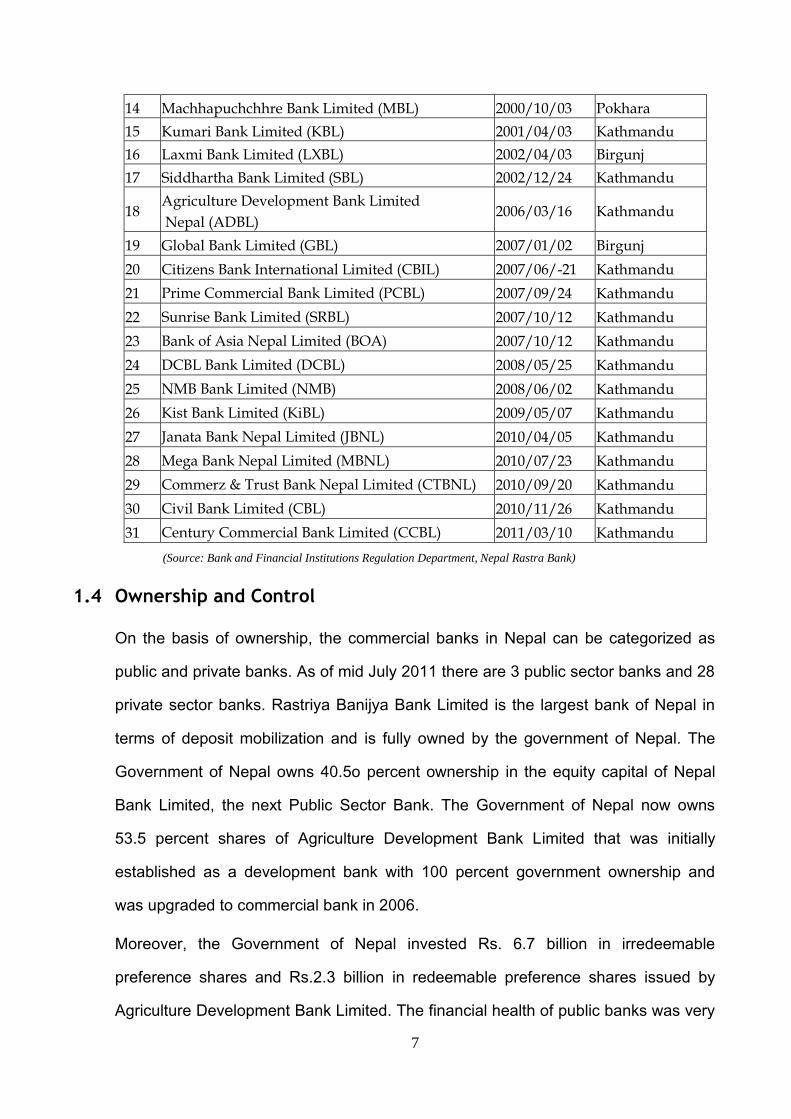
Table 1.2: List of Commercial Banks in Nepal (mid July, 2011)
S.N. Name Operation Date (A.D.)
Head Office
1 Nepal Bank Limited (NBL) 1937/11/15 Kathmandu
2 Rastriya Banijya Bank Limited (RBBL) 1966/01/23 Kathmandu
3 NABIL Bank Limited (NABIL) 1984/07/16 Kathmandu
4 Nepal Investment Bank Limited (NIBL) 1986/02/27 Kathmandu
5 Standard Chartered Bank Nepal Ltd. (SCBN) 1987/01/30 Kathmandu
6 Himalayan Bank Limited (HBL) 1993/01/18 Kathmandu
7 Nepal SBI Bank Limited (NSBI) 1993/07/07 Kathmandu
8 Nepal Bangladesh Bank Limited (NBBL) 1993/06/05 Kathmandu
9 Everest Bank Limited (EBL) 1994/10/18 Kathmandu
10 Bank of Kathmandu Limited (BOK) 1995/03/12 Kathmandu
11 Nepal Credit and Commerce Bank Ltd. (NCCBL) 1996/10/14 Siddharthanagar
12 Lumbini Bank Limited (LBL) 1998/07/17 Narayangadh
13 Nepal Industrial & Commercial Bank Ltd. (NIC) 1998/07/21 Biratnagar
7
14 Machhapuchchhre Bank Limited (MBL) 2000/10/03 Pokhara
15 Kumari Bank Limited (KBL) 2001/04/03 Kathmandu
16 Laxmi Bank Limited (LXBL) 2002/04/03 Birgunj
17 Siddhartha Bank Limited (SBL) 2002/12/24 Kathmandu
18 Agriculture Development Bank Limited
Nepal (ADBL) 2006/03/16 Kathmandu
19 Global Bank Limited (GBL) 2007/01/02 Birgunj
20 Citizens Bank International Limited (CBIL) 2007/06/-21 Kathmandu
21 Prime Commercial Bank Limited (PCBL) 2007/09/24 Kathmandu
22 Sunrise Bank Limited (SRBL) 2007/10/12 Kathmandu
23 Bank of Asia Nepal Limited (BOA) 2007/10/12 Kathmandu
24 DCBL Bank Limited (DCBL) 2008/05/25 Kathmandu
25 NMB Bank Limited (NMB) 2008/06/02 Kathmandu
26 Kist Bank Limited (KiBL) 2009/05/07 Kathmandu
27 Janata Bank Nepal Limited (JBNL) 2010/04/05 Kathmandu
28 Mega Bank Nepal Limited (MBNL) 2010/07/23 Kathmandu
29 Commerz & Trust Bank Nepal Limited (CTBNL) 2010/09/20 Kathmandu
30 Civil Bank Limited (CBL) 2010/11/26 Kathmandu
31 Century Commercial Bank Limited (CCBL) 2011/03/10 Kathmandu
(Source: Bank and Financial Institutions Regulation Department, Nepal Rastra Bank)
1.4 Ownership and Control
On the basis of ownership, the commercial banks in Nepal can be categorized as
public and private banks. As of mid July 2011 there are 3 public sector banks and 28
private sector banks. Rastriya Banijya Bank Limited is the largest bank of Nepal in
terms of deposit mobilization and is fully owned by the government of Nepal. The
Government of Nepal owns 40.5o percent ownership in the equity capital of Nepal
Bank Limited, the next Public Sector Bank. The Government of Nepal now owns
53.5 percent shares of Agriculture Development Bank Limited that was initially
established as a development bank with 100 percent government ownership and
was upgraded to commercial bank in 2006.
Moreover, the Government of Nepal invested Rs. 6.7 billion in irredeemable
preference shares and Rs.2.3 billion in redeemable preference shares issued by
Agriculture Development Bank Limited. The financial health of public banks was very

8
poor and thus a reform program was initiated in these banks under the Financial
Sector Reform Project with the technical assistance of the World Bank and DFID.
The private sector banks in Nepal can be further re-grouped into the local private
banks and foreign joint-venture banks. The banks with the local private investment
are local private banks while the banks with joint investment of both foreign
institutions and local investors are joint-venture banks. As at mid July 2011, there
were seven private joint venture banks, and 21 locally owned banks.
1.5 Scope of Operations: Public vs. Private
Nepal’s public sector banks control a sizable chunk of deposits, loans and advances
and total assets of the banking industry. They have continued to expand their
branches despite the growth of private banks. Total deposits of the banking industry
increased by 9.0 percent to Rs. 687.59 billion in mid July 2011 compared to the
deposit of Rs. 630.88 billion in the previous year. Similarly, loans and advances of
the banking industry increased by 11.93 percent to Rs. 522.85 billion compared to a
total of Rs. 467.11 billion in mid July 2010. The total assets of the banking industry in
mid July 2011 increased by 11.57 percent to Rs. 878.36 billion compared to Rs.
787.3 billion in the previous year.
The growth rates of all variables mentioned above were higher in private banks
relative to the public sector banks in the review year. The chart below shows
deposits, loans and advances and total assets of the banking industry of public and
private sector banks.

9
Chart 1.1: Banking Operations: Public vs. Private (mid July, 2011)
(Source: Bank and Financial Institutions Regulation Department, NRB )
1.6 Access to Banking Services and Branch Network
Banking services have spread across the country, mainly due to the rapid increase in
number of private bank branches. Despite the rapid growth in number, their scope of
operation is yet limited to urban and suburban areas and still a big chunk of
population is derived from access to the banking services. More recently, banks
have begun exploring distant markets within the country, which is a good sign.
The total number of bank branches increased to 1245 in mid-July 2011 from 1137 in
July 2010. Three public sector banks had a total of 473 branches. The remaining 772
branches were of the other 28 private sector banks.
Table 1.3: Branches of Commercial Banks (Mid July 2011)
Name of Banks 2009 2010 2011
Nepal Bank Limited (NBL) 100 110 111
Rastriya Banijya Bank Limited (RBBL) 123 128 128
NABIL Bank Limited (NABIL) 32 37 46
Nepal Investment Bank Limited (NIBL) 31 40 41
Standard Chartered Bank Nepal Ltd. (SCBN) 13 16 16
Himalayan Bank Limited (HBL) 23 30 35
Nepal SBI Bank Limited (NSBI) 33 44 46

10
Nepal Bangladesh Bank Limited (NBBL) 17 19 19
Everest Bank Limited (EBL) 30 37 43
Bank of Kathmandu Limited (BOK) 30 37 39
Nepal Credit and Commerce Bank Ltd. (NCCBL) 17 17 17
Lumbini Bank Limited (LBL) 5 13 15
Nepal Industrial & Commercial Bank Ltd. (NIC) 21 26 34
Machhapuchchhre Bank Limited (MBL) 31 41 41
Kumari Bank Limited (KBL) 15 27 29
Laxmi Bank Limited (LXBL) 19 22 27
Siddhartha Bank Limited (SBL) 10 30 40
Agriculture Development Bank (ADBL) 86 97* 234*
Global Bank Limited (GBL) 16 28 28
Citizens Bank International Limited (CBIL) 10 18 30
Prime Commercial Bank Limited (PCBL) 8 17 24
Sunrise Bank Limited (SRBL) 21 41 47
Bank of Asia Nepal Limited (BOA) 21 27 29
DCBL Bank Limited (DCBL) 5 12 21
NMB Bank Limited (NMB) 9 15 18
Kist Bank Limited (KiBL) 26 51 51
Janata Bank Nepal Limited (JBNL) - 3 13
Mega Bank Nepal Limited (MBNL) 14
Commerz & Trust Bank Nepal Limited (CTBNL) 7
Civil Bank Limited (CBL) 1
Century Commercial Bank Limited (CCBL) 1
Total 752 980 1245
* Also includes branches with development banking functions.
(Source: Bank and Financial Institutions Department, NRB)
The ADBL has the largest number of branches (234) followed by RBBL (128) and
NBL (111). While private banks have begun expanding their branches in the
districts, their operations are still concentrated in Kathmandu valley, the country’s
main economic hub. The districts with highest number of bank branches are
Kathmandu, Rupandehi and Kaski respectively.
Table 1.4: Region wise distribution of Branches (mid July 2011)
S. N. Development Region 2009 2010 2011
1 Eastern Development Region 135 170 216
2 Central Development Region 379 505 629
3 Western Development Region 147 177 225

11
4 Mid-western Development Region 57 72 100
5 Far-western Development Region 34 56 75
Total 752 980 1245
(Source: Bank and Financial Institutions Regulation Department, NRB)
Most of the bank branches are located in the Central Development Region (629)
followed by the Western and Eastern Development Regions with 225 and 216
branches respectively. The Far Western Development Region has the lowest
number of bank branches.
Chart 1.2: Number of Bank Branches (Region wise)
(Source: Bank and Financial Institutions Regulation Department, NRB)
1.7 Asset Share of Banks and Financial Institutions
The ever-increasing number of banks and financial institutions point towards an
unprecedented financial deepening in Nepal. Increase in the number of banks and
financial institutions also bring about a corresponding increase in total assets of the
financial system. The respective shares of banks and financial institutions (licensed
by Nepal Rastra Bank) in the total assets of financial system as of Mid July for three
consecutive years are depicted in the table below.

12
Table 1.5: Asset share of banks and financial institutions (mid July 2011)
Bank and Financial Institutions
% Share
2009
% Share
2010
% Share
2011
Commercial Banks 82.1 76.7 75.3
Development Banks 6.9 10.6 12.0
Finance Companies 8.8 10.9 10.9
Micro Finance Development Banks 1.6 1.8 1.8
Other
(Co-operatives and NGOS-NRB
Licensed)
0.6 0.0 0.0
Total 100 100 100
(Source: Bank and Financial Institutions Regulation Department, NRB)
Table 1.5 shows the dominance of commercial banks in Nepalese financial system.
Although the share of assets of commercial banks in the total decreased to 75.3
percent in 2011 from 76.7 percent in 2010, yet the huge chunk of the financial asset
still belong to the commercial banks. The total assets of the banks and financial
institutions licensed by NRB increased to Rs. 1166 billion in 2011 compared to Rs.
1027 billion in 2010. The share of development banks and finance companies in total
assets stood at 12 percent and 10.9 percent respectively, it was 10.6 percent and
10.9 percent 2010.
1.8 Employment in the Banking Industry
Commercial banks employed 9369 people in mid-July 2011. The number of staffs at
the public sector banks was sizable (9111), which is explained by their low use of
information and communication technology (ICT) and reliance on manual systems.
In mid-July 2010, the public sector banks had 9263 employees while the private
banks employed 9005 people. The staff number in private banks increased to 13291
and that of public sector banks to 9111 in 2011.

13
Chart 1.3: Employment in Private and Public Sector Banks (mid July, 2011)
1.9 Review of the Banking Legislation
Nepal Rastra Bank is the apex body to regulate and supervise banks and financial
institutions in Nepal. The prime responsibility of Nepal Rastra Bank is to strengthen
and ensure the stability and soundness of the banking system in the country. Nepal
Rastra Bank conducts onsite inspection and offsite supervision both on a regular
need basis to supervise the activities of banks and to test their compliance status
with the existing laws and regulations.
Nepal is moving towards deregulated banking system gradually. Therefore, the
banks and financial institutions are provided with adequate level of freedom in their
regular managerial and operational issues. However, it does not mean that they are
allowed to exercise completely regulations free banking system. Of course,
observing the market situations and the trends in the international supervisory
practices, Nepal Rasta Bank makes necessary adjustment in the banking
regulations. They are required to abide by the directives and circulars issued from
time to time by Nepal Rastra Bank covering different aspects. The underlying
philosophy is that banks should have discretion to offer the banking products and
services in a competitive manner but they should comply with the minimum rules and

14
regulations to protect the interest of the stakeholders. Pursuant to this, the objectives
of bank supervision in Nepal are to promote and maintain the safety, soundness, and
integrity of the Nepalese banking and financial system and boosting up public
confidence towards this system through the implementation of appropriate policies of
international standards. To achieve such objectives Nepal Rastra Bank has issued a
number of regulations and prudential norms that have to be complied with by
banking institutions. Such regulations are designed to limit excessive risk taking by
banks and financial institutions. The key documents that guide the NRB’s regulatory
decisions are the Nepal Rastra Bank Act, 2002, Bank and Financial Institutions Act,
2006, Company Act, 2006, Supervision By-laws, 2002, Unified Directives to licensed
institutions, New Capital Adequacy Framework, 2007 (Updated), Monetary Policy,
Anti Money Laundering Act 2064, Risk Management /Stress Testing Guidelines and
international best practices in banking industries.

15
CHAPTER TWO
Bank Supervision
2.1 Banks and Supervision
A key function of a central bank is to maintain macroeconomic stability. Regardless
of whether or not financial stability is explicitly mentioned in law, it is an implicit
function required to maintain macroeconomic stability, and therefore the general
expectation that it should work to maintain financial stability. Fundamental to the
understanding is the fact that even if the central bank does not supervise banks and
financial institutions, by providing window it will act for maintaining financial stability.
NRB has legal mandate and duty to promote safe and sound banking system and
stable financial markets through supervision and regulation of banking, financial and
payment systems. Section 84 of the Nepal Rastra Bank Act, 2002 empowers it to
inspect and supervise the banks and financial institutions. NRB has authority to
formulate and implement inspection and supervision bylaws confirming to
international standards as basis for inspecting for supervising commercial banks.
Supervision results in important information on the banking system that feeds into
monetary policy formulation and decision-making processes, and also for taking
timely measures for maintaining financial stability.
Banks play crucial role in the economy. They are specialized institutions that
channelize resources from areas with surplus to those with deficits. In this process,
banks also collect resources from the general public. In mobilizing resources from
surplus to deficit sectors, banks operate with high leverage ratio. The inherent
imbalance between 'own' funds and 'borrowed' funds in total asset structure is a
peculiar feature of banking institutions and is an area of supervisory interest and
concern. The shareholders of banks have small amounts of their own funds at stake
and therefore, there is an underlying incentive for banks to take risks because they
are using the fund of depositors. Supervision, therefore, is necessary to protect the
interest of depositors and other stakeholders. In the absence of close supervision,

16
there is a likelihood of stakeholders being put into “a head, I win, a tail, you lose”
situation.
Banks are an important source of liquidity to an economy. As financial intermediaries
they allocate funds and risks among individuals and firms by extending loans or
buying securities with funds they receive as deposits. A bank failure can have an
adverse impact in the financial system by influencing the operation of the payments
system, which could have an impact on the overall economy.
Financial institutions are supervised all over the world because of the key role they
play in the economy. Although the cost of supervision is high, the cost of no
supervision or poor supervision is even higher. The cost of bank failure to society as
a whole is higher than the private cost (the loss faced by shareholders). Depositors
are generally not well informed to be able to monitor the portfolio behavior of banks,
are also largely uninformed about compliance requirements, and have little or no
influence on decisions taken by their bank. Therefore, bank supervision is important
for,
Maintaining stability and confidence in the financial system, thereby
reducing the risk of loss to depositors and other stakeholders.
Ensuring that banks operate prudently and hold sufficient capital to
support the risks that arise in business, and
Fostering an efficient and competitive banking system that is responsive to
the public need for good quality, and easy access to financial services at a
reasonable cost.
The aforesaid reasons underscore the need for an independent and autonomous
supervisory authority to conduct direct assessments of the banking system. Credible
and effective supervision rest, among others, on the following elements:
Adequate legal authority to oversee the scope, and conduct of business by
banks and/or financial institutions it supervises.

17
Operational independence to carry out its mandate without interference.
Appropriate level of transparency in the formulation and execution of
supervisory policies, as well as full accountability for the outcomes, and
Sufficient staffs with requisite technical skills and experience.
The supervisory authority must be able to rely on immediately available and
objective information based on expert assessment by supervisors about the health of
individual banks and financial institutions. This is important for taking decisions to
prevent crises from getting out of control.
2.2 Bank Supervision Department (BSD)
The NRB’s Bank Supervision Department is responsible for executing the
supervisory policies and practices as per governing laws and policies. The
supervisory process includes on-site examination, analysis of policy and procedures,
application review, supervisory action and implementation, off-site monitoring and
reporting. The BSD is responsible for carrying out inspection and supervision of all
commercial banks. It is organized in four units:
On-site Inspection and Enforcement;
Off-site Supervision;
Policy Planning and Analysis; and
Internal Administration.
2.3 Supervision Methodology
The BSD has adopted international best practices for supervising commercial banks
in combination with the prevailing Nepalese laws. It has been following a
compliance-based approach for supervision while also gradually moving towards
risk-based supervision. The Strategic Plan of NRB clearly specifies the time-bound
action plan for implementing risk- based supervisory mechanism.

18
Supervisory reviews are thorough, regular, and involve on-site examinations. These
examinations focus on six major components of bank safety and soundness that are
collectively known as CAMELS (Capital Adequacy, Asset Quality, Management
competence, Earning, Liquidity, Sensitivity to Market Risk). Banks are assigned
grades of 1 (best) to 5 (worst) on each component. Supervisors use six scores to
award a composite CAMELS rating, also expressed in a scale of 1 to 5. The scores
and ratings are kept confidential and used only for supervisory purposes.
The management of banks cannot be assessed only in terms of the returns
submitted by the bank. Thus, off-site supervision does not use the CAMELS rating
but has a separate rating, which uses the components of CAMELS except for "M"
representing management. This rating is system is called CAELS. The off-site
supervision unit ranks the banks regularly based on these components.
2.4 Organization of BSD
The BSD has divided its function into various /units. The department comprises of
on-site inspection/enforcement division, off-site supervision division, policy planning
and analysis unit and internal administration unit. Besides these, there are different
committee, working groups and a High level Co-ordination Committee (HLCC) for
sharing information among other regulatory authorities of Nepal. Committees are
formed as and when needed basis for certain assigned tasks, and are generally of a
temporary nature.
2.4.1 Onsite/Enforcement Unit
Onsite/Enforcement units are responsible to carry out onsite inspection and
enforcement functions. The on-site examinations are conducted in accordance with
the approved annual plan of the department. BSD is conducting corporate level
onsite inspections of each commercial bank at least once a year. More than two-
thirds of the department's human resources are deployed in these activities. The

19
BSD has an Onsite Inspection Manual for inspection purpose. The objectives of on-
site inspection are:
To determine the financial position of the banks and the quality of their
portfolios and operations to ensure that they are not operating against
the interests of depositors and customers.
To assess and appraise the competence and capability of the bank's
management and staff, because the quality of management determines
the soundness of operations.
To ascertain whether banks are complying with applicable laws,
regulations and policies issued by NRB.
To evaluate and verify bank's records, systems, and internal controls.
To test the accuracy, validity and regularity of data submitted by banks to
NRB, and
To assess and analyze the risk management processes, procedures and
systems adopted by banks.
Further, the BSD also carries out independent on-site assessment of corporate
governance, internal control system, reliability of information provided, potentiality of
business continuity etc. of the banks. The on-site examinations carried out by the
BSD include:
a) Initial examination, which is generally conducted within six months of
commencement of operation by a new bank.
b) Routine full-fledged, corporate-level inspection, which is the regular
examination, generally carried out once in a year
c) Targeted Inspection, which addresses specific areas of operation of a
bank e.g. credit, trade finance etc., and
d) Special inspection, which is carried out as and when needed.

20
The on-site examination unit conducts periodic examinations and special inspections
and its findings complement the off-site supervision, particularly in the verification of
information provided in the returns submitted to the Off-Site Supervision Unit.
2.4.2 Off-site Supervision Unit
This unit carries out off-site surveillance of all commercial banks. The core objective
of this function is to conduct periodic financial reviews of banks in order to identify
potential problems and to assess compliance to prevailing laws including their own
statutes. It also provides feedback and flag areas that need to be focused during on-
site inspections. The BSD has an Off-site Supervision Manual that spells out the
objectives, procedures and documents needed. Key objectives of the off-site
supervision unit of the BSD are:
To obtain regular information on the financial condition and health of
commercial banks.
To identify potential problems of commercial banks.
To help and strengthen the quality of on-site inspection.
To ascertain the compliance status of applicable laws, regulations and
directives by commercial banks, and
To serve as an early warning system.
The Off-Site Supervision Unit is responsible for supervising bank operations on the
basis of submitted data and reports. It reviews and analyses the financial
performance of banks using prudential reports, statutory returns and other relevant
information. It also monitors trends and developments of financial indicators of the
banking sector as a whole and generates industry reports on a quarterly basis.
The unit reviews the financial returns submitted by the banks for checking
compliance in terms of cash reserve ratio (CRR), statutory liquidity ratio (SLR) and
deprived sector lending (DSL) and recommends monetary penalties in case of non-

21
compliance. Further, it also collects and compiles information required for liquidity
monitoring of the commercial banks on a daily basis.
The unit monitors, reviews, and analyzes returns of commercial banks and prepares
reports to detect emerging problems and early warning signs. The returns are used
to evaluate the exposure to risks and the effect this could have on profits. The
returns are basis for computing basic ratios (financial soundness indicators) to
analyze capital adequacy, assets quality, earnings, liquidity and sensitivity to market
risk (CAELS). The unit essentially carries out the duties of enforcement, follow up
and periodic reviews as per the Capital Adequacy Framework 2007. Besides, the
unit also compiles and analyses financial data and prepare reports on a regular, as
well as, special case basis. Daily liquidity monitoring, forward-looking assessments
and sensitivity analysis of commercial banks are recent additions to the regular
offsite supervisory functions.
2.4.3 Policy, Planning and Analysis Unit
Financial integration, innovation and imbalances have created many challenges for
regulators and supervisors. Continuous monitoring, follow up and evaluation of
previous policies assist in attaining effectiveness for achieving the expected policy
outputs. The adoption of international best practices with regard to regulation and
supervision can assist in addressing challenges needed for building a safe, sound
and stable financial system. The Policy, Planning and Analysis Unit of BSD reviews
policy and undertake studies for improving supervisory tools and techniques.
Supervisory functions need to match the rapid growth of the banking sector and the
overall financial market and therefore the need for regular studies on changes and
developments that are taking place. In this context, it is also necessary to develop
and maintain relations with international supervisory agencies and this can help
share knowledge and adopt new techniques. The Policy, Planning and Analysis Unit
carry out the aforesaid functions and report new developments on a periodic basis.
22
Further, the Unit also reviews and formulates the annual plans of BSD in line with
NRB’s strategic plan. It is also responsible for coordinating interaction programs,
seminars and workshops on the supervision-related issues also involving external
stakeholders. The supervisory policies and guidelines are developed in an interactive
and consultative way, where industry participants and stakeholders are allowed to
comment on drafts before they are finalized.
2.4.4 Internal Administration Unit
The Internal Administration Unit performs the functions related to human resources
and internal administration within the BSD. Its tasks include internal placement,
issuance of travel orders, and keeping leave records and also serving as the back
office. This Unit looks after procurements such as supply of office logistics and
stationery in coordination with the General Services Department of NRB. This Unit
also carries out coordination to assist other units to carry out the functions more
effectively.

23
CHAPTER THREE
Current Issues in Bank Supervision
3.1 Background
The NRB's activities in banking supervision have often been determined by
exogenous elements based mainly from changes in the structure and scope;
activities and risks that the financial sector is facing and international changes in
regulatory standards. The recent financial turmoil in the United States has
underscored the importance of establishing better risk management regimes in the
banking industry. The existing risk management culture based on normal business
conditions and historical trends is not enough coping with the type of disorders that
have been witnessed in the global financial systems. This has necessitated
appropriate responses by regulatory and supervisory agencies.
The supervisory approaches within NRB are changing alongside the advances in
technology and supervisory practices around the world. So far, it has been following
compliance-based supervision where supervisors review the credit files and returns
produced by banks to assess compliance with existing laws and guidelines. It is
focused more on detecting deviations from legal provisions rather than the overall
financial soundness and risk management by banks. The existing approach provides
a snapshot of an institution’s financial condition at a point of time and the supervision
is periodic.
Supervisory authorities all over the world are gradually moving towards risk-based
supervision that is likely to contribute positively in the supervisory function. Though
scrutiny of systems and procedures at the bank under supervision is integral to on-
site inspection, there is scope for focusing more on the risk profile of the bank.
Globally, the move of supervisory bodies is towards more risk focused, responsive
and tailored approaches.

24
Nepal Rastra Bank carried out the Parallel Run of the New Capital Adequacy
Framework based on Basel II in FY 2007/08. The framework, brought into effect after
meticulous impact studies and discussions with different stakeholders, requires
banks to maintain capital based on risk exposure. The Parallel Run of Basel II was
successful in orienting banks to identify, classify and assess various risks in order to
make necessary capital management. However, as the banking sector is yet to
mature, the advanced approaches prescribed for banks in international markets are
largely not applicable in Nepal. Thus, the prescribed approaches have been
customized and simplified for implementation in Nepalese banks and financial
institutions.
NRB has developed and issued Risk Management Guidelines based on the Basel
Core Principles to set the minimum standard for risk management in commercial
banks. It is also developing an overall framework for moving towards risk-based
supervision (RBS).
3.2 Risk Based Supervision
Risk Based Supervision (RBS) is a proactive and efficient supervisory process,
which enables the supervisor to prioritize and focus efforts and resources on areas
of significant risks and/or banks that have high-risk profiles. It entails a shift from a
rigid rules/compliance-based supervisory approach to a more risk sensitive one,
which seeks to encourage a bank to develop, and continuously update its internal
risk management system to ensure that it is commensurate with the scope and
complexity of its operations. The main objectives of RBS are to:
Identify banks in which risks are higher
Identify the areas which are exposed to higher risk, and
Allocate scarce supervisory resources to identified risky areas.

25
Adoption of RBS saves supervisory resources and helps to promote a safe and
sound financial system. It saves resources because it focuses supervisory efforts on
areas of higher risk. By getting institutions to manage risks as opposed to correcting
symptoms of problems, as in case of traditional supervision, supervisors focus their
actions on identifying and preventing the causes of problems requiring improvements
in management practices and systems. RBS is not transaction based instead it is a
system-based inspection. In this approach, the regulator and supervisor enter into
the depth and details of the system and procedures for managing and controlling
risks.
The current supervisory process adopted by the BSD at NRB is applied to all
commercial banks uniformly. It is largely on-site inspection driven and supplemented
by off-site monitoring and follow-up. The process is based on CAMELS and CAELS
approaches where capital adequacy, asset quality, management aspects, earnings,
liquidity and sensitivity to market risk, etc. are reviewed keeping in mind the legal
requirements. On-site inspection is conducted, to a large extent, in reference to the
audited balance sheet date and any particular cut-off date of the fiscal year. Off-site
surveillance plays a supplementary role. In several external jurisdictions, the
supervisory process extensively leverages on the work done by others such as the
internal and external auditors. Nepal has no laws requiring external auditors to report
adverse findings to the supervisor on issues attracting supervisory attention.
However, the auditor has to submit a special purpose report called the Long Form
Audit Report (LFAR) to the supervisor.
3.3 Basel Core Principles (BCP)
The Basel Committee formulates supervisory standard / guidelines and also issues
statements with broad application on international best practices with regard to
regulation and supervision. This is intended to enable central banks to take required
measures for applying the standards within a legal and regulatory framework

26
appropriate to the country’s financial system. Since the introduction of the Core
Principles for Effective Banking Supervision in September 1997 by the Basel
Committee on Banking Supervision (BCBS), these principles have emerged as the
global standards for the quality of supervisory systems. The Basel Committee
recognizes that effective banking supervision requires a set of principles to be
followed. It is a brief document and covers a variety of topics in connection with
regulation and supervision.
Although supervisory practices and processes are always evolving and improving
with time, it is always good to continuously subject supervisory arrangements to
scrutiny against internationally accepted benchmarks and to consider improvements.
For complying with the BCP effectively, there is need for a strong public
infrastructure, including:
Financial transparency and effective corporate governance in banks and
financial institutions,
Balanced and stable fiscal policy,
Effective supervision of the financial sector by all concerned regulatory
bodies,
A sound legal system with strong enforcement of laws associated with
contract enforcement, bankruptcy, collateral and loan recovery,
Accounting standards and disclosure requirements, which are broadly
consistent with internationally accepted principles,
Institutions such as Assets Management Companies, Credit Rating Agencies,
Deposit Insurance and
Laws on controlling financial crime and conflict of interest.
The BSD at NRB is closely monitoring the application of BCP in its supervisory
policies and practices. The priority has been placed on addressing the BCP while
developing policy documents suited to the Nepalese financial system and context.

27
During onsite inspection, supervisors also pay attention to superb policies and best
practices of commercial banks in connection with their banking business.
3.4 Capital Adequacy Framework and its Implication in Nepal
NRB has implemented New Capital Adequacy Framework in commercial banks to
align with international best practices and also to ensure that capital at banks are
more risk sensitive and resilient to shocks. The structure and composition of the
Nepalese financial market doesn’t permit advanced approaches like the Internal
Rating Based (IRB) or the Standardized Approach. Considering the market, NRB
has adopted the simplified standardized approach for credit risk, basic indicator
approach for operational risk, and the net open position approach for assessing
market risk.
The Capital Adequacy Framework 2007 (updated) was put in place after
consultations with stakeholders, evaluation and assessments and impact studies.
This framework provides guidelines for implementing the New Capital Adequacy
Framework in Nepal. In line with International Convergence of Capital
Measurements and Capital Standards, this framework builds three mutually
reinforcing pillars – minimum capital requirements, supervisory review process, and
market discipline.
The first pillar requires minimum capital requirements for credit, operational and
market risks. Conceptually, the first pillar is similar to the existing capital framework,
in that, it provides a measure of capital relative to risk and also calculates operational
and market risks to the total risk weighed exposure to credit risk.
The second pillar – supervisory review process - requires banks to assess capital
and allows supervisors to evaluate a bank’s assessment, and determine whether the
assessment was reasonable. It is not enough for a bank or its supervisors to rely on
the calculation of minimum capital under the first pillar. Supervisors need to provide

28
an extra set of eyes to verify that the bank understands its risk profile, and is
sufficiently capitalized for facing the risks.
The third pillar – market discipline – ensures that the market provides yet another set
of eyes. The third pillar is intended to strengthen incentives for prudent risk
management. Greater transparency in financial reporting by banks can allow market
participants to better reward well-managed banks and penalize those that are poorly
managed.
Accord Implementation Group (AIG) was formed for overseeing the implementation
of the New Capital Adequacy Framework in Nepal. It comprises of officers from Bank
and Financial Institution Regulation Department, BSD and Financial Institution
Supervision Department. Realizing the importance of participation of stakeholders,
representatives of commercial and development banks are also included in the AIG.
3.4.1 Internal Capital Adequacy Assessment Process (ICAAP)
The “International Convergence of Capital Measurement and Capital Standards-A
Revised Framework”, (popularly known as Basel II), was issued by the BCBS in
June 2004. The revised framework aims for significantly more risk-sensitive capital
requirements than the 1988 Basel I accord and are based on three mutually-
reinforcing pillars: minimum capital requirements, supervisory review and market
discipline.
Pillar 1 covers minimum capital requirements for credit, market and operational risk.
Pillar 2 (Supervisory Review) comprises of Internal Capital Adequacy Assessment
Process (ICAAP) followed by Supervisory Review and Evaluation Process (SREP).
Pillar 3 (Market Discipline) includes disclosure requirements, or reporting. Thus,
ICAAP is covered under the Pillar 2 of Basel II Accord and is followed by SREP.
ICAAP is understood as bank’s internal assessment of capital that it considers
adequate to cover all material risks to which it is exposed. The objective of ICAAP is

29
to ensure that a bank understands its risk profile and has systems in place to assess,
quantify and monitor risk. One of the objectives is to determine the economic capital
required to cover all risks faced. While regulatory capital is the capital that the
regulator requires a bank to maintain, economic capital is capital that a bank needs
to maintain and is, in general, estimated using internal risk models. In order to define
the amount of risk as the possible loss in asset value over time or equivalently, the
erosion in the value of a bank’s equity (till the asset value falls below debt after which
the debt holders start getting affected), then the amount of capital a bank needs to
hold exactly equals the amount of risk. Therefore, the term economic capital is
frequently used as a proxy for risk. Since theoretically a bank could suffer losses
causing a complete erosion of its asset value, it is reasonable to look at the erosion,
which would almost never happen. This forms the basis of measuring economic
capital. The scope and coverage of ICAAP is much beyond Pillar 1 in the sense that
it not only covers the Pillar 1 risks (credit risk, market risk & operational risk) but also
encompasses all material risks. Though Pillar 1 is more costly and time-consuming
to implement, Pillar 2 has more depth, and far reaching consequences for banks.
The Pillar 2 (Supervisory Review Process, SRP) requires banks to implement an
internal process, called the Internal Capital Adequacy Assessment Process (ICAAP),
for assessing capital adequacy in relation to their risk profile as well as a strategy for
maintaining capital levels. The Pillar 2 also requires the supervisory authorities to
focus all banks to an evaluation process, hereafter called Supervisory Review and
Evaluation Process (SREP), and to initiate such supervisory measures, as might be
necessary.
3.4.2 Prompt Corrective Action
BCP No. 6 (Capital adequacy) focuses on capital requirement and enforcing Prompt
Corrective Action (PCA). It states, "Supervisors must set prudent and appropriate
30
minimum capital adequacy requirement for banks that reflect the risks that the bank
undertakes and must define the components of capital, bearing in mind its ability to
absorb losses." It also emphasizes that supervisors should require all banks to
calculate and consistently maintain a minimum capital adequacy ratio. The
supervisor defines the components of capital, ensuring that emphasis is given to
those elements of capital available for absorbing losses. The supervisor should be
equipped with the power to impose a specific capital charge and/or limits on all
material risk exposures.
Similarly, BCP No. 23 (Corrective and remedial powers of supervisors) states that
supervisors must have at their disposal an adequate range of supervisory tools to
bring about timely corrective actions, if for example, a bank is not complying with
laws, regulations or supervisory decisions, or is engaged in unsafe or unsound
practices, or when the interests of depositors are otherwise threatened. These tools
include the ability of the supervisor to take prompt remedial action and to impose
penalties.
The supervisors and regulators in least developed countries are being encouraged to
adopt PCA. However, there are some preconditions needed for the adoption of an
effective PCA and these include conceptual elements such as a prudential
supervisory focus on minimizing public deposit losses, and mandating supervisory
action as capital declines. The preconditions also include institutional aspects such
as greater supervisory independence and authority, more effective problem bank
resolution mechanisms, better methods of measuring capital, and enhancing
supervisory capabilities.
Over the years, several countries have adopted a system of prudential PCA binding
capital adequacy standards, and the ability to take substantial actions against banks
that fail to meet the standards. The adoption of PCA in the US, UK, European Union,
Hong Kong, Canada, Mexico, Korea, Indonesia, India, Bangladesh, Malaysia and
31
Brazil appear successful. The PCA approach to supervision believes that early steps
in preventing problems in banks are always better than caring for troubled banks.
In the PCA, immediate actions need to be taken to those banks whose capital
adequacy ratio falls short of the stipulated limit. Actions include restrictions on
branch expansion and dividend payments, loan disbursement and deposit
mobilization, and increases in salary and allowances depending on the level of
shortfall in the regulatory capital adequacy ratio.
NRB has already developed a PCA that is triggered by capital shortfalls. NRB has
also realized the need to incorporate additional provisions for triggering actions
based on liquidity and non performing assets(NPA) in the PCA bylaws.
3.5 Bank Exit Mechanism
One of the most challenging aspects of a bank supervisor’s job is knowing how to
read and react, in a balanced and effective way, to symptoms of problems that may
not yet be obvious to bank management and directors. The point where supervisor
identifies potential problems and recognizes the possible effect on a bank’s condition
is critical. NRB is committed to develop and implement supervision policies and
procedures that support prompt detection and mitigation of problems before they
affect a bank’s viability. NRB has, continuously, directed its efforts and made
progress in implementing prudential regulations including new capital adequacy
norms, strengthening supervisory capacity, making provisions for liquidity support to
banks, and introducing PCA), Early Warning Signals (EWS), and Stress Testing of
banks. The Nepalese financial system is exposed to both external risks, from the
global financial crisis, as well as those arising from internal macroeconomic
vulnerabilities. Under such a scenario banks regulators and supervisors need to be
well prepared for handling crisis that could result from the vulnerabilities of financial
system before they trigger systemic crises. Developing supervisory capacity for crisis
management, defining step-by-step process and mechanisms for problem bank

32
resolution, and developing bank exit systems are some immediate issues that need
to be addressed.
3.6 Macro-prudential Supervision
One important lesson learnt from global financial crisis is that regulation and
supervision of banks in isolation is not sufficient for maintaining financial stability. A
macro-prudential perspective evaluates and monitors the financial system as a
whole. Globally, efforts are already underway to initiate combined approaches to
micro and macro prudential perspectives to create a stronger supervisory framework.
Adopting macro-prudential supervision is an issue that needs to be addressed for the
stability of the Nepalese financial system.
3.7 Financial Safety Net or Deposit Guarantee
Developing a financial safety net for banks has been an important issue for
sustainable development of financial systems. NRB has the objective of promoting
stability and credibility of the banking system among the general public.
Strengthening regulatory and supervisory functions is important and developing a
strong safety net is essential for attaining the objective. Deposit guarantee schemes
for up to Rs. 200,000 have been introduced in Nepal. Besides, the establishment of
Asset Management Company (AMC), strengthening the capacity of Debt Recovery
Tribunal and establishment of Credit Raging Agencies are also equally important to
maintain and promote a safe and sound financial system.
3.8 Stress Testing
The impact on capital needs to be detected through stress testing. This will be
included in risk profile of a bank and would also need banks to maintain a shock-
absorbing fund in the form of regulatory capital. A stress test is a general term
covering the techniques and methodologies that banks can employ to measure their
vulnerability or exposure to the impacts of exceptional, rare but potential events.

33
These events could be interest rate changes, exchange rate fluctuations, changes in
credit rating, and those that influence liquidity etc. There are various methods for
measuring the impact of the factors discussed above in the supervisory review
process:
Simple sensitivity tests determine short-term sensitivity to a single risk factor,
and
Scenario analyses involve risk parameters (with low but positive probability) that
change along a pre-defined scenario, and the examination of the impact of
these parameters.
Out of these methods, the sensitivity test is simpler and serves a bank with a simple
portfolio best. A scenario analysis is somewhat more complicated and requires more
resources. Institutions with complex portfolios use this approach to assess risk
factors, which they consider material – after proper calibration of scenario
parameters. The time horizon of the analysis should be set in accordance with the
composition of the portfolio. Banks should regularly verify that the assumed risk
profile used during the stress test is in harmony with external factors. As a starting
point the scope of the stress test may be limited to simple sensitivity analysis.
Different risk factors that can be used for the stress test are interest rate, forced sale
value of collateral, non-performing loans (NPLs), stock prices and foreign exchange
rate fluctuations.
The liquidity positions of banks need to be stressed separately. Though the decision
of creating different scenarios for stress testing is a difficult one, to start with, certain
levels of shocks to the individual risk components need to be specified considering
the historical as well as hypothetical movement in the risk factors. Stress test should
be carried out assuming three different hypothetical scenarios:
Minor Level Shocks: These represent small shocks to the risk factors. The level
for different risk factors can, however, vary.
Moderate Level Shocks: It envisages medium level of shocks and the level needs
to be defined in each risk factor separately.

34
Major Level Shocks: It involves big shocks to all the risk factors and needs to be
defined separately.
Nepal Rastra Bank has issued stress-testing guidelines with different level of shock
to be considered by banks for their use in connection with stress testing. Banks are
allowed to use different levels of shock to be tested based on their own risk profile
and bank-specific conditions.
3.9 E-banking in Nepalese Commercial Banks
Electronic banking is the automated delivery of new and traditional banking products
and services directly to customers through electronic, interactive communication
channels. It provides customers convenient access to banking facilities from the
comfort of their home or office. Electronic banking includes systems that enable
customers to access accounts, transact business, or obtain information on financial
products and services through a public or private network, including the Internet.
Electronic banking can help the standardization of banking products and lead to
substantial reduction in costs. Enhancing efficiency of banking services is a major
objective of electronic banking by creating opportunities for penetrating new markets,
and expanding banking across borders. Electronic banking increases transparency
and competition in services but also increases risks. Nepalese banks are providing
the following e-banking services:
Internet Banking
SMS/Mobile Banking
Card Services (Debit Cards, Credit Cards, Prepaid Cards)
Automated Teller Machines (ATMs), and
Branchless Banking
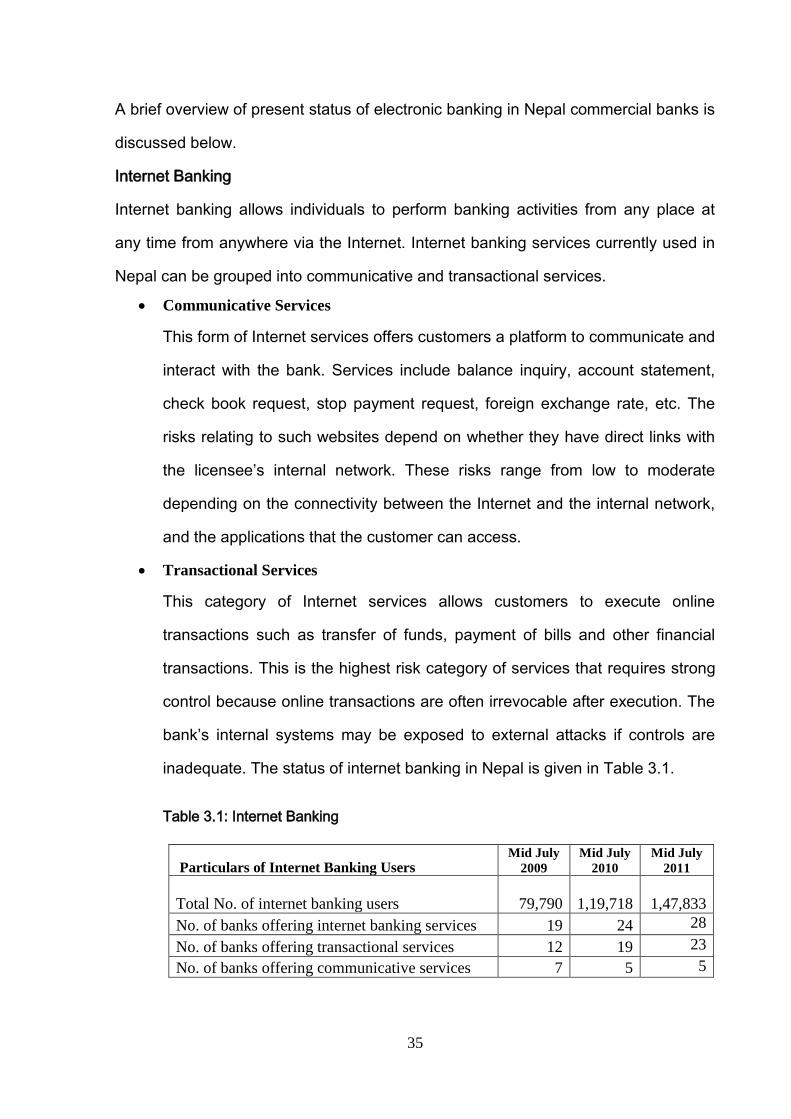
35
A brief overview of present status of electronic banking in Nepal commercial banks is
discussed below.
Internet Banking
Internet banking allows individuals to perform banking activities from any place at
any time from anywhere via the Internet. Internet banking services currently used in
Nepal can be grouped into communicative and transactional services.
Communicative Services
This form of Internet services offers customers a platform to communicate and
interact with the bank. Services include balance inquiry, account statement,
check book request, stop payment request, foreign exchange rate, etc. The
risks relating to such websites depend on whether they have direct links with
the licensee’s internal network. These risks range from low to moderate
depending on the connectivity between the Internet and the internal network,
and the applications that the customer can access.
Transactional Services
This category of Internet services allows customers to execute online
transactions such as transfer of funds, payment of bills and other financial
transactions. This is the highest risk category of services that requires strong
control because online transactions are often irrevocable after execution. The
bank’s internal systems may be exposed to external attacks if controls are
inadequate. The status of internet banking in Nepal is given in Table 3.1.
Table 3.1: Internet Banking
Particulars of Internet Banking Users Mid July
2009
Mid July
2010
Mid July
2011
Total No. of internet banking users 79,790 1,19,718
1,47,833
No. of banks offering internet banking services 19 24 28
No. of banks offering transactional services 12 19 23
No. of banks offering communicative services 7 5 5

36
In mid-July 2011, 28 of the 31 commercial banks were offering Internet
banking services. Among them 23 banks were offering transactional services,
and five using Internet only or communications. There were 1,47,833 Internet
banking users of commercial banks in mid-July 2011, which is 23.48 percent
higher than that in mid-July 2010. Two banks were using two-factor
authentications (2FA) mechanism for verifying customers and rest used a two-
level password based authentication.
Short Message Service (SMS) Banking/Mobile Banking
SMS banking is a technology-enabled service offered by banks to customers. It
allows customers to carry out selected banking services over mobile phones using
SMS messaging. Nepalese banks are providing services like balance inquiry, mini
statement, last transactions information, withdrawal alerts, check book
inquiry/request, intra-bank fund transfer, utility bill payments, etc. through SMS.
Registered mobile numbers and pin code are used for customer authentication in
mobile banking services.
Table 3.2: SMS Banking
In mid-July 2011, 26 banks were offering SMS banking services. The number of
SMS banking users in mid-July 2011 was 2,67,426, a 23.25 percent increase
compared to that of July 2010.
Particulars of SMS Banking Users Mid July
2009
Mid July
2010
Mid July
2011
Number of SMS banking users 1,11,155 2,16,987 2,67,426
No. of banks offering SMS banking services 24 21 26
No. of banks offering transactional services 1 5 12
No. of banks offering non-transactional services 23 16 14
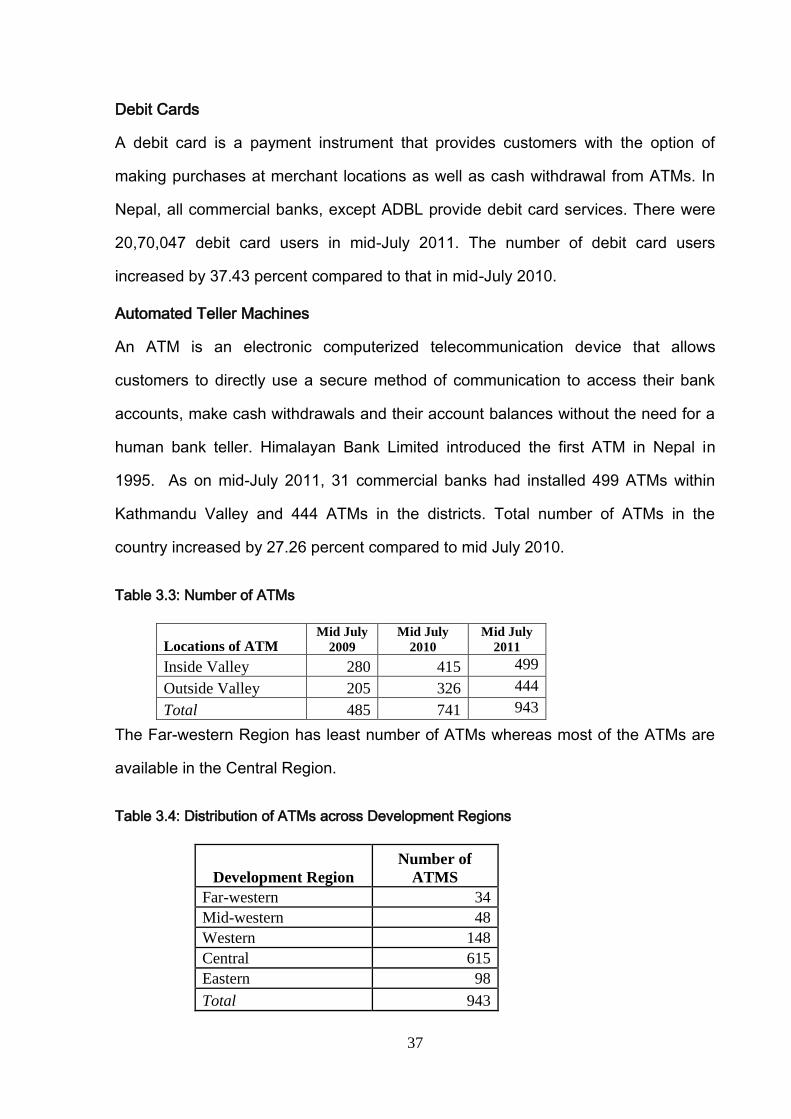
37
Debit Cards
A debit card is a payment instrument that provides customers with the option of
making purchases at merchant locations as well as cash withdrawal from ATMs. In
Nepal, all commercial banks, except ADBL provide debit card services. There were
20,70,047 debit card users in mid-July 2011. The number of debit card users
increased by 37.43 percent compared to that in mid-July 2010.
Automated Teller Machines
An ATM is an electronic computerized telecommunication device that allows
customers to directly use a secure method of communication to access their bank
accounts, make cash withdrawals and their account balances without the need for a
human bank teller. Himalayan Bank Limited introduced the first ATM in Nepal in
1995. As on mid-July 2011, 31 commercial banks had installed 499 ATMs within
Kathmandu Valley and 444 ATMs in the districts. Total number of ATMs in the
country increased by 27.26 percent compared to mid July 2010.
Table 3.3: Number of ATMs
Locations of ATM Mid July
2009
Mid July
2010
Mid July
2011
Inside Valley 280 415 499
Outside Valley 205 326 444
Total 485 741 943
The Far-western Region has least number of ATMs whereas most of the ATMs are
available in the Central Region.
Table 3.4: Distribution of ATMs across Development Regions
Development Region
Number of
ATMS
Far-western 34
Mid-western 48
Western 148
Central 615
Eastern 98
Total 943

38
Credit Cards
Credit cards contain identifying information about a credit account maintained by a
customer with a bank or other financial institutions. NABIL Bank Limited is the first
one that introduced credit card in Nepal in the early 1990s. Very few Nepalese banks
offer credit card services. In mid-July 2011, only 7 of 31 commercial banks were
offering credit card facilities. They had issued 30,079 credit cards in Nepalese
currency and 4,865 Credit cards in USD.
Table 3.5: Credit Cards
Mid July 2009 Mid July 2010 Mid July 2011
Total Number of Credit
Card Users 30,909 28,856
34,944
Domestic 27,301 25,560 30,079
International 3,608 3,296 4,865
Prepaid Card
Customers can obtain prepaid cards without having a bank account at the concerned
bank. In mid-July 2011, six banks were offering prepaid card services and had
issued 49,275 domestic prepaid cards and 4,535 international prepaid cards.
Table 3.6: Prepaid Cards
Mid July 2009 Mid July 2010 Mid July 2011
Total Number of Prepaid
Card Users 32,066 34,024 53,810
Domestic 27,728 30,115 49,275
International 4,338 3,909 4,535
Branchless Banking
Branchless banking is a distribution channel strategy used for delivering financial
services without relying on bank branches. It is serviced through point of transaction
(POT) machines using smart cards. In mid-July 2011, two banks were providing
branchless banking services in five districts and there were 6,964 branchless
banking customers using deposit and withdrawal facilities.

39
CHAPTER FOUR
Supervisory Activities
4.1 Annual Action Plan of Bank Supervision Department
The BSD prepares annual action plans for each year. Such plans need to be
reviewed regularly to ensure that implementation is in line with the plan. The BSD
reviews the plans at a regular interval. The annual action plan for the fiscal year
2010/11 and its implementation status is presented in Table 4.1.
Table 4.1: Annual Action Plan of BSD, 2010/11
S. N. Work Plans Implementation Status
1 On-site Inspection
Yes
1.1 Corporate level on-site inspection of all commercial banks. Yes 1.2 Preparation of Inspection Reports Yes 1.3 Special inspection of banks and branches as required Yes
2 Off-site Supervision
Yes
2.1 Preparation of quarterly consolidated off-site supervision report incorporating financial analysis, and compliance to prevailing directives and regulations, within the specified time.
Yes
2.2 Preparation of consolidated annual off-site supervision report of all commercial banks.
Yes
2.3 Annual clearance of commercial bank Yes
2.4 Cash Reserve Ratio and Deprived Sector Lending monitoring Yes 2.5 Capital adequacy ratios monitoring Yes
2.6 Daily liquidity monitoring Yes
3 Enforcement 3.1 Enforcing directions given by NRB during on-site
examinations or off-site supervision Yes
3.2 Monitoring implementation status of directions given by NRB on-site examination, or off-site supervision
Yes
3.3 Preparation of quarterly enforcement reports reflecting implementation status of each bank within the specified deadline.
Yes
4 Policy, planning
4.1 Publication of annual report of Bank Supervision Department. Yes

40
4.2 Coordination of various interaction programs, seminars, workshops, and trainings.
Yes
4.3 Preparation of Annual Bank Supervision Action Plan for 2010/11
Yes
4.4 Implementation of Risk Management Guidelines Yes
4.5 Preparation and implementation of Liquidity Monitoring Framework and Stress Testing Guidelines
Yes
The BSD performed all the planned activities in the Annual Supervision Action Plan
of 2010/11.
4.2 Corporate On-site Inspection Programs
The corporate on-site examinations of 29 banks (except Civil Bank Limited and
Century Bank Limited which were established in the last quarter of the fiscal year)
were carried out during 2010/11. The schedule of the quarterly on-site examinations
in 2010/11 was as follows:
Table 4.2: Corporate On-site Examinations in 2010/11
S. No. First Quarter Second Quarter Third Quarter Fourth Quarter
1 Nepal Bangladesh
Bank Ltd
Himalayan Bank
Ltd.
Nepal Bank Ltd.
Standard Chartered
Bank Nepal Ltd.
2 NCC Bank Ltd. Machhapuchchhre
Bank Ltd.
Rastriya Banijya
Bank Limited
Everest Bank Ltd
3 Global Bank Ltd. NIC Bank Ltd. Bank of Asia
Nepal Ltd.
Siddhartha Bank Ltd
4 Kist Bank Ltd. Kumari Bank Ltd. Bank of
Kathmandu
Development Credit
Bank Ltd.
5 Nepal Investment
Bank Ltd
Nepal SBI Bank Ltd. Citizens Bank
International Ltd.
Laxmi Bank Ltd.
6 Nabil Bank Ltd Sunrise Bank Ltd. Prime Commercial
Bank Ltd.
Lumbini Bank Ltd
7 Janata Bank Ltd. NMB Bank Ltd Agriculture
Development Bank
Ltd.
Commerz & Trust
Bank Ltd.
8 Mega Bank Ltd.
Total 7 7 8 7

41
Several discrepancies were identified in the course of inspections in terms of
compliance with NRB directives, BAFIA-2006 and other prevailing laws and
regulations. Similarly, there were shortcomings in corporate governance and risk
management practices. BSD has issued both specific and general
directions/instructions to banks for resolving the shortcomings observed during
inspections. The overall observation is that banks have poor corporate governance
and therefore there is a need for frequent on-site visits. The major shortcomings as
well as non-compliance observed at the banks during on-site examinations in
2010/11 were as follows:
Area of Inspections Major areas where deviation and non-compliances were observed
Capital Adequacy
Heavy accumulated loss and capital below prescribed limit in public banks
Cases on accounting treatment of debt instruments Improper calculation of risk weighed exposure Weak overall risk management Disclosure policy not formulated Credit risk mitigation criteria not fulfilled Loan provided by banks exceeded the Single Obligor
Limit (SOL) Weak infrastructure to implement Capital Adequacy
Framework Supervisors were not satisfied with operational risk
management, Asset Liability Management, and overall
risk management of the banks.
Asset Quality Lack of sound credit risk management practice (e.g., credit department lacking separate line of reporting for marketing and control) & poor credit documentation issues (e.g. credit information report, tax clearance, audited financial statements of the borrower, stock inspection report, valuation report, inadequate insurance of collateral and assets, etc.)
Lack of formulation and implementation of loan write-off
policy. Non-compliance to the terms and conditions mentioned in
the offer-letter.
Irregular credit monitoring.
Inadequate loan loss provisioning.
Inadequate borrowers’ information.
Borrowers separated only the basis of legal separation for

42
SOL purpose and credit concentration issues
Issues on assessment of borrower’s future cash flows for loan repayment
Improper valuation of fixed assets
Overdrawn overdraft limit
Creation of new loan limit to repay existing loans
Irregular consortium meetings
Non-compliance of Company Act
Issues on Loan Restructuring
Non-compliance of NRB Directives on Blacklisting
Discretionary power to CEO to override the provisions of
Credit Policy Guidelines (CPG)
Loan approved before getting credit information
Lack of proper monitoring of deprived sector loan
Board and management inactive in recovering problem
loans
Know Your Customer (KYC) directives not followed
Conflict between management and bank employees
Short-term loan extended again and again
Non-compliance of loan classification and provisioning
directives
Purpose of personal large loan not identified
Loan disbursed before approval
Loan disbursed against local Letter of Credit (LC)
Credit concentration in real estate sector
Issues in multiple banking (Paripassu not done)
Loan provided to promoter group
Recovery process not initiated upon maturity of the loan
Poor internal control
Grading of borrowers not assigned as envisaged by Risk
Management Guidelines
Management Lack of Compliance to Personnel Policy Guidelines of the
bank (Issues of job description, authority delegation,
transfer and promotion)
Disclosure policy not formulated
Strategic and business plan not formulated
Issues of high staff turnover and lack of proper staff
retention policy.
Independence and importance of Audit Committee
undermined
Lack of Board oversight on ICAAP and overall risk
management Inadequate MIS, IT, Disaster Recovery, information
security policy, weak data access control Lack of backup link in disaster recovery site
Weak outsourcing risk management Lack of comprehensive risk management guidelines
Lack of successor plan
Unprofessional decisions of the Board of Directors

43
Weak Board oversight on loans
BAFIA not fully complied
Operational lapses and less effort made to reducing lapses
Mechanism not prepared to monitor single obligor limit
and related parties
Board of directors unaware of bank activities
Crossholding not divested
Non-compliance to Anti Money Laundering directives
Bank not serious to comply with NRB directives
Conflict among directors of the bank
Less effective internal audit and compliance department
Regular loan limit provided to own staff
No procedure developed conducting Board meetings
Earning Improper classification and provisioning Issues of income recognition
High employee expenses (up to 77 percent of operating income)
Liquidity No discussion of agendas and very low frequency of Asset
Liability Committee (ALCO) meeting
Weaknesses in monitoring of liquidity profile and gap
analysis
High credit to deposit ratio Low net liquid assets to total deposit ratio Heavy gap in short term asset and liabilities and no revival
plan
Liability concentration in few clients
Sensitivity To Market
Poor analysis of rate sensitive assets and liabilities ALCO lacking regular meeting Investment Policy not formulated/implemented
The comments/issues on inspection reports, to a great extent, have been repeated
for the last few years. The comments generally happened to be in the field of
corporate governance, compliance and collateral issues. With regard to the
effectiveness of enforcement, most banks were complying with instructions given by
the supervisor and appropriate corrections took place on time. At the same time
some banks seemed more or less unable to address some issues in the inspection
reports justifying more supervisory attention.

44
Special On-site Inspection
During 2010/11, BSD conducted 61 special on-site examinations, one each at the 28
banks, and maximum of six inspections at Sunrise Bank Limited, which related to
various issues. The inspection was initiated on the basis of information provided by
the off-site unit and was instrumental in resolving the main issues.
Table 4.3: Special On-site Inspection in 2010/11
S.N. Banks No of Inspection
1 Nepal Bank Ltd. 1
2 Rastriya Banijya Bank Ltd. 1
3 Nabil Bank Ltd. 2
4 Nepal Investment Bank Ltd. 3
5 Standard Chartered Bank Nepal Ltd. 1
6 Himalayan Bank Ltd. 2
7 Nepal Bangladesh Bank Ltd. 5
8 Nepal SBI Bank Ltd. 1
9 Everest Bank Ltd. 2
10 Bank of Kathmandu Ltd. 4
11 Nepal Credit & Commerce Bank Ltd. 3
12 Lumbini Bank Ltd. 1
13 Nepal Industrial and Commercial Bank Ltd. 1
14 Machhapuchchhre Bank Ltd. 5
15 Kumari Bank Ltd. 4
16 Laxmi Bank Ltd. 1
17 Siddhartha Bank Ltd. 1
18 Agriculture Development Bank Nepal Ltd. 1
19 Global Bank Ltd. 1
20 Citizens Bank International Ltd. 2
21 Prime Commercial Bank Ltd. 3
22 Bank of Asia Nepal Ltd. 4
23 Sunrise Bank Ltd. 6
24 NMB Bank Ltd. 1
25 DCBL Bank Ltd. 2
26 Kist Bank Ltd. 1
27 Janata Bank Ltd. 1
28 Civil Bank Ltd. 1
Total Number of Inspections 61
4.3 Off-site Supervision
4.3.1 Cash Reserve Ratio (CRR) and Daily Liquidity Monitoring

45
Commercial banks are the backbone of the payment system and are the main
conduits of monetary policy. As an indirect monetary instrument, NRB uses CRR to
control money supply in the economy, which was 5.5 percent of total local currency
deposit liabilities in the review period. Banks that fail to maintain such reserves, face
monetary penalties based on the bank rate. The penalty rate escalates for repeated
violations. In 2010/11, Lumbini Bank Limited was penalized once in the first quarter
(Rs. 23007) for non-compliance to CRR. The offsite unit collects data from all
commercial banks to monitor and review weekly average CRR positions. It aims to
identify the balance of (excess or shortfall) reserves maintained in central bank.
4.3.2 Directed Lending
Nepalese commercial banks are required to disburse at least three percent of their
total loan portfolio in the deprived sector as directed lending. Failure to meet this
obligation results in the financial penalty, computed on the basis of the highest
published lending rate of the defaulting bank. During 2010/11, Siddhartha Bank
Limited was penalized (Rs. 275830.63) for not complying with the norms of directed
lending.
4.3.3 Statutory Liquidity Ratio (SLR)
Banks are required to maintain SLR of 15 percent of their total domestic deposit
liabilities. Failure to meet such obligation results in monetary penalties, computed on
the basis of bank rate (6.5 percent). During the fiscal year 2010/11, all the banks
complied with the Statutory Liquidity Ratio norm.
4.3.4 Capital Adequacy Ratio
The New Capital Adequacy Framework requires the banks to maintain minimum
capital requirements. As per the framework, commercial banks need to maintain at
least 6 percent Tier I capital and 10 percent Total Capital (Tier I & Tier II). The
minimum capital adequacy requirements are based on risk-weighted exposures
(RWE) of the banks. The capital adequacy ratios of banks are monitored each
month. Table 4.4 shows the capital position of the banks in mid-July 2011.

46
Table 4.4 Capital Adequacy Ratio at Commercial Banks
S.N. Bank
Rs. (in million) Percent
Tier 1 Tier 1 & Tier 2 Total RWE Tier I Total
Capital
1 Nepal Bank Ltd. -4789.14 -4789.14 49579.10
* 2 Rastriya Banijya Bank Ltd. -10452.51 -10452.51 46412.44
3 Nabil Bank Ltd. 4930.30 5734.54 48795.24 10.10 11.75
4 Nepal Investment Bank Ltd. 5817.43 7015.09 58043.31 10.02 12.09
5 Standard Chartered Bank Ltd. 4147.13 4668.33 26854.17 15.44 17.38
6 Himalayan Bank Ltd. 4303.51 5047.19 44085.18 9.76 11.45
7 Nepal Bangladesh Bank Ltd. 1727.50 1869.92 17755.96 9.73 10.53
8 Nepal SBI Bank Ltd. 2946.10 3250.62 27454.43 10.73 11.84
9 Everest Bank Ltd. 2927.17 3605.84 34583.55 8.46 10.43
10 Bank of Kathmandu Ltd. 2377.73 2662.07 22918.30 10.37 11.62
11 NCC Bank Ltd. 1572.68 1664.04 12251.36 12.84 13.58
12 NIC Bank Ltd. 2249.13 2531.62 17245.16 13.04 14.68
13 Lumbini Bank Ltd. 1790.71 1913.06 7810.07 22.93 24.49
14 Machhapuchhre Bank Ltd. 1747.97 1897.62 17477.22 10.00 10.86
15 Kumari Bank Ltd. 2236.59 2580.56 17863.89 12.52 14.45
16 Laxmi Bank Ltd. 2142.94 2567.26 19433.56 11.03 13.21
17 Siddharth Bank Ltd. 2160.60 2535.11 21583.30 10.01 11.75
18 Agriculture Dev. Bank Ltd. 11792.99 15130.98 75837.96 15.55 19.95
19 Global Bank Ltd. 1667.81 1823.04 16280.61 10.24 11.20
20 Citizens Bank Int'l Ltd. 2157.82 2282.76 14662.21 14.72 15.57
21 Prime Commercial Bank Ltd. 2780.49 2950.51 18056.33 15.40 16.34
22 Bank of Asia Nepal Ltd. 2346.10 2474.42 14210.95 16.51 17.41
23 Sunrise Bank Ltd. 2295.82 2417.84 16472.31 13.94 14.68
24 NMB Bank Ltd. 2145.67 2236.66 10533.42 20.37 21.23
25 DCBL Bank Ltd. 2324.46 2445.61 13738.15 16.92 17.80
26 Kist Bank Ltd 2264.08 2398.21 16545.90 13.68 14.49
27 Janata Bank Nepal Ltd 1480.43 1523.48 4180.82 35.41 36.44
28 Mega Bank Ltd. 1708.76 1756.93 9091.45 18.80 19.33
29 Commerz & Trust Bank Ltd. 1409.60 1434.46 4985.92 28.27 28.77
30 Civil Bank Ltd. 1201.55 1233.11 5794.95 20.73 21.28
31 Century Commercial Bank Ltd. 1123.20 1135.08 2697.69 41.64 42.08
Total 64534.62 75544.30 713234.91 9.05 10.59
* Banks having negative capital position and undergoing restructuring.
4.3.5 Annual Clearance for Publication of Financial Statements
Banks are required to obtain clearance from NRB prior to publishing their annual
accounts. In this process, an off-site surveillance of each bank is conducted based
on various documents like the final accounts submitted by the banks, preliminary
audit report, management reply, long form audit report, auditors’ final report and the

47
preceding on-site examination report. The bank’s financial position, compliance to
prevailing laws and issues raised by external auditors are analyzed to determine if
supervisory intervention is required.
4.4 Enforcement Activities
The Enforcement Unit is responsible for ensuring that banks adhere to NRB
directions with respect to the on-site examinations and off-site supervision.
Continuous follow up was done and efforts were made to ensure that the banks had
complied with the requirements. This Unit prepares quarterly enforcement reports.
4.5 Policy and Planning Activities
During the review period, the Policy Planning and Analysis Unit formulated an action
plan for the next year. The Unit conducted a periodic review of the Annual
Supervision Action Plan of 2010/11, and the report was executed in accordance with
Inspection and Supervision By-laws. The Unit also functions as secretariat for the
High Level Co-ordination Committee.
4.5.1 Liquidity Monitoring Framework and Stress Testing Guidelines
As necessitated by contingency planning, Risk Management Process, and Basel
core principles, the NRB has prepared and issued a Liquidity Monitoring Framework
to monitor the liquidity position of commercial banks. The Framework requires banks
to submit their short-term liquidity position (liquid asset to short term liabilities
position), deposit and credit concentration, interbank transaction, borrowing from
NRB (SLF, Repo, refinance), and liquidity profile (short- and long-term asset liability
position) within a given timeframe. This Framework helps in monitoring the liquidity
positions and devise suitable actions. Likewise, the stress testing guidelines aim to
assist banks to foresee their future position in the event of unanticipated risks. The
guidelines require commercial banks to carry out stress tests, periodic review of the
result of stress testing in their boards and submit them to NRB each quarter.

48
4.5.2 Trainings, Seminars, and Interaction Programs
A half-day workshop for board of directors of newly established commercial banks
was organized to familiarize them with NRB regulations and good corporate
governance practices. A total of 35 directors from six commercial banks attended the
program.
4.5.3 Working Group for Nepal Contingency Planning Project (NCPP)
A Senior Policy Group (SPG) to be chaired by the Minister of Finance has been
formed comprising the chiefs of the other regulatory bodies as members to the
Group. The Nepal Contingency Planning Project (NCPP) is a technical committee,
working under the SPG and is chaired by the Deputy Governor. It includes members
from the Ministry of Finance, Regulation Department and both Supervision
departments at NRB. The Policy Planning and Analysis Unit has been functioning as
secretariat for NCPP and its working group. The committee meets to address issues
that have major impacts on the financial system and are in the common jurisdiction
of all the regulatory bodies.

49
CHAPTER FIVE
Performance of the Commercial Banks in 2010/11
5.1 Assets of the commercial banks
The total assets of commercial banks increased by 10.43 percent in the fiscal year
2010/11 compared to 13.35 percent growth in 2009/10. The total assets increased
by 6.6 percent in public banks and by 11.66 percent in the private banks. The growth
rate of the total assets of private banks was higher than that of public banks with an
increasing trend over the last past five years.
Table 5.1: Total Assets of Commercial Banks (Mid-July, 2011)
(Rs. in billion)
Year 2006/07 Change % 2007/08 Change % 2008/09 Change % 2009/10 Change
% 2010/11
Private 251.23 36.86 343.84 42.39 489.58 15.60 565.94 11.66 631.98
Public 123.56 12.53 139.05 20.82 168.09 7.85 181.19 6.60 193.15
Industry 374.79 28.80 482.89 36.22 657.67 13.35 747.13 10.43 825.13
Chart 5.1: Total Assets of Commercial Banks

50
The increase in the total assets was mainly on account of the growth of the loan
portfolio of banks by Rs.65.50 billion in 2010/11. Such assets had increased by
67.60 billion and by Rs.98.84 billion in 2009/10 and 2008/09, respectively. The loan
portfolio of public banks grew by Rs.10.36 billion in 2010/11, while that of private
sector banks increased by Rs.55.14 billion.
5.2 Composition of Assets
Commercial banks have a variety of assets with loans and advances accounting
more than half of the total assets followed by other assets, cash and bank
balance and investments. In mid-July 2011, the proportions of loans, investment,
cash and bank balance, other assets and fixed assets in total assets 62 percent,
20 percent, 10 percent, 6 percent and 2 percent, respectively.
Chart 5.2: Composition of Assets of Commercial Banks

51
5.3 Composition of Liabilities
The liability and the capital side of balance sheet consisted of various sources of
funds like share capital, reserves, deposits and borrowings. The largest source of
fund of commercial banks in mid-July 2011 was deposit, which added up to Rs.687
billion, of which private banks held Rs. 532 billion. The second largest source, share
capital, comprised Rs.60 billion for all commercial banks. As evident from the
following Table 5.2, the reserves of private banks (Rs.16 billion) remained an
important source of funding. However, negative reserves of two public banks i.e.
NBL (Rs.4.6 billion), and RBBL (Rs.9.4 billion), have reduced the reserves of the
entire banking industry.
Year-on-year comparisons indicate a positive change in the liabilities of the banking
sector. Commercial banks were able to mobilize additional deposits of Rs.56.74
billion during 2010/11 – they had mobilized Rs. 66.69 billion deposits in 2009/10.
Private banks raised Rs. 44.74 billion in deposits in 2010/11 and public banks raised
Rs.11.89 billion.
Table 5.2: Composition of Liabilities (mid July, 2011)
(Rs. in billion)
(Note: Figures in parenthesis indicate percent of the total)
Capital and Liabilities Public Private Industry
Capital
11 (5.71)
49 (7.83)
60 (7.33)
Reserves and Surplus
(10) (-5.31)
16 (2.60)
6 (0.75)
Debenture & Bond
2 (1.19)
4 (0.59)
6 (0.73)
Borrowing
7 (3.57)
12 (1.88)
19 (2.28)
Deposit
155 (80)
532 (84.24)
687 (83.32)
Other Liabilities
28 (14.52)
18 (2.86)
46 (5.59)
Total Liabilities 193 632 825

52
Composition of Liabilities of Commercial Banks
7%
1%
1%
2%
83%
6%
Capital Reserves and Surplus Debenture & Bond
Borrowing Deposit Other Liabilities
The liabilities of commercial banks include deposits (83 %) while capital, borrowings
and others account for 7 percent, 2 percent and 8 percent respectively.
5.4 Capital
The consolidated capital fund of the Nepalese banking industry showed a positive
trend during the review year. The capital fund increased from Rs. 34.18 billion in
2008/09 to Rs. 50.53 billion in 2009/10, and Rs.66.66 billion in 2010/11. The capital
of private banks also grew by 24.01 percent to Rs. 65.88 billion. The capital fund of
public banks improved from negative of Rs. 2.6 billion to positive of Rs. 0.78 billion.
Chart 5.3: Composition of Liabilities of Commercial Banks (mid-July 2011)
Table 5.3: Total Capital Fund of Commercial Banks (Rs.in billion)
Banks / Year 2006/07
Changes % 2007/08
Changes % 2008/09
Changes % 2009/10
Changes % 2010/11
Private 14.25 79.06 25.51 59.40 40.67 30.64 53.13 24.01 65.88
Public -22.19 -27.31 -16.13 -59.77 -6.49 -59.92 -2.60 -129.97 0.78
Industries -7.94 -218.09 9.38 264.31 34.18 47.83 50.53 31.93 66.66
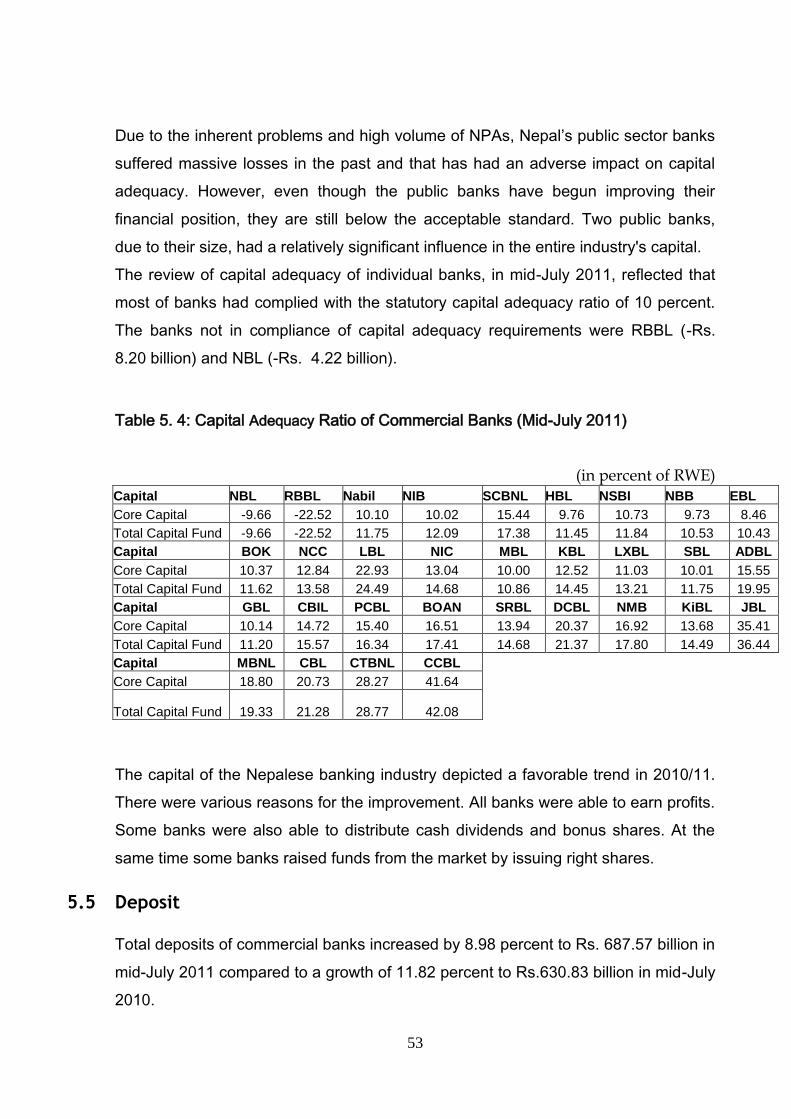
53
Due to the inherent problems and high volume of NPAs, Nepal’s public sector banks
suffered massive losses in the past and that has had an adverse impact on capital
adequacy. However, even though the public banks have begun improving their
financial position, they are still below the acceptable standard. Two public banks,
due to their size, had a relatively significant influence in the entire industry's capital.
The review of capital adequacy of individual banks, in mid-July 2011, reflected that
most of banks had complied with the statutory capital adequacy ratio of 10 percent.
The banks not in compliance of capital adequacy requirements were RBBL (-Rs.
8.20 billion) and NBL (-Rs. 4.22 billion).
Table 5. 4: Capital Adequacy Ratio of Commercial Banks (Mid-July 2011)
(in percent of RWE)
The capital of the Nepalese banking industry depicted a favorable trend in 2010/11.
There were various reasons for the improvement. All banks were able to earn profits.
Some banks were also able to distribute cash dividends and bonus shares. At the
same time some banks raised funds from the market by issuing right shares.
5.5 Deposit
Total deposits of commercial banks increased by 8.98 percent to Rs. 687.57 billion in
mid-July 2011 compared to a growth of 11.82 percent to Rs.630.83 billion in mid-July
2010.
Capital NBL RBBL Nabil NIB SCBNL HBL NSBI NBB EBL
Core Capital -9.66 -22.52 10.10 10.02 15.44 9.76 10.73 9.73 8.46
Total Capital Fund -9.66 -22.52 11.75 12.09 17.38 11.45 11.84 10.53 10.43
Capital BOK NCC LBL NIC MBL KBL LXBL SBL ADBL
Core Capital 10.37 12.84 22.93 13.04 10.00 12.52 11.03 10.01 15.55
Total Capital Fund 11.62 13.58 24.49 14.68 10.86 14.45 13.21 11.75 19.95
Capital GBL CBIL PCBL BOAN SRBL DCBL NMB KiBL JBL
Core Capital 10.14 14.72 15.40 16.51 13.94 20.37 16.92 13.68 35.41
Total Capital Fund 11.20 15.57 16.34 17.41 14.68 21.37 17.80 14.49 36.44
Capital MBNL CBL CTBNL CCBL
Core Capital 18.80 20.73 28.27 41.64
Total Capital Fund 19.33 21.28 28.77 42.08

54
Table 5.5: Deposit Mix of Commercial Banks (mid-July)
Account Types/Year
2007 2008 2009 2010 2011
Amt. Change
% Amt. Change
% Amt. Change
% Amt. Change
% Amt. Change
%
Current 45 20.32 56.1 24.67 71.6 27.63 80.6 12.57 78.9 -2.11
Saving 174.7 15.24 211.4 21.01 259.9 22.94 237.7 -8.54 231.1 -2.78
Term 87.2 13.84 104.8 20.18 141.2 34.73 200.1 41.71 253.6 26.74
Others 30.5 19.14 53.8 76.39 90.8 68.77 112.5 23.90 123.9 10.13
Total 337.4 15.87 426.1 26.29 563.5 32.25 630.9 11.96 687.5 8.97
The deposit of the banking industry was dominated by savings and term deposits.
The share of private banks in total deposit has been on an increasing trend for the
past five years. In mid-July 2011, the term deposit of the banking industry accounted
for 36.89 percent of the total deposit followed by savings (33.61%), others (18.02%),
and current deposits (11.47%).
5.6 Loans and Advances
Based on the gross loan of commercial banks, the loans and advances increased by
15.26 percent to Rs. 534.60 billion in 2010/11 compared to a growth of 15.42 percent
in 2009/10. Loan and advances of public banks increased by 8.80 percent to Rs.
109.10 billion, and that of private banks rose by 17.03 percent to Rs. 425.50 billion.
(Rs. in billion)
Note: Data based on gross loan
Table 5.6: Loans and Advances of Commercial Banks
Banks/Year 2006/07 Change %
2007/08 Change %
2008/09 Change %
2009/10 Change %
2010/11
Private 162.18 44.09 233.69 33.74 312.53 16.33 363.56 17.03 425.50
Public 72.97 9.55 79.94 11.73 89.32 12.26 100.27 8.80 109.10
Industry 235.15 33.37 313.62 28.13 401.85 15.42 463.83 15.26 534.60

55
5.6.1 Loans and Advances to Different Economic Sectors
Total loan and advances disbursed in various sectors of economy were compiled on
the basis of returns submitted by commercial banks. In mid-July 2011, sector-wise
classification of the total loan and advances of commercial banks are given as
below:
S.No. Sector
% of total loan (mid-July)
2011 2010 2009
1 Agriculture Forest 2.68 3.05 3.40
2 Fishery 0.02 0.00 0.00
3 Mining 0.42 0.43 1.79
4 Manufacturing 21.20 20.14 20.93
5 Construction 9.29 10.56 10.71
6 Electricity, Gas and Water 1.32 1.59 1.65
7 Metal Products, Machineries, Electronics and Installation 1.68
1.32 1.88
8 Transport, Warehousing and Communication 5.11 5.28 4.55
9 Wholesalers and Retailers 18.51 18.67 17.48
10 Finance, Insurance and Real Estate 14.01 11.51 9.82
11 Hotel and Restaurant 2.13 2.84 4,72
12 Other Services 4.52 3.96 1.76
13 Consumable Loans 5.91 5.76 3.53
14 Local Government 0.23 0.22 0.05
15 Others 12.99 14.66 17.72
Total Loan 100.00 100.00 100.00
Banks disbursed 21.2 percent of the total loans and advances to the manufacturing
sector in mid-July 2011. Similarly, the next highest share of loans and advances
went to the wholesale and retail sector (18.51%).
5.6.2 Security used to Secure Loans and Advances
Loans and advances disbursed by the commercial banks are backed by the various
securities. Table 5.8 shows the security used to secure loans and advances. In mid-
July 2011, assets (fixed or current) were used to secure most loans and advances
Table 5.7: Loans and Advances to Different Economic Sectors

56
(84.92%). Similarly, gold and silver, classified as others, were also used to secure
the loans and advances.
Table 5.8: Security used to Secure Loans and Advances
5.6.3 Types of Loans and Advances
NRB defines and classifies loans and advances of the commercial banks on the
basis of loan products offered by commercial banks. The types of loans and
advances offered in mid-July 2011 are given in Table 5.9
Table 5.9: Types of Loans and Advances
S.No Security
% of total loan (mid-July)
2011 2010 2009
1 Gold and Silver 2.96 2.26 1.61
2 Government Bonds 0.53 0.62 0.74
3 Non Government Securities 1.07 1.43 1.37
4 Fixed Deposit 1.59 1.50 1.33
5 Property as Collateral 84.92 85.66 85.90
6 Security of Bills 1.26 0.98 1.80
7 Guarantee 1.79 1.84 1.87
8 Credit/Debit Card 0.07 0.08 0.08
9 Others 5.82 5.62 5.31
S.No Loan Products
% of total loan
2011 2010 2009
1 Term Loan 14.33 14.16 15
2 Overdraft 17.31 16.27 18.10
3 Trust Receipt Loan/Import Loan 5.52 4.85 7.58
4 Demand and Other Working Capital Loan 23.39
22.36 21.64
5 Personal Residential Home Loan 5.48 7.50 7.23
6 Real Estate Loan 13.11 13.20 11.80
7 Margin Loan 1.35 2.07 2.24
8 Hire Purchase Loan 6.54 7.11 6.23
9 Deprived Sector Loan 3.44 3.65 2.96
10 Bills Purchased 0.91 0.45 0.76
11 Other Product 8.63 8.38 6.47
Total 100.00 100.00 100.00
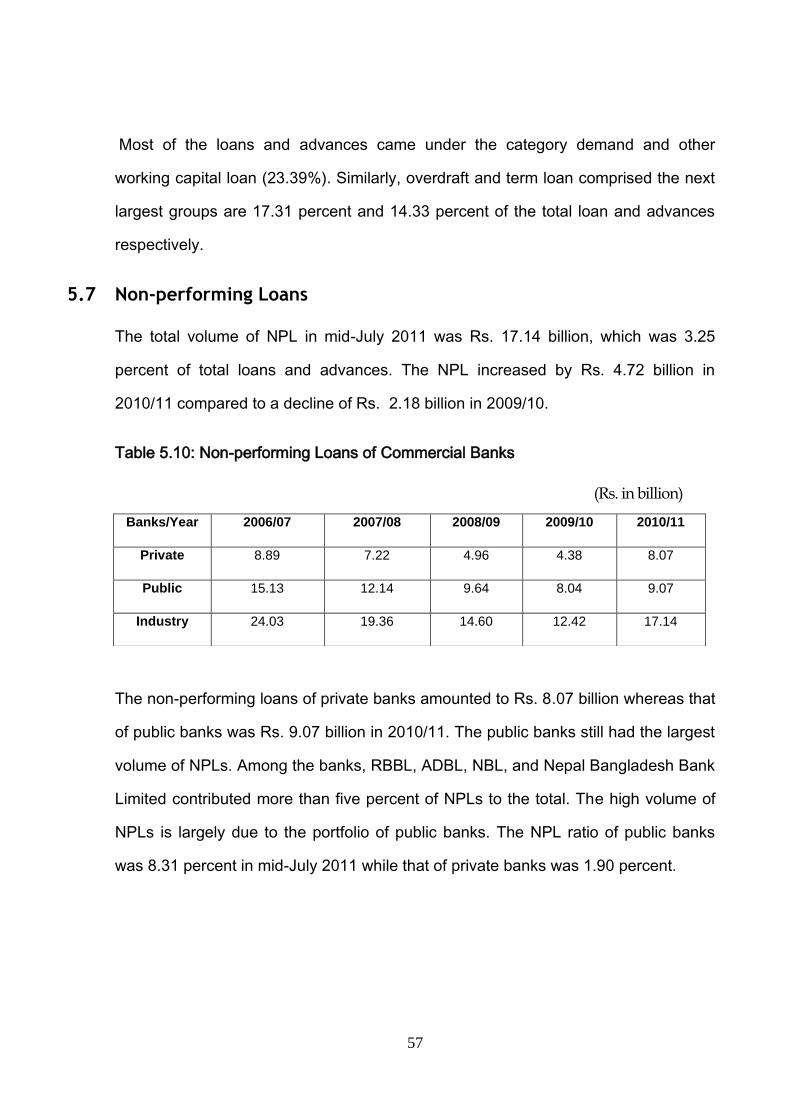
57
Most of the loans and advances came under the category demand and other
working capital loan (23.39%). Similarly, overdraft and term loan comprised the next
largest groups are 17.31 percent and 14.33 percent of the total loan and advances
respectively.
5.7 Non-performing Loans
The total volume of NPL in mid-July 2011 was Rs. 17.14 billion, which was 3.25
percent of total loans and advances. The NPL increased by Rs. 4.72 billion in
2010/11 compared to a decline of Rs. 2.18 billion in 2009/10.
Table 5.10: Non-performing Loans of Commercial Banks
(Rs. in billion)
The non-performing loans of private banks amounted to Rs. 8.07 billion whereas that
of public banks was Rs. 9.07 billion in 2010/11. The public banks still had the largest
volume of NPLs. Among the banks, RBBL, ADBL, NBL, and Nepal Bangladesh Bank
Limited contributed more than five percent of NPLs to the total. The high volume of
NPLs is largely due to the portfolio of public banks. The NPL ratio of public banks
was 8.31 percent in mid-July 2011 while that of private banks was 1.90 percent.
Banks/Year 2006/07 2007/08 2008/09 2009/10 2010/11
Private 8.89 7.22 4.96 4.38 8.07
Public 15.13 12.14 9.64 8.04 9.07
Industry 24.03 19.36 14.60 12.42 17.14

58
Table 5.11: NPL Ratio of Public and Private Banks (Gross Loan Based)
(Rs. in billion)
Chart 5.4: NPL Ratio of Public, Private & Industry (Gross Loan Based)
The NRB directives require banks to create loan loss provisions on the gross value
of all outstanding loans. Therefore, the public banks with large volumes of NPL
maintained higher provisions, while that of private banks was lower.
5.8 Non-Banking Assets
Assets taken over by banks in the course of loan recovery from defaulting borrowers
are classified as non-banking assets (NBA). The total amount of NBAs decreased by
17.07 percent to Rs. 526 million, in 2010/11. The NBAs at two public sector banks,
Banks/Year 2007/08 2008/09 2009/10 2010/11
Gross Loan NPL %
Gross Loan NPL %
Gross Loan NPL %
Gross Loan NPL %
Private 233.69 3.09 312.53 1.59 363.56 1.21 425.50 1.90
Public 79.94 15.19 89.32 10.79 100.27 8.02 109.10 8.31
Industry 313.62 6.17 401.85 3.63 463.83 2.68 534.60 3.21

59
RBBL and NBL, contributed most to the increase. The level and structure of NBAs
during the last five years is presented in Table 5.12
Table 5.12: Composition of NBAs of Commercial Banks
Rs. In million
Year 2006/07 2007/08 2008/09 2009/10 2010/11
Private Bank 285 148 280 0 0
Public Bank 110 51 23 634 526
Industry 395 200 303 634 526
Chart 5.5: Composition of NBAs of the Commercial Banks
5.9 Investment
The investment of Nepalese banks in productive sectors was limited. They have
been predominantly investing in government securities like treasury bills and
government bonds. This investment in government securities provides liquidity
benefits to banks. The other areas of investment include inter-bank placement and
investment in shares and debentures.

60
The total investment of commercial banks increased by 9.35 percent to Rs.149
billion in 2010/11 compared to a growth of 4.13 percent to Rs. 136 billion in 2009/10.
The composition of investment of commercial banks shows a high concentration
(68%) in government bonds while shares and debentures and ‘others’ account for 3
percent and 29 percent, respectively. Banks are not allowed to invest in shares and
debentures of Banks and the Financial Institutions licensed by NRB. This has
continuously diverted investment in ‘other’ areas. The investment portfolio of
commercial banks in mid-July 2011 is presented in table 5.13 and chart 5.6.
Table 5.13: Investment Portfolio of Banking Industry (mid-July, 2011)
Rs. In billion
Investment Instruments Total Amount
Government Bond Shares and Debentures Others
101.94 5.18 44.05 151.17
Chart 5.6: Investment Portfolio of Banking Industry (mid-July, 2011)
The analysis of the composition of investment of public banks indicated high
concentration in government bonds that was 79.28 percent of total investment.
Similarly, the shares of investment in shares and debentures and in other

61
investments were respectively 6.11 percent and 14.61 percent in public sector
banks. The proportion of investment in government bond by private banks was 64.49
percent of the total, shares and debentures comprised 2.76 percent while other
investments stood at 32.75.
5.10 Earnings
The total income of commercial banks increased by 28.33 percent to Rs. 82.76
billion in 2010/11 compared to a growth of 31.98 percent to Rs. 64.49 billion in
2009/10. Interest income, the significant proportion of income, contributed 89.87
percent to the total income. The remainder was income from commission, other
incomes, exchange income and non-operating income.
All banks earned profits during the review year. ADBL booked the highest profit of
Rs.2.38 billion – the return from loan loss provision contributed 91.51 percent of net
profit.
Until 2002/03, the Nepalese banking industry was unprofitable because of the poor
performance of two public banks. However, their performance improved after re-
structuring, and that has boosted the profitability of the entire industry. The
composition of total income of the banking industry in mid-July 2011 is given in table
5.14
Table 5.14: Composition of Total Income
Rs in million
Particulars 2006/07 2007/08 2008/09 2009/10 2010/11
Interest Income 23648 28017 39602 56629 74378
Non operating Income 129 215 821 322 492
Exchange Income 1162 1624 2125 1985 1838
Commission Income 1887 2333 2964 3319 3486
Other 1342 1629 3350 2234 2565
Total Income 28167 33817 48862 64488 82759
62
The main factor contributing to profitability is the net interest income, computed as
the surplus of interest income over interest expenses. In 2010/11 all banks had
positive net interest incomes. All banks except ADBL have had positive operating
profits, which is an effective measure of efficiency of bank operations. ADBL had a
high operating loss due to high staff expenses (Rs. 2.21 billion) and loan loss
provision (Rs. 2.50 billion).
The weighted average interest spread of public sector banks declined to 7.88
percent 2010/11 from 8.85 percent in 2009/10. The weighted average interest
spread of private sector banks increased to 4.38 percent from 4.28 percent in the
same period. In both cases, the banks have to remain competitive to maintain or
enhance profitability. The weighted average interest spread was in the range of a
minimum of 2.27 percent to a maximum of 7.75 percent in 2010/11.
Chart 5.7: Interest Spread of Banks
0.00%
2.00%
4.00%
6.00%
8.00%
10.00%
12.00%
14.00%
2006/07 2007/08 2008/09 2009/10 2010/11
Pe
rce
nt
Fiscal Year
Interest Spread of Commercial Banks
Public
Private
The net profit of commercial banks increased by 2.23 percent to Rs. 15.04 billion in
2010/11 compared to a growth of 7.24 percent in 2009/10. Out of the total net profit,
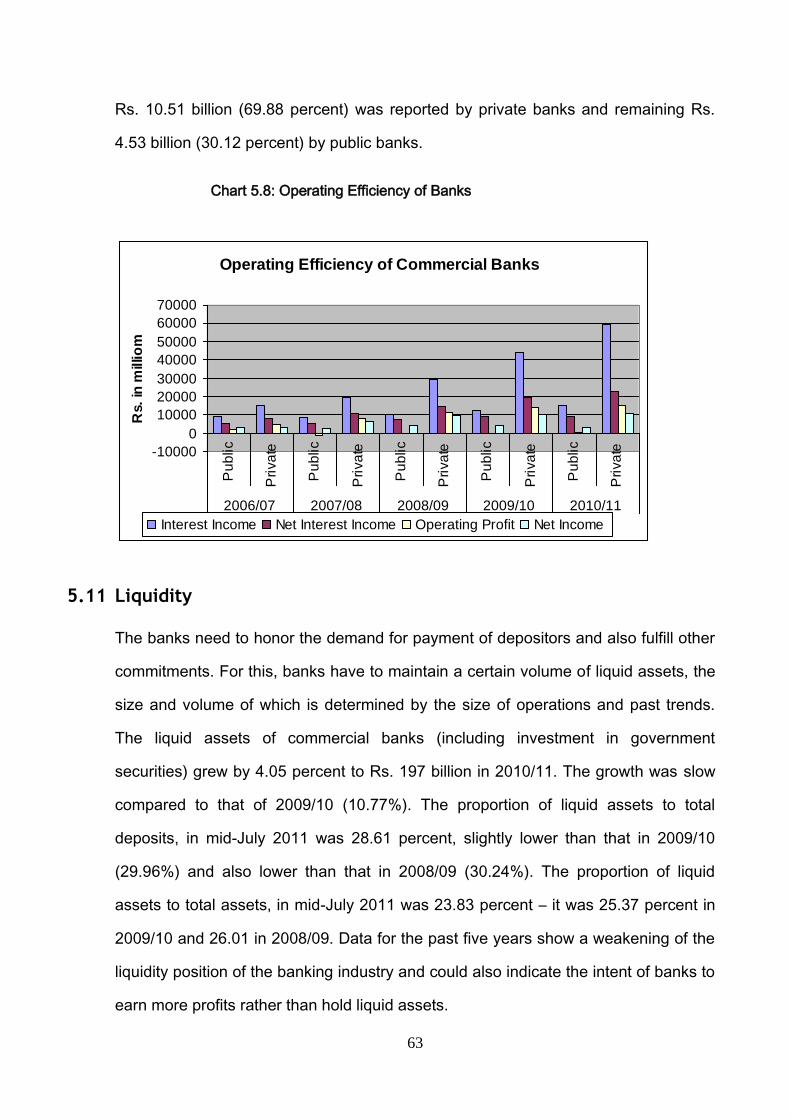
63
Rs. 10.51 billion (69.88 percent) was reported by private banks and remaining Rs.
4.53 billion (30.12 percent) by public banks.
Chart 5.8: Operating Efficiency of Banks
Operating Efficiency of Commercial Banks
-10000
0
10000
20000
30000
40000
50000
60000
70000
Pu
blic
Pri
va
te
Pu
blic
Pri
va
te
Pu
blic
Pri
va
te
Pu
blic
Pri
va
te
Pu
blic
Pri
va
te
2006/07 2007/08 2008/09 2009/10 2010/11Fiscal Year
Rs.
in m
illio
m
Interest Income Net Interest Income Operating Profit Net Income
5.11 Liquidity
The banks need to honor the demand for payment of depositors and also fulfill other
commitments. For this, banks have to maintain a certain volume of liquid assets, the
size and volume of which is determined by the size of operations and past trends.
The liquid assets of commercial banks (including investment in government
securities) grew by 4.05 percent to Rs. 197 billion in 2010/11. The growth was slow
compared to that of 2009/10 (10.77%). The proportion of liquid assets to total
deposits, in mid-July 2011 was 28.61 percent, slightly lower than that in 2009/10
(29.96%) and also lower than that in 2008/09 (30.24%). The proportion of liquid
assets to total assets, in mid-July 2011 was 23.83 percent – it was 25.37 percent in
2009/10 and 26.01 in 2008/09. Data for the past five years show a weakening of the
liquidity position of the banking industry and could also indicate the intent of banks to
earn more profits rather than hold liquid assets.

64
Table 5.15: Liquid Assets and Deposit of the Banks (Rs. in billion)
Components/Year
2006/07
2007/08
2008/09
2009/10
2010/11
Liquid Assets
109
129
171
189
197
Deposit
341
433
564
631
687
Liquid Assets/Deposit (%)
32.05
29.79
30.24
29.96
28.61
Table 5.16: Liquid Assets and Total Assets of the Banks (Rs. in billion)
Components/ Year
2006/07
2007/08
2008/09
2009/10
2010/11
Liquid Assets
109.35
128.92
170.62
189.07
196.66
Total Assets
374.79
482.89
655.85
745.39
825.09
Liquid assets/ total Assets (Percent)
29.18
26.70
26.01
25.37
23.83
Chart 5.9: Liquidity Position of Commercial Banks
Liquid Assets and Total Assets
0.00
100.00
200.00
300.00
400.00
500.00
600.00
700.00
800.00
900.00
2006/072007/082008/092009/102010/11
Fiscal Year
Rs. in
billio
n
0.00%
5.00%
10.00%
15.00%
20.00%
25.00%
30.00%
35.00%
Perc
en
t
Liquid Assets
Total Assets
Liquid assets/total Assets
Chart 5.9 shows the deteriorating liquidity of the banking industry. Deposits
increased by 11.82 percent in 2009/10 but it grew by just 8.98 percent in 2010/11.
Similarly, the downward liquid assets to deposit curve shows the declining status of
liquidity position in banking industry.

65
CHAPTER SIX
CChhaalllleennggeess iinn BBaannkkiinngg SSuuppeerrvviissiioonn iinn NNeeppaall
6.1 Background
Nepal Rastra Bank, as a promoter, regulator and supervisor of the Nepalese banking
industry, has been playing an important role in the development and promotion of
banking. It has kept updated with recent developments in the global financial system
and has issued and implemented various policies to keep up with the rest of the
world. The Nepalese banking system has grown rapidly in the past two decades in
terms of institutions, the use of technology and the gradual integration with the global
market. Developing a secure, healthy and efficient payment mechanism, ensuring
stability in the system, promoting healthy competition, carrying out effective
supervision and raising public confidence in the banking system are the major
challenges of the NRB. An immediate challenge is overseeing the successful
transition from a situation with a ‘large number of small banks” to one with “small
number of large banks”.
The Nepalese banking sector expanded after the liberalization process began in the
mid-1980s. Rapid growth in numbers and the types of transactions are adding to the
supervisory challenges. The number of commercial banks in Nepal reached 31 in
mid-July 2011 from 5 in 1990. Similarly the total assets of commercial banks
increased to Rs 868.61 billion in mid-July 2011 from Rs 26.68 billion in mid-July
1990. Most of the major changes in banking practices, regulation and supervision
have taken place in the past decade.
The rapid increase in number of institutions and transaction volume has brought
about competitive pressures in banking sector. The banks and financial institutions
tend to limit operations in urban and semi-urban areas rather than address the very

66
low access of people to financial services in remote rural areas. The uneven
geographical distribution of banks and urban concentration is one factor that has
increased competition. Banking is also becoming more sophisticated with
introduction of modern technology.
All of the changes taking place in the industry also add to the challenges of
regulation. Domestically, Nepal faces the challenge of addressing issues related to
the rapid growth of the banking sector. In this age of interconnectedness, there is
therefore a need to be cautious to prevent the transmission of vulnerabilities that
were observed during the recent global financial crisis.
The overall risk exposure of commercial banks is increasing by the day. Some banks
had faced recurring liquidity stress but the situation has improved. Asset quality of
some banks has been degrading due to their exposure in real estate and
shares/margin type lending. This section outlines some of the trends observed in the
Nepalese banking industry and the challenges posed to the NRB as the regulator
and supervisor.
6.2 Enforcing Capital Adequacy to Ensure a Level Playing Field
Two government owned banks – NBL and RBBL – face huge accumulated loss.
They are facing significant loss of capital, weak asset quality, low profitability, over-
staffing and low efficiency in overall management. Since 2002, reforms have been
underway to improve their condition and some improvements have been observed.
However, the capital of these banks remains far below the minimum requirement set
by NRB. Improving the capital position of the public banks remains a major challenge
for the central bank – even after the enforcement of the Prompt Corrective Actions
Bylaws, 2007. All banks other than two state-owned banks have maintained capital
at a level above the minimum regulatory requirement. However, state-owned banks
have not complied with the minimum capital adequacy norms making it difficult for
the NRB to create a level playing field for all commercial banks.

67
6.3 Enhancing Good Corporate Governance
Banks have a large number of stakeholders: shareholders, depositors, creditors,
board members, employees and the community or the general public. Therefore
fairness, accountability and transparency are expected from banking businesses.
Balancing the expectations of all stakeholders is a challenging job for the
management at the banks. The commercial banks also need to put in place a
comprehensive risk management framework to identify, measure, monitor and
mitigate risks. The board of directors and senior management is expected to keep a
close watch and provide guidelines for risk management. The boards need a range
of skills and understanding of ways to deal with banking issues and also have the
capacity to oversee the performance of management. Boards need to have
appropriate level of commitment to fulfill their responsibilities. To ensure sound
practice of corporate governance, both the board of directors and senior managers
need to have adequate knowledge and experience in the banking sector.
NRB issues prudential regulations on corporate governance requiring banks to
maintain minimum standards of operation. In addition to compliance with regulations,
they are expected to demonstrate robust corporate governance based on NRB
guidelines and international best practices. Over half of all directors at banks are
involved in businesses with little or no banking knowledge and experience. The
remainder has banking background or experience in government service. The
dominance of directors with business interests often results in conflict of interest
particularly because businesses are the main users of funds and therefore there is a
need for sound corporate governance.
6.4 Strengthening Supervisory Capacity
The rapid growth in the number of banks, their nature, size and technological
advancements have led to introduction of new financial services. Supervisory
capacity needs to be strengthened to match the requirements of the fast-changing

68
business environment. There is need to increase numbers and enhance capacity of
supervisory personnel, and to equip them with necessary resources and tools for
effective regulation and supervision.
Supervisory capacity is key to strengthening safety and soundness of the banking
system that are vital for enhancing the public confidence in the banking system. The
BSD can detect problems before they mature with well-trained and resourced
supervisors. The supervisors need to have knowledge and skills (including technical
skills) on banking in general and the necessary resources to carry out their functions.
A key skill required by the supervisors is system audits of banks, as most
transactions are now recorded electronically.
NRB has been offering opportunities to the supervisors for enhancing skills through
trainings and seminars both in country and abroad. Capacity building is a continuous
process and therefore needs to be adequately resourced for enabling supervisors to
remain fully capable of responding to the fast changing business environment.
6.5 Ensuring Effective Coordination between Supervisors and Regulators
Besides developing supervisory capacity, ensuring effective coordination between
banking supervisors and other regulators of the financial sector is another challenge.
The Nepalese banking system has grown and overall financial markets have become
closely integrated and therefore problems at individual banks are likely to have
systemic effects. Therefore, it is important to have effective coordination between
supervisors and regulators such as the Ministry of Finance (Government), Securities
Board of Nepal (SEBON) and the Insurance Board (Beema Samiti).
6.6 Implementation of Basel Core Principles and adoption of
International Best Practices
Banking has today become a global network of complex financial relationships. The
Nepalese banking system is also integrating into global financial system and this

69
makes it necessary for banks to adopt established global principles and best
practices. Nepal is in the process of implementing the Basel Core Principles, which
have been adopted and adjusted in national legislation, prudential regulations,
directives and guidelines. Some principles still remain to be adopted. Nepal has
implemented the new capital adequacy framework based on the Simplified
Standardized Approach of Basel II. Offsite supervision has developed and
implemented Early Warning Signals (EWS) as a tool to monitor performance and
compliance of banks. Nepal has also defined Prompt Corrective Actions (PCA) that
is enforced through PCA bylaws. Similarly, Risk Management Guidelines have been
designed and implemented -- they incorporate broader guidelines and set minimum
standard for risk management based on the BCBS principles. Nepal still faces
challenges in moving toward the Risk Based Supervision (RBS) approach,
developing macro prudential supervision framework, and in terms of introducing
forward-looking approaches to prevent systemic crises. Bank regulators and
supervisors face challenges in acquiring new knowledge and skills and also the
resources needed for adapting continuous changes in supervisory approaches.
6.7 Ensuring Effective Implementation of Best Practices of Anti-Money
Laundering
With rapid growth and increased integration of Nepal’s financial sector with the
global industry, there are also possibilities of misuse of banking resources for
unlawful purposes. There are global concerns about the misuse of banking services
for terrorist financing, drug trafficking and money laundering. NRB has taken some
measures to prevent the use of banking institutions for illegal activities but the legal
provisions and regulatory framework remain to be upgraded. Some regulatory
provisions such as Know Your Customer, Customer Due Diligence, Threshold
Transaction Report and Suspicious Transaction Report are already being

70
implemented. Nepal still faces challenges in implementing international best
practices in AML regimes but is fully committed towards the implementation.
6.8 Promoting Self-regulation in Banking
Banks and financial institutions are required to take risks for getting the anticipated
rewards. The risk taking behavior should be supported by adequate risk
management practices. Banks have large numbers of stakeholders and their
interests need to be protected and that could include avoiding excessive risk-taking.
Risk management is a main responsibility of the board of directors. Banks need to
have adequate board and senior management oversight, clear policies and
procedures, limits, and adequate internal control and risk management practices.
Banks with sound practices in risk management can promote self-regulation. Banks
and financial institutions in Nepal still depend on NRB for implementing of
international best practices. The NRB believes that banks should initiate processes
to adopt the international best practices in corporate governance, risk management,
and adopting self-regulatory controls that go beyond the minimum standard set by
the central bank.
6.9 Contingency Planning and Supervisory Strategies
The Nepalese banking sector is growing rapidly and its integration with the global
financial system has also exposed it to external risks that could destabilize the
financial architecture and even trigger a systemic crisis. It is necessary to strengthen
supervisory capacity with the adequate supervisory approaches, tools and
techniques for effectively managing the risks. It is necessary to have a crisis
management framework (contingency plan) for dealing with ‘’problem banks’
systematically. Bank supervisors also need to be equipped with strategies and
frameworks for managing crisis situations with clear implementation plans for
different management options.

71
6.10 Institutional Arrangement and Capacity Building
Bank supervision can become stronger when there is support and coordination
among supporting institutions in the financial system. Strengthening Credit
Information Centre and Debt Recovery Tribunal (DRT) are two such institutions.
Similarly, the credit rating agency (CRA) and assets management company (AMC)
can also help in validating the findings of supervision and enhance market
monitoring.
6.11 Strengthening Management Information System (MIS)
The supervisory strength depends on the timely collection, analysis and
interpretation of financial data. A strong management information system is required
for tracking and identifying problems on time to develop early warning signs and take
prompt actions. Supervisors need to develop a mechanism to monitor data related to
liquidity and capital of financial institutions regularly and that is facilitated by strong
MIS and monitoring systems. Acquiring timely and reliable data from bank remains a
challenge.
6.12 Supervision of Systemically Important Financial Institutions
Some Nepalese banks are growing aggressively in terms of their transaction volume
and asset portfolios. Some banks have grown very fast and play an important role in
the financial system. Such banks have large transactions with wide networks and
financial interconnectedness. The supervisory approach is the same for all
commercial banks and it is necessary to become selective and impose prudential
requirements on banks commensurate with their importance in the system. In this
respect, there is a need for special arrangements to reduce the inherent risks
associated with systemically important financial institutions. But it has been
challenging to introduce regulations, develop infrastructure and supervise and

72
monitor the Systemically Important Financial Institution (SIFI) that are considered to
be “too big to fail”.
6.13 Controlling Ever-greening of Loans
The growing number of banks and financial institutions has resulted in pressures for
competing in unhealthy ways. Because other sector of the economy have not been
performing well the number of good borrowers is limited while many banks have
resorted to unhealthy competition. The overall macro-economic indicators are not
very conducive to support the rapid growth of the banking sector. But statements
suggest that NPAs are also declining, indicating that some banks could be ‘ever-
greening’ loans to bring NPAs at minimum levels. They have used high volumes of
revolving loans, overdrafts and working capital loans to ever-green loans and
understate the level of NPAs. It is a challenge to control loan ever greening, and to
address the issue of high NPAs.
6.14 Developing and Retaining Human Resources
The rapid growth of banks has increased demands for competent human resources.
However, there is no ‘pipeline’ of skilled human resources and this has led to high
mobility of staff from the banks and issues of retaining staffs. There is need to
develop human resources capable of meeting the growing demand in the financial
sector while there are no institutional mechanisms for providing the capacity-building
service.
6.15 Macroeconomic Environment
Nepal’s economy has experiences low growth, high inflation, high consumption and
low savings. The investment environment has not been conducive for various
reasons including the energy crisis. Low business confidence and poor investment
environment have not assisted towards improving the situation. Many sectors of the

73
economy have reported slow growth indicating that there is low investment in the
core productive sectors such as agriculture and industry. There is thus the challenge
of channelizing resources towards the productive sectors to restore overall economic
health and also the sustainability of the banking sector.
6.16 Changing Global Environment
Banking practices, financial relationships, customer tastes and preferences, and
product structures are changing rapidly. There is greater economic connectivity with
the rest of the world, made possible by technology and the movement of people
across national borders. While the growing financial interconnectedness has
connected Nepal with the rest of the world, it has also exposed the banks and
financial institutions to more external risks. The supervisory approaches need to be
consolidated and expand across borders for effectiveness and this would need
investments in enhancing the capacity of staff for enforcing prudential norms and for
effective supervision and monitoring. High investment in human resources remains a
challenge for the NRB while pressures emanating from the fast-changing global
financial systems and practices remain relentless.
___________________________________________________________________________

74
AAppppeennddiixx 11:: Training aanndd ccaappaacciittyy bbuuiillddiinngg eevveennttss ffoorr BBSSDD ssttaaffff
S. No. Program Organizer Participa
nts Duration Country
1 The Impact of Global
Financial Crisis
SEACEN
1 9 days Sri Lanka
2 FSI-EMEAP Regional Seminar
on Financial Stability on Macro
Prudential Supervision
FSI/BIS 1 9 days New
Zealand
3 SEACEN Course on Crisis
Preparedness in Interconnected
Markets
The SEACEN
Centre
1 9 days Malaysia
4 Role of Central Bank in
Federal System
RBI 1 6 days India
5 Korea-FSV Financial Reform
Conference: An Emerging
market Perspective
Financial
Stability
Board
1 6 days Seoul,
Korea
6 5th SEACEN-OCC Course on
Problem Bank Supervision
The SEACEN
Centre 2 10 days Malaysia
7 3rd SEACEN-Deutsche
Bundesbank Advanced Course
on Banking Supervision and
Financial Stability: Financial
Market Analysis and
Surveillance
The SEACEN
Centre 1 9 days Taiwan
8 CeMCoA/BOJ Workshop on
Financial Market Analysis and
Surveillance
ADB The
SEACEN
Centre
1 10 days Malaysia
9 21st FSI-SEACEN Regional
Seminar on Basel III and Capital
Management by Banks
The SEACEN
Centre
2 8 days Malaysia
10 FSI SEANZA forum of
Banking Supervisor's Regional
Seminar
SEANZA
1 7 days Malaysia
11 Leadership Seminar on Cross
Border Supervision
SEACEN 1 10 days Singapore
12 Financial Market Analysis &
Surveillance
The SEACEN
Centre 1 9 days Korea
13 Anti-money Laundering and
Countering Terrorism
Govt. of
Taiwan 1 9 days Taiwan
14 FSI-EMEAP Regional
Seminar on Stress Testing
FSI 1 6 days Thailand
15 Observation/Study Visit
Program to State Bank of
Pakistan
State Bank of
Pakistan
1 8 days Pakistan
Total 17

75
AAppppeennddiixx 22:: OOrrggaanniizzaattiioonn CChhaarrtt ooff BBaannkk SSuuppeerrvviissiioonn DDeeppaarrttmmeenntt
Deputy Director-2 Deputy
Director-1
Offsite
Supervision
Deputy
Director-1
Asst. Director-3
Deputy Assistant -1
Onsite Inspection/
Report Enforcing
Head Assistant -1
Asst. Director-4
Deputy Director-3
Asst. Director-3 Asst. Director-6
Onsite Inspection/
Report Enforcing
Director Director Director
Onsite Inspection/
Report Enforcing
Internal Adm. and
Problem Bank
Resolution
Offsite
Supervision
Policy Planning
Executive Director
Deputy Director-3
Asst. Director-3
Deputy Director-3
Asst. Director-8 Asst. Director-7
Deputy Director-1

AAppppeennddiixx 33:: UUsseeffuull wweebbssiitteess ffoorr ssuuppeerrvviissoorrss
Name of Agency Web address
Australian Prudential Regulatory Authority www.apra.gov.au
Asian Development Bank www.adb.org
Association for financial professionals www.afponline.org
American Bankers Association www.aba.com
Association of German Banks www.german-banks.com
Asian Clearing Union www.asianclearingunion.org
Bank Administration Institute (BAI) www.bai.org
Banking Federation of the European Union www.fbe.be
Bank for International Settlement www.bis.org
Bank Negara Malaysia www.bnm.gov.my
Conference of State Bank Supervisors, USA www.csbsdal.org
Canada Deposit Insurance Corporation www.cdic.ca
China Banking Regulatory Commission www.cbrc.gov.cn
European Committee for Banking Standards (ECBS) www.ecbs.org
European Bank for Reconstruction and Development www.ebrd.org
Financial Services Authority UK www.fsa.gov.uk
Federal Reserve Board USA www.federalreserve.gov
Federal Reserve Bank Boston www.bos.frb.org
Federal Reserve Bank St. Louis www.stls.frb.org
Federal Reserve Bank Kansas City www.kc.frb.org
Federal Reserve Bank Philadelphia www.phil.frb.org
Federal Reserve Bank Minneapolis www.mpls.frb.fed.us
Federal Reserve Bank San Francisco www.frbsf.org
Federal Reserve Bank Richmond www.richmondfed.org
Federal Reserve Bank Atlanta www.frbatlanta.org
Federal Reserve Bank New York www.newyorkfed.org
Federal Reserve Bank Dallas www.dallasfed.org
Federal Reserve Bank Cleveland www.clevelandfed.org
Federal Deposit Insurance Corporation, USA www.fdic.gov
Federal Financial Institutions Examination Council, USA www.ffiec.gov
Financial Services Agency, Japan www.fsa.go.jp
International Accounting Standard Board www.iasb.org
International Monetary Fund (IMF) www.imf.org
Korea Financial Supervisory Commission www.fsc.go.kr
Monetary Authority of Singapore www.mas.gov.sg
Office of the superintendent of financial institutions, Canada www.osfi-bsif.gc.ca
Office of the Comptroller of the Currency, USA www.occ.treas.gov
Reserve Bank of India www.rbi.org.in
SEACEN Center, Malaysia www.seacen.org
The Risk Management Association, USA www.rmahq.org
World Bank Group www.worldbank.org
FSI Connect www.fsiconnect.org
European Banking Authority www.eba.europa.eu

AAppppeennddiixx 44:: EExxcceerrppttss ooff aauuddiitteedd ffiinnaanncciiaall ssttaatteemmeennttss ooff ccoommmmeerrcciiaall bbaannkkss 1. NNeeppaall BBaannkk LLiimmiitteedd (Rs. 000)
Capital and Liabilities FY 2006-07 FY 2007-08 FY 2008-09 FY 2009-10 FY 2010-11p
Capital 380,383 380,383 380,383 380,400 380,383
Reserves and Surplus (6,627,898) (6,388,684) (5,234,694) (5,232,200) (4,604,661)
Debenture & Bond - - - -
Borrowing 1,604,868 1,820,089 1,970,675 2,125,100 1,842,410
Deposit 39,014,204 41,829,391 45,194,232 42,129,900 46,804,206
Bills Payable 60,726 52,342 12,016 47,100
Proposed & Payable dividend 2,083 2,067 2,065 2,000
Tax Liabilities - - - 130,600
Other Liabilities 4,824,427 4,357,856 5,234,433 3,490,800 8,178,866
Total Liabilities 39,258,793 42,053,444 47,559,110 43,073,700 52,601,204
Cash Balance 1,086,067 1,181,792 1,515,655 1,573,700 10,837,966
Balance with NRB 5,224,859 4,430,641 6,619,700 7,350,200
Balance with Banks 806,367 1,004,559 1,036,435 1,044,700
Money At call 200,000 - 400,000 - 400,000
Investment 16,072,180 16,570,755 13,397,559 5,815,800 7,577,702
Loan and Advances 11,058,478 13,251,963 17,614,899 23,546,800 26,709,883
Fixed Assets
205,768 207,528 249,393 327,900 308,188
Non- Banking Assets - - - 435,300 381,065
Other Assets 4,605,074 5,406,206 6,725,469 2,979,300 6,386,400
Total Assets 39,258,793 42,053,444 47,559,110 43,073,700 52,601,204
Interest Income 1,848,612 2,094,906 2,690,058 2,865,100 3,735,206
Interest Expenses 772,644 772,657 791,710 764,400 1,457,253
Net Interest Income 1,075,968 1,322,249 1,898,348 2,100,700 2,277,953
Commission and discount 181,019 229,724 273,106 220,700 241,673
Other Operating Income 287,648 157,432 156,757 - 140,239
Exchange Income - 119,407 89,209 23,600 13,595
Total Operating Income 1,544,635 1,828,812 2,417,420 2,345,000 2,673,460
Employees Expenses 1,125,224 1,346,824 1,640,565 2,566,100 2,055,393
Other Operating Expenses 258,554 259,786 297,015 255,100 361,139
Exchange Loss 46,279 - - -
Operating Profit Before Provision 114,578 222,202 479,840 (476,200) 256,928
Provisions for possible losses 80,376 258,572 334,315 55,600 36,369
Operating Profit 34,202 (36,370) 145,525 (531,800) 220,559
Non-Operating Income/ Expenses 50,389 67,942 57,526 - 35,735
Return From Loan Loss Provision - 134,362 676,372 748,700 54,056
Profit From Ordinary activities 84,591 165,934 879,423 216,900 310,350
Extra ordinary Income /Expenses 165,057 179,996 165,144 213,900 198,578
Net Profit including all activities 249,648 345,930 1,044,567 430,800 508,928
Provision For Staff Bonus 22,695 31,448 94,960 - 46,266
Provision For Income Tax - 75,268 55,353 2,200 79,225 -This Year - - - - -Up to Last Year - - - - Net Profit / Loss 226,953 239,214 894,254 428,600 383,437
Financial Indicators
Core Capital to Risk Weighted Assets -37.97% -33.05% -13.94% -11.74% -9.66%
Capital Fund to Risk Weighted Assets -38.83% -35.46% -13.94% -11.74% -9.66%
Non-Performing Loan to Total Loan 13.49% 12.38% 4.94% 4.98% 5.28%
Weighted Average Interest Spread 4.51% 4.82% 6.45% 6.14% 7.75%
Net Interest Income (Rs. in thousand)
1,075,968 1,322,249 1,898,348 2,100,700 2,277,953
Return on Assets 0.58% 0.57% 1.88% 1.00% 0.74%
Credit to Deposit 35.26% 37.69% 43.28% 59.52% 57.07%
Liquid Assets to Total Assets 47.56% 42.94% 42.41% 32.92% `
Liquid Assets to Total Deposit 47.86% 43.17% 44.63% 33.66% 35.94%

22.. RRaassttrriiyyaa BBaanniijjyyaa BBaannkk (Rs. 000)
Capital and Liabilities FY 2006-07 FY 2007-08 FY 2008-09 FY 2009-10 FY 2010-11p
Capital 1,172,300 1,172,300 1,172,300 1,172,300 1172300
Reserves and Surplus (18,391,801) (16,632,278) (13,133,193) (9,789,377) (9,377,570)
Debenture & Bond - - - -
Borrowing 2,219,603 2,517,009 3,873,598 4,039,791 4812803
Deposit 50,464,128 64,340,951 68,160,927 68,623,160 73924079
Bills Payable 63,707 68,180 68,605 31,360
Proposed & Payable dividend 47,220 55,090 62,960 86,687
Tax Liabilities - -- - 29,186
Other Liabilities 10,564,489 1,783,670 8,509,150 19,904,757 10691581
Total Liabilities 46,139,646 53,304,922 68,714,347 84,097,864 81,223,193
Cash Balance
1,897,762 8,640,723 2,014,077 1,674,650
8,264,580
1,648,219 6907305 Balance with NRB 3,708,616 3708616 8,412,752
Balance with Banks 197,157 197157 1,344,468
Money At call 20,000 550,000 - - 83250
Investment 12,650,196 14,443,378 15,416,020 12,989,463 15333163
Loan and Advances 17,328,731 21,202,987 26,187,931 30,254,069 36866104
Fixed Assets 439,505 465,553 452,209 890,805 946815
Non- Banking Assets 110,137 51,453 23,317 199,077 145013
Other Assets 9,787,542 7,950,828 14,863,573 28,177,001 20941543
Total Assets 46,139,646 53,304,922 68,714,347 84,097,864 81223193
Interest Income 2,356,940 2,708,764 3,444,188 4,207,610 5027872
Interest Expenses 942,751 1,025,586 1,067,779 1,386,980 2424251
Net Interest Income 1,414,189 1,683,178 2,376,409 2,820,630 2603621
Commission and discount 343,561 430,618 577,560 608,261 435001
Other Operating Income 123,249 157,070 195,561 177,270 188903
Exchange Income - - 32,098 53,215 (28,028)
Total Operating Income 1,880,999 2,270,866 3,181,628 3,659,376 3199497
Employees Expenses 789,042 875,656 1,389,012 1,629,244 1432706
Other Operating Expenses 357,753 329,090 393,316 417,546 510873
Exchange Loss 12,933 30,484 - 13,067
Operating Profit Before Provision 721,271 1,035,636 1,399,300 1,599,519 1255918
Provisions for possible losses 386,922 425,542 481,042 286,546 419482
Operating Profit 334,349 610,094 918,258 1,312,973 836436
Non-Operating Income/ Expenses 31,334 13,872 60,887 97,738 96200
Return From Loan Loss Provision 1,224,604 1,134,290 1,331,959 1,201,493 760297
Profit From Ordinary activities 1,590,287 1,758,256 2,311,104 2,612,204 1692933
Extra ordinary Income /Expenses 155,976 152,018 138,356 (2,219) 207062
Net Profit including all activities 1,746,263 1,910,274 2,449,460 2,609,985 1899995
Provision For Staff Bonus 129,353 141,502 181,441 193,332 140740
Provision For Income Tax - - 344,337 405,966
-This Year - - - -
-Up to Last Year - - - -
Net Profit / Loss 1,616,910 1,768,772 1,923,682 2,010,687 1759255
Financial Indicators
Core Capital to Risk Weighted Assets -44.40% -38.17% -38.37% -24.08% -22.52%
Capital Fund to Risk Weighted Assets -43.53% -37.19% -38.37% -24.08% -22.52%
Non-Performing Loan to Total Loan 28.63% 21.43% 15.64% 9.78% 10.92%
Weighted Average Interest Spread 4.55% 4.91% 5.57% 6.19%
Net Interest Income (Rs. in thousand) 1,414,189 1,683,178 2,376,409 2,820,630 2603621
Return on Assets 3.14% 2.99% 2.84% 2.39% 2.66%
Credit to Deposit 49% 47.26% 46.37% 51.90% 49.87%
Liquid Assets to Total Assets 34.35% 36.71% 31.73% 34.74% 23.83%
Liquid Assets to Total Deposit 31.00% 30.41% 31.13% 42.57% 26.18%

33.. NNaabbiill BBaannkk LLiimmiitteedd (Rs. 000)
Capital and Liabilities FY 2006-07 FY 2007-08 FY 2008-09 FY 2009-10 FY 2010-11
Capital 491,654 689,216 965,747 2,028,773 2,029,769
Reserves and Surplus 1,565,395 1,747,983 2,164,494 1,805,452 2,571,204
Debenture & Bond - 240,000 300,000 300,000 300,000
Borrowing 882,573 1,360,000 1,681,305 74,900 1,650,599
Deposit 23,342,285 31,915,047 37,348,256 46,340,701 49,608,376
Bills Payable 83,515 238,422 463,139 425,444 415,768
Proposed & Payable dividend 509,418 437,373 361,325 434,737 608,931
Tax Liabilities - 38,777 80,232 24,904 46,529
Other Liabilities 378,553 465,941 502,900 644,814 868,443
Total Liabilities 27,253,393 37,132,759 43,867,398 52,079,725 58,099,619
Cash Balance 270,407 511,426 674,395 635,987 744,592
Balance With NRB 1,113,415 1,829,471 2,648,596 549,454 1,473,986
Bank Balance with Banks 16,003 330,244 49,521 214,656 239,971
Money At call 563,533 1,952,361 552,888 3,118,144 2,452,512
Investment 8,945,311 9,939,771 10,826,379 13,600,917 13,003,205
Loan and Advances 15,545,779 21,365,053 27,589,933 32,268,873 38,034,097
Fixed Assets 286,895 598,039 660,989 781,480 941,258
Non- Banking Assets - - - - 0
Other Assets 512,050 606,394 864,696 910,214 1,209,998
Total Assets 27,253,393 37,132,759 43,867,398 52,079,725 58,099,619
Interest Income 1,587,759 1,978,696 2,798,486 4,047,725 5,258,269
Interest Expenses 555,710 758,436 1,153,280 1,960,108 2,946,691
Net Interest Income 1,032,049 1,220,260 1,645,206 2,087,617 2,311,578
Commission and discount 150,608 156,234 179,693 215,482 290,855
Other Operating Income 87,574 97,444 144,164 169,548 183,445
Exchange Income 209,926 196,487 251,920 291,441 276,103
Total Operating Income 1,480,157 1,670,425 2,220,983 2,764,088 3,061,981
Employees Expenses 240,161 262,907 339,898 367,162 455,616
Other Operating Expenses 188,183 220,750 265,158 334,669 403,992
Exchange Loss - - - - 0
Operating Profit Before Provision 1,051,813 1,186,768 1,615,927 2,062,257 2,202,373
Provisions for possible losses 14,206 64,055 45,722 355,829 109,470
Operating Profit 1,037,607 1,122,713 1,570,205 1,706,428 2,092,903
Non-Operating Income/ Expenses 5,281 24,084 2,190 6,455 6,981
Return From Loan Loss Provision 10,926 11,101 10,618 39,791 7,101
Profit From Ordinary activities 1,053,814 1,157,898 1,583,013 1,752,674 2,106,985
Extra ordinary Income /Expenses 40,736 39,991 43,522 34,322 3,148
Net Profit including all activities 1,094,550 1,197,889 1,626,534 1,786,996 2,110,133
Provision For Staff Bonus 99,504 108,899 147,867 162,518 192,008
Provision For Income Tax 321,087 342,522 447,615 485,907 573,946 -This Year - - - - -Up to Last Year - - - - Net Profit / Loss 673,959 746,468 1,031,053 1,138,571 1,344,179
Financial Indicators
Core Capital to Risk Weighted Assets 10.40% 8.75% 8.74% 8.77% 8.83%
Capital Fund to Risk Weighted Assets 12.04% 11.10% 10.70% 10.50% 10.58%
Non-Performing Loan to Total Loan 1.12% 0.74% 0.80% 1.47% 1.77%
Weighted Average Interest Spread 4.15% 3.94% 4.16% 4.40% 4.37%
Net Interest Income (Rs. in thousand) 1,032,049 1,220,260 1,645,206 2,087,617 2,311,578
Return on Assets 2.72% 2.32% 2.55% 2.37% 2.43%
Credit to Deposit 68.13% 68.18% 73.87% 69.37% 78.29%
Liquid Assets to Total Assets 24.85% 25.07% 17.40% 23.92% 23.50%
Liquid Assets to Total Deposit 29.01% 29.17% 20.43% 26.89% 27.53%
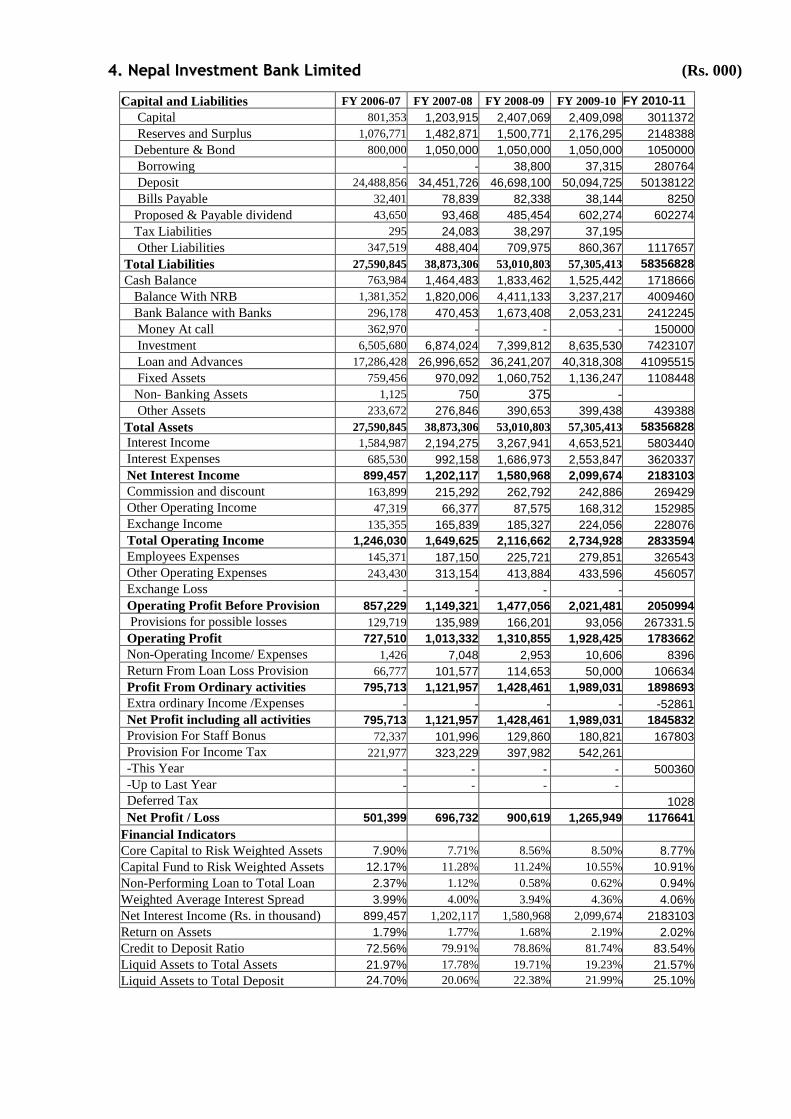
44.. NNeeppaall IInnvveessttmmeenntt BBaannkk LLiimmiitteedd (Rs. 000)
Capital and Liabilities FY 2006-07 FY 2007-08 FY 2008-09 FY 2009-10 FY 2010-11
Capital 801,353 1,203,915 2,407,069 2,409,098 3011372
Reserves and Surplus 1,076,771 1,482,871 1,500,771 2,176,295 2148388
Debenture & Bond 800,000 1,050,000 1,050,000 1,050,000 1050000
Borrowing - - 38,800 37,315 280764
Deposit 24,488,856 34,451,726 46,698,100 50,094,725 50138122
Bills Payable 32,401 78,839 82,338 38,144 8250
Proposed & Payable dividend 43,650 93,468 485,454 602,274 602274
Tax Liabilities 295 24,083 38,297 37,195
Other Liabilities 347,519 488,404 709,975 860,367 1117657
Total Liabilities 27,590,845 38,873,306 53,010,803 57,305,413 58356828
Cash Balance 763,984 1,464,483 1,833,462 1,525,442 1718666
Balance With NRB 1,381,352 1,820,006 4,411,133 3,237,217 4009460
Bank Balance with Banks 296,178 470,453 1,673,408 2,053,231 2412245
Money At call 362,970 - - - 150000
Investment 6,505,680 6,874,024 7,399,812 8,635,530 7423107
Loan and Advances 17,286,428 26,996,652 36,241,207 40,318,308 41095515
Fixed Assets 759,456 970,092 1,060,752 1,136,247 1108448
Non- Banking Assets 1,125 750 375 -
Other Assets 233,672 276,846 390,653 399,438 439388
Total Assets 27,590,845 38,873,306 53,010,803 57,305,413 58356828
Interest Income 1,584,987 2,194,275 3,267,941 4,653,521 5803440
Interest Expenses 685,530 992,158 1,686,973 2,553,847 3620337
Net Interest Income 899,457 1,202,117 1,580,968 2,099,674 2183103
Commission and discount 163,899 215,292 262,792 242,886 269429
Other Operating Income 47,319 66,377 87,575 168,312 152985
Exchange Income 135,355 165,839 185,327 224,056 228076
Total Operating Income 1,246,030 1,649,625 2,116,662 2,734,928 2833594
Employees Expenses 145,371 187,150 225,721 279,851 326543
Other Operating Expenses 243,430 313,154 413,884 433,596 456057
Exchange Loss - - - -
Operating Profit Before Provision 857,229 1,149,321 1,477,056 2,021,481 2050994
Provisions for possible losses 129,719 135,989 166,201 93,056 267331.5
Operating Profit 727,510 1,013,332 1,310,855 1,928,425 1783662
Non-Operating Income/ Expenses 1,426 7,048 2,953 10,606 8396
Return From Loan Loss Provision 66,777 101,577 114,653 50,000 106634
Profit From Ordinary activities 795,713 1,121,957 1,428,461 1,989,031 1898693
Extra ordinary Income /Expenses - - - - -52861
Net Profit including all activities 795,713 1,121,957 1,428,461 1,989,031 1845832
Provision For Staff Bonus 72,337 101,996 129,860 180,821 167803
Provision For Income Tax 221,977 323,229 397,982 542,261
-This Year - - - - 500360
-Up to Last Year - - - -
Deferred Tax
1028
Net Profit / Loss 501,399 696,732 900,619 1,265,949 1176641
Financial Indicators
Core Capital to Risk Weighted Assets 7.90% 7.71% 8.56% 8.50% 8.77%
Capital Fund to Risk Weighted Assets 12.17% 11.28% 11.24% 10.55% 10.91%
Non-Performing Loan to Total Loan 2.37% 1.12% 0.58% 0.62% 0.94%
Weighted Average Interest Spread 3.99% 4.00% 3.94% 4.36% 4.06%
Net Interest Income (Rs. in thousand) 899,457 1,202,117 1,580,968 2,099,674 2183103
Return on Assets 1.79% 1.77% 1.68% 2.19% 2.02%
Credit to Deposit Ratio 72.56% 79.91% 78.86% 81.74% 83.54%
Liquid Assets to Total Assets 21.97% 17.78% 19.71% 19.23% 21.57%
Liquid Assets to Total Deposit 24.70% 20.06% 22.38% 21.99% 25.10%

55.. SSttaannddaarrdd CChhaarrtteerreedd BBaannkk NNeeppaall LLiimmiitteedd (Rs. 000)
Capital and Liabilities FY 2006-07 FY 2007-08 FY 2008-09 FY 2009-10 FY 2010-11
Capital 413,255 620,784 931,966 1,608,256 1,610,168
Reserves and Surplus 1,703,098 1,871,764 2,120,503 1,761,453 2,067,609
Debenture & Bond - - - -
Borrowing 400,000 - 300,000 - 350,000
Deposit 24,647,021 29,743,999 35,871,721 35,182,721 37,999,242
Bills Payable 36,168 87,397 72,942 89,220 65,966
Proposed & Payable dividend 341,744 506,367 476,296 769,166 805,084
Tax Liabilities 5,599 2,051 4,263 -
Other Liabilities 1,049,804 503,426 809,777 802,503 912,450
Total Liabilities 28,596,689 33,335,788 40,587,468 40,213,319 43,810,519
Cash Balance 378,423 414,876 463,346 509,031 610,691
Balance With NRB 1,613,758 1,266,273 1,851,133 819,509 1,638,277
Bank Balance with Banks 28,841 369,094 822,685 600,766 726,828
Money At call 1,761,151 2,197,538 2,055,549 1,669,460 4,280,888
Investment 13,553,233 13,902,819 20,236,121 19,847,511 17,258,682
Loan and advances 10,502,637 13,718,597 13,679,757 15,956,955 18,427,270
Fixed Assets 125,591 117,272 137,293 118,540 106,071
Non- Banking Assets - - - -
Other Assets 633,055 1,349,319 1,341,585 691,547 761,812
Total Assets 28,596,689 33,335,788 40,587,468 40,213,319 43,810,519
Interest Income 1,411,982 1,591,195 1,887,221 2,042,109 2,718,699
Interest Expenses 413,055 471,730 543,787 575,740 1,003,100
Net Interest Income 998,927 1,119,465 1,343,435 1,466,369 1,715,599
Commission and discount 221,207 276,432 235,469 338,298 321,771
Other Operating Income 28,785 32,594 33,191 34,479 36,753
Exchange Income 309,086 345,653 480,031 458,564 387,134
Total Operating Income 1,558,005 1,774,144 2,092,126 2,297,710 2,461,257
Employees Expenses 199,778 225,256 253,056 312,964 365,986
Other Operating Expenses 228,451 230,571 276,327 295,305 305,215
Exchange Loss - - - -
Operating Profit Before Provision 1,129,776 1,318,317 1,562,743 1,689,441 1,790,056
Provisions for possible losses 36,809 69,885 56,635 76,974 82,739
Operating Profit 1,092,967 1,248,432 1,506,109 1,612,467 1,707,317
Non-Operating Income/ Expenses 9,492 1,682 22,098 36,268 6,445
Return From Loan Loss Provision 20,160 90,635 101,075 58,293 67,159
Profit From Ordinary activities 1,122,619 1,340,749 1,629,282 1,707,028 1,780,921
Extra ordinary Income /Expenses (4,915) (28,039) (15,356) (17,024) (22,764)
Net Profit including all activities 1,117,704 1,312,710 1,613,926 1,690,004 1,758,157
Provision For Staff Bonus 101,609 119,337 146,721 153,637 159,832
Provision For Income Tax 324,427 374,452 442,091 450,496 479,153
-This Year - - - - 485,713
-Up to Last Year - - - -
Deferred Tax
(6,560)
Net Profit / Loss 691,668 818,921 1,025,115 1,085,871 1,119,172
Financial Indicators
Core Capital to Risk Weighted Assets 13.77% 12.15% 13.05% 12.61% 12.10%
Capital Fund to Risk Weighted Assets 15.71% 0.14% 14.70% 14.60% 14.22%
Non-Performing Loan to Total Loan 1.83% 0.92% 0.66% 0.61% 0.62%
Weighted Average Interest Spread 3.95% 4.01% 3.98% 3.44% 3.28%
Net Interest Income (Rs. in thousand) 998,927 1,119,465 1,343,435 1,466,369 1,715,599
Return on Assets 2.42% 2.46% 2.53% 2.70% 2.55%
Credit to Deposit 43.78% 46.95% 38.70% 45.98% 49.11%
Liquid Assets to Total Assets 42.65% 40.25% 37.43% 30.16% 39.29%
Liquid Assets to Total Deposit 36.76% 35.91% 42.35% 34.48% 45.30%

66.. HHiimmaallaayyaann BBaannkk LLiimmiitteedd (Rs. 000)
Capital and Liabilities FY 2006-07 FY 2007-08 FY 2008-09 FY 2009-10 FY 2010-11
Capital 810,810 1,013,512 1,216,215 2,000,000 2,400,000
Reserves and Surplus 1,335,690 1,499,479 1,903,666 1,439,205 1,595,478 Debenture & Bond 360,000 860,000 500,000 500,000 500,000 Borrowing 235,968 83,178 - - 10,000 Deposit 30,048,418 31,842,789 34,681,345 37,611,202 40,920,627 Bills Payable 91,303 102,670 113,509 216,159 31,655 Proposed & Payable dividend 130,940 263,076 162,097 189,473 336,842
Tax Liabilities 11,913 19,131 10,163 - 0 Other Liabilities 494,099 491,696 733,327 761,085 941,601
Total Liabilities 33,519,141 36,175,531 39,320,322 42,717,124 46,736,203
Cash Balance 177,242 278,183 473,760 514,223 632,046 Balance With NRB 1,272,543 935,842 2,328,406 2,604,791 1,390,626 Bank Balance with Banks 307,556 234,118 246,361 747,476 941,979
Money At call 1,710,024 518,529 1,170,794 308,840 734,000 Investment 11,822,985 13,340,177 8,710,691 8,444,910 8,769,938 Loan and Advances 16,997,997 19,497,520 24,793,155 27,980,629 31,566,977 Fixed Assets 574,060 726,068 952,196 1,061,871 1,187,493 Non- Banking Assets 12,766 10,307 22,695 - 0 Other Assets 643,968 634,787 622,265 1,054,384 1,513,144
Total Assets 33,519,141 36,175,531 39,320,322 42,717,124 46,736,203
Interest Income 1,775,582 1,963,647 2,342,198 3,148,605 4,326,140 Interest Expenses 767,411 823,745 934,778 1,553,530 2,414,807
Net Interest Income 1,008,171 1,139,902 1,407,420 1,595,075 1,911,333
Commission and discount 193,224 202,888 284,302 270,258 350,365 Other Operating Income 40,329 62,104 46,343 112,346 129,517 Exchange Income 151,637 192,601 249,983 180,278 195,528
Total Operating Income 1,393,361 1,597,495 1,988,048 2,157,957 2,586,743
Employees Expenses 272,225 307,528 360,981 414,984 517,591 Other Operating Expenses 341,561 329,006 398,317 471,102 582,210 Exchange Loss - - - - 0
Operating Profit Before Provision 779,575 960,961 1,228,751 1,271,871 1,486,942
Provisions for possible losses 90,689 58,431 68,806 692,640 471,729
Operating Profit 688,886 902,530 1,159,945 579,231 1,015,213
Non-Operating Income/ Expenses 3,493 9,700 3,810 12,382 15,856 Return From Loan Loss Provision 412,654 184,107 19,485 265,542 228,146
Profit From Ordinary activities 1,105,033 1,096,337 1,183,240 857,155 1,259,215
Extra ordinary Income /Expenses (315,890) (52,614) (9,973) (25,855) 102,292
Net Profit including all activities 789,143 1,043,723 1,173,267 831,300 1,361,507
Provision For Staff Bonus 71,740 94,884 106,661 75,573 123,773 Provision For Income Tax 225,580 312,970 313,771 246,929 344,619 -This Year - - - - -Up to Last Year - - - -
Net Profit / Loss 491,823 635,869 752,835 508,798 893,115
Financial Indicators
Core Capital to Risk Weighted Assets 9.61% 9.64% 8.81% 8.68% 8.88%
Capital Fund to Risk Weighted Assets 11.13% 13.00% 11.02% 10.72% 10.68%
Non-Performing Loan to Total Loan 3.61% 2.36% 2.16% 3.52% 4.22%
Weighted Average Interest Spread 3.57% 3.66% 3.66% 4.21% 3.96%
Net Interest Income (Rs. in thousand) 1,008,171 1,139,902 1,407,420 1,595,075 1,911,333
Return on Assets 1.47% 1.76% 1.91% 1.19% 1.91%
Credit to Deposit 56.57% 61.23% 71.49% 74.39% 80.57%
Liquid Assets to Total Assets 29.60% 26.09% 21.44% 20.23% 21.62%
Liquid Assets to Total Deposit 33.02% 29.64% 24.31% 22.97% 24.70%

77.. NNeeppaall BBaannggllaaddeesshh BBaannkk LLiimmiitteedd (Rs. 000)
Capital and Liabilities FY 2006-07 FY 2007-08 FY 2008-09 FY 2009-10 FY 2010-11
Capital 719,852 744,126 1,860,315 1,860,315 2,009,396
Reserves and Surplus (3,344,015) (2,935,574) (748,073) 273,257 251,769
Debenture & Bond - - - -
Borrowing 230,000 30,000 - -
Deposit 9,461,535 10,883,652 9,997,697 10,052,182 11,511,677
Bills Payable 39,410 30,012 12,629 15,401
Proposed & Payable dividend 1,299 1,301 1,398 -
Tax Liabilities 30,332 - 6,729 -
Other Liabilities 116,135 637,509 833,857 329,886 2,159,167
Total Liabilities 7,254,548 9,391,026 11,964,552 12,531,041 15,932,009
Cash Balance 391,686 612,025 459,402 422,008 2,474,696
Balance With NRB 614,432 1,005,830 1,869,815 1,423,257
Bank Balance with Banks 157,935 304,993 242,200 213,033
Money At call 50,000 1,000 1,000 -
Investment 1,034,560 1,389,901 2,222,432 2,112,751 2,472,659
Loan and Advances 4,409,013 5,457,809 6,704,943 7,809,544 10,237,456
Fixed Assets 140,807 147,747 139,198 155,327 307,504
Non- Banking Assets 111,925 37,087 - -
Other Assets 344,190 434,634 325,562 395,121 439,694
Total Assets 7,254,548 9,391,026 11,964,552 12,531,041 15,932,009
Interest Income 982,197 828,276 1,337,112 1,167,627 1,435,080
Interest Expenses 432,219 397,997 409,776 476,787 756,269
Net Interest Income 549,978 430,279 927,336 690,840 678,811
Commission and discount 85,219 105,300 122,393 145,796 162,850
Other Operating Income 117,653 190,767 125,074 50,496 61,582
Exchange Income 40,962 90,111 80,549 49,840 59,726
Total Operating Income 793,812 816,457 1,255,353 936,972 962,969
Employees Expenses 112,547 140,837 138,424 146,641 189,433
Other Operating Expenses 114,326 121,863 123,306 128,766 139,068
Exchange Loss - - - -
Operating Profit Before Provision 566,939 553,757 993,623 661,565 634,468
Provisions for possible losses 1,502,798 379,304 283,319 148,389 422,426
Operating Profit (935,859) 174,453 710,303 513,176 212,042
Non-Operating Income/ Expenses 24,200 18,239 22,934 18,384 25,162
Return From Loan Loss Provision 34,277 1,343,374 1,905,860 1,318,048 310,884
Profit From Ordinary activities (877,382) 1,536,066 2,639,097 1,849,608 548,088
Extra ordinary Income /Expenses - (697,887) (14,990) (523,481) 106,998
Net Profit including all activities (877,382) 838,179 2,624,108 1,326,127 655,086
Provision For Staff Bonus - 76,198 238,555 120,557 59,553
Provision For Income Tax 184,198 165,494 227,446 184,190 180,023
-This Year - - - -
-Up to Last Year - - - -
Net Profit / Loss (1,061,580) 596,487 2,158,106 1,021,380 415,510
Financial Indicators
Core Capital to Risk Weighted Assets -23.55% -18.17% 4.42% 11.74% 10.53%
Capital Fund to Risk Weighted Assets -23.55% -18.17% 5.55% 12.81% 9.73%
Non-Performing Loan to Total Loan 39.76% 31.73% 19.80% 6.47% 19.18%
Weighted Average Interest Spread 4.90% 3.95% 3.92% 5.56% 4.96%
Net Interest Income (Rs. in thousand) 549,978 430,279 927,336 690,840 678,811
Return on Assets -14.63% 6.35% 18.04% 8.15% 3.85%
Credit to Deposit 96.91% 87.01% 91.33% 78.26% 88.93%
Liquid Assets to Total Assets 28.13% 33.50% 35.84% 31.42% 28.80%

88.. NNeeppaall SSBBII BBaannkk LLiimmiitteedd (Rs. 000)
Capital and Liabilities FY 2006-07 FY 2007-08 FY 2008-09 FY 2009-10 FY 2010-11
Capital 647,798 874,528 874,528 1,861,324 2,102,966
Reserves and Surplus 515,492 540,117 838,079 589,230 776,327
Debenture & Bond 200,000 200,000 200,000 200,000 200,000
Borrowing 815,365 1,627,480 727,466 - 0
Deposit 11,445,286 13,715,395 27,957,221 34,896,424 42,415,443
Bills Payable 48,856 75,115 62,947 72,368 80,685
Proposed & Payable dividend 91,024 12,229 24,905 83,080 93,465
Tax Liabilities - - - - 0
Other Liabilities 137,379 142,582 231,536 345,253 419,347
Total Liabilities 13,901,200 17,187,446 30,916,682 38,047,679 46,088,233
Cash Balance 287,530 308,102 652,027 815,680 1,007,688
Balance With NRB 556,678 403,810 444,139 1,842,802 2,330,927
Bank Balance with Banks 278,481 631,049 807,740 782,780 1,539,210
Money At call 350,000 304,013 - - 0
Investment 2,659,453 3,088,887 13,286,182 16,305,633 18,911,021
Loan and Advances 9,460,451 12,113,698 15,131,748 17,480,548 21,365,771
Fixed Assets 97,219 120,222 253,581 418,244 417,003
Non- Banking Assets 3,847 - - - 0
Other Assets 207,541 217,665 341,265 401,992 516,613
Total Assets 13,901,200 17,187,446 30,916,682 38,047,679 46,088,233
Interest Income 831,117 970,513 1,460,446 2,269,704 3,104,232
Interest Expenses 412,262 454,918 824,700 1,443,693 2,096,038
Net Interest Income 418,855 515,595 635,745 826,011 1,008,194
Commission and discount 52,591 50,918 78,837 131,692 247,165
Other Operating Income 12,601 19,557 52,790 78,796 95,172
Exchange Income 49,464 51,989 61,294 70,328 70,532
Total Operating Income 533,511 638,059 828,666 1,106,827 1,421,063
Employees Expenses 53,232 74,890 121,989 130,336 255,430
Other Operating Expenses 120,112 152,380 223,966 343,850 445,072
Exchange Loss - - - - 0
Operating Profit Before Provision 360,167 410,789 482,712 632,641 720,561
Provisions for possible losses 59,377 57,464 40,345 62,350 46,308
Operating Profit 300,790 353,325 442,366 570,291 674,253
Non-Operating Income/ Expenses (257) (271) 2,516 2,552 3,113
Return From Loan Loss Provision 78,515 29,782 198,673 56,621 179,122
Profit From Ordinary activities 379,048 382,836 643,556 629,464 856,488
Extra ordinary Income /Expenses - - (156,221) (37,266) (137,673)
Net Profit including all activities 379,048 382,836 487,335 592,198 718,815
Provision For Staff Bonus 34,459 34,803 44,303 53,836 65,346
Provision For Income Tax 89,681 100,263 126,658 146,620 188,904
-This Year - - - -
-Up to Last Year - - - -
Net Profit / Loss 254,908 247,770 316,373 391,742 464,565
Financial Indicators
Core Capital to Risk Weighted Assets 10.53% 9.97% 10.03% 10.89% 10.32%
Capital Fund to Risk Weighted Assets 13.29% 12.32% 11.92% 12.25% 11.52%
Non-Performing Loan to Total Loan 4.56% 3.83% 2.02% 1.48% 1.10%
Weighted Average Interest Spread 3.01% 3.11% 2.84% 2.76% 2.86%
Net Interest Income (Rs. in thousand) 418,855 515,595 635,745 826,011 1,008,194
Return on Assets 1.83% 1.44% 1.02% 1.03% 1.01%
Credit to Deposit 82.66% 88.32% 55.84% 51.48% 51.20%
Liquid Assets to Total Assets 27.47% 27.24% 16.85% 20.38% 22.68%
Liquid Assets to Total Deposit 33.36% 34.14% 18.64% 22.22% 24.64%

99.. EEvveerreesstt BBaannkk LLiimmiitteedd (Rs. 000) Capital and Liabilities FY 2006-07 FY 2007-08 FY 2008-09 FY 2009-10 FY 2010-11
Capital 518,000 831,400 1,030,467 1,279,607 1,391,570
Reserves and Surplus 683,515 1,089,837 1,173,157 1,479,530 1,721,976
Debenture & Bond 300,000 300,000 300,000 300,000 300,000
Borrowing - - 312,000 404,600 482,000
Deposit 18,186,254 23,976,298 33,322,946 36,932,310 41,127,914
Bills Payable 26,776 49,430 148,656 145,514 49,716
Proposed & Payable dividend 68,146 140,790 230,525 276,253 576,898
Tax Liabilities 15,278 41,143 20,522 (1,136) 26,900
Other Liabilities 1,634,605 720,444 378,575 566,082 559,238
Total Liabilities 21,432,574 27,149,342 36,916,848 41,382,760 46,236,212
Cash Balance 534,997 822,990 944,696 1,091,500 1,048,999
Balance With NRB 1,178,198 1,080,915 4,787,164 5,625,114 4,706,320
Bank Balance with Banks 678,225 764,068 432,512 1,102,200 367,544
Money At call - 346,000 - - 0
Investment 4,984,315 5,059,557 5,948,480 5,008,308 7,743,928
Loan and Advances 13,664,082 18,339,085 23,884,674 27,556,356 31,057,691
Fixed Assets 170,097 360,512 427,157 463,094 460,259
Non- Banking Assets - - - - 0
Other Assets 222,660 376,215 492,166 536,188 851,471
Total Assets 21,432,574 27,149,342 36,916,849 41,382,760 46,236,212
Interest Income 1,144,408 1,548,657 2,186,815 3,102,451 4,331,026
Interest Expenses 517,166 632,609 1,012,874 1,572,790 2,535,876
Net Interest Income 627,242 916,048 1,173,941 1,529,661 1,795,150
Commission and discount 117,718 150,264 202,094 208,123 203,468
Other Operating Income 67,967 79,134 106,404 142,311 148,062
Exchange Income 28,405 64,452 62,527 47,880 46,259
Total Operating Income 841,332 1,209,898 1,544,966 1,927,975 2,192,939
Employees Expenses 86,118 157,957 186,920 226,364 293,130
Other Operating Expenses 177,546 233,767 292,011 352,511 383,112
Exchange Loss - - - - 0
Operating Profit Before Provision 577,668 818,174 1,066,035 1,349,100 1,516,697
Provisions for possible losses 89,696 99,340 93,085 77,010 (98,299)
Operating Profit 487,972 718,834 972,950 1,272,090 1,614,996
Non-Operating Income/ Expenses 1,315 4,519 5,005 12,338 1,433
Return From Loan Loss Provision 11,687 20,201 8,044 83,553 56,337
Profit From Ordinary activities 500,974 743,554 986,000 1,367,981 1,672,766
Extra ordinary Income /Expenses (795) (18,999) (5,549) (61,192) (12,051)
Net Profit including all activities 500,179 724,555 980,451 1,306,789 1,660,715
Provision For Staff Bonus 45,471 65,869 89,132 118,799 133,101
Provision For Income Tax 158,299 207,468 252,586 356,225 596,310
-This Year - - - -
-Up to Last Year - - - -
Net Profit / Loss 296,409 451,218 638,733 831,765 931,304
Financial Indicators
Core Capital to Risk Weighted Assets 7.80% 9.04% 8.52% 8.39% 8.46%
Capital Fund to Risk Weighted Assets 11.20% 11.44% 10.55% 10.77% 10.43%
Non-Performing Loan to Total Loan 0.80% 0.68% 0.48% 0.16% 0.34%
Weighted Average Interest Spread 3.90% 4.30% 4.40% 4.78% 4.60%
Net Interest Income (Rs. in thousand) 627,242 916,048 1,173,941 1,529,661 1,795,150
Return on Assets 1.40% 0.02 1.73% 2.09% 2.10%
Credit to Deposit 77.40% 79.00% 73.43% 74.61% 76.98%
Liquid Assets to Total Assets 47.11% 28.82% 30.64% 29.42% 28.70%
Liquid Assets to Total Deposit 55.51% 32.64% 33.94% 32.96% 32.26%

1100.. BBaannkk ooff KKaatthhmmaanndduu LLiimmiitteedd (Rs. 000) Capital and Liabilities FY 2006-07 FY 2007-08 FY 2008-09 FY 2009-10 FY 2010-11
Capital 603,141 603,141 844,398 1,359,480 1,604,187
Reserves and Surplus 390,133 738,933 897,192 714,049 831,001
Debenture & Bond 200,000 200,000 200,000 200,000 200,000
Borrowing 730,000 100,000 100,000 300,000 464,900
Deposit 12,388,928 15,833,738 18,083,980 20,315,834 21,018,417
Bills Payable 25,777 51,576 51,125 35,702 19,051
Proposed & Payable dividend 135,575 32,804 77,333 177,324 227,713
Tax Liabilities - - - - 0
Other Liabilities 107,841 161,733 241,977 293,802 392,481
Total Liabilities 14,581,395 17,721,925 20,496,005 23,396,191 24,757,750
Cash Balance 219,043 536,747 565,066 455,181 542,371
Balance With NRB 883,496 606,049 1,324,108 687,582 641,694
Bank Balance with Banks 213,365 297,671 292,938 655,604 494,866
Money At call 259,278 72,680 243,352 931,988 479,920
Investment 2,992,434 3,204,068 2,783,599 3,269,205 4,286,599
Loan and Advances 9,399,328 12,462,637 14,647,297 16,664,931 17,468,194
Fixed Assets 320,846 387,274 417,041 491,295 501,995
Non- Banking Assets 3,626 453 - - 0
Other Assets 289,979 154,346 222,606 240,405 342,111
Total Assets 14,581,395 17,721,925 20,496,005 23,396,191 24,757,750
Interest Income 819,004 1,034,158 1,347,755 1,870,847 2,386,780
Interest Expenses 339,181 417,543 563,113 902,927 1,218,790
Net Interest Income 479,823 616,615 784,642 967,920 1,167,990
Commission and discount 97,431 129,415 150,919 160,065 173,508
Other Operating Income 19,003 23,168 43,222 73,925 79,726
Exchange Income 80,826 93,764 136,036 140,785 117,098
Total Operating Income 677,083 862,962 1,114,820 1,342,695 1,538,322
Employees Expenses 69,740 90,602 146,495 168,513 196,170
Other Operating Expenses 138,430 170,481 233,668 294,457 285,992
Exchange Loss - - - - 0
Operating Profit Before Provision 468,913 601,879 734,658 879,725 1,056,160
Provisions for possible losses 81,895 38,438 33,745 119,401 152,748
Operating Profit 387,018 563,441 700,912 760,324 903,412
Non-Operating Income/ Expenses (2,780) 810 (2,027) 2,918 5,464
Return From Loan Loss Provision 37,104 61,833 21,577 41,818 43,359
Profit From Ordinary activities 421,342 626,084 720,462 805,060 952,235
Extra ordinary Income /Expenses 411 (45,396) 6,934 - (675)
Net Profit including all activities 421,753 580,688 727,396 805,060 951,560
Provision For Staff Bonus 38,341 52,790 66,127 73,187 86,505
Provision For Income Tax 121,025 166,402 199,535 222,610 259,903
-This Year - - - -
-Up to Last Year - - - -
Net Profit / Loss 262,387 361,496 461,735 509,263 605,152
Financial Indicators
Core Capital to Risk Weighted Assets 9.43% 9.57% 9.81% 9.41% 10.37%
Capital Fund to Risk Weighted Assets 12.62% 11.94% 11.68% 10.85% 11.62%
Non-Performing Loan to Total Loan 2.51% 1.86% 1.27% 1.51% 1.82%
Weighted Average Interest Spread 4.04% 4.35% 4.72% 5.16% 5.45%
Net Interest Income (Rs. in thousand) 479,823 616,615 784,642 967,920 1,167,990
Return on Assets 1.80% 2.04% 2.25% 2.18% 2.44%
Credit to Deposit 78.25% 80.51% 82.65% 83.90% 85.43%
Liquid Assets to Total Assets 26.80% 20.46% 20.35% 24.30% 24.89%
Liquid Assets to Total Deposit 31.54% 22.90% 23.06% 27.98% 29.31%
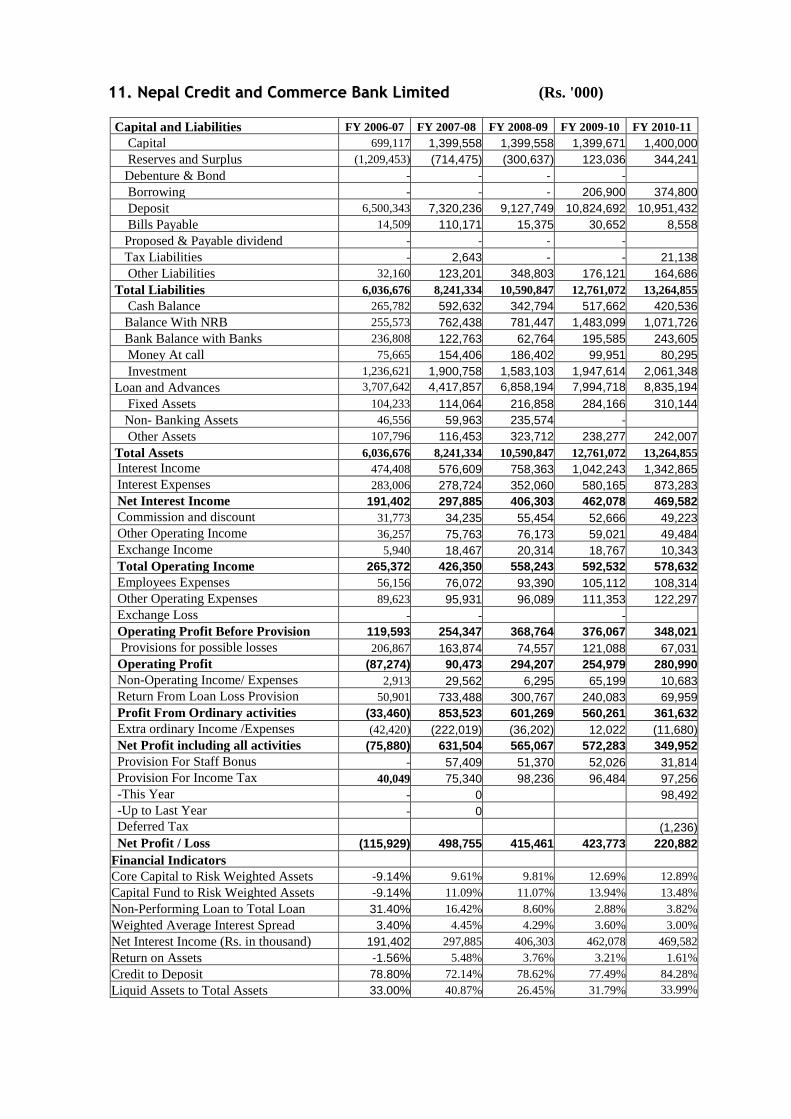
1111.. NNeeppaall CCrreeddiitt aanndd CCoommmmeerrccee BBaannkk LLiimmiitteedd (Rs. '000)
Capital and Liabilities FY 2006-07 FY 2007-08 FY 2008-09 FY 2009-10 FY 2010-11
Capital 699,117 1,399,558 1,399,558 1,399,671 1,400,000
Reserves and Surplus (1,209,453) (714,475) (300,637) 123,036 344,241
Debenture & Bond - - - -
Borrowing - - - 206,900 374,800
Deposit 6,500,343 7,320,236 9,127,749 10,824,692 10,951,432
Bills Payable 14,509 110,171 15,375 30,652 8,558
Proposed & Payable dividend - - - -
Tax Liabilities - 2,643 - - 21,138
Other Liabilities 32,160 123,201 348,803 176,121 164,686
Total Liabilities 6,036,676 8,241,334 10,590,847 12,761,072 13,264,855
Cash Balance 265,782 592,632 342,794 517,662 420,536
Balance With NRB 255,573 762,438 781,447 1,483,099 1,071,726
Bank Balance with Banks 236,808 122,763 62,764 195,585 243,605
Money At call 75,665 154,406 186,402 99,951 80,295
Investment 1,236,621 1,900,758 1,583,103 1,947,614 2,061,348
Loan and Advances 3,707,642 4,417,857 6,858,194 7,994,718 8,835,194
Fixed Assets 104,233 114,064 216,858 284,166 310,144
Non- Banking Assets 46,556 59,963 235,574 -
Other Assets 107,796 116,453 323,712 238,277 242,007
Total Assets 6,036,676 8,241,334 10,590,847 12,761,072 13,264,855
Interest Income 474,408 576,609 758,363 1,042,243 1,342,865
Interest Expenses 283,006 278,724 352,060 580,165 873,283
Net Interest Income 191,402 297,885 406,303 462,078 469,582
Commission and discount 31,773 34,235 55,454 52,666 49,223
Other Operating Income 36,257 75,763 76,173 59,021 49,484
Exchange Income 5,940 18,467 20,314 18,767 10,343
Total Operating Income 265,372 426,350 558,243 592,532 578,632
Employees Expenses 56,156 76,072 93,390 105,112 108,314
Other Operating Expenses 89,623 95,931 96,089 111,353 122,297
Exchange Loss - - -
Operating Profit Before Provision 119,593 254,347 368,764 376,067 348,021
Provisions for possible losses 206,867 163,874 74,557 121,088 67,031
Operating Profit (87,274) 90,473 294,207 254,979 280,990
Non-Operating Income/ Expenses 2,913 29,562 6,295 65,199 10,683
Return From Loan Loss Provision 50,901 733,488 300,767 240,083 69,959
Profit From Ordinary activities (33,460) 853,523 601,269 560,261 361,632
Extra ordinary Income /Expenses (42,420) (222,019) (36,202) 12,022 (11,680)
Net Profit including all activities (75,880) 631,504 565,067 572,283 349,952
Provision For Staff Bonus - 57,409 51,370 52,026 31,814
Provision For Income Tax 40,049 75,340 98,236 96,484 97,256
-This Year - 0 98,492
-Up to Last Year - 0
Deferred Tax
(1,236)
Net Profit / Loss (115,929) 498,755 415,461 423,773 220,882
Financial Indicators
Core Capital to Risk Weighted Assets -9.14% 9.61% 9.81% 12.69% 12.89%
Capital Fund to Risk Weighted Assets -9.14% 11.09% 11.07% 13.94% 13.48%
Non-Performing Loan to Total Loan 31.40% 16.42% 8.60% 2.88% 3.82%
Weighted Average Interest Spread 3.40% 4.45% 4.29% 3.60% 3.00%
Net Interest Income (Rs. in thousand) 191,402 297,885 406,303 462,078 469,582
Return on Assets -1.56% 5.48% 3.76% 3.21% 1.61%
Credit to Deposit 78.80% 72.14% 78.62% 77.49% 84.28%
Liquid Assets to Total Assets 33.00% 40.87% 26.45% 31.79% 33.99%
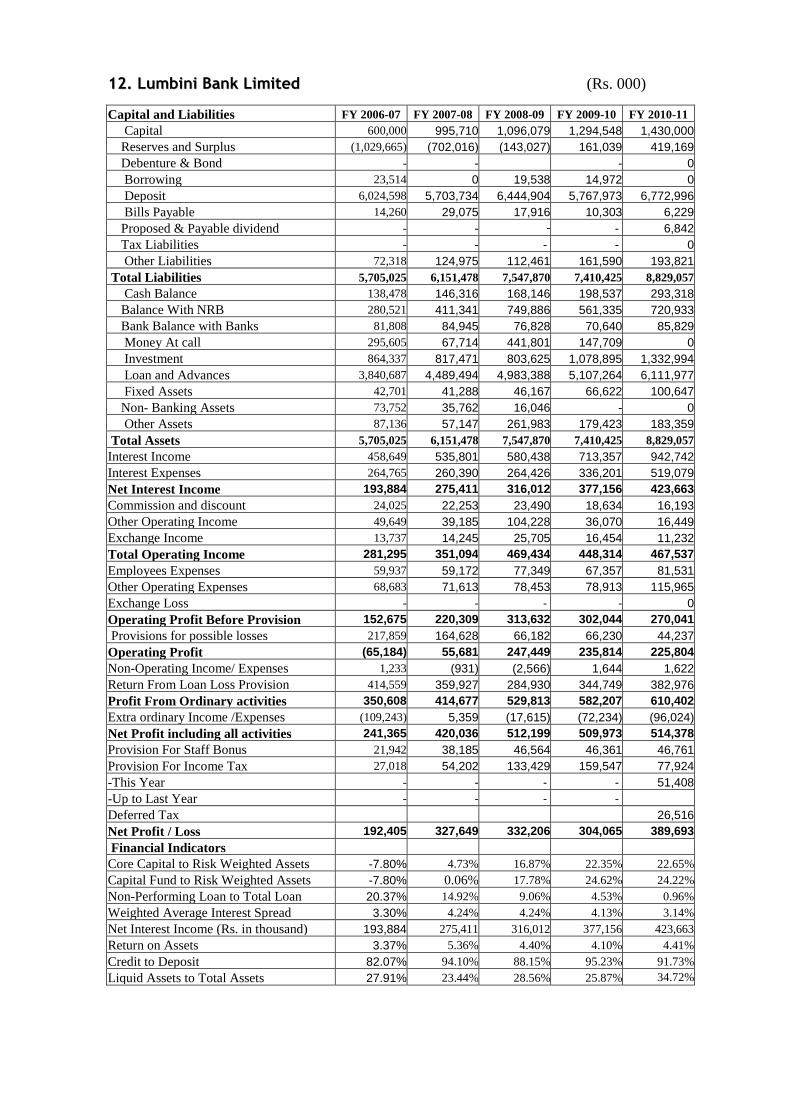
1122.. LLuummbbiinnii BBaannkk LLiimmiitteedd (Rs. 000) Capital and Liabilities FY 2006-07 FY 2007-08 FY 2008-09 FY 2009-10 FY 2010-11
Capital 600,000 995,710 1,096,079 1,294,548 1,430,000
Reserves and Surplus (1,029,665) (702,016) (143,027) 161,039 419,169
Debenture & Bond - - - 0
Borrowing 23,514 0 19,538 14,972 0
Deposit 6,024,598 5,703,734 6,444,904 5,767,973 6,772,996
Bills Payable 14,260 29,075 17,916 10,303 6,229
Proposed & Payable dividend - - -
- 6,842
Tax Liabilities - - - - 0
Other Liabilities 72,318 124,975 112,461 161,590 193,821
Total Liabilities 5,705,025 6,151,478 7,547,870 7,410,425 8,829,057
Cash Balance 138,478 146,316 168,146 198,537 293,318
Balance With NRB 280,521 411,341 749,886 561,335 720,933
Bank Balance with Banks 81,808 84,945 76,828 70,640 85,829
Money At call 295,605 67,714 441,801 147,709 0
Investment 864,337 817,471 803,625 1,078,895 1,332,994
Loan and Advances 3,840,687 4,489,494 4,983,388 5,107,264 6,111,977
Fixed Assets 42,701 41,288 46,167 66,622 100,647
Non- Banking Assets 73,752 35,762 16,046 - 0
Other Assets 87,136 57,147 261,983 179,423 183,359
Total Assets 5,705,025 6,151,478 7,547,870 7,410,425 8,829,057
Interest Income 458,649 535,801 580,438 713,357 942,742
Interest Expenses 264,765 260,390 264,426 336,201 519,079
Net Interest Income 193,884 275,411 316,012 377,156 423,663
Commission and discount 24,025 22,253 23,490 18,634 16,193
Other Operating Income 49,649 39,185 104,228 36,070 16,449
Exchange Income 13,737 14,245 25,705 16,454 11,232
Total Operating Income 281,295 351,094 469,434 448,314 467,537
Employees Expenses 59,937 59,172 77,349 67,357 81,531
Other Operating Expenses 68,683 71,613 78,453 78,913 115,965
Exchange Loss - - - - 0
Operating Profit Before Provision 152,675 220,309 313,632 302,044 270,041
Provisions for possible losses 217,859 164,628 66,182 66,230 44,237
Operating Profit (65,184) 55,681 247,449 235,814 225,804
Non-Operating Income/ Expenses 1,233 (931) (2,566) 1,644 1,622
Return From Loan Loss Provision 414,559 359,927 284,930 344,749 382,976
Profit From Ordinary activities 350,608 414,677 529,813 582,207 610,402
Extra ordinary Income /Expenses (109,243) 5,359 (17,615) (72,234) (96,024)
Net Profit including all activities 241,365 420,036 512,199 509,973 514,378
Provision For Staff Bonus 21,942 38,185 46,564 46,361 46,761
Provision For Income Tax 27,018 54,202 133,429 159,547 77,924
-This Year - - - - 51,408
-Up to Last Year - - - -
Deferred Tax
26,516
Net Profit / Loss 192,405 327,649 332,206 304,065 389,693
Financial Indicators
Core Capital to Risk Weighted Assets -7.80% 4.73% 16.87% 22.35% 22.65%
Capital Fund to Risk Weighted Assets -7.80% 0.06% 17.78% 24.62% 24.22%
Non-Performing Loan to Total Loan 20.37% 14.92% 9.06% 4.53% 0.96%
Weighted Average Interest Spread 3.30% 4.24% 4.24% 4.13% 3.14%
Net Interest Income (Rs. in thousand) 193,884 275,411 316,012 377,156 423,663
Return on Assets 3.37% 5.36% 4.40% 4.10% 4.41%
Credit to Deposit 82.07% 94.10% 88.15% 95.23% 91.73%
Liquid Assets to Total Assets 27.91% 23.44% 28.56% 25.87% 34.72%
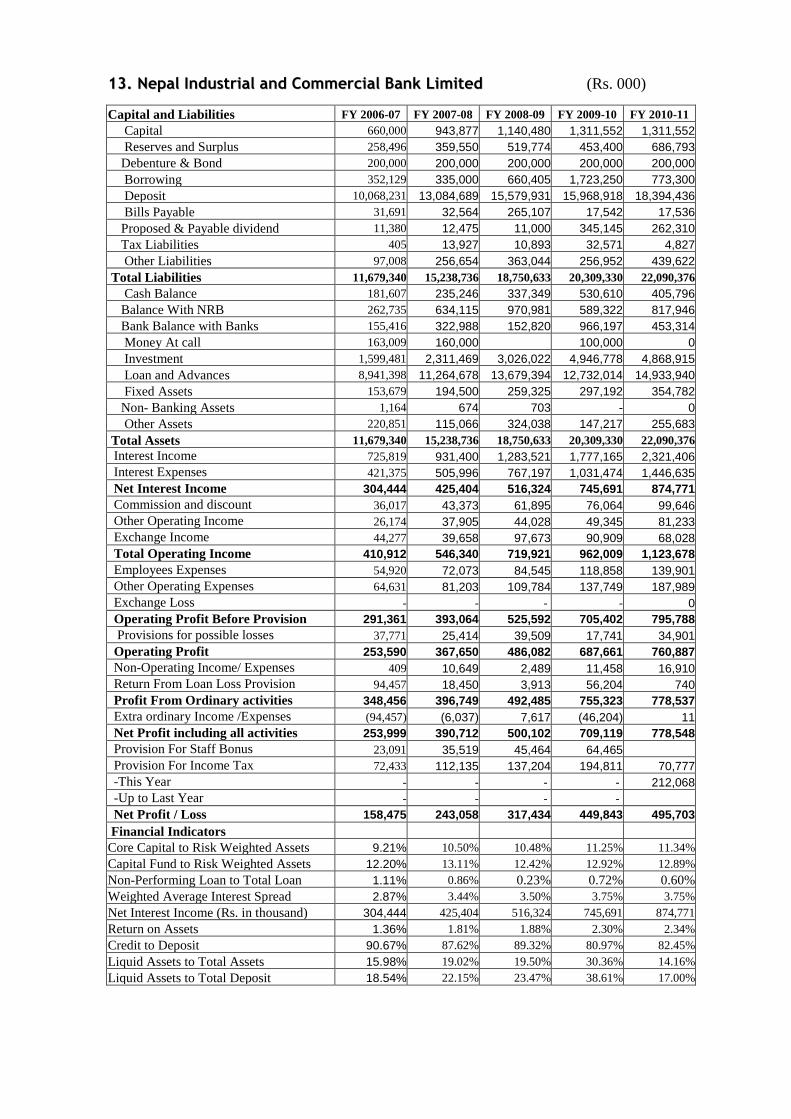
1133.. NNeeppaall IInndduussttrriiaall aanndd CCoommmmeerrcciiaall BBaannkk LLiimmiitteedd (Rs. 000) Capital and Liabilities FY 2006-07 FY 2007-08 FY 2008-09 FY 2009-10 FY 2010-11
Capital 660,000 943,877 1,140,480 1,311,552 1,311,552
Reserves and Surplus 258,496 359,550 519,774 453,400 686,793
Debenture & Bond 200,000 200,000 200,000 200,000 200,000
Borrowing 352,129 335,000 660,405 1,723,250 773,300
Deposit 10,068,231 13,084,689 15,579,931 15,968,918 18,394,436
Bills Payable 31,691 32,564 265,107 17,542 17,536
Proposed & Payable dividend 11,380 12,475 11,000 345,145 262,310
Tax Liabilities 405 13,927 10,893 32,571 4,827
Other Liabilities 97,008 256,654 363,044 256,952 439,622
Total Liabilities 11,679,340 15,238,736 18,750,633 20,309,330 22,090,376
Cash Balance 181,607 235,246 337,349 530,610 405,796
Balance With NRB 262,735 634,115 970,981 589,322 817,946
Bank Balance with Banks 155,416 322,988 152,820 966,197 453,314
Money At call 163,009 160,000 100,000 0
Investment 1,599,481 2,311,469 3,026,022 4,946,778 4,868,915
Loan and Advances 8,941,398 11,264,678 13,679,394 12,732,014 14,933,940
Fixed Assets 153,679 194,500 259,325 297,192 354,782
Non- Banking Assets 1,164 674 703 - 0
Other Assets 220,851 115,066 324,038 147,217 255,683
Total Assets 11,679,340 15,238,736 18,750,633 20,309,330 22,090,376
Interest Income 725,819 931,400 1,283,521 1,777,165 2,321,406
Interest Expenses 421,375 505,996 767,197 1,031,474 1,446,635
Net Interest Income 304,444 425,404 516,324 745,691 874,771
Commission and discount 36,017 43,373 61,895 76,064 99,646
Other Operating Income 26,174 37,905 44,028 49,345 81,233
Exchange Income 44,277 39,658 97,673 90,909 68,028
Total Operating Income 410,912 546,340 719,921 962,009 1,123,678
Employees Expenses 54,920 72,073 84,545 118,858 139,901
Other Operating Expenses 64,631 81,203 109,784 137,749 187,989
Exchange Loss - - - - 0
Operating Profit Before Provision 291,361 393,064 525,592 705,402 795,788
Provisions for possible losses 37,771 25,414 39,509 17,741 34,901
Operating Profit 253,590 367,650 486,082 687,661 760,887
Non-Operating Income/ Expenses 409 10,649 2,489 11,458 16,910
Return From Loan Loss Provision 94,457 18,450 3,913 56,204 740
Profit From Ordinary activities 348,456 396,749 492,485 755,323 778,537
Extra ordinary Income /Expenses (94,457) (6,037) 7,617 (46,204) 11
Net Profit including all activities 253,999 390,712 500,102 709,119 778,548
Provision For Staff Bonus 23,091 35,519 45,464 64,465
Provision For Income Tax 72,433 112,135 137,204 194,811 70,777
-This Year - - - - 212,068
-Up to Last Year - - - -
Net Profit / Loss 158,475 243,058 317,434 449,843 495,703
Financial Indicators
Core Capital to Risk Weighted Assets 9.21% 10.50% 10.48% 11.25% 11.34%
Capital Fund to Risk Weighted Assets 12.20% 13.11% 12.42% 12.92% 12.89%
Non-Performing Loan to Total Loan 1.11% 0.86% 0.23% 0.72% 0.60%
Weighted Average Interest Spread 2.87% 3.44% 3.50% 3.75% 3.75%
Net Interest Income (Rs. in thousand) 304,444 425,404 516,324 745,691 874,771
Return on Assets 1.36% 1.81% 1.88% 2.30% 2.34%
Credit to Deposit 90.67% 87.62% 89.32% 80.97% 82.45%
Liquid Assets to Total Assets 15.98% 19.02% 19.50% 30.36% 14.16%
Liquid Assets to Total Deposit 18.54% 22.15% 23.47% 38.61% 17.00%

1144.. MMaacchhhhaappuucchhcchhhhrree BBaannkk LLiimmiitteedd (Rs. '000') Capital and Liabilities FY 2006-07 FY 2007-08 FY 2008-09 FY 2009-10 FY 2010-11
Capital 821,651 901,339 1,479,270 1,627,196 1,627,197
Reserves and Surplus 185,641 262,008 220,928 146,314 146,426
Debenture & Bond - - - -
Borrowing 228,504 88,508 150,000 1,251,242
Deposit 9,475,452 11,102,242 15,596,791 18,535,917 16,411,426
Bills Payable 21,482 10,311 24,445 15,402
Proposed & Payable dividend - 8,649 112 -
Tax Liabilities 7,372 3,037 11,765 -
Other Liabilities 70,228 122,454 157,472 203,961 789,488
Total Liabilities 10,810,330 12,498,548 17,490,782 20,678,790 20,225,779
Cash Balance 385,941 560,317 743,199 1,049,327 2,207,561
Balance With NRB 785,689 893,295 1,755,982 1,094,664
Bank Balance with Banks 112,451 134,951 267,468 315,726
Money At call 694,000 70,000 661,564 307,891
Investment 1,278,469 1,443,551 1,246,159 2,096,792 1,409,556
Loan and Advances 7,129,891 8,642,323 12,516,012 14,289,793 14,731,040
Fixed Assets 262,246 535,886 664,158 732,291 725,485
Non- Banking Assets 3,392 - 4,500 -
Other Assets 158,251 218,225 293,304 438,633 844,246
Total Assets 10,810,330 12,498,548 17,490,782 20,678,790 20,225,779
Interest Income 694,482 796,597 1,041,473 1,688,617 2,080,305
Interest Expenses 397,722 407,919 580,036 1,144,808 1,544,728
Net Interest Income 296,760 388,678 461,437 543,809 535,577
Commission and discount 34,305 35,616 38,017 49,904 44,183
Other Operating Income 49,039 30,072 57,136 60,634 72,406
Exchange Income 29,036 45,699 59,818 42,695 38,433
Total Operating Income 409,140 500,065 616,408 697,042 690,599
Employees Expenses 54,360 71,421 90,996 152,113 164,250
Other Operating Expenses 101,467 124,408 182,841 223,469 274,325
Exchange Loss 1,893 - - -
Operating Profit Before Provision 251,420 304,236 342,571 321,460 252,024
Provisions for possible losses 157,606 264,487 258,939 335,041 337,850
Operating Profit 93,814 39,749 83,632 (13,581) (85,826)
Non-Operating Income/ Expenses 462 (48) 24 - 98,774
Return From Loan Loss Provision 48,185 135,405 110,738 117,796 685,546
Profit From Ordinary activities 142,461 175,106 194,395 104,215 698,494
Extra ordinary Income /Expenses (14,319) 38 (500) 9,970 (685,546)
Net Profit including all activities 128,142 175,144 193,895 114,185 12,948
Provision For Staff Bonus 11,403 15,922 17,627 10,380 1,177
Provision For Income Tax 39,940 74,206 53,017 30,492 3,531
-This Year - - - -
-Up to Last Year - - - -
Net Profit / Loss 76,799 85,016 123,251 73,313 8,240
Financial Indicators
Core Capital to Risk Weighted Assets 10.68% 10.97% 10.96% 9.94% 10.86%
Capital Fund to Risk Weighted Assets 11.97% 12.29% 11.84% 11.24% 10.00%
Non-Performing Loan to Total Loan 1.16% 1.04% 2.33% 2.32% 4.46%
Weighted Average Interest Spread 3.38% 3.96% 3.60% 3.40% 2.27%
Net Interest Income (Rs. in thousand) 296,760 388,678 461,437 543,809 535,577
Return on Assets 0.69% 0.68% 0.70% 0.35% 0.03%
Credit to Deposit 77.25% 81.00% 83.00% 80.78% 92.35%
Liquid Assets to Total Assets 27.10% 19.89% 18.55% 24.27% 18.56%
Liquid Assets to Total Deposit 30.92% 22.39% 20.80% 27.07% 22.87%

1155.. KKuummaarrii BBaannkk LLiimmiitteedd (Rs. 000) Capital and Liabilities FY 2006-07 FY 2007-08 FY 2008-09 FY 2009-10 FY 2010-11
Capital 750,000 1,070,000 1,304,936 1,306,016 1,603,800
Reserves and Surplus 275,630 294,885 320,017 479,743 610,037
Debenture & Bond - 400,000 400,000 400,000 400,000
Borrowing 212,970 100,000 293,420 429,739 660,925
Deposit 10,557,416 12,774,281 15,710,925 17,432,253 16,986,279
Bills Payable 16,554 65,297 70,087 42,313 8,118
Proposed & Payable dividend - - 6,584 156,816 6,582
Tax Liabilities 11,007 (9,650) 235 -
Other Liabilities 94,734 331,786 432,361 275,594 216,044
Total Liabilities 11,918,311 15,026,599 18,538,565 20,522,474 20,491,785
Cash Balance 190,748 565,641 549,109 574,066 524,781
Balance With NRB 384,845 244,576 1,120,761 1,663,998 526,949
Bank Balance with Banks 96,520 123,624 106,430 485,765 116,794
Money At call 372,215 55,360 30,000 120,000 451,520
Investment 1,678,418 2,138,797 1,510,828 2,296,873 3,533,623
Loan and Advances 8,929,013 11,335,088 14,593,347 14,765,912 14,626,074
Fixed Assets 189,324 222,001 247,833 285,638 306,277
Non- Banking Assets 2,395 3,141 - -
Other Assets 74,833 338,371 380,258 330,222 405,767
Total Assets 11,918,311 15,026,599 18,538,565 20,522,474 20,491,785
Interest Income 791,284 957,246 1,374,722 1,871,066 2,251,791
Interest Expenses 397,053 498,734 816,203 1,188,918 1,566,551
Net Interest Income 394,231 458,512 558,520 682,148 685,240
Commission and discount 40,764 48,494 79,104 100,337 99,707
Other Operating Income 15,281 17,805 19,747 41,614 53,636
Exchange Income 20,294 41,807 59,002 37,925 36,719
Total Operating Income 470,570 566,618 716,372 862,024 875,302
Employees Expenses 74,244 89,570 115,985 143,278 168,352
Other Operating Expenses 104,079 148,143 186,502 217,606 212,938
Exchange Loss - 0 0
Operating Profit Before Provision 292,247 328,905 413,885 501,140 494,012
Provisions for possible losses 24,950 64,024 57,403 13,078 113,780
Operating Profit 267,297 264,881 356,482 488,062 380,232
Non-Operating Income/ Expenses 670 15,588 1,112 699 632
Return From Loan Loss Provision 6,264 7,241 47,021 14,824 13,788
Profit From Ordinary activities 274,231 287,710 404,615 503,585 394,652
Extra ordinary Income /Expenses (817) (4,531) (876) (352) (342)
Net Profit including all activities 273,414 283,179 403,739 503,233 394,310
Provision For Staff Bonus 24,856 25,743 36,704 45,748 35,846
Provision For Income Tax 78,296 82,506 105,593 140,943 107,227
-This Year - - - - 100,032
-Up to Last Year - - - - 3,023
Deferred Tax
4,171
Net Profit / Loss 170,262 174,930 261,443 316,542 251,237
Financial Indicators
Core Capital to Risk Weighted Assets 10.26% 10.40% 9.09% 10.29% 12.35%
Capital Fund to Risk Weighted Assets 11.22% 14.41% 11.56% 12.34% 13.76%
Non-Performing Loan to Total Loan 0.73% 1.32% 0.44% 0.50% 1.12%
Weighted Average Interest Spread 4.67% 4.30% 4.17% 3.28% 3.92%
Net Interest Income (Rs. in thousand) 394,231 458,512 558,520 682,148 685,240
Return on Assets 1.43% 1.16% 1.41% 1.59% 1.23%
Credit to Deposit 85.84% 92.00% 94.17% 79.45% 87.87%
Liquid Assets to Total Assets 19.65% 16.36% 10.75% 22.29% 21.60%
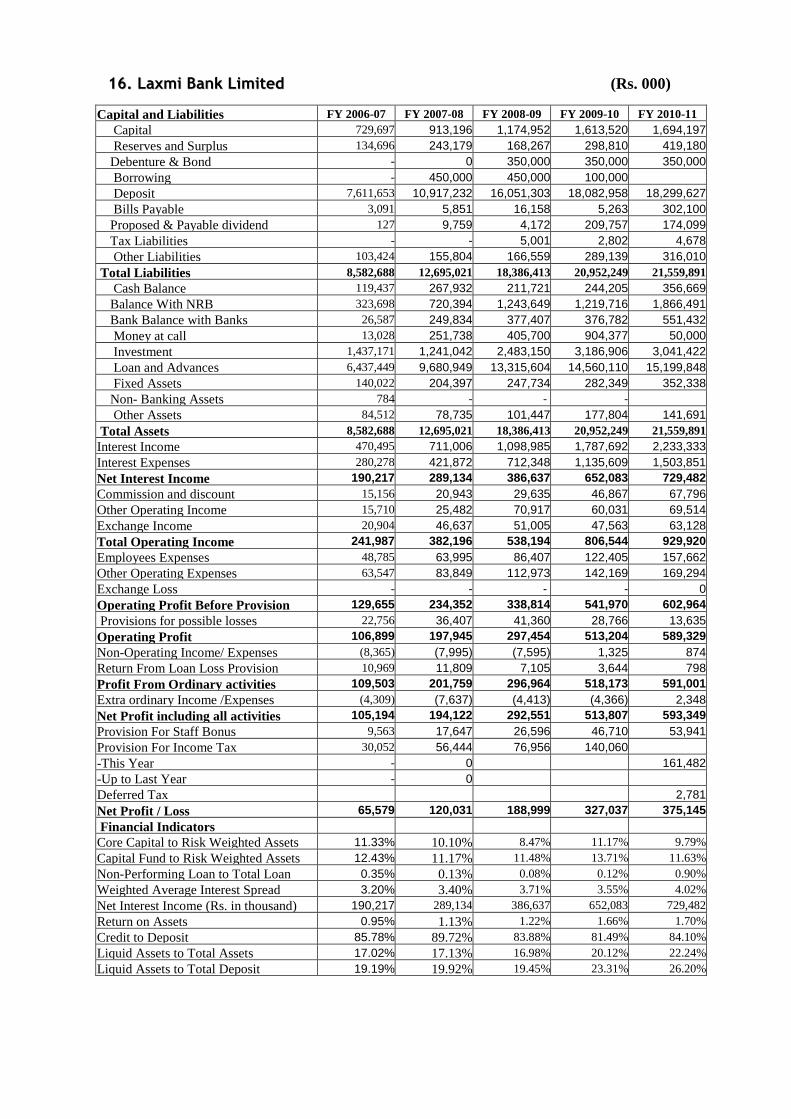
1166.. LLaaxxmmii BBaannkk LLiimmiitteedd (Rs. 000)
Capital and Liabilities FY 2006-07 FY 2007-08 FY 2008-09 FY 2009-10 FY 2010-11
Capital 729,697 913,196 1,174,952 1,613,520 1,694,197
Reserves and Surplus 134,696 243,179 168,267 298,810 419,180
Debenture & Bond - 0 350,000 350,000 350,000
Borrowing - 450,000 450,000 100,000
Deposit 7,611,653 10,917,232 16,051,303 18,082,958 18,299,627
Bills Payable 3,091 5,851 16,158 5,263 302,100
Proposed & Payable dividend 127 9,759 4,172 209,757 174,099
Tax Liabilities - - 5,001 2,802 4,678
Other Liabilities 103,424 155,804 166,559 289,139 316,010
Total Liabilities 8,582,688 12,695,021 18,386,413 20,952,249 21,559,891
Cash Balance 119,437 267,932 211,721 244,205 356,669
Balance With NRB 323,698 720,394 1,243,649 1,219,716 1,866,491
Bank Balance with Banks 26,587 249,834 377,407 376,782 551,432
Money at call 13,028 251,738 405,700 904,377 50,000
Investment 1,437,171 1,241,042 2,483,150 3,186,906 3,041,422
Loan and Advances 6,437,449 9,680,949 13,315,604 14,560,110 15,199,848
Fixed Assets 140,022 204,397 247,734 282,349 352,338
Non- Banking Assets 784 - - -
Other Assets 84,512 78,735 101,447 177,804 141,691
Total Assets 8,582,688 12,695,021 18,386,413 20,952,249 21,559,891
Interest Income 470,495 711,006 1,098,985 1,787,692 2,233,333
Interest Expenses 280,278 421,872 712,348 1,135,609 1,503,851
Net Interest Income 190,217 289,134 386,637 652,083 729,482
Commission and discount 15,156 20,943 29,635 46,867 67,796
Other Operating Income 15,710 25,482 70,917 60,031 69,514
Exchange Income 20,904 46,637 51,005 47,563 63,128
Total Operating Income 241,987 382,196 538,194 806,544 929,920
Employees Expenses 48,785 63,995 86,407 122,405 157,662
Other Operating Expenses 63,547 83,849 112,973 142,169 169,294
Exchange Loss - - - - 0
Operating Profit Before Provision 129,655 234,352 338,814 541,970 602,964
Provisions for possible losses 22,756 36,407 41,360 28,766 13,635
Operating Profit 106,899 197,945 297,454 513,204 589,329
Non-Operating Income/ Expenses (8,365) (7,995) (7,595) 1,325 874
Return From Loan Loss Provision 10,969 11,809 7,105 3,644 798
Profit From Ordinary activities 109,503 201,759 296,964 518,173 591,001
Extra ordinary Income /Expenses (4,309) (7,637) (4,413) (4,366) 2,348
Net Profit including all activities 105,194 194,122 292,551 513,807 593,349
Provision For Staff Bonus 9,563 17,647 26,596 46,710 53,941
Provision For Income Tax 30,052 56,444 76,956 140,060
-This Year - 0 161,482
-Up to Last Year - 0
Deferred Tax
2,781
Net Profit / Loss 65,579 120,031 188,999 327,037 375,145
Financial Indicators
Core Capital to Risk Weighted Assets 11.33% 10.10% 8.47% 11.17% 9.79%
Capital Fund to Risk Weighted Assets 12.43% 11.17% 11.48% 13.71% 11.63%
Non-Performing Loan to Total Loan 0.35% 0.13% 0.08% 0.12% 0.90%
Weighted Average Interest Spread 3.20% 3.40% 3.71% 3.55% 4.02%
Net Interest Income (Rs. in thousand) 190,217 289,134 386,637 652,083 729,482
Return on Assets 0.95% 1.13% 1.22% 1.66% 1.70%
Credit to Deposit 85.78% 89.72% 83.88% 81.49% 84.10%
Liquid Assets to Total Assets 17.02% 17.13% 16.98% 20.12% 22.24%
Liquid Assets to Total Deposit 19.19% 19.92% 19.45% 23.31% 26.20%

1177.. SSiiddddhhaarrtthhaa BBaannkk LLiimmiitteedd (Rs. 000)
Capital and Liabilities FY 2006-07 FY 2007-08 FY 2008-09 FY 2009-10 FY 2010-11
Capital 600,000 828,000 952,200 1,310,436 1,618,264 Reserves and Surplus 193,710 240,346 326,545 293,106 370,141 Debenture & Bond - - 227,770 227,770 227,770 Borrowing 430,000 205,133 327,600 345,000 45,000 Deposit 6,625,078 10,191,441 15,854,798 20,197,029 21,575,654 Bills Payable - 15,884 17,877 35,704 2,686
Proposed & Payable dividend 4,737 6,537 7,517 131,457 200,939 Tax Liabilities 5,203 11,155 4,846 7,439 15,659 Other Liabilities 95,936 169,860 162,597 254,488 349,759
Total Liabilities 7,954,664 11,668,356 17,881,750 22,802,429 24,405,872
Cash Balance 130,442 149,007 270,946 326,868 491,249 Balance With NRB 380,564 270,219 984,981 1,027,465 1,222,412
Bank Balance With Banks 6,220 18,199 291,757 1,052,277 192,024 Money At call 229,446 584,736 484,840 699,042 882,781 Investment 865,189 1,150,096 2,176,428 2,452,475 2,537,909 Loan and Advances 6,222,587 9,335,598 13,328,622 16,653,852 18,384,033 Fixed Assets 46,667 72,398 172,158 360,426 368,174 Non- Banking Assets 10,173 - - -
Other Assets 63,376 88,103 172,019 230,024 327,290
Total Assets 7,954,664 11,668,356 17,881,750 22,802,429 24,405,872
Interest Income 481,524 729,872 1,265,582 2,018,291 2,690,294 Interest Expenses 271,711 408,189 813,619 1,406,489 1,925,243
Net Interest Income 209,813 321,683 451,963 611,802 765,051
Commission and discount 20,178 21,454 32,548 42,758 68,049
Other Operating Income 18,659 31,294 46,354 50,694 62,252 Exchange Income 14,245 27,487 38,682 12,168 38,690
Total Operating Income 262,895 401,918 569,547 717,422 934,042
Employees Expenses 33,620 48,247 79,385 103,680 155,803 Other Operating Expenses 55,721 71,480 114,817 175,735 265,477 Exchange Loss - - - -
Operating Profit Before Provision 173,554 282,191 375,346 438,007 512,762
Provisions for possible losses 20,544 48,048 39,842 65,322 42,628
Operating Profit 153,010 234,143 335,503 372,685 470,133
Non-Operating Income/ Expenses 35 506 10,858 1,433 Return From Loan Loss Provision - 4,031 8,857 - 20,871
Profit From Ordinary activities 153,045 238,680 344,361 383,543 492,438
Extra ordinary Income /Expenses - 0 (8,857) -
Net Profit including all activities 153,045 238,680 335,503 383,543 492,438
Provision For Staff Bonus 13,913 21,698 30,500 34,868 44,767 Provision For Income Tax 43,826 73,808 87,087 107,828 136,255 -This Year - - - - 136,140 -Up to Last Year - - - - 2,040
Deferred Tax
1924.703
Net Profit / Loss 95,306 143,174 217,916 240,847 311,415
Financial Indicators
Core Capital to Risk Weighted Assets 10.78% 10.19% 8.26% 8.00% 9.05%
Capital Fund to Risk Weighted Assets 11.84% 11.14% 10.39% 10.04% 10.78%
Non-Performing Loan to Total Loan 0.34% 0.69% 0.45% 0.53% 0.79%
Weighted Average Interest Spread 3.57% 3.71% 3.45% 3.94% 3.94%
Net Interest Income (Rs. in thousand) 209,813 321,683 451,963 611,802 765,051
Return on Assets 1.20% 1.23% 1.22% 1.06% 1.28%
Credit to Deposit 95.39% 93.03% 85.18% 83.65% 86.43%
Liquid Assets to Total Assets 17.25% 16.05% 20.84% 19.77% 18.78%
Liquid Assets to Total Deposit 20.72% 18.37% 23.50% 22.32% 21.25%

1188.. AAggrriiccuullttuurree DDeevveellooppmmeenntt BBaannkk LLttdd.. NNeeppaall (Rs. 000)
Capital and Liabilities FY 2006-07 FY 2007-08 FY 2008-09 FY 2009-10 FY 2010-11
Capital 7,528,000 10,777,500 10,777,500 9,437,500 9,474,300
Reserves and Surplus (6,254,909) (5,442,189) (452,327) 1,430,001 3,734,931 Debenture & Bond - 0 2,300,000 2,300,000 Borrowing 373,947 257,373 198,250 259,562 243,701 Deposit 32,416,358 32,553,827 35,159,610 32,472,569 34,394,627 Bills Payable - - - - Proposed & Payable dividend - - 276,000 276,000 276,000
Tax Liabilities 284,744 365,242 597,719 941,920 1,321,153 Other Liabilities 3,812,071 5,174,996 5,261,987 6,902,674 7,577,440
Total Liabilities 38,160,211 43,686,749 51,818,739 54,020,226 59,322,152
Cash Balance 749,552 905,235 1,413,971 1,366,731 1,581,094 Balance With NRB 2,001,144 1,806,731 2,717,813 1,759,468 2,553,275 Bank Balance With Banks 938,625 912,032 1,075,869 1,035,206 674,585
Money At call 161,599 49,995 2,244,198 1,611,342 27,289 Investment 3,177,461 4,757,097 4,896,062 4,540,084 7,348,073 Loan and Advances 27,252,333 30,589,428 32,603,096 33,876,957 34,459,919 Fixed Assets 788,868 781,149 803,333 968,745 1,022,894 Non- Banking Assets - - - - Other Assets 3,090,629 3,885,082 6,064,398 8,861,693 11,655,023
Total Assets 38,160,211 43,686,749 51,818,739 54,020,226 59,322,152
Interest Income 4,623,096 3,961,131 4,231,143 5,464,857 6,101,187 Interest Expenses 1,605,867 1,641,207 1,157,071 1,507,997 2,116,489
Net Interest Income 3,017,229 2,319,924 3,074,072 3,956,860 3,984,698
Commission and discount 49,818 71,139 90,045 101,727 261,741 Other Operating Income 232,033 350,676 382,246 318,804 322,224 Exchange Income - 11,955 22,096 0
Total Operating Income 3,299,080 2,753,694 3,568,459 4,377,391 4,568,663
Employees Expenses 1,306,805 1,849,133 2,486,716 2,679,861 2,209,114 Other Operating Expenses 277,546 288,020 300,691 330,022 376,623 Exchange Loss 14,061 - - 5,576 1,268
Operating Profit Before Provision 1,700,668 616,541 781,052 1,361,932 1,981,658
Provisions for possible losses 337,783 2,677,476 2,184,688 2,582,234 2,504,031
Operating Profit 1,362,885 (2,060,935) (1,403,636) (1,220,302) (522,373)
Non-Operating Income/ Expenses 7,419 18,336 634,989 19,474 105,562 Return From Loan Loss Provision 1,803,214 4,064,478 1,381,932 2,469,671 2,182,828
Profit From Ordinary activities 3,173,518 2,021,879 613,284 1,268,843 1,766,017
Extra ordinary Income /Expenses (1,883,003) (1,212,162) 1,106,749 667,292 367,166
Net Profit including all activities 1,290,515 809,717 1,720,033 1,936,135 2,133,183
Provision For Staff Bonus 95,594 59,979 127,410 143,417 158,013 Provision For Income Tax 136,473 80,499 535,023 (99,667) 379,232 -This Year - - - - 379,232 -Up to Last Year - - - - 789,296
Net Profit / Loss 1,058,448 669,239 1,057,600 1,892,385 2,385,234
Financial Indicators
Core Capital to Risk Weighted Assets 2.68% 6.09% 11.04% 14.66% 16.34%
Capital Fund to Risk Weighted Assets 4.84% 11.41% 15.69% 19.19% 20.47%
Non-Performing Loan to Total Loan 17.96% 11.69% 9.71% 8.36% 8.99%
Weighted Average Interest Spread 5.88% 4.52% 5.87% 6.09% 6.35%
Net Interest Income (Rs. in thousand) 3,017,229 2,319,924 3,074,072 3,956,860 3,984,698
Return on Assets - 0.00% 2.04% 3.50% 4.02%
Credit to Deposit 106.24% 112.44% 108.93% 121.90% 117.38%
Liquid Assets to Total Assets 14.70% 8.41% 21.08% 17.03% 18.17%
Liquid Assets to Total Deposit 17.31% 11.29% 31.07% 28.33% 31.34%

1199.. GGlloobbaall BBaannkk LLiimmiitteedd (Rs. 000) Capital and Liabilities FY 2006-07 FY 2007-08 FY 2008-09 FY 2009-10 FY 2010-11
Capital 510,000 700,000 1,000,000 1,473,350 1,600,000
Reserves and Surplus (38,612) 22,622 48,927 47,672 108,027
Debenture & Bond - - - - 0
Borrowing 30,000 100,000 499,460 339,160 401,789
Deposit 3,023,616 7,319,702 10,932,984 15,031,548 15,066,490
Bills Payable 2,534 30,637 76,459 66,632 60,460
Proposed & Payable dividend - - - 74,258 80,263
Tax Liabilities - 282 - - 0
Other Liabilities 9,178 92,473 68,643 168,795 205,679
Total Liabilities 3,536,716 8,265,716 12,626,473 17,201,415 17,522,708
Cash Balance 66,728 576,459 326,273 543,541 522,684
Balance With NRB 304,184 604,812 914,399 945,041 808,765
Bank Balance With Banks 102,128 86,712 141,470 945,756 422,997
Money At call - 457,760 36,643 - 0
Investment 389,480 1,187,415 1,620,121 2,270,487 2,920,247
Loan and Advances 2,564,140 5,084,730 9,063,092 11,960,452 12,372,424
Fixed Assets 52,509 105,386 224,351 284,400 231,579
Non- Banking Assets - - - - 0
Other Assets 57,547 162,442 300,124 251,738 244,012
Total Assets 3,536,716 8,265,716 12,626,473 17,201,415 17,522,708
Interest Income 65,103 357,911 683,933 1,464,978 1,963,603
Interest Expenses 40,325 218,947 459,784 962,010 1,288,051
Net Interest Income 24,778 138,964 224,150 502,968 675,552
Commission and discount 3,969 18,991 46,019 54,618 67,518
Other Operating Income 2,086 9,670 33,841 75,488 84,979
Exchange Income 6,479 26,541 30,210 35,362 30,937
Total Operating Income 37,312 194,166 334,220 668,436 858,986
Employees Expenses 12,706 41,962 66,322 100,256 155,004
Other Operating Expenses 24,794 60,107 132,894 209,346 237,364
Exchange Loss - - - - 0
Operating Profit Before Provision (188) 92,097 135,004 358,834 466,618
Provisions for possible losses 38,425 16,917 70,218 195,065 252,931
Operating Profit (38,613) 75,180 64,785 163,769 213,687
Non-Operating Income/ Expenses - - - 440 (132)
Return From Loan Loss Provision - - - - 166,245
Profit From Ordinary activities (38,613) 75,180 64,785 164,209 379,800
Extra ordinary Income /Expenses - - - - (93,481)
Net Profit including all activities (38,613) 75,180 64,785 164,209 286,319
Provision For Staff Bonus - 6,834 5,890 14,928 26,029
Provision For Income Tax - 7,112 3,291 76,278 35,312
-This Year - - - -
-Up to Last Year - - - -
Net Profit / Loss (38,613) 61,234 55,605 73,003 224,978
Financial Indicators Core Capital to Risk Weighted Assets 14.00% 10.95% 9.42% 10.50% 10.14%
Capital Fund to Risk Weighted Assets 16.00% 11.80% 10.31% 11.39% 11.09%
Non-Performing Loan to Total Loan - - 0.09% 0.85% 2.52%
Weighted Average Interest Spread 3.25% 3.05% 3.05% 3.05% 3.27%
Net Interest Income (Rs. in thousand) 24,778 138,964 224,150 502,968 675,552
Return on Assets -1.15% 0.75% 0.21% 0.42% 1.28%
Credit to Deposit 86.00% 70.22% 83.78% 83.48% 84.82%
Liquid Assets to Total Assets 16.90% 29.61% 21.90% 25.50% 21.77%
Liquid Assets to Total Deposit 19.77% 33.43% 25.30% 29.18% 25.31%

2200.. CCiittiizzeennss BBaannkk IInntteerrnnaattiioonnaall LLiimmiitteedd (Rs. 000) Capital and Liabilities FY 2006-07 FY 2007-08 FY 2008-09 FY 2009-10 FY 2010-11
Capital 560,000 560,000 1,000,000 1,206,950 2,040,000
Reserves and Surplus (15,420) 39,421 34,073 101,319 132,119
Debenture & Bond - - 0
Borrowing 1,372,569 476,074 250,000 651,151 805,000
Deposit 1,553,170 6,139,579 11,524,426 14,214,482 13,478,333
Bills Payable 1,297 4,209 4,166 2,430 3,782
Proposed & Payable dividend - - 100,000 126,316 170,526
Tax Liabilities - - - - 0
Other Liabilities 15,680 50,017 53,409 214,237 185,277
Total Liabilities 3,487,296 7,269,300 12,966,074 16,516,885 16,815,037
Cash Balance 46,111 316,759 366,875 626,708 831,453
Balance With NRB 76,725 299,590 1,134,215 1,596,432 492,519
Bank Balance With Banks 23,985 116,134 154,264 222,478 181,563
Money At call - 442,682 900,400 234,981 226,837
Investment 1,221,389 1,174,029 2,027,338 2,680,168 2,401,437
Loan and Advances 2,026,210 4,750,342 8,128,114 10,785,658 12,271,826
Fixed Assets 73,809 126,104 121,659 163,856 192,066
Non- Banking Assets - - - - 0
Other Assets 19,067 43,660 133,211 206,604 217,336
Total Assets 3,487,296 7,269,300 12,966,074 16,516,885 16,815,037
Interest Income 26,955 396,842 758,256 1,398,830 1,795,232
Interest Expenses 14,830 252,028 508,802 950,898 1,236,322
Net Interest Income 12,125 144,814 249,454 447,932 558,910
Commission and discount 664 9,028 12,295 25,135 32,533
Other Operating Income 6,782 24,537 45,805 67,846 65,121
Exchange Income 582 8,900 8,825 15,275 13,282
Total Operating Income 20,153 187,279 316,379 556,188 669,846
Employees Expenses 6,030 29,049 40,219 63,465 81,689
Other Operating Expenses 9,026 51,719 91,673 131,632 179,151
Exchange Loss - - - - 0
Operating Profit Before Provision 5,097 106,511 184,487 361,091 409,006
Provisions for possible losses 20,517 27,466 34,119 57,124 103,368
Operating Profit (15,420) 79,045 150,368 303,967 305,638
Non-Operating Income/ Expenses - 244 273 1,173 6,730
Return From Loan Loss Provision - 0 0 0
Profit From Ordinary activities (15,420) 79,289 150,641 305,140 312,368
Extra ordinary Income /Expenses - 0 0 0 0
Net Profit including all activities (15,420) 79,289 150,641 305,140 312,368
Provision For Staff Bonus - 7,208 13,695 27,740 28,397
Provision For Income Tax - 17,240 41,137 83,839 85,617
-This Year - - - -
-Up to Last Year - - - -
Net Profit / Loss (15,420) 54,841 95,810 193,561 198,354
Financial Indicators Core Capital to Risk Weighted Assets 21.07% 11.18% 10.79% 10.51% 14.69%
Capital Fund to Risk Weighted Assets 21.86% 12.08% 11.65% 11.40% 15.53%
Non-Performing Loan to Total Loan - 0 0.00% 0.31% 1.17%
Weighted Average Interest Spread 3.24% 4.46% 4.91% 3.73% 3.27%
Net Interest Income (Rs. in thousand) 12,125 144,814 249,454 447,932 558,910
Return on Assets -0.44 0.75% 0.74% 1.17% 1.18%
Credit to Deposit 130.46% 78.15% 71.24% 76.86% 92.85%
Liquid Assets to Total Assets 4.21% 18.61% 22.31% 24.44% 16.93%
Liquid Assets to Total Deposit 9.45% 22.03% 25.10% 28.40% 21.12%

2211.. PPrriimmee CCoommmmeerrcciiaall BBaannkk LLiimmiitteedd (Rs. 000) Capital and Liabilities FY 2006-07 FY 2007-08 FY 2008-09 FY 2009-10 FY 2010-11
Capital 700,000
9
963,755 1,373,755 2,245,746
Reserves and Surplus 28,007 65,449 164,645 241,112
Debenture & Bond - - - 0
Borrowing 265,502 539,364 448,800 213,120
Deposit 5,275,649 11,779,989 17,883,518 18,938,903
Bills Payable 753 9,809 29,425 17,159
Proposed & Payable dividend - 5,263 115,789 283,673
Tax Liabilities - - 4,889 14,603
Other Liabilities 118,586 93,259 198,008 131,786
Total Liabilities 6,388,497 13,456,887 20,218,829 22,086,102
Cash Balance 92,185 279,676 761,017 905,065
Balance With NRB 178,191 950,917 2,035,518 1,735,542
Bank Balance With Banks 27,891 148,733 711,944 285,218
Money At call 450,000 453,826 604,869
Investment 378,563 2,097,042 2,038,603 1,366,046
Loan and Advances 5,104,412 9,732,585 13,946,600 16,894,719
Fixed Assets 40,333 108,064 162,574 180,786
Non- Banking Assets - - - 0
Other Assets 116,922 139,870 108,747 113,857
Total Assets 6,388,497 13,456,887 20,218,829 22,086,102
Interest Income 224,530 822,685 1,749,859 2,477,093
Interest Expenses 121,365 564,655 1,193,075 1,780,463
Net Interest Income 103,165 258,030 556,784 696,630
Commission and discount 5,209 21,516 25,662 46,341
Other Operating Income 35,908 81,760 129,949 105,375
Exchange Income 3,403 10,961 21,772 15,471
Total Operating Income 147,685 372,267 734,167 863,817
Employees Expenses 21,954 34,320 57,518 81,013
Other Operating Expenses 29,197 68,315 109,996 152,028
Exchange Loss - - - 0
Operating Profit Before Provision 96,534 269,633 566,653 630,776
Provisions for possible losses 51,559 46,749 57,541 61,414
Operating Profit 44,975 222,883 509,112 569,362
Non-Operating Income/ Expenses - - 4,986 0
Return From Loan Loss Provision - - 21 0
Profit From Ordinary activities 44,975 222,883 514,119 569,362
Extra ordinary Income /Expenses - - - 0
Net Profit including all activities 44,975 222,883 514,119 569,362
Provision For Staff Bonus 4,089 20,265 46,738 51,760
Provision For Income Tax 12,879 59,936 142,396 157,462
-This Year - - - 0
-Up to Last Year - - - 0
Net Profit / Loss 28,007 142,682 324,985 360,140
Financial Indicators
Core Capital to Risk Weighted Assets 12.31% 9.47% 9.78% 13.66%
Capital Fund to Risk Weighted Assets 13.18% 10.38% 10.67% 14.60%
Non-Performing Loan to Total Loan
- 0.00% 0.00% 0.57%
Weighted Average Interest Spread 3.55% 3.57% 2.54% 3.80%
Net Interest Income (Rs. in thousand) 103,165 258,030 556,784 696,630
Return on Assets 0.44% 1.06% 1.61% 1.63%
Credit to Deposit 96.75% 82.62% 78.86% 90.35%
Liquid Assets to Total Assets 14.70% 15.59% 25.68% 20.83%
Liquid Assets to Total Deposit 17.80% 17.81% 29.03% 24.29%

2222.. BBaannkk ooff AAssiiaa NNeeppaall LLiimmiitteedd (Rs. 000) Capital and Liabilities FY 2006-07 FY 2007-08 FY 2008-09 FY 2009-10 FY 2010-11
Capital 700,000 1,000,000 1,500,000 2,000,000
Reserves and Surplus 4,462 15,955 84,990 154,441
Debenture & Bond - 0
Borrowing 500,000 1,409,657 876,440 990,000
Deposit 3,054,837 8,875,563 12,480,761 13,677,365
Bills Payable 3,380 153,198 21,401 4,112
Proposed & Payable dividend - 50,000 157,895 147,368
Tax Liabilities 852 - 2,048 0
Other Liabilities 29,503 139,135 420,037 726,283
Total Liabilities 4,293,034 11,643,508 15,543,572 17,699,569
Cash Balance 73,150 236,519 268,765 320,772
Balance With NRB 254,304 496,654 480,866 929,808
Bank Balance With Banks 67,775 382,726 181,684 645,395
Money At call 369,776 915,050 749,332 492,750
Investment 703,081 1,727,036 2,415,874 2,648,191
Loan and Advances 2,727,703 7,635,757 11,107,422 11,639,021
Fixed Assets 61,058 167,870 242,789 206,230
Non- Banking Assets - - - 0
Other Assets 36,187 81,897 96,840 817,402
Total Assets 4,293,034 11,643,508 15,543,572 17,699,569
Interest Income 190,517 584,258 1,370,272 1,859,543
Interest Expenses 127,236 378,200 870,269 1,239,699
Net Interest Income 63,281 206,057 500,003 619,844
Commission and discount 1,725 7,819 17,648 16,787
Other Operating Income 11,127 61,301 80,674 62,625
Exchange Income 2,663 10,904 27,164 30,854
Total Operating Income 78,796 286,081 625,489 730,110
Employees Expenses 18,800 53,665 101,919 122,803
Other Operating Expenses 25,279 87,832 151,764 166,733
Exchange Loss 0 0
Operating Profit Before Provision 34,717 144,585 371,806 440,574
Provisions for possible losses 27,553 49,785 45,190 111,616
Operating Profit 7,164 94,800 326,616 328,958
Non-Operating Income/ Expenses - 1,833 1,126
Return From Loan Loss Provision - - 0
Profit From Ordinary activities 7,164 96,633 326,616 330,084
Extra ordinary Income /Expenses - - - 0
Net Profit including all activities 7,164 96,633 326,616 330,084
Provision For Staff Bonus 651 8,785 29,692 30,008
Provision For Income Tax 2,051 26,354 89,021 90,195
-This Year - 26,690 -
-Up to Last Year - (335) -
Net Profit / Loss 4,462 61,494 207,903 209,881
Financial Indicators
Core Capital to Risk Weighted Assets 21.24% 11.06% 12.66% 15.20%
Capital Fund to Risk Weighted Assets 22.08% 11.91% 13.06% 16.11%
Non-Performing Loan to Total Loan 0 0.01% 0.27% 1.40%
Weighted Average Interest Spread 2.85% 4.10% 3.68% 2.52%
Net Interest Income (Rs. in thousand) 63,281 206,057 500,003 619,844
Return on Assets 0.21% 0.77% 1.53% 1.26%
Credit to Deposit 90.19% 86.90% 89.00% 85.10%
Liquid Assets to Total Assets 20.51% 19.31% 19.25% 25.56%
Liquid Assets to Total Deposit 28.82% 25.34% 23.98% 33.07%

2233.. SSuunnrriissee BBaannkk LLiimmiitteedd (Rs. 000) Capital and Liabilities FY 2006-07 FY 2007-08 FY 2008-09 FY 2009-10 FY 2010-11
Capital 700,000 1,337,500 1,510,350 2,015,000
Reserves and Surplus (27,209) 57,570 135,014 131,061
Debenture & Bond - - -
Borrowing 487,873 365,614 150,000
Deposit 4,226,272 12,012,618 14,767,030 13,391,714
Bills Payable 9,124 20,921 8,736 2,700
Proposed & Payable dividend - - 125,000 80,600
Tax Liabilities - - 3,632
Other Liabilities 47,108 2,963,028 219,175 229,383
Total Liabilities 5,443,168 16,757,251 16,918,937 15,850,458
Cash Balance 34,933 316,399 395,427 587,478
Balance With NRB 244,532 3,950,334 974,460 890,020
Bank Balance With Banks 70,539 475,397 114,096 426,945
Money At call 15,570 674,150 126,090 323,897
Investment 595,009 1,910,210 2,465,338 1,103,343
Loan and Advances 3,995,604 8,953,332 12,045,228 11,910,059
Fixed Assets 106,149 272,931 365,088 371,731
Non- Banking Assets - - -
Other Assets 80,832 204,499 433,210 236,985
Total Assets 5,143,168 16,757,251 16,918,937 15,850,458
Interest Income 174,204 774,066 1,546,891 1,918,745
Interest Expenses 101,339 510,001 962,288 1,221,699
Net Interest Income 72,865 264,065 584,603 697,046
Commission and discount 20,468 58,628 81,651 50,759
Other Operating Income 709 3,214 8,854 45,995
Exchange Income 10,909 35,583 42,783 34,035
Total Operating Income 104,951 361,490 717,891 827,836
Employees Expenses 31,130 75,474 124,094 140,682
Other Operating Expenses 51,847 121,822 199,803 240,267
Exchange Loss - - -
Operating Profit Before Provision 21,974 164,194 393,994 446,887
Provisions for possible losses 62,100 57,497 83,093 372,358
Operating Profit (40,126) 106,697 310,901 74,529
Non-Operating Income/ Expenses - 4,211 74 11,494
Return From Loan Loss Provision - 21,523 1,181 233
Profit From Ordinary activities (40,126) 132,432 312,156 86,256
Extra ordinary Income /Expenses - - - 0
Net Profit including all activities (40,126) 132,432 312,156 86,256
Provision For Staff Bonus - 12,039 28,377 7,841
Provision For Income Tax (12,917) 35,613 79,428 34,175
-This Year - - - 30,777
-Up to Last Year - - - 1,969
Deferred Tax
1,429
Net Profit / Loss (27,209) 84,779 204,351 44,239
Financial Indicators
Core Capital to Risk Weighted Assets 13.92% 11.88% 10.47% 12.55%
Capital Fund to Risk Weighted Assets 14.78% 12.66% 11.37% 13.28%
Non-Performing Loan to Total Loan - 0.0007% 1.04% 0.0351%
Weighted Average Interest Spread 2.88% 3.65% 4.92% 3.83%
Net Interest Income (Rs. in thousand) 72,865 264,065 584,603 697,046
Return on Assets -0.50% 0.51% 1.21% 0.0028%
Credit to Deposit 94.54% 74.53% 81.57% 92.87%
Liquid Assets to Total Assets 12.67% 37.93% 18.55% 18.71%
Liquid Assets to Total Deposit 15.42% 52.91% 21.26% 22.15%

2244.. DDCCBBLL BBaannkk LLiimmiitteedd (Rs. '000') Capital and Liabilities FY 2006-07 FY 2007-08 FY 2008-09 FY 2009-10 FY 2010-11
Capital 268,800 1,107,456 1,655,289 1,920,911 2,000,000
Reserves and Surplus 78,696 115,505 214,205 112,058 117,884
Debenture & Bond - - - -
Borrowing 50,000 350,995 290,000 - 1,070,000
Deposit 2,539,702 2,913,337 6,613,359 8,065,183 9,322,535
Bills Payable 813 241,028 22,500 2,650 875
Proposed & Payable dividend 4,451 1,499 5,601 9,191 4,162
Tax Liabilities - - - -
Other Liabilities 26,803 40,404 57,685 69,405 60,217
Total Liabilities 2,969,265 4,770,224 8,858,639 10,179,398 12,575,673
Cash Balance 15,831 33,272 87,949 135,515 516,203
Balance With NRB 129,546 153,024 551,213 274,339 514,100
Bank Balance With Banks 8,233 39,501 76,597 206,630 305,866
Money At call 268,440 663,063 1,021,576 935,615
Investment 42,615 68,571 497,813 882,973 1,960,260
Loan and Advances 2,329,207 3,608,620 6,353,976 7,401,715 8,797,730
Fixed Assets 137,524 172,440 220,448 248,677 322,025
Non- Banking Assets 13,136 - - -
Other Assets 24,733 31,733 49,067 93,934 159,489
Total Assets 2,969,265 4,770,224 8,858,639 10,179,398 12,575,673
Interest Income 255,936 308,678 587,877 930,032 1,316,982
Interest Expenses 131,248 151,131 347,983 598,033 949,934
Net Interest Income 124,688 157,547 239,894 331,999 367,048
Commission and discount 3,833 5,136 9,811 16,069 14,654
Other Operating Income 7,007 12,576 30,852 29,023 31,214
Exchange Income 375 5,157 14,913 10,441 8,553
Total Operating Income 135,903 180,416 295,470 387,532 421,469
Employees Expenses 29,430 43,699 52,752 65,649 87,616
Other Operating Expenses 23,109 27,904 39,466 50,592 90,024
Exchange Loss - - - -
Operating Profit Before Provision 83,364 108,813 203,252 271,291 243,829
Provisions for possible losses 9,532 30,803 38,208 21,982 101,773
Operating Profit 73,832 78,010 165,045 249,309 142,056
Non-Operating Income/ Expenses 71 783 - 683
Return From Loan Loss Provision 268 4,379 - - 0
Profit From Ordinary activities 74,171 83,172 165,045 249,992 142,056
Extra ordinary Income /Expenses - 3,250 - 2,219
Net Profit including all activities 74,171 86,422 165,045 252,211 142,056
Provision For Staff Bonus 6,742 7,857 15,004 22,928 12,914
Provision For Income Tax 22,325 23,608 46,985 70,909 40,064
-This Year - - - - 35,376
-Up to Last Year - - - - 1,242
Deferred Tax
3,446
Net Profit / Loss 45,104 54,957 103,056 158,374 89,078
Financial Indicators
Core Capital to Risk Weighted Assets 12.71% 29.04% 20.27% 22.87% 20.20%
Capital Fund to Risk Weighted Assets 13.57% 29.92% 20.99% 23.73% 21.07%
Non-Performing Loan to Total Loan 2.67% 2.28% 1.59% 1.44% 1.95%
Weighted Average Interest Spread 4.88% 2.51% 2.41% 3.15% 3.40%
Net Interest Income (Rs. in thousand) 124,688 157,547 239,894 331,999 367,048
Return on Assets 1.52% 1.12% 1.15% 1.53% 0.0069%
Credit to Deposit 91.71% 123.87% 98.00% 93.56% 81.72%
Liquid Assets to Total Assets 15.15% 18.51% 24.61% 23.46% 23.46%

2255.. NNMMBB BBaannkk LLiimmiitteedd (Rs. 000) Capital and Liabilities FY 2006-07 FY 2007-08 FY 2008-09 FY 2009-10 FY 2010-11
Capital 199,541 1,000,000 1,424,641 1,651,650 2,000,000
Reserves and Surplus 84,933 213,481 167,412 159,879 211,462
Debenture & Bond - - - -
Borrowing 937,254 278,112 313,961 380,255 497,200
Deposit 1,296,389 1,661,605 6,877,907 10,110,690 12,866,222
Bills Payable 811 24,103 5,447 9,531 2,838
Proposed & Payable dividend 63,664 8,507 7,588 150,150 180,000
Tax Liabilities 970 - - -
Other Liabilities 1,837,375 5,742,084 7,059,708 764,423 190,470
Total Liabilities 4,420,937 8,927,892 15,856,664 13,226,578 15,948,192
Cash Balance 3,078 17,915 201,847 239,918 264,688
Balance With NRB 12,787 506,384 717,404 522,558 876,757
Bank Balance With Banks 18,402 4,926,120 6,561,098 967,358 352,443
Money At call 1,975,298 93,404 875,527 582,309 259,166
Investment 854,678 1,242,902 1,857,563 2,715,957 2,614,946
Loan and Advances 1,395,885 1,939,967 5,194,211 7,808,119 11,208,574
Fixed Assets 80,177 132,720 223,814 255,294 276,549
Non- Banking Assets 259 - - -
Other Assets 80,373 68,480 225,200 135,065 95,069
Total Assets 4,420,937 8,927,892 15,856,664 13,226,578 15,948,192
Interest Income 237,933 251,409 402,583 866,182 1,492,385
Interest Expenses 140,253 139,095 254,261 559,544 1,053,451
Net Interest Income 97,680 112,314 148,322 306,638 438,934
Commission and discount 20,024 27,614 27,262 49,953 27,982
Other Operating Income 51,006 40,724 42,914 66,524 59,472
Exchange Income - 0 9,343 23,006 47,191
Total Operating Income 168,710 180,652 227,841 446,121 573,579
Employees Expenses 14,212 20,123 40,274 55,958 75,614
Other Operating Expenses 13,970 32,222 76,983 108,343 136,395
Exchange Loss - 97 - -
Operating Profit Before Provision 140,528 128,210 110,585 281,820 361,570
Provisions for possible losses 19,512 32,387 42,195 40,253 36,531
Operating Profit 121,016 95,823 68,390 241,567 325,038
Non-Operating Income/ Expenses - 600 1,712 1,983 3,903
Return From Loan Loss Provision 186 22,462 27,563 4,006 25,610
Profit From Ordinary activities 121,202 118,885 97,666 247,556 354,551
Extra ordinary Income /Expenses - - - 1,005 14,385
Net Profit including all activities 121,202 118,885 97,666 248,561 368,936
Provision For Staff Bonus 11,018 10,808 8,879 22,596 33,539
Provision For Income Tax 35,046 35,255 25,834 69,892 113,892
-This Year - - - - 103,396
-Up to Last Year - - - (3,797) 10,495
Net Profit / Loss 75,138 72,822 62,953 159,870 221,505
Financial Indicators
Core Capital to Risk Weighted Assets 11.76% 32.66% 18.42% 17.53% 15.51%
Capital Fund to Risk Weighted Assets 13.31% 33.96% 19.03% 18.37% 16.39%
Non-Performing Loan to Total Loan 1.73% 1.52% 0.51% 0.70% 0.27%
Weighted Average Interest Spread 3.58% 2.41% 3.58% 3.19% 3.18%
Net Interest Income (Rs. in thousand) 97,680 112,314 148,322 306,638 438,934
Return on Assets - 0.82% 0.00 1.21% 1.39%
Credit to Deposit 112.02% 120.96% 76.78% 78.44% 88.16%
Liquid Assets to Total Assets 56.25% 70.78% 59.85% 29.51% 22.83%
Liquid Assets to Total Deposit 191.82% 380.31% 137.97% 38.60% 28.30%

2266.. KKiisstt BBaannkk LLiimmiitteedd ((RRss.. 000000)) Capital and Liabilities FY 2006-07 FY 2007-08 FY 2008-09 FY 2009-10 FY 2010-11
Capital - - 2,000,000 2,000,000 2,000,000
Reserves and Surplus - - 45,119 89,257 143,334
Debenture & Bond - - - -
Borrowing - - 130,000 600,000 910,043
Deposit - - 8,684,078 15,962,631 15,808,486
Bills Payable - - 16,011 9,030 1,343
Proposed & Payable dividend - - 77,118 100,000
Tax Liabilities - - 3,357 7,674
Other Liabilities - - 195,856 178,626 152,047
Total Liabilities - - 11,151,537 18,947,218 19,015,253
Cash Balance - - 383,620 563,286 762,965
Balance With NRB - - 638,941 1,027,274 1,152,429
Bank Balance With Banks - - 205,598 84,769 72,957
Money At call - - 1,184,504 1,366,279 413,058
Investment - - 1,085,100 2,057,666 1,874,110
Loan and Advances - - 6,803,439 12,345,845 13,042,567
Fixed Assets - - 714,439 1,149,484 1,225,108
Non- Banking Assets - - - -
Other Assets - - 135,895 352,615 472,059
Total Assets - - 11,151,537 18,947,218 19,015,253
Interest Income - - 594,757 1,517,073 1,994,330
Interest Expenses - - 338,979 967,324 1,302,975
Net Interest Income - - 255,778 549,749 691,355
Commission and discount - - 4,326 16,766 68,038
Other Operating Income - - 63,617 86,607 80,706
Exchange Income - - 44 2,789 7,669
Total Operating Income - - 323,766 655,911 847,768
Employees Expenses - - 42,550 142,974 193,639
Other Operating Expenses - - 97,769 236,496 291,212
Exchange Loss - - - -
Operating Profit Before Provision - - 183,447 276,441 362,917
Provisions for possible losses - - 46,584 58,890 273,205
Operating Profit - - 136,863 217,551 89,712
Non-Operating Income/ Expenses - - 505 2,405 3,596
Return From Loan Loss Provision - - - -
Profit From Ordinary activities - - 137,368 219,956 93,308
Extra ordinary Income /Expenses - - - -
Net Profit including all activities - - 137,368 219,956 93,308
Provision For Staff Bonus - - 12,488 19,996 8,483
Provision For Income Tax - - 35,217 55,822 30,748
-This Year - - - - 34,182
-Up to Last Year - - - - (265)
Deferred Tax
- - (3,169)
Net Profit / Loss - - 89,663 144,138 54,077
Financial Indicators - -
Core Capital to Risk Weighted Assets - - 20.27% 13.14% 12.70%
Capital Fund to Risk Weighted Assets - - 20.96% 13.95% 13.49%
Non-Performing Loan to Total Loan - - 0.22% 0.19% 2.54%
Weighted Average Interest Spread - - 4.62% 3.69% 4.19%
Net Interest Income (Rs. in thousand) - - 255,778 549,749 691,355
Return on Assets - - 0.80% 0.76% 0.28%
Credit to Deposit - - 79.31% 78.22% 85.00%
Liquid Assets to Total Assets - - 25.89% 24.74% 22.07%
Liquid Assets to Total Deposit - - 33.25% 29.37% 26.55%

2277.. JJaannaattaa BBaannkk NNeeppaall LLiimmiitteedd (Rs. 000) Capital and Liabilities FY 2006-07 FY 2007-08 FY 2008-09 FY 2009-10 FY 2010-11
Capital - - - 1,400,000 1,400,000
Reserves and Surplus - - - 46,166 76,875
Debenture & Bond - - - - 0
Borrowing - - - - 91,054
Deposit - - - 855,362 3,501,603
Bills Payable - - - 10,099 2,388
Proposed & Payable dividend - - - - 0
Tax Liabilities - - - 1,995 2,084
Other Liabilities - - - 24,247 36,322
Total Liabilities - - - 2,337,869 5,110,326
Cash Balance - - - 15,246 131,094
Balance With NRB - - - 31,418 133,536
Bank Balance With Banks - - - 1,226,227 78,399
Money At call - - - 150,176 410,000
Investment - - - 75,000 542,029
Loan and Advances - - - 602,247 3,541,267
Fixed Assets - - - 90,688 123,609
Non- Banking Assets - - - - 0
Other Assets - - - 146,867 150,392
Total Assets - - - 2,337,869 5,110,326
Interest Income - - - 47,042 393,213
Interest Expenses - - - 4,590 196,818
Net Interest Income - - - 42,452 196,395
Commission and discount - - - 490 7,367
Other Operating Income - - - 5,208 23,546
Exchange Income - - - 59 3,573
Total Operating Income - - - 48,209 230,881
Employees Expenses - - - 10,417 53,677
Other Operating Expenses - - - 16,420 87,785
Exchange Loss - - - - 0
Operating Profit Before Provision - - - 21,372 89,419
Provisions for possible losses - - - 6,083 36,960
Operating Profit - - - 15,289 52,459
Non-Operating Income/ Expenses - - - - 67
Return From Loan Loss Provision - - - - 0
Profit From Ordinary activities - - - 15,289 52,526
Extra ordinary Income /Expenses - - - - 0
Net Profit including all activities - - - 15,289 52,526
Provision For Staff Bonus - - - 1,390 4,775
Provision For Income Tax - - - 4,268 17,043
-This Year - - -
-Up to Last Year - - -
Net Profit / Loss - - - 9,631 30,708
Financial Indicators - - -
Core Capital to Risk Weighted Assets - - - 69.29% 34.84%
Capital Fund to Risk Weighted Assets - - - 0.00% 35.69%
Non-Performing Loan to Total Loan - - - 0.00% 0.00%
Weighted Average Interest Spread - - - 3.24% 2.48%
Net Interest Income (Rs. in thousand) - - - 42,452 196,395
Return on Assets - - - 0.41% 0.60%
Credit to Deposit - - - 70.00% 101.00%
Liquid Assets to Total Assets - - - 64.08% 23.95%
Liquid Assets to Total Deposit - - - 175.14% 34.96%

2288.. MMeeggaa BBaannkk LLiimmiitteedd (Rs. 000) Capital and Liabilities FY 2006-07 FY 2007-08 FY 2008-09 FY 2009-10 FY 2010-11
Capital - - - - 1,631,000
Reserves and Surplus - - - - 80,798
Debenture & Bond - - - -
Borrowing - - - - 114,752
Deposit - - - - 5,373,493
Bills Payable - - - - 2,171
Proposed & Payable dividend - - - -
Tax Liabilities - - - - 180
Other Liabilities - - - - 39,335
Total Liabilities - - - - 7,241,729
Cash Balance - - - - 159,914
Balance With NRB - - - - 271,482
Bank Balance With Banks - - - - 58,550
Money At call - - - - 599,000
Investment - - - - 990,169
Loan and Advances - - - - 4,768,297
Fixed Assets - - - - 255,553
Non- Banking Assets - - - -
Other Assets - - - - 138,763
Total Assets - - - - 7,241,729
Interest Income - - - - 544,215
Interest Expenses - - - - 300,760
Net Interest Income - - - - 243,455
Commission and discount - - - - 6,609
Other Operating Income - - - - 27,380
Exchange Income - - - - 7,457
Total Operating Income - - - - 284,902
Employees Expenses - - - - 81,386
Other Operating Expenses - - - - 117,128
Exchange Loss - - - -
Operating Profit Before Provision - - - - 86,387
Provisions for possible losses - - - - 48,165
Operating Profit - - - - 38,222
Non-Operating Income/ Expenses - - - - 0
Return From Loan Loss Provision - - - - 0
Profit From Ordinary activities - - - - 38,222
Extra ordinary Income /Expenses - - - - 0
Net Profit including all activities - - - - 38,222
Provision For Staff Bonus - - - - 3,475
Provision For Income Tax - - - - 10,424
-This Year - - - - 9,172
-Up to Last Year - - - -
Deferred tax
- - - - 1,253
Net Profit / Loss - - - - 24,323
Financial Indicators
Core Capital to Risk Weighted Assets - - - - 18.83%
Capital Fund to Risk Weighted Assets - - - - 19.36%
Non-Performing Loan to Total Loan - - - -
Weighted Average Interest Spread - - - - 2.84%
Net Interest Income (Rs. in thousand) - - - - 243,455
Return on Assets - - - - 0.51%
Credit to Deposit - - - - 89.63%
Liquid Assets to Total Assets - - - - 22.74%
Liquid Assets to Total Deposit - - - - 30.65%

2299.. CCoommmmeerrzz aanndd TTrruusstt BBaannkk NNeeppaall LLiimmiitteedd ((RRss.. 000000)) Capital and Liabilities FY 2006-07 FY 2007-08 FY 2008-09 FY 2009-10 FY 2010-11
Capital - - - - 1,400,000
Reserves and Surplus - - - - 23,333
Debenture & Bond - - - -
Borrowing - - - - 190,307
Deposit - - - - 2,487,864
Bills Payable - - - -
Proposed & Payable dividend - - - -
Tax Liabilities - - - - 4,188
Other Liabilities - - - - 57,646
Total Liabilities 4,163,338
Cash Balance - - - - 61,492
Balance With NRB - - - - 93,642
Bank Balance With Banks - - - - 80,850
Money At call - - - - 558,268
Investment - - - - 700,857
Loan and Advances - - - - 2,466,373
Fixed Assets - - - - 120,012
Non- Banking Assets - - - - Other Assets - - - - 81,844
Total Assets 4,163,338
Interest Income - - - - 270,699
Interest Expenses - - - - 138,311
Net Interest Income 132,388
Commission and discount - - - - 4,524
Other Operating Income - - - - 12,325
Exchange Income - - - - 1,835
Total Operating Income 151,072
Employees Expenses - - - - 34,025
Other Operating Expenses - - - - 53,014
Exchange Loss - - - -
Operating Profit Before Provision 64,033
Provisions for possible losses - - - - 27,613
Operating Profit 36,420
Non-Operating Income/ Expenses - - - -
Return From Loan Loss Provision - - - -
Profit From Ordinary activities 36,420
Extra ordinary Income /Expenses - - - - 0
Net Profit including all activities 36,420
Provision For Staff Bonus - - - - 3,311
Provision For Income Tax - - - -
-This Year - - - - 12,688
-Up to Last Year - - - -
Deferred Tax
- - - - (2,347)
Net Profit / Loss - - - - 22,768
Financial Indicators
Core Capital to Risk Weighted Assets - - - - 26.80%
Capital Fund to Risk Weighted Assets - - - - 27.28%
Non-Performing Loan to Total Loan - - - - 0.00%
Weighted Average Interest Spread - - - - 3.00%
Net Interest Income (Rs. in thousand) - - - - 132,388
Return on Assets - - - - 0.55%
Credit to Deposit - - - - 100.14%
Liquid Assets to Total Assets - - - - 19.08%
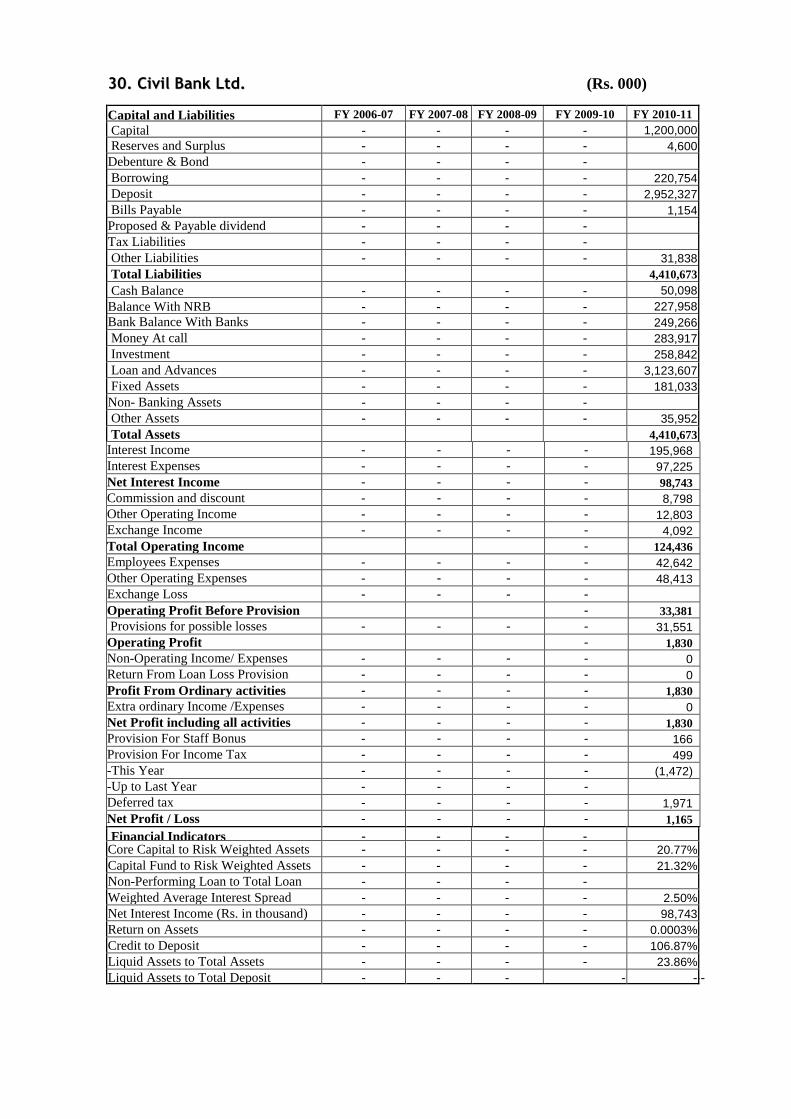
3300.. CCiivviill BBaannkk LLttdd.. (Rs. 000) Capital and Liabilities FY 2006-07 FY 2007-08 FY 2008-09 FY 2009-10 FY 2010-11
Capital - - - - 1,200,000
Reserves and Surplus - - - - 4,600
Debenture & Bond - - - -
Borrowing - - - - 220,754
Deposit - - - - 2,952,327
Bills Payable - - - - 1,154
Proposed & Payable dividend - - - -
Tax Liabilities - - - -
Other Liabilities - - - - 31,838
Total Liabilities 4,410,673
Cash Balance - - - - 50,098
Balance With NRB - - - - 227,958
Bank Balance With Banks - - - - 249,266
Money At call - - - - 283,917
Investment - - - - 258,842
Loan and Advances - - - - 3,123,607
Fixed Assets - - - - 181,033
Non- Banking Assets - - - -
Other Assets - - - - 35,952
Total Assets 4,410,673
Interest Income - - - - 195,968
Interest Expenses - - - - 97,225
Net Interest Income - - - - 98,743
Commission and discount - - - - 8,798
Other Operating Income - - - - 12,803
Exchange Income - - - - 4,092
Total Operating Income - 124,436
Employees Expenses - - - - 42,642
Other Operating Expenses - - - - 48,413
Exchange Loss - - - -
Operating Profit Before Provision - 33,381
Provisions for possible losses - - - - 31,551
Operating Profit - 1,830
Non-Operating Income/ Expenses - - - - 0
Return From Loan Loss Provision - - - - 0
Profit From Ordinary activities - - - - 1,830
Extra ordinary Income /Expenses - - - - 0
Net Profit including all activities - - - - 1,830
Provision For Staff Bonus - - - - 166
Provision For Income Tax - - - - 499
-This Year - - - - (1,472)
-Up to Last Year - - - -
Deferred tax
- - - - 1,971
Net Profit / Loss - - - - 1,165
Financial Indicators - - - -
Core Capital to Risk Weighted Assets - - - - 20.77%
Capital Fund to Risk Weighted Assets - - - - 21.32%
Non-Performing Loan to Total Loan - - - -
Weighted Average Interest Spread - - - - 2.50%
Net Interest Income (Rs. in thousand) - - - - 98,743
Return on Assets - - - - 0.0003%
Credit to Deposit - - - - 106.87%
Liquid Assets to Total Assets - - - - 23.86%
Liquid Assets to Total Deposit - - - - - - -

3311.. CCeennttuurryy BBaannkk LLiimmiitteedd (Rs. 000) Capital and Liabilities FY 2006-07 FY 2007-08 FY 2008-09 FY 2009-10 FY 2010-11
Capital - - - - 1,080,000
Reserves and Surplus - - - - 43,104
Debenture & Bond - - - -
Borrowing - - - - 58,361
Deposit - - - - 1,358,878
Bills Payable - - - -
Proposed & Payable dividend - - - -
Tax Liabilities - - - - 19,874
Other Liabilities - - - - 60,087
Total Liabilities 2,620,304
Cash Balance - - - - 78,170
Balance With NRB - - - -
Bank Balance With Banks - - - -
Money At call - - - - 579,000
Investment - - - - 612,040
Loan and Advances - - - - 1,175,447
Fixed Assets - - - - 94,097
Non- Banking Assets - - - -
Other Assets - - - - 81,550
Total Assets - - - - 2,620,304
Interest Income - - - - 65,675
Interest Expenses - - - - 23,214
Net Interest Income - - - - 42,461
Commission and discount - - - - 537
Other Operating Income - - - - 9,993
Exchange Income - - - - 141
Total Operating Income - - - - 53,132
Employees Expenses - - - - 11,591
Other Operating Expenses - - - - 18,891
Exchange Loss - - - -
Operating Profit Before Provision - - - - 22,650
Provisions for possible losses - - - - 11,873
Operating Profit - - - - 10,777
Non-Operating Income/ Expenses - - - - 24,044
Return From Loan Loss Provision - - - -
Profit From Ordinary activities - - - - 34,821
Extra ordinary Income /Expenses - - - - 0
Net Profit including all activities - - - - 34,821
Provision For Staff Bonus - - - - 3,165
Provision For Income Tax - - - - 9,496
-This Year - - - -
-Up to Last Year - - - -
Net Profit / Loss - - - - 22,160
Financial Indicators - - - -
Core Capital to Risk Weighted Assets - - - - 42.08%
Capital Fund to Risk Weighted Assets - - - - 41.64%
Non-Performing Loan to Total Loan - - - -
Weighted Average Interest Spread - - - - 3.12%
Net Interest Income (Rs. in thousand) - - - - 42,461
Return on Assets - - - - 1.09%
Credit to Deposit - - - - 87.37%
Liquid Assets to Total Assets - - - - 25.08%
Liquid Assets to Total Deposit - - - - 48.36%

CCoonnssoolliiddaatteedd FFiinnaanncciiaallss ooff tthhee PPuubblliicc BBaannkkss ((22001100//1111)) (Rs. 000)
Capital and Liabilities FY 2006-07 FY 2007-08 FY 2008-09 FY 2009-10 FY 2010-11
Capital 9,080,683 12,330,183 12,330,183 10,990,200 11,026,983
Reserves and Surplus (31,274,60)8) (28,463,151) (18,820,214) (13,591,576) (10,247,300)
Debenture & Bond - - - 2,300,000 2,300,000
Borrowing 4,198,418 4,594,471 6,042,523 6,424,453 6,898,914
Deposit 121,894,690 138,724,169 148,514,769 143,225,629 155,122,912
Bills Payable 124,433 120,522 80,621 78,460 0
Proposed & Payable dividend 49,303 57,157 341,025 364,687 276,000
Tax Liabilities 284,744 2,148,912 597,719 1,101,706 1,321,153
Other Liabilities 19,200,987 16,679,077 19,005,570 30,298,231 26,447,887
Total Liabilities 123,558,650 139,045,115 168,092,196 181,191,790 193,146,549
Cash Balance 3,733,381 10,727,750 4,943,703 4,615,081 19,326,365
Balance With NRB 10,934,619 6,237,372 17,750,265 17,374,248 2,553,275
Bank Balance With Banks 1,942,149 1,916,591 3,456,772 3,728,125 674,585
Money At call 381,599 599,995 2,644,198 1,611,342 510,539
Investment 31,899,837 35,771,230 33,709,641 23,345,347 30,258,938
Loan and Advances 55,639,542 65,044,378 76,405,926 87,677,826 98,035,906
Fixed Assets 1,434,141 1,454,230 1,504,935 2,187,450 2,277,897
Non- Banking Assets 110,137 51,453 23,317 634,377 526,078
Other Assets 17,483,245 17,242,116 27,653,440 40,017,994 38,982,966
Total Assets 123,558,650 139,045,115 168,092,196 181,191,790 193,146,549
Interest Income 8,828,648 8,764,801 10,365,389 12,537,567 14,864,265
Interest Expenses 3,321,262 3,439,450 3,016,560 3,659,377 5,997,993
Net Interest Income 5,507,386 5,325,351 7,348,829 8,878,190 8,866,272
Commission and discount 574,398 731,481 940,711 930,688 938,415
Other Operating Income 642,930 665,178 734,564 496,074 651,366
Exchange Income - 131,362 143,403 76,815 (14,433)
Total Operating Income 6,724,714 6,853,372 9,167,507 10,381,767 10,441,620
Employees Expenses 3,221,071 4,071,613 5,516,293 6,875,205 5,697,213
Other Operating Expenses 893,853 876,896 991,022 1,002,668 1,248,635
Exchange Loss 73,273 30,484 - 18,643 1,268
Operating Profit Before Provision 2,536,517 1,874,379 2,660,192 2,485,251 3,494,504
Provisions for possible losses 805,081 3,361,590 3,000,045 2,924,380 2,959,882
Operating Profit 1,731,436 (1,487,211) (339,853) (439,129) 534,622
Non-Operating Income/ Expenses 89,142 100,150 753,402 117,212 237,497
Return From Loan Loss Provision 3,027,818 5,333,130 3,390,263 4,419,864 2,997,181
Profit From Ordinary activities 4,848,396 3,946,069 3,803,811 4,097,947 3,769,300
Extra ordinary Income /Expenses (1,561,970) (880,148) 1,410,249 878,973 772,806
Net Profit including all activities 3,286,426 3,065,921 5,214,060 4,976,920 4,542,106
Provision For Staff Bonus 247,642 232,929 403,811 336,749 345,019
Provision For Income Tax 136,473 155,767 934,713 308,499 458,457
-This Year - 0 0 0 379,232
-Up to Last Year - 0 0 0 0
Net Profit / Loss 2,902,311 2,677,225 3,875,536 4,331,672 4,527,926
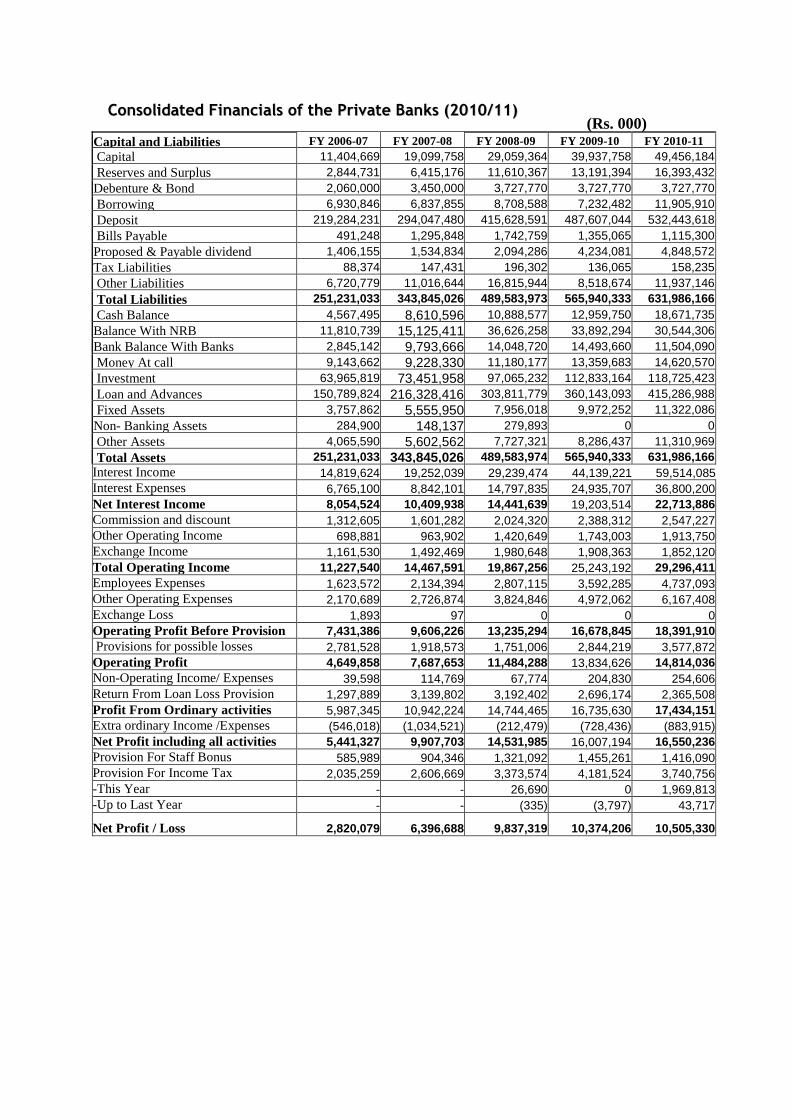
CCoonnssoolliiddaatteedd FFiinnaanncciiaallss ooff tthhee PPrriivvaattee BBaannkkss ((22001100//1111)) (Rs. 000)
Capital and Liabilities FY 2006-07 FY 2007-08 FY 2008-09 FY 2009-10 FY 2010-11
Capital 11,404,669 19,099,758 29,059,364 39,937,758 49,456,184
Reserves and Surplus 2,844,731 6,415,176 11,610,367 13,191,394 16,393,432
Debenture & Bond 2,060,000 3,450,000 3,727,770 3,727,770 3,727,770
Borrowing 6,930,846 6,837,855 8,708,588 7,232,482 11,905,910
Deposit 219,284,231 294,047,480 415,628,591 487,607,044 532,443,618
Bills Payable 491,248 1,295,848 1,742,759 1,355,065 1,115,300
Proposed & Payable dividend 1,406,155 1,534,834 2,094,286 4,234,081 4,848,572
Tax Liabilities 88,374 147,431 196,302 136,065 158,235
Other Liabilities 6,720,779 11,016,644 16,815,944 8,518,674 11,937,146
Total Liabilities 251,231,033 343,845,026 489,583,973 565,940,333 631,986,166
Cash Balance 4,567,495 8,610,596 10,888,577 12,959,750 18,671,735
Balance With NRB 11,810,739 15,125,411 36,626,258 33,892,294 30,544,306
Bank Balance With Banks 2,845,142 9,793,666 14,048,720 14,493,660 11,504,090
Money At call 9,143,662 9,228,330 11,180,177 13,359,683 14,620,570
Investment 63,965,819 73,451,958 97,065,232 112,833,164 118,725,423
Loan and Advances 150,789,824 216,328,416 303,811,779 360,143,093 415,286,988
Fixed Assets 3,757,862 5,555,950 7,956,018 9,972,252 11,322,086
Non- Banking Assets 284,900 148,137 279,893 0 0
Other Assets 4,065,590 5,602,562 7,727,321 8,286,437 11,310,969
Total Assets 251,231,033 343,845,026 489,583,974 565,940,333 631,986,166
Interest Income 14,819,624 19,252,039 29,239,474 44,139,221 59,514,085
Interest Expenses 6,765,100 8,842,101 14,797,835 24,935,707 36,800,200
Net Interest Income 8,054,524 10,409,938 14,441,639 19,203,514 22,713,886
Commission and discount 1,312,605 1,601,282 2,024,320 2,388,312 2,547,227
Other Operating Income 698,881 963,902 1,420,649 1,743,003 1,913,750
Exchange Income 1,161,530 1,492,469 1,980,648 1,908,363 1,852,120
Total Operating Income 11,227,540 14,467,591 19,867,256 25,243,192 29,296,411
Employees Expenses 1,623,572 2,134,394 2,807,115 3,592,285 4,737,093
Other Operating Expenses 2,170,689 2,726,874 3,824,846 4,972,062 6,167,408
Exchange Loss 1,893 97 0 0 0
Operating Profit Before Provision 7,431,386 9,606,226 13,235,294 16,678,845 18,391,910
Provisions for possible losses 2,781,528 1,918,573 1,751,006 2,844,219 3,577,872
Operating Profit 4,649,858 7,687,653 11,484,288 13,834,626 14,814,036
Non-Operating Income/ Expenses 39,598 114,769 67,774 204,830 254,606
Return From Loan Loss Provision 1,297,889 3,139,802 3,192,402 2,696,174 2,365,508
Profit From Ordinary activities 5,987,345 10,942,224 14,744,465 16,735,630 17,434,151
Extra ordinary Income /Expenses (546,018) (1,034,521) (212,479) (728,436) (883,915)
Net Profit including all activities 5,441,327 9,907,703 14,531,985 16,007,194 16,550,236
Provision For Staff Bonus 585,989 904,346 1,321,092 1,455,261 1,416,090
Provision For Income Tax 2,035,259 2,606,669 3,373,574 4,181,524 3,740,756
-This Year - - 26,690 0 1,969,813
-Up to Last Year - - (335) (3,797) 43,717
Net Profit / Loss 2,820,079 6,396,688 9,837,319 10,374,206 10,505,330
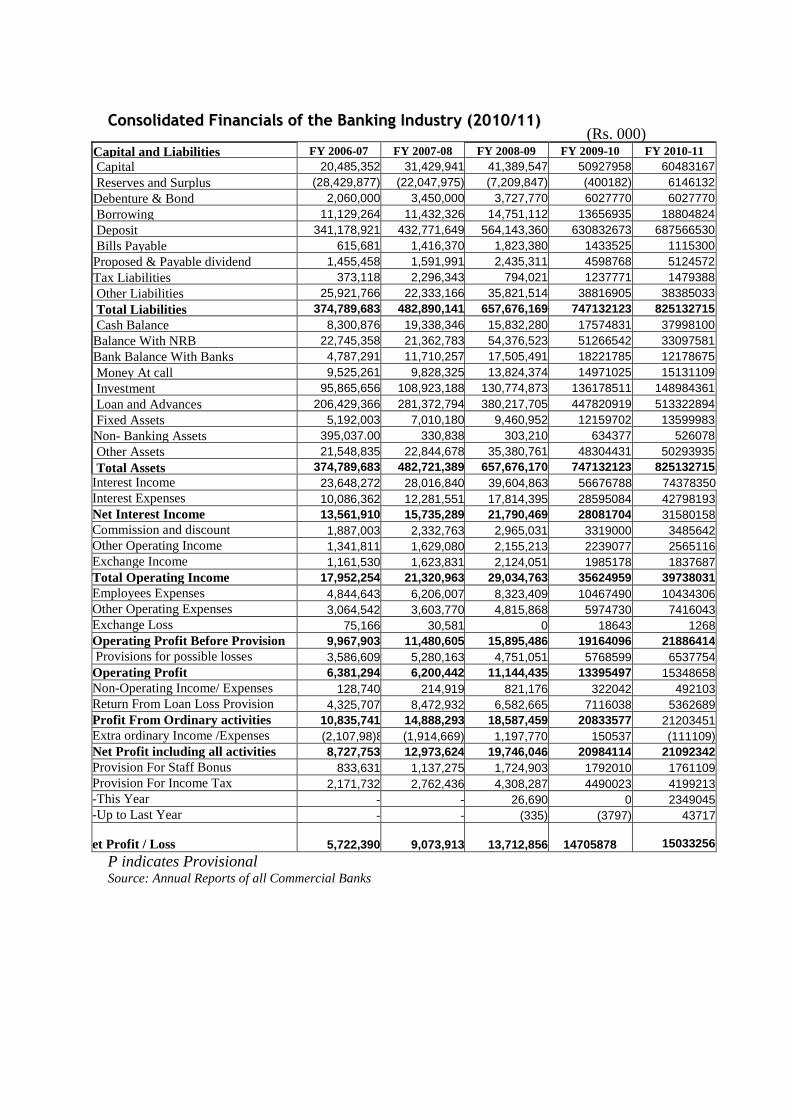
CCoonnssoolliiddaatteedd FFiinnaanncciiaallss ooff tthhee BBaannkkiinngg IInndduussttrryy ((22001100//1111)) (Rs. 000)
Capital and Liabilities FY 2006-07 FY 2007-08 FY 2008-09 FY 2009-10 FY 2010-11
Capital 20,485,352 31,429,941 41,389,547 50927958 60483167
Reserves and Surplus (28,429,877) (22,047,975) (7,209,847) (400182) 6146132
Debenture & Bond 2,060,000 3,450,000 3,727,770 6027770 6027770
Borrowing 11,129,264 11,432,326 14,751,112 13656935 18804824
Deposit 341,178,921 432,771,649 564,143,360 630832673 687566530
Bills Payable 615,681 1,416,370 1,823,380 1433525 1115300
Proposed & Payable dividend 1,455,458 1,591,991 2,435,311 4598768 5124572
Tax Liabilities 373,118 2,296,343 794,021 1237771 1479388
Other Liabilities 25,921,766 22,333,166 35,821,514 38816905 38385033
Total Liabilities 374,789,683 482,890,141 657,676,169 747132123 825132715
Cash Balance 8,300,876 19,338,346 15,832,280 17574831 37998100
Balance With NRB 22,745,358 21,362,783 54,376,523 51266542 33097581
Bank Balance With Banks 4,787,291 11,710,257 17,505,491 18221785 12178675
Money At call 9,525,261 9,828,325 13,824,374 14971025 15131109
Investment 95,865,656 108,923,188 130,774,873 136178511 148984361
Loan and Advances 206,429,366 281,372,794 380,217,705 447820919 513322894
Fixed Assets 5,192,003 7,010,180 9,460,952 12159702 13599983
Non- Banking Assets 395,037.00 330,838 303,210 634377 526078
Other Assets 21,548,835 22,844,678 35,380,761 48304431 50293935
Total Assets 374,789,683 482,721,389 657,676,170 747132123 825132715
Interest Income 23,648,272 28,016,840 39,604,863 56676788 74378350
Interest Expenses 10,086,362 12,281,551 17,814,395 28595084 42798193
Net Interest Income 13,561,910 15,735,289 21,790,469 28081704 31580158
Commission and discount 1,887,003 2,332,763 2,965,031 3319000 3485642
Other Operating Income 1,341,811 1,629,080 2,155,213 2239077 2565116
Exchange Income 1,161,530 1,623,831 2,124,051 1985178 1837687
Total Operating Income 17,952,254 21,320,963 29,034,763 35624959 39738031
Employees Expenses 4,844,643 6,206,007 8,323,409 10467490 10434306
Other Operating Expenses 3,064,542 3,603,770 4,815,868 5974730 7416043
Exchange Loss 75,166 30,581 0 18643 1268
Operating Profit Before Provision 9,967,903 11,480,605 15,895,486 19164096 21886414
Provisions for possible losses 3,586,609 5,280,163 4,751,051 5768599 6537754
Operating Profit 6,381,294 6,200,442 11,144,435 13395497 15348658
Non-Operating Income/ Expenses 128,740 214,919 821,176 322042 492103
Return From Loan Loss Provision 4,325,707 8,472,932 6,582,665 7116038 5362689
Profit From Ordinary activities 10,835,741 14,888,293 18,587,459 20833577 21203451
Extra ordinary Income /Expenses (2,107,98)8) (1,914,669) 1,197,770 150537 (111109)
Net Profit including all activities 8,727,753 12,973,624 19,746,046 20984114 21092342
Provision For Staff Bonus 833,631 1,137,275 1,724,903 1792010 1761109
Provision For Income Tax 2,171,732 2,762,436 4,308,287 4490023 4199213
-This Year - - 26,690 0 2349045
-Up to Last Year - - (335) (3797) 43717
et Profit / Loss 5,722,390 9,073,913 13,712,856 14705878
15033256
P indicates Provisional Source: Annual Reports of all Commercial Banks
Top Related