


Languages
Pages
Legal

Environmentally Harmful Dumping of Inefficient and Obsolete Air Conditioners in Africa Annexes: Room AC Market Profiles for Ten African Countries
June 24, 2020
CLASP

This report has been produced by CLASP, June 2020. Support was given by the Institute for Governance & Sustainable Development
(IGSD).
CLASP makes no representations or warranties implied. The work presented in this report represents our best efforts and judgments
based on the information available at the time this report was prepared. CLASP is not responsible for the reader’s use of, or reliance
upon, the report, nor any decisions based on the report. Readers of the report are advised that they assume all liabilities incurred by
them, or third parties, as a result of their reliance on the report, or the data, information, findings and opinions contained in the report.
List of Figures 1
List of Tables: 4
List of Acronyms 5
Foreword 6
Annex 1 – Algeria Country Profile 7
Market Size & Characteristics 7
Trade Flows 11
Annex 2 – Egypt Country Profile 13
Market Size & Characteristics 13
Trade Flows 16
Annex 3 – Morocco Country Profile 20
Market Size & Characteristics 20
Trade Flows 23
Annex 4 – Tunisia Country Profile 26
Market Size & Characteristics 26
Trade Flows 29
Annex 5 – Ghana Country Profile 33
Market Size & Characteristics 33
Trade Flows 37
Annex 6 – Nigeria Country Profile 39
Market Size & Characteristics 39
Trade Flows 42
Annex 7 – Ethiopia Country Profile 45
Market Size & Characteristics 45
Trade Flows 47
Annex 8 – Kenya Country Profile 49
Market Size & Characteristics 49
Trade Flows 52
Annex 9 – Tanzania Country Profile 55
Market Size & Characteristics 55
Trade Flows 57
Annex 10 – South Africa Country Profile 59
Market Size & Characteristics 59
Trade Flows 62

1
List of Figures
Figure 1: Algeria estimated annual market size projected to 2023 ............................................................... 7 Figure 2: Source countries of RACs in Algeria ............................................................................................. 8 Figure 3: Main RAC brands in Algeria .......................................................................................................... 8 Figure 4: Efficiency levels of RACs in Algeria ............................................................................................... 8 Figure 5: RAC efficiency levels in Algeria by source country ....................................................................... 8 Figure 6: RAC compressor types in Algeria .................................................................................................. 9 Figure 7: RAC efficiency levels in Algeria by compressor type .................................................................... 9 Figure 8: Refrigerants in Algerian RAC market........................................................................................... 10 Figure 9: RAC refrigerants in Morocco by source country .......................................................................... 10 Figure 10: Refrigerant type in RACs in Algeria categorized by compressor type ....................................... 10 Figure 11: Algeria's RAC imports from top 10 trading partners (2014-2017) ............................................. 11 Figure 12: Algeria's RAC exports to top 10 trading partners (2014-2017) .................................................. 11 Figure 13: Algeria's compressor imports from top 10 trading partners (2014-2017) .................................. 12 Figure 14: Algeria's compressor exports (2016-2017) ................................................................................ 12 Figure 15: Algeria's refrigerant imports from top 10 trading partners (2014-2017) .................................... 12 Figure 16: Egypt annual market size projected to 2023 ............................................................................. 13 Figure 17: Source countries of RACs in Egypt ........................................................................................... 14 Figure 18: Main RAC brands in Egypt ........................................................................................................ 14 Figure 19: Efficiency levels of RACs in Egypt ............................................................................................. 14 Figure 20: RAC Efficiency levels in Egypt by source country ..................................................................... 14 Figure 21: Compressor types in RACs in the Egypt market ....................................................................... 15 Figure 22: Efficiency levels categorized by compressor type of RACs in the Egypt market ...................... 15 Figure 23: The Egypt Energy Label ............................................................................................................ 15 Figure 24: Refrigerants in Egyptian RAC market ........................................................................................ 16 Figure 25: Refrigerants in Egypt by compressor type ................................................................................. 16 Figure 26: Refrigerant types of RACs in the Egypt market categorized by compressor type .................... 16 Figure 27: Egypt's RAC imports from top 10 trading partners (2015-2018) ............................................... 17 Figure 28: Egypt's RAC exports to top 10 trading partners (2014-2018) .................................................... 17 Figure 29: Egypt's compressor imports from top 10 trading partners (2014-2018) .................................... 18 Figure 30: Egypt's compressor exports to top 10 trading partners (2014-2018) ........................................ 18 Figure 31: Egypt's refrigerant imports from top 10 trading partners (2014-2018) ...................................... 19 Figure 32: Egypt’s refrigerant exports to top 10 trading partners (2014-2018) ........................................... 19 Figure 33: Morocco annual market size projected to 2023 ......................................................................... 20 Figure 34: Source countries of RACs in Morocco ....................................................................................... 21 Figure 35: Main RAC brands in Morocco .................................................................................................... 21 Figure 36: Efficiency levels of RACs in Morocco ........................................................................................ 21 Figure 37: RAC efficiency levels in Morocco by source country ................................................................. 21 Figure 38: RAC compressor types in the Moroccan market ....................................................................... 22 Figure 39: Efficiency levels categorized by RAC compressor types in the Moroccan market .................... 22 Figure 40: Refrigerants in Moroccan RAC market ...................................................................................... 22 Figure 41: RAC refrigerants in Morocco by source country ........................................................................ 22 Figure 42: Refrigerant type of RACs in the Moroccan market categorized by compressor type ................ 23 Figure 43: Morocco's RAC imports from top 10 trading partners (2014-2017) ........................................... 23 Figure 44: Morocco's RAC exports to top 10 trading partners (2014-2017) ............................................... 23 Figure 45: Morocco’s compressor imports from top 10 trading partners (2014-2017) ............................... 24 Figure 46: Morocco’s compressor exports to top 10 trading partners (2014-2017).................................... 24 Figure 47: Morocco's refrigerant imports from top 10 trading partners (2015-2017) .................................. 25 Figure 48: Morocco's refrigerant exports (2016-2017)................................................................................ 25 Figure 49: Tunisia annual market size projected to 2023 ........................................................................... 26
Figure 50: RAC source countries and popular brands in Tunisia ............................................................... 26 Figure 51: Efficiency levels of RACs in Tunisia .......................................................................................... 27 Figure 52: RAC efficiency levels in Tunisia by source country ................................................................... 27 Figure 53: RAC compressor types in the Tunisian market ......................................................................... 27 Figure 54: Efficiency levels categorized by compressor type in the Tunisian market ................................ 27 Figure 55: Tunisia RAC energy label .......................................................................................................... 28 Figure 56: Refrigerants in RACs in Tunisia ................................................................................................. 28 Figure 57: RAC refrigerants by source country........................................................................................... 28 Figure 58: Refrigerant type of RACs in the Tunisian market categorized by compressor type .................. 29 Figure 59: Tunisia's RAC imports from top 10 trading partners (2014-2017) ............................................. 30 Figure 60: Tunisia's RAC exports to top 10 trading partners (2014-2017) ................................................. 30 Figure 61: Tunisia's compressor imports from top 10 trading partners (2014-2017) .................................. 31 Figure 62: Tunisia's compressor exports to top 10 trading partners (2014-2017) ...................................... 31 Figure 63: Tunisia's refrigerant imports from top 10 trading partners (2014-2017) .................................... 31 Figure 64: Tunisia's refrigerant exports (2015-2017) .................................................................................. 32 Figure 65: Estimated annual RAC market in Ghana ................................................................................... 33 Figure 66: Top 10 RAC source countries in Ghana .................................................................................... 34 Figure 67: Popular RAC brands in Ghana .................................................................................................. 34 Figure 68: Efficiency levels of RACs in Ghana ........................................................................................... 34 Figure 69: RAC compressor type sin the Ghana RAC market ................................................................... 35 Figure 70: Efficiency levels in the Ghana market categorized by RAC compressor type .......................... 35 Figure 71: Ghana energy label ................................................................................................................... 35 Figure 72: Refrigerants found in RACs in Ghana (Source: BSRIA)............................................................ 36 Figure 73: RAC refrigerant in Ghana categorized by compressor type ...................................................... 36 Figure 74: Ghana's RAC imports from top 10 trading partners (2016-2018) .............................................. 37 Figure 75: Ghana's RAC exports to top 10 trading partners (2016-2018) .................................................. 37 Figure 76: Ghana's compressor imports from top 10 trading partners (2016-2018) .................................. 38 Figure 77: Ghana's compressor exports (2016-2018) ................................................................................ 38 Figure 78: Ghana's refrigerant imports from top 10 trading partners (2016-2018) ..................................... 38 Figure 79: Nigeria annual market size projected to 2023 ........................................................................... 39 Figure 80: RAC sources countries in Nigeria .............................................................................................. 40 Figure 81: Popular RAC brands in Nigeria .................................................................................................. 40 Figure 82: Efficiency levels of RACs in Nigeria ........................................................................................... 40 Figure 83: RAC efficiency levels in Nigeria by source country ................................................................... 40 Figure 84: RAC compressor types in the Nigerian market ......................................................................... 41 Figure 85: RAC efficiency levels in Nigeria categorized by compressor type ............................................ 41 Figure 86: Nigerian RAC energy label ........................................................................................................ 41 Figure 87: Refrigerants contained in RACs in the Nigerian market ............................................................ 42 Figure 88: RAC refrigerants in the Nigerian market categorized by compressor type ............................... 42 Figure 89: Nigeria's RAC imports from top 10 trading partners (2014-2018) ............................................. 43 Figure 90: Nigeria's compressor imports from top 10 trading partners (2014-2018) .................................. 43 Figure 91: Nigeria's refrigerant imports from top 10 trading partners (2014-2018) .................................... 44 Figure 92: Ethiopia annual market size projected to 2023 .......................................................................... 45 Figure 93: Source countries for RACs in Ethiopia ...................................................................................... 45 Figure 94: Popular RAC brands in Ethiopia ................................................................................................ 45 Figure 95: Efficiency levels of RACs in Ethiopia ......................................................................................... 46 Figure 96: Efficiency levels in Ethiopia by brand source country ................................................................ 46 Figure 97: Refrigerants in RACs in Ethiopia ............................................................................................... 46 Figure 98: Refrigerants in Ethiopia by brand source country ...................................................................... 46 Figure 99: Ethiopia's RAC imports from top 10 trading partners (2014-2016) ........................................... 47 Figure 100: Ethiopia's RAC exports ............................................................................................................ 47
Figure 101: Ethiopia's compressor imports from top 10 trading partners (2014-2016) .............................. 48 Figure 102: Ethiopia's compressor exports (2014-2016) ............................................................................ 48 Figure 103: Ethiopia's refrigerant imports from top 10 trading partners (2014-2016) ................................. 48 Figure 104: Estimated annual sales projected to 2023 and imports from 2012 – 2017 ............................. 49 Figure 105: Popular RAC brands in the Kenyan market (based on sales) ................................................. 49 Figure 106: Efficiency levels of RACs in Kenya .......................................................................................... 50 Figure 107: Efficiency levels in Kenya by source country ........................................................................... 50 Figure 108: Efficiency levels categorized according to RAC compressor types in the Kenyan market ..... 50 Figure 109: Refrigerants in Kenyan RAC market ....................................................................................... 51 Figure 110: RAC refrigerants in Kenya by source country ......................................................................... 51 Figure 111: RAC refrigerant type categorized by compressor type ............................................................ 51 Figure 112: Kenya's RAC imports from top 10 trading partners (2017-2018) ............................................ 52 Figure 113: Kenya's RAC exports (2017-2018) .......................................................................................... 52 Figure 114: Kenya's compressor imports from top 10 trading partners (2017-2018) ................................. 53 Figure 115: Kenya's compressor exports.................................................................................................... 53 Figure 116: Kenya's refrigerant imports (2017-2018) ................................................................................. 53 Figure 117: Kenya's refrigerant exports (2017-2018) ................................................................................. 54 Figure 118: Tanzania RAC market size projected to 2023 ......................................................................... 55 Figure 119: Source countries for RACs in Tanzania .................................................................................. 55 Figure 120: RAC brands in Tanzania .......................................................................................................... 55 Figure 121: Efficiency levels of RACs in Tanzania ..................................................................................... 56 Figure 122: Efficiency levels in Tanzania by brand source country ............................................................ 56 Figure 123: Refrigerants in RACs in Tanzania ........................................................................................... 56 Figure 124: RAC refrigerants in Tanzania by source country ..................................................................... 56 Figure 125: Tanzania's RAC imports from top 10 trading partners (2014-2018) ........................................ 57 Figure 126: Tanzania's RAC exports (2014-2018) ..................................................................................... 57 Figure 127: Tanzania's compressor imports from top 10 trading partners (2014-2018) ............................ 58 Figure 128: Tanzania's compressor exports to top 10 trading partners (2014-2018) ................................. 58 Figure 129: Tanzania's refrigerant imports (2014-2018)............................................................................. 58 Figure 130: South Africa annual market size projected to 2023 ................................................................. 59 Figure 131: Source countries for RACs in South Africa .............................................................................. 59 Figure 132: RAC brands in South Africa ..................................................................................................... 59 Figure 133: Energy efficiency levels of RACs in South African market ...................................................... 60 Figure 134: RAC compressor types in the South African market ............................................................... 61 Figure 135: Energy efficiency levels categorized by compressor type ....................................................... 61 Figure 136: South Africa energy label for RACs ......................................................................................... 61 Figure 137: Refrigerants in RACs in South African market ........................................................................ 62 Figure 138: RAC refrigerant types in the South African market categorized by compressor type ............. 62 Figure 139: South Africa's RAC imports from top 10 trading partners (2016-2018) ................................... 63 Figure 140: South Africa's RAC exports ..................................................................................................... 63 Figure 141: South Africa's compressor imports from top 10 trading partners (2016-2018) ........................ 64 Figure 142: South Africa's compressor exports to top 10 trading partners (2016-2018) ............................ 64 Figure 143: South Africa's refrigerant imports (2014-2018) ........................................................................ 64 Figure 144: South Africa's refrigerant exports (2014-2018) ........................................................................ 65
List of Tables:
Table 1: Ghana minimum energy performance standards for non-ducted air conditioners ....................... 35 Table 2: Kenya energy performance standards for split RACs ................................................................... 51
List of Acronyms
AMU Arab Maghreb Union
BSRIA Building Services Research and Information Association
CAGR compound annual growth rate
CFC chlorofluorocarbon
COMESA Common Market for Eastern and Southern Africa
CSPF cooling seasonal performance factor
ECOWAS Economic Community of West African States
EER energy efficiency ratio
GHG greenhouse gas
GWh Gigawatt hour
GWP Global warming potential
HCFC hydrochlorofluorocarbon
HFC hydrofluorocarbon
IGSD Institute for Governance and Sustainable Development
JRAIA Japan Refrigeration and Air Conditioning Industry Association
JV joint venture
kg kilogram
kW kilowatt
kWh kilowatt hour
MEPS minimum energy performance standard
MP Montreal Protocol
MT CO2e megatonnes of carbon dioxide equivalent
ODS ozone depleting substance
PAMS CLASP's Policy Analysis Modeling System
RAC room air conditioner
SADC Southern African Development Community
SEER seasonal energy efficiency ratio
T&D transmission and distribution
U4E United for Efficiency
UAE United Arab Emirates
UEC unit energy consumption
US United States
W watt

6
Foreword
These annexes contains analysis of room air conditioner markets in ten African countries. The information
presented herein was collected by CLASP as part of the research process for the Environmentally Harmful
Dumping of Inefficient and Obsolete Air Conditioners in Africa report. For further information on the
methodologies employed to collect the country-level data in the annexes, please refer to the full report at
CLASP.ngo
7
Annex 1 – Algeria Country Profile
Market Size & Characteristics
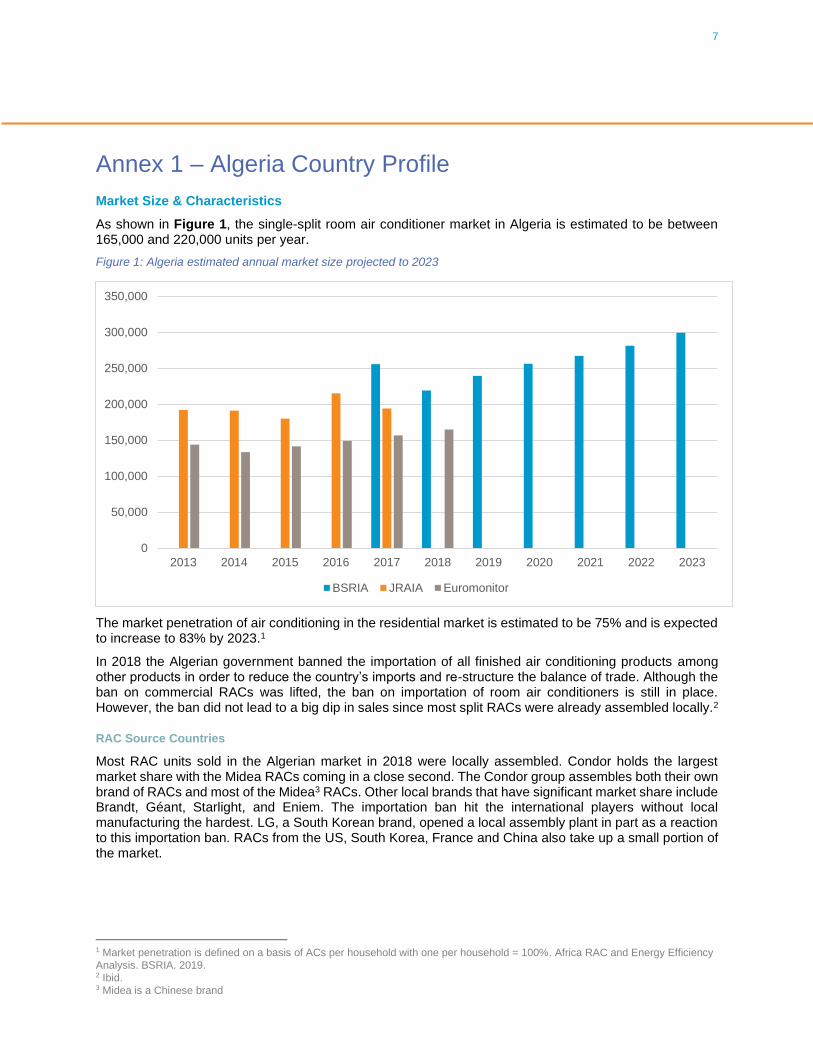
As shown in Figure 1, the single-split room air conditioner market in Algeria is estimated to be between 165,000 and 220,000 units per year.
Figure 1: Algeria estimated annual market size projected to 2023
The market penetration of air conditioning in the residential market is estimated to be 75% and is expected to increase to 83% by 2023.1
In 2018 the Algerian government banned the importation of all finished air conditioning products among other products in order to reduce the country’s imports and re-structure the balance of trade. Although the ban on commercial RACs was lifted, the ban on importation of room air conditioners is still in place. However, the ban did not lead to a big dip in sales since most split RACs were already assembled locally.2
RAC Source Countries
Most RAC units sold in the Algerian market in 2018 were locally assembled. Condor holds the largest market share with the Midea RACs coming in a close second. The Condor group assembles both their own brand of RACs and most of the Midea3 RACs. Other local brands that have significant market share include Brandt, Géant, Starlight, and Eniem. The importation ban hit the international players without local manufacturing the hardest. LG, a South Korean brand, opened a local assembly plant in part as a reaction to this importation ban. RACs from the US, South Korea, France and China also take up a small portion of the market.
1 Market penetration is defined on a basis of ACs per household with one per household = 100%. Africa RAC and Energy Efficiency
Analysis. BSRIA. 2019. 2 Ibid. 3 Midea is a Chinese brand
0
50,000
100,000
150,000
200,000
250,000
300,000
350,000
2013 2014 2015 2016 2017 2018 2019 2020 2021 2022 2023
BSRIA JRAIA Euromonitor
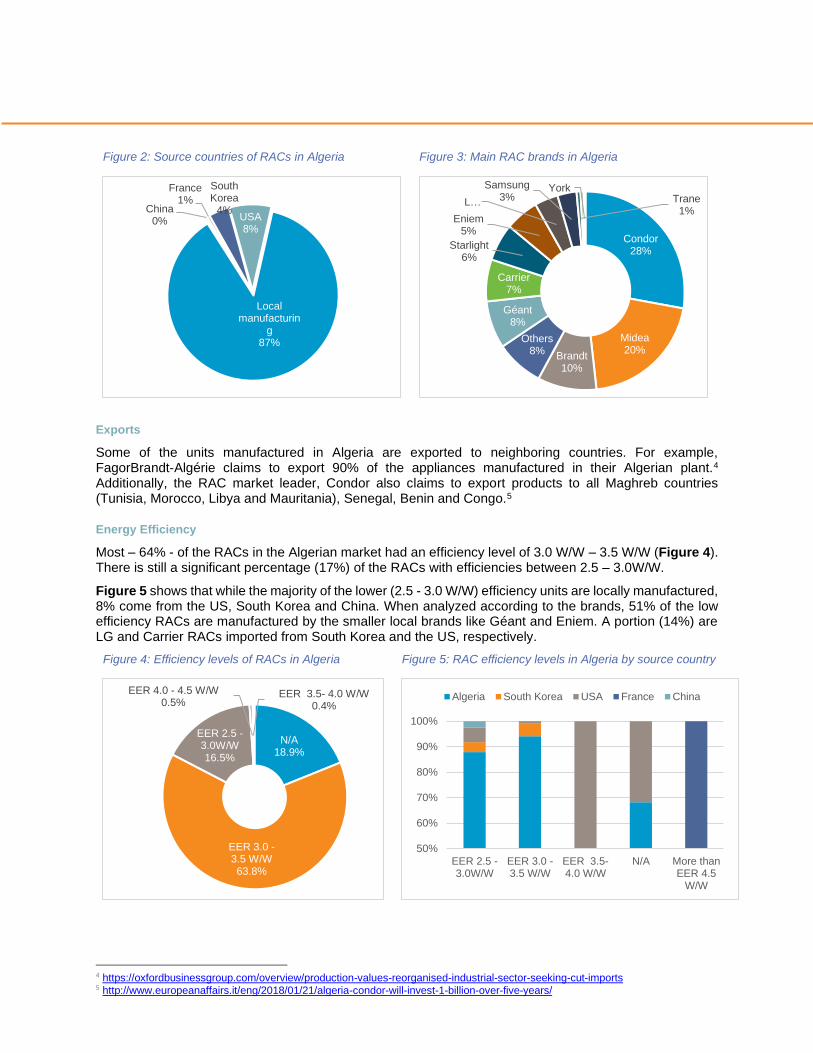
Figure 2: Source countries of RACs in Algeria
Figure 3: Main RAC brands in Algeria
Exports
Some of the units manufactured in Algeria are exported to neighboring countries. For example, FagorBrandt-Algérie claims to export 90% of the appliances manufactured in their Algerian plant.4 Additionally, the RAC market leader, Condor also claims to export products to all Maghreb countries (Tunisia, Morocco, Libya and Mauritania), Senegal, Benin and Congo.5
Energy Efficiency
Most – 64% - of the RACs in the Algerian market had an efficiency level of 3.0 W/W – 3.5 W/W (Figure 4). There is still a significant percentage (17%) of the RACs with efficiencies between 2.5 – 3.0W/W.
Figure 5 shows that while the majority of the lower (2.5 - 3.0 W/W) efficiency units are locally manufactured, 8% come from the US, South Korea and China. When analyzed according to the brands, 51% of the low efficiency RACs are manufactured by the smaller local brands like Géant and Eniem. A portion (14%) are LG and Carrier RACs imported from South Korea and the US, respectively.
Figure 4: Efficiency levels of RACs in Algeria
Figure 5: RAC efficiency levels in Algeria by source country
4 https://oxfordbusinessgroup.com/overview/production-values-reorganised-industrial-sector-seeking-cut-imports 5 http://www.europeanaffairs.it/eng/2018/01/21/algeria-condor-will-invest-1-billion-over-five-years/
Local manufacturin
g87%
China0%
France1%
South Korea
4%USA8%
Condor28%
Midea20%
Brandt10%
Others8%
Géant8%
Carrier7%
Starlight6%
Eniem5%
L…
Samsung3% Trane
1%
York
N/A18.9%
EER 3.0 -3.5 W/W63.8%
EER 2.5 -3.0W/W16.5%
EER 4.0 - 4.5 W/W0.5%
EER 3.5- 4.0 W/W0.4%
50%
60%
70%
80%
90%
100%
EER 2.5 -3.0W/W
EER 3.0 -3.5 W/W
EER 3.5-4.0 W/W
N/A More thanEER 4.5
W/W
Algeria South Korea USA France China
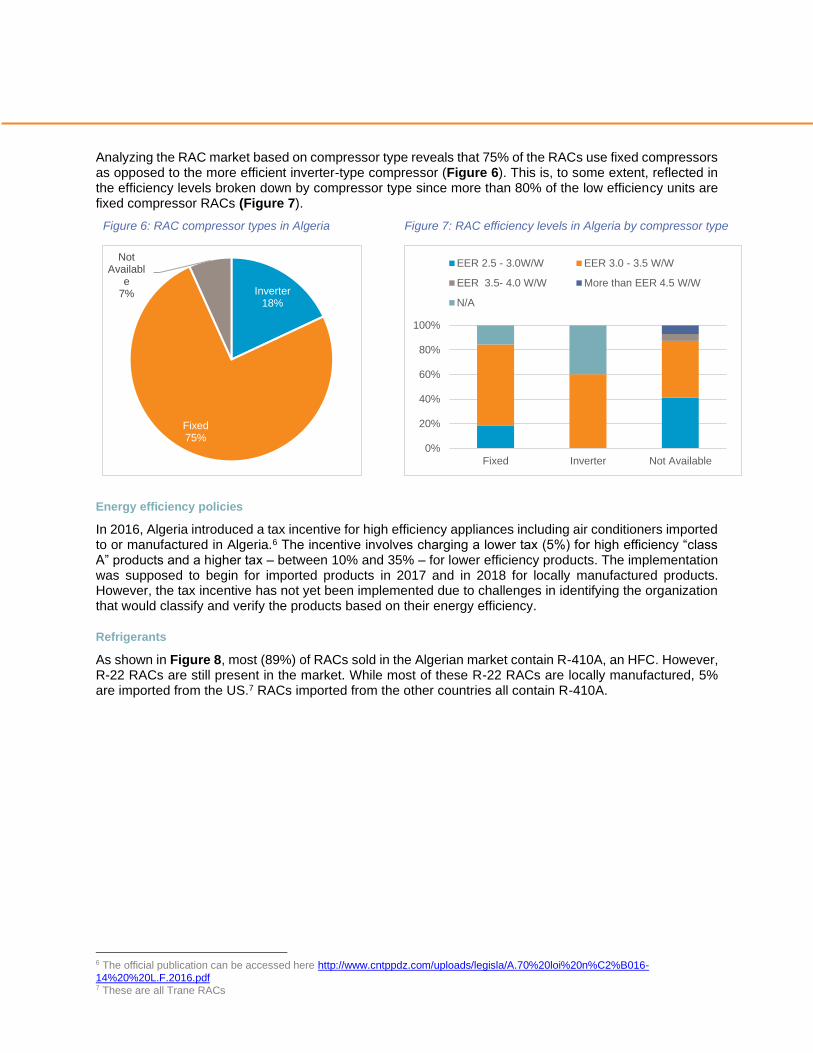
Analyzing the RAC market based on compressor type reveals that 75% of the RACs use fixed compressors as opposed to the more efficient inverter-type compressor (Figure 6). This is, to some extent, reflected in the efficiency levels broken down by compressor type since more than 80% of the low efficiency units are fixed compressor RACs (Figure 7).
Figure 6: RAC compressor types in Algeria
Figure 7: RAC efficiency levels in Algeria by compressor type
Energy efficiency policies
In 2016, Algeria introduced a tax incentive for high efficiency appliances including air conditioners imported to or manufactured in Algeria.6 The incentive involves charging a lower tax (5%) for high efficiency “class A” products and a higher tax – between 10% and 35% – for lower efficiency products. The implementation was supposed to begin for imported products in 2017 and in 2018 for locally manufactured products. However, the tax incentive has not yet been implemented due to challenges in identifying the organization that would classify and verify the products based on their energy efficiency.
Refrigerants
As shown in Figure 8, most (89%) of RACs sold in the Algerian market contain R-410A, an HFC. However, R-22 RACs are still present in the market. While most of these R-22 RACs are locally manufactured, 5% are imported from the US.7 RACs imported from the other countries all contain R-410A.
6 The official publication can be accessed here http://www.cntppdz.com/uploads/legisla/A.70%20loi%20n%C2%B016-
14%20%20L.F.2016.pdf 7 These are all Trane RACs
Inverter18%
Fixed75%
Not Availabl
e7%
0%
20%
40%
60%
80%
100%
Fixed Inverter Not Available
EER 2.5 - 3.0W/W EER 3.0 - 3.5 W/W
EER 3.5- 4.0 W/W More than EER 4.5 W/W
N/A

Figure 8: Refrigerants in Algerian RAC market
Figure 9: RAC refrigerants in Morocco by source country
When the refrigerant type is analyzed based on the RAC compressor types, 14% pf the RACs with fixed compressors contain R-22 while all the inverter units with data available contain R-410A (Figure 10).
Figure 10: Refrigerant type in RACs in Algeria categorized by compressor type
R-2211%
R-410A89%
75%
80%
85%
90%
95%
100%
R-22 R-410A
Algeria China France South Korea USA
0%
20%
40%
60%
80%
100%
R-22 R-410A
Fixed Inverter Not Available
Trade Flows
CLASP used Comtrade data to assess Algeria’s imports and exports of RAC units, compressors, and three refrigerants commonly found in RACs imported to or manufactured in Africa, R-22, R-410A, and R-32.
RACs
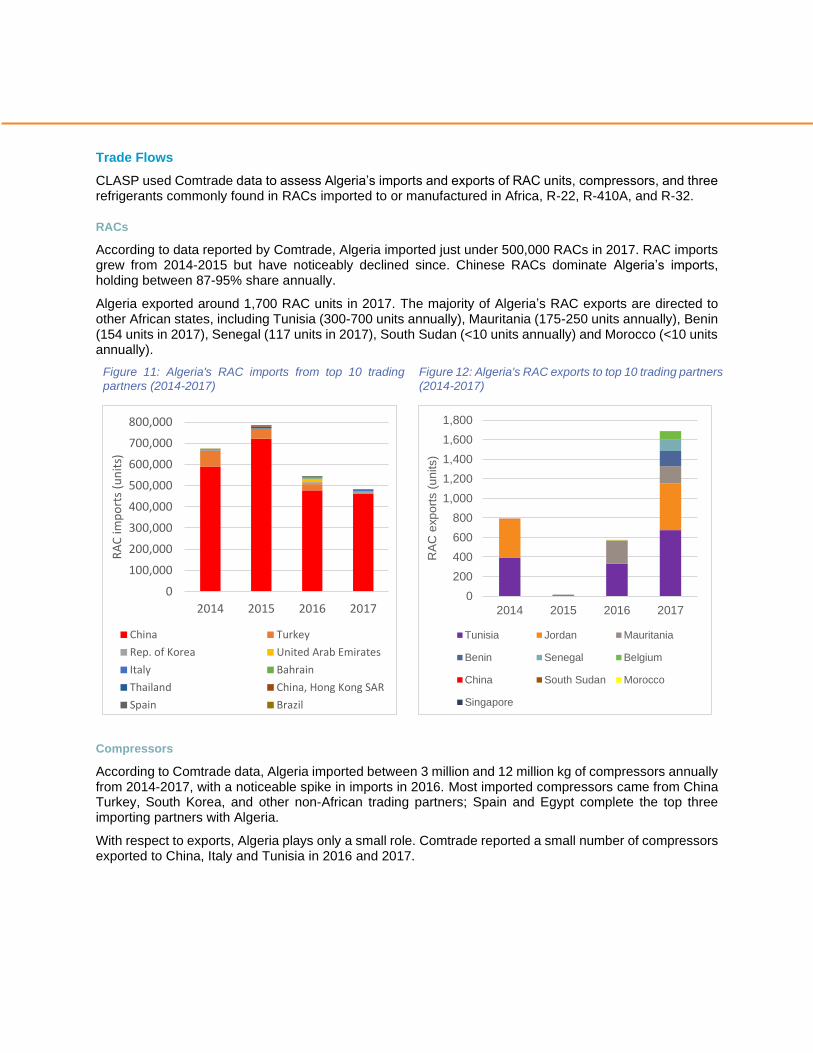
According to data reported by Comtrade, Algeria imported just under 500,000 RACs in 2017. RAC imports grew from 2014-2015 but have noticeably declined since. Chinese RACs dominate Algeria’s imports, holding between 87-95% share annually.
Algeria exported around 1,700 RAC units in 2017. The majority of Algeria’s RAC exports are directed to other African states, including Tunisia (300-700 units annually), Mauritania (175-250 units annually), Benin (154 units in 2017), Senegal (117 units in 2017), South Sudan (<10 units annually) and Morocco (<10 units annually).
Figure 11: Algeria's RAC imports from top 10 trading
partners (2014-2017)
Figure 12: Algeria's RAC exports to top 10 trading partners
(2014-2017)
Compressors
According to Comtrade data, Algeria imported between 3 million and 12 million kg of compressors annually from 2014-2017, with a noticeable spike in imports in 2016. Most imported compressors came from China Turkey, South Korea, and other non-African trading partners; Spain and Egypt complete the top three importing partners with Algeria.
With respect to exports, Algeria plays only a small role. Comtrade reported a small number of compressors exported to China, Italy and Tunisia in 2016 and 2017.
0
100,000
200,000
300,000
400,000
500,000
600,000
700,000
800,000
2014 2015 2016 2017
RA
C im
po
rts
(un
its)
China Turkey
Rep. of Korea United Arab Emirates
Italy Bahrain
Thailand China, Hong Kong SAR
Spain Brazil
0
200
400
600
800
1,000
1,200
1,400
1,600
1,800
2014 2015 2016 2017
RA
C e
xp
ort
s (
un
its)
Tunisia Jordan Mauritania
Benin Senegal Belgium
China South Sudan Morocco
Singapore
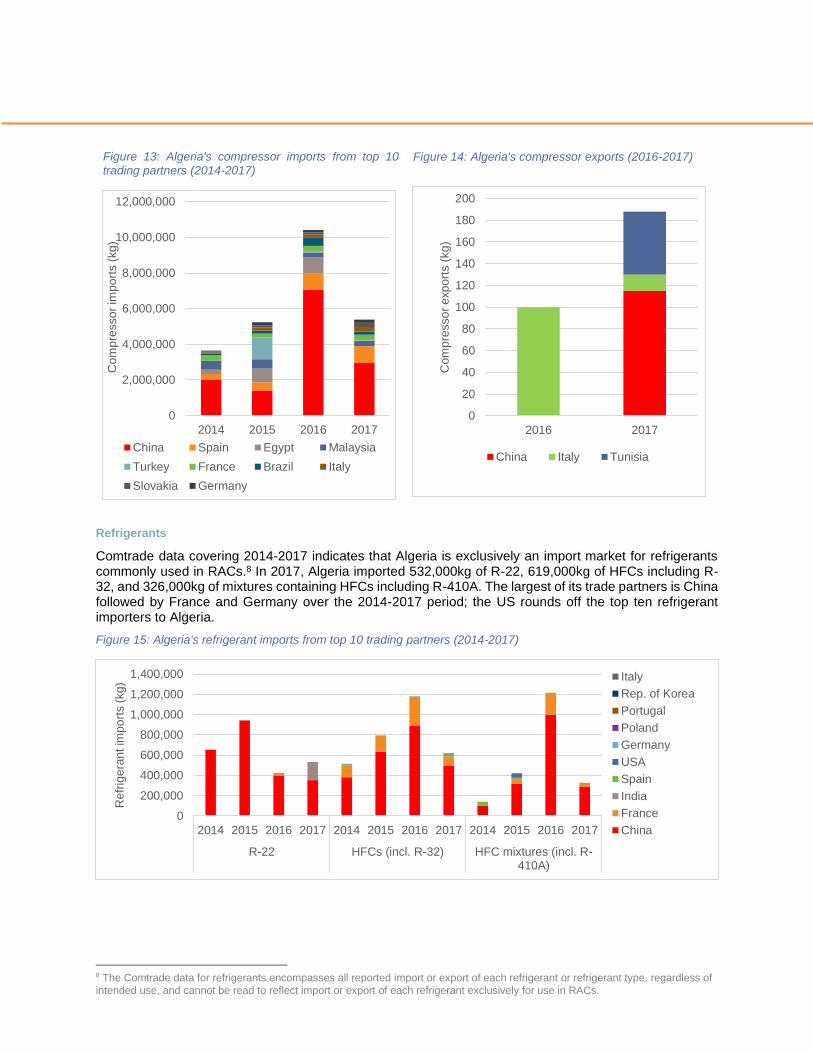
Figure 13: Algeria's compressor imports from top 10 trading partners (2014-2017)
Figure 14: Algeria's compressor exports (2016-2017)
Refrigerants
Comtrade data covering 2014-2017 indicates that Algeria is exclusively an import market for refrigerants commonly used in RACs.8 In 2017, Algeria imported 532,000kg of R-22, 619,000kg of HFCs including R-32, and 326,000kg of mixtures containing HFCs including R-410A. The largest of its trade partners is China followed by France and Germany over the 2014-2017 period; the US rounds off the top ten refrigerant importers to Algeria.
Figure 15: Algeria's refrigerant imports from top 10 trading partners (2014-2017)
8 The Comtrade data for refrigerants encompasses all reported import or export of each refrigerant or refrigerant type, regardless of
intended use, and cannot be read to reflect import or export of each refrigerant exclusively for use in RACs.
0
2,000,000
4,000,000
6,000,000
8,000,000
10,000,000
12,000,000
2014 2015 2016 2017
Co
mp
resso
r im
po
rts (
kg
)
China Spain Egypt Malaysia
Turkey France Brazil Italy
Slovakia Germany
0
20
40
60
80
100
120
140
160
180
200
2016 2017
Co
mp
resso
r e
xp
ort
s (
kg
)China Italy Tunisia
0
200,000
400,000
600,000
800,000
1,000,000
1,200,000
1,400,000
2014 2015 2016 2017 2014 2015 2016 2017 2014 2015 2016 2017
R-22 HFCs (incl. R-32) HFC mixtures (incl. R-410A)
Refr
ige
ran
t im
po
rts (
kg
)
Italy
Rep. of Korea
Portugal
Poland
Germany
USA
Spain
India
France
China
Annex 2 – Egypt Country Profile
Market Size & Characteristics
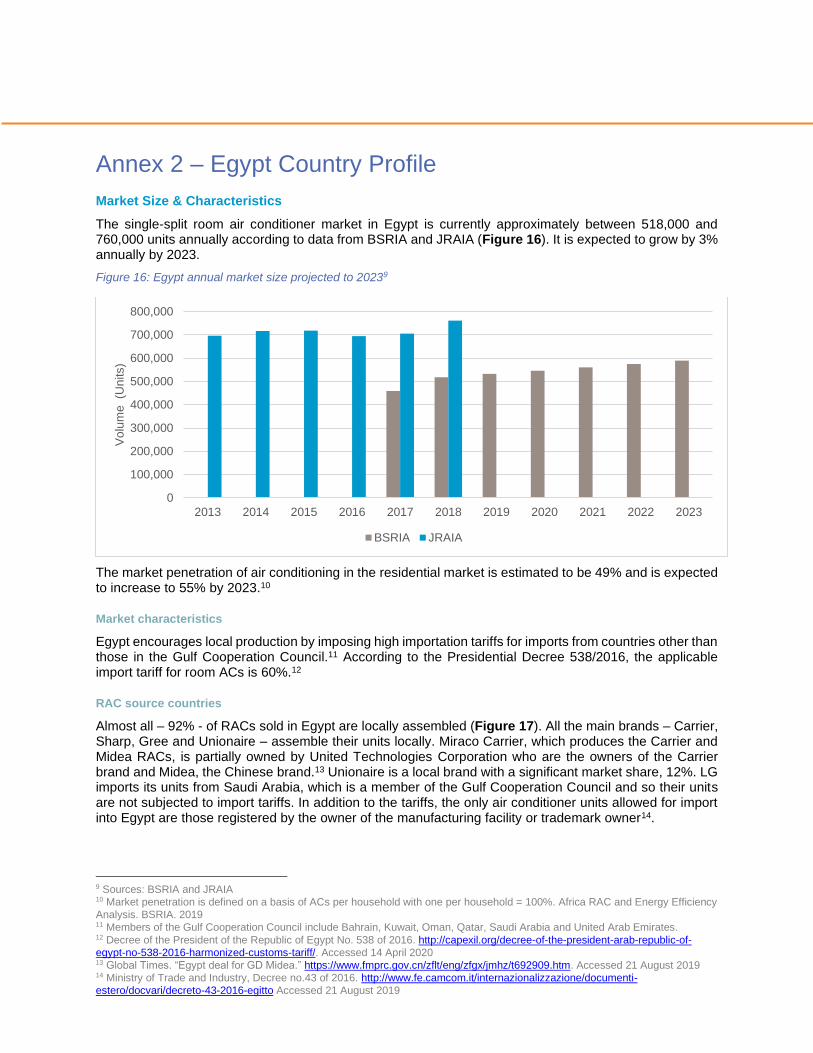
The single-split room air conditioner market in Egypt is currently approximately between 518,000 and 760,000 units annually according to data from BSRIA and JRAIA (Figure 16). It is expected to grow by 3% annually by 2023.
Figure 16: Egypt annual market size projected to 20239
The market penetration of air conditioning in the residential market is estimated to be 49% and is expected to increase to 55% by 2023.10
Market characteristics
Egypt encourages local production by imposing high importation tariffs for imports from countries other than those in the Gulf Cooperation Council.11 According to the Presidential Decree 538/2016, the applicable import tariff for room ACs is 60%.12
RAC source countries
Almost all – 92% - of RACs sold in Egypt are locally assembled (Figure 17). All the main brands – Carrier, Sharp, Gree and Unionaire – assemble their units locally. Miraco Carrier, which produces the Carrier and Midea RACs, is partially owned by United Technologies Corporation who are the owners of the Carrier brand and Midea, the Chinese brand.13 Unionaire is a local brand with a significant market share, 12%. LG imports its units from Saudi Arabia, which is a member of the Gulf Cooperation Council and so their units are not subjected to import tariffs. In addition to the tariffs, the only air conditioner units allowed for import into Egypt are those registered by the owner of the manufacturing facility or trademark owner14.
9 Sources: BSRIA and JRAIA 10 Market penetration is defined on a basis of ACs per household with one per household = 100%. Africa RAC and Energy Efficiency
Analysis. BSRIA. 2019 11 Members of the Gulf Cooperation Council include Bahrain, Kuwait, Oman, Qatar, Saudi Arabia and United Arab Emirates. 12 Decree of the President of the Republic of Egypt No. 538 of 2016. http://capexil.org/decree-of-the-president-arab-republic-of-
egypt-no-538-2016-harmonized-customs-tariff/. Accessed 14 April 2020 13 Global Times. “Egypt deal for GD Midea.” https://www.fmprc.gov.cn/zflt/eng/zfgx/jmhz/t692909.htm. Accessed 21 August 2019 14 Ministry of Trade and Industry, Decree no.43 of 2016. http://www.fe.camcom.it/internazionalizzazione/documenti-
estero/docvari/decreto-43-2016-egitto Accessed 21 August 2019
0
100,000
200,000
300,000
400,000
500,000
600,000
700,000
800,000
2013 2014 2015 2016 2017 2018 2019 2020 2021 2022 2023
Vo
lum
e (U
nits)
BSRIA JRAIA
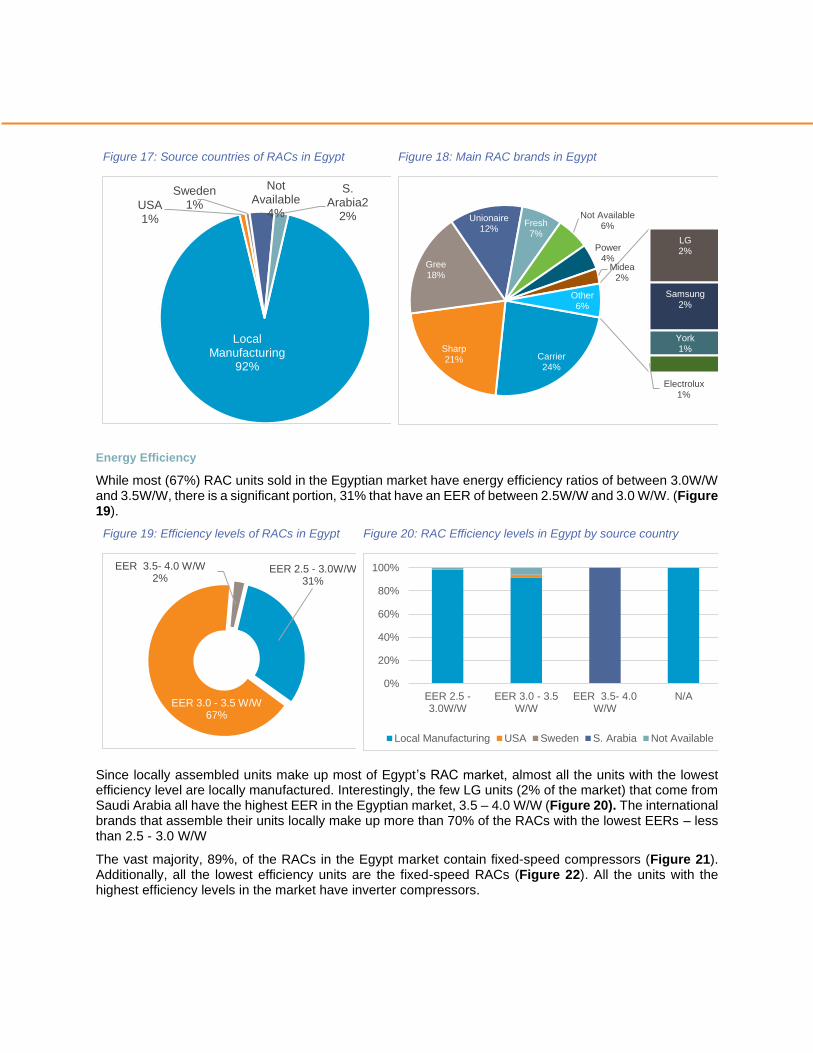
Figure 17: Source countries of RACs in Egypt
Figure 18: Main RAC brands in Egypt
Energy Efficiency
While most (67%) RAC units sold in the Egyptian market have energy efficiency ratios of between 3.0W/W and 3.5W/W, there is a significant portion, 31% that have an EER of between 2.5W/W and 3.0 W/W. (Figure 19).
Figure 19: Efficiency levels of RACs in Egypt
Figure 20: RAC Efficiency levels in Egypt by source country
Since locally assembled units make up most of Egypt’s RAC market, almost all the units with the lowest efficiency level are locally manufactured. Interestingly, the few LG units (2% of the market) that come from Saudi Arabia all have the highest EER in the Egyptian market, 3.5 – 4.0 W/W (Figure 20). The international brands that assemble their units locally make up more than 70% of the RACs with the lowest EERs – less than 2.5 - 3.0 W/W
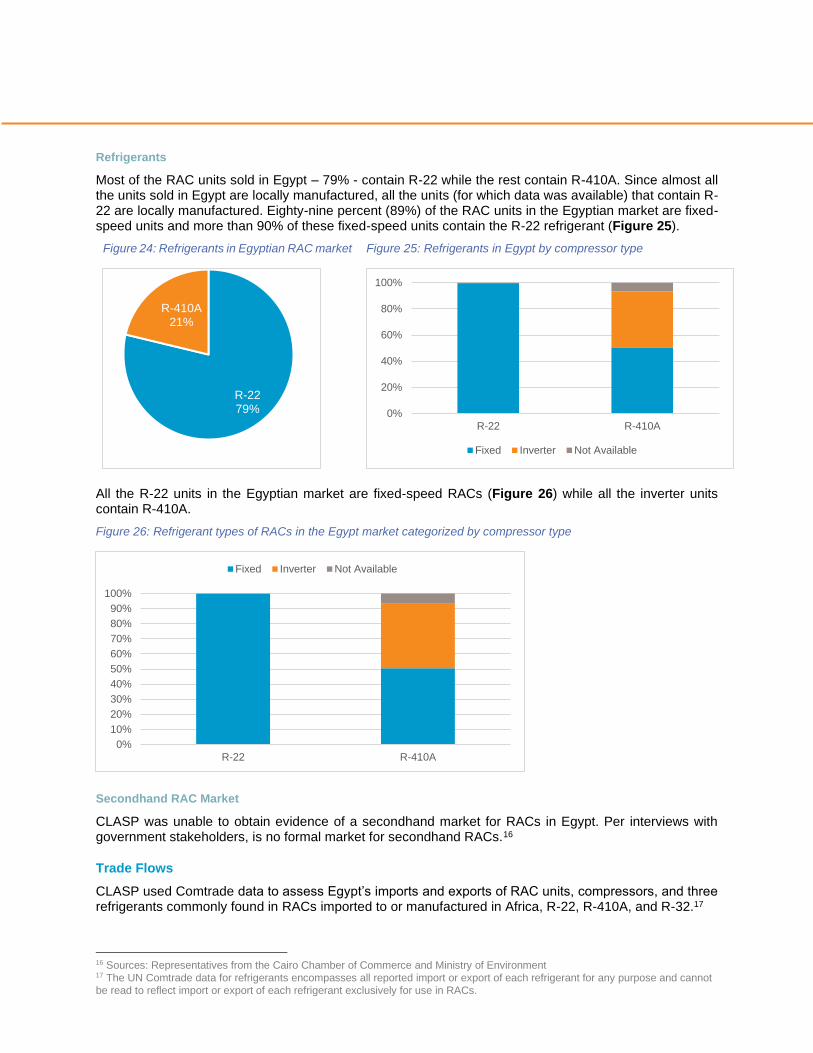
The vast majority, 89%, of the RACs in the Egypt market contain fixed-speed compressors (Figure 21). Additionally, all the lowest efficiency units are the fixed-speed RACs (Figure 22). All the units with the highest efficiency levels in the market have inverter compressors.
Local Manufacturing
92%
USA1%
Sweden1%
Not Available
4%
S. Arabia2
2%
Carrier24%
Sharp21%
Gree18%
Unionaire12%
Fresh7%
Not Available6%
Power4%
Midea2%
LG2%
Samsung2%
York1%
Electrolux1%
Other6%
EER 2.5 - 3.0W/W31%
EER 3.0 - 3.5 W/W67%
EER 3.5- 4.0 W/W2%
0%
20%
40%
60%
80%
100%
EER 2.5 -3.0W/W
EER 3.0 - 3.5W/W
EER 3.5- 4.0W/W
N/A
Local Manufacturing USA Sweden S. Arabia Not Available
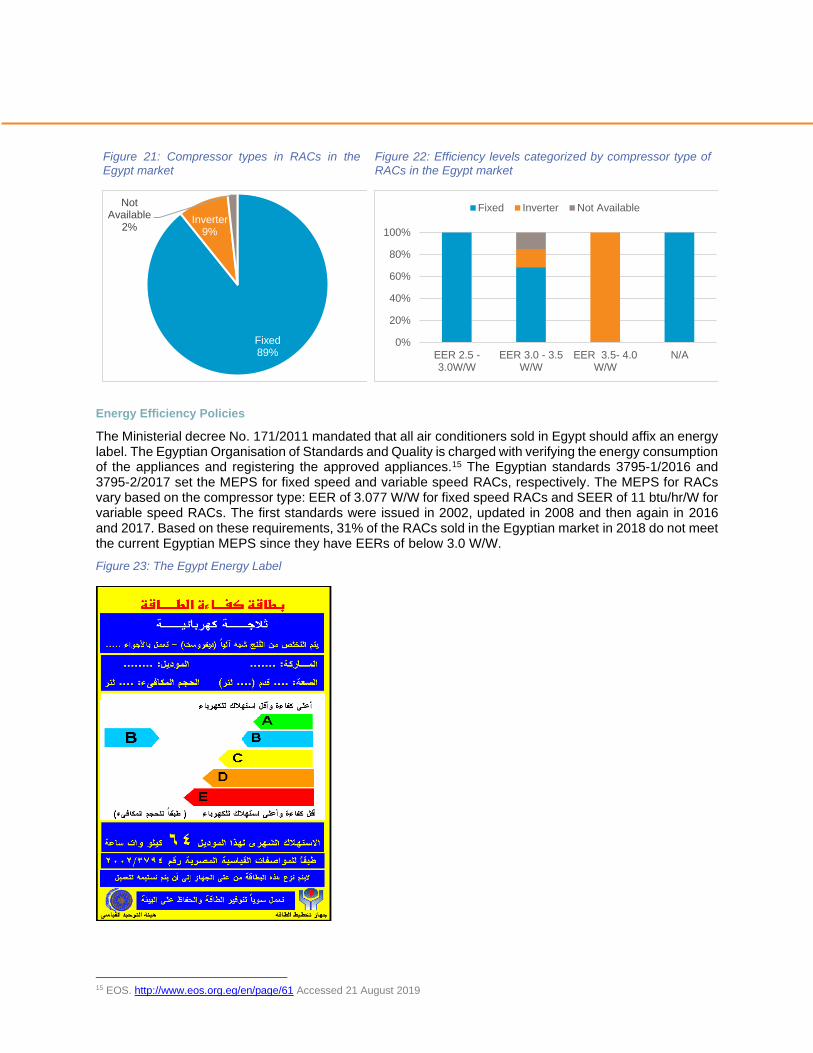
Figure 21: Compressor types in RACs in the Egypt market
Figure 22: Efficiency levels categorized by compressor type of RACs in the Egypt market
Energy Efficiency Policies
The Ministerial decree No. 171/2011 mandated that all air conditioners sold in Egypt should affix an energy label. The Egyptian Organisation of Standards and Quality is charged with verifying the energy consumption of the appliances and registering the approved appliances.15 The Egyptian standards 3795-1/2016 and 3795-2/2017 set the MEPS for fixed speed and variable speed RACs, respectively. The MEPS for RACs vary based on the compressor type: EER of 3.077 W/W for fixed speed RACs and SEER of 11 btu/hr/W for variable speed RACs. The first standards were issued in 2002, updated in 2008 and then again in 2016 and 2017. Based on these requirements, 31% of the RACs sold in the Egyptian market in 2018 do not meet the current Egyptian MEPS since they have EERs of below 3.0 W/W.
Figure 23: The Egypt Energy Label
15 EOS. http://www.eos.org.eg/en/page/61 Accessed 21 August 2019
Fixed89%
Inverter9%
Not Available
2%
0%
20%
40%
60%
80%
100%
EER 2.5 -3.0W/W
EER 3.0 - 3.5W/W
EER 3.5- 4.0W/W
N/A
Fixed Inverter Not Available
Refrigerants
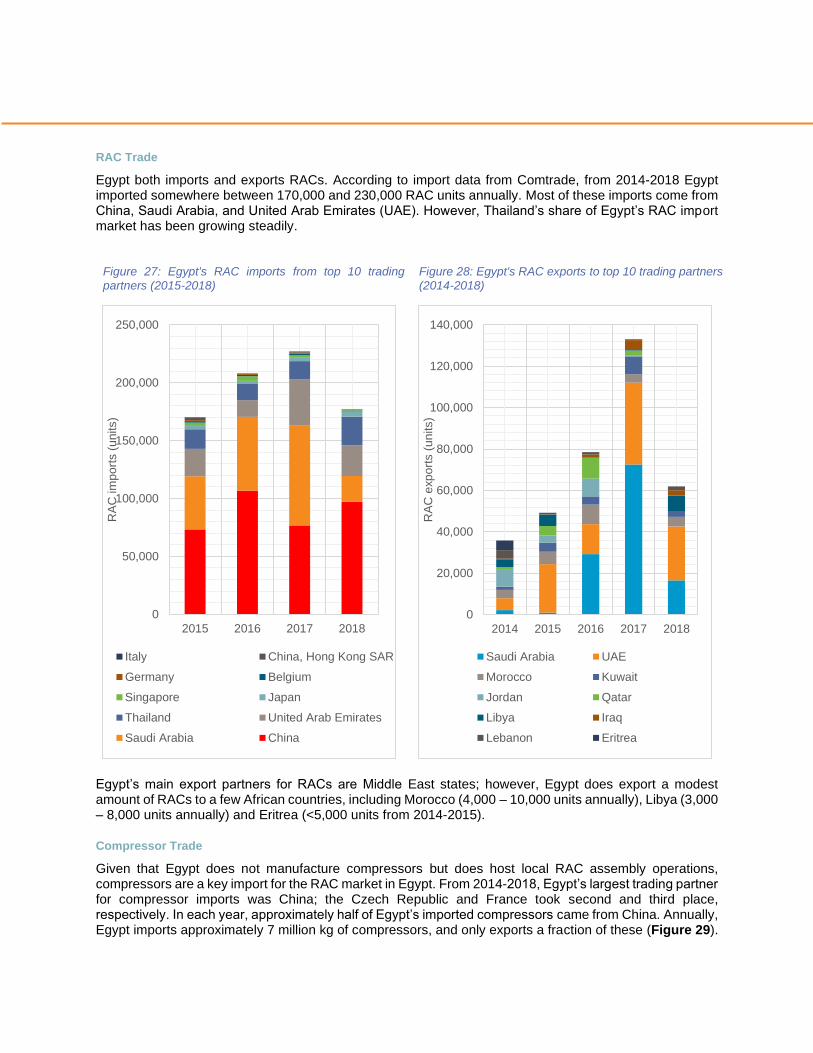
Most of the RAC units sold in Egypt – 79% - contain R-22 while the rest contain R-410A. Since almost all the units sold in Egypt are locally manufactured, all the units (for which data was available) that contain R-22 are locally manufactured. Eighty-nine percent (89%) of the RAC units in the Egyptian market are fixed-speed units and more than 90% of these fixed-speed units contain the R-22 refrigerant (Figure 25).
Figure 24: Refrigerants in Egyptian RAC market
Figure 25: Refrigerants in Egypt by compressor type
All the R-22 units in the Egyptian market are fixed-speed RACs (Figure 26) while all the inverter units contain R-410A.
Figure 26: Refrigerant types of RACs in the Egypt market categorized by compressor type
Secondhand RAC Market
CLASP was unable to obtain evidence of a secondhand market for RACs in Egypt. Per interviews with government stakeholders, is no formal market for secondhand RACs.16
Trade Flows
CLASP used Comtrade data to assess Egypt’s imports and exports of RAC units, compressors, and three refrigerants commonly found in RACs imported to or manufactured in Africa, R-22, R-410A, and R-32.17
16 Sources: Representatives from the Cairo Chamber of Commerce and Ministry of Environment 17 The UN Comtrade data for refrigerants encompasses all reported import or export of each refrigerant for any purpose and cannot
be read to reflect import or export of each refrigerant exclusively for use in RACs.
R-2279%
R-410A21%
0%
20%
40%
60%
80%
100%
R-22 R-410A
Fixed Inverter Not Available
0%
10%
20%
30%
40%
50%
60%
70%
80%
90%
100%
R-22 R-410A
Fixed Inverter Not Available
RAC Trade
Egypt both imports and exports RACs. According to import data from Comtrade, from 2014-2018 Egypt imported somewhere between 170,000 and 230,000 RAC units annually. Most of these imports come from China, Saudi Arabia, and United Arab Emirates (UAE). However, Thailand’s share of Egypt’s RAC import market has been growing steadily.
Figure 27: Egypt's RAC imports from top 10 trading
partners (2015-2018)
Figure 28: Egypt's RAC exports to top 10 trading partners
(2014-2018)
Egypt’s main export partners for RACs are Middle East states; however, Egypt does export a modest amount of RACs to a few African countries, including Morocco (4,000 – 10,000 units annually), Libya (3,000 – 8,000 units annually) and Eritrea (<5,000 units from 2014-2015).
Compressor Trade
Given that Egypt does not manufacture compressors but does host local RAC assembly operations, compressors are a key import for the RAC market in Egypt. From 2014-2018, Egypt’s largest trading partner for compressor imports was China; the Czech Republic and France took second and third place, respectively. In each year, approximately half of Egypt’s imported compressors came from China. Annually, Egypt imports approximately 7 million kg of compressors, and only exports a fraction of these (Figure 29).
0
50,000
100,000
150,000
200,000
250,000
2015 2016 2017 2018
RA
C im
po
rts (
un
its)
Italy China, Hong Kong SAR
Germany Belgium
Singapore Japan
Thailand United Arab Emirates
Saudi Arabia China
0
20,000
40,000
60,000
80,000
100,000
120,000
140,000
2014 2015 2016 2017 2018
RA
C e
xp
ort
s (
un
its)
Saudi Arabia UAE
Morocco Kuwait
Jordan Qatar
Libya Iraq
Lebanon Eritrea
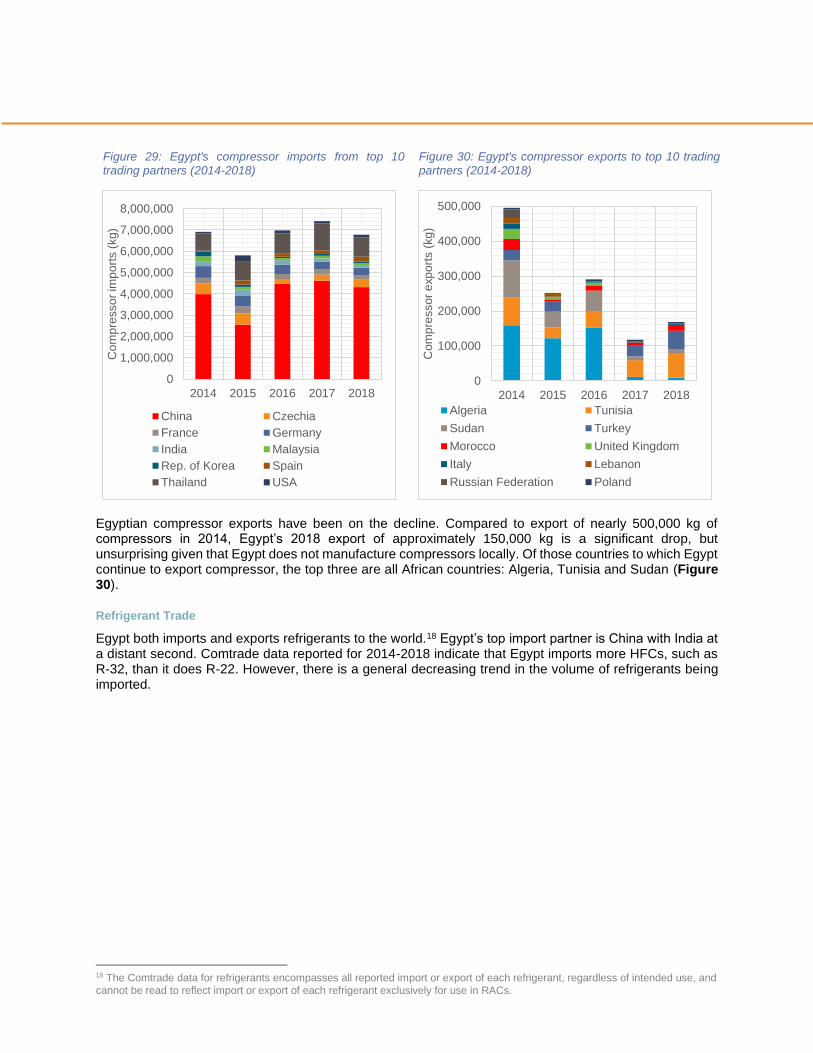
Figure 29: Egypt's compressor imports from top 10 trading partners (2014-2018)
Figure 30: Egypt's compressor exports to top 10 trading partners (2014-2018)
Egyptian compressor exports have been on the decline. Compared to export of nearly 500,000 kg of compressors in 2014, Egypt’s 2018 export of approximately 150,000 kg is a significant drop, but unsurprising given that Egypt does not manufacture compressors locally. Of those countries to which Egypt continue to export compressor, the top three are all African countries: Algeria, Tunisia and Sudan (Figure 30).
Refrigerant Trade
Egypt both imports and exports refrigerants to the world.18 Egypt’s top import partner is China with India at a distant second. Comtrade data reported for 2014-2018 indicate that Egypt imports more HFCs, such as R-32, than it does R-22. However, there is a general decreasing trend in the volume of refrigerants being imported.
18 The Comtrade data for refrigerants encompasses all reported import or export of each refrigerant, regardless of intended use, and
cannot be read to reflect import or export of each refrigerant exclusively for use in RACs.
0
1,000,000
2,000,000
3,000,000
4,000,000
5,000,000
6,000,000
7,000,000
8,000,000
2014 2015 2016 2017 2018
Co
mp
resso
r im
po
rts (
kg
)
China Czechia
France Germany
India Malaysia
Rep. of Korea Spain
Thailand USA
0
100,000
200,000
300,000
400,000
500,000
2014 2015 2016 2017 2018
Co
mp
resso
r e
xp
ort
s (
kg
)
Algeria Tunisia
Sudan Turkey
Morocco United Kingdom
Italy Lebanon
Russian Federation Poland
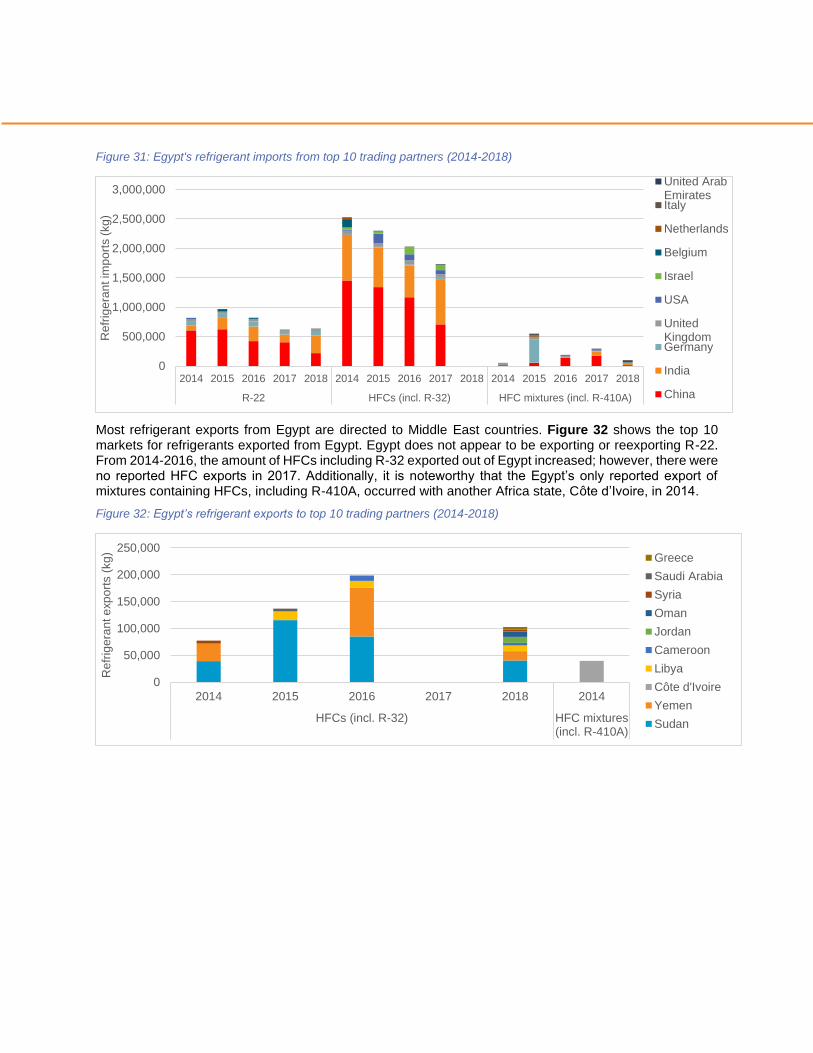
Figure 31: Egypt's refrigerant imports from top 10 trading partners (2014-2018)
Most refrigerant exports from Egypt are directed to Middle East countries. Figure 32 shows the top 10 markets for refrigerants exported from Egypt. Egypt does not appear to be exporting or reexporting R-22. From 2014-2016, the amount of HFCs including R-32 exported out of Egypt increased; however, there were no reported HFC exports in 2017. Additionally, it is noteworthy that the Egypt’s only reported export of mixtures containing HFCs, including R-410A, occurred with another Africa state, Côte d’Ivoire, in 2014.
Figure 32: Egypt’s refrigerant exports to top 10 trading partners (2014-2018)
0
500,000
1,000,000
1,500,000
2,000,000
2,500,000
3,000,000
2014 2015 2016 2017 2018 2014 2015 2016 2017 2018 2014 2015 2016 2017 2018
R-22 HFCs (incl. R-32) HFC mixtures (incl. R-410A)
Re
frig
era
nt im
po
rts (
kg
)
United ArabEmiratesItaly
Netherlands
Belgium
Israel
USA
UnitedKingdomGermany
India
China
0
50,000
100,000
150,000
200,000
250,000
2014 2015 2016 2017 2018 2014
HFCs (incl. R-32) HFC mixtures(incl. R-410A)
Refr
ige
ran
t e
xp
ort
s (
kg
) Greece
Saudi Arabia
Syria
Oman
Jordan
Cameroon
Libya
Côte d'Ivoire
Yemen
Sudan

Annex 3 – Morocco Country Profile
Market Size & Characteristics
The single-split room air conditioner market in Morocco is currently approximately between 100,000 and 140,000 units annually. According to BSRIA projections, it is expected to grow by between 2% and 6% annually to 2023 as shown in Figure 33 below.
Figure 33: Morocco annual market size projected to 2023
The market penetration of air conditioning in the residential market is estimated to be 40% and is expected to increase to 50% by 2023.19
RAC source countries
Morocco is the only African country that has a free trade agreement with the US. Based on this Agreement, since 2006, air conditioners imported from the US are not subject to import duty.20 Morocco also has free trade agreements with Egypt, Tunisia and Jordan known as the Agadir Agreement.
The RAC market in Morocco is dominated by imports. 34% of the RAC units come from China but units from Egypt and South Korea also have a significant market. Two local brands that import Chinese OEM products, Fitco and RTEC, are also popular in the market. Carrier which has the largest market share imports units from its Egypt manufacturing plants and a few from the US.
19 Market penetration is defined on a basis of ACs per household with one per household = 100%. Africa RAC and Energy Efficiency
Analysis. BSRIA. 2019 20 Office of the United States Trade Representative. “Morocco FTA, Final Text.” https://ustr.gov/trade-agreements/free-trade-
agreements/morocco-fta/final-text Accessed 21 August 2019.
0
20,000
40,000
60,000
80,000
100,000
120,000
140,000
160,000
2013 2014 2015 2016 2017 2018 2019 2020 2021 2022 2023
Num
ber
of
Units
BSRIA JRAIA
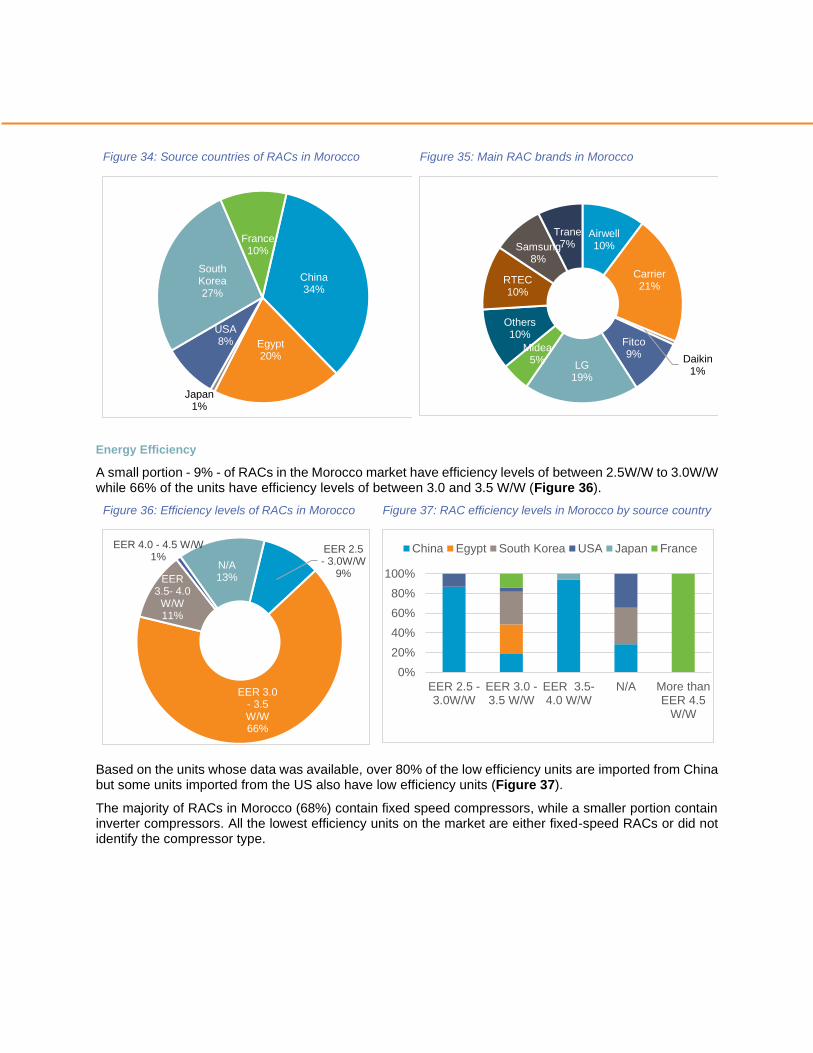
Figure 34: Source countries of RACs in Morocco
Figure 35: Main RAC brands in Morocco
Energy Efficiency
A small portion - 9% - of RACs in the Morocco market have efficiency levels of between 2.5W/W to 3.0W/W while 66% of the units have efficiency levels of between 3.0 and 3.5 W/W (Figure 36).
Figure 36: Efficiency levels of RACs in Morocco
Figure 37: RAC efficiency levels in Morocco by source country
Based on the units whose data was available, over 80% of the low efficiency units are imported from China but some units imported from the US also have low efficiency units (Figure 37).
The majority of RACs in Morocco (68%) contain fixed speed compressors, while a smaller portion contain inverter compressors. All the lowest efficiency units on the market are either fixed-speed RACs or did not identify the compressor type.
China34%
Egypt20%
Japan1%
USA8%
South Korea27%
France10%
Airwell10%
Carrier21%
Daikin1%
Fitco9%
LG19%
Midea5%
Others10%
RTEC10%
Samsung8%
Trane7%
EER 2.5 - 3.0W/W
9%
EER 3.0 - 3.5 W/W66%
EER 3.5- 4.0
W/W11%
EER 4.0 - 4.5 W/W1%
N/A13%
0%
20%
40%
60%
80%
100%
EER 2.5 -3.0W/W
EER 3.0 -3.5 W/W
EER 3.5-4.0 W/W
N/A More thanEER 4.5
W/W
China Egypt South Korea USA Japan France
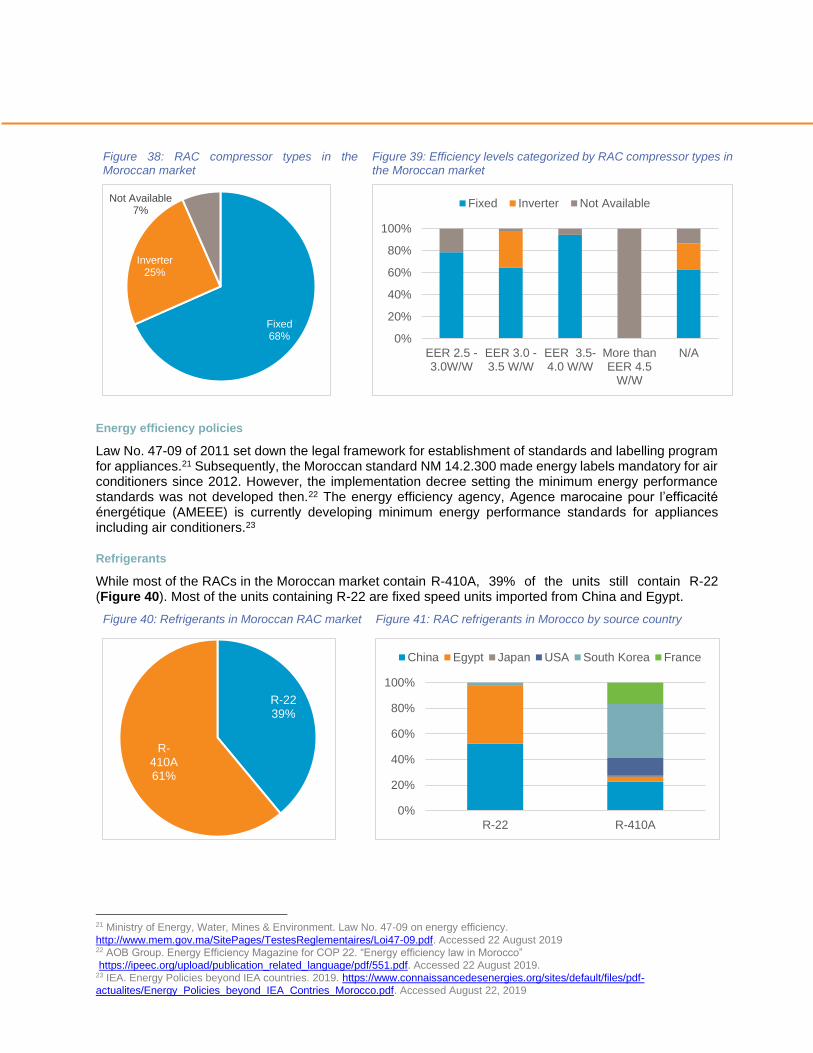
Figure 38: RAC compressor types in the Moroccan market
Figure 39: Efficiency levels categorized by RAC compressor types in the Moroccan market
Energy efficiency policies
Law No. 47-09 of 2011 set down the legal framework for establishment of standards and labelling program for appliances.21 Subsequently, the Moroccan standard NM 14.2.300 made energy labels mandatory for air conditioners since 2012. However, the implementation decree setting the minimum energy performance standards was not developed then.22 The energy efficiency agency, Agence marocaine pour l’efficacité énergétique (AMEEE) is currently developing minimum energy performance standards for appliances including air conditioners.23
Refrigerants
While most of the RACs in the Moroccan market contain R-410A, 39% of the units still contain R-22 (Figure 40). Most of the units containing R-22 are fixed speed units imported from China and Egypt.
Figure 40: Refrigerants in Moroccan RAC market
Figure 41: RAC refrigerants in Morocco by source country
21 Ministry of Energy, Water, Mines & Environment. Law No. 47-09 on energy efficiency.
http://www.mem.gov.ma/SitePages/TestesReglementaires/Loi47-09.pdf. Accessed 22 August 2019 22 AOB Group. Energy Efficiency Magazine for COP 22. “Energy efficiency law in Morocco”
https://ipeec.org/upload/publication_related_language/pdf/551.pdf. Accessed 22 August 2019. 23 IEA. Energy Policies beyond IEA countries. 2019. https://www.connaissancedesenergies.org/sites/default/files/pdf-
actualites/Energy_Policies_beyond_IEA_Contries_Morocco.pdf. Accessed August 22, 2019
Fixed68%
Inverter25%
Not Available7%
0%
20%
40%
60%
80%
100%
EER 2.5 -3.0W/W
EER 3.0 -3.5 W/W
EER 3.5-4.0 W/W
More thanEER 4.5
W/W
N/A
Fixed Inverter Not Available
R-2239%
R-410A61%
0%
20%
40%
60%
80%
100%
R-22 R-410A
China Egypt Japan USA South Korea France
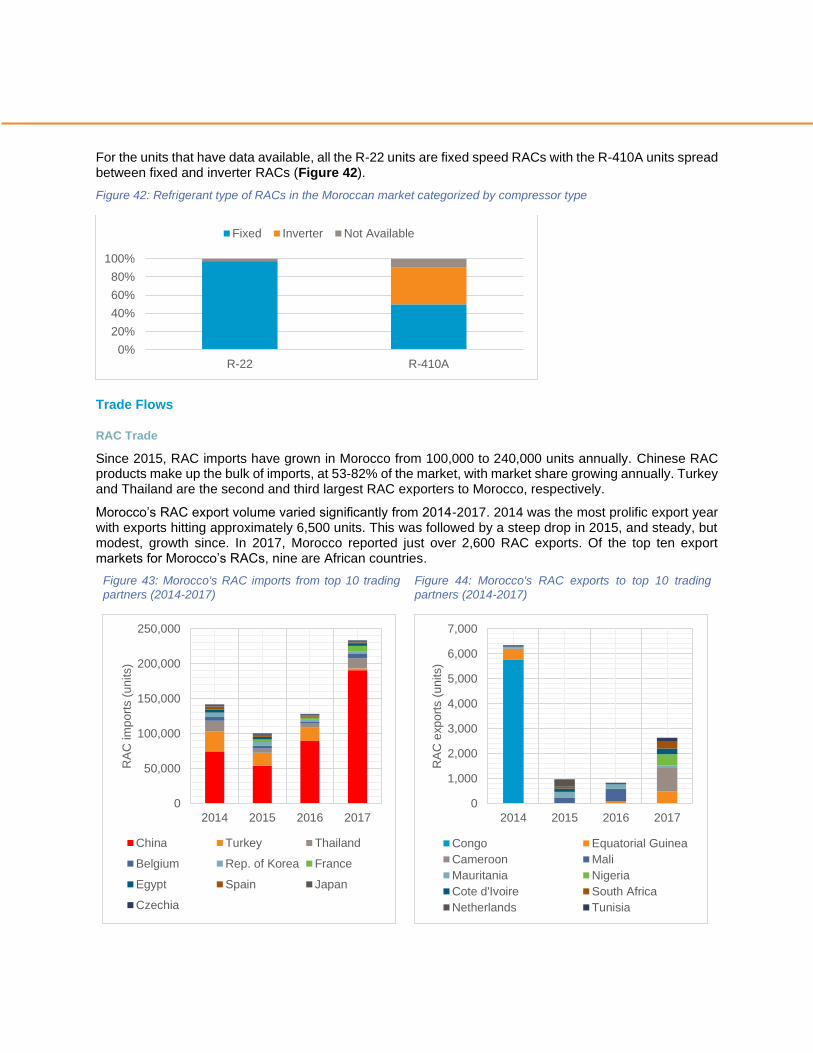
For the units that have data available, all the R-22 units are fixed speed RACs with the R-410A units spread between fixed and inverter RACs (Figure 42).
Figure 42: Refrigerant type of RACs in the Moroccan market categorized by compressor type
Trade Flows
RAC Trade
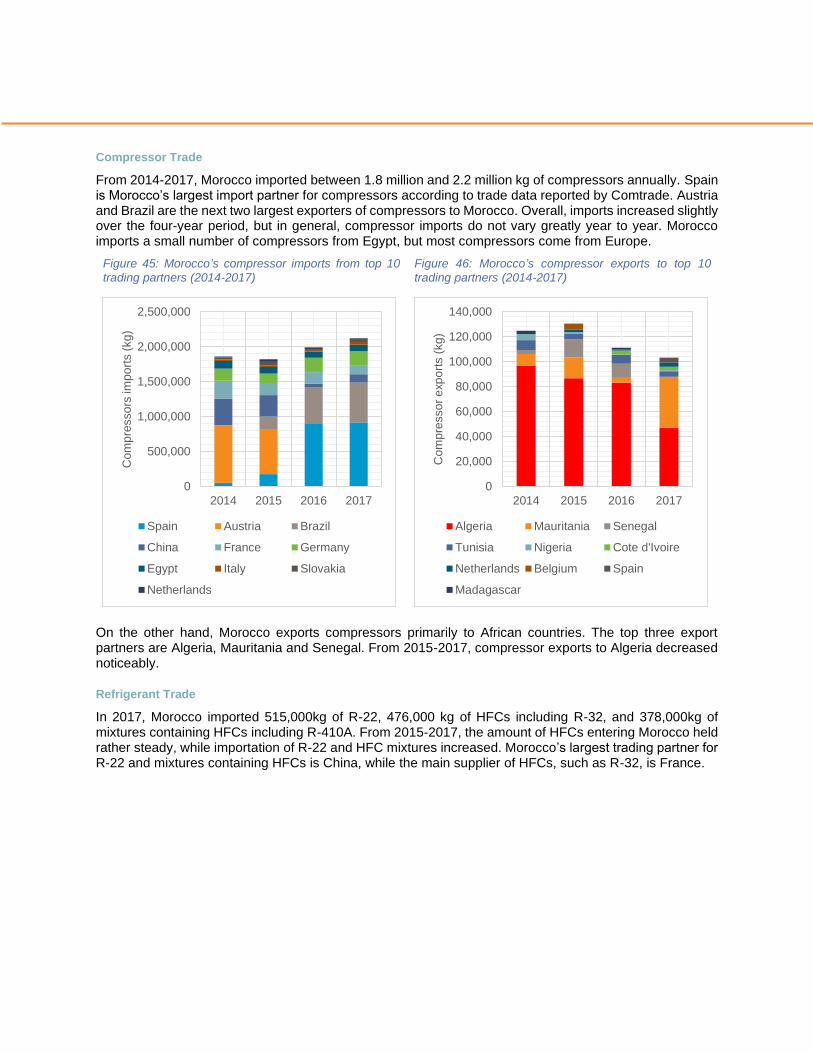
Since 2015, RAC imports have grown in Morocco from 100,000 to 240,000 units annually. Chinese RAC products make up the bulk of imports, at 53-82% of the market, with market share growing annually. Turkey and Thailand are the second and third largest RAC exporters to Morocco, respectively.
Morocco’s RAC export volume varied significantly from 2014-2017. 2014 was the most prolific export year with exports hitting approximately 6,500 units. This was followed by a steep drop in 2015, and steady, but modest, growth since. In 2017, Morocco reported just over 2,600 RAC exports. Of the top ten export markets for Morocco’s RACs, nine are African countries.
Figure 43: Morocco's RAC imports from top 10 trading
partners (2014-2017)
Figure 44: Morocco's RAC exports to top 10 trading
partners (2014-2017)
0%
20%
40%
60%
80%
100%
R-22 R-410A
Fixed Inverter Not Available
0
50,000
100,000
150,000
200,000
250,000
2014 2015 2016 2017
RA
C im
po
rts (
un
its)
China Turkey Thailand
Belgium Rep. of Korea France
Egypt Spain Japan
Czechia
0
1,000
2,000
3,000
4,000
5,000
6,000
7,000
2014 2015 2016 2017
RA
C e
xp
ort
s (
un
its)
Congo Equatorial Guinea
Cameroon Mali
Mauritania Nigeria
Cote d'Ivoire South Africa
Netherlands Tunisia
Compressor Trade
From 2014-2017, Morocco imported between 1.8 million and 2.2 million kg of compressors annually. Spain is Morocco’s largest import partner for compressors according to trade data reported by Comtrade. Austria and Brazil are the next two largest exporters of compressors to Morocco. Overall, imports increased slightly over the four-year period, but in general, compressor imports do not vary greatly year to year. Morocco imports a small number of compressors from Egypt, but most compressors come from Europe.
Figure 45: Morocco’s compressor imports from top 10
trading partners (2014-2017)
Figure 46: Morocco’s compressor exports to top 10
trading partners (2014-2017)
On the other hand, Morocco exports compressors primarily to African countries. The top three export partners are Algeria, Mauritania and Senegal. From 2015-2017, compressor exports to Algeria decreased noticeably.
Refrigerant Trade
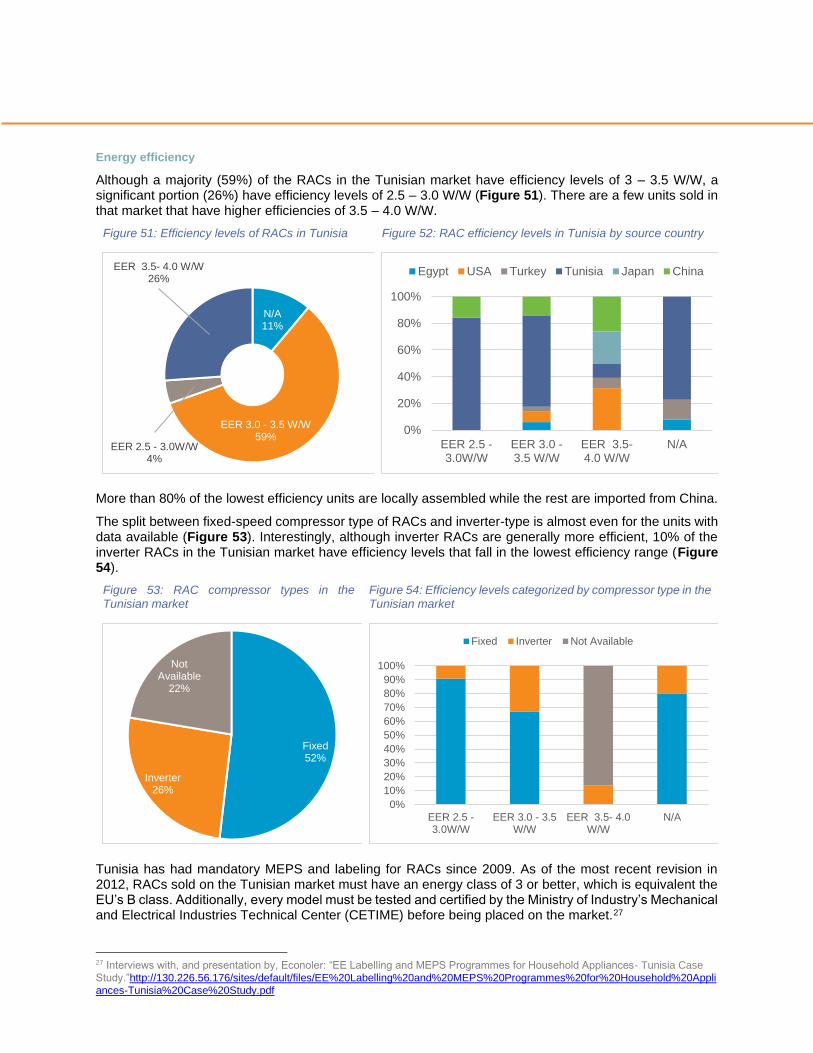
In 2017, Morocco imported 515,000kg of R-22, 476,000 kg of HFCs including R-32, and 378,000kg of mixtures containing HFCs including R-410A. From 2015-2017, the amount of HFCs entering Morocco held rather steady, while importation of R-22 and HFC mixtures increased. Morocco’s largest trading partner for R-22 and mixtures containing HFCs is China, while the main supplier of HFCs, such as R-32, is France.
0
500,000
1,000,000
1,500,000
2,000,000
2,500,000
2014 2015 2016 2017
Com
pre
sso
rs im
po
rts (
kg
)
Spain Austria Brazil
China France Germany
Egypt Italy Slovakia
Netherlands
0
20,000
40,000
60,000
80,000
100,000
120,000
140,000
2014 2015 2016 2017
Com
pre
sso
r e
xp
ort
s (
kg
)
Algeria Mauritania Senegal
Tunisia Nigeria Cote d'Ivoire
Netherlands Belgium Spain
Madagascar
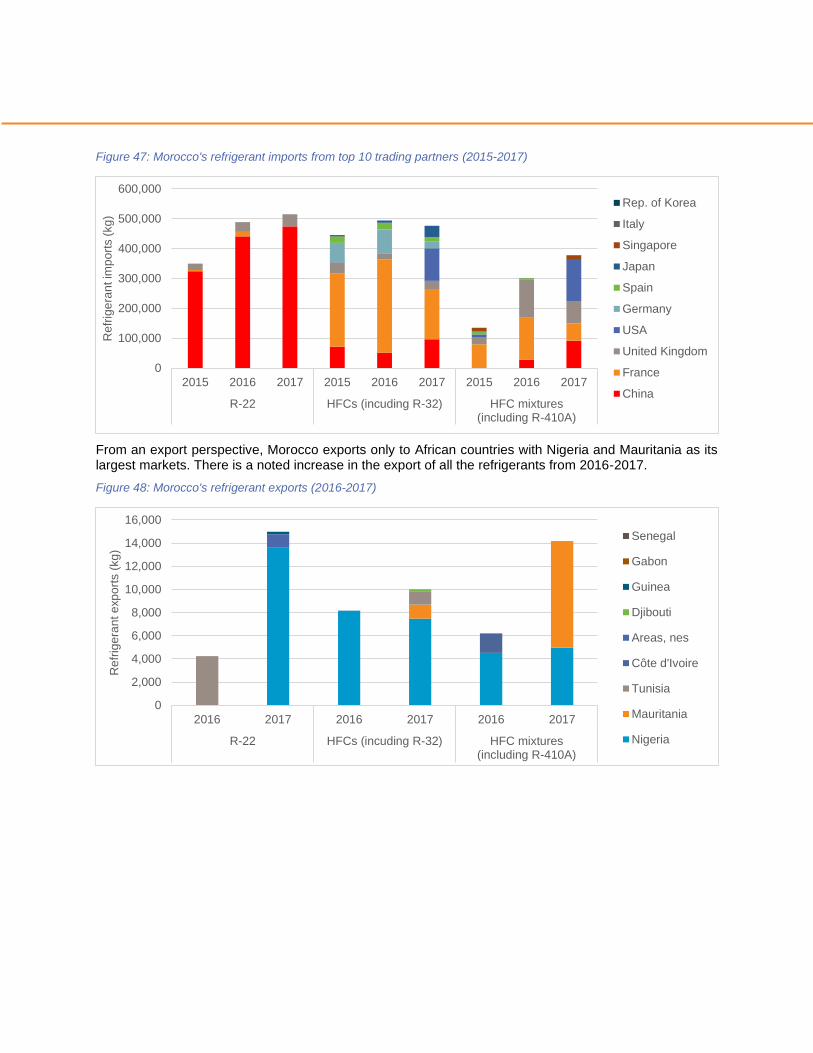
Figure 47: Morocco's refrigerant imports from top 10 trading partners (2015-2017)
From an export perspective, Morocco exports only to African countries with Nigeria and Mauritania as its largest markets. There is a noted increase in the export of all the refrigerants from 2016-2017.
Figure 48: Morocco's refrigerant exports (2016-2017)
0
100,000
200,000
300,000
400,000
500,000
600,000
2015 2016 2017 2015 2016 2017 2015 2016 2017
R-22 HFCs (incuding R-32) HFC mixtures(including R-410A)
Re
frig
era
nt im
po
rts (
kg
)
Rep. of Korea
Italy
Singapore
Japan
Spain
Germany
USA
United Kingdom
France
China
0
2,000
4,000
6,000
8,000
10,000
12,000
14,000
16,000
2016 2017 2016 2017 2016 2017
R-22 HFCs (incuding R-32) HFC mixtures(including R-410A)
Refr
ige
ran
t e
xp
ort
s (
kg
)
Senegal
Gabon
Guinea
Djibouti
Areas, nes
Côte d'Ivoire
Tunisia
Mauritania
Nigeria

Annex 4 – Tunisia Country Profile
Market Size & Characteristics
Tunisia has a small, but growing market for single-split room air conditioners. In 2018, between 50,000-60,000 new single-split RACs were sold in Tunisia.24 In addition to the legal market for RACs, the black market for is estimated to be of a similar size, meaning the overall market for room air conditioners is likely closer to 100,000 units annually.25 Currently, the penetration rate of air conditioning in residential regions is at 75% and is expected to grow to 78% by 2023.
Figure 49: Tunisia annual market size projected to 2023
RAC source countries
Most RAC units in Tunisia are locally assembled; three companies hold the largest share at 10% namely Haier, Midea and a series of other companies that are grouped together. RACs from Tunisia dominate the market at 55%, with China and the US second and third at 16% and 13% respectively (Figure 50). Smuggled black market units come through the Algerian and Libyan borders.26
Figure 50: RAC source countries and popular brands in Tunisia
24 Based on market data obtained by BSRIA and Euromonitor split RAC sales data. 25 Source: Representatives from Econoler and Tunisia’s National Agency for Energy Management (ANME). 26 Finding from BSRIA
0
10,000
20,000
30,000
40,000
50,000
60,000
70,000
2014 2015 2016 2017 2018 2019 2020 2021 2022 2023
Num
ber
of
Units
BSRIA JRAIA
China16%
Egypt4%
Japan6%
Tunisia55%
Turkey6% USA
13%
Beko6% Carrier
8%
Coala7%
Daikin5%
Gree7%
Haier10%
Hitachi1%
LG7%
Midea10%
Others10%
Samsung8%
Trane7%
Westpoint7%
York7%
Energy efficiency
Although a majority (59%) of the RACs in the Tunisian market have efficiency levels of 3 – 3.5 W/W, a significant portion (26%) have efficiency levels of 2.5 – 3.0 W/W (Figure 51). There are a few units sold in that market that have higher efficiencies of 3.5 – 4.0 W/W.
Figure 51: Efficiency levels of RACs in Tunisia
Figure 52: RAC efficiency levels in Tunisia by source country
More than 80% of the lowest efficiency units are locally assembled while the rest are imported from China.
The split between fixed-speed compressor type of RACs and inverter-type is almost even for the units with data available (Figure 53). Interestingly, although inverter RACs are generally more efficient, 10% of the inverter RACs in the Tunisian market have efficiency levels that fall in the lowest efficiency range (Figure 54).
Figure 53: RAC compressor types in the Tunisian market
Figure 54: Efficiency levels categorized by compressor type in the Tunisian market
Tunisia has had mandatory MEPS and labeling for RACs since 2009. As of the most recent revision in 2012, RACs sold on the Tunisian market must have an energy class of 3 or better, which is equivalent the EU’s B class. Additionally, every model must be tested and certified by the Ministry of Industry’s Mechanical and Electrical Industries Technical Center (CETIME) before being placed on the market.27
27 Interviews with, and presentation by, Econoler: “EE Labelling and MEPS Programmes for Household Appliances- Tunisia Case
Study.”http://130.226.56.176/sites/default/files/EE%20Labelling%20and%20MEPS%20Programmes%20for%20Household%20Appli
ances-Tunisia%20Case%20Study.pdf
N/A11%
EER 3.0 - 3.5 W/W59%
EER 2.5 - 3.0W/W4%
EER 3.5- 4.0 W/W26%
0%
20%
40%
60%
80%
100%
EER 2.5 -3.0W/W
EER 3.0 -3.5 W/W
EER 3.5-4.0 W/W
N/A
Egypt USA Turkey Tunisia Japan China
Fixed52%
Inverter26%
Not Available
22%
0%
10%
20%
30%
40%
50%
60%
70%
80%
90%
100%
EER 2.5 -3.0W/W
EER 3.0 - 3.5W/W
EER 3.5- 4.0W/W
N/A
Fixed Inverter Not Available
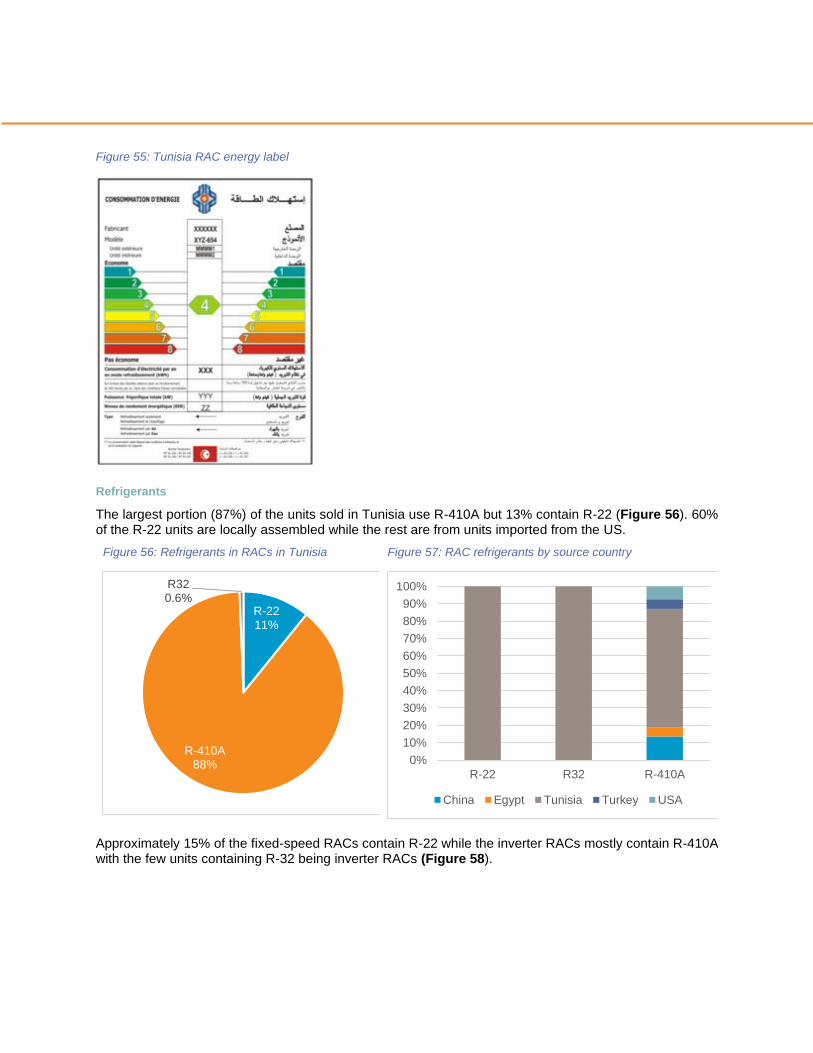
Figure 55: Tunisia RAC energy label
Refrigerants
The largest portion (87%) of the units sold in Tunisia use R-410A but 13% contain R-22 (Figure 56). 60% of the R-22 units are locally assembled while the rest are from units imported from the US.
Figure 56: Refrigerants in RACs in Tunisia
Figure 57: RAC refrigerants by source country
Approximately 15% of the fixed-speed RACs contain R-22 while the inverter RACs mostly contain R-410A with the few units containing R-32 being inverter RACs (Figure 58).
R-2211%
R-410A88%
R320.6%
0%
10%
20%
30%
40%
50%
60%
70%
80%
90%
100%
R-22 R32 R-410A
China Egypt Tunisia Turkey USA
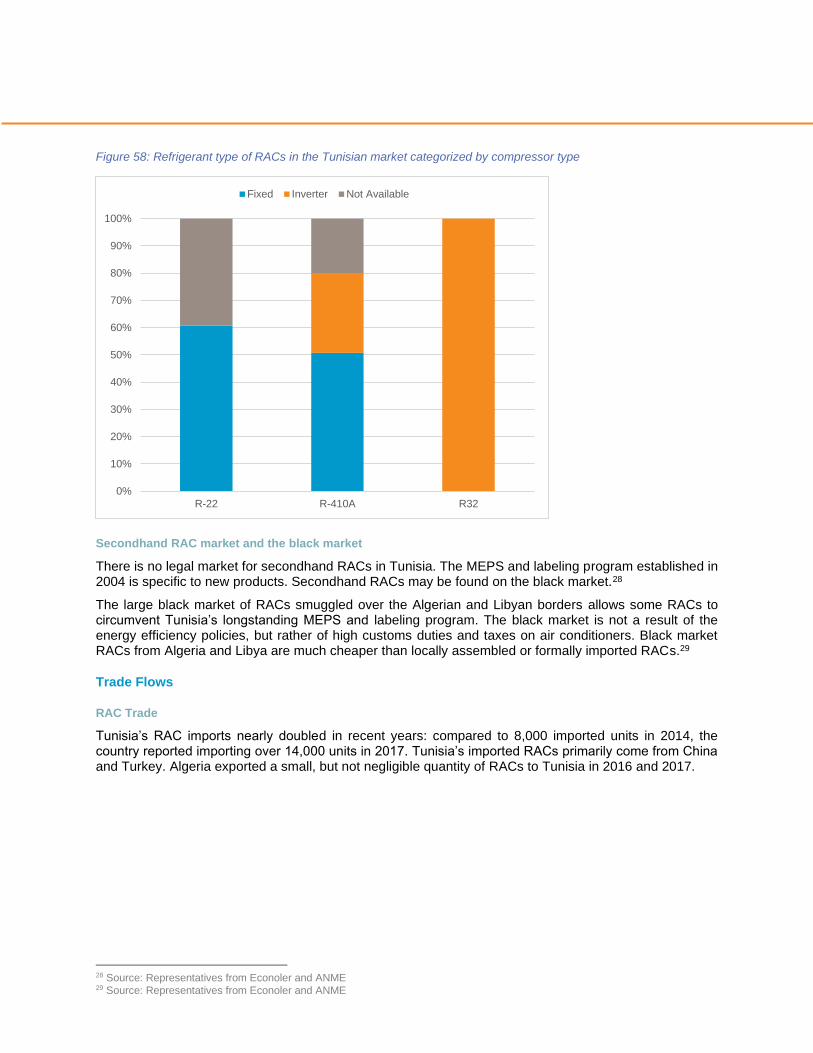
Figure 58: Refrigerant type of RACs in the Tunisian market categorized by compressor type
Secondhand RAC market and the black market
There is no legal market for secondhand RACs in Tunisia. The MEPS and labeling program established in 2004 is specific to new products. Secondhand RACs may be found on the black market.28
The large black market of RACs smuggled over the Algerian and Libyan borders allows some RACs to circumvent Tunisia’s longstanding MEPS and labeling program. The black market is not a result of the energy efficiency policies, but rather of high customs duties and taxes on air conditioners. Black market RACs from Algeria and Libya are much cheaper than locally assembled or formally imported RACs.29
Trade Flows
RAC Trade
Tunisia’s RAC imports nearly doubled in recent years: compared to 8,000 imported units in 2014, the country reported importing over 14,000 units in 2017. Tunisia’s imported RACs primarily come from China and Turkey. Algeria exported a small, but not negligible quantity of RACs to Tunisia in 2016 and 2017.
28 Source: Representatives from Econoler and ANME 29 Source: Representatives from Econoler and ANME
0%
10%
20%
30%
40%
50%
60%
70%
80%
90%
100%
R-22 R-410A R32
Fixed Inverter Not Available
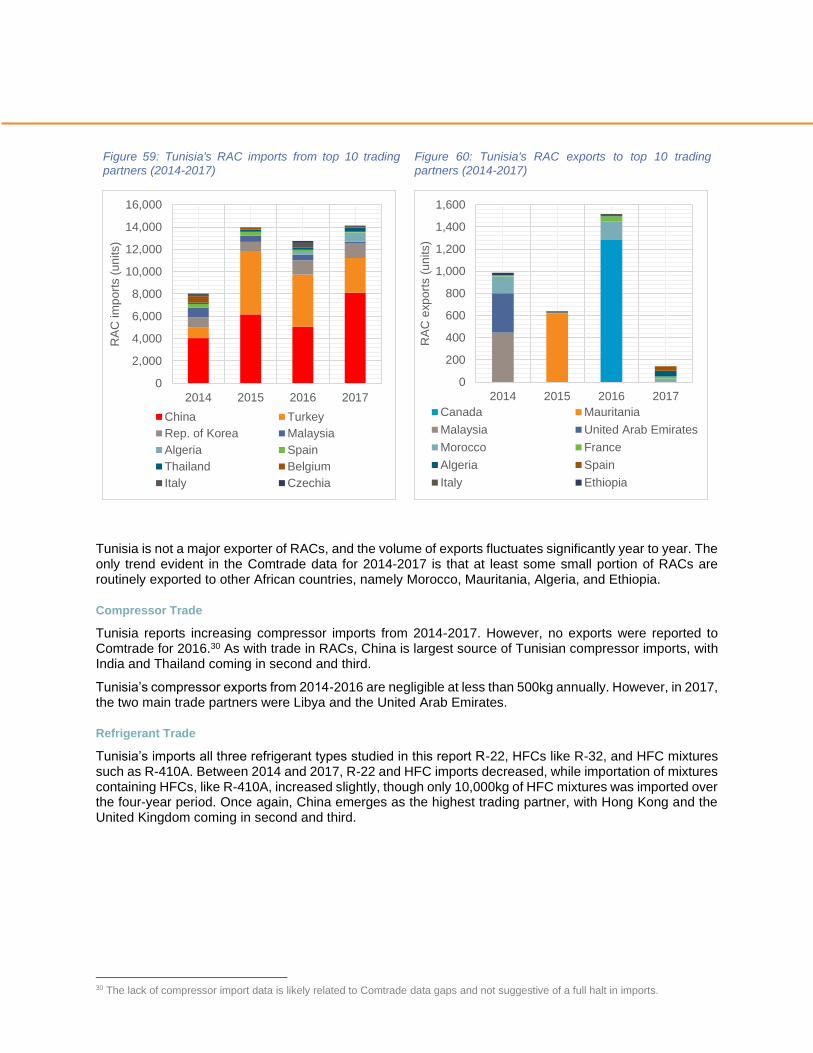
Figure 59: Tunisia's RAC imports from top 10 trading partners (2014-2017)
Figure 60: Tunisia's RAC exports to top 10 trading partners (2014-2017)
Tunisia is not a major exporter of RACs, and the volume of exports fluctuates significantly year to year. The only trend evident in the Comtrade data for 2014-2017 is that at least some small portion of RACs are routinely exported to other African countries, namely Morocco, Mauritania, Algeria, and Ethiopia.
Compressor Trade
Tunisia reports increasing compressor imports from 2014-2017. However, no exports were reported to Comtrade for 2016.30 As with trade in RACs, China is largest source of Tunisian compressor imports, with India and Thailand coming in second and third.
Tunisia’s compressor exports from 2014-2016 are negligible at less than 500kg annually. However, in 2017, the two main trade partners were Libya and the United Arab Emirates.
Refrigerant Trade
Tunisia’s imports all three refrigerant types studied in this report R-22, HFCs like R-32, and HFC mixtures such as R-410A. Between 2014 and 2017, R-22 and HFC imports decreased, while importation of mixtures containing HFCs, like R-410A, increased slightly, though only 10,000kg of HFC mixtures was imported over the four-year period. Once again, China emerges as the highest trading partner, with Hong Kong and the United Kingdom coming in second and third.
30 The lack of compressor import data is likely related to Comtrade data gaps and not suggestive of a full halt in imports.
0
2,000
4,000
6,000
8,000
10,000
12,000
14,000
16,000
2014 2015 2016 2017
RA
C im
po
rts (
un
its)
China Turkey
Rep. of Korea Malaysia
Algeria Spain
Thailand Belgium
Italy Czechia
0
200
400
600
800
1,000
1,200
1,400
1,600
2014 2015 2016 2017
RA
C e
xp
ort
s (
un
its)
Canada Mauritania
Malaysia United Arab Emirates
Morocco France
Algeria Spain
Italy Ethiopia
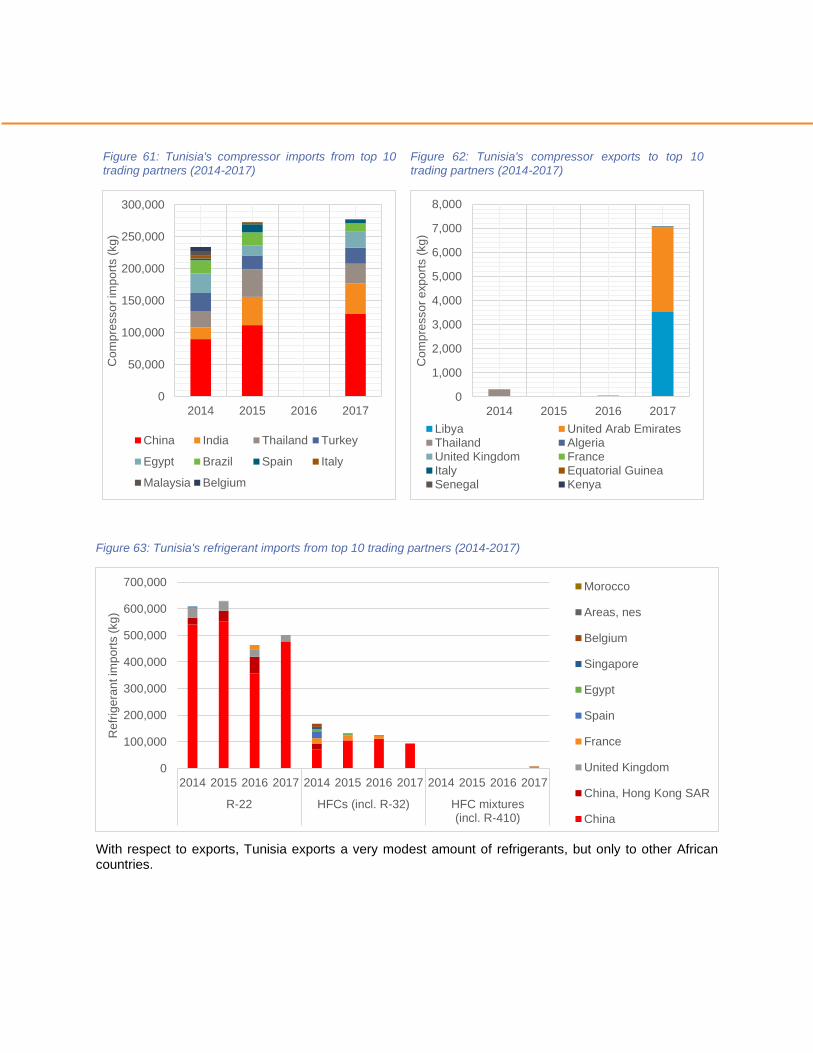
Figure 61: Tunisia's compressor imports from top 10 trading partners (2014-2017)
Figure 62: Tunisia's compressor exports to top 10 trading partners (2014-2017)
Figure 63: Tunisia's refrigerant imports from top 10 trading partners (2014-2017)
With respect to exports, Tunisia exports a very modest amount of refrigerants, but only to other African countries.
0
50,000
100,000
150,000
200,000
250,000
300,000
2014 2015 2016 2017
Co
mp
resso
r im
po
rts (
kg
)
China India Thailand Turkey
Egypt Brazil Spain Italy
Malaysia Belgium
0
1,000
2,000
3,000
4,000
5,000
6,000
7,000
8,000
2014 2015 2016 2017C
om
pre
sso
r e
xp
ort
s (
kg
)Libya United Arab EmiratesThailand AlgeriaUnited Kingdom FranceItaly Equatorial GuineaSenegal Kenya
0
100,000
200,000
300,000
400,000
500,000
600,000
700,000
2014 2015 2016 2017 2014 2015 2016 2017 2014 2015 2016 2017
R-22 HFCs (incl. R-32) HFC mixtures(incl. R-410)
Refr
ige
ran
t im
po
rts (
kg
)
Morocco
Areas, nes
Belgium
Singapore
Egypt
Spain
France
United Kingdom
China, Hong Kong SAR
China
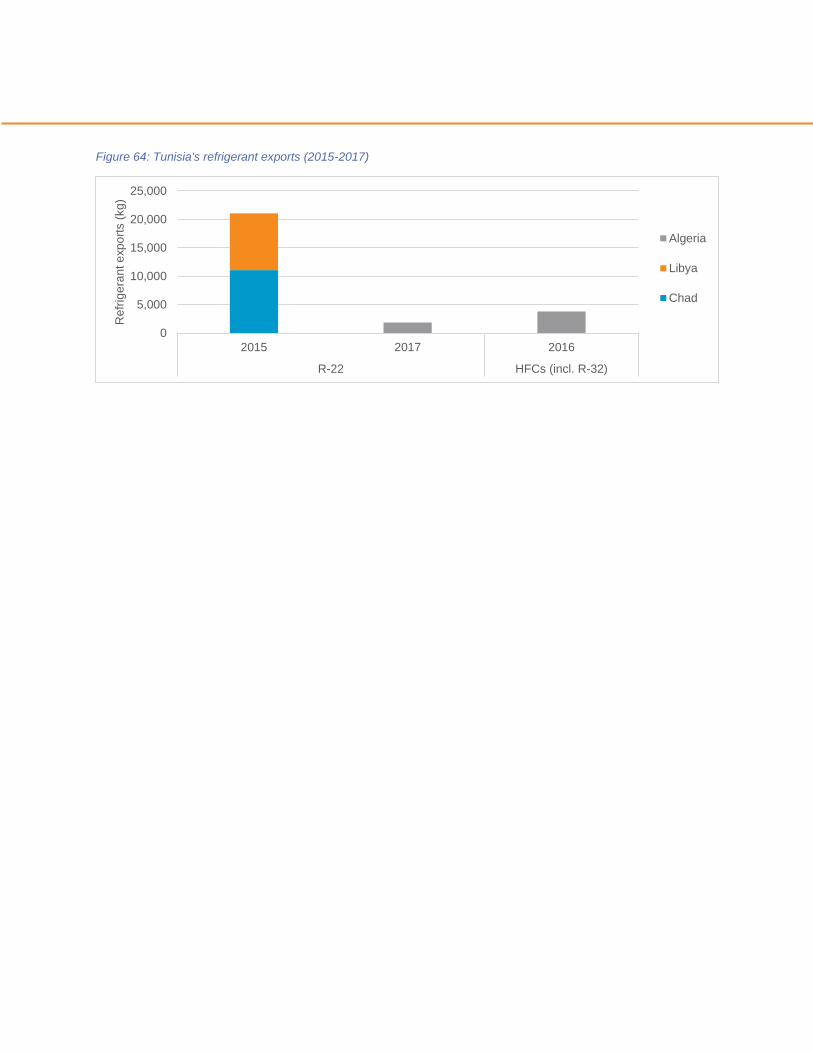
Figure 64: Tunisia's refrigerant exports (2015-2017)
0
5,000
10,000
15,000
20,000
25,000
2015 2017 2016
R-22 HFCs (incl. R-32)
Re
frig
era
nt e
xp
ort
s (
kg
)
Algeria
Libya
Chad
Annex 5 – Ghana Country Profile
Market Size & Characteristics
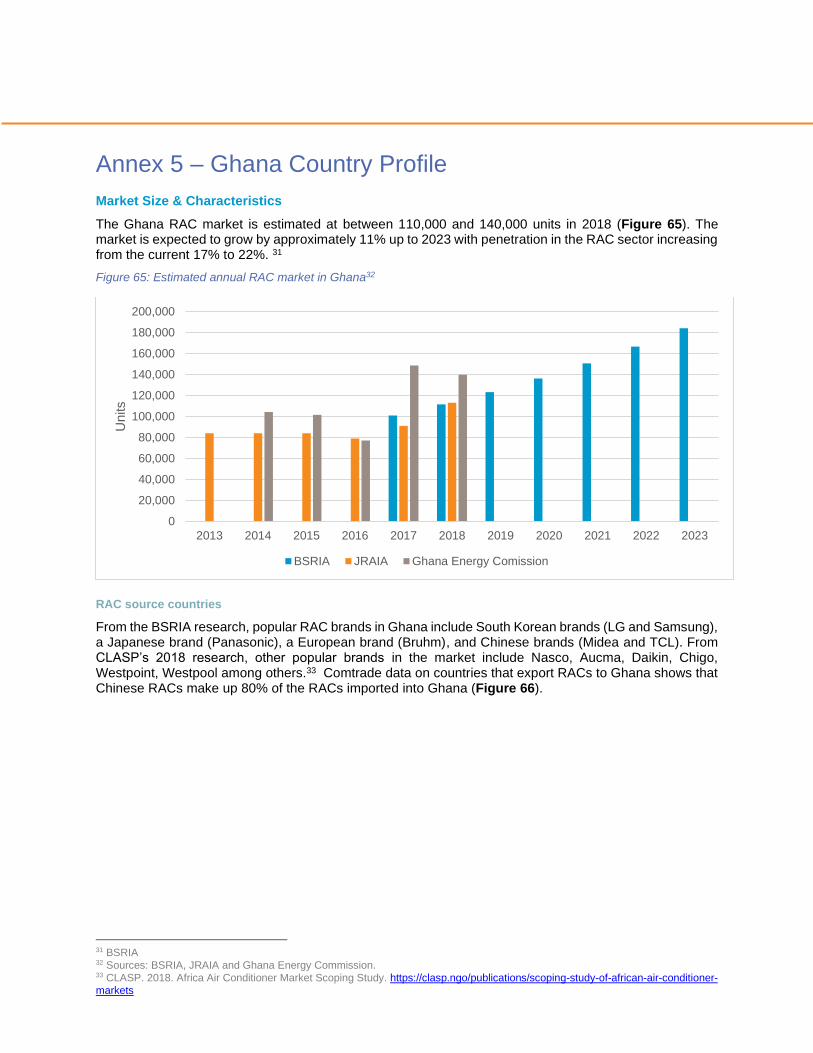
The Ghana RAC market is estimated at between 110,000 and 140,000 units in 2018 (Figure 65). The market is expected to grow by approximately 11% up to 2023 with penetration in the RAC sector increasing from the current 17% to 22%. 31
Figure 65: Estimated annual RAC market in Ghana32
RAC source countries
From the BSRIA research, popular RAC brands in Ghana include South Korean brands (LG and Samsung), a Japanese brand (Panasonic), a European brand (Bruhm), and Chinese brands (Midea and TCL). From CLASP’s 2018 research, other popular brands in the market include Nasco, Aucma, Daikin, Chigo, Westpoint, Westpool among others.33 Comtrade data on countries that export RACs to Ghana shows that Chinese RACs make up 80% of the RACs imported into Ghana (Figure 66).
31 BSRIA 32 Sources: BSRIA, JRAIA and Ghana Energy Commission. 33 CLASP. 2018. Africa Air Conditioner Market Scoping Study. https://clasp.ngo/publications/scoping-study-of-african-air-conditioner-
markets
0
20,000
40,000
60,000
80,000
100,000
120,000
140,000
160,000
180,000
200,000
2013 2014 2015 2016 2017 2018 2019 2020 2021 2022 2023
Units
BSRIA JRAIA Ghana Energy Comission
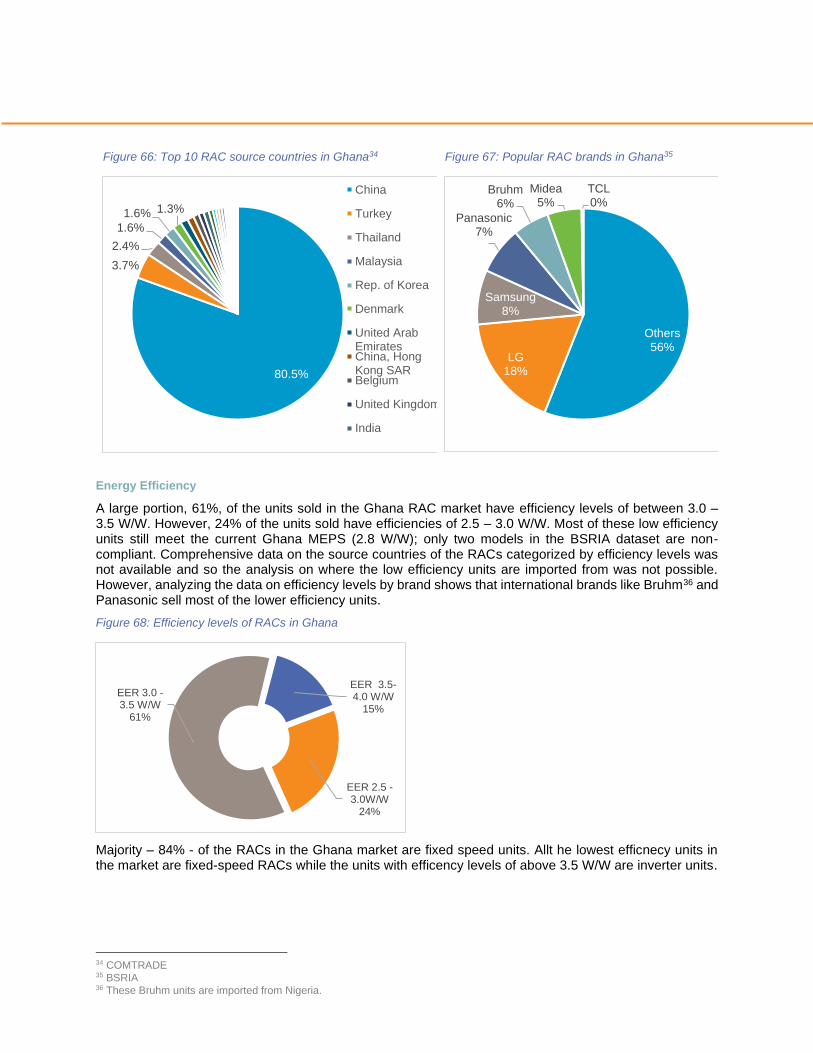
Figure 66: Top 10 RAC source countries in Ghana34
Figure 67: Popular RAC brands in Ghana35
Energy Efficiency
A large portion, 61%, of the units sold in the Ghana RAC market have efficiency levels of between 3.0 – 3.5 W/W. However, 24% of the units sold have efficiencies of 2.5 – 3.0 W/W. Most of these low efficiency units still meet the current Ghana MEPS (2.8 W/W); only two models in the BSRIA dataset are non-compliant. Comprehensive data on the source countries of the RACs categorized by efficiency levels was not available and so the analysis on where the low efficiency units are imported from was not possible. However, analyzing the data on efficiency levels by brand shows that international brands like Bruhm36 and Panasonic sell most of the lower efficiency units.
Figure 68: Efficiency levels of RACs in Ghana
Majority – 84% - of the RACs in the Ghana market are fixed speed units. Allt he lowest efficnecy units in the market are fixed-speed RACs while the units with efficency levels of above 3.5 W/W are inverter units.
34 COMTRADE 35 BSRIA 36 These Bruhm units are imported from Nigeria.
80.5%
3.7%
2.4%
1.6%
1.6% 1.3%
China
Turkey
Thailand
Malaysia
Rep. of Korea
Denmark
United ArabEmiratesChina, HongKong SARBelgium
United Kingdom
India
Others56%
LG18%
Samsung8%
Panasonic7%
Bruhm6%
Midea5%
TCL0%
EER 3.5-4.0 W/W
15%
EER 2.5 -3.0W/W
24%
EER 3.0 -3.5 W/W
61%
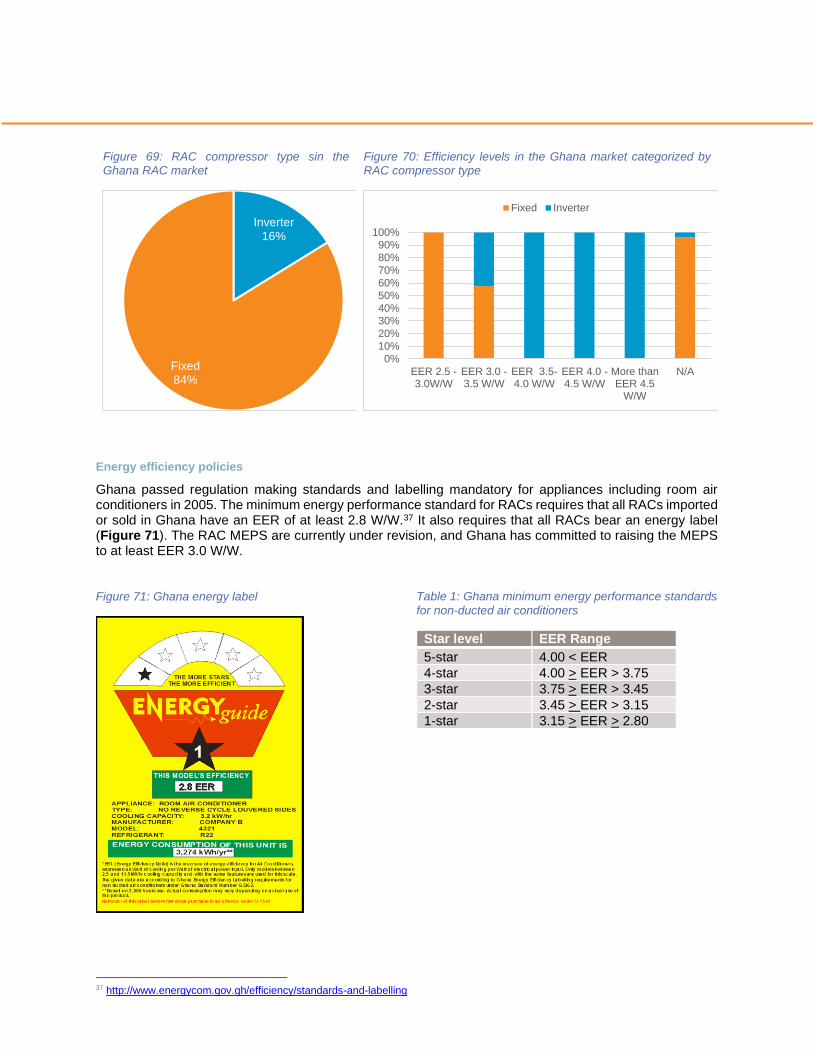
Figure 69: RAC compressor type sin the Ghana RAC market
Figure 70: Efficiency levels in the Ghana market categorized by RAC compressor type
Energy efficiency policies
Ghana passed regulation making standards and labelling mandatory for appliances including room air conditioners in 2005. The minimum energy performance standard for RACs requires that all RACs imported or sold in Ghana have an EER of at least 2.8 W/W.37 It also requires that all RACs bear an energy label (Figure 71). The RAC MEPS are currently under revision, and Ghana has committed to raising the MEPS to at least EER 3.0 W/W.
Figure 71: Ghana energy label
Table 1: Ghana minimum energy performance standards
for non-ducted air conditioners
Star level EER Range
5-star 4.00 < EER
4-star 4.00 > EER > 3.75
3-star 3.75 > EER > 3.45
2-star 3.45 > EER > 3.15
1-star 3.15 > EER > 2.80
37 http://www.energycom.gov.gh/efficiency/standards-and-labelling
Inverter16%
Fixed84%
0%
10%
20%
30%
40%
50%
60%
70%
80%
90%
100%
EER 2.5 -3.0W/W
EER 3.0 -3.5 W/W
EER 3.5-4.0 W/W
EER 4.0 -4.5 W/W
More thanEER 4.5
W/W
N/A
Fixed Inverter
Refrigerants
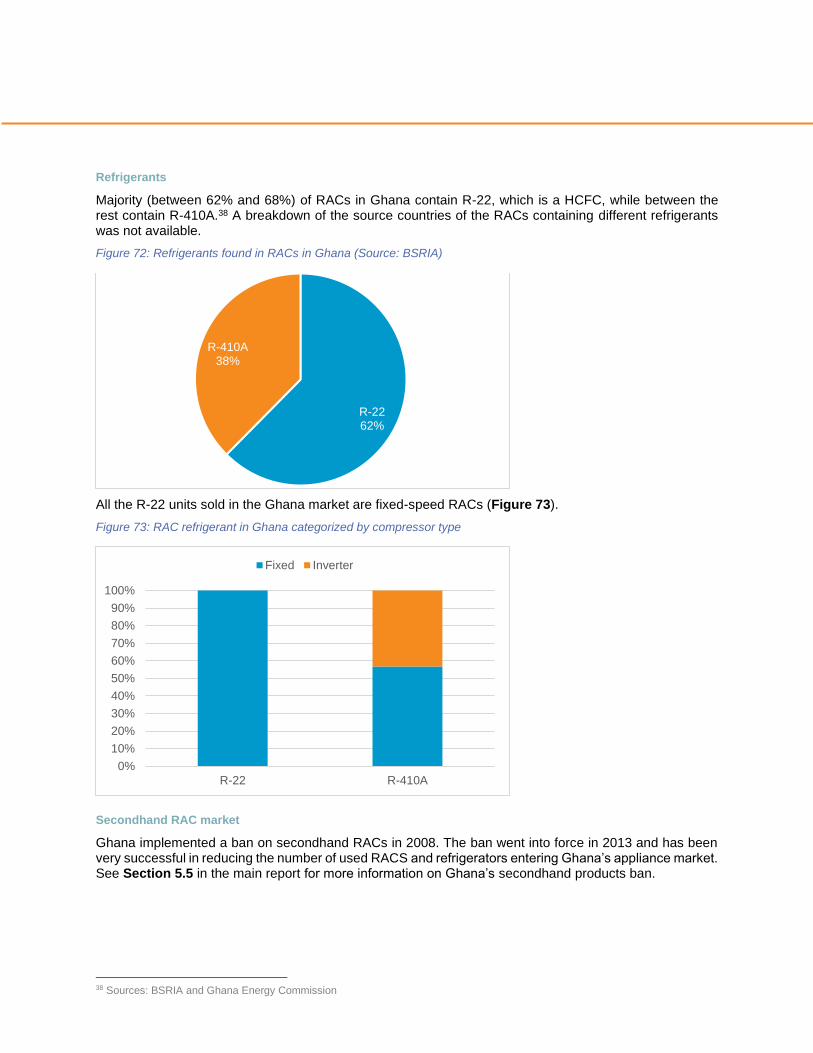
Majority (between 62% and 68%) of RACs in Ghana contain R-22, which is a HCFC, while between the rest contain R-410A.38 A breakdown of the source countries of the RACs containing different refrigerants was not available.
Figure 72: Refrigerants found in RACs in Ghana (Source: BSRIA)
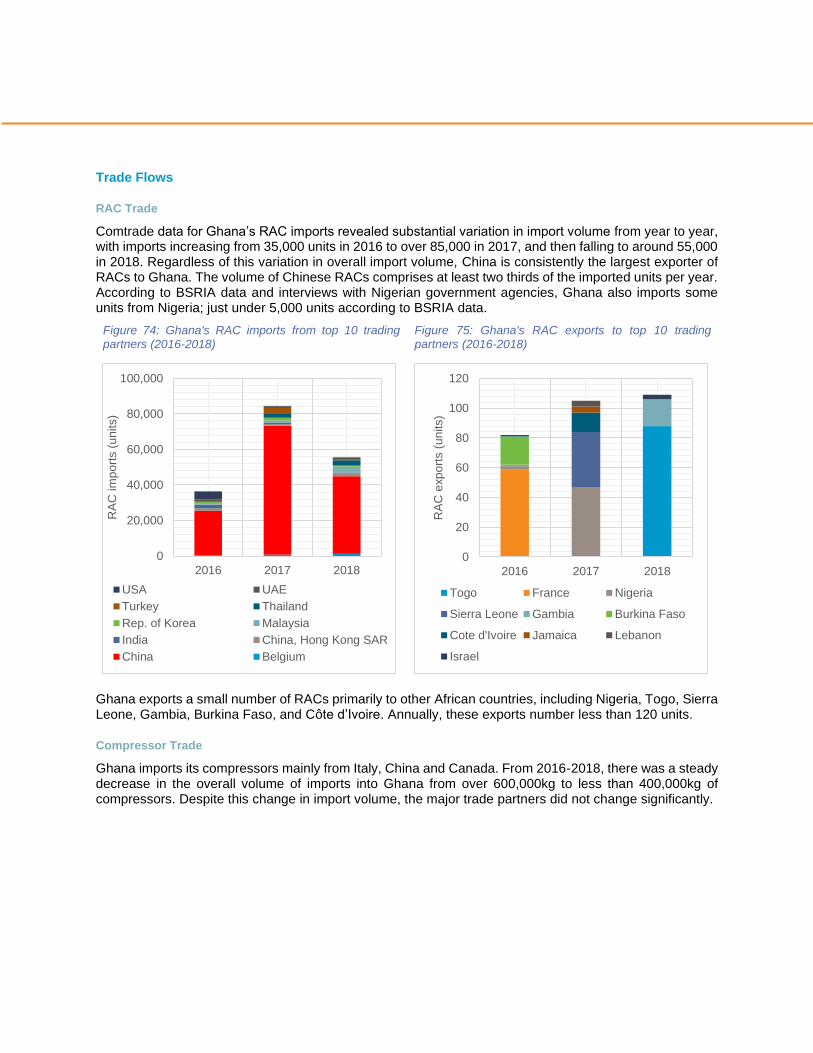
All the R-22 units sold in the Ghana market are fixed-speed RACs (Figure 73).
Figure 73: RAC refrigerant in Ghana categorized by compressor type
Secondhand RAC market
Ghana implemented a ban on secondhand RACs in 2008. The ban went into force in 2013 and has been very successful in reducing the number of used RACS and refrigerators entering Ghana’s appliance market. See Section 5.5 in the main report for more information on Ghana’s secondhand products ban.
38 Sources: BSRIA and Ghana Energy Commission
R-2262%
R-410A38%
0%
10%
20%
30%
40%
50%
60%
70%
80%
90%
100%
R-22 R-410A
Fixed Inverter
Trade Flows
RAC Trade
Comtrade data for Ghana’s RAC imports revealed substantial variation in import volume from year to year, with imports increasing from 35,000 units in 2016 to over 85,000 in 2017, and then falling to around 55,000 in 2018. Regardless of this variation in overall import volume, China is consistently the largest exporter of RACs to Ghana. The volume of Chinese RACs comprises at least two thirds of the imported units per year. According to BSRIA data and interviews with Nigerian government agencies, Ghana also imports some units from Nigeria; just under 5,000 units according to BSRIA data.
Figure 74: Ghana's RAC imports from top 10 trading partners (2016-2018)
Figure 75: Ghana's RAC exports to top 10 trading partners (2016-2018)
Ghana exports a small number of RACs primarily to other African countries, including Nigeria, Togo, Sierra Leone, Gambia, Burkina Faso, and Côte d’Ivoire. Annually, these exports number less than 120 units.
Compressor Trade
Ghana imports its compressors mainly from Italy, China and Canada. From 2016-2018, there was a steady decrease in the overall volume of imports into Ghana from over 600,000kg to less than 400,000kg of compressors. Despite this change in import volume, the major trade partners did not change significantly.
0
20,000
40,000
60,000
80,000
100,000
2016 2017 2018
RA
C im
po
rts (
un
its)
USA UAE
Turkey Thailand
Rep. of Korea Malaysia
India China, Hong Kong SAR
China Belgium
0
20
40
60
80
100
120
2016 2017 2018
RA
C e
xp
ort
s (
un
its)
Togo France Nigeria
Sierra Leone Gambia Burkina Faso
Cote d'Ivoire Jamaica Lebanon
Israel
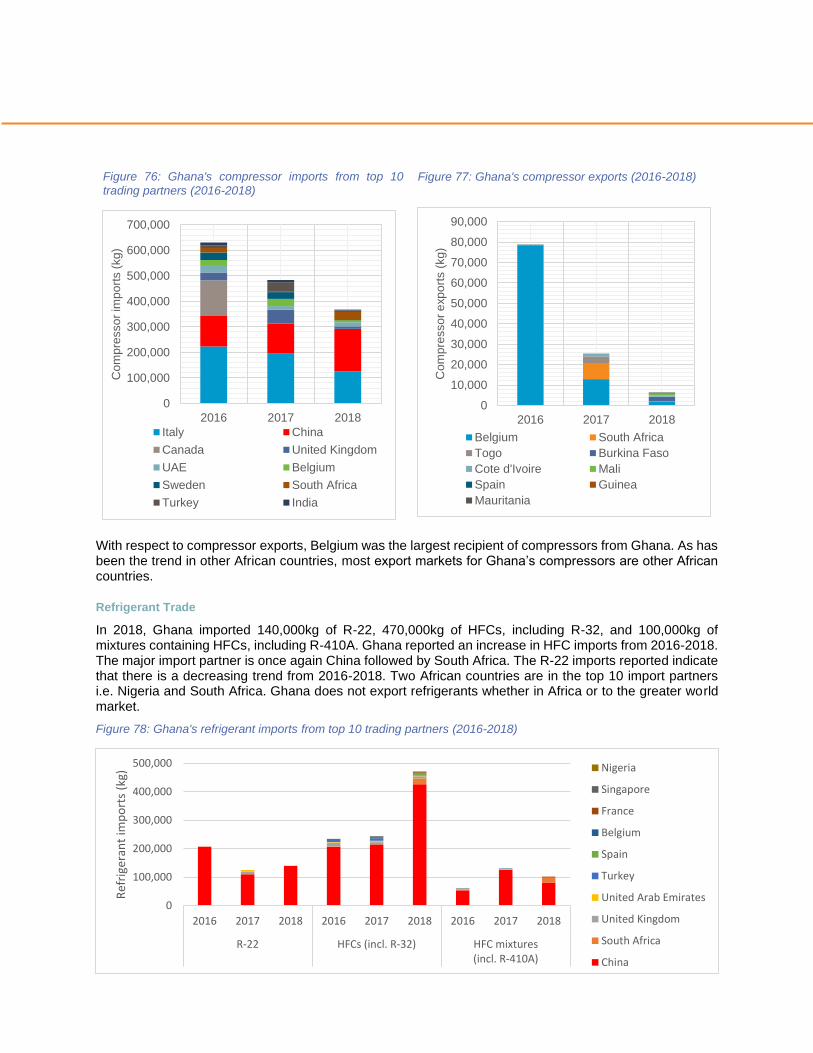
Figure 76: Ghana's compressor imports from top 10
trading partners (2016-2018)
Figure 77: Ghana's compressor exports (2016-2018)
With respect to compressor exports, Belgium was the largest recipient of compressors from Ghana. As has been the trend in other African countries, most export markets for Ghana’s compressors are other African countries.
Refrigerant Trade
In 2018, Ghana imported 140,000kg of R-22, 470,000kg of HFCs, including R-32, and 100,000kg of mixtures containing HFCs, including R-410A. Ghana reported an increase in HFC imports from 2016-2018. The major import partner is once again China followed by South Africa. The R-22 imports reported indicate that there is a decreasing trend from 2016-2018. Two African countries are in the top 10 import partners i.e. Nigeria and South Africa. Ghana does not export refrigerants whether in Africa or to the greater world market.
Figure 78: Ghana's refrigerant imports from top 10 trading partners (2016-2018)
0
100,000
200,000
300,000
400,000
500,000
600,000
700,000
2016 2017 2018
Co
mp
resso
r im
po
rts (
kg
)
Italy China
Canada United Kingdom
UAE Belgium
Sweden South Africa
Turkey India
0
10,000
20,000
30,000
40,000
50,000
60,000
70,000
80,000
90,000
2016 2017 2018
Co
mp
resso
r e
xp
ort
s (
kg
)Belgium South Africa
Togo Burkina Faso
Cote d'Ivoire Mali
Spain Guinea
Mauritania
0
100,000
200,000
300,000
400,000
500,000
2016 2017 2018 2016 2017 2018 2016 2017 2018
R-22 HFCs (incl. R-32) HFC mixtures(incl. R-410A)
Ref
rige
ran
t im
po
rts
(kg)
Nigeria
Singapore
France
Belgium
Spain
Turkey
United Arab Emirates
United Kingdom
South Africa
China

Annex 6 – Nigeria Country Profile
Market Size & Characteristics
The single-split room air conditioner market in Nigeria is currently approximately between 380,000 and 560,000 units annually according to data from BSRIA, JRAIA and Euromonitor data (Figure 79). According to BSRIA’s research, it is expected to grow by 4-5% annually by 2023.
Figure 79: Nigeria annual market size projected to 202339
The market penetration of air conditioning in the residential market is estimated to be 20% and is expected to increase to 25% by 2023.40
Market characteristics
Nigeria encourages local assembly of air conditioning units by setting significantly lower import duty (5%) for completely knocked down units as compared to assembled units (20%).41 This has motivated several international RAC manufacturing companies to set up assembly plants locally either through joint ventures or setting up local subsidiaries.
RAC source countries
Majority (86%) of the RAC units sold in Nigeria are manufactured locally (Figure 80). The most popular brands in the market are Chinese (Midea, Gree, Chigo and Haier Thermocool), South Korean (LG & Samsung), and Japanese (Daikin & Panasonic).
39 Sources: BSRIA, JRAIA and Euromonitor) 40 Market penetration is defined on a basis of ACs per household with one per household = 100%. Africa RAC and Energy Efficiency
Analysis. BSRIA. 2019 41 Ibid
0
100,000
200,000
300,000
400,000
500,000
600,000
700,000
800,000
900,000
2013 2014 2015 2016 2017 2018 2019 2020 2021 2022 2023
Num
ber
of
Units
BSRIA JRAIA Euromonitor
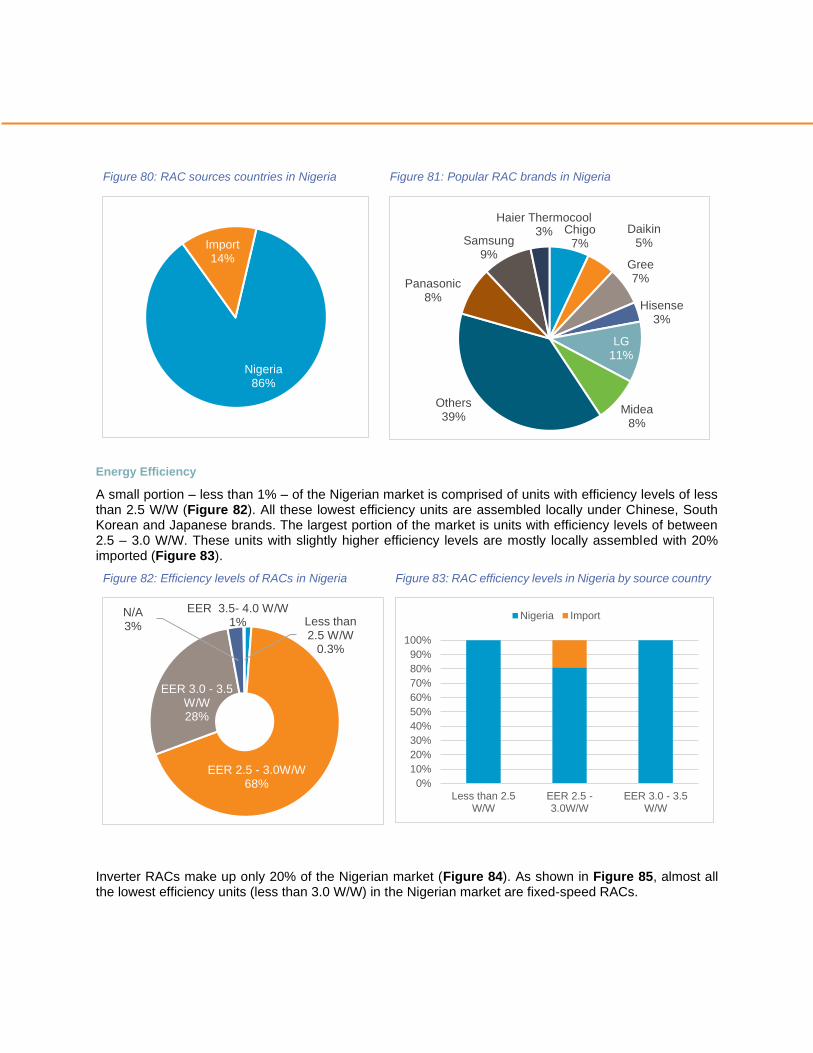
Figure 80: RAC sources countries in Nigeria
Figure 81: Popular RAC brands in Nigeria
Energy Efficiency
A small portion – less than 1% – of the Nigerian market is comprised of units with efficiency levels of less than 2.5 W/W (Figure 82). All these lowest efficiency units are assembled locally under Chinese, South Korean and Japanese brands. The largest portion of the market is units with efficiency levels of between 2.5 – 3.0 W/W. These units with slightly higher efficiency levels are mostly locally assembled with 20% imported (Figure 83).
Figure 82: Efficiency levels of RACs in Nigeria
Figure 83: RAC efficiency levels in Nigeria by source country
Inverter RACs make up only 20% of the Nigerian market (Figure 84). As shown in Figure 85, almost all the lowest efficiency units (less than 3.0 W/W) in the Nigerian market are fixed-speed RACs.
Nigeria86%
Import14%
Chigo7%
Daikin5%
Gree7%
Hisense3%
LG11%
Midea8%
Others39%
Panasonic8%
Samsung9%
Haier Thermocool3%
EER 3.5- 4.0 W/W1%
EER 2.5 - 3.0W/W68%
EER 3.0 - 3.5 W/W28%
N/A3% Less than
2.5 W/W0.3%
0%
10%
20%
30%
40%
50%
60%
70%
80%
90%
100%
Less than 2.5W/W
EER 2.5 -3.0W/W
EER 3.0 - 3.5W/W
Nigeria Import
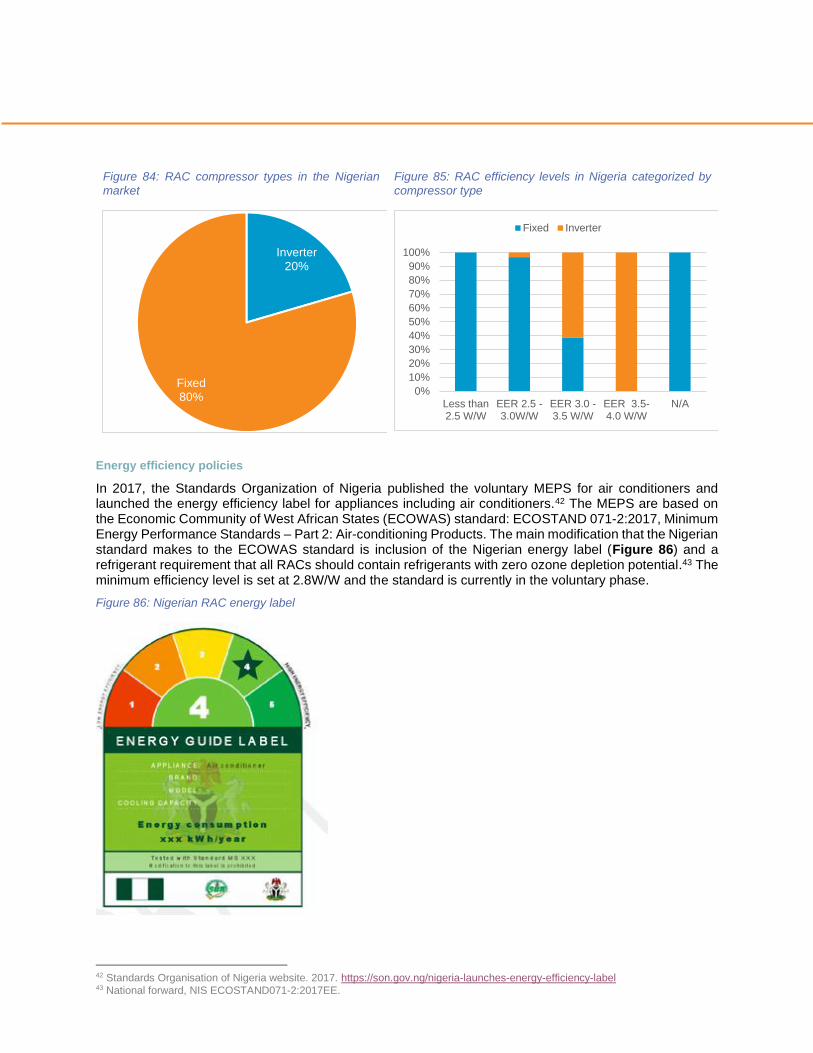
Figure 84: RAC compressor types in the Nigerian
market
Figure 85: RAC efficiency levels in Nigeria categorized by
compressor type
Energy efficiency policies
In 2017, the Standards Organization of Nigeria published the voluntary MEPS for air conditioners and launched the energy efficiency label for appliances including air conditioners.42 The MEPS are based on the Economic Community of West African States (ECOWAS) standard: ECOSTAND 071-2:2017, Minimum Energy Performance Standards – Part 2: Air-conditioning Products. The main modification that the Nigerian standard makes to the ECOWAS standard is inclusion of the Nigerian energy label (Figure 86) and a refrigerant requirement that all RACs should contain refrigerants with zero ozone depletion potential.43 The minimum efficiency level is set at 2.8W/W and the standard is currently in the voluntary phase.
Figure 86: Nigerian RAC energy label
42 Standards Organisation of Nigeria website. 2017. https://son.gov.ng/nigeria-launches-energy-efficiency-label 43 National forward, NIS ECOSTAND071-2:2017EE.
Inverter 20%
Fixed80%
0%
10%
20%
30%
40%
50%
60%
70%
80%
90%
100%
Less than2.5 W/W
EER 2.5 -3.0W/W
EER 3.0 -3.5 W/W
EER 3.5-4.0 W/W
N/A
Fixed Inverter

Refrigerants
The Nigerian RAC market still has many HCFC RAC models available with units containing R-22 making up 50% of the market. These R-22 units are assembled for international brands like Haier, Gree and Daikin.
Figure 87: Refrigerants contained in RACs in the Nigerian market
Figure 88: RAC refrigerants in the Nigerian market categorized by compressor type
All the R-22 units in the Nigerian market are fixed-speed units while the R-410A are split evenly between the fixed speed and inverter units (Figure 88).
Secondhand RAC Market
According to a 2015 study, the secondhand RACs imported into Nigeria were imported from Italy, Hong Kong, South Korea, Singapore, Japan and Germany.44 Examples of the popular secondhand RAC brands are Goldstar, Itaclime, Sanyo, Panasonic, LG, Hitachi, Hisense and Sharp.
Trade Flows
RAC Trade
In 2018, Nigeria imported approximately 350,000 RACs. Most of these imports came from China and Thailand, the world’s two largest RAC manufacturing economies. Despite a slight drop in imports between 2014 and 2015, the overall trend in the RAC imports market is one of growth. Comtrade did not have any data on RAC exports from Nigeria. However, a 2015 study found that both new and secondhand RACs were exported to neighboring countries such as Mali, Chad, Niger, Cameroon, Togo and Benin.45 In addition to these countries, interviews with Nigerian government agencies also identified Ghana as an export country for units from Nigeria.46
44 Baseline Assessment of Air Conditioners in Nigeria, GIZ, 2015 45 Baseline Assessment of Air Conditioners in Nigeria, GIZ, 2015 46 Interviews with representatives from Standards Organization of Nigeria and National Centre for Energy Efficiency and
Conservation (NCEEC)
R-2253%
R-410A36%
Not Available11%
0%
10%
20%
30%
40%
50%
60%
70%
80%
90%
100%
R-22 R-410A Not Available
Fixed Inverter
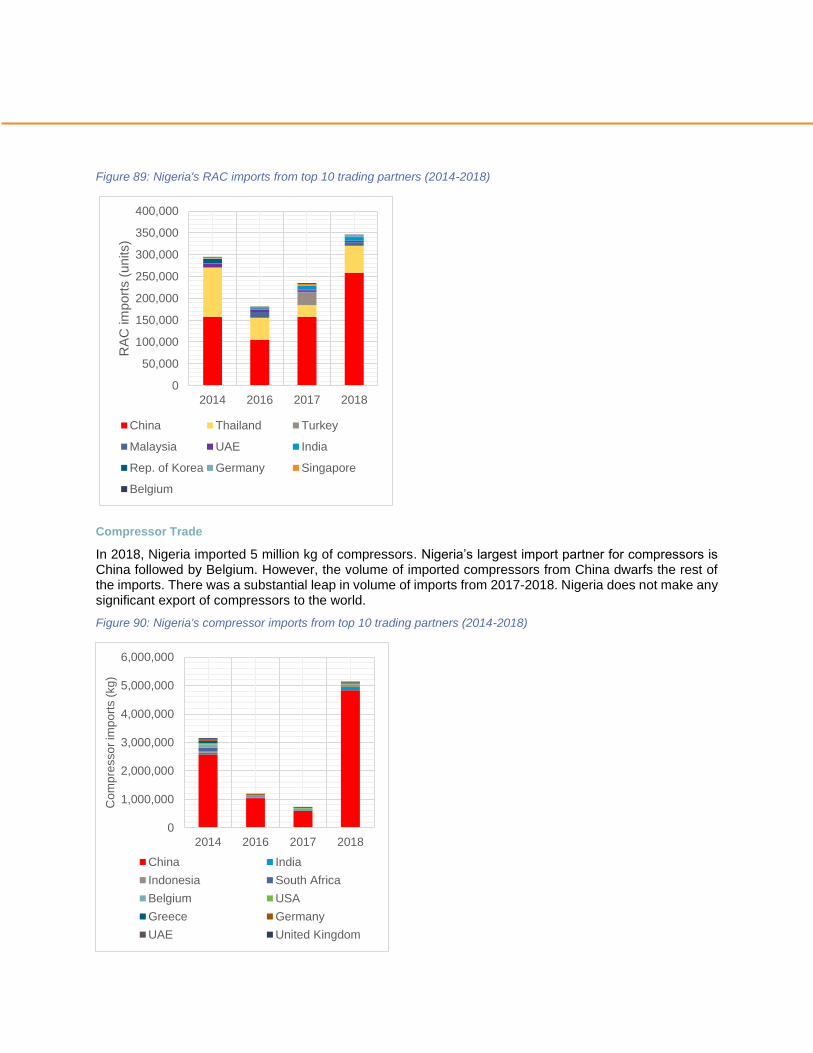
Figure 89: Nigeria's RAC imports from top 10 trading partners (2014-2018)
Compressor Trade
In 2018, Nigeria imported 5 million kg of compressors. Nigeria’s largest import partner for compressors is China followed by Belgium. However, the volume of imported compressors from China dwarfs the rest of the imports. There was a substantial leap in volume of imports from 2017-2018. Nigeria does not make any significant export of compressors to the world.
Figure 90: Nigeria's compressor imports from top 10 trading partners (2014-2018)
0
50,000
100,000
150,000
200,000
250,000
300,000
350,000
400,000
2014 2016 2017 2018
RA
C im
port
s (
units)
China Thailand Turkey
Malaysia UAE India
Rep. of Korea Germany Singapore
Belgium
0
1,000,000
2,000,000
3,000,000
4,000,000
5,000,000
6,000,000
2014 2016 2017 2018
Com
pre
sso
r im
po
rts (
kg
)
China India
Indonesia South Africa
Belgium USA
Greece Germany
UAE United Kingdom
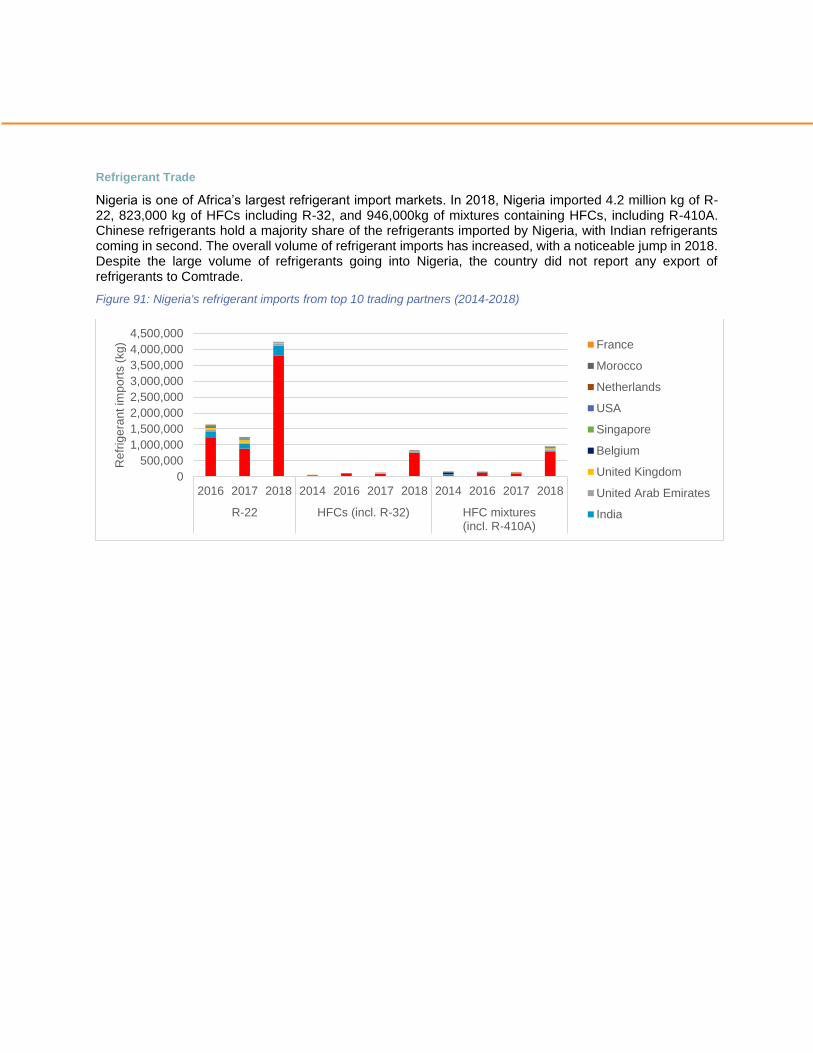
Refrigerant Trade
Nigeria is one of Africa’s largest refrigerant import markets. In 2018, Nigeria imported 4.2 million kg of R-22, 823,000 kg of HFCs including R-32, and 946,000kg of mixtures containing HFCs, including R-410A. Chinese refrigerants hold a majority share of the refrigerants imported by Nigeria, with Indian refrigerants coming in second. The overall volume of refrigerant imports has increased, with a noticeable jump in 2018. Despite the large volume of refrigerants going into Nigeria, the country did not report any export of refrigerants to Comtrade.
Figure 91: Nigeria's refrigerant imports from top 10 trading partners (2014-2018)
0
500,000
1,000,000
1,500,000
2,000,000
2,500,000
3,000,000
3,500,000
4,000,000
4,500,000
2016 2017 2018 2014 2016 2017 2018 2014 2016 2017 2018
R-22 HFCs (incl. R-32) HFC mixtures(incl. R-410A)
Refr
ige
ran
t im
po
rts (
kg
) France
Morocco
Netherlands
USA
Singapore
Belgium
United Kingdom
United Arab Emirates
India
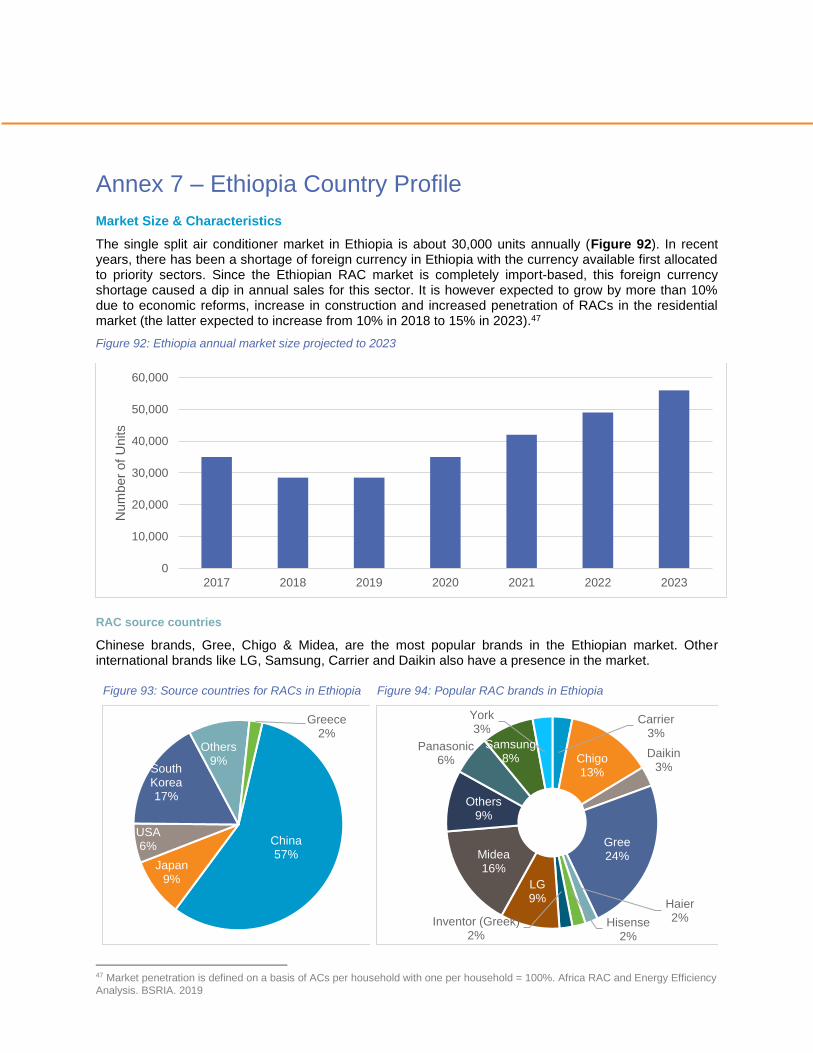
Annex 7 – Ethiopia Country Profile
Market Size & Characteristics
The single split air conditioner market in Ethiopia is about 30,000 units annually (Figure 92). In recent years, there has been a shortage of foreign currency in Ethiopia with the currency available first allocated to priority sectors. Since the Ethiopian RAC market is completely import-based, this foreign currency shortage caused a dip in annual sales for this sector. It is however expected to grow by more than 10% due to economic reforms, increase in construction and increased penetration of RACs in the residential market (the latter expected to increase from 10% in 2018 to 15% in 2023).47
Figure 92: Ethiopia annual market size projected to 2023
RAC source countries
Chinese brands, Gree, Chigo & Midea, are the most popular brands in the Ethiopian market. Other international brands like LG, Samsung, Carrier and Daikin also have a presence in the market.
Figure 93: Source countries for RACs in Ethiopia
Figure 94: Popular RAC brands in Ethiopia
47 Market penetration is defined on a basis of ACs per household with one per household = 100%. Africa RAC and Energy Efficiency
Analysis. BSRIA. 2019
0
10,000
20,000
30,000
40,000
50,000
60,000
2017 2018 2019 2020 2021 2022 2023
Num
ber
of
Units
China57%
Japan9%
USA6%
South Korea17%
Others9%
Greece2%
Carrier3%
Chigo13%
Daikin3%
Gree24%
Haier2%Hisense
2%
Inventor (Greek)2%
LG9%
Midea16%
Others9%
Panasonic6%
Samsung8%
York3%
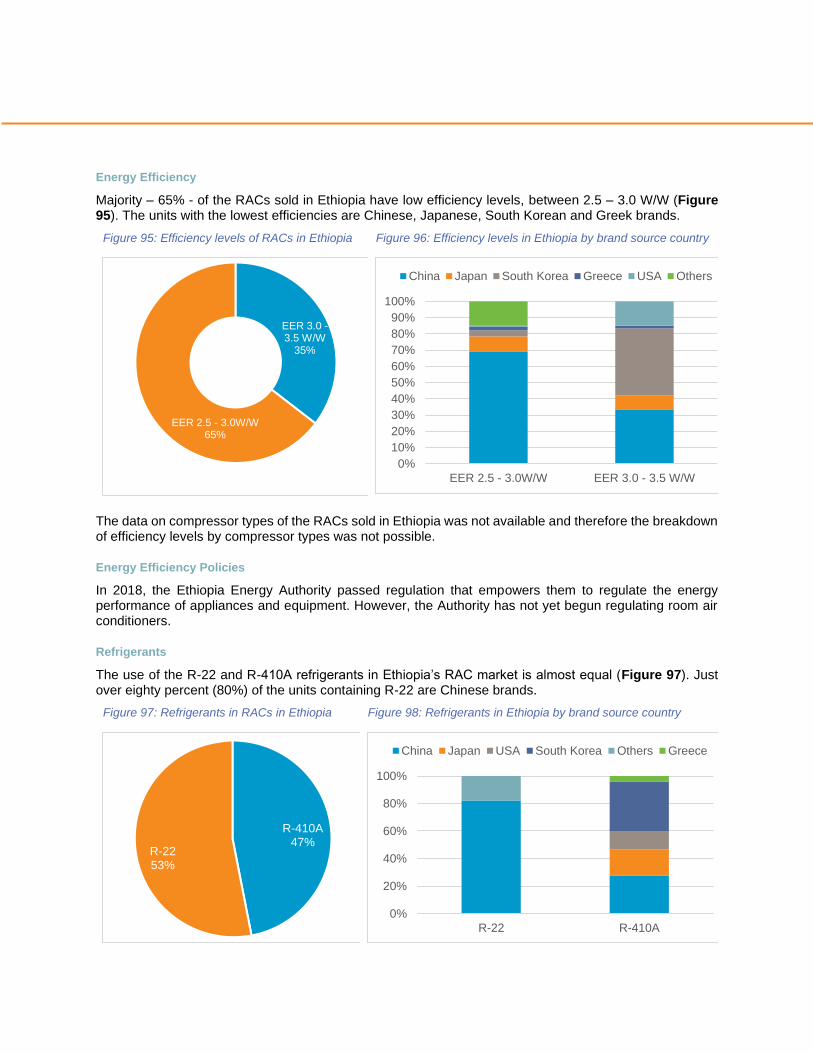
Energy Efficiency
Majority – 65% - of the RACs sold in Ethiopia have low efficiency levels, between 2.5 – 3.0 W/W (Figure 95). The units with the lowest efficiencies are Chinese, Japanese, South Korean and Greek brands.
Figure 95: Efficiency levels of RACs in Ethiopia
Figure 96: Efficiency levels in Ethiopia by brand source country
The data on compressor types of the RACs sold in Ethiopia was not available and therefore the breakdown of efficiency levels by compressor types was not possible.
Energy Efficiency Policies
In 2018, the Ethiopia Energy Authority passed regulation that empowers them to regulate the energy performance of appliances and equipment. However, the Authority has not yet begun regulating room air conditioners.
Refrigerants
The use of the R-22 and R-410A refrigerants in Ethiopia’s RAC market is almost equal (Figure 97). Just over eighty percent (80%) of the units containing R-22 are Chinese brands.
Figure 97: Refrigerants in RACs in Ethiopia
Figure 98: Refrigerants in Ethiopia by brand source country
EER 3.0 -3.5 W/W
35%
EER 2.5 - 3.0W/W65%
0%
10%
20%
30%
40%
50%
60%
70%
80%
90%
100%
EER 2.5 - 3.0W/W EER 3.0 - 3.5 W/W
China Japan South Korea Greece USA Others
R-410A47%
R-2253%
0%
20%
40%
60%
80%
100%
R-22 R-410A
China Japan USA South Korea Others Greece

Trade Flows
RAC Trade
In 2016, the most recent year for which Comtrade had import/export data on Ethiopia, the country imported just under 18,000 RACs. Though Ethiopia’s import market for RACs is small, it does appear to be growing. Ethiopia primarily imports RACs from China, with Italy and the United Arab Emirates being the next largest identifiable import partners.48 Ethiopia is not a major exporter of RACs to the region or the world.
Figure 99: Ethiopia's RAC imports from top 10 trading partners (2014-2016)
Figure 100: Ethiopia's RAC exports
Compressor Trade
In 2018, Ethiopia imported just over 319,000kg of compressors, primarily from China, India and Italy. The volume of imports varies from year to year – no clear trend is evident. Ethiopia is not a major exporter of compressors. The largest volumes of exports in 2016 were directed to Uganda, the United Kingdom and the United Arab Emirates.
48 A large amount of Ethiopia’s RAC imports as reported by Comtrade originate from “Areas, nes.” Areas NES (not elsewhere
specified)" is used by Comtrade (a) for low value trade and (b) if the partner designation was unknown to the reporting country or if
an error was made in the partner assignment. CLASP elected to remove this data from the charts so as to provide a clearer picture
of the main known trading partners.
0
2,000
4,000
6,000
8,000
10,000
12,000
14,000
16,000
18,000
20,000
2014 2015 2016
RA
C im
port
s (
units)
China United Arab Emirates
Italy Malaysia
Thailand Rep. of Korea
Saudi Arabia Egypt
India
0
50
100
150
200
250
300
350
400
450
500
2014 2015 2016
RA
C e
xport
s (
units)
United Arab Emirates United Kingdom
Djibouti Algeria
USA South Africa
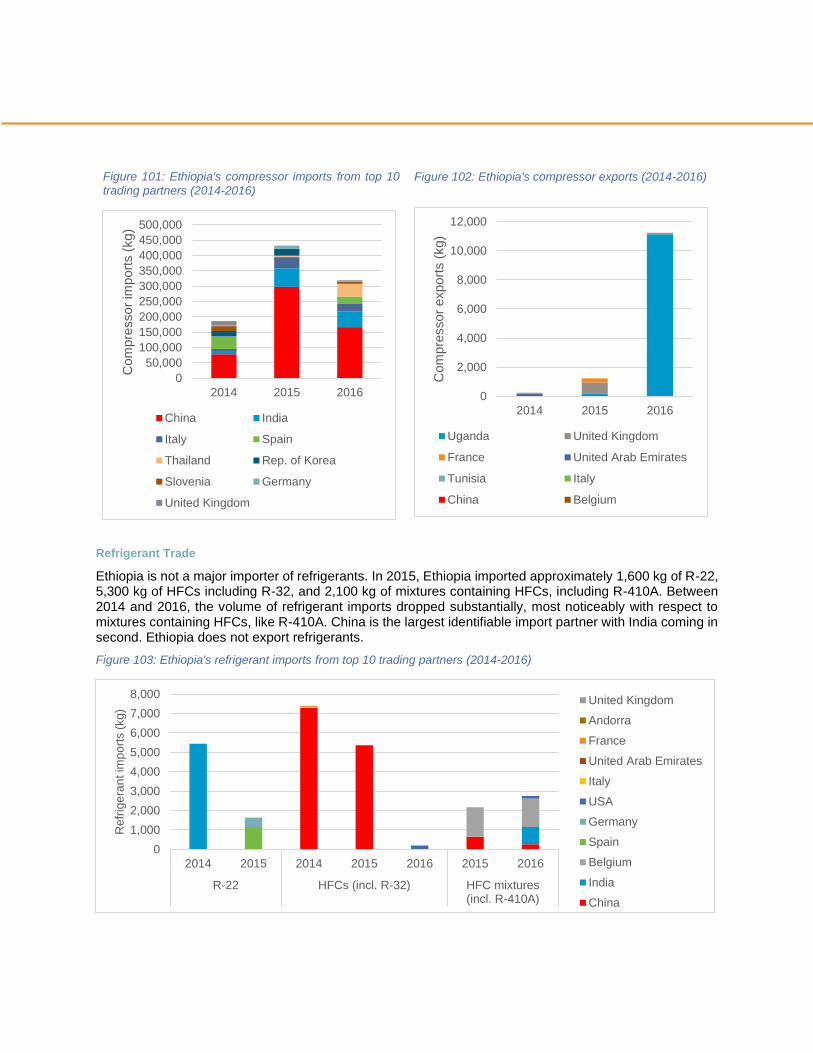
Figure 101: Ethiopia's compressor imports from top 10
trading partners (2014-2016)
Figure 102: Ethiopia's compressor exports (2014-2016)
Refrigerant Trade
Ethiopia is not a major importer of refrigerants. In 2015, Ethiopia imported approximately 1,600 kg of R-22, 5,300 kg of HFCs including R-32, and 2,100 kg of mixtures containing HFCs, including R-410A. Between 2014 and 2016, the volume of refrigerant imports dropped substantially, most noticeably with respect to mixtures containing HFCs, like R-410A. China is the largest identifiable import partner with India coming in second. Ethiopia does not export refrigerants.
Figure 103: Ethiopia's refrigerant imports from top 10 trading partners (2014-2016)
0
50,000
100,000
150,000
200,000
250,000
300,000
350,000
400,000
450,000
500,000
2014 2015 2016
Com
pre
ssor
import
s (
kg)
China India
Italy Spain
Thailand Rep. of Korea
Slovenia Germany
United Kingdom
0
2,000
4,000
6,000
8,000
10,000
12,000
2014 2015 2016
Com
pre
ssor
export
s (
kg)
Uganda United Kingdom
France United Arab Emirates
Tunisia Italy
China Belgium
0
1,000
2,000
3,000
4,000
5,000
6,000
7,000
8,000
2014 2015 2014 2015 2016 2015 2016
R-22 HFCs (incl. R-32) HFC mixtures(incl. R-410A)
Refr
ige
ran
t im
po
rts (
kg
)
United Kingdom
Andorra
France
United Arab Emirates
Italy
USA
Germany
Spain
Belgium
India
China
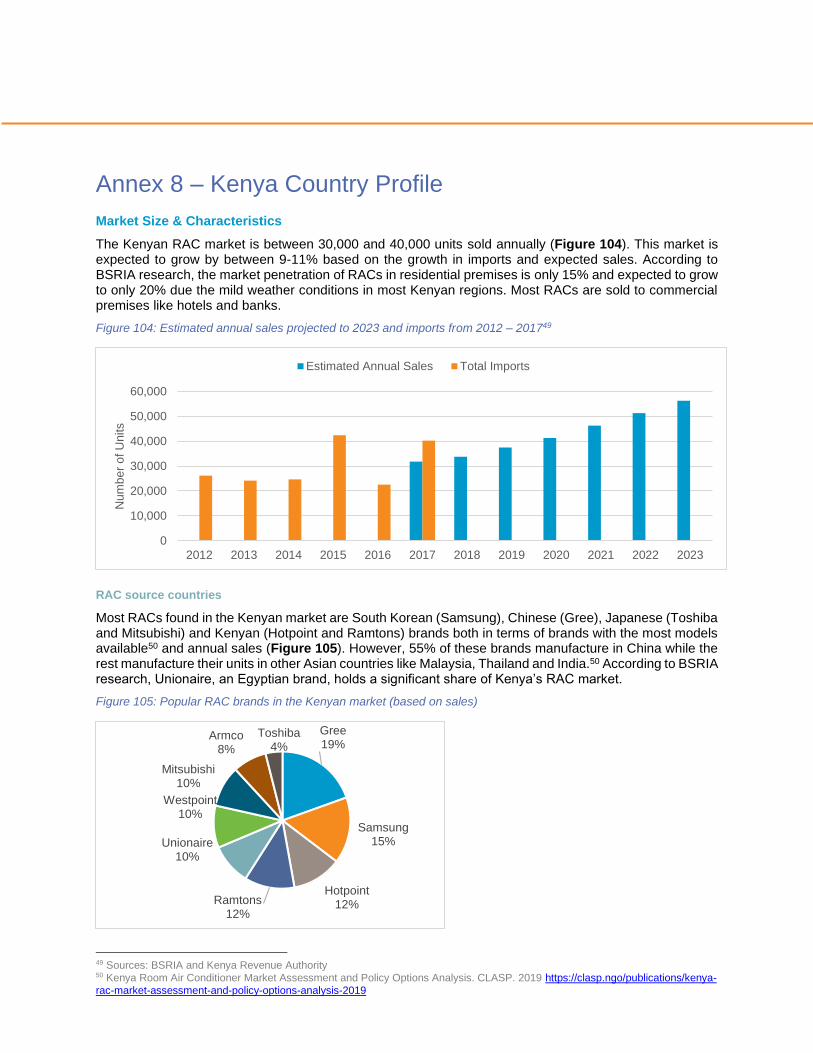
Annex 8 – Kenya Country Profile
Market Size & Characteristics
The Kenyan RAC market is between 30,000 and 40,000 units sold annually (Figure 104). This market is expected to grow by between 9-11% based on the growth in imports and expected sales. According to BSRIA research, the market penetration of RACs in residential premises is only 15% and expected to grow to only 20% due the mild weather conditions in most Kenyan regions. Most RACs are sold to commercial premises like hotels and banks.
Figure 104: Estimated annual sales projected to 2023 and imports from 2012 – 201749
RAC source countries
Most RACs found in the Kenyan market are South Korean (Samsung), Chinese (Gree), Japanese (Toshiba and Mitsubishi) and Kenyan (Hotpoint and Ramtons) brands both in terms of brands with the most models available50 and annual sales (Figure 105). However, 55% of these brands manufacture in China while the rest manufacture their units in other Asian countries like Malaysia, Thailand and India.50 According to BSRIA research, Unionaire, an Egyptian brand, holds a significant share of Kenya’s RAC market.
Figure 105: Popular RAC brands in the Kenyan market (based on sales)
49 Sources: BSRIA and Kenya Revenue Authority 50 Kenya Room Air Conditioner Market Assessment and Policy Options Analysis. CLASP. 2019 https://clasp.ngo/publications/kenya-
rac-market-assessment-and-policy-options-analysis-2019
0
10,000
20,000
30,000
40,000
50,000
60,000
2012 2013 2014 2015 2016 2017 2018 2019 2020 2021 2022 2023
Num
be
r o
f U
nits
Estimated Annual Sales Total Imports
Gree19%
Samsung15%
Hotpoint12%Ramtons
12%
Unionaire10%
Westpoint10%
Mitsubishi10%
Armco8%
Toshiba4%
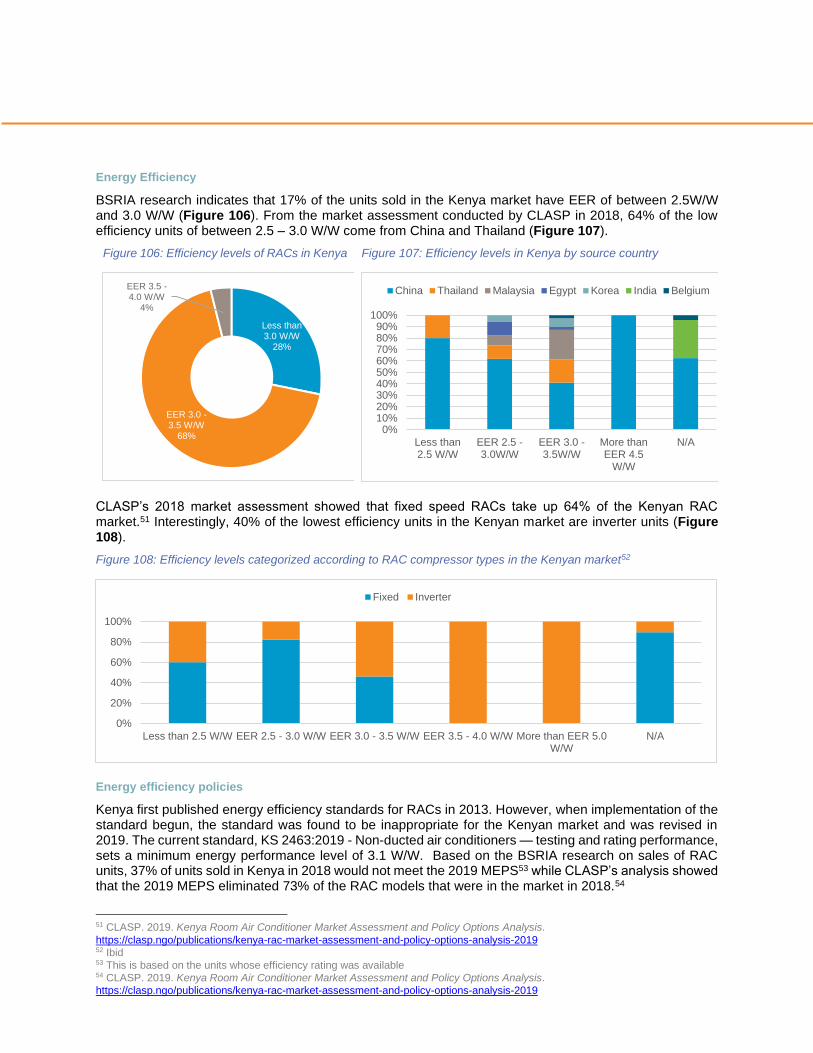
Energy Efficiency
BSRIA research indicates that 17% of the units sold in the Kenya market have EER of between 2.5W/W and 3.0 W/W (Figure 106). From the market assessment conducted by CLASP in 2018, 64% of the low efficiency units of between 2.5 – 3.0 W/W come from China and Thailand (Figure 107).
Figure 106: Efficiency levels of RACs in Kenya
Figure 107: Efficiency levels in Kenya by source country
CLASP’s 2018 market assessment showed that fixed speed RACs take up 64% of the Kenyan RAC market.51 Interestingly, 40% of the lowest efficiency units in the Kenyan market are inverter units (Figure 108).
Figure 108: Efficiency levels categorized according to RAC compressor types in the Kenyan market52
Energy efficiency policies
Kenya first published energy efficiency standards for RACs in 2013. However, when implementation of the standard begun, the standard was found to be inappropriate for the Kenyan market and was revised in 2019. The current standard, KS 2463:2019 - Non-ducted air conditioners — testing and rating performance, sets a minimum energy performance level of 3.1 W/W. Based on the BSRIA research on sales of RAC units, 37% of units sold in Kenya in 2018 would not meet the 2019 MEPS53 while CLASP’s analysis showed that the 2019 MEPS eliminated 73% of the RAC models that were in the market in 2018.54
51 CLASP. 2019. Kenya Room Air Conditioner Market Assessment and Policy Options Analysis.
https://clasp.ngo/publications/kenya-rac-market-assessment-and-policy-options-analysis-2019 52 Ibid 53 This is based on the units whose efficiency rating was available 54 CLASP. 2019. Kenya Room Air Conditioner Market Assessment and Policy Options Analysis.
https://clasp.ngo/publications/kenya-rac-market-assessment-and-policy-options-analysis-2019
Less than 3.0 W/W
28%
EER 3.0 -3.5 W/W
68%
EER 3.5 -4.0 W/W
4%
0%10%20%30%40%50%60%70%80%90%
100%
Less than2.5 W/W
EER 2.5 -3.0W/W
EER 3.0 -3.5W/W
More thanEER 4.5
W/W
N/A
China Thailand Malaysia Egypt Korea India Belgium
0%
20%
40%
60%
80%
100%
Less than 2.5 W/W EER 2.5 - 3.0 W/W EER 3.0 - 3.5 W/W EER 3.5 - 4.0 W/W More than EER 5.0W/W
N/A
Fixed Inverter
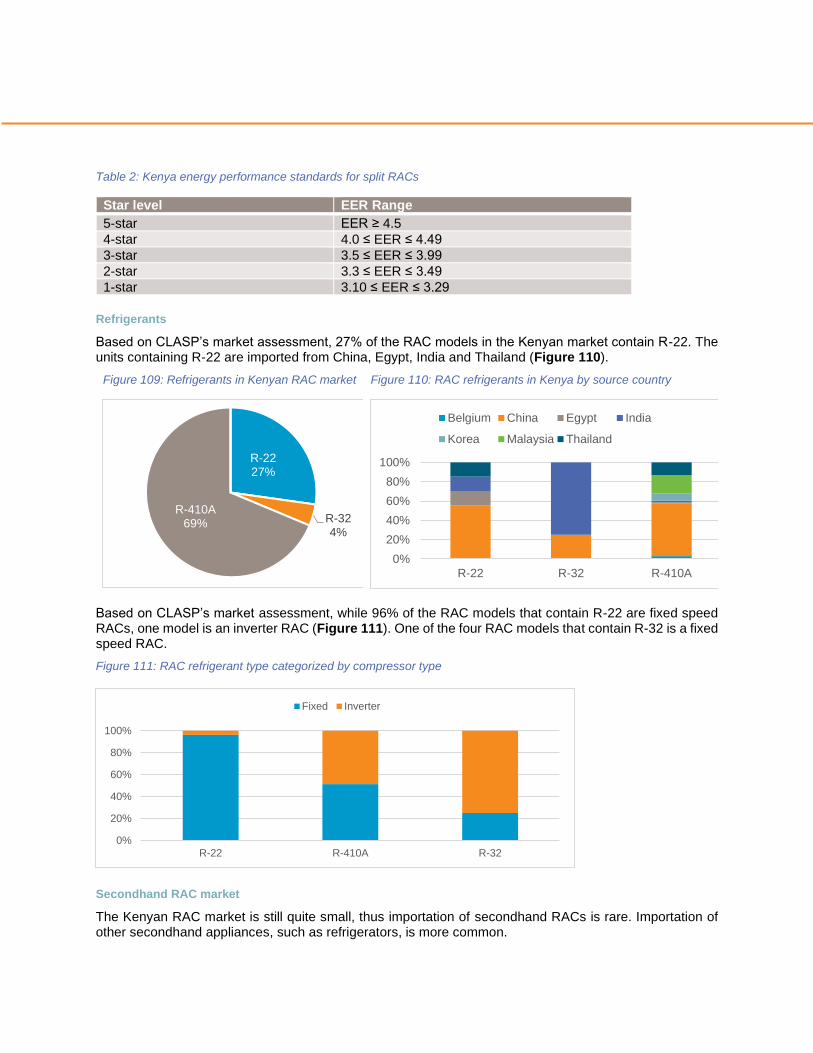
Table 2: Kenya energy performance standards for split RACs
Star level EER Range
5-star EER ≥ 4.5
4-star 4.0 ≤ EER ≤ 4.49
3-star 3.5 ≤ EER ≤ 3.99
2-star 3.3 ≤ EER ≤ 3.49
1-star 3.10 ≤ EER ≤ 3.29
Refrigerants
Based on CLASP’s market assessment, 27% of the RAC models in the Kenyan market contain R-22. The units containing R-22 are imported from China, Egypt, India and Thailand (Figure 110).
Figure 109: Refrigerants in Kenyan RAC market
Figure 110: RAC refrigerants in Kenya by source country
Based on CLASP’s market assessment, while 96% of the RAC models that contain R-22 are fixed speed RACs, one model is an inverter RAC (Figure 111). One of the four RAC models that contain R-32 is a fixed speed RAC.
Figure 111: RAC refrigerant type categorized by compressor type
Secondhand RAC market
The Kenyan RAC market is still quite small, thus importation of secondhand RACs is rare. Importation of other secondhand appliances, such as refrigerators, is more common.
R-2227%
R-324%
R-410A69%
0%
20%
40%
60%
80%
100%
R-22 R-32 R-410A
Belgium China Egypt India
Korea Malaysia Thailand
0%
20%
40%
60%
80%
100%
R-22 R-410A R-32
Fixed Inverter
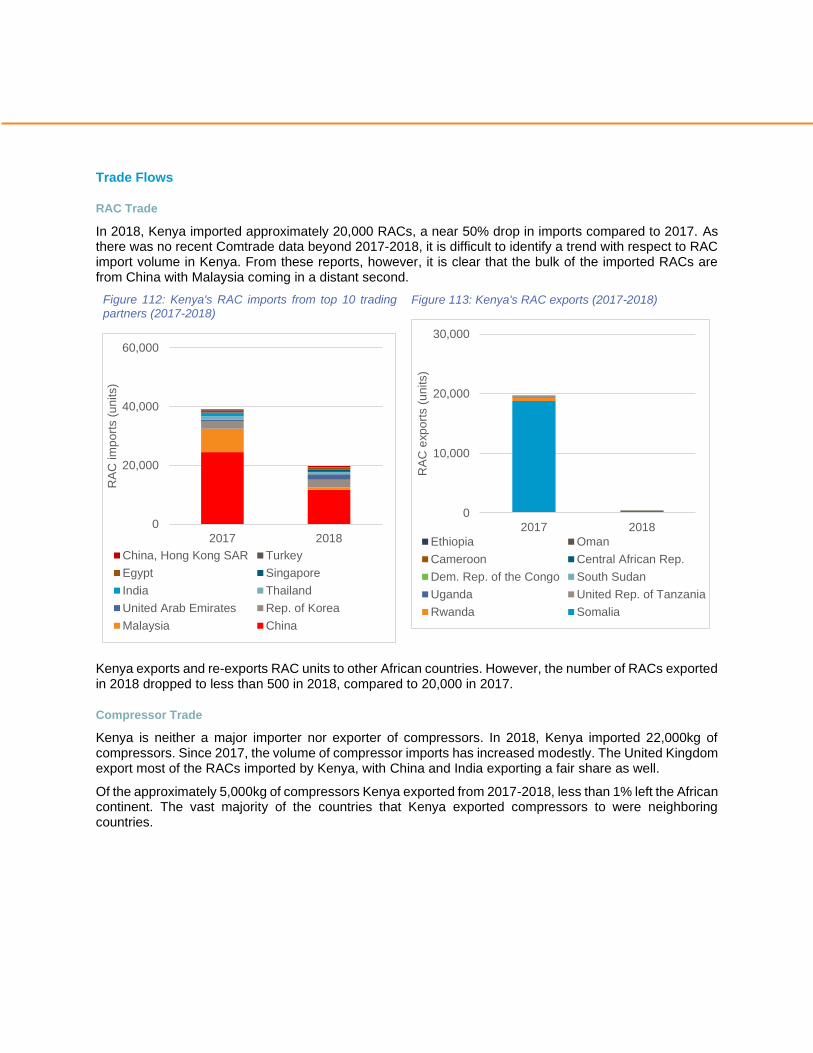
Trade Flows
RAC Trade
In 2018, Kenya imported approximately 20,000 RACs, a near 50% drop in imports compared to 2017. As there was no recent Comtrade data beyond 2017-2018, it is difficult to identify a trend with respect to RAC import volume in Kenya. From these reports, however, it is clear that the bulk of the imported RACs are from China with Malaysia coming in a distant second.
Figure 112: Kenya's RAC imports from top 10 trading partners (2017-2018)
Figure 113: Kenya's RAC exports (2017-2018)
Kenya exports and re-exports RAC units to other African countries. However, the number of RACs exported in 2018 dropped to less than 500 in 2018, compared to 20,000 in 2017.
Compressor Trade
Kenya is neither a major importer nor exporter of compressors. In 2018, Kenya imported 22,000kg of compressors. Since 2017, the volume of compressor imports has increased modestly. The United Kingdom export most of the RACs imported by Kenya, with China and India exporting a fair share as well.
Of the approximately 5,000kg of compressors Kenya exported from 2017-2018, less than 1% left the African continent. The vast majority of the countries that Kenya exported compressors to were neighboring countries.
0
20,000
40,000
60,000
2017 2018
RA
C im
po
rts (
un
its)
China, Hong Kong SAR Turkey
Egypt Singapore
India Thailand
United Arab Emirates Rep. of Korea
Malaysia China
0
10,000
20,000
30,000
2017 2018
RA
C e
xp
ort
s (
un
its)
Ethiopia Oman
Cameroon Central African Rep.
Dem. Rep. of the Congo South Sudan
Uganda United Rep. of Tanzania
Rwanda Somalia

Figure 114: Kenya's compressor imports from top 10
trading partners (2017-2018)
Figure 115: Kenya's compressor exports
Refrigerant Trade
In 2018, Kenya imported 70,000kg of R-22, 86,000kg of HFCs including R-32, and 135,000kg of mixtures containing HFCs, including R-410A. Though only these two years of data were available from the last five years, there is clear growth in Kenya’s imports of refrigerants between 2017 and 2018. Kenya’s largest import partner has been India; however, Chinese refrigerants surpassed Indian refrigerants in 2018.
Figure 116: Kenya's refrigerant imports (2017-2018)
Kenya exports a small quantity of HFCs and mixtures containing HFCs to other African countries. As can be seen in Figure 117 the overall export volume is negligible compared to Kenya’s imports of the same products, and seems to represent just a small amount of intra-African trade with smaller states.
0
5,000
10,000
15,000
20,000
25,000
2017 2018
Com
pre
sso
r im
po
rts (
kg
)
United Kingdom China
India UAE
Thailand Mexico
Denmark Rep. of Korea
France Slovakia
0
1,000
2,000
3,000
4,000
2017 2018C
om
pre
sso
r e
xp
ort
s (
kg
)Rwanda United Arab Emirates
Burundi Ethiopia
Dem. Rep. of the Congo Uganda
United Rep. of Tanzania
0
20,000
40,000
60,000
80,000
100,000
120,000
140,000
160,000
2017 2018 2017 2018 2017 2018
R-22 HFCs (incl. R-32) HFC mixtures(incl. R-410A)
Refr
ige
ran
t im
po
rts (
kg
)
Israel
Denmark
Germany
Belgium
South Africa
United Kingdom
USA
United Arab Emirates
China
India
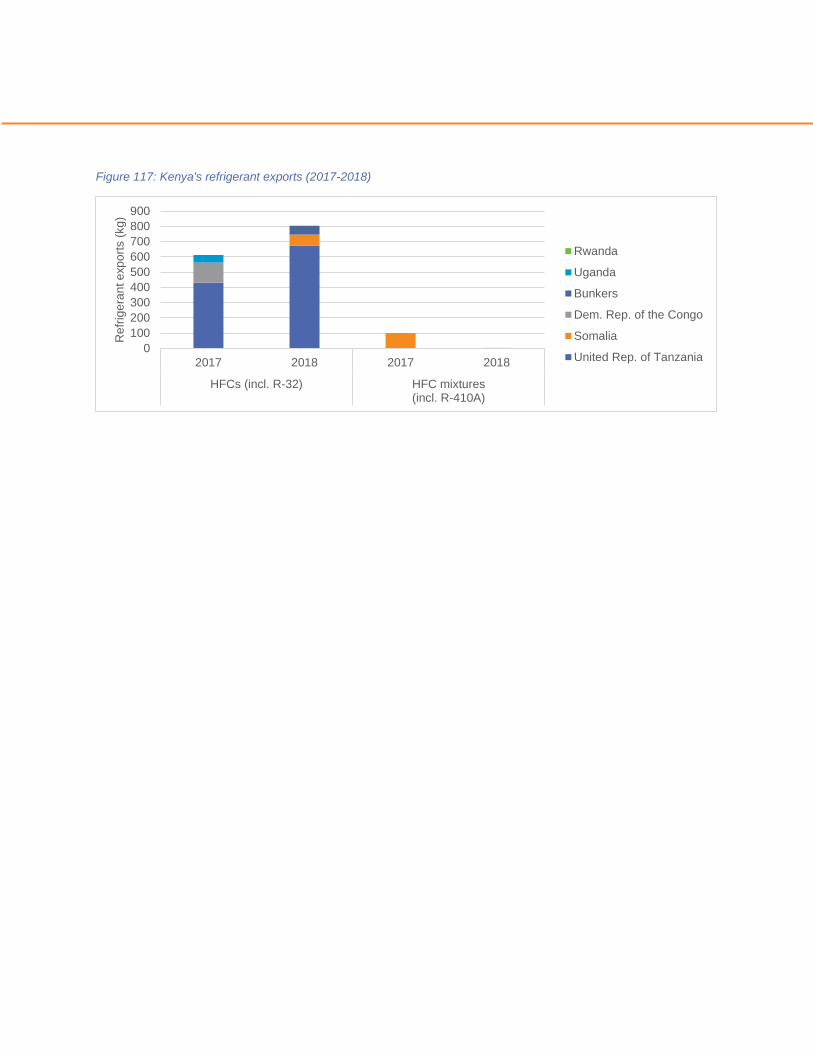
Figure 117: Kenya's refrigerant exports (2017-2018)
0
100
200
300
400
500
600
700
800
900
2017 2018 2017 2018
HFCs (incl. R-32) HFC mixtures(incl. R-410A)
Re
frig
era
nt e
xp
ort
s (
kg
)
Rwanda
Uganda
Bunkers
Dem. Rep. of the Congo
Somalia
United Rep. of Tanzania
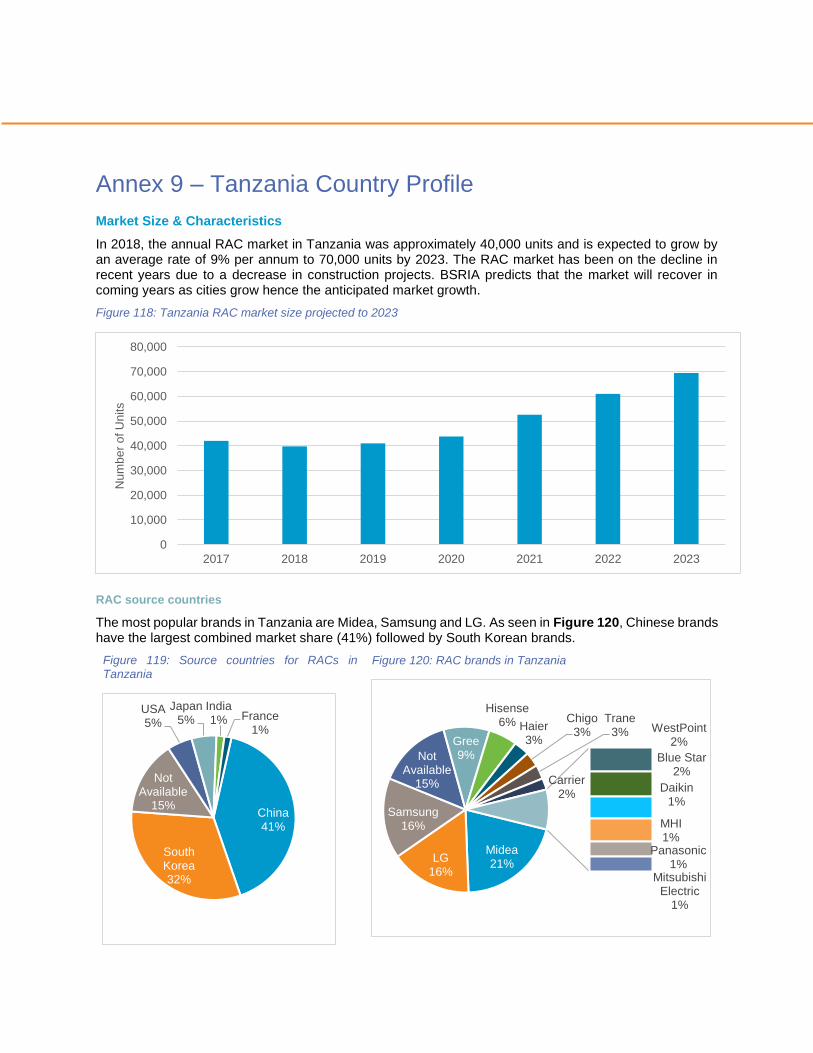
Annex 9 – Tanzania Country Profile
Market Size & Characteristics
In 2018, the annual RAC market in Tanzania was approximately 40,000 units and is expected to grow by an average rate of 9% per annum to 70,000 units by 2023. The RAC market has been on the decline in recent years due to a decrease in construction projects. BSRIA predicts that the market will recover in coming years as cities grow hence the anticipated market growth.
Figure 118: Tanzania RAC market size projected to 2023
RAC source countries
The most popular brands in Tanzania are Midea, Samsung and LG. As seen in Figure 120, Chinese brands have the largest combined market share (41%) followed by South Korean brands.
Figure 119: Source countries for RACs in Tanzania
Figure 120: RAC brands in Tanzania
0
10,000
20,000
30,000
40,000
50,000
60,000
70,000
80,000
2017 2018 2019 2020 2021 2022 2023
Num
be
r o
f U
nits
China41%
South Korea32%
Not Available
15%
USA5%
Japan5%
India1% France
1%
Midea21%
LG16%
Samsung16%
Not Available
15%
Gree9%
Hisense6% Haier
3%
Chigo3%
Trane3%
Carrier2%
WestPoint2%
Blue Star2%
Daikin1%
MHI1%
Panasonic1%
Mitsubishi Electric
1%
Other8%
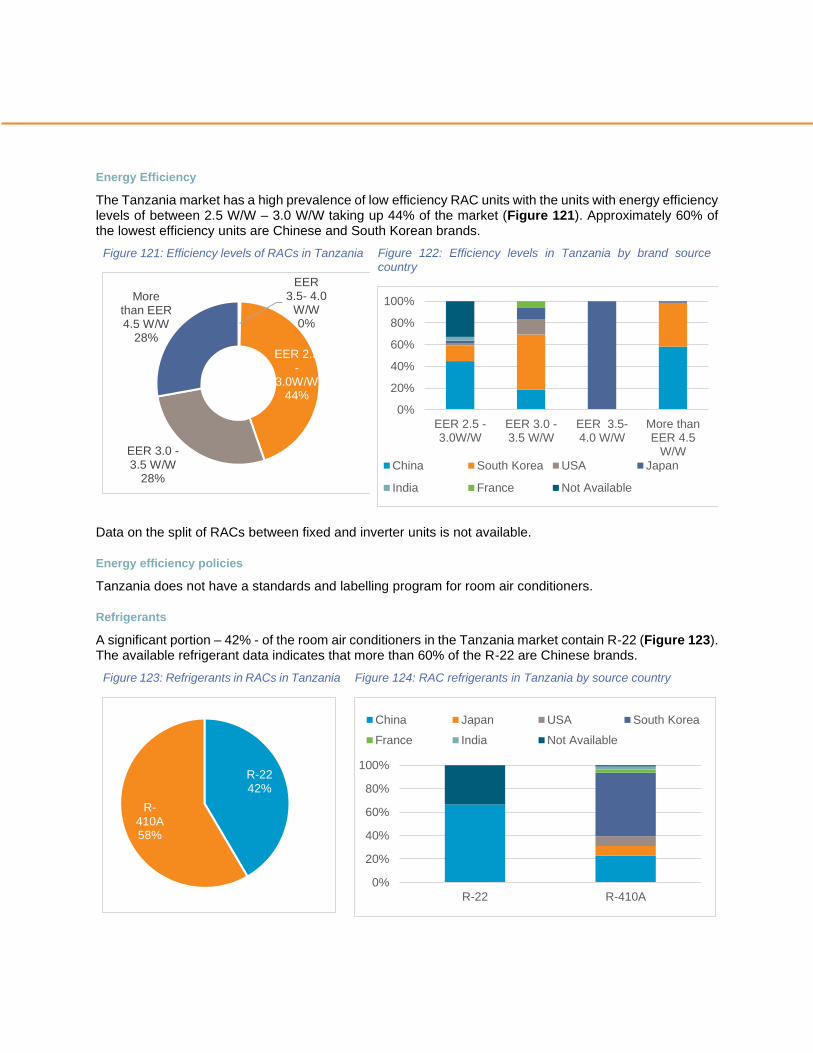
Energy Efficiency
The Tanzania market has a high prevalence of low efficiency RAC units with the units with energy efficiency levels of between 2.5 W/W – 3.0 W/W taking up 44% of the market (Figure 121). Approximately 60% of the lowest efficiency units are Chinese and South Korean brands.
Figure 121: Efficiency levels of RACs in Tanzania
Figure 122: Efficiency levels in Tanzania by brand source
country
Data on the split of RACs between fixed and inverter units is not available.
Energy efficiency policies
Tanzania does not have a standards and labelling program for room air conditioners.
Refrigerants
A significant portion – 42% - of the room air conditioners in the Tanzania market contain R-22 (Figure 123). The available refrigerant data indicates that more than 60% of the R-22 are Chinese brands.
Figure 123: Refrigerants in RACs in Tanzania
Figure 124: RAC refrigerants in Tanzania by source country
EER 3.5- 4.0
W/W0%
EER 2.5 -
3.0W/W44%
EER 3.0 -3.5 W/W
28%
More than EER 4.5 W/W
28%
0%
20%
40%
60%
80%
100%
EER 2.5 -3.0W/W
EER 3.0 -3.5 W/W
EER 3.5-4.0 W/W
More thanEER 4.5
W/W
China South Korea USA Japan
India France Not Available
R-2242%
R-410A58%
0%
20%
40%
60%
80%
100%
R-22 R-410A
China Japan USA South Korea
France India Not Available
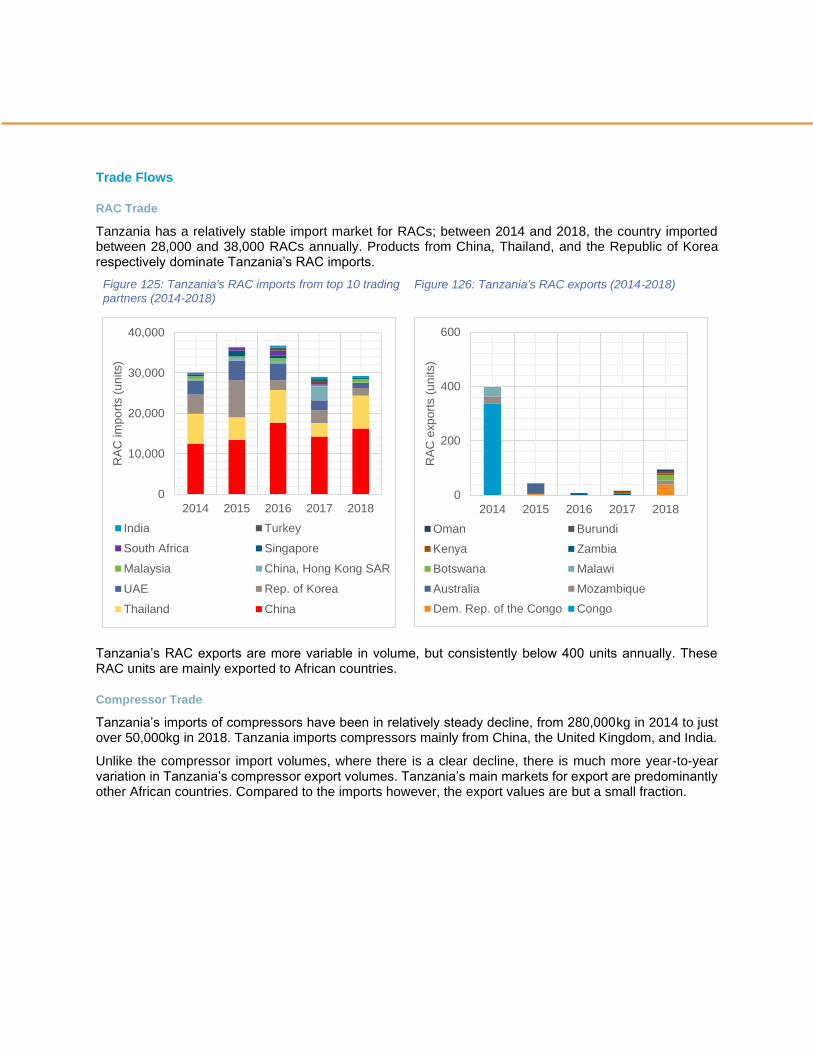
Trade Flows
RAC Trade
Tanzania has a relatively stable import market for RACs; between 2014 and 2018, the country imported between 28,000 and 38,000 RACs annually. Products from China, Thailand, and the Republic of Korea respectively dominate Tanzania’s RAC imports.
Figure 125: Tanzania's RAC imports from top 10 trading
partners (2014-2018)
Figure 126: Tanzania's RAC exports (2014-2018)
Tanzania’s RAC exports are more variable in volume, but consistently below 400 units annually. These RAC units are mainly exported to African countries.
Compressor Trade
Tanzania’s imports of compressors have been in relatively steady decline, from 280,000kg in 2014 to just over 50,000kg in 2018. Tanzania imports compressors mainly from China, the United Kingdom, and India.
Unlike the compressor import volumes, where there is a clear decline, there is much more year-to-year variation in Tanzania’s compressor export volumes. Tanzania’s main markets for export are predominantly other African countries. Compared to the imports however, the export values are but a small fraction.
0
10,000
20,000
30,000
40,000
2014 2015 2016 2017 2018
RA
C im
po
rts (
un
its)
India Turkey
South Africa Singapore
Malaysia China, Hong Kong SAR
UAE Rep. of Korea
Thailand China
0
200
400
600
2014 2015 2016 2017 2018
RA
C e
xp
ort
s (
un
its)
Oman Burundi
Kenya Zambia
Botswana Malawi
Australia Mozambique
Dem. Rep. of the Congo Congo

Figure 127: Tanzania's compressor imports from top 10
trading partners (2014-2018)
Figure 128: Tanzania's compressor exports to top 10
trading partners (2014-2018)
Refrigerant Trade
In 2018, Tanzania imported 172,000kg of R-22, 61,000kg of HFCs, including R-32, and 15,000kg of mixtures containing HFCs, including R-410A. R-22 is by far the most imported refrigerant into Tanzania. There is an incremental trend from 2014-2018 with China as the largest overall trade partner; however, it is noteworthy that in 2014-2016, India was the largest exporter to Tanzania for R-22. Mixtures containing HFCs, like R-410A, make up a smaller share Tanzania’s refrigerant imports. Tanzania does not export refrigerants.
Figure 129: Tanzania's refrigerant imports (2014-2018)
0
50,000
100,000
150,000
200,000
250,000
300,000
350,000
2014 2015 2016 2017 2018
Co
mp
resso
r im
po
rts (
kg
)
China United Kingdom
India Slovakia
UAE South Africa
Belgium Denmark
USA Thailand
0
2,000
4,000
6,000
8,000
10,000
2014 2015 2016 2017 2018
Com
pre
ssor
export
s (
kg)
Kenya South Africa
Cameroon United Kingdom
China Cote d'Ivoire
Botswana Uganda
Zambia Dem. Rep. of the Congo
0
30,000
60,000
90,000
120,000
150,000
180,000
201
4
201
5
201
6
201
7
201
8
201
4
201
5
201
6
201
7
201
8
201
4
201
5
201
6
201
7
201
8
R-22 HFCs (incl. R-32) HFC mixtures(incl. R-410A)
Refr
ige
ran
t im
po
rts (
kg
)
Singapore
Spain
Netherlands
USA
South Africa
China, Hong Kong SAR
United Arab Emirates
Switzerland
India
China
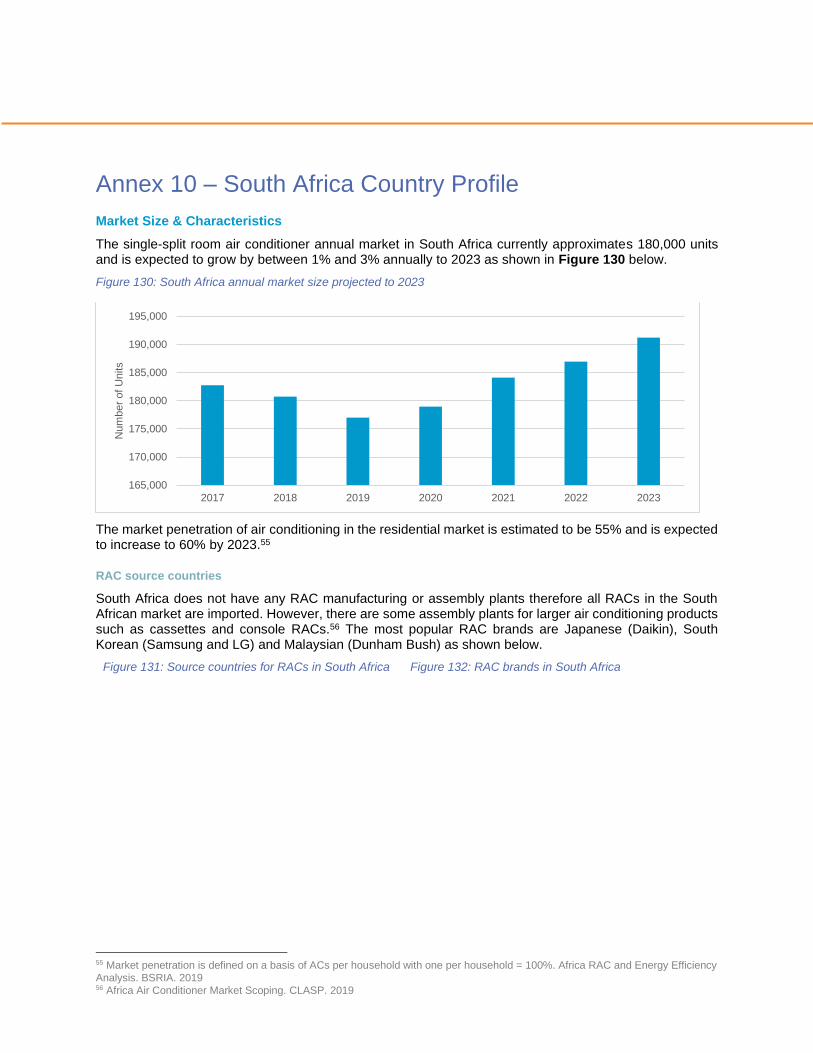
Annex 10 – South Africa Country Profile
Market Size & Characteristics
The single-split room air conditioner annual market in South Africa currently approximates 180,000 units and is expected to grow by between 1% and 3% annually to 2023 as shown in Figure 130 below.
Figure 130: South Africa annual market size projected to 2023
The market penetration of air conditioning in the residential market is estimated to be 55% and is expected to increase to 60% by 2023.55
RAC source countries
South Africa does not have any RAC manufacturing or assembly plants therefore all RACs in the South African market are imported. However, there are some assembly plants for larger air conditioning products such as cassettes and console RACs.56 The most popular RAC brands are Japanese (Daikin), South Korean (Samsung and LG) and Malaysian (Dunham Bush) as shown below.
Figure 131: Source countries for RACs in South Africa Figure 132: RAC brands in South Africa
55 Market penetration is defined on a basis of ACs per household with one per household = 100%. Africa RAC and Energy Efficiency
Analysis. BSRIA. 2019 56 Africa Air Conditioner Market Scoping. CLASP. 2019
165,000
170,000
175,000
180,000
185,000
190,000
195,000
2017 2018 2019 2020 2021 2022 2023
Num
ber
of U
nits
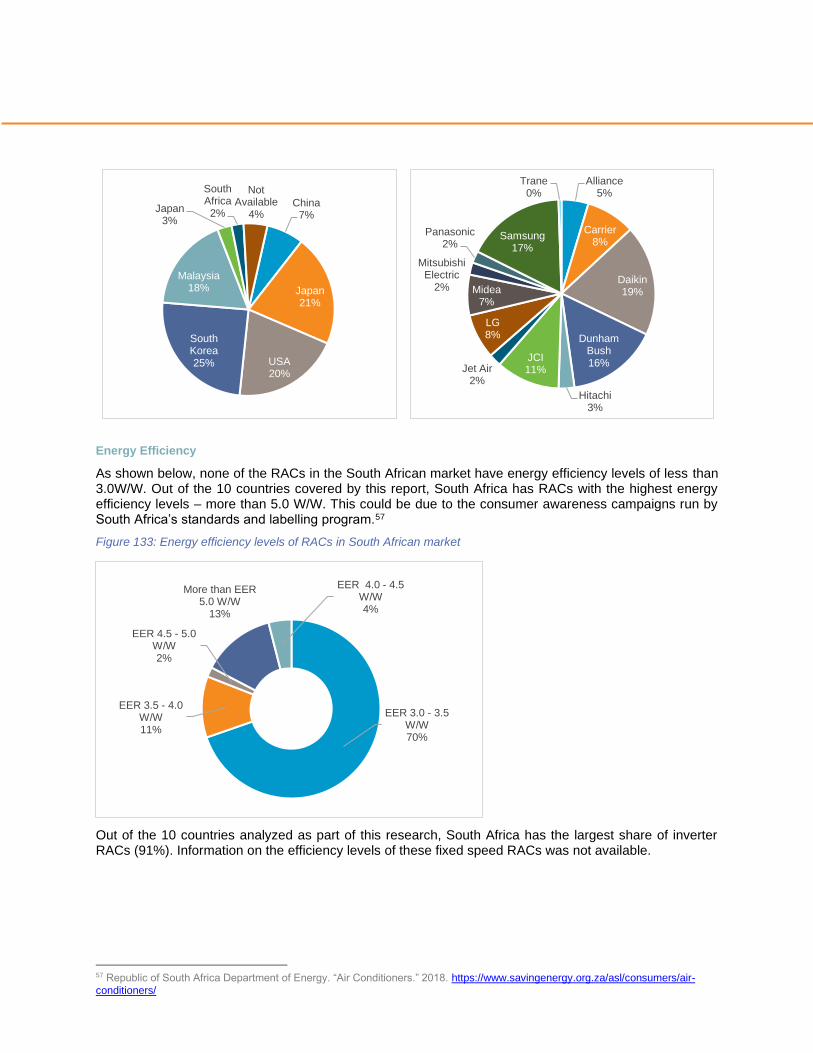
Energy Efficiency
As shown below, none of the RACs in the South African market have energy efficiency levels of less than 3.0W/W. Out of the 10 countries covered by this report, South Africa has RACs with the highest energy efficiency levels – more than 5.0 W/W. This could be due to the consumer awareness campaigns run by South Africa’s standards and labelling program.57
Figure 133: Energy efficiency levels of RACs in South African market
Out of the 10 countries analyzed as part of this research, South Africa has the largest share of inverter RACs (91%). Information on the efficiency levels of these fixed speed RACs was not available.
57 Republic of South Africa Department of Energy. “Air Conditioners.” 2018. https://www.savingenergy.org.za/asl/consumers/air-
conditioners/
China7%
Japan21%
USA20%
South Korea25%
Malaysia18%
Japan 3%
South Africa2%
Not Available
4%
Alliance5%
Carrier8%
Daikin19%
Dunham Bush16%
Hitachi3%
JCI11%Jet Air
2%
LG8%
Midea7%
Mitsubishi Electric
2%
Panasonic2%
Samsung17%
Trane0%
EER 3.0 - 3.5 W/W70%
EER 3.5 - 4.0 W/W11%
EER 4.5 - 5.0 W/W2%
More than EER 5.0 W/W
13%
EER 4.0 - 4.5 W/W4%
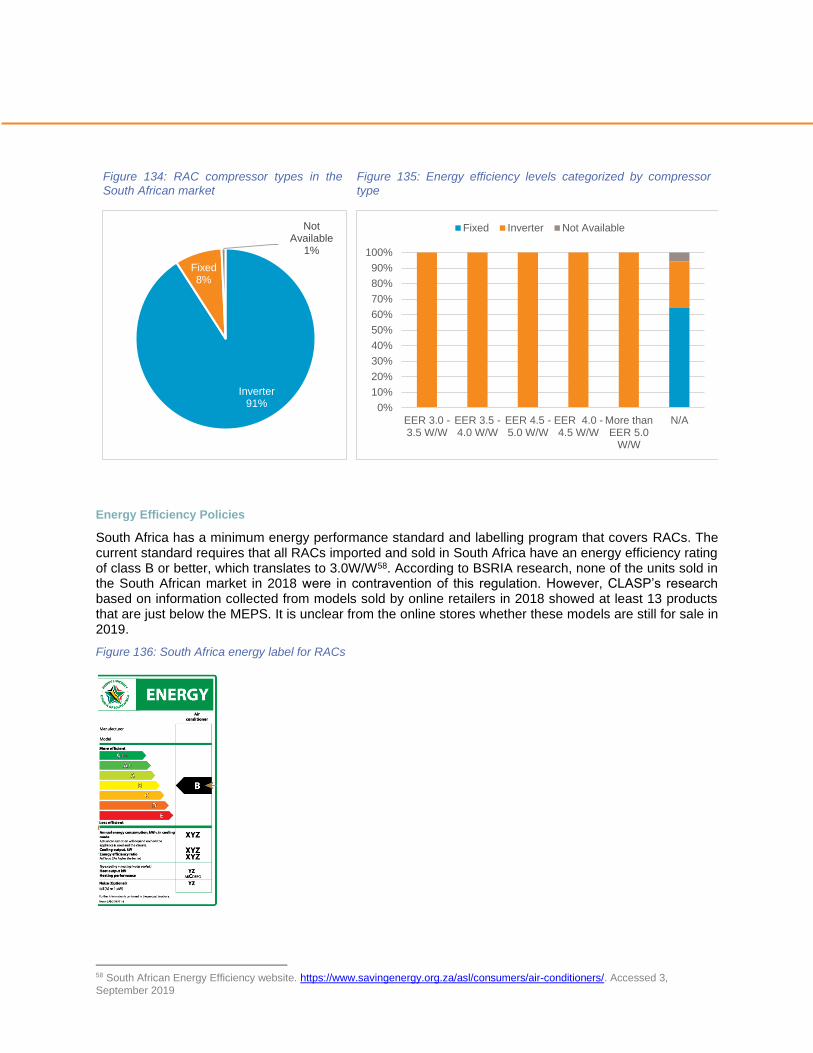
Figure 134: RAC compressor types in the
South African market
Figure 135: Energy efficiency levels categorized by compressor
type
Energy Efficiency Policies
South Africa has a minimum energy performance standard and labelling program that covers RACs. The current standard requires that all RACs imported and sold in South Africa have an energy efficiency rating of class B or better, which translates to 3.0W/W58. According to BSRIA research, none of the units sold in the South African market in 2018 were in contravention of this regulation. However, CLASP’s research based on information collected from models sold by online retailers in 2018 showed at least 13 products that are just below the MEPS. It is unclear from the online stores whether these models are still for sale in 2019.
Figure 136: South Africa energy label for RACs
58 South African Energy Efficiency website. https://www.savingenergy.org.za/asl/consumers/air-conditioners/. Accessed 3,
September 2019
Inverter91%
Fixed8%
Not Available
1%
0%
10%
20%
30%
40%
50%
60%
70%
80%
90%
100%
EER 3.0 -3.5 W/W
EER 3.5 -4.0 W/W
EER 4.5 -5.0 W/W
EER 4.0 -4.5 W/W
More thanEER 5.0
W/W
N/A
Fixed Inverter Not Available
Ghana Kenya Nigeria South Africa
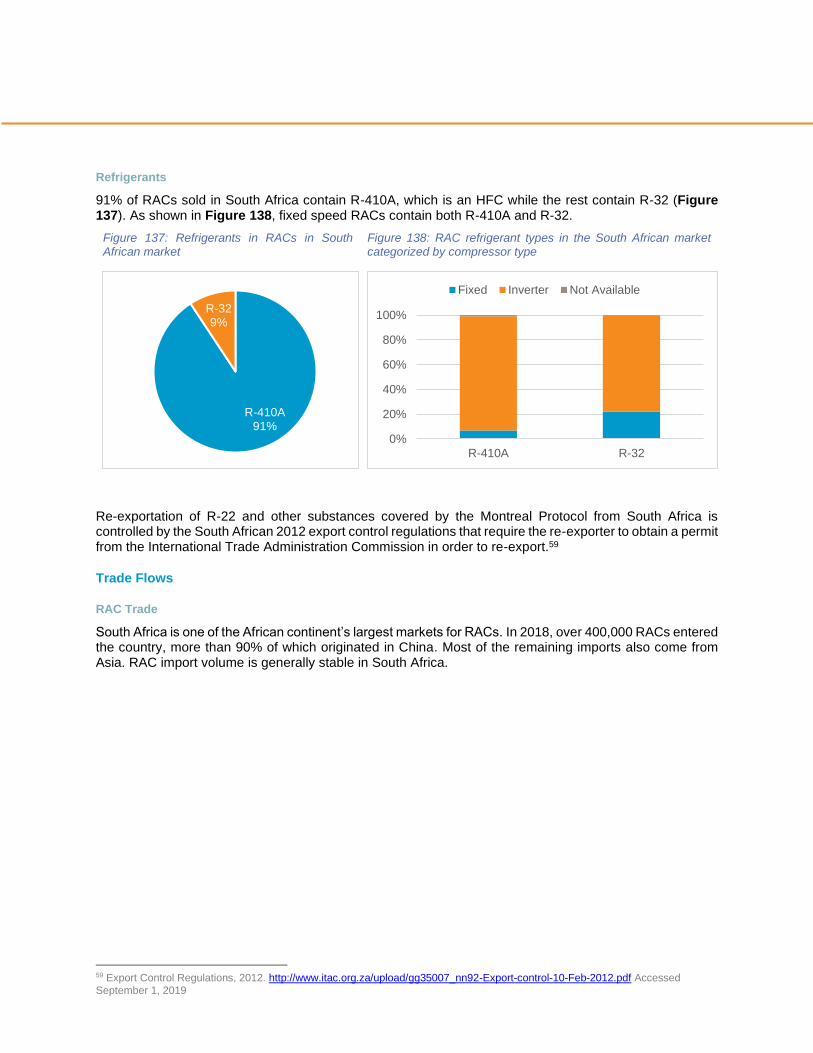
Refrigerants
91% of RACs sold in South Africa contain R-410A, which is an HFC while the rest contain R-32 (Figure 137). As shown in Figure 138, fixed speed RACs contain both R-410A and R-32.
Figure 137: Refrigerants in RACs in South African market
Figure 138: RAC refrigerant types in the South African market categorized by compressor type
Re-exportation of R-22 and other substances covered by the Montreal Protocol from South Africa is controlled by the South African 2012 export control regulations that require the re-exporter to obtain a permit from the International Trade Administration Commission in order to re-export.59
Trade Flows
RAC Trade
South Africa is one of the African continent’s largest markets for RACs. In 2018, over 400,000 RACs entered the country, more than 90% of which originated in China. Most of the remaining imports also come from Asia. RAC import volume is generally stable in South Africa.
59 Export Control Regulations, 2012. http://www.itac.org.za/upload/gg35007_nn92-Export-control-10-Feb-2012.pdf Accessed
September 1, 2019
R-410A91%
R-329%
0%
20%
40%
60%
80%
100%
R-410A R-32
Fixed Inverter Not Available
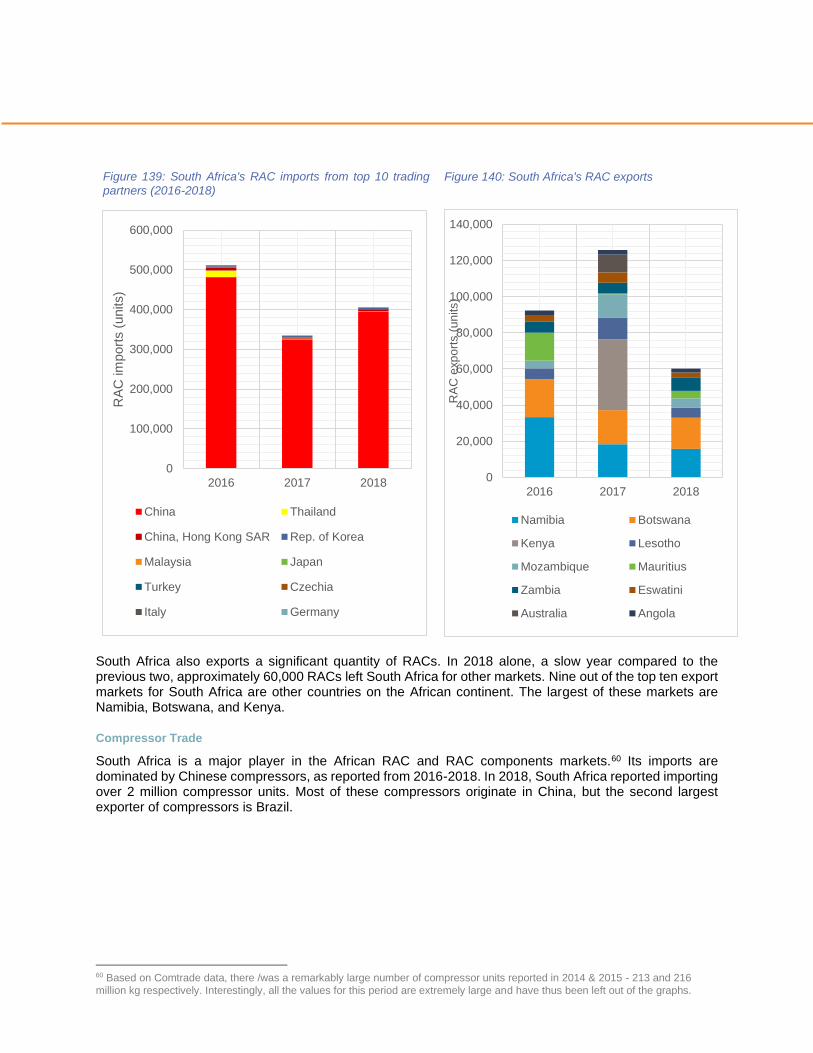
Figure 139: South Africa's RAC imports from top 10 trading
partners (2016-2018)
Figure 140: South Africa's RAC exports
South Africa also exports a significant quantity of RACs. In 2018 alone, a slow year compared to the previous two, approximately 60,000 RACs left South Africa for other markets. Nine out of the top ten export markets for South Africa are other countries on the African continent. The largest of these markets are Namibia, Botswana, and Kenya.
Compressor Trade
South Africa is a major player in the African RAC and RAC components markets.60 Its imports are dominated by Chinese compressors, as reported from 2016-2018. In 2018, South Africa reported importing over 2 million compressor units. Most of these compressors originate in China, but the second largest exporter of compressors is Brazil.
60 Based on Comtrade data, there /was a remarkably large number of compressor units reported in 2014 & 2015 - 213 and 216
million kg respectively. Interestingly, all the values for this period are extremely large and have thus been left out of the graphs.
0
100,000
200,000
300,000
400,000
500,000
600,000
2016 2017 2018
RA
C im
port
s (
units)
China Thailand
China, Hong Kong SAR Rep. of Korea
Malaysia Japan
Turkey Czechia
Italy Germany
0
20,000
40,000
60,000
80,000
100,000
120,000
140,000
2016 2017 2018
RA
C e
xp
ort
s (
un
its)
Namibia Botswana
Kenya Lesotho
Mozambique Mauritius
Zambia Eswatini
Australia Angola
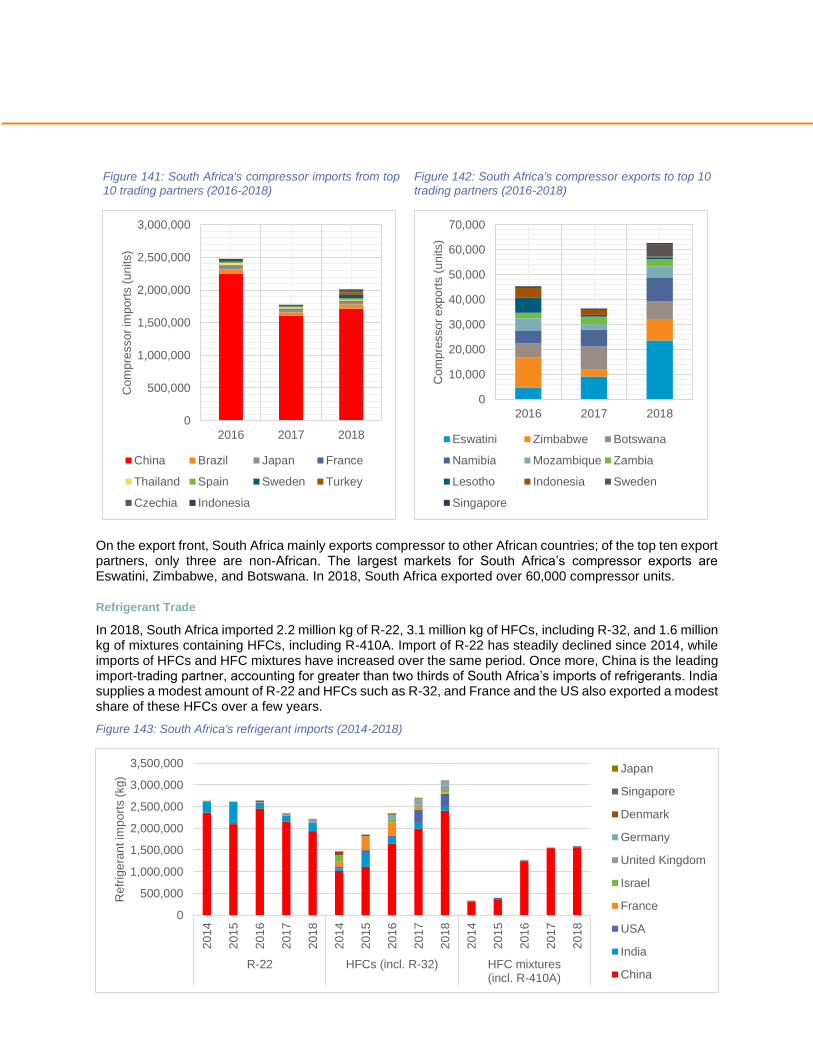
Figure 141: South Africa's compressor imports from top
10 trading partners (2016-2018)
Figure 142: South Africa's compressor exports to top 10
trading partners (2016-2018)
On the export front, South Africa mainly exports compressor to other African countries; of the top ten export partners, only three are non-African. The largest markets for South Africa’s compressor exports are Eswatini, Zimbabwe, and Botswana. In 2018, South Africa exported over 60,000 compressor units.
Refrigerant Trade
In 2018, South Africa imported 2.2 million kg of R-22, 3.1 million kg of HFCs, including R-32, and 1.6 million kg of mixtures containing HFCs, including R-410A. Import of R-22 has steadily declined since 2014, while imports of HFCs and HFC mixtures have increased over the same period. Once more, China is the leading import-trading partner, accounting for greater than two thirds of South Africa’s imports of refrigerants. India supplies a modest amount of R-22 and HFCs such as R-32, and France and the US also exported a modest share of these HFCs over a few years.
Figure 143: South Africa's refrigerant imports (2014-2018)
0
500,000
1,000,000
1,500,000
2,000,000
2,500,000
3,000,000
2016 2017 2018
Com
pre
sso
r im
po
rts (
un
its)
China Brazil Japan France
Thailand Spain Sweden Turkey
Czechia Indonesia
0
10,000
20,000
30,000
40,000
50,000
60,000
70,000
2016 2017 2018
Com
pre
sso
r e
xp
ort
s (
un
its)
Eswatini Zimbabwe Botswana
Namibia Mozambique Zambia
Lesotho Indonesia Sweden
Singapore
0
500,000
1,000,000
1,500,000
2,000,000
2,500,000
3,000,000
3,500,000
201
4
201
5
201
6
201
7
201
8
201
4
201
5
201
6
201
7
201
8
201
4
201
5
201
6
201
7
201
8
R-22 HFCs (incl. R-32) HFC mixtures(incl. R-410A)
Refr
ige
ran
t im
po
rts (
kg
)
Japan
Singapore
Denmark
Germany
United Kingdom
Israel
France
USA
India
China
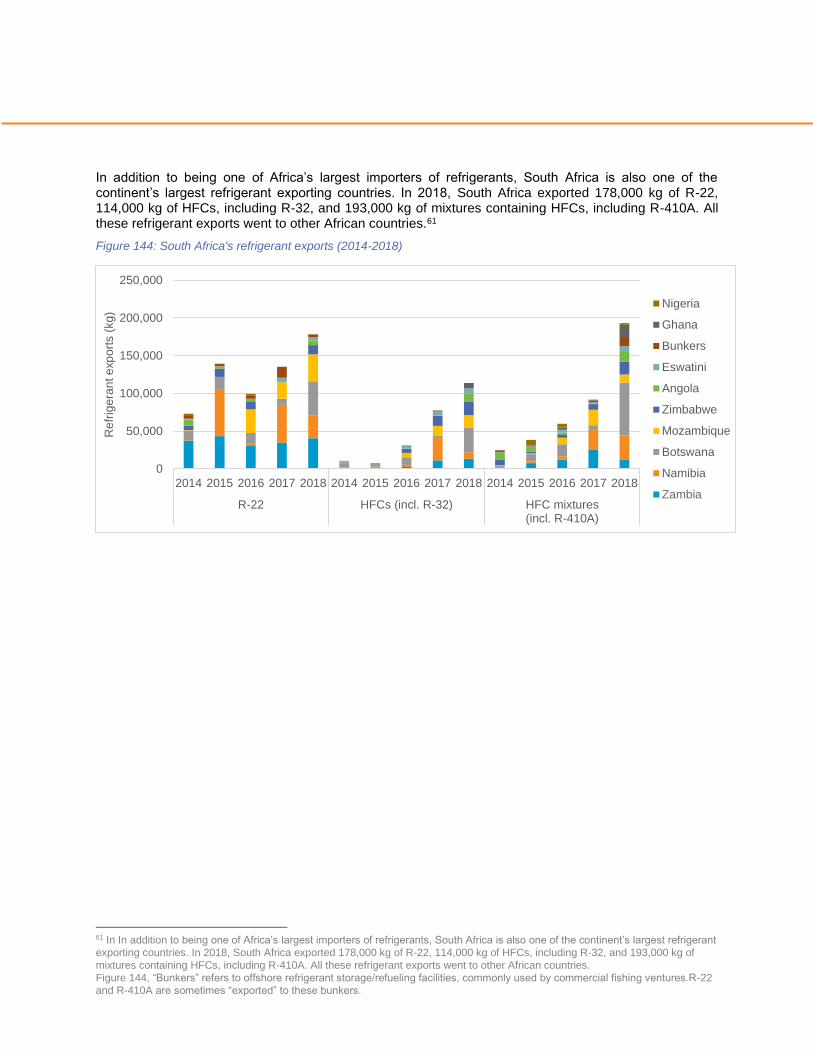
In addition to being one of Africa’s largest importers of refrigerants, South Africa is also one of the continent’s largest refrigerant exporting countries. In 2018, South Africa exported 178,000 kg of R-22, 114,000 kg of HFCs, including R-32, and 193,000 kg of mixtures containing HFCs, including R-410A. All these refrigerant exports went to other African countries.61
Figure 144: South Africa's refrigerant exports (2014-2018)
61 In In addition to being one of Africa’s largest importers of refrigerants, South Africa is also one of the continent’s largest refrigerant
exporting countries. In 2018, South Africa exported 178,000 kg of R-22, 114,000 kg of HFCs, including R-32, and 193,000 kg of
mixtures containing HFCs, including R-410A. All these refrigerant exports went to other African countries.
Figure 144, “Bunkers” refers to offshore refrigerant storage/refueling facilities, commonly used by commercial fishing ventures.R-22
and R-410A are sometimes “exported” to these bunkers.
0
50,000
100,000
150,000
200,000
250,000
2014 2015 2016 2017 2018 2014 2015 2016 2017 2018 2014 2015 2016 2017 2018
R-22 HFCs (incl. R-32) HFC mixtures(incl. R-410A)
Refr
ige
ran
t e
xp
ort
s (
kg
)
Nigeria
Ghana
Bunkers
Eswatini
Angola
Zimbabwe
Mozambique
Botswana
Namibia
Zambia
Top Related