


![STP Ozonation & Advanced Oxidation Process [AOP]](https://static.fdocuments.in/doc/165x107/58d1472a1a28ab455d8b65d5/stp-ozonation-advanced-oxidation-process-aop.jpg)


Languages
Pages
Legal

Aniline degradation by combinedphotocatalysis and ozonation
Laura SaÂnchez, Jose Peral, Xavier DomeÁnech*
Departament de QuõÂmica, Edi®ci Cn. Universitat AutoÁnoma de Barcelona, 08193 Bellaterra, Spain
Received 2 November 1997; received in revised form 28 February 1998; accepted 22 May 1998
Abstract
The combination of TiO2-assisted photocatalysis and ozonation in the degradation of aniline in aqueous solution is
investigated. From the experimental results obtained it is observed that the ozonation pretreatment followed by photocatalysis
strongly increases the yield of TOC removal in comparison to either ozonation or photocatalysis carried out separately. The
opposite sequence (photocatalysis pretreatment followed by ozonation) does not enhance the ef®ciency of aniline degradation.
Nevertheless, the highest TOC removal was achieved by simultaneous ozonation and photocatalysis. A mechanism involving
the formation of an ozonide anion radical previous to the generation of OH radicals is suggested to explain the synergic effect
between ozone and TiO2 under illumination. # 1998 Elsevier Science B.V. All rights reserved.
Keywords: Aniline; Degradation; Photocatalysis; Ozonation
1. Introduction
Photocatalysis is a promising new methodology for
carrying out the elimination of relatively recalcitrant
organic compounds [1±3]. This methodology is based
on the production of electron±hole pairs by illumina-
tion with light of suitable energy, of a semiconductor
powder dispersed in an aqueous medium. These
charge carriers migrate to the particles surface and
react with adsorbed species of suitable redox potential.
In aerated media, adsorbed molecular oxygen accepts
photogenerated electrons, while water molecules can
react with photogenerated holes to produce hydroxyl
radicals [4,5]:
O2 � eÿ ! O�ÿ2
H2O� h� ! HO� � H�
Due to its capability to generate OH radicals, which
are powerful oxidant species [6], photocatalysis can be
considered an advanced oxidation process (AOP).
However, despite that photocatalysis has shown to
be adequate for the destruction of a wide variety of
compounds, in some cases the complete mineraliza-
tion is slowly attained and the ef®ciency of the pro-
cesses, in terms of energy consumption, is only
advantageous for very dilute ef¯uents [2,7,8]. To
overcome this dif®culty some additives with different
chemical roles such as H2O2, Fe2�, Fe3�, S2O2ÿ8 , Ag�,
etc., have been added to the photocatalytic systems
[9±14]. On the other hand, the use of ozone for the
Applied Catalysis B: Environmental 19 (1998) 59±65
*Corresponding author. Tel.: +34-3-5811702; fax: +34-3-
5812920.
0926-3373/98/$ ± see front matter # 1998 Elsevier Science B.V. All rights reserved.
P I I : S 0 9 2 6 - 3 3 7 3 ( 9 8 ) 0 0 0 5 8 - 7
destruction of organics in water is also a well known
water treatment technique and research ®eld [15,16].
Unlike photocatalysis, ozonation, due to its capability
for selectively destroying recalcitrant organics, is used
as a pretreatment step before ordinary biological
techniques, thus being more ef®cient for highly con-
centrated samples treatment. The simultaneous appli-
cation of ozonation and photocatalysis has potential
use for the ef®cient treatment of organic contaminated
waters in a wide range of concentrations. Is it for that
reason that in the present paper, the combined effect of
photocatalysis and ozonation upon the degradation of
a relatively stable organic compound, such as aniline,
is studied. The in¯uence of different experimental
parameters, i.e. ozone ¯ow, pH, aniline concentration
and mass of the semiconductor on the ef®ciency of
TOC removal is investigated.
2. Experimental
All chemicals were at least of reagent grade and
were used as received. The titanium dioxide (Degussa
P-25) was predominantly anatase (80% anatase and
20% rutile), as shown by X-ray diffraction. The BET
surface area, determined from nitrogen adsorption
at ÿ1968C (accusorb 2100 Microneritics) was
59.1 m2 gÿ1. The average particle size, determined
by scanning electron microscopy, was 27 nm. Unless
otherwise stated, the concentration of TiO2 in suspen-
sion in the experiments was 2 g lÿ1. All experiments
were made at 25.0�0.18C.
Experiments were conducted in a thermostatic
cylindrical Pyrex cell of 130 cm3 capacity. The reac-
tion mixture inside the cell was maintained in suspen-
sion by magnetic stirring. As a light source, a 125 W
Philips HPK medium pressure mercury vapour lamp
was used. The intensity of the incident light inside the
photoreactor, measured employing a uranyl actino-
meter, was 9.2�10ÿ4 einstein dmÿ3 minÿ1.
Ozone was produced by a Sander Labor-Ozonisator
301.7 and was immediately bubbled through the sus-
pensions. The amount of ozone generated was deter-
mined by iodometry. In order to know the amount of
ozone consumed, the reactor outlet gas was bubbled
through a KI (0.125 mol dmÿ3) tamponed solution
and ozone was measured by iodometry. Total organic
carbon (TOC) of initial and irradiated samples was
determined with a Shimadzu TOC-5000 analyzer. The
concentration of aniline was measured by HPLC. A
Metrohm 690 Chromatograph equipped with a vis±
UV detector (795 Applied Biosystems) working at
280 nm was used. The stationary phase employed was
an Spherisorb ODS-B column [250 mm�4.6 mm
(i.d.)], while the mobile phase was a mixture of
60% CH3CN and 40% H2O.
3. Results and discussion
Different experiments using ozone, TiO2, and com-
binations of them have been performed to carry out the
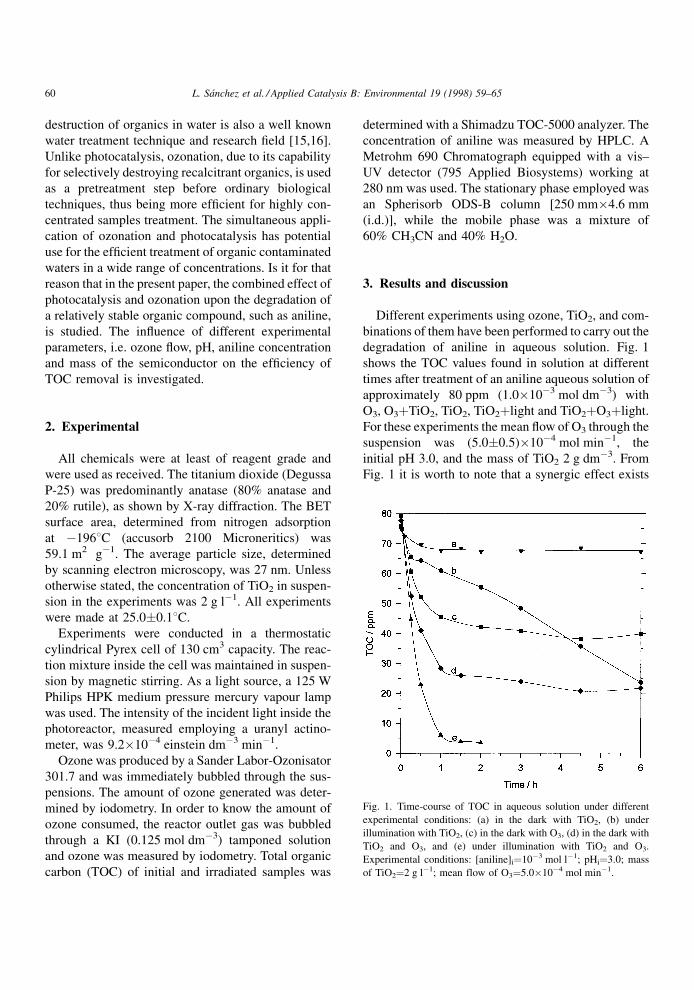
degradation of aniline in aqueous solution. Fig. 1
shows the TOC values found in solution at different
times after treatment of an aniline aqueous solution of
approximately 80 ppm (1.0�10ÿ3 mol dmÿ3) with
O3, O3�TiO2, TiO2, TiO2�light and TiO2�O3�light.
For these experiments the mean ¯ow of O3 through the
suspension was (5.0�0.5)�10ÿ4 mol minÿ1, the
initial pH 3.0, and the mass of TiO2 2 g dmÿ3. From
Fig. 1 it is worth to note that a synergic effect exists
Fig. 1. Time-course of TOC in aqueous solution under different
experimental conditions: (a) in the dark with TiO2, (b) under
illumination with TiO2, (c) in the dark with O3, (d) in the dark with
TiO2 and O3, and (e) under illumination with TiO2 and O3.
Experimental conditions: [aniline]i�10ÿ3 mol lÿ1; pHi�3.0; mass
of TiO2�2 g lÿ1; mean flow of O3�5.0�10ÿ4 mol minÿ1.
60 L. SaÂnchez et al. / Applied Catalysis B: Environmental 19 (1998) 59±65

between TiO2 and O3, specially remarkable when
comparing curve e (simultaneous effect of TiO2, O3
and light) with curves b and c. Indeed, after 2 h of
irradiation, 96% TOC reduction is detected, while in
the absence of O3 the TOC reduction is only 27%.
Comparing curve d (O3�TiO2 in the dark) with the
cumulative effect of O3 alone and TiO2 alone (curves
a�c), an increment of approximately 10% of TOC
reduction is observed with respect to the addition of
the separated O3 and TiO2 systems. This aniline
degradation enhancement can be attributed to 10%
increment of O3 ¯ow (5.3�10ÿ4 mol minÿ1) in the
experiments represented in the curve d with respect to
that of experiments of curve c (4.8�10ÿ4 mol minÿ1).
On the other hand, the ozone consumption during
irradiation (initial aniline concentration: 350 ppm)
has been determined, giving the following ratios in
terms of O3 consumed per ppm of TOC degraded:
2.3�10ÿ2 g ppmÿ1 for aniline ozonation in the dark
(the same value is obtained under illumination) and
1.1�10ÿ2 g ppmÿ1 for aniline degradation in the pre-
sence of TiO2 and O3 under illumination. The experi-
ments with combinations of O3 and light did not give
further improvement in TOC removal when compared
to the ozonation in the dark. This could be explained
by the Pyrex glass light absorption which ®lters
wavelengths below 300 nm, those required to directly
photoactivate O3.
It is interesting to emphasize that in all the experi-
ments carried out in the presence of O3 in solution the
chromatograms obtained after only 15 min of reaction
reveal the total absence of aromatic compounds such
as aniline and its oxidation derivatives like phenol,
hydroquinone, benzoquinone, nitrobenzene, etc.,
which otherwise are detected in experiments with
illuminated TiO2 suspensions in the absence of O3
in solution [14]. In fact, it is known that O3 reacts very
ef®ciently with aromatic compounds [17]. Concretely,
ozone readily reacts with aniline giving iodoaniline,
maleic acid and oxo-propanedioic acid as main inter-
mediates [18,19]. This fact suggests that an ozonation
pretreatment in the dark followed by photocatalysis
would be a fast way to perform the initial steps of
aniline degradation. Fig. 2 shows the TOC concentra-
tion vs. reaction time for an experiment where ozona-
tion of an aniline solution is followed by TiO2-assisted
photocatalysis. As can be seen, the TOC reduction at
the initial stages of photocatalysis (solid lines in
Fig. 2) is signi®cantly increased with respect to photo-
catalysis without previous ozonation treatment (see
curve b in Fig. 1). The kinetics of photocatalysis
seems to be independent of the extent of ozonation
pretreatment. In fact, the experimental points onto the
solid lines in Fig. 2 follow ®rst-order kinetics with rate
constants of 7.9�10ÿ3 and 7.8�10ÿ3 minÿ1 (correla-
tion coef®cients: 0.994 and 0.996, respectively) for 30
and 120 min preozonation, respectively. On the other
hand, the opposite sequence of events (photocatalysis
pretreatment followed by ozonation) does not appre-
ciably increase the yield of ozonation without photo-
catalytic pretreatment.
Although the strategy of ozonation pretreatment
followed by photocatalysis would be a satisfactory
route for aniline degradation, the simultaneous ozona-
tion and photocatalysis methodology leads to a larger
TOC removal which, despite being more energy and
material demanding, could be preferred from an
applied point of view. In fact, besides the direct
ozonation of the intermediate compounds, in the pre-
sence of TiO2 under illumination ozone can generate
Fig. 2. TOC vs. time in dark ozonized (- - -) samples without TiO2
followed by photocatalysis with TiO2 (ÐÐÐ). (&) First
experience: 30 min ozonation, (~) second experience: 120 min
ozonation. Experimental conditions: [aniline]i�10ÿ3 mol lÿ1;
pHi�3.0; mass of TiO2 (during photocatalysis)�2 g lÿ1; mean
flow of O3 (during ozonation)�5.0�10ÿ4 mol minÿ1. After
ozonation air was bubbled through the suspension for 10 min to
eliminate any ozone remaining in the solution.
L. SaÂnchez et al. / Applied Catalysis B: Environmental 19 (1998) 59±65 61
OH�
radicals through the formation of an ozonide
radical (O�ÿ3 ) in the adsorption layer [20]:
TiO2 � h� ! eÿ � h�
O3 � eÿ ! O�ÿ3
The generated O�ÿ3 species rapidly reacts with H� in
the solution to give HO�3 radicals (rate constant:
5�1010 molÿ1 dm3 sÿ1 [21]), which evolves to give
O2 and OH�
(rate constant: 1.4�105 sÿ1 [21]):
O�ÿ3 � H� ! HO
�3
HO�3 ! O2 � HO
�
In photocatalysis, the hydroxyl radical is generally
considered to be mainly responsible for the organic
attack. It must be considered that the OH�
radicals can
react with O3 (rate constant: 2�109 molÿ1 dm3 sÿ1
[22]),
OH� � O3 ! O2 � HO
�2
in competition with aniline and the corresponding
organic intermediates (reaction rate for aniline reac-
tion with OH�: 8.6�109 molÿ1 dm3 sÿ1 [23]). Further,
the O�ÿ2 species participates in a closed loop reaction
scheme, which leads to a continuous consumption of
ozone [24]. In the absence of O3, dissolved O2 itself
can accept TiO2 conduction band electron and gen-
erate O�ÿ2 ,
O2 � eÿ ! O�ÿ2
which in turn can be protonated to form HO�2 (rate
constant: 2�10ÿ9 molÿ1 dm3 sÿ1 [22]):
O�ÿ2 � H� ! HO
�2
In contrast with HO�3, this species cannot give OH
radicals in a single step [22] and an alternative reaction
pathway has been proposed to account for OH radicals
generation from HO�2 [25]:
2HO�2 ! H2O2 � O2
H2O2 � O�ÿ2 ! HO
� � HOÿ � O2
This mechanism requires a total of three electrons
for the generation of a single OH�
species, which is a
less favored situation if compared with the one elec-
tron needed through the O�ÿ3 reaction pathway.
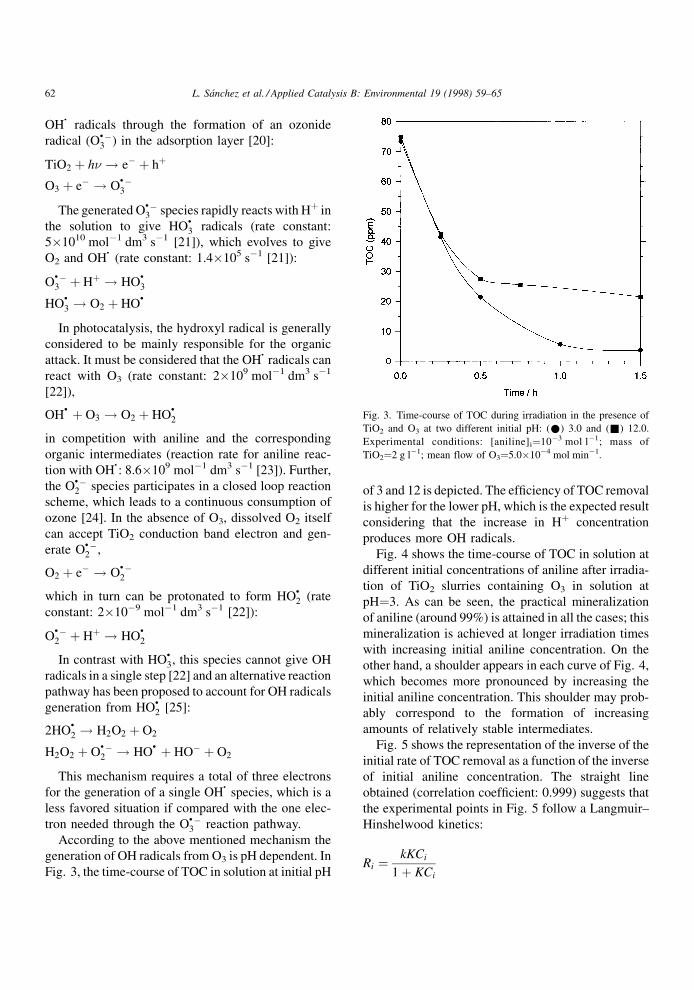
According to the above mentioned mechanism the
generation of OH radicals from O3 is pH dependent. In
Fig. 3, the time-course of TOC in solution at initial pH
of 3 and 12 is depicted. The ef®ciency of TOC removal
is higher for the lower pH, which is the expected result
considering that the increase in H� concentration
produces more OH radicals.
Fig. 4 shows the time-course of TOC in solution at
different initial concentrations of aniline after irradia-
tion of TiO2 slurries containing O3 in solution at
pH�3. As can be seen, the practical mineralization
of aniline (around 99%) is attained in all the cases; this
mineralization is achieved at longer irradiation times
with increasing initial aniline concentration. On the
other hand, a shoulder appears in each curve of Fig. 4,
which becomes more pronounced by increasing the
initial aniline concentration. This shoulder may prob-
ably correspond to the formation of increasing
amounts of relatively stable intermediates.
Fig. 5 shows the representation of the inverse of the
initial rate of TOC removal as a function of the inverse
of initial aniline concentration. The straight line
obtained (correlation coef®cient: 0.999) suggests that
the experimental points in Fig. 5 follow a Langmuir±
Hinshelwood kinetics:
Ri � kKCi
1� KCi
Fig. 3. Time-course of TOC during irradiation in the presence of
TiO2 and O3 at two different initial pH: (*) 3.0 and (&) 12.0.
Experimental conditions: [aniline]i�10ÿ3 mol lÿ1; mass of
TiO2�2 g lÿ1; mean flow of O3�5.0�10ÿ4 mol minÿ1.
62 L. SaÂnchez et al. / Applied Catalysis B: Environmental 19 (1998) 59±65

where k and K are the ®rst-order reaction rate and
adsorption equilibrium constants, respectively. The
values of these constants, deducted from the plot,
are 85.5 ppm minÿ1 and 3.47�10ÿ4 ppmÿ1 for k
and K, respectively. Because the kinetic constants
have been obtained using initial time data, it can be
assumed that these parameters are referred to aniline.
The results depicted in Fig. 4 show that mineraliza-
tion of aniline at high concentrations can be accom-
plished by simultaneous ozonation and photocatalysis,
something that either photocatalysis or ozonation
separately cannot afford. This fact is clearly shown
in Fig. 6, in which the time-course of TOC removal of
an approximately 1300 ppm (1.8�10ÿ2 mol lÿ1)
initial aniline solution is depicted. The TOC removal
was carried out by means of three different routes:
photocatalysis, ozonation, and photocataly-
sis�ozonation. As can be seen, while photocatalysis
with ozonation leads to 97% TOC removal after 7 h,
photocatalysis and ozonation separately give only
8.8% and 44% TOC reduction, respectively, for the
same time interval.
In Fig. 7, the TOC remaining in solution after
simultaneous photocatalysis and ozonation treatment
is plotted as a function of the irradiation time for
1300 ppm aniline solutions at pH 3, and in the pre-
sence of several semiconductor masses. The results
Fig. 4. Time-course of TOC for illuminated aqueous aniline
solutions of different initial concentrations. Experimental condi-
tions: pHi�3.0; mass of TiO2�2 g lÿ1; mean flow of
O3�5.0�10ÿ4 mol minÿ1.
Fig. 5. Inverse of the initial rate of TOC removal as a function of
the inverse of the initial aniline concentration. Experimental
conditions: the same as in Fig. 4.
Fig. 6. Time-course of TOC in illuminated aqueous solution under
different experimental conditions: (&) under illumination with
TiO2, (~) in the dark with O3 and (*) under illumination with
TiO2 and O3. Experimental conditions: [aniline]i�1300 ppm;
pHi�3.0; mass of TiO2�2 g lÿ1; mean flow of O3�5.0�10ÿ4 mol minÿ1.
L. SaÂnchez et al. / Applied Catalysis B: Environmental 19 (1998) 59±65 63

show that the mass of TiO2 has a limited in¯uence on
the degradation yield except for long irradiation times,
for which the suspensions with lower semiconductor
content give lower degree of TOC removal; this fact is
probably due to the gradual poisoning of the catalyst
surface with time. Similarly, the amount of ozone in
solution does not in¯uence the yield of TOC removal
during the ®rst 90 min of irradiation (see Fig. 8). For
longer irradiation times, the ef®ciency of TOC
removal clearly increases with increasing ozone ¯ow
through the suspension.
4. Conclusions
The combination of ozonation and photocatalysis
with TiO2 gives high yields of aniline degradation in
aqueous solutions. Particularly, an ozonation pretreat-
ment followed by photocatalysis signi®cantly
increases the yield of TOC removal in comparison
to either ozonation or photocatalysis acting separately.
This enhanced ef®ciency is not observed for photo-
catalysis pretreatment followed by ozonation. This
behavior can be rationalized considering that ozone
is an effective agent for the degradation of aniline and
the intermediate aromatic compounds, which, other-
wise would be slowly degraded by photocatalysis. In
this way, after ozonation, photocatalysis can progress
at high rates in an aqueous medium free of aromatic
compounds. On the other hand, even higher ef®cien-
cies of TOC removal are obtained with simultaneous
ozonation and photocatalysis. It is proposed that ozone
acts by accepting a photogenerated electron of TiO2
to form an ozonide anion radical, which is an inter-
mediate species in the formation of OH radicals.
Acknowledgements
This work was ®nancially supported by CICYT
(AMB96-0742) and FundacioÂn Domingo MartõÂnez,
to whom we are very grateful.
References
[1] X. DomeÁnech, Photocatalytic Degradation of Contaminants in
Trends in Photochemistry and Photobiology, vol. I, Council of
Scientific Research Integration, 1990, p. 265.
[2] M. Hoffmann, S. Martin, W. Choi, D. Bahnemann, Chem.
Rev. 95 (1995) 69.
Fig. 7. Time-course of TOC during illumination of 1300 ppm
aniline solutions, in the presence of O3, containing different
amounts of TiO2: (!) 3.0 g lÿ1, (*) 2.0 g lÿ1, (&) 1.0 g lÿ1 and
(~) 0.1 g lÿ1. Experimental conditions: pHi�3.0; mean flow of
O3�5.0�10ÿ4 mol minÿ1.
Fig. 8. Time-course of TOC during irradiation of 1300 ppm aniline
solutions containing 2.0 g lÿ1 of TiO2, in the presence of O3
bubbled at three different flows: (&) 1.65�10ÿ4 mol minÿ1, (*)
4.52�10ÿ4 mol minÿ1 and (~) 7.62�10ÿ4 mol minÿ1. Initial
pH�3.0.
64 L. SaÂnchez et al. / Applied Catalysis B: Environmental 19 (1998) 59±65
[3] A. Mills, R.H. Davis, D. Worsley, Chem. Soc. Rev. (1993)
419.
[4] J.R. Harbour, M.L. Hair, J. Phys. Chem. 83 (1979) 652.
[5] C.S. Turchi, D.F. Ollis, J. Catal. 122 (1990) 178.
[6] W.H. Glaze, J.W. Kand, D.H. Chapin, Ozone Sci. Eng. 9
(1987) 335.
[7] J.M. Herrmann, C. Guillard, P. Pichat, Catal. Today 17 (1993)
7.
[8] O. Legrini, E. Oliveros, A.M. Braun, Chem. Rev. 93 (1993)
671.
[9] L. SaÂnchez, J. Peral, X. DomeÁnech, Electrochim. Acta 41
(1996) 1981.
[10] A. Ansari, J. Peral, X. DomeÁnech, R. RodrõÂguez-Clemente,
J. Casado, J. Mol. Catal. A 112 (1996) 269.
[11] A. Kumar, S. Kumar, Chem. Lett. (1996) 711.
[12] A. Sclafani, L. Palmisano, E. Davi, J. Photochem. Photobiol.
A 56 (1991) 113.
[13] E. Pelizzetti, V. Carlin, C. Minero, M. GraÈtzel, N. J. Chem. 15
(1991) 351.
[14] L. SaÂnchez, J. Peral, X. DomeÁnech, Electrochim. Acta 42
(1997) 1877.
[15] R.E. BuÈhler, J. Staehelin, J. HoigneÂ, J. Phys. Chem. 88 (1984)
2560.
[16] J. Staehelin, R.E. BuÈhler, J. HoigneÂ, J. Phys. Chem. 88 (1984)
5999.
[17] R. Larson, E. Weber, Reaction Mechanism in Environmental
Organic Chemistry, Lewis Publishers, Boca RatoÂn, 1994,
p. 316.
[18] B. Legube, B. Langlais, B. Sohm, M. DoreÂ, Ozone Sci. Eng. 3
(1981) 33.
[19] W.F. Chand, R.A. Larson, Water Res. 25 (1991) 1529.
[20] K. Tanaka, K. Abe, T. Hisanaga, J. Photochem. Photobiol.
A 101 (1996) 85.
[21] G.R. Peyton, in: Significance and Treatment of Volatile
Organic Compounds in Water Supplies, Lewis Publishers,
Chelsea, 1990, p. 313.
[22] G. Wittmann, I. Ilisz, A. Dombi, Mechanism of Catalysed
Ozone Decomposition in Aqueous Solutions in Regional
Conference on Ozone, Ultraviolet Light, Advanced Oxidation
Processes in Water Treatment, International Ozone Associa-
tion, 1996, p. 411.
[23] L. Qin, G.N.R. Tripathi, R.H. Schuler, Z. Naturforsch. A 40A
(1985) 1026.
[24] J. Staehelin, J. HoigneÂ, Environ. Sci. Technol. 19 (1985)
1206.
[25] K. Okamoto, Y. Yamamoto, H. Tanaka, M. Tanaka, A. Itaya,
Bull. Chem. Soc. Jpn. 58 (1985) 2015.
L. SaÂnchez et al. / Applied Catalysis B: Environmental 19 (1998) 59±65 65
Top Related