


Languages
Pages
Legal

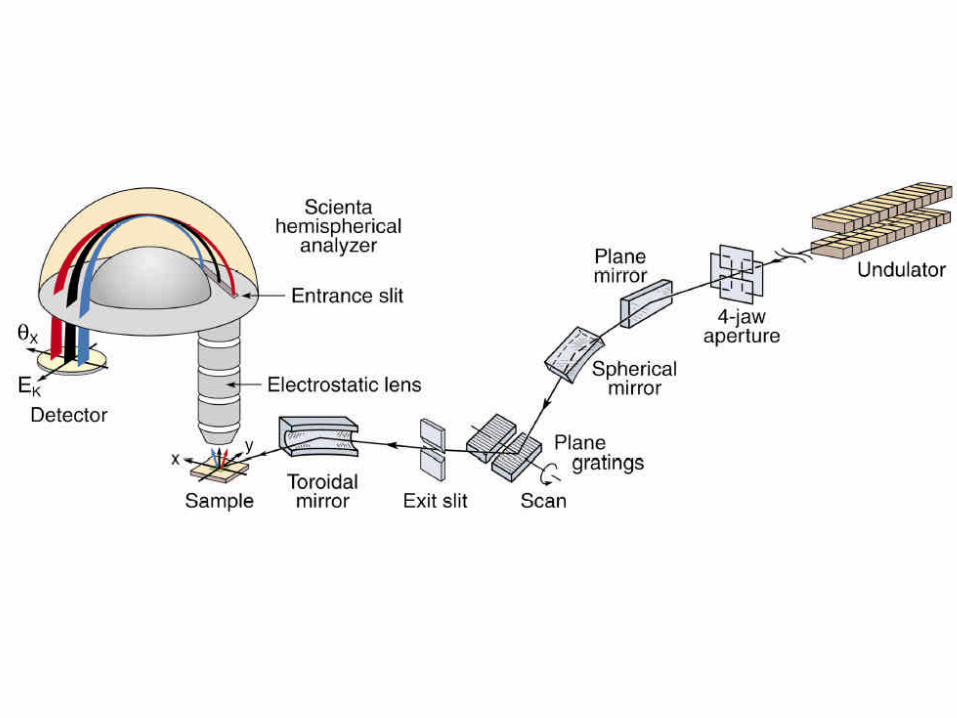
Angle Resolved Photoemission Spectroscopy
Dan DessauUniversity of Colorado, Boulder
sample
analyzer
e -
hν
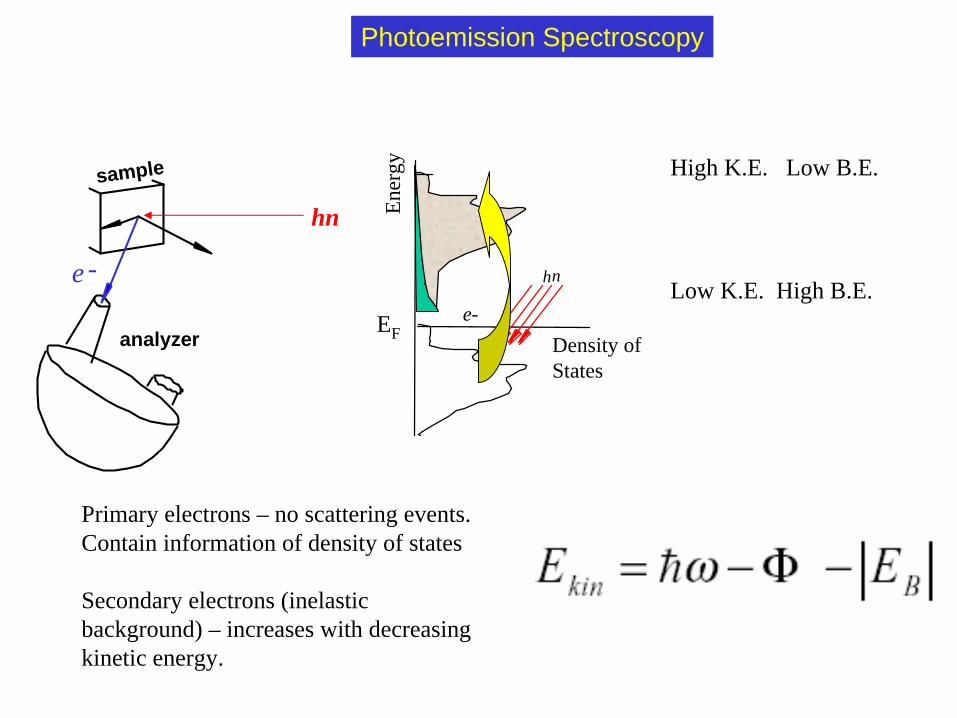
Photoemission Spectroscopy
Density of States
Ene
rgy
EFe-
hν
Primary electrons – no scattering events. Contain information of density of states
Secondary electrons (inelastic background) – increases with decreasing kinetic energy.
High K.E. Low B.E.
Low K.E. High B.E.
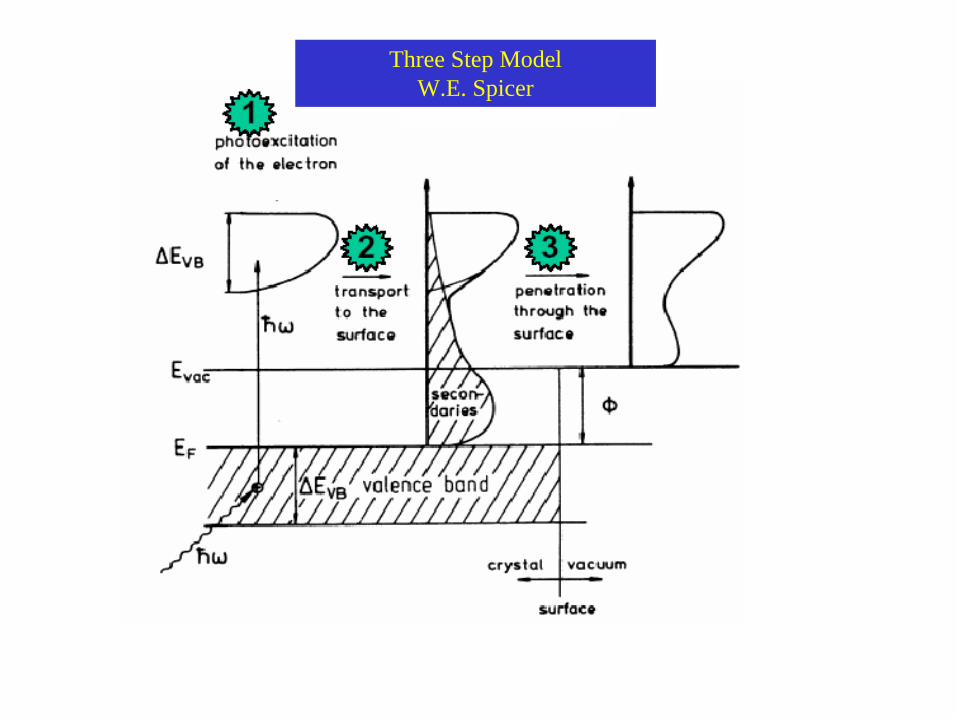
Three Step Model W.E. Spicer

• Angle–dependent core level spectroscopy (not this talk)• To vary the surface sensitivity of an experiment
•normal emission – more bulk sensitive•glancing emission – more surface sensitive
• To perform X-ray photoelectron Diffraction (XPD)•Obtain local structural information (similar to EXAFS)
•Angle-dependent valence band spectroscopy (this talk)• To measure the k (momentum) dependence of valence band states• To measure electronic band dispersions and Fermi Surfaces• To measure symmetries of states• To obtain many-body phenomena (e.g. correlated electron systems).
Angle resolved photoemission spectroscopy

Low energy excitation
Energy (E) and momentum (p or k) are the most important quantum numbers in a solid. Specifying these specifies behavior of electrons.
Quantum numbers E,k
Newton : KE=0.5 mv2 = p2/2m p=mv, p=hk
-1.0 -0.5 0.0 0.5 1.0
KE
p
-1.0 -0.5 0.0 0.5 1.0
E
k
EF
kF-kF
Pauli Principle - each electron goes into it’s own individual quantum state (new E,k). Fill lowest energy states first. Highest energy electrons are at Fermi Energy EF, with a momentum hkF. These are the most important electrons. All low energy excitations come from near EF.
kx
ky
occupied
unoccupied
Fermi Surface
Brillouin Zone
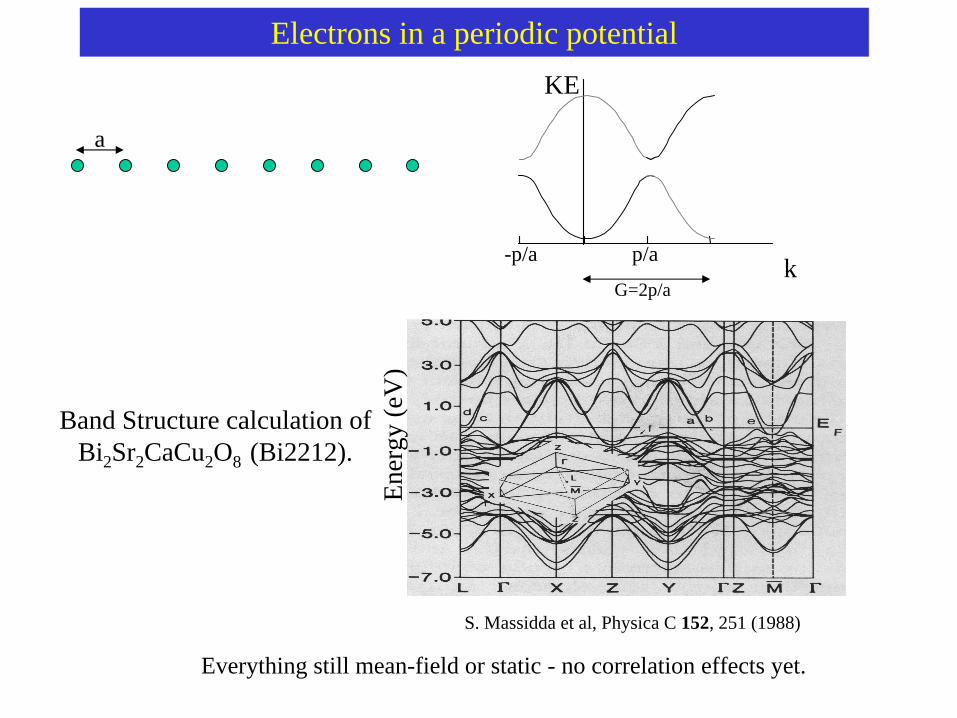
Electrons in a periodic potential
a
KE
kp/a-p/a
G=2p/a
Band Structure calculation of Bi2Sr2CaCu2O8 (Bi2212).
S. Massidda et al, Physica C 152, 251 (1988)
Ene
rgy
(eV
)
Everything still mean-field or static - no correlation effects yet.
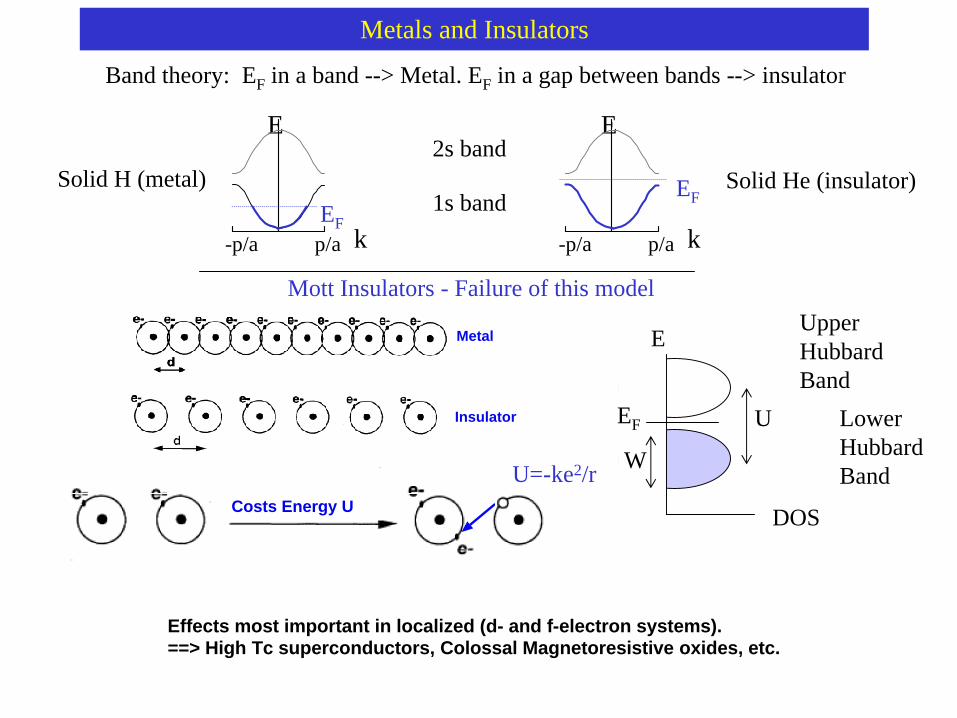
Metals and Insulators
p/a
E
k-p/aEF
Solid H (metal)
p/a
E
k-p/a
EFSolid He (insulator)
Band theory: EF in a band --> Metal. EF in a gap between bands --> insulator
1s band
2s band
Costs Energy U
Metal
Insulator
Mott Insulators - Failure of this model
Effects most important in localized (d- and f-electron systems).==> High Tc superconductors, Colossal Magnetoresistive oxides, etc.
U=-ke2/r
U
DOS
E
W
UpperHubbardBand
LowerHubbardBand
EF
θφ
hν
A detector
sample
e-
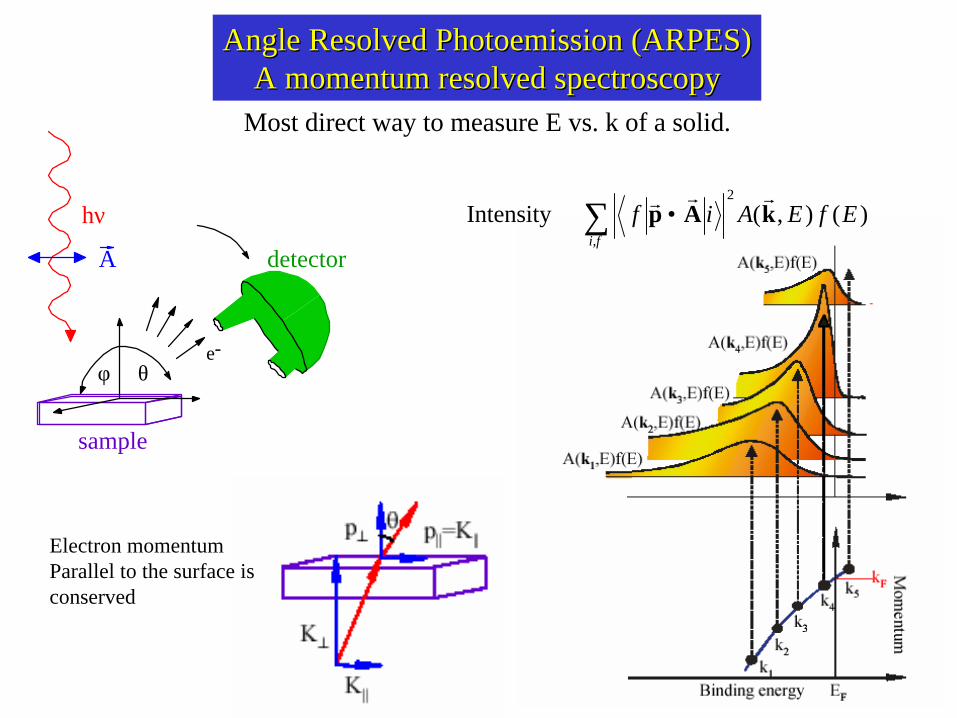
Angle Resolved Photoemission (ARPES)Angle Resolved Photoemission (ARPES)A momentum resolved spectroscopyA momentum resolved spectroscopy
Electron momentum Parallel to the surface is conserved
)(),( Intensity2
EfEAifi,f
kAprrr∑ •∝
Most direct way to measure E vs. k of a solid.
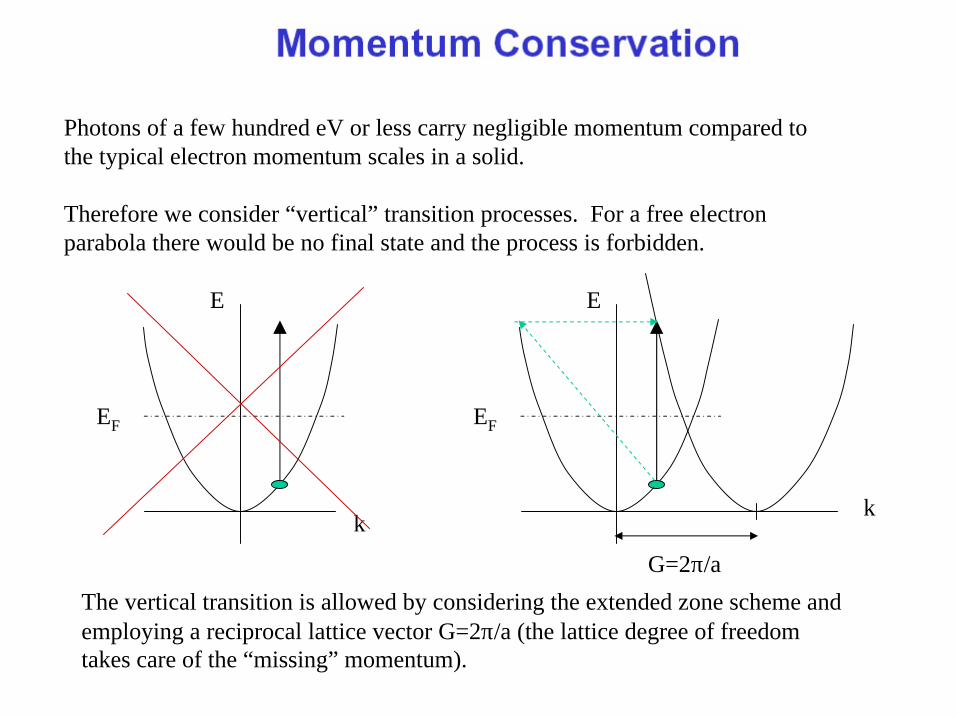
Photons of a few hundred eV or less carry negligible momentum compared to the typical electron momentum scales in a solid.
Therefore we consider “vertical” transition processes. For a free electron parabola there would be no final state and the process is forbidden.
E
k
EF
E
k
EF
G=2π/a
The vertical transition is allowed by considering the extended zone scheme and employing a reciprocal lattice vector G=2π/a (the lattice degree of freedom takes care of the “missing” momentum).
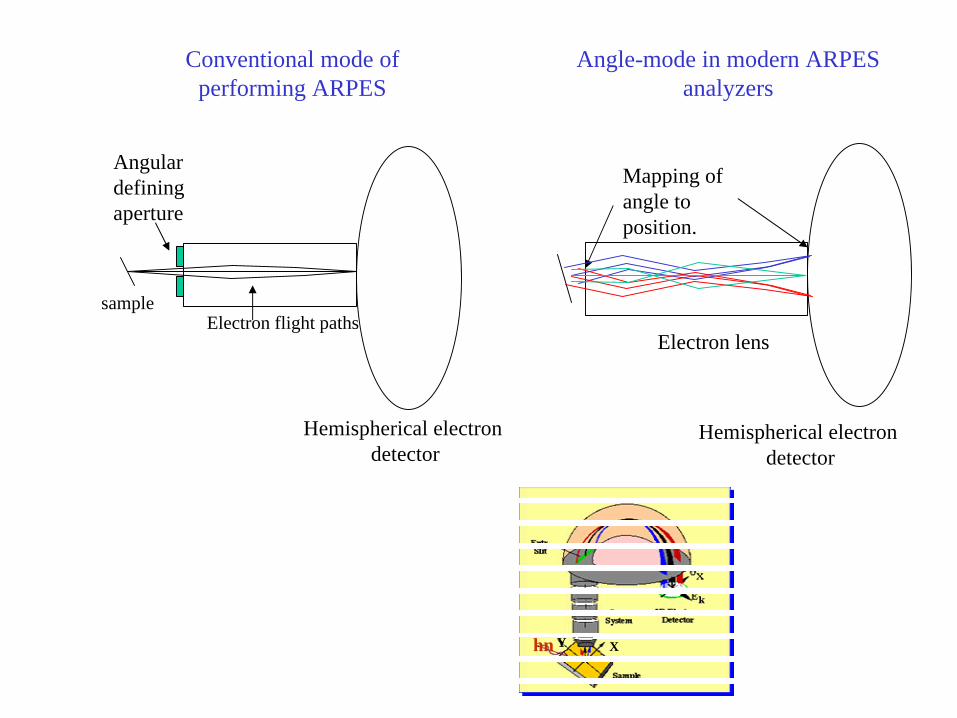
Angular defining aperture
sampleElectron flight paths
Hemispherical electron detector
Mapping of angle to position.
Electron lens
Hemispherical electron detector
Conventional mode of performing ARPES
Angle-mode in modern ARPES analyzers
XYhn
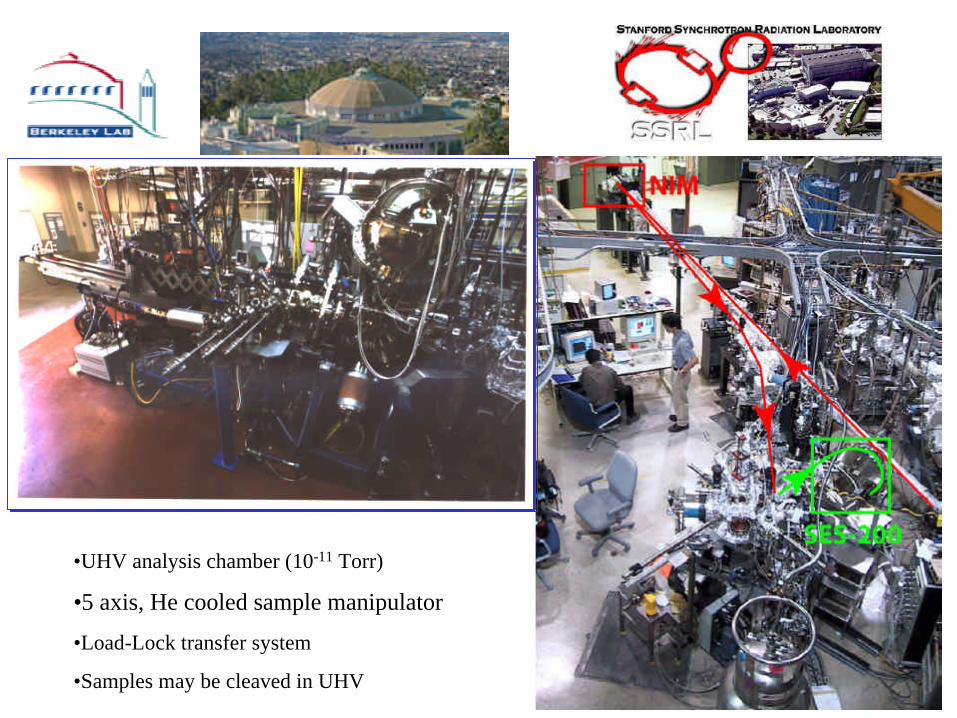
•UHV analysis chamber (10-11 Torr)
•5 axis, He cooled sample manipulator
•Load-Lock transfer system
•Samples may be cleaved in UHV
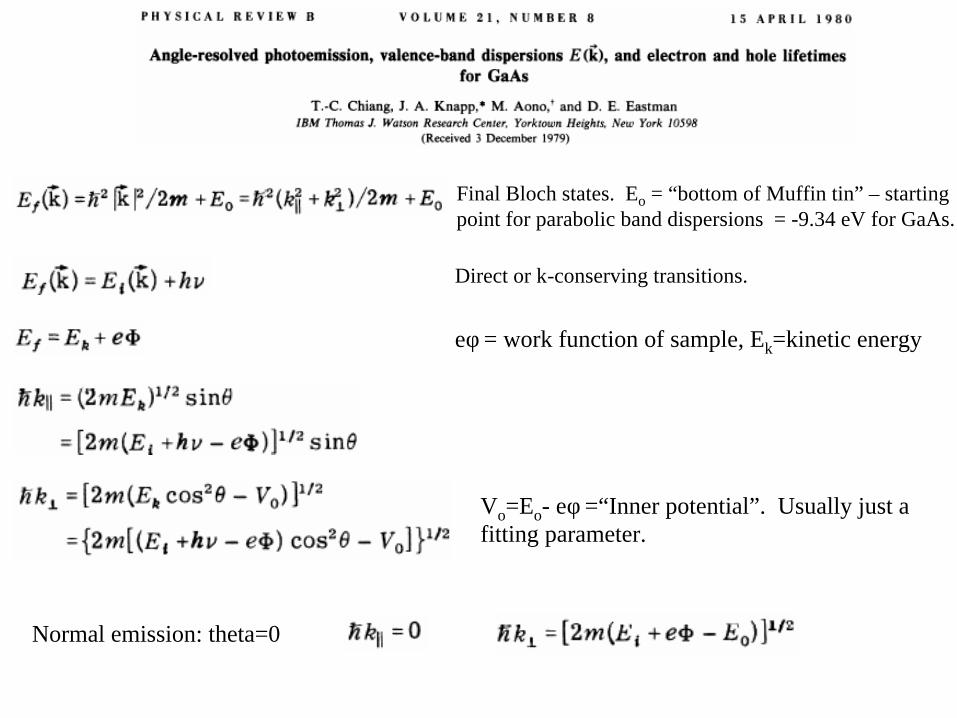
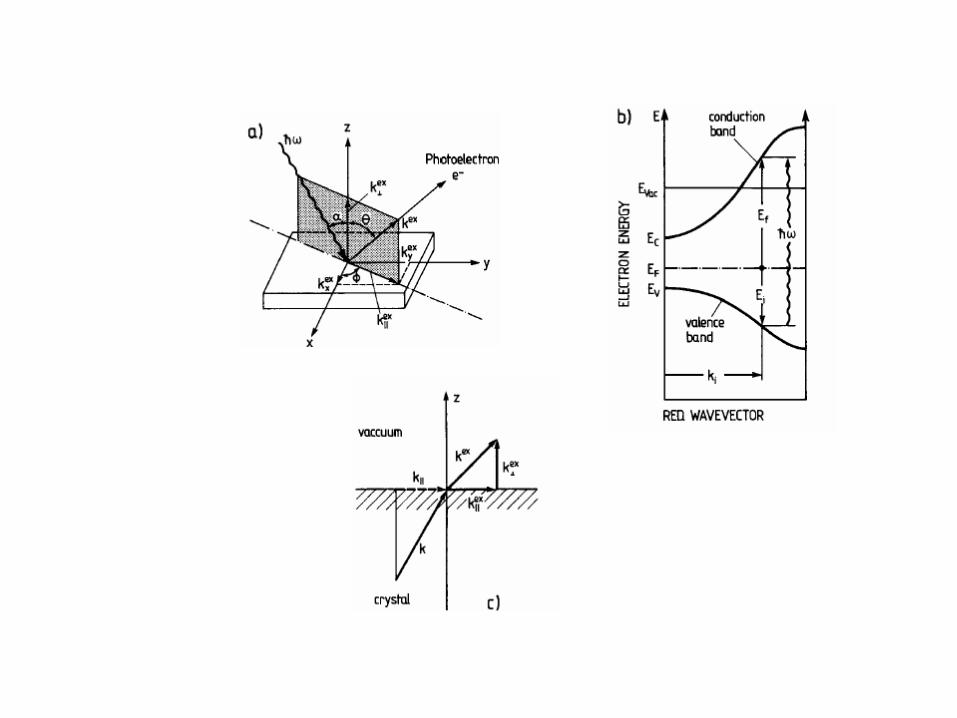
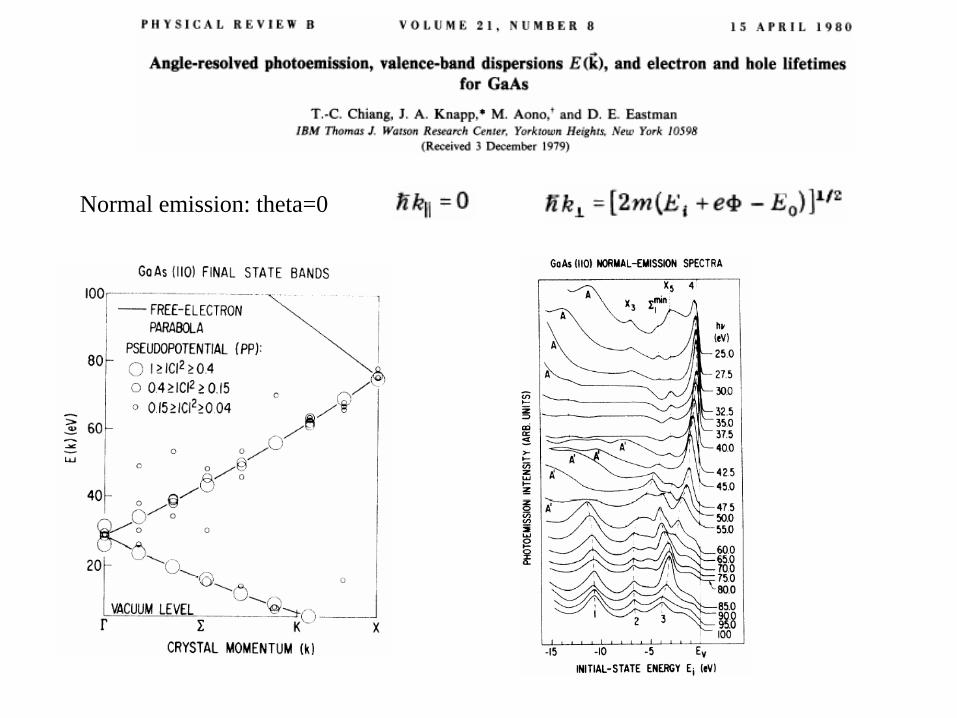
Final Bloch states. Eo = “bottom of Muffin tin” – starting point for parabolic band dispersions = -9.34 eV for GaAs.
Direct or k-conserving transitions.
eφ = work function of sample, Ek=kinetic energy
Vo=Eo- eφ =“Inner potential”. Usually just a fitting parameter.
Normal emission: theta=0
Normal emission: theta=0

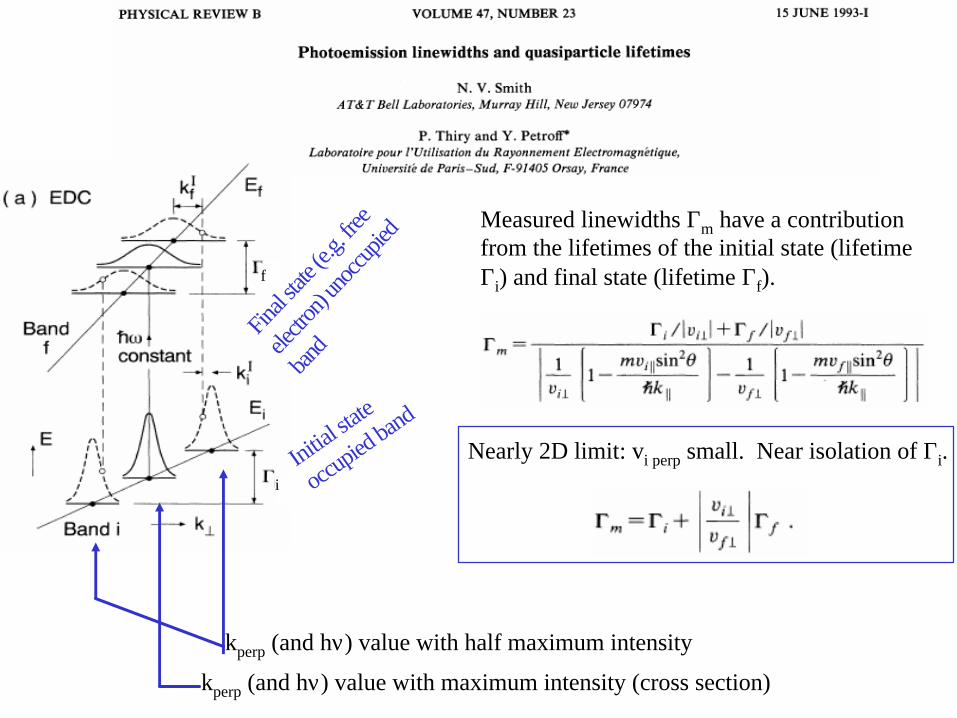
Measured linewidths Γm have a contribution from the lifetimes of the initial state (lifetime Γi) and final state (lifetime Γf).f
i
Final s
tate (
e.g. fr
ee
electr
on) u
noccu
pied
band
Initial st
ate
occupi
ed ban
d
kperp (and hν) value with maximum intensity (cross section)
kperp (and hν) value with half maximum intensity
Nearly 2D limit: vi perp small. Near isolation of Γi.
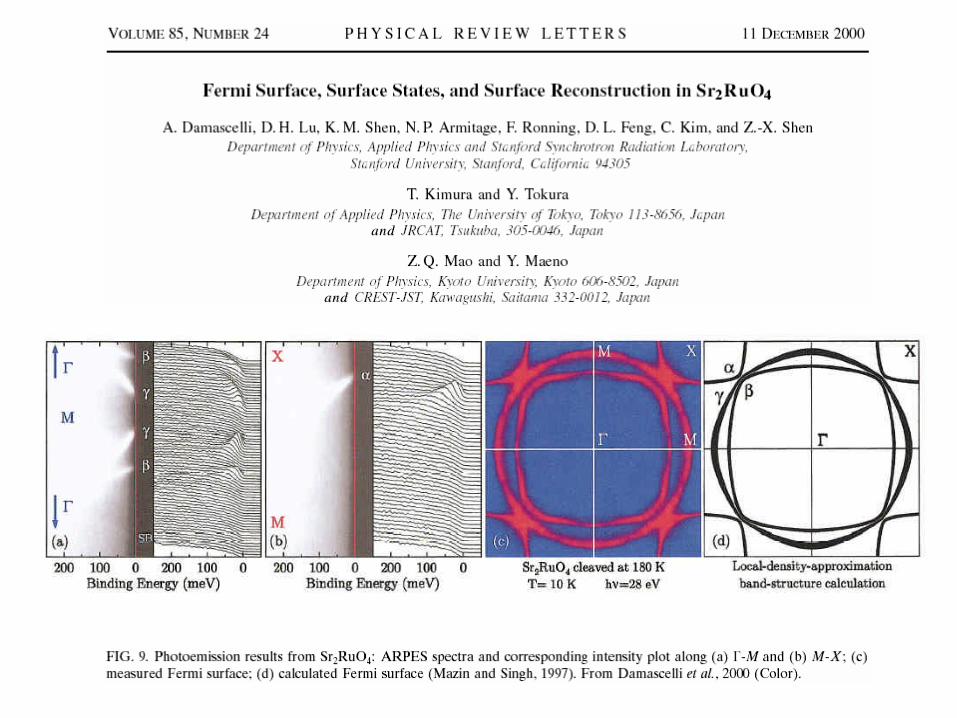
•Can ignore kz dispersion. •Need not vary photon energy to map out Fermi surface and high symmetry directions.•Less final state broadening. Intrinsic initial-state linewidthscan be studied.
2D compounds
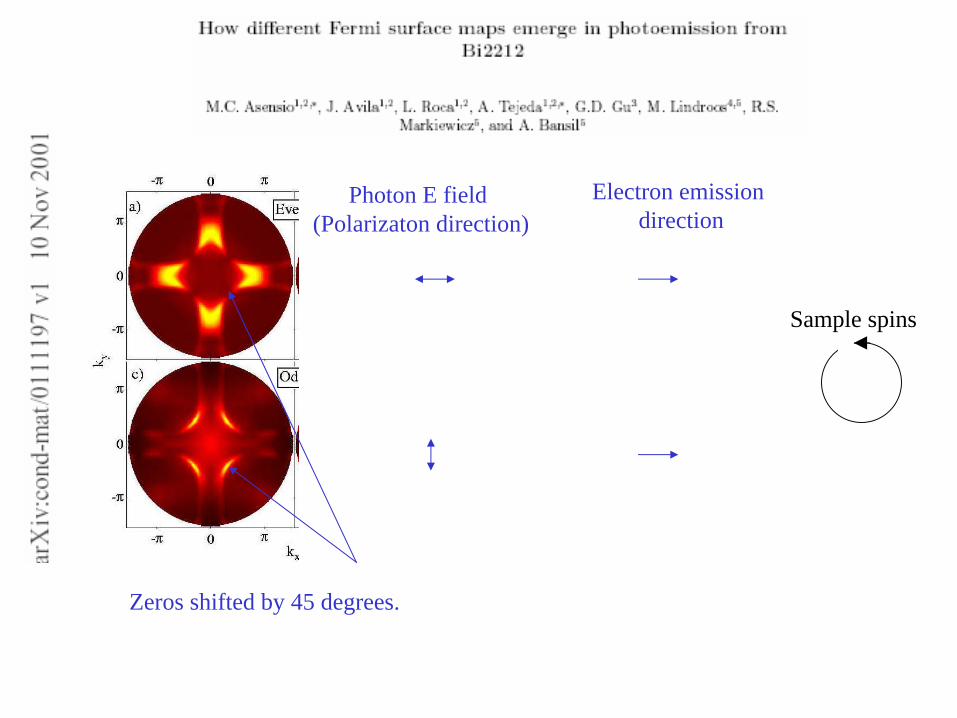
Photon E field (Polarizaton direction)
Zeros shifted by 45 degrees.
Electron emission direction
Sample spins

Symmetry Analysis
The matrix element is integrated over all space.The integration axis of interest here is perpendicular to a chosen mirror plane.If net odd symmetry, then the matrix element integrates to exactly zero.
E field
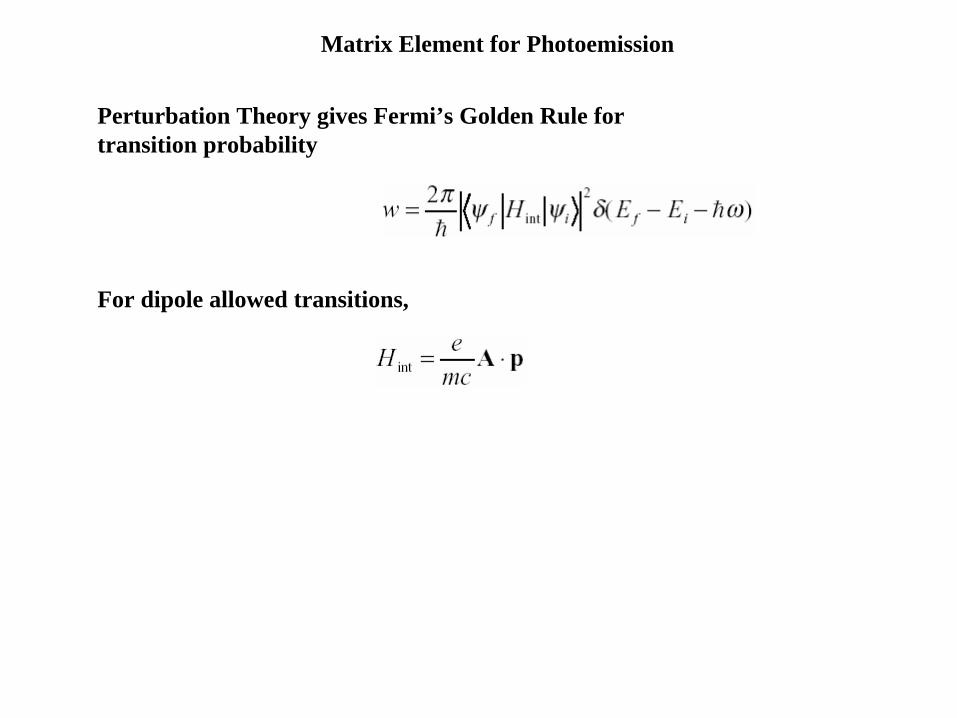
Matrix Element for Photoemission
Perturbation Theory gives Fermi’s Golden Rule fortransition probability
For dipole allowed transitions,
binding energy
emission angle
MDC
EDC
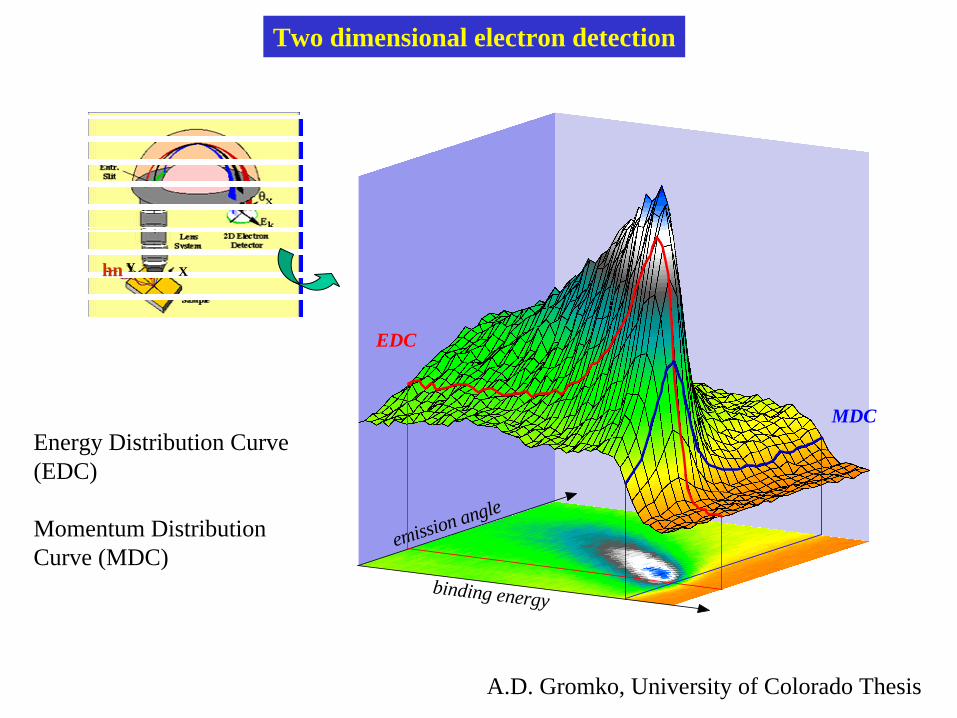
Two dimensional electron detection
XYhn
A.D. Gromko, University of Colorado Thesis
Energy Distribution Curve (EDC)
Momentum Distribution Curve (MDC)
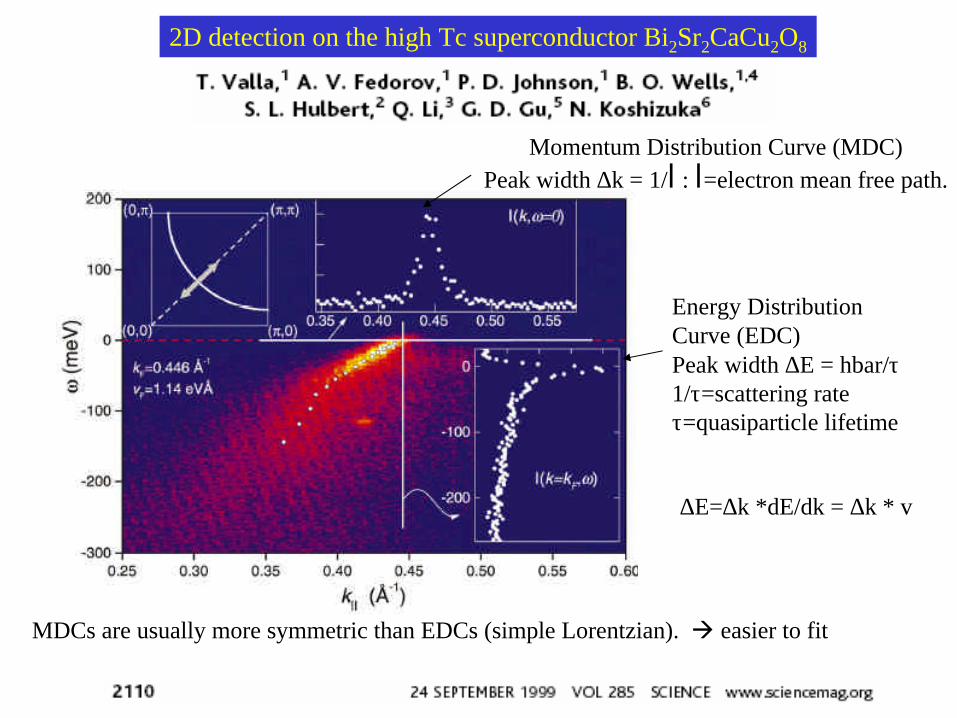
Momentum Distribution Curve (MDC)Peak width ∆k = 1/l : l=electron mean free path.
Energy Distribution Curve (EDC)Peak width ∆E = hbar/τ1/τ=scattering rateτ=quasiparticle lifetime
2D detection on the high Tc superconductor Bi2Sr2CaCu2O8
∆E=∆k *dE/dk = ∆k * v
MDCs are usually more symmetric than EDCs (simple Lorentzian). à easier to fit
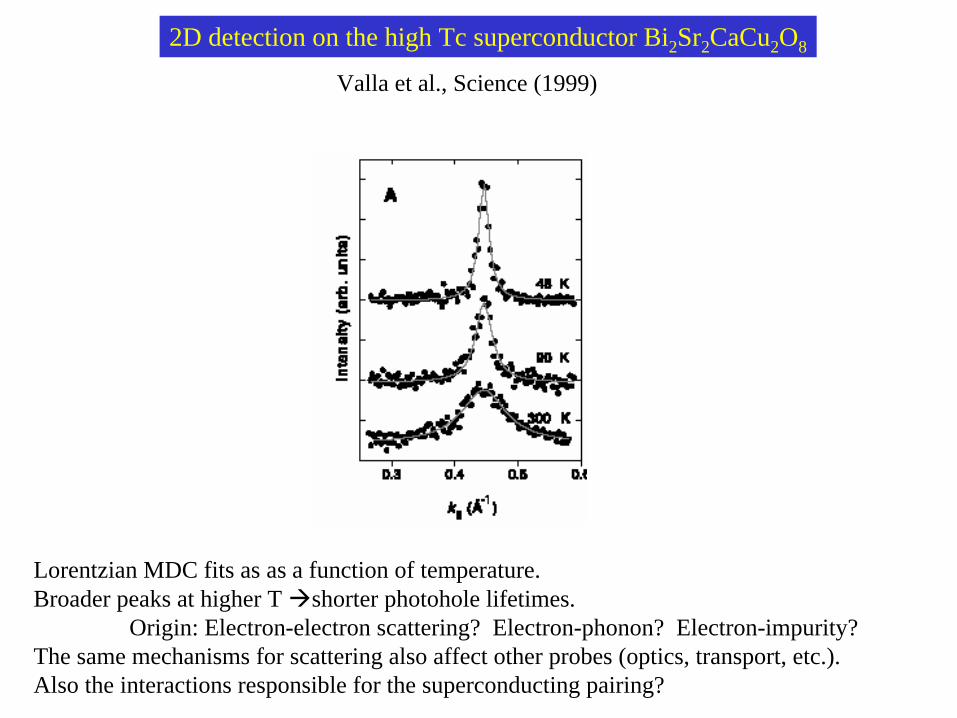
2D detection on the high Tc superconductor Bi2Sr2CaCu2O8
Lorentzian MDC fits as as a function of temperature. Broader peaks at higher T àshorter photohole lifetimes.
Origin: Electron-electron scattering? Electron-phonon? Electron-impurity?The same mechanisms for scattering also affect other probes (optics, transport, etc.).Also the interactions responsible for the superconducting pairing?
Valla et al., Science (1999)
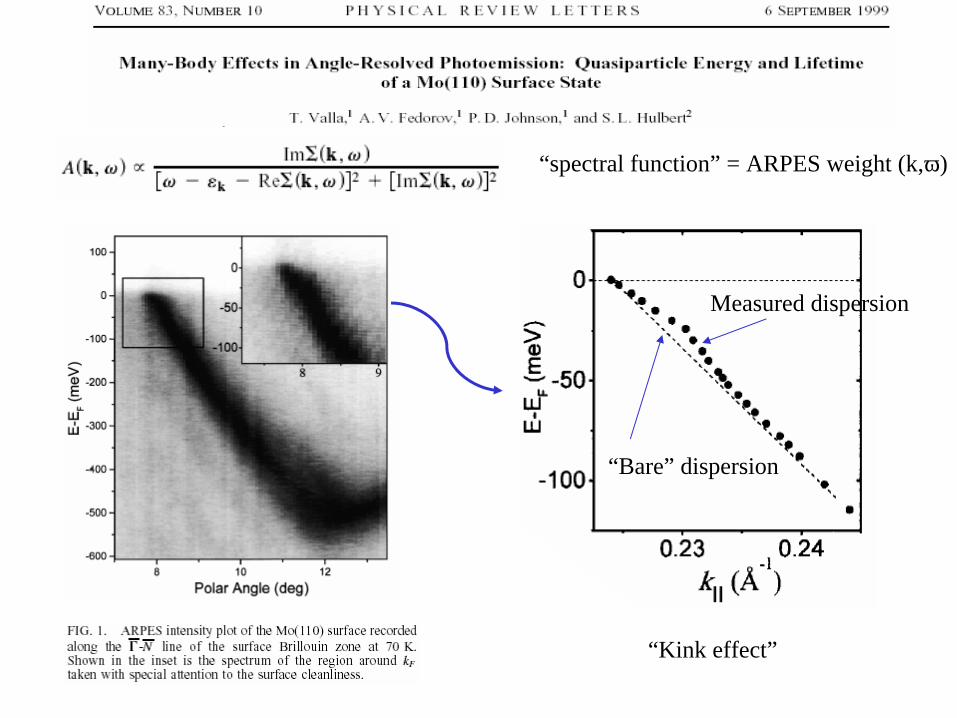
Measured dispersion
“Bare” dispersion
“spectral function” = ARPES weight (k,ω)
“Kink effect”
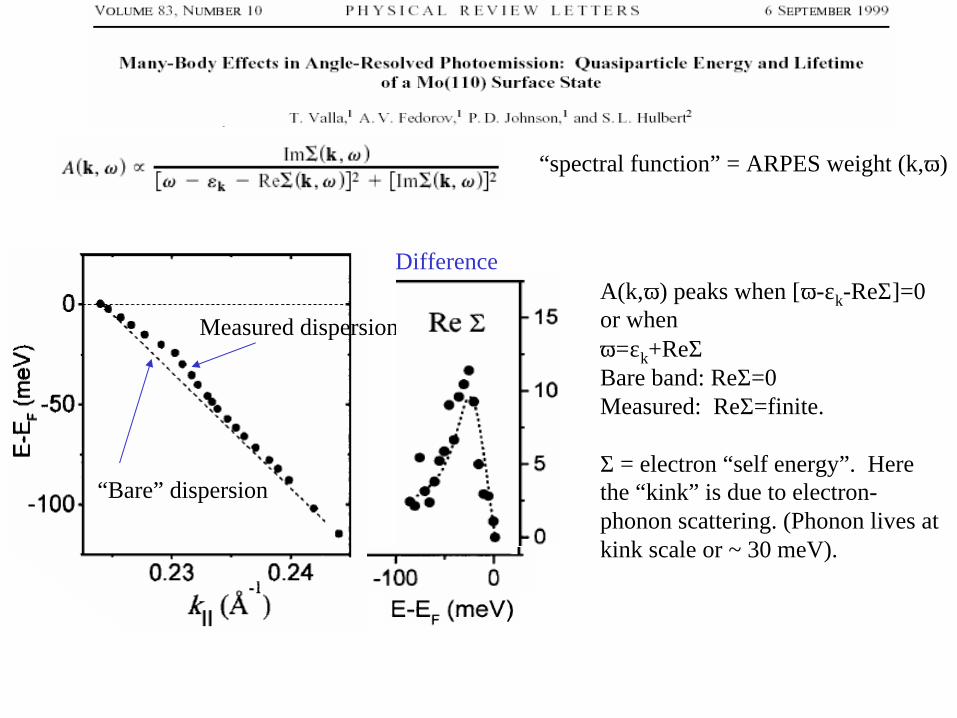
A(k,ω) peaks when [ω-εk-ReΣ]=0or whenω=εk+ReΣBare band: ReΣ=0Measured: ReΣ=finite.
Σ = electron “self energy”. Here the “kink” is due to electron-phonon scattering. (Phonon lives at kink scale or ~ 30 meV).
Measured dispersion
“Bare” dispersion
“spectral function” = ARPES weight (k,ω)
Difference
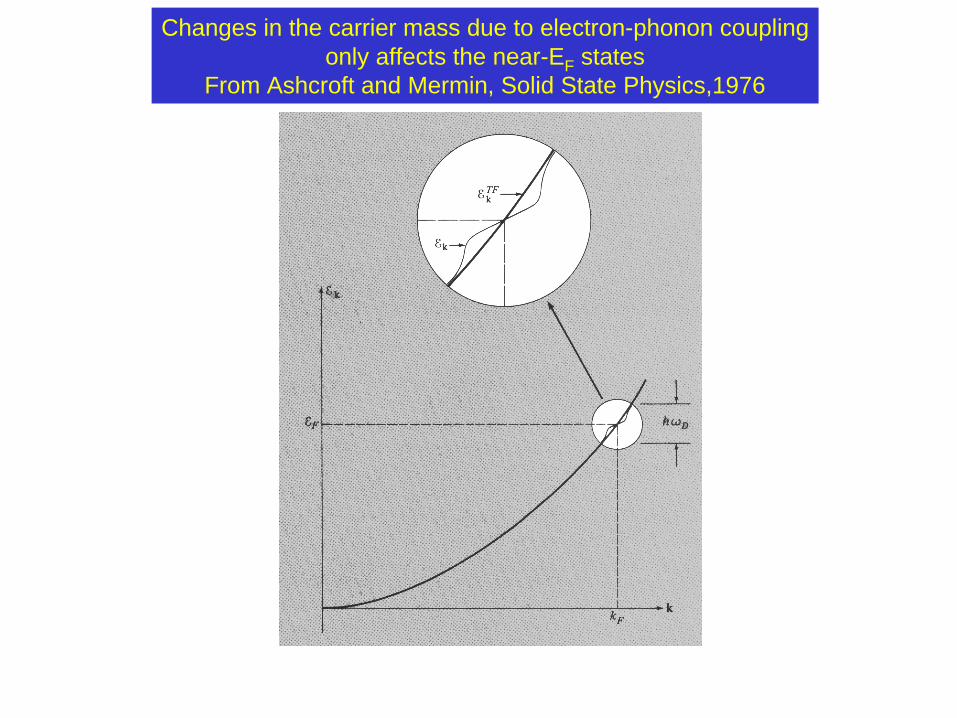
Changes in the carrier mass due to electron-phonon couplingonly affects the near-EF states
From Ashcroft and Mermin, Solid State Physics,1976
FWH
M o
f qu
asip
artic
lepe
ak
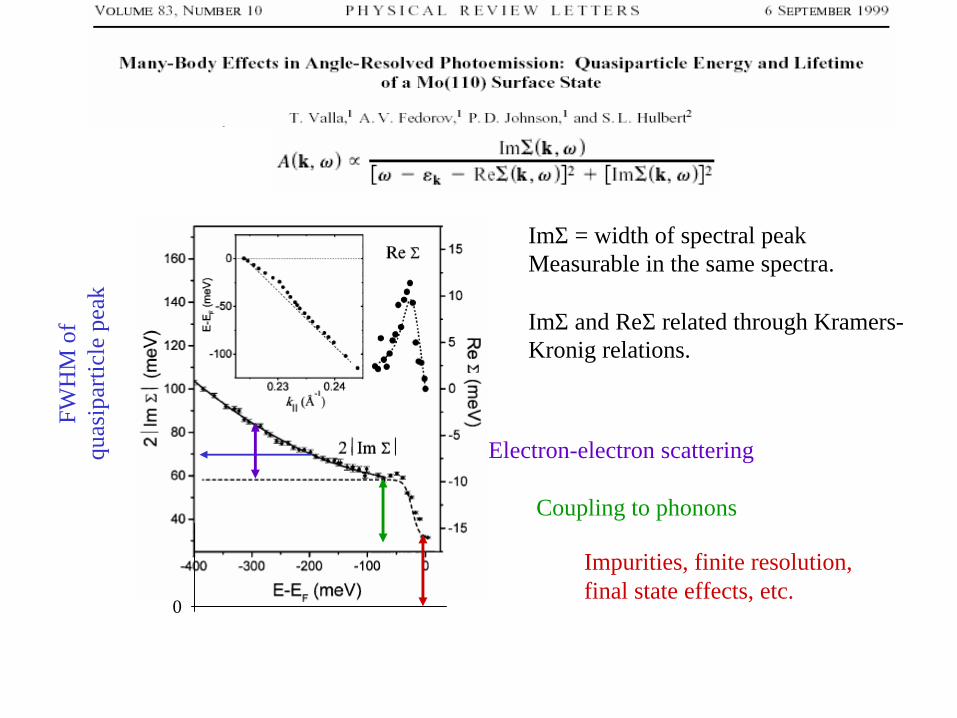
ImΣ = width of spectral peak Measurable in the same spectra.
ImΣ and ReΣ related through Kramers-Kronig relations.
Impurities, finite resolution, final state effects, etc.
Coupling to phonons
Electron-electron scattering
0
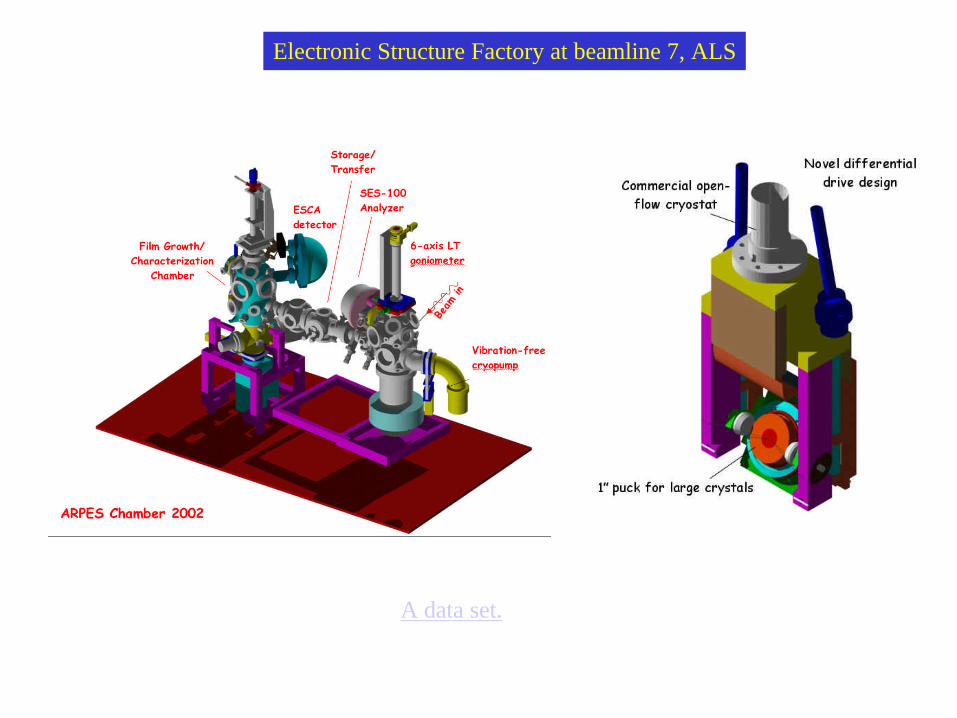
Electronic Structure Factory at beamline 7, ALS
A data set.
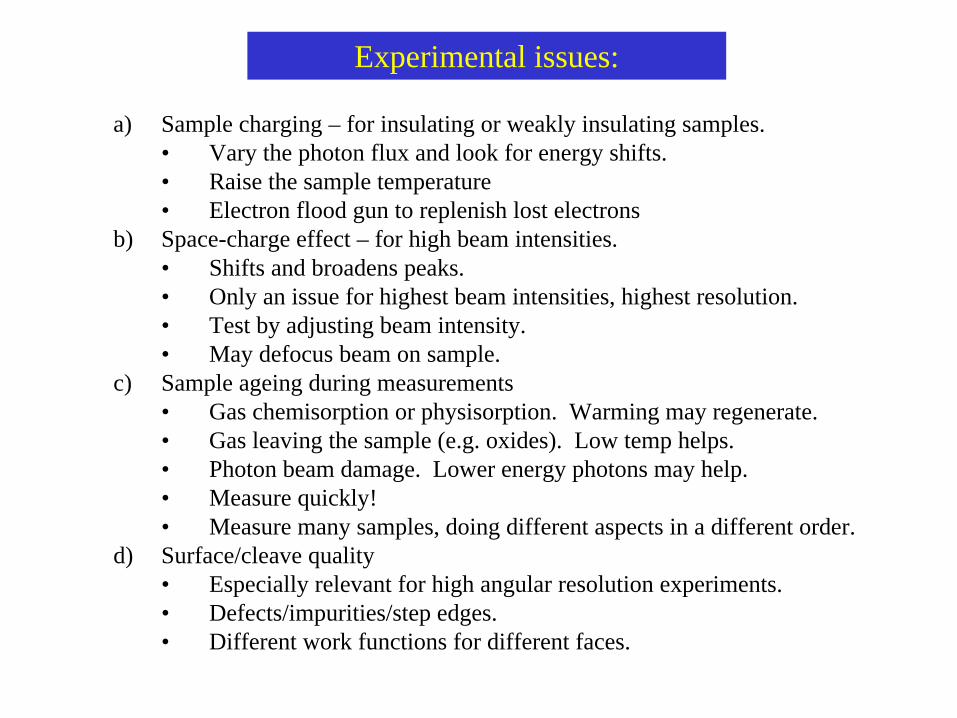
a) Sample charging – for insulating or weakly insulating samples.• Vary the photon flux and look for energy shifts.• Raise the sample temperature• Electron flood gun to replenish lost electrons
b) Space-charge effect – for high beam intensities. • Shifts and broadens peaks. • Only an issue for highest beam intensities, highest resolution.• Test by adjusting beam intensity.• May defocus beam on sample.
c) Sample ageing during measurements• Gas chemisorption or physisorption. Warming may regenerate.• Gas leaving the sample (e.g. oxides). Low temp helps.• Photon beam damage. Lower energy photons may help.• Measure quickly!• Measure many samples, doing different aspects in a different order.
d) Surface/cleave quality• Especially relevant for high angular resolution experiments.• Defects/impurities/step edges.• Different work functions for different faces.
Experimental issues:

From ALS undulator beamline 10.0.1
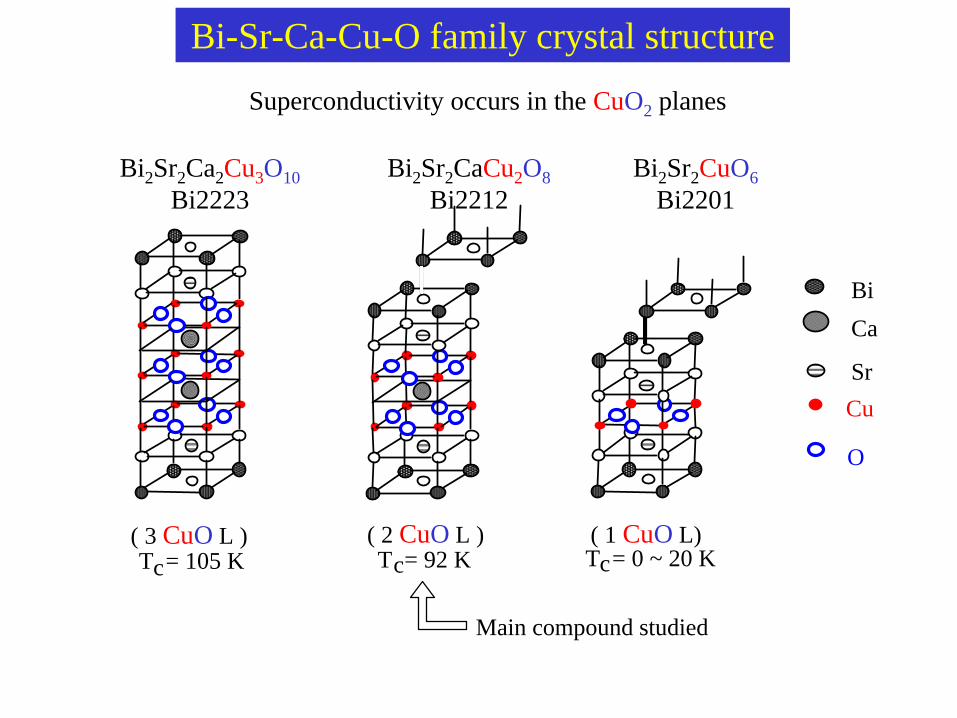
( 3 CuO L )T = 105 Kc
( 2 CuO L )T = 92 Kc
( 1 CuO L)T = 0 ~ 20 Kc
Bi2Sr2Ca2Cu3O10Bi2223
Bi
Sr
O
Cu
Ca
Bi-Sr-Ca-Cu-O family crystal structure
Main compound studied
Superconductivity occurs in the CuO2 planes
Bi2Sr2CaCu2O8Bi2212
Bi2Sr2CuO6Bi2201
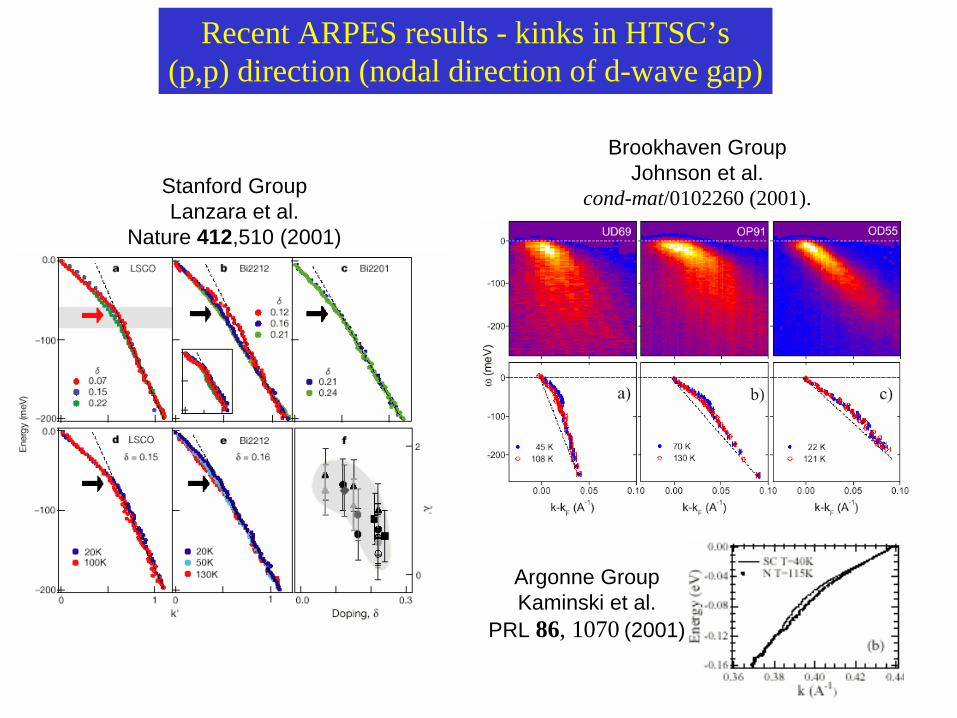
Recent ARPES results - kinks in HTSC’s(p,p) direction (nodal direction of d-wave gap)
Stanford GroupLanzara et al.
Nature 412,510 (2001)
Brookhaven GroupJohnson et al.
cond-mat/0102260 (2001).
Argonne GroupKaminski et al.
PRL 86, 1070 (2001)
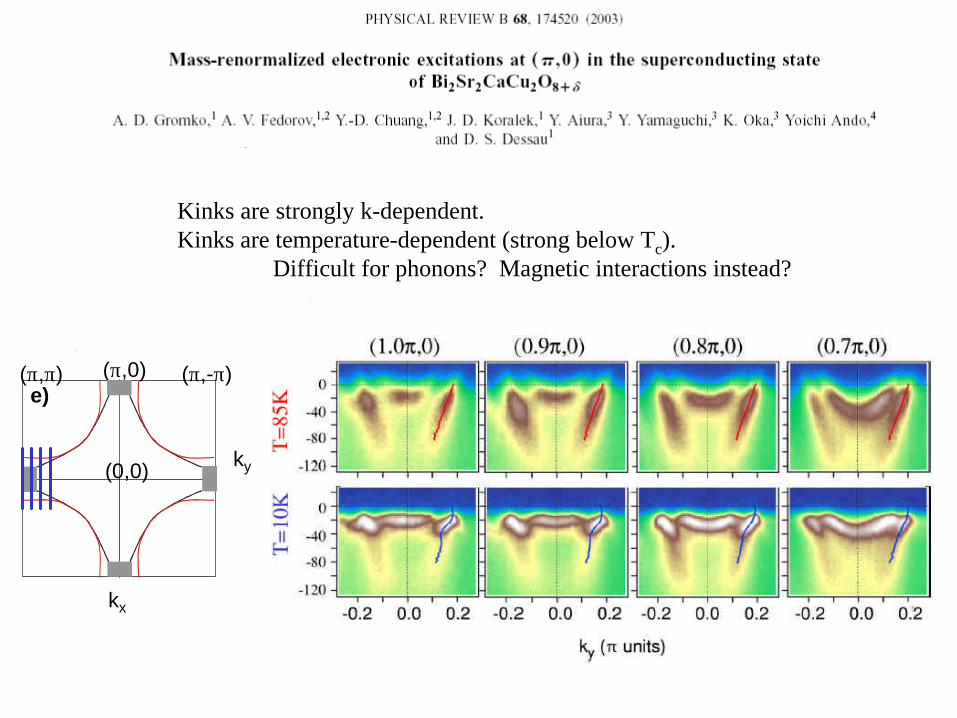
Kinks are strongly k-dependent.Kinks are temperature-dependent (strong below Tc).
Difficult for phonons? Magnetic interactions instead?
e)
kx
(π,π) (π,-π)
(0,0)
(π,0)
ky
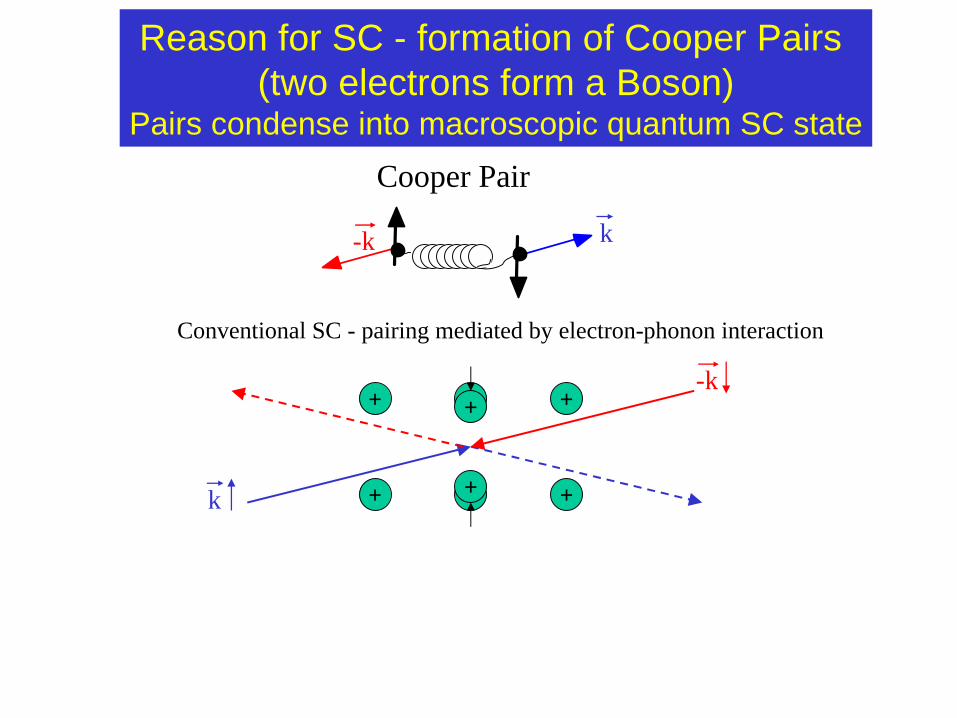
Reason for SC - formation of Cooper Pairs (two electrons form a Boson)
Pairs condense into macroscopic quantum SC state
Cooper Pair
-k k
Conventional SC - pairing mediated by electron-phonon interaction
+
++ +
+ +
+
+k
-k
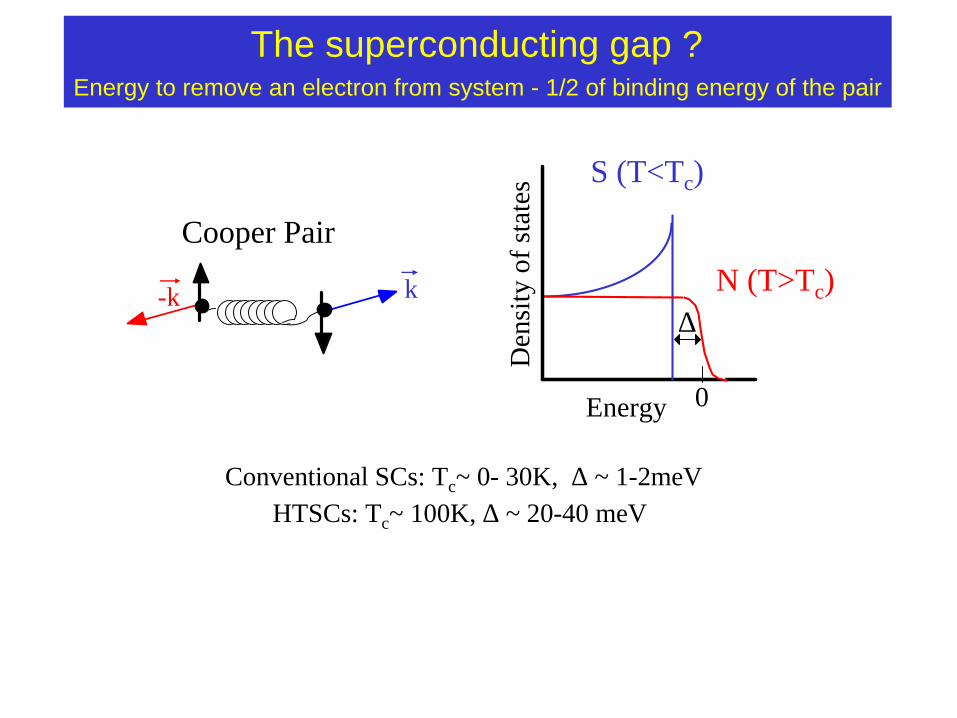
Conventional SCs: Tc~ 0- 30K, ∆ ~ 1-2meVHTSCs: Tc~ 100K, ∆ ~ 20-40 meV
The superconducting gap ?Energy to remove an electron from system - 1/2 of binding energy of the pair
Cooper Pair
-k k N (T>Tc)
0Energy
Den
sity
of s
tate
s
∆
S (T<Tc)
? small
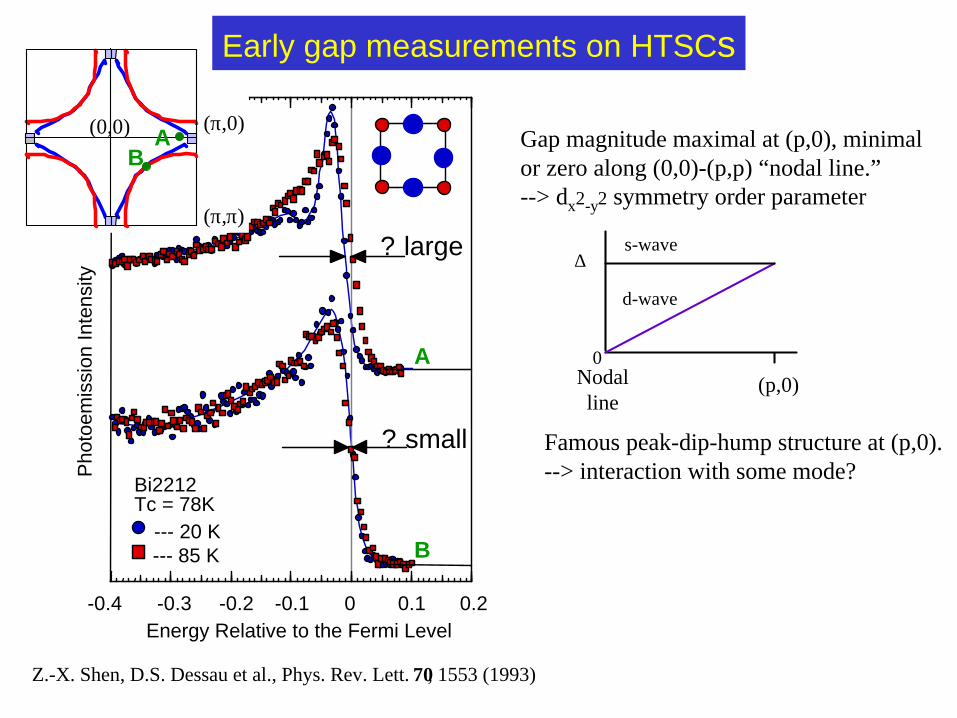
-0.4 -0.3 -0.2 -0.1 0 0.1 0.2Energy Relative to the Fermi Level
Bi2212Tc = 78K
--- 20 K--- 85 K
A
B
Pho
toem
issi
on In
tens
ity
? large
Z.-X. Shen, D.S. Dessau et al., Phys. Rev. Lett. 70, 1553 (1993)
Gap magnitude maximal at (p,0), minimal or zero along (0,0)-(p,p) “nodal line.” --> dx2-y2 symmetry order parameter
Famous peak-dip-hump structure at (p,0). --> interaction with some mode?
(0,0) (π,0)
(π,π)
AB
Early gap measurements on HTSCs
∆
0
s-wave
d-wave
(p,0)Nodalline

Y
X
(0,0) (p ,0)
(p ,p )
Γ Mχ(spin) : known to be a singlet (S=0)
S = 0, l = 0-- s-wave superconductor
(conventional SC)
++-
-
S = 0, l = 2-- d-wave superconductor
(HTSCs - pretty sure)
Hole-like Fermi Surface
d-wave SC gap - maximal near (p,0)
Z-X Shen, D.S. Dessau et al, PRL 70, 1553 (1993).
Order parameter
? maximal
Node line? =0
++
-
-
Ψ(r1,σ1;r2,σ2)=ψ(orbital) χ(spin)•Antisymmetric under exchange
Superconducting order parameter symmetrySC gap ? = magnitude of order parameter. Varies as a function of k in a d-wave SC

H. Ding, M.R. Norman, J.C. Campuzano, et al.
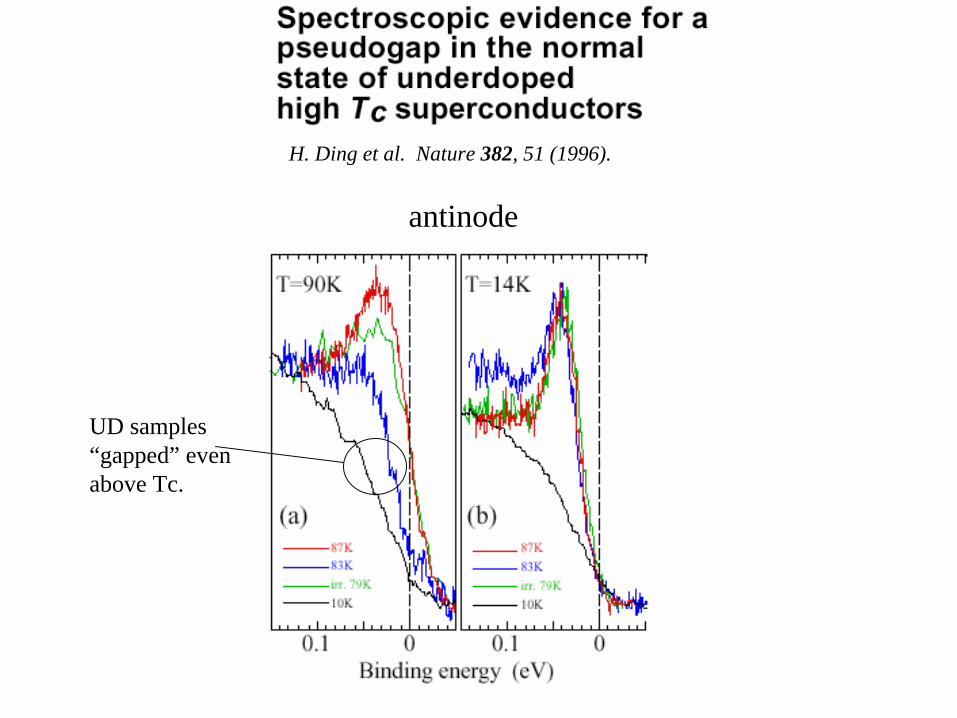
H. Ding et al. Nature 382, 51 (1996).
antinode
UD samples “gapped” even above Tc.
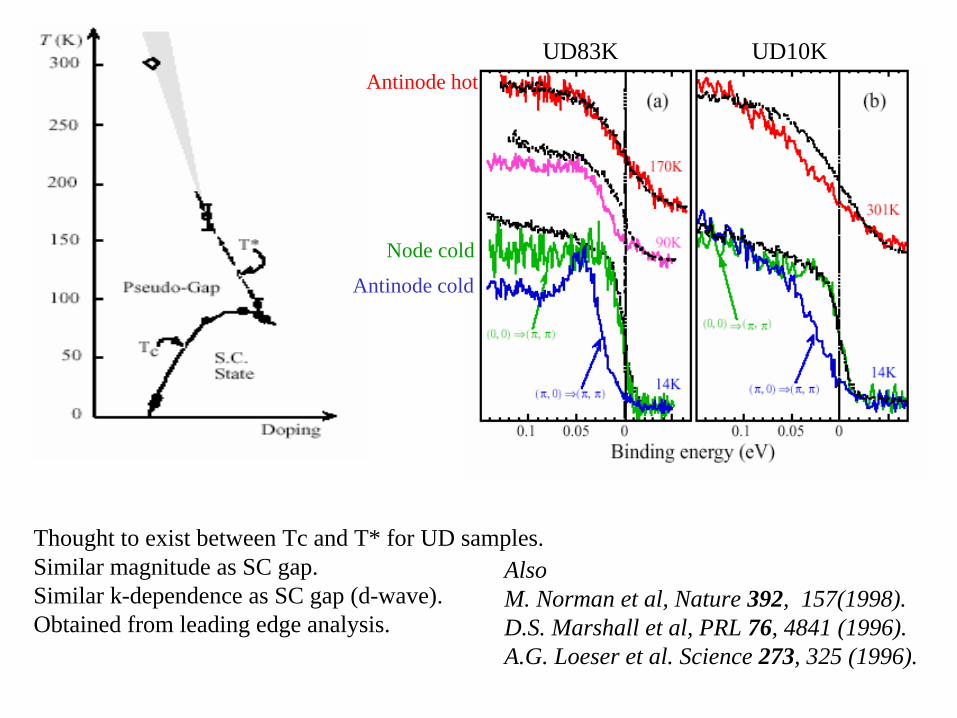
Node cold
Antinode cold
Antinode hot
Thought to exist between Tc and T* for UD samples.Similar magnitude as SC gap. Similar k-dependence as SC gap (d-wave).Obtained from leading edge analysis.
AlsoM. Norman et al, Nature 392, 157(1998).D.S. Marshall et al, PRL 76, 4841 (1996).A.G. Loeser et al. Science 273, 325 (1996).
UD83K UD10K

Top Related