


Languages
Pages
Legal


ANALYSIS OF DEVELOPMENT CONTROL REGULATIONS’
COMPLIANCE IN KITENGELA TOWN, KAJIADO COUNTY,
KENYA
BY:
WATHOME EMMANUEL MAKATO
B63/68730/2013
A PLANNING RESEARCH PROJECT REPORT SUBMITTED IN PARTIAL
FULFILMENT FOR THE MASTER OF ARTS DEGREE IN PLANNING
UNIVERSITY OF NAIROBI
SEPTEMBER, 2016

ii
DECLARATION
This Planning Research Project is my original work and has not been presented for a
degree in any other university.
Signed …………………… Date……………………………
Emmanuel Makato Wathome
CANDIDATE
This Planning Research Project has been submitted for examination with my
approval as University supervisor.
Signed …………………… Date……………………………
Dr. Romanus Opiyo
SUPERVISOR

iii
DEDICATION
I would like to dedicate this report to my parents Mr. and Mrs. Bernard Wathome, my
son Baxton Baraka and wife Winfred Sammy for their unconditional love, support and
encouragement throughout the course of this work.

iv
ACKNOWLEDGEMENT
I would like to thank all those who have supported me and facilitated the fieldwork
and writing of this Research Project Report. Special gratitude goes to all academic
staff members of the Department of Urban and Regional Planning, University of
Nairobi. I single out Dr. Romanus Opiyo who was my supervisor for his guidance and
series of corrections and comments.
I would also like to acknowledge the staff of Kajiado County (Planning, Public
Work/Engineering and Public Health Departments) for the timely provision of
relevant information and members of my class of M.A (Planning) 2013/2014 for their
inspiring, motivating as well as constructive critic which kept me going thought out
the postgraduate course.

v
ABSTRACT
Urbanization is taking place in all parts of the world. In developing countries like
Kenya, urban development has been taking place in a haphazard way especially in
Nairobi’s satellite towns such as Kitengela. This has been attributed to violation of
development control regulations. Several development control tools which provide the
set development control regulations have been provided to guide and control
development in these urban areas. However, the violation of these development
control regulations has persisted resulting to unhealthy environment, lack of
aesthetics, inadequacy of provisions of public utilities and open spaces. The study
sought to identify and document previous and current development control tools used
to guide and control physical development in Kitengela Town, investigate the level of
compliance with development control regulations in Kitengela Town, assess the
factors affecting compliance, establish the effects of the development control tools
compliance level to the urban spatial structure and propose possible intervention
measures for the effective development control regulations compliance. The study
used semi-structured questionnaires to interview 40 households and 24 developers and
a checklist to collect data on 40 developments. It also used interview schedules to
interview 4 key informant. The collected data was analyzed using spatial analysis,
descriptive analysis and basic computation using computer programs such as SPSS
and Excel in analyzing the data. The study found out that; Currently, Kitengela
Zoning Plan (2012) is the main development control tool for Kitengela Town, the
average development control regulations’ compliance level is at 59.5% and the main
factors contributing to development control regulations’ non-compliance are; high
statutory and professional fees (at 25%), corruption (at 22.5%), aspiration of
developers to maximise returns from their land (at 17.5%), ignorance (at 10%) and
low levels of public awareness (at 7.5%). The study has established that there is
moderate negative relationship between building line size and plot coverage and the
main effects of development control regulations’ non-compliance include;
environmental degradation, vulnerability to loss of lives and property, congestion,
inadequacy of public purpose spaces, loss of desirable neighbourhood character and
inadequacy of parking spaces. The study concludes that the main driver of
development control regulations’ compliance is the effectiveness of the development
proposal evaluation process, development supervision and inspection. The study

vi
therefore recommends introduction of a computerized development application
system and adoption of one stop shop concept such as e-construction permit
management system which has been a success in Kigali-Rwanda, establishment of an
e-consultation portal for development control, devolution of development control
institutions to the sub-county level, enforcement of development control through
criminal offence, establishment of an independent development control oversight
institution, zone based statutory fee and gazettement and listing of registered and
licensed development professionals.
vii
TABLE OF CONTENTS
DECLARATION ...........................................................................................................ii
DEDICATION..............................................................................................................iii
ACKNOWLEDGEMENT ............................................................................................iv
ABSTRACT...................................................................................................................v
ABBREVIATIONS AND ACRONYMS...................................................................xiii
CHAPTER ONE : INTRODUCTION...........................................................................1
1.1 Introduction ..........................................................................................................1
1.2 Statement of the Problem .....................................................................................3
1.3 Research Questions ..............................................................................................5
1.4 Research Objectives .............................................................................................5
1.5 Research Hypothesis ............................................................................................6
1.6 Geographical and Contextual Scope ....................................................................6
1.7 Justification ..........................................................................................................7
1.8 Assumptions .........................................................................................................9
1.9 Definition of Terms............................................................................................10
CHAPTER TWO : LITERATURE REVIEW.............................................................13
2.1 Introduction ........................................................................................................13
2.2 Development Control .........................................................................................13
2.2.1 Objectives of Development Control ............................................................14
2.2.2 Development Control Tools/Instruments ....................................................15
2.2.3 Development Control Regulations ..............................................................16
2.2.4 Development Control Elements...................................................................18
2.2.5 Development Control Process .....................................................................19
2.2.6 Approaches of Development Control ..........................................................21
2.3 Implications of Development Control on Urban Development .........................23
2.4 Development Control and Satellite Towns Development..................................23
2.5 Factors affecting Compliance with Development Control Regulations.............24
2.5.1 Lack of Approved Physical Development Plans .........................................25
2.5.2 Laxity in Processing Development Applications ........................................25
2.5.3 High Professional Fees ................................................................................26
2.5.4 High Poverty Levels ....................................................................................26
2.5.5 Lack of awareness of the existence of Development Control Regulations .26
2.5.6 Poor Enforcement Machinery......................................................................27
2.5.7 Political Interference and lack of Political Will ..........................................27

viii
2.5.8 Restrictive Planning Regulations.................................................................28
2.5.9 Effects of Market Forces .............................................................................28
2.5.10 Concluding Remark...................................................................................28
2.6 Effects of Non-Compliance to Development Control Regulations....................29
2.6.1 Land Use Conflicts and Demolitions...........................................................29
2.6.2 Fines and/or Jail Term .................................................................................29
2.6.3 Unhealthy Environment...............................................................................29
2.6.4 Lack of Aesthetics .......................................................................................30
2.6.5 Inadequate Provision of Parking..................................................................30
2.6.6 Inadequate Provision of Children’s Playing Ground ...................................30
2.6.7 Loss of Lives and Property ..........................................................................31
2.7 Intervention Measures for Effective Spatial Development ................................31
2.7.1 Review of Best Practices in Development Control .....................................32
2.7.2 Lessons learnt from Best Practices in Development Control ......................35
2.8 Development Control related Legal, Policy and Institutional Framework ........36
2.8.1 Legal Framework.........................................................................................36
2.8.2 Policy Framework........................................................................................38
2.8.3 Institutional Framework ..............................................................................41
2.9 Conceptual Framework ......................................................................................44
2.10 Conclusion........................................................................................................47
CHAPTER THREE : RESEARCH METHODOLOGY .............................................48
3.1 Introduction ........................................................................................................48
3.2 Research Design.................................................................................................48
3.3 Research Population...........................................................................................48
3.4 Sampling Plan ....................................................................................................49
3.5 Data Need Matrix ...............................................................................................52
3.6 Data Collection Methods....................................................................................54
3.7 Data Analysis Plan .............................................................................................55
3.8 Data Presentation Plan .......................................................................................56
CHAPTER FOUR : STUDY AREA ...........................................................................58
4.1 Introduction ........................................................................................................58
4.2 Geographical Location .......................................................................................58
4.3 Demographic Characteristics .............................................................................61
4.4 Socio-Economic Characteristics ........................................................................61
4.4.1 Local Economy............................................................................................62
ix
4.5 Social Infrastructure ...........................................................................................64
4.6 Physical Infrastructure........................................................................................65
4.7 Natural Physical and Geological Features .........................................................67
4.8 Climatic Characteristics .....................................................................................68
CHAPTER FIVE : STUDY FINDINGS .....................................................................69
5.1 Introduction ........................................................................................................69
5.2 Response Rate ....................................................................................................69
5.3 Socio-Economic Background of Respondents...................................................70
5.3.1 Socio-Economic Background of Residents .................................................70
5.3.2 Socio-Economic Background of Developers ..............................................70
5.3.3 Socio-Economic Background of Development Control Officials ...............71
5.4 Identification of Development Control Tools and Compliance Levels .............71
5.4.1 Development Control Tools for Kitengela Town before the Preparation ofthe Town’s Local Physical Development Plan .....................................................71
5.4.2 The Current Main Development Control Tools for Kitengela Town ..........73
5.4.3 Development Control Regulations Compliance Levels in Kia Ng’ombe ‘B’Zone ......................................................................................................................74
5.5 Factors Affecting Development Control Regulations’ Compliance ..................85
5.5.1 High Professional and Statutory Fees..........................................................87
5.5.2 Corruption....................................................................................................87
5.5.3 Aspirations and Aims of Developers to Maximise Returns on their Land..88
5.5.4 Ignorance .....................................................................................................88
5.5.5 Lack of Public Awareness ...........................................................................89
5.5.6 Complexity of the Development Control Process .......................................89
5.5.7 Poverty.........................................................................................................90
5.5.8 Poor Enforcement ........................................................................................91
5.6 Effects of Development Control Regulations Non-Compliance........................91
5.6.1 Environmental Degradation.........................................................................92
5.6.2 Vulnerability to Loss of Lives and property................................................93
5.6.3 Congestion ...................................................................................................94
5.6.4 Loss of Desirable Neighbourhood Character ..............................................94
5.6.5 Inadequacy of Children Playing Areas........................................................95
5.6.6 Inadequacy of Parking Spaces.....................................................................95
5.7 Suggestions on Possible Intervention Measures for the Effective DevelopmentControl Regulations Compliance .............................................................................96
5.7.1 Strict Enforcement of Development Control...............................................97

x
5.7.2 Regular Development Supervisions and Inspections ..................................97
5.7.3 Public Sensitization .....................................................................................97
5.7.4 Simplification of the Development Control Process ...................................98
5.7.5 Listing of Development Professionals.........................................................98
5.7.6 Curbing Corruption......................................................................................98
5.7.7 Revision of Statutory Fees...........................................................................99
CHAPTER SIX : SUMMARY OF FINDINGS, CONCLUSIONS ANDRECOMMENDATIONS...........................................................................................100
6.1 Introduction ......................................................................................................100
6.2 Summary of the Study Findings.......................................................................100
6.2.1 Development Control Tools for Kitengela Town......................................100
6.2.2 Development Control Regulations Compliance Levels in Kia Ng’ombe ‘B’Zone ....................................................................................................................101
6.2.3 Factors Affecting Development Control Regulations Compliance ...........101
6.2.4 Effects of the Development Control Regulations Non-Compliance .........102
6.2.5 Possible Intervention Measures for the Effective Development ControlRegulations Compliance.....................................................................................102
6.3 Study Conclusions............................................................................................103
6.4 Recommendations ............................................................................................104
6.4.1 Introduction of a Computerized Development Application System andadoption of One Stop Shop Concept ..................................................................104
6.4.2 Establishment of an E-Consultation Portal for Development Control ......105
6.4.3 Development of a GIS based Development Control System ....................105
6.4.4 Devolution of Development Control Institutions to the Sub-County Level............................................................................................................................106
6.4.5 Enforcement of Development Control through Criminal Offence ............106
6.4.6 Establishment/Empowerment of Neighbourhood/Residents Associations107
6.4.7 Establishment of an Independent Development Control OversightInstitution............................................................................................................108
6.4.8 Zone Based Statutory Fee..........................................................................108
6.4.9 Gazettement and Listing of Registered and Licensed DevelopmentProfessionals.......................................................................................................109
6.5 Suggestions for Further Research ....................................................................109
REFERENCES ..........................................................................................................110
APPENDICES ...........................................................................................................114

xi
LIST OF FIGURES
Figure 2-1: Conceptualized diagram of Development Application Evaluation in Kenya .......21
Figure 2-2: The New zoning system in Singapore...................................................................34
Figure 2-3: Conceptual Framework .........................................................................................45
Figure 5-1: Land Use Mix in Kia Ng’ombe ‘B’ Zone .............................................................76
LIST OF TABLES
Table 2-1: Summary of Development Control Regulations ....................................................17
Table 3-1: Data Need Matrix ...................................................................................................52
Table 5-1: Response Rate ........................................................................................................69
Table 5-2: Monthly Income of Residents ................................................................................70
Table 5-3: Development Control Regulations for Kia Ng’ombe ‘B’ Zone .............................75
Table 5-4: Structure Types in Kia Ng’ombe ‘B’ Zone ............................................................77
Table 5-5: Plot Sizes in Kia Ng’ombe ‘B’ Zone......................................................................78
Table 5-6: Land Use-Land Size Cross Tabulation...................................................................79
Table 5-7: Plot Coverage within Kia Ng’ombe ‘B’ Zone ........................................................80
Table 5-8: Correlation of Building Line Size and Plot Coverage ............................................81
Table 5-9: Parking Space Provision-Plot Coverage Cross Tabulation ....................................82
Table 5-10: Summary of Development Control Regulations Compliance ..............................85
Table 5-11: Factors Affecting Development Control Regulations’ Compliance.....................86
Table 5-12: Effects of Development Control Regulations’ Non-Compliance .........................92
Table 5-13: Suggestions of Possible Intervention Measures for Effective Development
Control Regulations’ Compliance............................................................................................96
LIST OF MAPS
Map 3-1: Spatial Distribution of Sampled Developments .......................................................51
Map 4-1: Kitengela in National, Regional and Local Context.................................................59
Map 4-2: Kia Ngombe ‘B’ Zone, Kitengela Town ..................................................................60
Map 4-3: Road Network in Kitengela Town ...........................................................................66
Map 5-1: Developments within the Riparian Reserve .............................................................84
xii
LIST OF PLATES
Plate 1-1: A Commercial Development in Kitengela Town..........................................8
Plate 1-2: Mixed Density Residential Developments within Kia Ng’ombe ‘B’ Zone ..9
Plate 4-1: Flower Farms within Kitengela Town.........................................................62
Plate 4-2: A University in Kitengela Town .................................................................64
Plate 5-1: Washrooms within the Building Line Space ...............................................79
Plate 5-2: Orientation of Developments ......................................................................80
Plate 5-3: Roadside Dumping ......................................................................................92
Plate 5-4: Connected Structures...................................................................................93
Plate 5-5: Narrow Passages..........................................................................................94
Plate 5-6: Non Uniformity Building Typologies .........................................................94
Plate 5-7: Inadequacy of Open Spaces.........................................................................95
Plate 5-8: Use of Passages as Parking Spaces .............................................................96

xiii
ABBREVIATIONS AND ACRONYMS
AAK Architectural Association of Kenya
EIA Environmental Impact Assessment
EMCA Environmental Management and Coordination Act
GIS Geographical Information System
GOI Government of Ireland
GOK Government of Kenya
KNBS Kenya National Bureau of Statistics
NEMA National Environment Management Authority
NLC National Land Commission
OECD Organization for Economic Co-operation and Development
PDP Part Development Plan
PPP Public-Private Partnership
SDGs Sustainable Development Goals
SHHP Self Help Housing Program
SPSS Statistical Package for Social Science
TISA The Institute for Social Accountability
UN United Nations
UNCHS United Nations Commission on Human Settlements
UNPD United Nations Development Programme
USAID United States Agency for International Development
WCED World Commission on Environment and Development
1
CHAPTER ONE: INTRODUCTION
1.1 Introduction
For any system to work as expected there is always the need for control and balance
which is a form of regulation for necessary operation (Obabori, Obiuwevbi and
Olomu, 2007). In the built environment, development control regulations provides for
these controls and balance. The development control regulations (development
guidelines and specifications) are provided by the various development control tools
ranging from development plans to development legislations (GOI, 2007). These
development control tools are intended to provide the strategic framework and policy
context for all local planning decisions (GOI, 2007). The rationale for introduction of
development control on both public and private development is to achieve objectives
of safety and better health in order to create an improved environment for the benefit
of the community (Dissanayake, 1987).
Different countries have employed different typologies of planning instruments and
approaches in concerted efforts to address some of the shortcomings experienced in
the development process. The instruments have been derived from different sectoral
experiences in both the developed countries and developing countries (Akatch, 1995).
In Africa, some of the most commonly used planning approaches include, Master
planning which despite its static nature has been used by a number of countries;
Action planning and structure planning approach as used in a few countries like
Kenya, Uganda and Botswana; Strategic planning is used in South Africa and
Egyptians new towns with Hybrid variations of land use regulations for urban
development control and management (Akatch, 1995).
Kenya has had different legislations that have guided physical development since
1915 such as Town Planning Ordinance Cap of 1931, Land Planning Act Cap 303 and
the Physical Planning Act of 1996. The Town Planning Ordinance Cap 134 of 1931
(now repealed) provided for the use, control and development of Government Land in
Kenya, The Land Planning Act Cap 303 was enacted to address land use in the areas
within 3 miles of municipality and township boundaries and areas within 400 feet
from the centre of trunk roads while the Physical Planning Act extended planning to
all areas of the country. Today, urban planning in Kenya is under two institutions; the
Ministry of Lands, Housing and Urban Development and the County governments.

2
The two institutions are mainly guided by the Physical Planning Act Cap 286 (under
review), Urban Areas and Cities Act (2011), County Government Act (2012) and
National Land Commission Act (2012). There are other numerous laws that guide
physical planning and are mostly related to land. These laws are set to ensure
sustainable development in the country and especially in urban areas where the rate of
development is very high due to high rate of urban population growth due to rural
urban migration and natural population growth. This increase in urban population has
not been adequately planned for. Hardly 30 percent of the urban centres are planned
and even where plans are available they are rarely enforced (Kimani and Musungu,
2010). The legal structures under which development control is enforced has been
identified to be either too weak or inappropriate in addressing the myriad of problems
of physical development (Ahmed and Dinye, 2011). The growth in unplanned
settlements in the urban areas, urban sprawl, congestion and property development in
excess of the carrying capacity of available infrastructure are the most obvious
evidence of failure to plan urban development and enforce the designated laws and
standards. Physical development planning in Kenya has not been a prerequisite of any
building construction. This has led to location of developments in areas that are
poorly served with infrastructural services and with incompatible and conflicting
developments.
The study therefore seeks to analyses development control regulations’ compliance in
Kitengela Town being one of the largest satellite towns of Nairobi city with a
population size of 58,167 and an area of 89.19km2 (KNBS, 2009). The study
highlights the level of development control regulations’ compliance by assessing one
of the oldest residential zone of Kitengela Town (Kia Ng’ombe ‘B’ Zone) as well as
the different development control tools that have been used to guide and control
physical development in the town over the years, the level of compliance to these
development control regulations, the factors affecting the compliance level, the effects
of the compliance level and the possible intervention measures for the effective
development control regulations compliance.
3
1.2 Statement of the Problem
Urbanisation is taking place in all parts of the world. The world urban population has
been growing significantly from 2% in the year 1800 to about 50% currently (UN-
Habitat 2011). In the less developed countries, the urban population is expected to
grow from 1.9 billion in 2000 to 3.9 billion in 2030 (UNPD, 2008). Growth rate is
expected to be more rapid in urban areas in less developed countries/regions
averaging 2.3% per annum with doubling time of 30 years. The urban population in
Africa is expected to double by 2025 with African cities becoming home to over
40,000 people every day (Hall and Pfeifer, 2000:3).
Like most African countries, Kenya has been urbanizing rapidly. Of the projected top
20 fastest growing cities in the world from 2010 to 2025, Mombasa and Nairobi are
among them with Mombasa being expected to grow at 79 percent and Nairobi at 77.3
percent (State of East Africa Report, 2012). While an estimated 20.4 percent of
Kenya’s population lived in urban areas by the year 2000, the proportion is estimated
to reach 60 percent by the year 2030 (Kenya Vision 2030). This growth is largely due
to a high level of rural-urban migration fuelled by rural poverty and a dwindling per
capita ownership of farming and grazing land, natural population growth and arbitrary
urban boundary extensions (Owuor, 2011).
The pressure for urbanization has led to the evolution of numerous urban areas whose
development in most cases has not been in tandem with physical development
planning, alongside enforcement of planning standards and regulations (AAK, 2011).
Unmanaged urban growth has contributed to social and economic problems, including
the emergence and proliferation of informal settlements, shortage of decent housing,
rising crime, vulnerability to disasters such as fire, collapsing buildings and flooding,
environment degradation and poor infrastructural services such as road transport,
social amenities, drainage system and sanitation services (Kenya, 2007). In order to
deal with the strain of urban population booms some of these cities are turning to
satellite cities and towns as part of their solution. Without proper planning, there is
likely of emergence of unplanned urban sprawl. This has created a need for new
towns to be developed within the peripheries. This has been the case with Nairobi
City where satellite towns such as Ongata Rongai, Kiserian, Ngong, Athi River, Ruiru
and Kitengela have emerged and grown significantly as a way of accommodating the
swelling number of urban dwellers in Nairobi city. Their emergence and rapid growth
4
has been attributed to their proximity to the city and availability of land. This is due to
the fact that rapid urban growth means an increasing demand for urban land,
particularly for housing, but also for various other urban uses. This increase in
demand for land affects land use in the peri-urban areas where most of the satellite
towns are located (Aguilar, 2008; Aguilar and Ward, 2003; Tacoli, 1999 and 1998).
As the city expand, the rural-urban fringe experience its direct impact with those
living there facing new challenges and opportunities in meeting their life needs and
accommodating the by-products of land use changes. Although urbanisation of these
fringe areas provides opportunities for employment, better housing, education,
knowledge and technology transfer and ready markets for the agricultural products,
increase in population places enormous stress on natural resources and existing social
services and infrastructure (Rees, 1992; Rees and Wackernagel, 1994).
Serving mainly as dormitory towns, these satellite towns are characterised by strip
and nodal physical development with haphazard developments coming along major
roads and then spreading to the interior (Kazungu, Gichuru & Gitau, 2011). This has
resulted in high densities, overcrowded housing, insanitary conditions, diminishing
open spaces and haphazard peripheral development. The transformation of these
towns from rural to urban has been taking place under the watch of the local
authorities from the local governments in the name of town and county councils to the
current county governments. These local authorities have used different development
control tools to control and guide physical developments some of which have been
considered to be inadequate, inappropriate or poorly enforced resulting to
uncoordinated physical development and its resultant effects. In addition, majority of
these satellite towns lack local physical development plans with the few that have
them having been prepared in the recent past. This has resulted to a firefighting
approach to development control as development precede planning especially in the
old zones of these towns.
A significant volume of research literature on impacts of urbanization on land use
planning, livelihood and environment in the Nairobi rural-urban fringe and
agglomeration and dispersion is reported in Thuo (2013), Friedmann‘s (1987: 38),
Krugman and Venables (1990), Rosenthal and Strange (2010). However, limited work
has been done in understanding the development control regulations’ compliance in
Nairobi’s satellite towns especially in the old zones of these towns since the level of

5
compliance to planning standards (development control regulations) vary from zone
to zone and development to development due to difference in socio-economic
characteristics among people as noted by Habitat International, 2009. With the
increasing rate of land subdivision of grazing land (as noted by Nkedianye, 2004) and
subsequent physical development in Kitengela town especially in the old residential
zones, the development control tools used to guide and control physical development
in the town since its emergency, level of adherence to these development control tools
within Kia Ng’ombe ‘B’ Zone and the factors explaining the compliance level and the
resultant effects of the adherence level are questioned.
1.3 Research Questions
The study set out to answer the following questions:
1. What are the previous and current development control tools used to guide and
control physical development in Kitengela Town?
2. What is the level of compliance with development control regulations in
Kitengela Town?
3. What are the factors affecting compliance with development control
regulations in Kitengela Town?
4. What are the effects of the level of compliance to development control
regulations to the urban spatial structure in the study area?
5. What are the possible intervention measures for the effective compliance with
development control regulations in Kitengela Town?
1.4 Research Objectives
The specific objectives of the study are as follows:
1. To identify and document the previous and current development control tools
used to guide and control physical development in Kitengela Town.
2. To investigate the development control regulations compliance levels in
Kitengela Town.
3. To assess the factors affecting development control regulations compliance in
Kitengela Town.
4. To establish the effects of the development control regulations compliance
level to the urban spatial structure of Kitengela Town.
5. To propose possible intervention measures for the effective development
control regulations compliance in Kitengela Town.

6
1.5 Research Hypothesis
The research hypothesis for this study is as follows;
Ha: The correlation between building line size and level of plot coverage will be
significantly different from zero.
Thus, the Null Hypothesis will be as follows;
H0: The correlation between level of building line and level of plot coverage will not
be significantly different from zero.
The two variables for which the magnitude of relationship will be assessed are
building line size and plot coverage (building line size being the independent variable
and plot coverage the dependent variable). The statistical technique to be used to test
the hypothesis will be correlation (Pearson correlation coefficient) since the variables
are perceived to be linearly related and are at ratio level of measurement.
1.6 Geographical and Contextual Scope
The study is geographically limited to Kia Ngombe ‘B’ Zone in Kitengela Town
which is one of the seventeen zones in the town. This research is part study on the
dynamics of development control which is broad. Therefore the research is limited to
the development control tools used to guide and control physical development in
Kitengela Town, the development control regulations compliance within Kia Ngombe
‘B’ zone, the factors affecting development control regulations compliance level, the
effects of the development control regulations compliance level to the urban spatial
structure and possible intervention measures for the effective development control
regulations compliance in Kitengela Town. Under the development control tools, the
study will examine the various development control tools informing physical
development in Kitengela Town since the emergence of the town as well as assess the
level of development control regulations compliance in Kia Ngombe ‘B’ Zone-the
study area. The study will also look at the socio-economic factors affecting the
development control regulations compliance level and the resultant effects of the
compliance level to the urban spatial structure of the study area. In addition, the study
will examine the previous efforts, on-going programmes and proposed programmes
on improving the development control regulations compliance in the town. This will
be accompanied by alternative planning interventions that can be adopted for the
effective development control regulations compliance of the Kia Ngombe ‘B’ Zone

7
and the entire Kitengela town as a whole as the zone may not be examined in isolation
from the other zones forming the town.
1.7 Justification
Analysis of development control regulations’ compliance plays a great role in the
provision of a better understanding of the effectiveness of existing development
control instruments in achieving sustainable urban development, capacity of planning
departments in development control and the main factors hampering the effectiveness
of development control. It also facilitates the formulation of policy proposals which
can be adopted to ensure orderly physical development, optimal land use, proper
execution and implementation of approved physical development plans and protection
and conservation of the environment as noted by AAK (2011). In addition, the study
therefore will have benefitted the academia with relevant information that is crucial in
beefing knowledge bank in so far as development control issues are concerned.
Therefore, for effective management of urban areas, development control regulations’
compliance analysis is key for all towns and cities and especially for towns
experiencing rapid urbanization due to the rapid rate of land use and land use intensity
changes. Kitengela Town (a satellite town of Nairobi City within the wider Nairobi
Metropolitan region) is one such town undergoing rapid spatial transformations
transforming from a group ranch (in 1988) to the current robust urban centre. The
town which is only 30 kilometers south of Nairobi city begun as a group ranch
(Kitengela group ranch) made up of 18,292 hectares and 214 registered members
which was subdivided in 1988 in efforts by the Government to encourage private land
ownership in pastoral systems with the aim of intensifying and commercializing
livestock production. After subdivision of the group ranch, land fragmentation and
sales have continued at a steady and escalating pace. The land fragmentation has been
accelerated by the high rate of in-migration from Nairobi City due to availability of
affordable land, its proximity to Nairobi and its strategic location along an
international road (Nairobi-Arusha road). The human population within the Kitengela
area has more than doubled in the last 10 years from 6,548 in 1989 to 17,347 in 1999
to 58,167 in 2009.
Kitengela once had its little economy pegged on livestock slaughter houses. Wildlife
roamed the land and only a few non-Maasai dared to settle here. Today, it is
8
Plate 1-1: A Commercial Development in Kitengela TownSource: Fieldwork, 2016
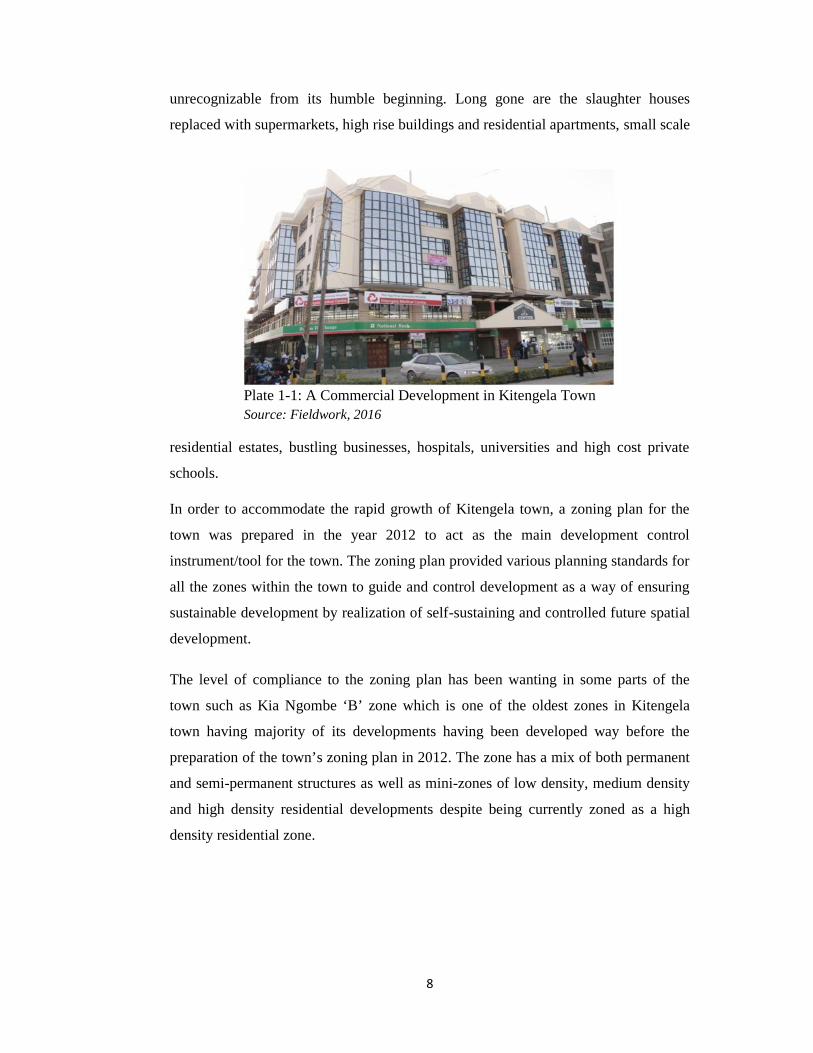
unrecognizable from its humble beginning. Long gone are the slaughter houses
replaced with supermarkets, high rise buildings and residential apartments, small scale
residential estates, bustling businesses, hospitals, universities and high cost private
schools.
In order to accommodate the rapid growth of Kitengela town, a zoning plan for the
town was prepared in the year 2012 to act as the main development control
instrument/tool for the town. The zoning plan provided various planning standards for
all the zones within the town to guide and control development as a way of ensuring
sustainable development by realization of self-sustaining and controlled future spatial
development.
The level of compliance to the zoning plan has been wanting in some parts of the
town such as Kia Ngombe ‘B’ zone which is one of the oldest zones in Kitengela
town having majority of its developments having been developed way before the
preparation of the town’s zoning plan in 2012. The zone has a mix of both permanent
and semi-permanent structures as well as mini-zones of low density, medium density
and high density residential developments despite being currently zoned as a high
density residential zone.

9
Plate 1-2: Mixed Density Residential Developments within KiaNg’ombe ‘B’ ZoneSource: Fieldwork, 2016
This has resulted to undesirable development intensity and pattern and hence the
author’s interest in the area of study. In addition, there is an identifiable information
gap in understanding the development control regulations compliance in Nairobi’s
satellite towns. The study aims at formulation of possible intervention measures for
sustainable physical development of Kia Ng’ombe ‘B’ Zone and Kitengela town in
general.
1.8 Assumptions
The study has several assumptions which include;
1. Compliance with development control regulations is a means to sustainable
development in urban areas
2. The sample data from the study can be used to generalize or estimate the
development control regulations’ compliance level for the whole town and
other satellite towns like Kitengela
3. The recommendations (intervention measures) from the study can be adopted
to solve similar problems in other parts/zones of the town as well as other
towns facing similar problems

10
1.9 Definition of Terms
Development
Control:
The draft Physical Planning Handbook of 2008 defines
development control as ‘a process of ensuring development
applications comply with policy guidelines, planning
regulations, standards, approved physical development
plans, Local Authority by-laws as well as other relevant
statutes’. This also involves enforcing compliance with
these requirements in implementing the approved
development proposals to ensure sustainable development.
Development: The Physical Planning Act Cap 286 (under review) defines
development as ‘the making of any material change in the
use or density of any building or land or subdivision of any
land’. This study considers the definition of development to
include the works that the Local Authority grants approval
for as per Section 33 of the Physical Planning Act.
Planning
Standards:
Planning standards are development guidelines and
regulations provided by various development control tools
to guide and control development in a given area
Urbanization: This is defined as a process of increasing concentration of a
country’s national population into towns and cities. The
process includes the multiplication of points of
concentration and increase in size of individual
concentration (Draft Land Policy-Kenya, 2007).
Satellite Towns: Satellite towns are smaller municipalities that are adjacent
to a major city which is the core of a metropolitan area.
They differ from mere suburbs, subdivisions and especially
bedroom communities in that they have municipal
governments distinct from that of the core metropolis and
employment bases sufficient to support their residential
populations (Ministry of Nairobi Metropolitan

11
Development, 2009)
Advisory/Zoning
Plan:
It is a plan indicating permitted subdivision and use of land
specified in such plan (draft Physical Planning Handbook
of 2008). AAK 2011 defines advisory/zoning plan as a plan
indicating permitted subdivision and use of land specified
in such plan.
Urban Area: Means an area designated as such under the Urban Areas
and Cities Act as contemplated in Article 184 of the
Constitution;
Physical Planning: The Draft Physical Planning Bill 2015 defines physicalplanning as urban or regional planning, spatial planning,town and county planning, or land planning;
SustainableDevelopment:
It can be defined as Development that meets the needs ofthe present without compromising the ability of futuregenerations to meet their own needs (WCED,1987).Sustainable Development expands and enhances thequality of human life without debasing the ecologicalcapital.
Land use planning: The draft Physical Planning Handbook of 2008 defines land
use planning as deciding in advance what to do, where,
when, with what, how, on or under the land. It is a thought
process that guides land use activities on space. This
process has to be guided by a set of rules, regulations and
standards.
Intervention
Measures:
These refer to deliberate actions taken to improve a
situation (Oxford Dictionary)
Sustainable
Development:
It can be defined as Development that meets the needs of
the present without compromising the ability of future
generations to meet their own needs (WCED, 1987).
Sustainable Development expands and enhances the quality
of human life without debasing the ecological capital.
12
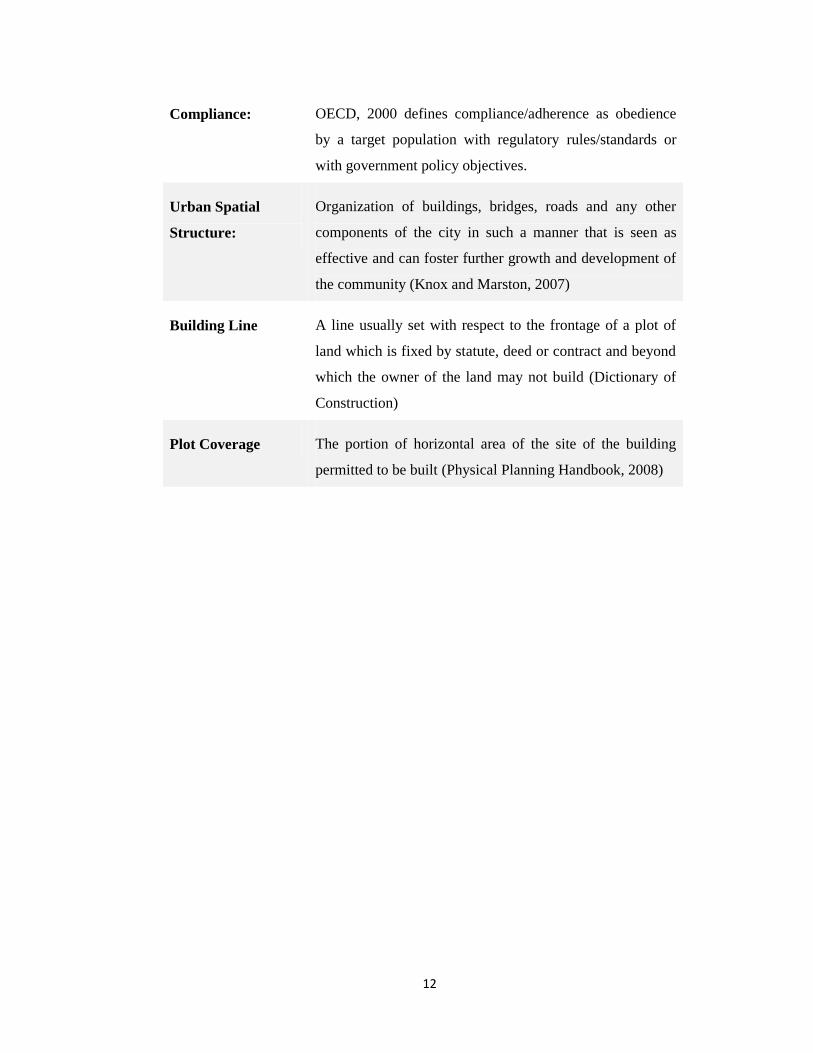
Compliance: OECD, 2000 defines compliance/adherence as obedience
by a target population with regulatory rules/standards or
with government policy objectives.
Urban Spatial
Structure:
Organization of buildings, bridges, roads and any other
components of the city in such a manner that is seen as
effective and can foster further growth and development of
the community (Knox and Marston, 2007)
Building Line A line usually set with respect to the frontage of a plot of
land which is fixed by statute, deed or contract and beyond
which the owner of the land may not build (Dictionary of
Construction)
Plot Coverage The portion of horizontal area of the site of the building
permitted to be built (Physical Planning Handbook, 2008)

13
CHAPTER TWO: LITERATURE REVIEW
2.1 Introduction
This chapter entails the systematic identification and analysis of documents
containing information related to; development control tools, factors affecting
development control regulations’ compliance, effects of development control
regulations non-compliance level to the urban spatial structure, possible intervention
measures for the effective development control regulations compliance based on
lessons learnt form best practice case studies, development control related legal,
policy and institutional framework and conceptual framework .
2.2 Development Control
Reade (1987), defines development control as the power to decide whether or not
specific development takes place on specific sites to control the intensity of
development that is permitted and to control its layout and design. Its power lies not
in the power to grant or to refuse permission, but rather in the power of the
professional planners to persuade the applicants to modify their proposal, even before
they submit them for approval. Groves (2000) conceives development control as the
executive arm of the planning process being the means whereby policies are
implemented, specific land use proposals brought to fruition and unlawful
development prevented. It enables a local authority to protect residential areas from
inappropriate intrusions, reserve land for new industries, maintain a green belt, keep
valuable buildings and trees and prevent ugly signs.
Development Control is also defined as the process of managing or regulating the
carrying out of any works on land or making of any material change in the use of any
structures and ensuring compliance with the physical development plans (Physical
Planning Act, 1996).
The development control function seeks to manage and regulate property
development to ensure that all development takes place at an appropriate time and
place and in such a manner that it conforms to a pre-determined set of policies or
standards. Ahmed and Dinye (2011), notes that development control can be either pre-
development, during development or at post -development stage of a project which is
sited in an unapproved location. It is a highly sensitive exercise which must be done
with precaution, precision, firmness and with deep sense of responsibility by the
authority concerned. Fairness, justice and equity should be the watchwords in

14
development control programmes. If done properly and in a humane manner, it will
be widely accepted. However, when it is haphazardly done with bias and favoritism in
the society, it could be explosive and may lead to violent reactions from affected
members of the community concerned.
2.2.1 Objectives of Development Control
According to Ahmed and Dinye (2011), development control facilitates appropriate
development, recognizing its significance in building and protecting a healthy
economy and a sustainable environment. It also examines the potential impact of the
proposed development, protects the public interest from inappropriate development
and also involves compliance of all procedures, building codes, standards to ensure
that physical plans conform to the approved plans. The Draft Physical Planning Bill
2015 states that the main purpose of development control is ‘to ensure the orderly and
rational development of land to create sustainable human settlements that
accommodate a variety of land uses to meet the needs of the people who live in these
settlements’. In this regard, there are five main objectives of development control
which include:
i. To ensure orderly physical development;
ii. To ensure optimal land use;
iii. To ensure proper execution and implementation of approved physical
development plans;
iv. To protect and conserve the environment and;
v. To promote public participation in physical development decision-making.
The legitimacy of urban development control is derived from the police power which
is exercised by the government (Opata, Mulongo, Omuterema, Ngetich, 2013). The
Draft Physical Planning Bill 2015 and the Urban Areas and Cities Act 2011 provides
for each planning authority in the area under the planning authority’s jurisdiction to:
i. Control or prohibit the use or development of land or buildings for the proper
and orderly development of the area;
ii. Control or prohibit the sub-division of land or existing parcels of property;
iii. Consider and approve all development applications;
iv. Protect, preserve public land reserved for open spaces, parks, urban forests and
green belts;

15
v. Ensure compliance with the provisions of Draft Physical Planning Bill 2015
and the Urban Areas and Cities Act 2011or any other relevant written law.
2.2.2 Development Control Tools/Instruments
Ngetich, Opata and Mulongo (2014) identified two types of development control
tools/instruments; statutory and non-statutory instruments. The statutory instruments
entail the legislations and policies which provide for the preparation of development
plans and the planning and development regulations and standards which inform
development control process. They include the Constitution of Kenya 2010, Physical
Planning Act 1996, County Government Act 2012, Urban Areas and Cities Act 2011,
National Land Commission Act 2012, Public Health Act Cap 242 and the EMCA of
1999, Sessional paper No.6 of 1999 on Environment and Development, Draft
National Urban Development Policy, Environment and Natural resource policy,
National Housing Policy and Draft National Land Policy (2006). The non-statutory
instruments include Local Authorities Planning and building Regulations, gazetted
rules and regulations (Physical Planning Handbook), circulars from Ministries,
Departments and resolutions of County committee meetings as well as political
decisions.
According to AAK (2015), the main tools or instruments of development for orderly
and sustainable development include: Regional Physical Development Plans, Local
Physical Development Plans, Part Development Plans, Zoning Plans and ordinances
and Local Authorities Planning and building Regulations (The Building Codes). Of
special importance is the Local Government (Adoptive By-Laws) (Building) Order
1968 due to its use as the main development control tool in towns and other urban
areas lacking development plans. It comprehensively addresses among others matters
revolving around comfort, aesthetics, safety, public health, lifespan and performance
of the built environment and their inhabitants (Nduthu, 2010). The code clearly
outlines the process of application for development permission and mandatory
inspections. These development control tools/instruments provide the development
guidelines and regulations (development control regulations) which provide a
framework for development control process.

16
2.2.3 Development Control Regulations
Development control regulations are provided at plot and neighbourhood/zone levels.
At plot level, development control regulations are provided in terms of plot settings,
permitted structure types, permitted uses, permissible development with conditions
and prohibited developments (Rongai Zoning Plan, 2013). At neighbourhood level,
development control regulations are provided in terms of roads hierarchy (widths and
length of roads, the number of plots the roads ought to serve and provision of dead
ends and truncations), provision of public utility spaces and the percentage of land use
allocation (Draft Physical Planning Handbook, 2008).
In regards to plot settings, the development control regulations provided are the
permitted minimum plot sizes, permitted minimum access road width, permitted
maximum plot coverage, permitted maximum building heights, permitted minimum
building line, permitted minimum setbacks, parking space provisions specification
and waste water disposal mechanisms. Under the permitted structure types, the
typologies of developments are specified; single dwelling units, apartments/flats, row
housing, health institutions, educational institutions, nature parks/trails, open spaces,
assembly plants etc. The permitted structure type has to be in line with the permitted
use. The permitted use varies between the ten main land uses which include;
Residential, Commercial, Industrial, Recreational, Transportation, Public Purpose,
Public Utilities, Educational, deferred (land bank) and urban agriculture (Draft
Physical Planning Handbook, 2008). These land uses are further divided into sub-land
uses such as: high, medium and low density for residential land use and heavy and
light for industrial land use.
Under the permissible developments with conditions, the developments which are
deemed compatible with the permitted land use are indicated with provision of the
conditions such as change or extension of user, specification on plot settings such as
landscaping and fence heights and specification on the intensity of the permissible
land use such as specification on the scale of the use. In regards to prohibited
developments, the type of developments deemed incompatible to the permitted land
use are listed indicating that these developments cannot be permitted even with
conditions attached since they seem to conflict with the permitted land use.

17
Table 2-1: Summary of Development Control Regulations
LEVEL DEVELOPMENT
CONTROL
REGULATIONS
DETAILS
Neighbourhood
Level
1. Roads’ Hierarchy Specifications on:
o Widths and Length of Roads
o Number of Plots the Roads Ought to Serve
o Provision of Dead Ends and Truncations
2. Provision of
Public Utility
Spaces
Specification on:
o Solid Waste Disposal
o Wastewater Disposal
3. Percentage of
Land Use
Allocation
Percentage of Land for:
o Dwelling plots
o Recreation
o Community Facilities
o Roads and Streets
Plot Level 1. Plot Settings o Permitted Minimum Plot Sizes
o Permitted Minimum Access Road Width
o Permitted Maximum Plot Coverage
o Permitted Maximum Building Heights
o Permitted Minimum Building Line
o Permitted Minimum Setbacks
o Parking Space Provisions Specification
o Waste Water Disposal Mechanisms
2. Permitted
Structure Types
Typologies of developments are specified;
o Single Dwelling Units
o Apartments/Flats
o Row Housing
o Health Institutions
o Educational Institutions
o Nature Parks/Trails
o Open Spaces
o Assembly Plants
3. Permitted Uses o Residential Density

18
Specification:
o Low Density
o Medium
Density
o High Density
o Industrial Intensity
Specification:
o Heavy
o Medium
o Light
o Commercial
o Recreational
o Transportation
o Public Purpose
o Public Utilities
o Educational
o Deferred (Land Bank)
Urban Agriculture
4. Permissible
Development with
Conditions
Conditions such as:
o Change or Extension of User
o Specification on plot settings such as
landscaping and fence heights
o Specification on the intensity of the
permissible land use such as specification
on the scale of the use
5. Prohibited
Developments
List of developments types deemed
incompatible to the permitted land use
Source: Author’s Construct, 2016
2.2.4 Development Control Elements
The elements of urban development control include Part Development Plans, Land
Subdivisions, Change of User, Extension of User, Extension of Lease and Building
Plans. These elements of urban development are implemented leading to the way the
towns spatially get organized (Opata, Mulongo, Omuterema, Ngetich, 2014).
Part development plans (PDP’s) are plans which are prepared on the basis of an
approved Physical Development plan. It indicates precise areas identified for

19
immediate use and for alienation. It has been abused or used in the past to identify and
allocate plots reserved for public utilities, riparian reserves and other environmentally
sensitive areas, for private use.
A subdivision plan is used to actualize proposal of LPDP and specifies zoning density
of an area. It has been used as premise for decision making in a place where there is
no master plans to guide layout development of a town.
Change of user, extension of user and extension of lease are interrelated elements of
development control and they are used to monitor land use change in the urban
setting. Change of user entails substituting the existing function of the plot for another
different user while extension of user involves introducing another different user to
share the same space in the plot. In the case of extension of lease, it means renewal of
lease to reflect an extra term of ownership.
Building plans entails Architectural and Structural Drawings of developments. They
indicate the design, size and typology of buildings as well as the structural settings of
the buildings. They are used to monitor development density in an urban setting
(Opata et al, 2014).
2.2.5 Development Control Process
The process of development control entail evaluation of applications for development
permission, granting or refusing permission and inspecting developments (Opata,
Mulongo, Omuterema & Ngetich, 2013). Currently, urban development control is
under the armpit of the 47 County Governments in Kenya (Kenya, 2010). According
to Opata, Mulongo, Omuterema and Ngetich (2013), there are two phases of
development control; evaluation of development application and inspection.
In the first phase of development control process (evaluation of development
application) under the County Government, the Sub-County Admistrators receive the
application forms (Form PPAI) from the applicants with sufficient copies for
circulation to various institutions for comments. The type of development applications
which are normally processed ranges from land subdivision or amalgamation,
building plans, change of user and extension of user and extension of leases or
renewals. Development permission is granted by the County Government upon
receipt of favourable comments from the institutions to which the applications are
circulated to. A decision by the County Government’s Technical committee led by the

20
Sub-County Administrator is made within a period of one month and that decisions
can either fall within four categories notably: Unconditional permission or approval,
Conditional approval, Refusal of permission and Refusal to take a decision or
deferment. The approvals or refusal or deferment is done in the prescribed form
PPA2. If planning permission is refused or the applicant is aggrieved by any
conditions imposed or the County Government refuses to make a decision within one
month, the applicant may appeal to the District/Municipal planning Liaison
Committee, the National Physical planning Liaison committee or the High Court. The
Physical planning liaison committees are quasi-judicial bodies that meet and
determine complaints lodged arising from planning decisions.
The second phase of development control process (inspection) kicks in after the
evaluation of development application is completed and approvals are issued. In this
phase building inspectors from the enforcement directorate periodically visit the
project sites to inspect and complete the development/building card to ensure that
developments are undertaken in compliance with the relevant standards and that the
developments are supervised by approved professionals. Upon completion of the
construction works and the development is ready for use, the enforcement department
issues a certificate of occupation to permit the use of the development.

21
2.2.6 Approaches of Development Control
According to AAK (2011), planning theory which provides a platform for
development control has evolved in three stages: Master Plan or Blue Print Era of
1950s to mid-1960s exemplified in early development plans coming after the 1947
Town and Country Planning Act of Britain; System theory view of planning from
1960s championed by the Planning Advisory Group (PAG) of 1965, and Planning as a
continuous participation in conflict resolution or collaborative/communicative view of
planning in late 1960s and early 1970s.
In the Master Plan or Blue Print Era (1950s), planning was concerned with production
of plans that gave detailed maps of a desired future end state to be achieved in certain
Figure 2-1: Conceptualized diagram of Development Application Evaluation in KenyaSource: Adapted from Opata, Mulongo, Omuterema & Ngetich (2013) with Modifications

22
number of years. This planning approach followed a model developed by
Abercrombie which had three stages of planning: Survey, Analyze and Plan (SAP).
The philosophy behind the master plans assumed that the planner, being a technocrat
had the skills and know-how to solve the spatial-related problems for the sake of
public interest and the developer had the obligation to follow as a servant what the
master plan had in command without the option of an alternative view. The
disadvantage of this model was the inflexibility of the plan due to its command nature
and lack of public participation in the plan formulation.
In 1960s, there was the System View of Planning and the Structure Plans which
concentrated on the objectives of the plan and the alternative ways of reaching such
objectives. The emphasis of this approach was that planning had to be accompanied
by reports showing the rationale of decision making at every stage of the planning
process by illustrating the possible consequences of alternative policies/strategies and
evaluating them against the objectives in order to choose a preferred course of action.
The planner was tasked with formulation of broad development goals and
identification of detailed objectives then tries to follow the consequences of possible
courses of action, evaluate the alternatives in relation to the objectives and the
resources available and takes action through public investment or controls on private
investment to implement the preferred alternative. There was constant monitoring to
assess the progress of the plan in achieving the set goals and objectives. Mcloughlin
(1969) argues this process assumes that ‘it proceeds in a straight line through a
sequence of processes, which are then constantly reiterated through a return loop’.
The disadvantage of this model was the assumption that the planner could determine
what was best for society and the high amount data requirements.
In 1970s, there was the approach of Planning as a continuous participation in conflict
resolution or collaborative/communicative view of planning. The emphasis was on
public participation in plan formulation. According to Burke (1979), participatory
planning approaches emphasize public participation and reduce the role of the planner
to that of a negotiator/advocate whose principal aim is to promote public interest.
There is stakeholders’ involvement in preparation of planning proposals as a way of
ensuring that they own and support the development control process. The
disadvantage of this approach is that small groups of people using positions of
influence or money can influence planning decisions to the disadvantage of society.

23
2.3 Implications of Development Control on Urban Development
Development control as a process is geared towards achieving goals and objectives
depicted in spatial plans and entails the government regulating land use and new
buildings (Ngetich, Opata and Mulongo, 2014). In addition, it also considered to
encourage optimal utilization of resources in order to achieve greatest improvement
and to promote separation of incompatible uses, as well as enhancing visually
pleasant landscape. The elements of public interest which development control seeks
to protect for achievement of sustainable urban development include health and
safety, convenience, efficiency and energy conservation, environmental quality, social
equity and social choice and amenity as (Faludi, 1973). Development control plays a
great role in the determination of urban spatial structures through the application of
laws and other instruments which provide development control regulations for
guiding and controlling development (Ngetich, Opata and Mulongo, 2014).
Since development control takes place at two levels (the macro and micro levels) as
noted by Onokerhoraye and Omuta (1985), it influences the urban structure at both
the macro and micro levels. At the macro level, its main objective is to control the
sub-division of land thus controlling the development of layouts or sub-divisions with
the aim of ensuring that as new areas are brought under urban use and influence, they
not only form an integral part of the present overall urban structure, but also fit into
the future structure. At the micro level, its main objective is to control the
development of the individual plot and structure within the sub-division. It is
normally applied in different contexts for different ends. Control over building
densities can be imposed with a view to decentralize activities to prevent a burden on
the available infrastructure in a particular area or alternatively to restrict low rise
development with the view of achieving maximum utilization of land where there is a
scarcity of land for development (Dissanayake, 1987).
2.4 Development Control and Satellite Towns Development
Satellite towns refer to small or media-sized settlements located around a large
metropolis. They are physically separated from the main urban area, but economically
they are an integral part of a large urban body (Golany, 1976; Weissbourd, 1972). The
distance between a satellite town and a major town should be close enough to justify both
a rapid commuting distance and the open space needed to separate the town settlements
and far enough to give a physical identity to the satellite town (Golany, 1976). In

24
addition, satellite towns should be totally economic dependent on the neighboring
urban center where the majority of satellite town residents find their jobs and should
have independent local governments to give them identity so that they are different
from normal urban suburb. Majority of satellite towns are basically dependent
residential settlements attaching to metropolises as people only live there with basic
service facilities and need to go to urban center for work and entertainment resulting
to the name “dormitory towns” (Mengyi, 2011).
The objectives of satellite town development are to decentralize population and
industries from the large cities. Fung (1981), noted several advantages of satellite
town development such as relocation of factories, schools and offices from the central
cities preventing overconcentration of population and economic activities in the
central cities. In addition, is facilitates better utilization of urban land use by using
farmland surrounding towns to replace open spaces that would have been planned in
the central cities. In some countries, the development of satellites towns is by default
rather than by design as they emerge and grow around cities and large towns due to
their proximity and availability of land while in others such as China, they are
planned for. In cases where development of satellites towns is planned, there is
normally provision of development control regulations to guide and control their
growth such as optimal size, distance from the central city, permitted industrial
activities and the physical infrastructure to be provided (Fung and Freeberne, 1981).
In cases where the emergence and growth of satellite towns is by default rather than
by design, zoning plans/ordinance are normally prepared to guide, control and
accomodate the growth and development of the towns. These zoning ordinances
specify the uses to which property may be legally put and the intensity of
development allowed. Just like in other towns, development control in satellite towns
facilitates orderly physical development, optimal land use and protection and
conservation of the environment.
2.5 Factors affecting Compliance with Development Control Regulations
Despite the existence of various development control tools such as development plans
(which provide the development control regulations), there are cases of total non-
compliance or partial compliance in some areas. Kimani and Musungu (2010)
highlighted lack of capacity to inspect and supervise developments and implement
plans, lack of relevant supportive system for effective enforcement and lack of

25
resources for local authorities as the main the factors hampering the effectiveness of
development control. In addition, UN Habitat (1990 a) and AAK, (2010) in their re-
assessment of urban planning and development regulations in African cities,
Ogundele, Odewumi and Aigbe (2011) on their paper on challenges and prospects of
physical development control and AAK (2015) in their policy paper on managing
building development, outlined the factors which contribute to non- compliance to
urban development control regulations;
2.5.1 Lack of Approved Physical Development Plans
AAK (2015) noted that most counties in Kenya lacked approved physical
development plans which leads to absence of standards for development control
despite the provision for County Spatial Plan, County Integrated Development Plans,
Town Plans and Sectoral Plans by the County Governments Act of 2012. The lack of
physical development plans being the main sources of planning standards and other
development regulations resulted to lack a framework for development control. In
cases where the development plans are in existence, there arises the challenge of the
plans being outdated due to lack of constant review. This makes the development
control process difficulty and ineffective since the provisions or regulations of the
development plans do not accommodate the changing development trends.
2.5.2 Laxity in Processing Development Applications
The time taken for evaluation of development application and subsequent approval
was deemed to be too long discouraging developers from submitting applications for
development permission and corruption of responsible officers to speed up the
process. The Draft Physical Planning Bill 2015 and the Urban Areas and Cities Act
2011 require that all developers must submit their development proposals to planning
authorities for approval. In some cases, the development applications processing has
been reported to take unnecessary long period of time (more than the thirty days as
provided by the Physical Planning Bill 2015) thus delaying developments in many
areas. Developers have had to go ahead with their developments with no regard for
submitted development proposals. This has resulted to non-compliance or partial
compliance of the set development control regulations due to lack of compliance to
the conditions which are normally provided when granting the development
permission.

26
2.5.3 High Professional Fees
The Physical Planning Act (Kenya, 1996) stipulates that any documents, plans and
particulars that are provided to the planning authority while applying for development
permission have been prepared by qualified, registered and validly registered
professions. This is done to ensure that development proposals are prepared by the
relevant professionals with adequate knowledge on the requirements of the law
concerning the development proposal. However, the professional fees charged by
various professionals like Planners, Architects, land Surveyors and Engineers have
been identified as a serious hindrance to development within the legal framework in
Kenya. To many developers, these professional fees have been unaffordable hence
discouraging developers in engaging these professionals in making development
proposals thus leaving room for the quacks to ruin the built environment (Opata,
Mulongo, Omuterema, Ngetich, 2013).
2.5.4 High Poverty Levels
The proportion of the population living in poverty has increased in most developing
countries to as much as 50% of the population in Kenya’s urban areas. With a large
proportion of urban population in poverty struggling to make a living, compliance to
urban development regulations is not among their key priorities. Lack of
comprehensive urban development policy that would guide regulations that are in line
with the needs of the people and the current social-economic realities such as urban
poverty has contributed to the high degree of non-compliance to urban development
and planning regulations (Ngetich, Opata and Mulongo, 2013).
2.5.5 Lack of awareness of the existence of Development Control Regulations
The extent to which people are aware of the existence of development control
regulations is important because it partly determines the extent to which people
comply with the standards/regulations. A large portion of people in the urban areas
are not aware of the development standards/regulations (UNCHS Habitat, 1999). This
results to non-compliance of the set development control regulations negatively
affecting the implementation of development plans and policies. The lack of
awareness to these planning regulations has been partial attributed to lacks of
guidelines in policy procedures such as current development plans, comprehensive
zoning plans and planning standards (AAK, 2011). A relatively high number of
developers get to know of the existence of the development control regulations during

27
the submission of the development proposals as majority of the members of the public
are “illiterate” on physical planning programmes (Ogundele, Odewumi and Aigbe,
2011). In view of this, urban developers have come to view the development control
process as a hindrance rather than a means to achieving sustainable developments.
2.5.6 Poor Enforcement Machinery
The technical capacities in most counties did not meet the required establishment
requirement in terms of experience, expertise and numbers with only Nairobi City
County having a fully functional City Planning Department with nine sections.
Approximately 82 percent of Counties in Kenya do not have adequate development
control staff, while 6 per cent had no technical staff and support from related agencies
(AAK, 2015). The planning officers in charge of development control have been
unable to implement development plans and inspect and supervise all developments
within their area of jurisdiction. This has been attributed to inadequacy of resources
and lack of relevant supportive system for effective enforcement as (Kimani and
Musungu, 2010).
2.5.7 Political Interference and lack of Political Will
Political interference in the urban development control systems has limited the local
Authorities ability to fully regulate and control development. Powerful government
officials have been known in the past to enforce approvals which do not meet the
stipulated requirements (Opata, Mulongo, Omuterema, Ngetich, 2013). This has
resulted to high rates of violation of the development control regulations which
negatively affects the implementation of development plans resulting to
uncoordinated development patterns, lack of neighbourhood character and inadequacy
in infrastructure provision. In addition, there is lack of political will and public
support for planning. Planning is viewed as unnecessary interference in private
property rights. Obudho (1992), notes that implementation of development plans
depends on very much on the good will of Local Authority. Where spatial planning
receives public support, development control takes place smoothly with effective
implementation of the development plans and policies unlike in areas without public
support.

28
2.5.8 Restrictive Planning Regulations
Explicit urban development and planning regulations have been adopted in
developing countries. The various Acts regulating urban development seem to be
outdated and not conforming to the countries current social, economic and political
circumstances (e.g. Physical Planning Act Cap 286). Planning regulations and
standards have been considered to be too static and inflexible such as the
developments control code, the building and zoning regulations (Ngetich, 2013).
Some of the issues that have been considered unrealistic include the space
requirements for various developments such as educational facilities especially in
urban areas where land/space is limited and spacing of specific developments such as
petrol service stations and provision of acceleration and deceleration lanes.
2.5.9 Effects of Market Forces
The aims and aspirations of developers (profit motivated) have greatly affected
development plans implementation. As developers seek to maximize returns from
land, they tend to violate some of the building and planning standards/regulations
such as plot coverage and plot ratio. Developers seek to attain as many units as
possible within their land as a way of maximizing profits from their land and
developments. The high demand for commercial spaces and housing units as evident
in the high rate of housing deficit in the country has motivated developers to adopt the
beacon to beacon type of developments (AAK, 2011).
2.5.10 Concluding Remark
Based on these previous study on factors affecting development control regulations
compliance, the above factors appear to be the main causes of development control
regulations non-compliance in urban areas of Kenya. However, due to the different
rate of urban growth and the uniqueness of urban centres in terms of topography,
demography, etc., each urban area is experiencing different set of challenges and the
contribution of these factors to the non-compliance of development control
regulations may not be uniform in all urban areas. There is a need to indicate the
extent to which each of these factors contributes to the non-compliance of
development control regulations and confirm whether the above mentioned factors are
the only main factors affecting development control instruments’ compliance.
29
2.6 Effects of Non-Compliance to Development Control Regulations
Non-compliance to development control regulations have negative effects on the
developers and the society at large. The effects of the non-compliance to the
developers include demolition of non-compliant developments and/or fine or jail
term. The negative effects of the non-compliance to the society include unhealthy
environment, lack of aesthetics, inadequacy of provisions for parking and children’s
playing grounds and loss of lives and property due to collapse of buildings (AAK,
2011).
2.6.1 Land Use Conflicts and Demolitions
The use of land for the purpose other than the one provided for by the development
plans/land use plans results to land use conflicts leading to demolitions.
Developments encroaching on private or public land are normally demolished to pave
way for the intended use. In Nairobi, the Syokimau demolition case was an epitome of
non-adherence to development control regulations. So many buildings were
demolished in various neighborhoods of Syokimau, Kyangombe and Manyatta areas
in 2011. The demolitions were necessitated by the fact that land in question was
within the jurisdictional area occupied by the Jomo Kenyatta International Airport and
thereby posing a security risk (Opata, Mulongo, Omuterema, Ngetich, 2013).
2.6.2 Fines and/or Jail Term
The Physical Planning Act Cap 286 (Under Review) and the Draft Physical Planning
Bill 2015 provide for the fine and jail term for violation of development/planning
regulations. Section 72(2) of the Physical Planning Bill constitute an offence liable to
fine not less than five percent and not exceeding ten percent the value of land on
which the development is taking place or to imprisonment for a term not exceeding
two years or to both’ while Section 30 (1) of the Physical Planning Act Cap 286
constitute an offence liable to fine not exceeding Kenya shillings hundred thousand or
an imprisonment not exceeding five years or both, but this punishment has never been
meted. As a result, most low income urban residents continue to encroach and squat in
unupgraded areas (Opata, Mulongo, Omuterema, Ngetich, 2014).
2.6.3 Unhealthy Environment
A study undertaken by Architectural Association of Kenya in the year 2011 on the
development control frameworks of 17 Municipalities and towns in Kenya indicated

30
that the leading effects of non- compliance are unhealthy living environment
(unsecure, poorly lit, ventilated and solid waste disposal) and lack of children’s
playground. This has been attributed to uncoordinated development pattern, beacon to
beacon type of development and inadequate provision spaces for public utility such as
dumpsites, drainage channels and sewer lines (AAK, 2011).
2.6.4 Lack of Aesthetics
Lack of aesthetics is evident in lack of neighbourhood character as defined by zoning
regulations (UN Habitat 1990 a), AAK, (2010). The uncoordinated development
pattern in areas with high rate of development control regulations non-compliance
results to undesirable area character. For an area to have a character there has to be
some form of uniformity in regards to building typology, plot coverage and building
height. Non-compliance of these development control regulations results to loss of
aesthetics due to lack of character. For instance, the emergence of highrise
developments within low density residential areas due to non-compliance in regards
to permitted use and building heights, results to loss of character in an area.
2.6.5 Inadequate Provision of Parking
AAK 2011, identified inadequacy of parking spaces as one of the effect of non-
compliance to development control regulations. As developers fail to comply with the
set plot coverage at plot level (due aims and aspiration of developers to maximize
returns from their land), parking spaces are normally not provided for. This has been
witnessed in residential as well as commercial areas/zones where the plot coverage
goes up to 100% in some cases with no provision of parking spaces at any of the
lower, ground or upper floors.
2.6.6 Inadequate Provision of Children’s Playing Ground
As market forces take centre stage in allocation of urban land uses, developers seek to
use land in ways that make maximum returns to them. Very few if not none are
interested in provision of children’s playing grounds and where they exists or are
provided for, developers look for ways to convert them to other more profitable uses
(AAK, 2011). This has been experienced in Nairobi where children’s playing ground
for Langata Primary School was grabbed by developers for construction of parking
space for an adjacent hotel.

31
2.6.7 Loss of Lives and Property
The lack of adherence to planning and building regulations in regards to permitted
building height (based on soil type), stipulated type/size of material and ratio of
mixture among others has resulted to collapse of buildings. This has resulted to loss of
lives and property. The urban scene in Kenya in the recent past has witnessed a series
of collapse of buildings for instance, in January 2006, 15 workers were killed in
downtown Nairobi’s Nyama Kima area when a two storey building under
construction collapsed. The tragedy was attributed to under designed concrete
columns and failure to allow appropriate curing (AAK, 2011). In June 2012, a
building collapsed in Mlolongo in the outskirts of Nairobi where one person was
confirmed dead (Daily Nation of 11th June, 2012). According to statistics released by
Board of Registered Architects and Quantity Surveyors and Architectural Association
of Kenya in July 2011, Kenya developers lost KSH. 1.4 Billion, as a result of
collapsed buildings since 2001.
These seven effects are considered as the main effects of non-compliance to
development control regulations in urban areas in accordance to the previous studies
related to the research topic. However, they ought to be ordered from the most
adverse to the least adverse in reference to the number of people affected so as to
provide the most effective remedy depending on the cause. In addition, there is need
to establish whether there may be other effects which are more adverse than the above
mentioned depending on the urban area.
2.7 Intervention Measures for Effective Spatial Development
The existing urban development control instruments and practices have not been
effective in guaranteeing sustainable living despite being in existence in Kenya from
as early as 1947 in the name of Town and County Planning Act. Ngetich (2013) noted
that there is a need for all stakeholders in the built environment to address the
challenge of development control regulations’ non-compliance as a way of ensuring
effective development control regulations compliance in guaranteeing sustainable
living. Several intervention measures to development control regulations’ non-
compliance have been adopted in other countries where the level of compliance and
sub sequential development plans implementation has been high. In order to have an
in-depth understanding of these intervention measures, it is necessary to undertake a
review of best practices in development control.
32
2.7.1 Review of Best Practices in Development Control
The review of the best practice case studies helps to develop the benchmarks of
development control systems (AAK, 2011). The review of the best practices of
development control such as Botswana and Singapore may/could enable a better
understanding of how the development control process in our country can be
improved for effective development plans and policies implementation. The
justification for the selection of Botswana and Singapore for the case studies is due to:
International recognition of Singapore for its good practice and procedures in public
land management (Yeung, 1987) and the well contained rapid urban growth of the
city of Gaborone in Botswana through careful management and development control
practices (Mosha, 1996).
2.7.1.1 A Case Study of Gaborone City-Botswana
Gaborone is one of fastest growing capital cities in Africa (Mosha, 1996). Mosha
(1996) notes that with careful planning and management, development of the city has
been sustainable in all respects. In the planning of Gaborone, the master/structure
plans, zoning, subdivision regulations, building codes, urban development standards
and other public policies are used to shape development. These regulations are all
adopted to help protect the urban natural environment, gear infrastructure investments
with development and enhance property values.
In order to ensure that there is no overlap and conflict of jurisdiction and decision
making in regards to development control, there has been good separation of roles and
responsibilities regarding land management. Physical planning is the responsibility of
the Ministry of Local Government, Lands and Housing through its department of
Town and Regional Planning. The Department of Town and Regional Planning is
responsible for preparation of physical development plans and setting detailed
guidelines for development control. The Ministry of Local Government, Lands and
Housing is the principal land manager being responsible for setting guidelines and
policies on the use of land. The Department of Survey and Mapping is responsible for
surveying. The Department of Lands is responsible for land allocation and land
administration. Local Authorities have delegated powers for controlling development
within the areas of their jurisdiction (Mosha, 1996).

33
As a way of ensuring strict adherence to planning standards in housing development,
a housing cooperation (Botswana Housing Cooperation) was established to build
houses both for sale and rental within the confines of the planning regulations. All
urban centres and major villages are declared planning areas and therefore all
developments including houses within the settlements require compliance with the
Town and Country Planning Act of 1977 (DCDM Botswana, 2006).
Local Authorities in Botswana are responsible for development control in all the
country’s planning areas and carry out such a responsibility through building
inspectors who make sure that all developments carried out are consistent with the
development control code and the Town and Country Planning Act (Segopa, 2009). In
addition, a Self Help Housing Program was introduced in the 1970s to provide site
and service plots where people erect their houses at their own pace using less rigorous
standards to ease affordability. Recent policy changes have made the government the
facilitator of housing rather than the provider. Private sector, financial institutions and
individuals are called upon to service land and construct houses in urban areas. The
policy of social mix in Botswana requires that urban areas be planned in a way to
avoid polarization of people in terms of social classes or income groups. This would
avoid the development of low income ghettos which are non-compliant to the set
development control regulations.
2.7.1.2 A Case Study of Singapore
In Singapore, land use planning is taken seriously and plans are implemented with
high levels of compliance with development control and planning regulations (Yuen,
2007). To ensure that plans remain relevant, workable and well integrated with the
environment and infrastructure, the planning authority in Singapore (the Urban
Redevelopment Authority) has been involving all relevant public development
agencies when preparing and reviewing the development plans. Its Development
Control Division holds frequent dialogues with professional bodies and private sector
to review development rules and guidelines to facilitate the work of the development
industry. In addition, as a way of dealing with rigid land use zoning proposals ((of the
1958 Master Plan), there has been establishment of a more responsive instrument
(Singapore Concept Plan of 1971) to facilitate long-term planning. It overcame the
restrictions of the Master Plan by remaining an expression of principles and policies,
not detailed proposals and land use maps. It is an evolving document in order to effect

34
the strategic shifts necessary to meet growing needs, changing circumstances and
available opportunities as they arise.
As a way of ensuring adequate public awareness on the set development control
regulations and other development regulations, government agencies in Singapore
hold public consultations through media focus group discussion, public dialogues,
forums, exhibition and competitions. The community works with planners in the plan
making process with the key goal being consensus building to create and foster a
greater sense of community. Through these consultations, Singapore has developed a
new zoning system which moves away from the traditional prescriptive land use
zoning system to an impact based zoning scheme. The new zoning system gives
businesses greater flexibility of having a mixed use and creating work- life- play-learn
environment within the same site to suit their need and market demand.
The planning authorities in Singapore also introduced electronic consultation with the
public/population. This was achieved through establishment of an e-consultation
portal to engage the population on specific draft guidelines and policies before they
are finalized. Development potential of each site is set out in the development guide
plans and this gives the private and public sector developers a clear idea of what they
can or cannot build on their land parcels. This also provides certainty and
transparency in the planning system and makes development control objectives
predictable and accountable.
Figure 2-2: The New zoning system in SingaporeSource: Urban Redevelopment Authority Annual Report 2000/01

35
Other than the public consultation, there is also Public Private Partnership in plan
implementation in Singapore. Plans are sent to private sector professionals and
developers to prepare in the move to give the private sector and the general public
more participation in the process of planning. This has promoted and facilitated
growth in supporting businesses and engaging people in planning. The introduction of
a Computerized Planning Application has improved on the timelines of granting
planning decisions and saves applicant time, manpower and resources. It enables
online consultations, checks status online and can be made at any time and place
provided there is internet.
In order to ensure strict adherence to development control regulations, the
enforcement of development control is enforced through criminal offence. An
enforcement notice is in writing and may be served to any person who has interest on
land in question. The notice states the breach of planning control, measures and time
to be taken to remedy the situation. The fine for offenders is high at S$10,000 every
day for a continuing offence compared to other countries like Kenya where it is only
Kshs 5,000 for a continuing offence (Physical Planning Bill 2014). With the strict
enforcement of these fines, high levels of development control instruments’
compliance are achieved.
2.7.2 Lessons learnt from Best Practices in Development Control
The above two case studies of best practices of development control (in Singapore
and Gaborone City-Botswana) has provided intervention measures which can be
adopted by other countries such as Kenya to ensure sustainable urban development
through effective urban development management. They can be summarized as
below:
a. Adequate public participation in development control through various means
b. Creation of public private partnerships in development control
c. Strict enforcement of development control regulations
d. Provision of serviced plots for development
e. Simplification of development application processing
f. Flexibility and impact oriented zoning systems
g. Adequate staff provision for development control
h. Effective separation of roles and responsibilities regarding land management

36
It is also important to note that despite the efficiency of these measures, there are also
challenges that come with their adoption such as too much flexibility of the
development control regulations which can create problems of achieving the desired
area character. In addition, it has not been clearly determined whether these
intervention measures can bear the same fruits in other countries which have unique
development challenges or they were just toiler-made for those countries where they
originate to address their own development challenges.
2.8 Development Control related Legal, Policy and Institutional Framework
This section is for analyzing Policies and Acts of Parliament touching on physical
planning and development in Kenya by looking at their relevance to development
control regulations adherence.
2.8.1 Legal Framework
In Kenya, development is governed by various legislations which mainly include the
Constitution of Kenya 2010, Physical Planning Act Bill 2014, County Government
Act 2012, Urban Areas and Cities Act 2011, National Land Commission Act 2012,
Public Health Act Cap 242 and the Environmental Management and Coordination Act
(EMCA) of 1999. These laws cover possession, registration and land planning and
development.
a. The Constitution of Kenya (2010)
Constitution of Kenya provides that land in Kenya shall be held, used and managed in
a manner that is equitable, efficient, productive and sustainable. In this regard, land
within the study area ought to be used and managed equitably, efficiently,
productively and sustainable by conservation of the environment and optimal use of
land and land resources.
b. Physical Planning Act, 1996
This Act provides for the purposes of the Local Physical Development Plans to be for
the purposes of zoning, urban renewal or redevelopment, guiding and coordinating the
development of infrastructure, regulating land use and land development, providing a
framework for coordinating various sectoral agencies and giving effect to any
Integrated City or Urban Development Plan. The Local Physical Plan for Kitengela
town will be used for the above purposes.

37
c. The Environmental Management and Co-ordination Act, 1999
The EMCA is an Act of Parliament that provides for the establishment of an
appropriate legal and institutional framework for the management of the environment.
It provides for establishment of NEMA a body charged with the responsibility of
ensuring a clean and healthy environment. The act provides various standards and
regulations in regards to different developments or land uses with a provision for
environmental impact assessment for selected developments. Its emphasis is on clean
and healthy environment for all people in Kenya.
d. Public Health Act Cap 242
The act makes provision for securing and maintaining health. Under section 166 it is
stipulated that the local authority should maintain hygiene and prevent nuisance. It
stress on prevention of pollution with strong emphasis on water by any waste and
provision of housing support services and infrastructures which should be kept clean.
Section 126(d), the act provides for the formulation of by-laws by all municipal,
urban and area councils regarding building materials, building space, lighting,
ventilation, height of buildings and height of chimneys. This facilitates development
control since it provides for the establishment of standards to guide and control
development.
e. Water Act, 2002
This Act of Parliament provides for the management, conservation, use and control of
water resources and for the acquisition and regulation of rights to use water; to
provide for the regulation and management of water supply and sewerage services. In
reference to the act, developers within Kitengela Town ought to compliance to the act
in regards to effluent discharge and water usage in all phases of the development
projects’ cycles and provision of permits from WARMA in cases where boreholes are
considered as sources of water supply within the area.
f. National Land Commission Act, 2012
This Act gives effect to the objects and principles of devolved government in land
management and administration. Of relevance, is provision for the management and
administration of land in accordance with the principles of land policy set out in
Article 60 of the Constitution and the national land policy and also for the linkage

38
between the Commission (NLC), County governments and other institutions dealing
with land and land related resources.
g. Urban Areas and Cities Act, 2011
The objectives and purposes of this Act are to establish a legislative framework for
classification of areas as urban areas or cities, governance and management of urban
areas and cities and participation by the residents in the governance of urban areas and
cities. The act provides for the formulation of integrated development plans for towns
and cities which bind, guide and inform all planning development and decisions and
ensure comprehensive inclusion of all functions. The city or urban area integrated
development plans ought to be aligned to the development plans and strategies of the
county governments.
h. County Government Act No.17 of 2012
In Section 111 of the act, each city and municipality should have city or municipal
land use plans and city or municipal building and zoning plans which will be the
instruments for development facilitation and development control within the
respective city or municipality. In reference to the act, the County Government of
Kajiado have the statutory mandate to undertake development planning and control
land and building development within their area of jurisdiction including Kitengela
town, the study area.
2.8.2 Policy Framework
The main policies that have shaped development control in Kenya are Sessional paper
No.6 of 1999 on Environment and Development, Agenda 21: Rio Declaration for
Environment and Development (1992), Draft National Urban Development Policy,
Environment and Natural resource policy, National Housing Policy and Draft
National Land Policy (2006).
a. Agenda 21: Rio Declaration for Environment and Development, 1992
This is a programme of action for sustainable development worldwide. In the
conference, elaboration of strategies and measures to halt and reverse the effects of
environmental degradation in contexts of national and international efforts to promote
sustainable and environmental sound development in all countries was done. This was
to be achieved through environmentally sound management of waste. The programme
recognizes provision of infrastructure services and facilities as the main issue of

39
addressing sustainable development which will be achieved through better and
coordinated/planned development especially in the urban areas such as the Kitengela
town.
b. Sustainable Development Goals (SDGs)
The SDGs officially known as Transforming our World: the 2030 Agenda for
Sustainable Development are intergovernmental set of aspiration goals (which are 17
in number) and are regarded as the successor of the MDGs. The goals covers a broad
range of sustainable development issues such as ending poverty and hunger,
improving health and education, making cities more sustainable, combating climate
change and protecting oceans and forests. Of relevance is Goal number 11 (Making
Cities and Human Settlements inclusive, safe, resilient and sustainable) which
recognizes the importance of provision of inclusive and accessible green and public
spaces, affordable housing and basic services which can only be effectively achieved
through effective development control. To this effect, Kitengela Town can only be
made inclusive, safe, resilient and sustainable through development control.
c. Sessional paper No.6 of 1999 on Environment and Development
This Sessional paper sets out comprehensive policy guidelines towards achieving
sustainable development and in response to the increasing concerns regarding the
effects of development on the environment. The paper recognizes the need for the
provision of infrastructures and coordinated development and land uses. Kitengela
town just like any other urban area in Kenya ought to be adequately provided with
infrastructure and provided with a land use plan to guide and control development in
the area.
d. National Urban Development Policy, 2015
This is the basic policy of urban development in Kenya and provides a framework for
sustainable urban development. The specific objectives this policy seeks to realize
are: mainstream good governance; foster safe, secure and livable urban areas, ensure
adequate housing for all urban income groups; facilitate accessibility to the full range
of social services that improve the health, education, skills development and
recreational needs of citizens in urban areas; promote integrated environmental
planning and management and foster timely and adequate delivery/management of
land for urban development.
40
e. National Environment Policy, 2013
The goal of this policy is better quality of life for present and future generations
through sustainable management and use of the environment and natural resources.
The policy is for guiding the management of natural resources such as land, water,
soil, forest and animals, how it affects the quality of life for both present and future
generations. The relevance of this policy is the rights of the local residents of
Kitengela to access clean and healthy environment, protect, stop or discontinue any
act or omission that is harmful to environment.
f. National Housing Policy
The new National Housing Policy for Kenya, was passed in parliament on 30th June,
2004 addresses issues such as the right to housing (facilitating progressive realization
of the right to adequate housing by all), provision of legal security of tenure to the
poorer sections of society, and participation of the inhabitants in the housing and slum
upgrading process. One of the key goals of the policy is to facilitate the provision of
adequate shelter and a healthy living environment at an affordable cost to all socio-
economic groups in the country so as to foster sustainable human settlements.
Kitengela residents should be provided with housing units that are habitable with
housing support services such as sewer system, drainage system and solid waste
disposal services.
g. National Land Policy, 2009
The overall objective of the National Land Policy is to secure rights over land and
provide for sustainable growth, investment and the reduction of poverty in line with
the government’s overall development objectives. The relevance of this policy is the
economically viable, socially equitable and environmentally sustainable allocation
and use of land within Kitengela Town. In addition, land and land-based resources
within the town ought to be effective and efficient.
i. Kitengela Zoning Plan (2012)
Kitengela Zoning Plan is a Local Physical Development Plan for Kitengela Town
with an objective of providing a guide to help in development control so as to ensure
harmony in location of the different land uses. The plan was prepared under the
provisions of the Physical Planning Act Cap 286 (under review) and the Local
Government Act Cap 265 (now repealed). The preparation of the zoning plan has

41
been triggered by the rapid rate of urban development in Kitengela town which is
foreseen as a menace to the welfare of the local population, natural environment and
the performance of the sub-region’s economy. The zoning plan is geared towards
realization of self-sustaining and controlled future spatial developments. It indicates
the seventeen (17) zones indicating land uses for each zone, preferred minimum plot
sizes, types of developments, plot settings and permissible as well as prohibited
developments.
2.8.3 Institutional Framework
The institutional framework for development control in Kenya rest in most cases at
the national government level, county government level and a wide array of
professionals working in the private sector who initiate application for development
permission processes on behalf of their clients/developers (AAK, 2015). However,
other institutions such as CBOs and law enforcement agents also play significant roles
in development control.
a. National Government
Under the national government the institutions concerned with development control
include the Ministry of Lands, Housing and Urban Development, NLC and the
NEMA. Under the Ministry of Lands, Housing and Urban Development, there is the
National Physical Planning Council which among other functions ensure the
mobilization of adequate resources for the preparation and implementation of physical
development plans, policies and strategies and the Director-General of Physical
Planning who among other functions overseeing the proper execution of development
control at the national and regional level. The relevance of the National Land
Commission in Development Control is the management of public land on behalf of
the national and county governments through Committees and County offices
provided for by the National Land Commission Act (2012). In this regard, they
determine the alienation and of public land. NEMA is tasked with the establishment
and review of land use guidelines in consultation with the relevant lead agencies as
well as evaluation of selected development application depending on their impact on
the environment (EMCA, 1999).

42
b. County Government
In accordance to the County Government Act 2012, the county governments are
responsible for spatial planning within the counties. There are various agents
responsible for development control within the county government structure which
include; County executives, County Government’s Technical committee, County
Physical Planning Departments, County Assemblies, Land Officers, Land Surveyors
and Public Health Officer. The role of County Executive in urban areas or city
planning is monitoring of the process of planning, formulation and adoption of the
integrated development plan by a city or municipality within the county while the
County Assemblies are responsible for approval of county development planning
submitted by county executive.
The County Physical Planning Department which include County and City/Municipal
Directors of Physical Planning, Planners, Architects, Draughtsmen, Building
inspectors and Enforcement section are responsible for preparation of county and
local physical development plans, processing of development applications and
inspection of construction works. County Government’s Technical committee chaired
by the Sub-County Administrator is concerned with evaluation of development
applications. Land Officers and Land Surveyors are mainly concerned with evaluation
of development applications in respect to land ownership and location and plot/land
sizes while the Public Health officer evaluates the development application in respect
to protection of health and well-being of the general public.
c. Professionals
In the development/construction industry, there is a wide array of professionals
working in the private sector who initiate application for development permission
processes and implementation of development projects on behalf of the developers.
They include Planners, Architects, Engineers, Contractors, Land Surveyors and
Environmental Experts. The Planners (Registered and licensed in accordance to the
Physical Planners’ Registration Act of 1996) are concerned with the preparation and
submission of physical planning briefs and/or Land Amalgamation and Subdivision
Schemes on behalf of the developers. Registered and licensed Architects and
Structural Engineers prepare architectural and structural drawings respectively for
developments and submits the same for evaluation. NEMA licensed lead experts
undertakes Environmental Impact Assessment for proposed developments on behalf

43
of the developers and submit the EIA reports to NEMA offices for evaluation and sub
sequential approval (NEMA License). The Contractors are concerned with the
implementation of the development projects for and on behalf of the developers in
accordance to the approved planning briefs and architectural and structural drawings
while the Land Surveyors implement land amalgamation and/or subdivision in
accordance to the approved land amalgamation and/or subdivision schemes.
d. Community Based Organizations
Community based organizations such as neighbourhood/residents associations are
actively involved in development control. In the spirit of public participation as
envisaged in the Kenyan Constitution (2010), the public, through
neighbourhood/residents associations are involved in urban planning process. Article
1 (4), Article 6 (2), Article 174 (c and d), Article 184 (1), Article 196 (1), Article 232
(1) d, e, f, Fourth Schedule Part 2 (14), gives citizens the right to manage their own
affairs and further their development and the right of participation in the exercise of
powers of the state and in making decisions that affect them. Section 22 and the
second schedule of the Urban Areas Act (2011), give residents the right to contribute
to the decision-making processes of the city or urban area by written or oral
submissions to the city or municipal manager or town administrator and to receive
prompt responses to their written or oral communications. In this regard,
neighbourhood/residents associations participate in formulation of development
control regulations for their area of residence as well as play a significant role in their
enforcement.
e. Law Enforcement Agents and the Judicial System
With enforcement of development control being through criminal offence, the police
support enforcement of development control through two main ways. First, through
provision of security to development control officials in cases of demolitions of
development control regulations non-compliant developments and serving of
enforcement notices and secondly, through enforcement of development control
related laws through arrest and charging of violators of development control
regulations.
The role of judicial system (the courts) in development control is provision of a forum
for resolving development related disputes and enforcement of physical development

44
related laws in a fair and rational manner. They hear and determine development
related cases and give their verdict on the same.
2.9 Conceptual Framework
A conceptual framework is a set of broad ideas and principles taken from relevant
fields of enquiry and used to structure a subsequent presentation (Reichel and Ramey,
1987). When clearly articulated, a conceptual framework has potential usefulness as a
tool to assist a researcher to make meaning of subsequent findings (Kyaka, 2012).
For the purpose of this study, the conceptual framework will be used as analytical tool for
organizing ideas to achieve the research objectives. Its purpose is provision of an abstract
representation of the analysis of development control regulations compliance in Kitengela
Town as well as provide a direction of collection and analysis of data. In this regard, it
provides the organizing principle for analyzing development control regulations
compliance as outlined in the figure below.

45
Figure 2-3: Conceptual FrameworkSource: Author’s Construct, 2016

46
It is a requirement by law that all developments needs to be subjected to development
control process by first ensuring that the development proposals are submitted to the
relevant planning authorities for evaluation before implementation. With controlling
being part and parcel of an integrated planning of urban centres, development control
intervenes in the process of land development, construction, occupancy and use to
enable and constrain transactions in accordance with prescribed rules and regulations.
This ensures strict compliance to the development control regulations to facilitate the
implementation of development plans. The evaluation of the development proposal
enable assessment of the degree to which the development proposals adhere to the set
development control regulations (such as the permitted minimum plot sizes, building
line, setbacks and access road width, permitted maximum plot coverage and plot
ratio) for advice on modification of the proposals before the issuance of development
permission. Secondly, the implementation of the developments ought to be constantly
inspected to make sure that the implementation is in accordance to the development
approval provided for the developments.
Based on the evaluation of development application and monitoring of development
implementation through regular inspection, it is possible to identify the development
control regulations compliant developments and the non-compliant developments.
There are several factors affecting development control regulations compliance such
as the timeline for development application evaluation, the level of public support for
development control, the level of public awareness on development control process,
the cost of preparing and submitting development proposals for evaluation and the
availability of a physical development plan for guiding and controlling development
in the area.
However, based on lessons learnt from best practices in development control (such as
Singapore and Botswana), the problem of non-compliance to development control
regulations can be addressed through adoption of some or all of
approaches/techniques used to ensure effective development control regulations
compliance in these countries or formulation of home-made solutions for the local
problems depending on the problem being addressed. Some of these approaches
include adequate resource provision for development control, impact oriented zoning
system, simplification of development application processing, strict enforcement of
development control and adequate public participation in development control.

47
2.10 Conclusion
Development control as a means of ensuring orderly physical development, optimal
land use and protection and conservation of the environment, should be inclusive of
all stakeholders in the built environment. Each person has a part to play in the
development control process since its non-compliance affect us all either directly or
indirectly. Kenya as a country ought to borrow a leaf from nations which are
internationally recognition of for their good practice and procedures in public land
management and development control practices such as Singapore and Botswana.
This would to a great extent address the challenges associated with development
control regulations’ non-compliance such as traffic congestion and inadequate
provision of infrastructure facilities hence facilitating the achievement of the
development control objectives.

48
CHAPTER THREE: RESEARCH METHODOLOGY
3.1 Introduction
This chapter presents the methods and techniques that the researcher will employ in
the study. In particular, the chapter will describe the research design, research
population, sampling plan, data need matrix, data collection methods, data analysis
plan and data presentation plan.
3.2 Research Design
Orodho (2003) defines a research design as the scheme, outline or plan that is used to
generate answers to research questions. Research design provides an operational
frame within which the facts are placed, processed through analyzing procedures and
the valuable research output is produced. The study adopted a descriptive survey
research design (non-experimental research design). This research design allows the
researcher to observe or measure statistics to assess the relationship between or
among variables without manipulation of the independent variables
3.3 Research Population
According to Ngechu (2004), a population is a well-defined or set of people, services,
elements, events, group of things or households that are being investigated. The
population under study for identification and documentation of the current and
previous development control tools used to guide and control physical development in
Kitengela Town included all the National and County Government officials concerned
with development control while that for investigation of development control
regulations compliance level included all the developments within Kia Ngombe ‘B’
zone. The population under study for assessment of the factors affecting development
control regulations compliance and effects of the compliance level included all the
developers of the developments within Kia Ngombe ‘B’ zone and their respective
occupants while that for determination of possible intervention measures for the
effective development control regulations compliance of Kitengela Town included the
National and County Government development control officials and the developers
and residents of Kia Ngombe ‘B’ zone.
The targeted population for this study included all persons over the age of 18 years
(adults) residing in Kia Ngombe ‘B’ Zone in Kitengela Town, all the developments
and their respective developers (or their representatives) within that zone and all

49
National and County Government development control officials within the county.
This is justified by the fact that the way developments take place within the zone
affects the area residents either directly or indirectly and therefore they are in a good
position to describe the effects of the development control regulations compliance
level (of the developments within their area of residence/business/work) to the urban
spatial structure. The owners of developments within this zone (whether living there
or not) are targeted since they are responsible for the way their developments take
place in regard to development control regulations compliance hence will provide
valuable information in regards to the factors affecting development control
regulations compliance, the resultant effects and possible intervention measures. In
addition, the developments within the zone are targeted since they will facilitate the
investigation of planning standards and building regulations compliance level in
regards to compliance to the permitted uses, plot settings, permitted structure types,
permitted development with conditions and prohibited developments. The National
and County Government development control officials within the county are also
targeted due to their in depth understanding of the area’s development control
regulations as well as the previous and current development control tools used to
guide and control development in Kitengela Town and the entire county in general.
3.4 Sampling Plan
For the purpose of saving time and cost (due to restrictions of resources) as well as in
order to obtain unbiased estimates of the population status, sampling will be
undertaken. This entailed the selection of a sub-group of the population (rather than
all possible cases or elements) for the purposes of undertaking the study. At the time
of conducting research, it was impossible, impractical or too expensive to collect data
from all the potential units of analysis included in the research problem. A smaller
number of units (a sample) was chosen in order to represent the relevant attributes of
the whole set of units, the population. The sample was drawn from the Developers,
Developments and Households of Kia Ngombe ‘B’ zone as well as the Development
Control Officials within Kajiado County (sampling units).
The study had four sampling groups: Developments, Developers, Households and
Development Control Officials. The sampling plan for each of the sampling group is
as follows;
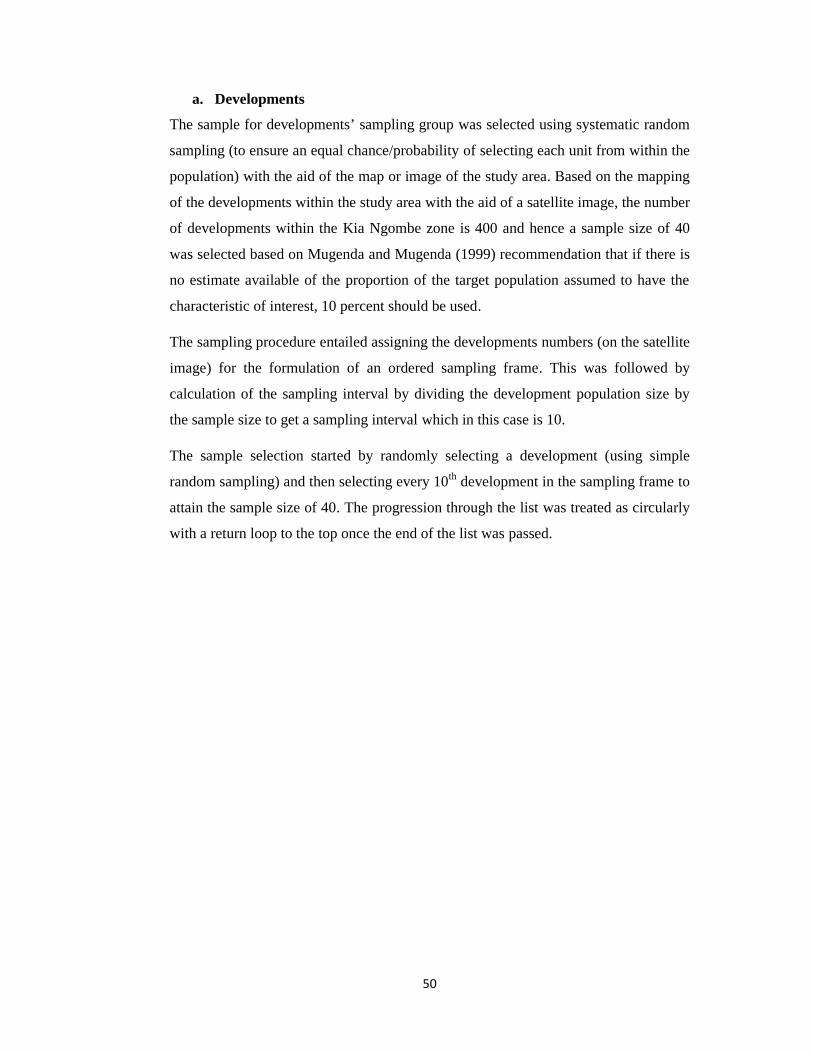
50
a. Developments
The sample for developments’ sampling group was selected using systematic random
sampling (to ensure an equal chance/probability of selecting each unit from within the
population) with the aid of the map or image of the study area. Based on the mapping
of the developments within the study area with the aid of a satellite image, the number
of developments within the Kia Ngombe zone is 400 and hence a sample size of 40
was selected based on Mugenda and Mugenda (1999) recommendation that if there is
no estimate available of the proportion of the target population assumed to have the
characteristic of interest, 10 percent should be used.
The sampling procedure entailed assigning the developments numbers (on the satellite
image) for the formulation of an ordered sampling frame. This was followed by
calculation of the sampling interval by dividing the development population size by
the sample size to get a sampling interval which in this case is 10.
The sample selection started by randomly selecting a development (using simple
random sampling) and then selecting every 10th development in the sampling frame to
attain the sample size of 40. The progression through the list was treated as circularly
with a return loop to the top once the end of the list was passed.

51
Map 3-1: Spatial Distribution of Sampled Developments
Source: Adopted form Google Maps with Modifications, 2016
b. Developers
The sample for developers’ sampling group was selected using purposive sampling
with an intent to select the 40 developers (or their representatives) of the selected 40
developments even though only 24 developers were accessible for administration of
the developers’ questionnaires. For each development selected, the developer (owner)
was included in the sample. This was for enhancing consistency in ensuring that the
information on development matches with the information from the people who have
implemented the developments (the developers). This facilitated selection of the
people (developers) with the required information concerning the selected
developments such as explanations to the level of development control regulations
compliance of their developments, factors affecting development control regulations
compliance, the resultant effects and possible intervention measures.

52
c. Households
The sample for households’ sampling group was selected using multistage sampling.
Purposive sampling was used to select the developments from which the households’
samples were to be drawn while simple random sampling was used to select one
household within each of the selected developments. The justification for the
purposive sampling of developments from where to draw the households’ sample is
ensuring that information on the effects of the development control regulations
compliance level of the selected developments on the residents is well captured and
there is triangulation of information from developers, developments and households.
Within each selected development on the image, one household was selected through
simple random sampling (to ensure that each household within the development has
an equal chance of being included in the sample) to attain a sample size of 40.
d. Development Control Officials
The sample for the Development Control Officials’ sampling group was selected
using purposive sampling to select National and County Government official who are
concerned with development control within the study area. They include the Kajiado
County Physical Planner, Director of NEMA Kajiado County, Public Health Officer-
Kajiado East Sub County (Kitengela) and Public Works Officer/County Engineer to
attain a sample size of 4.
3.5 Data Need Matrix
The data required for the purpose of the study is based on the five research objectives
and is summarized below;
Table 3-1: Data Need Matrix
Objective Data and Information Sources
1. To identify and
document the previous
and current development
control tools used to
guide and control
physical development in
Kitengela Town
o Development control tools
used for the town before the
preparation of the Kitengela
Zoning Plan in 2012
o Development control tools
used for the town from 2012
to present
o Kajiado
County,
Planning,
Engineering,
Public Health
and NEMA
offices

53
Source: Author, 2016
2. To investigate the
development control
regulations compliance
levels in in Kitengela
Town
o Plot settings-plot sizes,
access roads width, plot
coverages, plot ratio,
building line and setbacks
lengths and parking space
provisions
o Structure types
o Existing uses
o Existing development types
o width and length of access
roads
o Policy
Documents
o Physical
Development
Plans
o Field Survey
3. To assess the factors
affecting development
control regulations
compliance in the
Kitengela Town
o Timelines for development
applications processing
o Development control process
o Development control
enforcement
o Statutory and professional
fees
o Development control
awareness level
o Field Survey
4. To establish the effects
of the development
control regulations
compliance level to the
urban spatial structure.
o Social, economic and
environmental effects of the
development control
regulations compliance level
to the urban spatial structure
of the study area
o Field Survey
5. To propose possible
intervention measures
for the effective
development control
regulations compliance
in the Kitengela Town
o Ways of enhancing
development control
regulations compliance in the
study area
o Field Survey
o Policy Papers
o Previous
Studies on
Development
Control

54
3.6 Data Collection Methods
There are several methods of data collection; interviewing, instrument administration,
observation and examination of documents, materials and artifacts. An inventory of
the study area’s characteristics in regards to development control regulations
compliance was obtained by carrying out a survey of the study area through the above
four data collection methods.
Data collection through examination of documents and materials entailed the
collection of data which already exists or data which is difficult to obtain from the
field such as development control tools for Kitengela town and the possible
intervention measures for effective development control based on best practices. It
entailed the examination of documents containing information related to development
regulations, factors affecting development control regulations compliance, effects of
non-compliance to development control regulations and planning intervention
measures for effective development control for both published and unpublished
literature. Some sources of this type of data (secondary data) included Local Physical
Development Plans, Acts of Parliament, Sectoral policies, Central Bureau of Statistic
records, Physical Planning Handbook, AAK policy papers, and maps from Survey of
Kenya.
Interviewing, instrument administration and observation entailed the collection or
gathering of first hand data (primary data) from the field (study area) concerning
development control regulations compliance, factors affecting development control
regulations compliance, effects development control regulations compliance and
possible intervention measures. The instruments used in collection of primary data
include questionnaires and checklists. The study utilised household questionnaires and
developers questionnaires to collect information regarding the awareness of the
existence of development control regulations, factors affecting development control
regulations compliance, effects of the development control regulations compliance
level to the urban spatial structure and the possible intervention measures effective
development control. (See Appendix 1 for Household Questionnaire and Appendix 2
for Developers’ Questionnaires). A checklist was used to collect information
regarding development control regulations compliance such as building lines, plot
coverage, setbacks and roads width. (See Appendix 3 for Checklist).

55
Observation method was used to capture the visual characteristics of the study area
which was recorded on observation forms and maps. The observation of the study
area incorporated physical observation for documentation of the existing situation and
mapping of the physical elements in the study area such as buildings/developments,
open spaces, transport networks etc. Some of the data collected through physical
observation include building heights, structure types, type of land use etc.
Interviews were conducted with the key informants (Kajiado County Physical
Planner, Director of NEMA Kajiado County, Public Health Officer-Kajiado East Sub
County (Kitengela) and Public Works Officer/County Engineer) due to their advanced
knowledge on issues related to development control. (See Appendix 4 for Key
Informants Interview Schedules).
3.7 Data Analysis Plan
The collected data was analyzed using content analysis (for qualitative data) and
descriptive analysis (for quantitative data) such as frequency distribution and basic
computation using computer programs such as SPSS and Excel. The data analysis was
done to bring out the sense in the data; to make it useful information as noted by
Mugenda and Mugenda (2012). The units of analysis for this study were individuals
and developments.
Content analysis was used to analyse qualitative data collected through interviews
with development control officials, observation and documentary analysis
(examination of documents) while descriptive analysis was used to analyse
quantitative data collected through administration of research instruments. Aspects
analyzed using content analysis include the development control tools for Kitengela
Town and Kajiado County in general, main factors affecting development control
regulations compliance and proposals on effective development control regulations
compliance. Development control tools for each of the development control agencies
and the factors hindering development control regulations’ compliance were
identified as well as the suggestions/proposals of the development control officials on
possible intervention measures for effective development control regulations’
compliance.

56
The qualitative data was interpreted to establish patterns, trends and relationships of
variables such as the main factors influencing development control regulations
compliance and possible intervention measures for effective development control
regulations compliance
Statistical Package of Social Science tool (SPSS) and Excel were used to analyze
quantitative data obtained through administration of research instruments
(questionnaires and checklist). The aspects analyzed using SPSS include background
information of respondents, developments details, factors affecting development
control regulations compliance and their respective effects and proposals on effective
development control regulations compliance.
Correlation (Pearson correlation coefficient) was used to test the null hypothesis. The
correlation test was used due to the ratio level of measurement of the data collected
and the perceived linear relationship between building line size and plot coverage
percentage. It enabled a decision to be made on whether or not a significant
relationship existed between building line size and plot coverage percentage
The analyzed data was interpreted to facilitate measuring of relationships and sub-
sequential drawing of conclusions and recommendations for informed decision
making as well as to achieve the study’s objectives. The quantitative data was
interpreted to establish condition, distribution, location and adequacy of physical
entities such as developments, roads etc.
3.8 Data Presentation Plan
The presentation of the data (after analysis) depends on the type of the data;
qualitative or quantitative. Qualitative data is presented by use of descriptive
narratives and photography. Information presented using descriptive narratives
include detailed description of phenomena such as development application
processing process and detailed intervention measures for effective development
control regulations compliance. Information presented using photography entail the
visual characteristics of phenomena such as building conditions, congestion and road
conditions.

57
The quantitative data is presented using charts (such as bar graphs and pie charts),
frequency tables and maps. Bar charts and pie charts is used to present discrete data
such as land use mix of the study area. Frequency tables is used to present
summarized categorical or numerical data such as building lines and setbacks, road
widths etc. while maps is used to present spatial information such as location and
distribution of developments and infrastructure such as roads.

58
CHAPTER FOUR: STUDY AREA
4.1 Introduction
This chapter is concerned with the general characteristics of the study area defining its
geographical location, demographic characteristics, socio-economic characteristics,
social infrastructure, physical infrastructure, natural physical and geological features
and climatic characteristics.
4.2 Geographical Location
Kitengela Town is located 30 kilometers south of Nairobi City (CBD) within Kajiado
East Sub-County, Kajiado County. Kajiado County borders Nairobi City to the North
extending to the Kenya-Tanzania border to the South. It borders Taita Taveta County
to the Southeast, Machakos and Makueni Counties to the East, Kiambu County to the
North and Narok County to the West.
Kitengela as a location comprises an area of approximately 390 km2 (GOK, 2001)
within Kajiado County and is part of a larger rangeland ecosystem called the Athi-
Kaputiei Plains (a 2,456 km2 ecosystem). Kitengela town is part of the Nairobi
Metropolitan Area. The town borders Athi River town to the North East, Nairobi
National Park to the North, Ongata Rongai to the North West, Olturoto to the South
and South Keekonyokie to the west. The town is approximately 89.19 km2 in size.
Kitengela town has seventeen (17) land use zones which include: Kimmerland,
Selelo,Muigai, Upper Valley, New Valley, Commercial Zone, Shooting Range,
Korompoi, Downtown, Jua Kali, Parkview, Mohammed, Milimani, Sifa Farm, Kwa
Saitoti, Noonkopir and Kia Ngombe (Kitengela Zoning Plan, 2012). Kia Ngombe ‘B’
zone (the study area) is a high density residential zone. It borders Kia Ngombe ‘A’
zone to the North and East, Hill Top Commercial zone to the West and New Valley
‘A’ zone to the South. The zone is defined by Kitengela Hospital road, Hill Top, 3T
road, Deliverance Road and Sunrise of Africa Academy.

59
Map 4-1: Kitengela in National, Regional andLocal ContextSource: Author’s Construct

60
Map 4-2: Kia Ngombe ‘B’ Zone, Kitengela TownSource: Adopted from Kitengela Zoning Plan, 2012
KIA NGOMBE ‘B’ ZONE

61
4.3 Demographic Characteristics
The indigenous people of Kitengela town are the Maasai community who are mainly
pastoralists. However, there has been an increasing influx of people from other tribal
groups mainly from Nairobi and Athi River. Population growth and urbanization have
occurred in parallel with land tenure changes in Kitengela. The influx of people from
other areas has been due to the availability of land for investment and settlement. This
has transformed the area into a cosmopolitan region.
During the 1980’s and throughout the 1990’s, the towns of Athi River and Kitengela
grew rapidly, with industries and an export processing zone established in the area.
The 2009 population census counted 58,167 residents of Kitengela up from 17,347 in
1999 and 6,548 in 1989 (GOK, 2001). More than two-thirds of the population of
Kajiado County is concentrated in the Kitengela trading centre and other smaller
trading centres (Nkedianye, 2004). Given the population size of 58,167 and an area of
89.19km2, the population density for Kitengela as a location is approximately 652.17
people per square kilometer. According to the 2009 population census, the urban
population of Kitengela town is approximately 8,378.
Kajiado County where Kitengela towns falls is considered to be the wealthiest county
in Kenya with poverty level of 11.6% compared to the average poverty level of 45.9%
for the country.
4.4 Socio-Economic Characteristics
Kitengela falls on the outskirts of Nairobi City County. The area has undergone great
transformation from a group ranch in 1988 to an agricultural town in the 1990’s to a
robust town with plenty of urban features. Kitengela begun as the Kitengela group
ranch made up of 18,292 hectares and 214 registered members (all Maasai) which was
subdivided in 1988 in efforts by the Government to encourage private land ownership
in pastoral systems with the aim of intensifying and commercializing livestock
production (Kristjanson et al., 2002). After subdivision of the group ranch, land
fragmentation and sales have continued at a steady and escalating pace (Nkedianye,
2004).
Land fragmentation and land use conversion in Kitengela has been occasioned by in-
migration of population from Nairobi City. Scarcity of land within the city has
propelled relocation of residential developments to areas such as Kitengela, Ongata

62
Plate 4-1: Flower Farms within Kitengela TownSource: Author, 2016
Rongai, Ngong and Kiserian. Proximity to the city and ample landscape make
Kitengela area and its environs ideal for most businesses. This has been amplified by
the refurbishing of the Athi River-Namanga Highway and the expansion of water
supply (Export Processing Zone water supply) to Kitengela. Within Kitengela Town,
businesses both formal and informal have come up. Establishments flourishing within
the larger Kitengela area include industries, large scale farming, commercial
institutions/colleges, financial institutions/banks and office complexes.
4.4.1 Local Economy
The local economy of Kitengela as a location is anchored on livestock farming, crop
agriculture, industries, mining, trade and commerce and commoditization of land
(Kitengela Zoning Plan, 2012). Within Kitengela town, there are two industries that
manufacture steel pipes, iron bars and steel products (Ashut Engineering and Prime
steel). On the north western side, there are quarries (Ngurunga quarries) where
limestone, building stones and gypsum are mined. The type of crop farming practiced
in Kitengela is mainly horticultural farming with presence of several flower farms and
vegetable farms along the Nairobi-Namanga road as evident by the large number of
greenhouses within the area.
Livestock farming is practiced within the outskirts of the town where there is presence
of grazing land. The livestock rearing in one of the major economic activity in
Kitengela due to the pastoralist lifestyle of the local population. The main livestock in
Kitengela include cattle, goats, sheep and donkeys. The milk produced in the area is

63
marketed mainly through hawking around Kitengela town. Within the town, there
exists a slaughter house for the processing and supply of livestock produce to the
town and city markets. Commercialization in livestock production is limited as
pastoralists market their livestock mainly when the need arises.
Within the town, there are several wholesale and retail shops comprising mainly
supermarkets, general stores, service shops, bars/pubs, butcheries and hardwares.
There are also banking institutions besides other micro-financial agencies operating in
the town. The Jua Kali sector has also grown rapidly and mainly consists of carpentry,
tailoring shops, motor vehicle garages, welding and posho-mills. The town is prime
with numerous investment opportunities.
The increase in population and the need for land for development and settlement has
led to increased sub-division and sale of the same. This act has resulted to the eruption
of individuals alleging to be aiding the process as brokers and middlemen as evident
in the ever increasing number of land and property firms. In addition, holding land on
speculation basis within the town has been on the rise as the land businesses within
Kitengela and wider Kajiado County becomes a lucrative business. The locals have
been selling their land to the moneyed who buy them in large tracks and then resell
them in small portions of an eighth or even quarter acres at a profit.
The Kitengela area has experienced significant real estate growth in the past five
years and is poised for explosive economic growth in the next few years. A big
contributing factor has been the expansion of Nairobi which has seen its population
grow to more than four million resulting in an insatiable need for housing, as well as
commercial and industrial zones. The Kenya Export Processing Zone (EPZ) as well as
some premier blue chip companies and government parastatals such as the East
African Portland Cement, the Athi River Mining, Kenya Meat Commission and Ken
chic Limited are located within this locality raising the stakes of real estate
development. Real estate development companies (such as Jamii Bora estate and
Superior Homes) have been engaging in the execution of planned housing
developments on vast swathes of land. These developments are modeled in a way that
they offer residential units as well as schools, recreation and religious facilities. The
result has been the march of economic activity southward along the Nairobi-Athi

64
River corridor as developers, the government and home-seekers at large search for
habitable areas.
4.5 Social Infrastructure
The social infrastructures within Kitengela town include educational facilities, health
facilities, religious facilities, community/public purpose facilities and administrative
facilities. The provision of these social infrastructure is determined by the zone-based
development control regulations. For each zone, the specific social infrastructure
allowed/permitted are indicated as well as those allowed with conditions.
Within the town, there are four secondary schools (St. Monica Girls Secondary
School, Kitengela International School, Kitengela Girls School and Noonkopir
Secondary School) and six full primary schools (Acacia Crest Academy, Kitengela
International Academy, Thorn Groove Academy, Neptun, Ebenezer Primary School
and Kitengela Prisons Primary School). With the exception of Kitengela Prisons
Primary School and Kitengela Girls Secondary School all of these schools are private.
The most prominent schools in the town is the Acacia Crest Academy and Kitengela
International School. There are also four tertiary educational institutions within the
town which include Kenya College of Accountancy (KCA), National Industrial
Training Institute (at Namanga-Ngurunga road junction), East African University and
KAG (Kenya Assemblies of God) EAST University which have all been established
in the last ten years.
Plate 4-2: A University in Kitengela TownSource: Author, 2016

65
The literacy level within Kajiado County and by extension Kitengela town is low at
55.4 compared to 66.4 for the country as the county is ranked in position 36 out of the
47 counties in the country in regards to literacy level (Kenya County Facts Sheets,
2011).
The health facilities in the town include Aga Khan Hospital, Getrudes Hospital,
Kitengela Medical, Penda Health Centre, Meridian Hospital and Kitengela Health
Centre. With the exception of Kitengela Health Centre, the rest are all private.
However, there are county and sub-county public hospitals in the neighbouring towns
of Kajiado and Isinya. The county in general has a low doctor-patient ratio of
1:76,000 compared to 1: 26,000 for Kenya county average (Kenya Counties Facts
Sheet 2011).
Due to presence of both Christians and Muslims in the town, there are both churches
and a mosque within the town. The churches are for both Catholics and Protestants.
The prominent churches within the town include St. Monica’s Catholic Church,
PCEA Church Kitengela and Deliverance Church. The community/public purpose
facilities within the town include a children’s Home (Kenya Kids), a correctional
facility (Kitengela Prison), a Police post and an administration police camp. The
administrative facilities include the Chief’s office (adjacent to the open air market)
and the Sub-county office (adjacent to KCB bank).
4.6 Physical Infrastructure
Kitengela town enjoys the presence of a class ‘A’ road (Nairobi-Namanga road-A104)
which passes at the centre of the town linking the town to Nairobi city, Kajiado,
Isinya and Namanga towns and Tanzania through Namanga. The main roads within
the town for internal movement and accessibility include Kitengela-Rongai road
(Ngurunga road), EPZ road, Noonkopir road, Pinto road, Kitengela Prisons, road,
Deliverance road, Acacia road and Old Namanga road.
With the exception of Namanga road and EPZ road, all roads in the town are not
paved. According to the Kenya County Facts Sheet 2011, Kajiado County is one of
the counties with the worst roads (in terms of condition) as only 38.4% of the roads
are in good/fair conditions compared to the country’s average of 43.5%. Within
Kitengela town, there is only one designated bus terminus within the town which is
still under construction. Currently, the residents have been utilizing a road reserve at

66
the junction of Namanga road and Prisons road as the bus terminus. There is also a
proposed second bus terminus at the site currently occupied by the Prime Steel
Industries.
There is also a railway line passing through the eastern side of the town (which form
the border of Kajiado and Machakos Counties) even though there lacks a well
designated railway station. The town does not have an airport or airstrip due to its
proximity to the Jomo Kenyatta International Airport which is just approximately
25kilometers away.
Kitengela Town does not have a public sewer reticulation system. Each individual
plot and household in the township manages its own liquid wastes by use of septic
tanks, waste water treatment facilities and bio digesters. Due to the high number of
new developments coming come within the town, there is a need for a sewer system
Map 4-3: Road Network in Kitengela TownSource: Google Maps

67
for the town or even expansion of the EPZA sewer system (serving the neighbouring
Athi River town) to serve the town.
Just like liquid waste disposal, each individual plot and household manages its own
solid waste. Refuse collection and disposal is currently undertaken by private garbage
collection firms even though there is provision of a public dumpsite in the western
edge of the town in Noonkopir area.
The town is supplied with water by EPZ water project and supplemented by private
boreholes and rain water harvesting measures. However, there is a need to improve
water supply in Kitengela through harnessing of river water (Kisaju and Isinya
Rivers) through construction of a dam upstream to avoid overreliance on the EPZ
water supply which is sourced from Kiambu through partnership of EPZ and Nairobi
Water and Sewerage Company.
In regards to power supply, the town is connected to the national electricity grid with
presence of a Kenya Power and Lighting Company substation within the town. In
addition, the town is well served by various mobile phone service providers such as
Airtel and Safaricom as evident in the presence of the several Base Transceiver
Stations within the town.
The provision of these physical infrastructure determines the development control
regulations for each area/plot. The building line size specification is based on the
width of abutting road, development density on availability of public sewer system
and width of abutting road, land use type on accessibility and provision of support
facilities and services such as solid waste collection and disposal and water supply,
road widths on existing road hierarchy and waste disposal mechanism on provision of
waste management facilities and services.
4.7 Natural Physical and Geological Features
The landscape of Kitengela is generally plains being part of the greater Athi-Kaputiei
Plains. The area mainly consists of wooded grassland, open grassland and scrubs with
open grass land having scattered trees (Kitengela Zoning Plan, 2012). The ground
cover varies seasonally with rainfall and grazing intensity. The dominant plant species
are acacia trees.

68
There are three rivers within Kitengela town; Ilkeek-Lemedungi River, Green Valley
River and Kisaju River (which forms the southern border of the town). Kitengela area
being in the Kaputei plains and with undulating topography has caused meandering of
the rivers. The geology of Kitengela is characterized by Athi series rocks, Kapiti
phonolites and basement system rocks. The major aquifers in the area are in Upper
Athi Series due to the availability of tuffs, lake beds and sediments in between the
phonolites. Other aquifers are found in basement rocks due to fracturing and exposure
of the rocks due to erosion (Ministry of Natural Resources and Wildlife, 1966).
The natural physical and geological features and geology of Kitengela are key
determinants of the land use, land use intensity, building height, building density and
liquid waste disposal mechanisms. Thus, they are valuable considerations in
formulation of area-based development control regulations. For instance, the geology
of the area is used to determine the permissible building height of developments based
on the soil load carrying capacity while availability of aquifers determine the liquid
waste disposal mechanisms as septic tanks, soak pits and pit latrines are discouraged
in areas where people rely on underground water supply.
4.8 Climatic Characteristics
Kitengela area is generally dry usually characterised by the long periods of drought as
it falls in a semi-arid region. There are two rainy seasons; the short rains between
October and December and the Long rain between March and May. The annual
rainfall varies between 500mm and 1,250mm. At times the region receives rainfall
amounts as low as 250 mm. The rainfall is very unpredictable hence most of the
residents do not practice crop farming (rain fed agriculture). The average annual
temperature in Kajiado County as a whole is 18.9°C (Dietz, Owiti, Brandt and Otinga,
1986).
The soils are not favourable for growth of most of the crops due to the poor texture
which in turn translates to low water holding capacity and high water infiltration rates.
The soils are very susceptible to erosion processes such as wind erosion due to their
light weight nature.
The poor soils and low rainfall within Kitengela Town has discouraged farming
resulting to change in land use from agricultural to other uses such as residential,
commercial, industrial etc.

69
CHAPTER FIVE: STUDY FINDINGS
5.1 Introduction
This chapter presents the major study findings that have emerged from data collection
using administration of household questionnaires, developers’ questionnaires and
checklists, interviews and observation. The collected data is analyzed to come up with
findings on key study questions and objectives that the study intended to respond to
and achieve. It presents findings on; the socio-economic background of the
respondents, the development control tools used to guide and control physical
development in Kitengela Town, the development control regulations’ compliance
level, the factors affecting compliance and the effects of the development control
regulations compliance level to the urban spatial structure.
5.2 Response Rate
Table 5-1 shows the responses received from the field for the various categories of
respondents. The overall response rate was 87% based on the interviews conducted
and questionnaires and checklists filled.
Table 5-1: Response Rate
Research Instrument Expected Responses Actual/Received
Responses
Response
Rate
Household Questionnaires 40 40 100%
Developers’
Questionnaires
40 24 60%
Checklists 40 40 100%
Interview Schedules 4 4 100%
Total 124 108 87%
Source: Author, 2016
According to Dixon (2012), a response rate of 50% is adequate while a response rate
greater than 70% is very good. This agrees with Mugenda and Mugenda (2003), that a
50% response rate is adequate, 60% good and above 70% very good. This therefore
implies that the response rate of 87% is very good and suitable to make a finale for
the study.

70
5.3 Socio-Economic Background of Respondents
The study had three categories of respondents which included: Residents, Developers
and the Development Control Officials.
5.3.1 Socio-Economic Background of Residents
Out of the 40 residents interviewed, 53.8% were male while 46.2% were female and
their age ranged from 23 to 73 years. Only 34.3% of the interviewed residents are
engaged in formal employment (teachers, production supervisors, environmental
experts, office administrators etc.) while 65.7% are either unemployed or undertake
small-scale businesses such as shop keeping, grocery vending etc. This explains their
income levels where 37.5% of the residents earn below Kshs 10,000 per month,
34.4% between Kshs 10,000 and Kshs 20,000 and only 28.1% earning above Kshs
20,000 per month. This explains the fact that only 12.8% of the residents own the
housing units they live in with 87.2% being just tenants.
Table 5-2: Monthly Income of Residents
Income Per Month in Kshs Percentage of Respondents
Below 10,000 37.5
10,000-20,000 34.4
20,001-30,000 15.6
30,001-40,000 6.25
40,001-50,000 3.125
Above 50,000 3.125
Source: Field Survey, 2016
5.3.2 Socio-Economic Background of Developers
The age of the interviewed developers ranged from 25 to 75 years with 54% being
male and 46% female. A significant number of the developers (approximately 36%)
are below 40 years in age an indication that more young people are investing in real
estate. The literacy level among the developers is high with approximately 92% of the
developers having completed their secondary education with 70% having completed
their tertiary education. Their occupation range from business to civil service with
more than 50% of the respondents working directly with national or county
government. Their monthly income from their developments range from Kshs 20,000
for semi-permanent row housing to Kshs 160,000 for flats.
71
5.3.3 Socio-Economic Background of Development Control Officials
The study interviewed four development control officials; Kajiado County Physical
Planner, Director of NEMA Kajiado County, Public Health Officer-Kajiado East Sub
County (Kitengela) and Public Works Officer/County Engineer. Three of the
development control officials were male with only one female (Kajiado County
Engineer). All the officials had university degrees contrary to Rukwaro (2011)
findings that the key departments involved with development control lacked qualified
staff.
5.4 Identification of Development Control Tools and Compliance Levels
This section presents the development control tools used by the various development
control agencies to guide and control development in Kitengela Town before and after
the preparation of the town’s local physical development plan in 2012 as well their
compliance levels within Kia Ng’ombe ‘B’ Zone.
5.4.1 Development Control Tools for Kitengela Town before the Preparation of
the Town’s Local Physical Development Plan
Before the preparation of the Kitengela Zoning Plan in 2012, different development
control agencies used different development control tools to guide and control
development within the town. They included both the statutory and non-statutory
tools (as noted by Ngetich, Opata and Mulongo, 2014). The statutory tools
(legislations) include the Physical planning Act of 1996 and the Environmental
Management and Coordination Act of 1999 (EMCA) which provided for the
preparation of development plans and the planning and development regulations and
standards which inform development control process. The non-statutory tools
included gazetted rules and regulations (the Physical Planning Handbook), Local
Authorities Planning and Building Regulations (i.e. the Building Code), physical
development plans (i.e. the Kitengela/Isinya/Kipeto Integrated Development Plan of
2010) and Registry Index Maps.
Each development control agency had its own development control tools and the
concerned agencies include the Physical Planning Department, Public Health
Department, Public Works/Engineering Department and the National Environment
Management Authority.
72
a. The Physical Planning Department
The physical planning department in the now defunct Kajiado County Council used
the Physical planning Act of 1996, Physical Development Plans
(Kitengela/Isinya/Kipeto Integrated Development Plan of 2010), Physical Planning
Handbook of 2007 and Registry Index Maps as tools for development control.
The Physical planning Act of 1996 (Part V on Control of Development) provided the
development control process and the agencies responsible for the formulation of by-
laws for guiding and controlling development. These by-laws acted as the basis of
development control by providing development control regulations.
The Kitengela/Isinya/Kipeto Integrated Development Plan provided development
control regulations for guiding and controlling development in Kitengela, Isinya and
Kipeto areas. These regulations were inform of permitted structure types, roads’
widths and minimum land size. Within Kitengela Town, the regulations include
permitted minimum land size of 0.0045 Hectares and highrise developments within
the town.
The Physical Planning Handbook provided supplemental guidance and standards on
the process and practice of land use planning highlighting the recommended plot
coverage, plot ratio, structure types, development densities, building lines, setbacks
and roads widths for each land use type.
Registry Index Maps provided information regarding size and dimension of plots and
the type of road serving the plots. This facilitated the determination of the appropriate
land use for each of the plot.
b. Public Health Department
The main development control tool for the Public Health Department in now defunct
Kajiado County Council was the Building Code (The Local Government Adoptive
By-Laws-Order 1968). This is through the adoption of Section 126 of the Public
Health Act on formulation of by-laws for buildings and sanitation. The building code
was used to ensure that public health that is secured and maintained through provision
of various standards regarding building materials, building space, lighting, ventilation,
height of buildings and height of chimneys. These standards were used as a basis for
development control especially for evaluating development applications and
inspection of construction works.
73
c. Public Works/Engineering Department
The Public Works/Engineering Department in the now defunct Kajiado County
Council used the Building Code (Edition 1997) as the main development control tool.
It was used as a basis for checking the structural stability of buildings/structures by
providing various standards regarding building materials (load-bearing requirements,
resistance to weather and damp and fire resistance), building sites and ventilation of
buildings among others.
d. National Environment Management Authority
NEMA as a development control agent has been utilizing the Environmental
Management and Coordination Act of 1999 (EMCA) as its main development control
tool. The Act provides various standards and regulations in regards to different
developments or land uses with a provision for environmental impact assessment for
selected developments. The regulations include: EIA/EA Regulations (Legal Notice
No. 101 of 2003), Water Quality Regulations (Legal Notice No. 120 of 2006), Waste
Management Regulations (Legal Notice No.121 of 2006) and Noise Regulations
(Legal Notice No. 61 of 2009).
The EIA/EA Regulations provides for the developments to undergo environmental
impact assessment and annual environmental audits while the Water Quality
Regulations provides for the guides for water use and conservation as well as effluent
standards for discharge. Waste Management Regulations focuses on management of
solid, industrial and hazardous wastes, pesticides, toxic and radioactive substances
while the Noise Regulations provides for the acceptable noise limits as a way of
managing noise pollution to levels that do not cause a disturbance/nuisance to the
public.
5.4.2 The Current Main Development Control Tools for Kitengela Town
Currently, the Kitengela Zoning Plan (2012) is the main development control tool for
Kitengela Town. Being a zoning plan, it is considered to supersede the other
development control tools in regards to ensuring orderly and sustainable development
as noted by AAK (2015). For this reason, it is used as the main development control
tool for guiding and controlling physical development within Kitengela Town. The
other development control tools are used as supplementary development control tools.
The Building Code (Edition 2009) is used to compliment the zoning plan through
74
provision of the standards regarding building materials, building space, lighting and
ventilation which are relevant to both the Public Health and Public
Works/Engineering Departments while EMCA is used to compliment the zoning plan
through provision of detailed environment related standards and regulations relevant
to NEMA. For both the Public Health and Public Works/Engineering Departments,
the Kitengela Zoning Plan provides standards regarding building height and building
sites specifications while for NEMA, the plan provides standards regarding waste
disposal mechanisms, riparian reserve specifications and percentage of vegetation
cover at plot level.
5.4.2.1 Kitengela Zoning Plan of 2012
Kitengela Zoning Plan is a Local Physical Development Plan (a Zoning Plan) for
Kitengela Town with an objective of providing a guide to help in development control
so as to ensure harmony in location of the different land uses. The plan was prepared
under the provisions of the Physical Planning Act Cap 286 (under review) and the
Local Government Act Cap 265 (now repealed). The preparation of the zoning plan
has been triggered by the rapid rate of urban development in Kitengela town which is
foreseen as a menace to the welfare of the local population, natural environment and
the performance of the sub-region’s economy. The zoning plan is geared towards
realization of self-sustaining and controlled future spatial developments. It indicates
the seventeen (17) zones indicating land uses for each zone, preferred minimum plot
sizes, types of developments, plot settings and permissible as well as prohibited
developments.
5.4.3 Development Control Regulations Compliance Levels in Kia Ng’ombe ‘B’
Zone
The study assesses the development control regulations compliance level through
inspection (evaluation) of the developments’ specifications in comparison to the set
development control regulations as provided by the Kitengela Zoning Plan (being the
main development control tool for Kitengela Town currently). This facilitates
assessment of the level of conformity to the set specifications (development control
regulations). The set development control regulations for Kia Ng’ombe ‘B’ Zone are
as provided in Table 5-3 below;
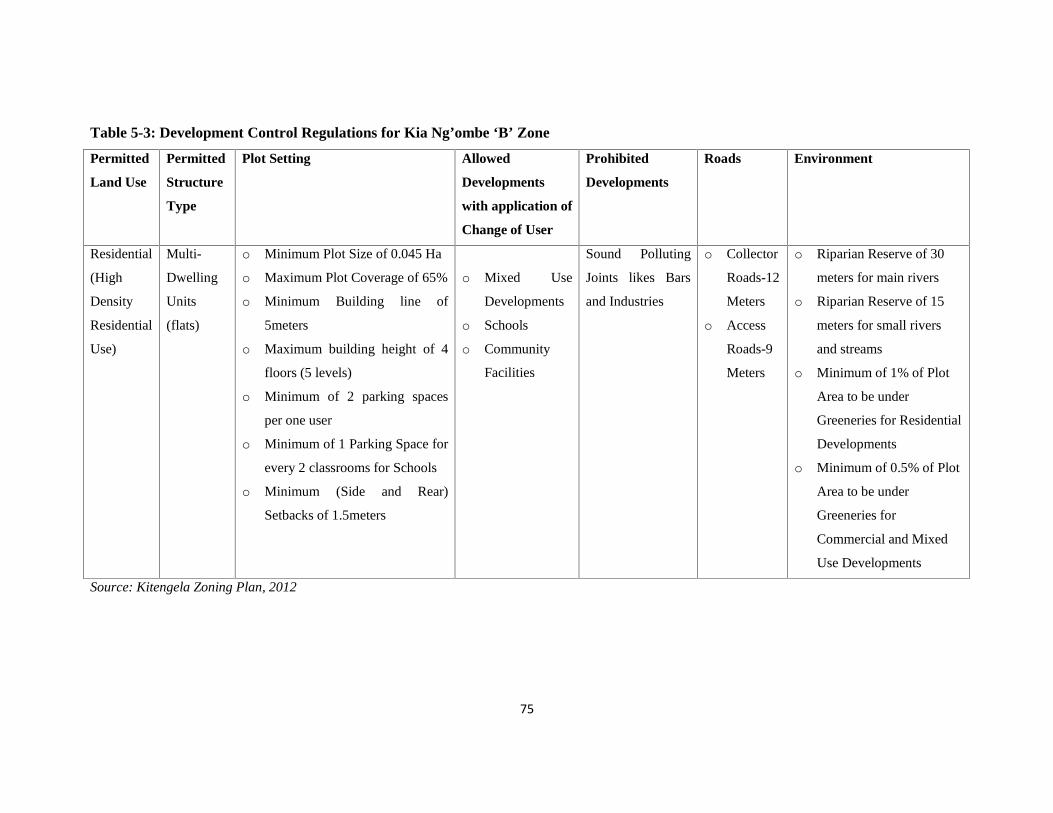
75
Table 5-3: Development Control Regulations for Kia Ng’ombe ‘B’ Zone
Permitted
Land Use
Permitted
Structure
Type
Plot Setting Allowed
Developments
with application of
Change of User
Prohibited
Developments
Roads Environment
Residential
(High
Density
Residential
Use)
Multi-
Dwelling
Units
(flats)
o Minimum Plot Size of 0.045 Ha
o Maximum Plot Coverage of 65%
o Minimum Building line of
5meters
o Maximum building height of 4
floors (5 levels)
o Minimum of 2 parking spaces
per one user
o Minimum of 1 Parking Space for
every 2 classrooms for Schools
o Minimum (Side and Rear)
Setbacks of 1.5meters
o Mixed Use
Developments
o Schools
o Community
Facilities
Sound Polluting
Joints likes Bars
and Industries
o Collector
Roads-12
Meters
o Access
Roads-9
Meters
o Riparian Reserve of 30
meters for main rivers
o Riparian Reserve of 15
meters for small rivers
and streams
o Minimum of 1% of Plot
Area to be under
Greeneries for Residential
Developments
o Minimum of 0.5% of Plot
Area to be under
Greeneries for
Commercial and Mixed
Use Developments
Source: Kitengela Zoning Plan, 2012

76
5.4.3.1 Land Use Compliance
The land use mix in Kia Ng’ombe ‘B’ Zone is as in Figure 5-1 below;
Figure 5-1: Land Use Mix in Kia Ng’ombe ‘B’ Zone
Source: Field Survey, 2016
The study found out that 95% of the sampled plots/developments are compliant to the
recommended land use. 42.5% of the sampled developments are residential (which is
the recommended land use) while 42.5% are mixed use and 10% educational which
are permitted with a change of user (Kitengela Zoning Plan, 2012). 5% of the
developments are non-compliant to the permitted land use with agricultural and
commercial land uses accounting for 2.5% each. The commercial developments
within the residential zone are mainly developed along the main roads within the zone
while the agricultural development is within the low density residential subzone
within the wider residential zone where there is presence of comparatively large
tracks of land. People are accustomed to having various types of commercial and even
agricultural developments close to residential areas or within them and the attempt to
segregate uses does not meet with much success especially in towns/cities of
developing countries (Courtney, 1978).
5.4.3.2 Structure Type Compliance
On the profile of the developments in respect to structure typology, six structure types
were identified; Flats, Row Housing, Bungalows, Maisonettes, Agricultural Farms
and Educational Facilities. Some of the structure types are either permanent or semi-

77
permanent while others have a mix of both permanent and semi-permanent as shown
in Table 5-4 below;
Table 5-4: Structure Types in Kia Ng’ombe ‘B’ Zone
Source: Field Survey, 2016
Only 57.5% of the sampled developments are compliant to the permitted structure
type within the zone. This include flats, permanent row housing and permanent
educational facilities whereby the permanent row housing and permanent educational
facilities are only allowed with application of change of user to either mixed use
(residential cum commercial) or educational land use. The non-compliant structures
include semi-permanent and mix of permanent and semi-permanent row housing,
bungalows, maisonettes, agricultural farms and semi-permanent educational facilities.
The non-compliance of these structures is due to their semi-permanent aspect,
prohibited land use or prohibited land use density.
The construction of the semi-permanent structures is attributed to reduction of
construction costs through use of cheaper building materials such as iron sheets (since
building materials account for approximately 68% of the total construction cost) and
in return reduce costs associated with building material acquisition and labour up to
50% (Syagga, 1993).
The existence of low density residential developments (bungalows and maisonettes) is
due to presence of sub-zones within the zone where some sections of the zone are
predominantly for low density residential developments while others are for high
Structure Type Percentage
1. Flat 37.5
2. Row Housing Semi-Permanent 20.0 37.5
Permanent 10.0
Mix of Permanent and Semi-Permanent 7.5
3. Bungalow 10.0
4. Maisonette 2.5
5. Agricultural Farm 2.5
6. Educational
Facility
Permanent 5.0 10
Semi-Permanent 5.0
Total 100.0

78
density developments. In addition, rejection of such developments cannot be justified
purely on the basis of zoning requirements, since development would not create
harmful effects in terms of nuisance, pollution, traffic, or an undue demand on
existing infrastructure (Dissanayake, 1987).
The existence of agricultural farms within the zone is explained by the original use of
the land before the preparation of the town’s zoning plan in 2012. Before the
emergence of the town in 1988, land was agricultural (a group ranch) and after the
subdivision of the group ranch some land owners did not apply for change of user.
5.4.3.3 Plot Setting Compliance
Plot setting is provided in terms of plot size, plot coverage, building line, setbacks,
building height and parking spaces provision specification.
a. Plot size
The plot sizes in Kia Ng’ombe ‘B’ Zone range from 0.05 Hectares (1/8Acre) to 0.80
Hectares (2 Acres) with the average size being 0.05 Hectares (1/8Acre). This is an
indication that all sampled plots are compliant to the set recommended minimum plot
size of 0.05 Hectares (1/8Acre).
Table 5-5: Plot Sizes in Kia Ng’ombe ‘B’ Zone
Plot Sizes Percentage
0.05Ha 72.5
0.20Ha 7.5
0.10Ha 12.5
0.40Ha 2.5
0.80Ha 5.0
Total 100.0
Source: Field Survey, 2016
The plot sizes depend mainly on the land use. All plots above 0.20 Hectare (1/2 Acre)
are either for educational and agricultural uses since the land requirement for
educational facility (Pre-School) is 0.15-0.25 Hectares while that for small-scale
agricultural farm is 1-4 Hectares (Physical Planning Handbook, 2007).

79
Plate 5-1: Washrooms within the Building Line SpaceSource: Fieldwork, 2016
Table 5-6: Land Use-Land Size Cross Tabulation
Land Sizes Total
0.05Ha 0.10Ha 0.20Ha 0.40Ha 0.80Ha
Land Use
Residential 70.6% 23.5% 5.9% - - 100.0%
Commercial 100.0% - - - - 100.0%
Mixed Use 94.1% 5.9% - - - 100.0%
Educational - - 50.0% 25.0% 25.0% 100.0%
Agricultural - - - - 100.0% 100.0%
Total 72.5% 12.5% 7.5% 2.5% 5.0% 100.0%
Source: Field Survey, 2016
b. Building Line
The study found out that the building line for the sampled developments range from
zero to twelve meters. The compliance level to the recommended minimum building
line of 5 meters is at 25% with half of the sampled developments in the study having
no building line at all.
The building line compliance is lowest among the multi-dwelling residential
developments (flats and row housing units) as 93% of the sampled flats have building
line non-compliant with 100% of the sampled row housing units being non-compliant.
This is due to the use of the building line space for construction of commercial
facilities (shops), water tanks and sanitary facilities (washrooms) as a way of
maximizing on the available space within the plot.

80
c. Setbacks
The permitted minimum setback size according to the Kitengela Zoning Plan is 1.5
meters. This is for the both rear and side setbacks. However, the setbacks ‘compliance
level within Kia Ng’ombe ‘B’ Zone is 32.5% for rear setback and 25% for side
setbacks. The low setbacks’ compliance level is as a result of developers trying to
maximise on the available space as they view the side and rear setbacks as wastage of
space hence end up developing their plots from ‘beacon to beacon’ (AAK, 2011). In
addition, majority of developers use their buildings’ outer walls as boundary walls
hence avoiding leaving any open spaces around their buildings. This is evident in the
orientation of their buildings as majority of the housing units are facing each other
with a passage at the centre.
d. Plot Coverage
The study found out that compliance to plot coverage within Kia Ng’ombe ‘B Zone is
at 42.5% as 57.5% of the sampled developments occupy more than 65% of the plot
area as shown in Table 5-7 below;
Table 5-7: Plot Coverage within Kia Ng’ombe ‘B’ Zone
Plot Coverage Percentage
65% and Below 42.5%
Above 65% 57.5%
Source: Field Survey, 2016
Plate 5-2: Orientation of DevelopmentsSource: Fieldwork, 2016

81
The essence of fixing plot coverage is to ensure a healthy environment and allow for
expansion and improvement of infrastructural facilities and social amenities (Physical
Planning Handbook, 2007). Its compliance is significantly affected by building line
size compliance level. It logical that as the building line size increases, there is a
corresponding increase in the size of undeveloped space within the plot (the building
line size × plot width) and hence a decrease in size of plot area covered by the
development.
Using correlation, the study established that building line size affected plot coverage
percentage as shown in Table 5-8. With a correlation coefficient of -0.602, the
relationship between plot coverage and building line size is deemed to be moderate
and negative. This means that there is a moderate negative relationship between
building line and plot coverage (as the building line size increases, the plot coverage
percentage decreases). Based on the fact that increase in building line size results to
increase in building line compliance and decrease in plot coverage percentage results
to increase in plot coverage compliance, increase in building line compliance would
result to increase in plot coverage compliance
Table 5-8: Correlation of Building Line Size and Plot CoverageBuilding Line Plot Coverage
Building Line
Pearson Correlation 1 -.602**
Sig. (2-tailed) .000
N 40 40
Plot Coverage
Pearson Correlation -.602** 1
Sig. (2-tailed) .000
N 40 40
**. Correlation is significant at the 0.01 level (2-tailed).
Source: Field Data, 2016
With the research hypothesis being ‘The correlation between building line size and
level of plot coverage will be significantly different from zero’ and the null hypothesis
being ‘The correlation between building line size and level of plot coverage will not
be significantly different from zero’, the null hypothesis is rejected since the
correlation between building size and plot coverage is significant. This means that
building line size is one of the key determinants of plot coverage percentage but not
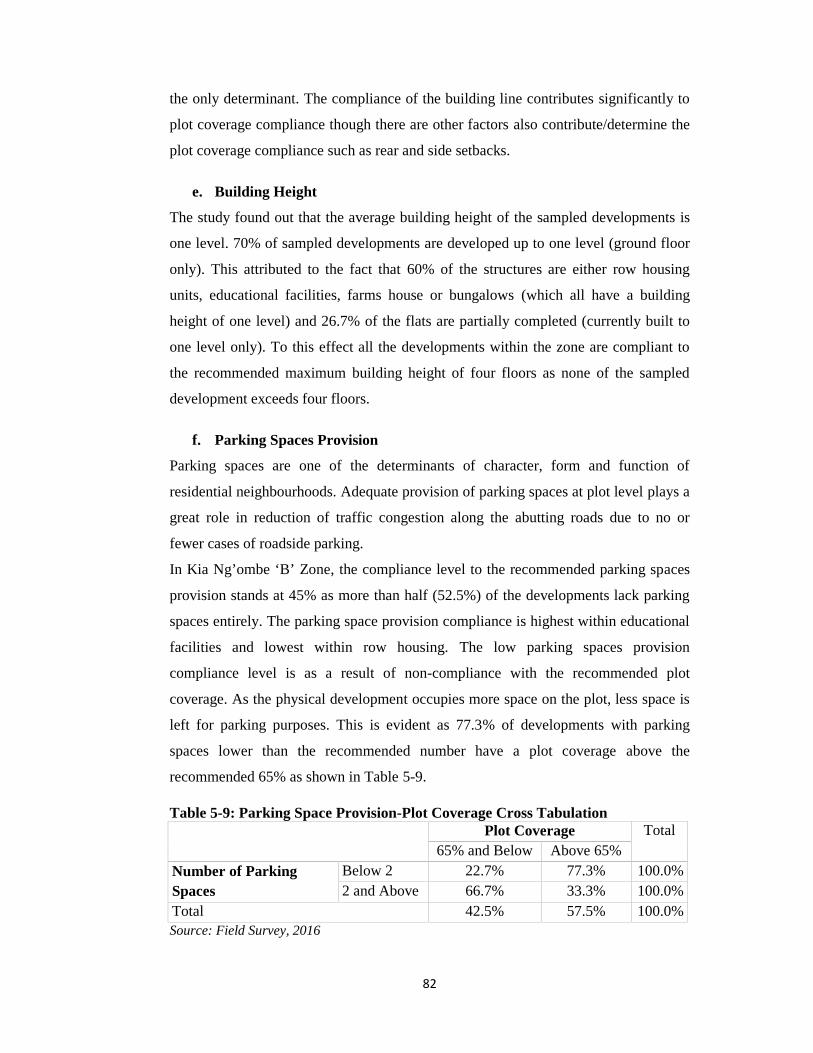
82
the only determinant. The compliance of the building line contributes significantly to
plot coverage compliance though there are other factors also contribute/determine the
plot coverage compliance such as rear and side setbacks.
e. Building Height
The study found out that the average building height of the sampled developments is
one level. 70% of sampled developments are developed up to one level (ground floor
only). This attributed to the fact that 60% of the structures are either row housing
units, educational facilities, farms house or bungalows (which all have a building
height of one level) and 26.7% of the flats are partially completed (currently built to
one level only). To this effect all the developments within the zone are compliant to
the recommended maximum building height of four floors as none of the sampled
development exceeds four floors.
f. Parking Spaces Provision
Parking spaces are one of the determinants of character, form and function of
residential neighbourhoods. Adequate provision of parking spaces at plot level plays a
great role in reduction of traffic congestion along the abutting roads due to no or
fewer cases of roadside parking.
In Kia Ng’ombe ‘B’ Zone, the compliance level to the recommended parking spaces
provision stands at 45% as more than half (52.5%) of the developments lack parking
spaces entirely. The parking space provision compliance is highest within educational
facilities and lowest within row housing. The low parking spaces provision
compliance level is as a result of non-compliance with the recommended plot
coverage. As the physical development occupies more space on the plot, less space is
left for parking purposes. This is evident as 77.3% of developments with parking
spaces lower than the recommended number have a plot coverage above the
recommended 65% as shown in Table 5-9.
Table 5-9: Parking Space Provision-Plot Coverage Cross TabulationPlot Coverage Total
65% and Below Above 65%Number of ParkingSpaces
Below 2 22.7% 77.3% 100.0%2 and Above 66.7% 33.3% 100.0%
Total 42.5% 57.5% 100.0%Source: Field Survey, 2016

83
5.4.3.4 Roads Provision
The compliance level to the recommended access road width in Kia Ng’ombe ‘B’
Zone is at 32.5% as 67.5% of the sampled developments in the study are served by 6
meter wide access roads. This is explained by the current roads’ width non-compliant
subdivisions in the area which were undertaken way before the preparation of the
town’s zoning plan (in 2012) when the town was a group ranch in late 1980s.
5.4.3.5 Environmental Considerations
The set environmental regulations are provided in terms of permitted minimum
riparian reserve width and permitted minimum plot area under Greeneries.
In regards to compliance to the recommended plot area under greeneries, the study
found out that only the single dwelling residential units (bungalows and maisonettes)
and educational facilities are compliant as the high residential developments (flats and
row housing units) have majority of their plot area either developed or paved for
parking purposes.
The study also found out that out of the 400 developments within Kia Ng’ombe ‘B’
Zone, only two have sections within the riparian reserve as majority of the plots
adjacent to the river are undeveloped. This means that there minimal cases of loss of
property or lives due to flooding of the stream/river within the area.

84
5.4.3.6 Summary of Development Control Regulations’ Compliance within Kia
Ng’ombe ‘B’ Zone
Using the compliance level of the individual development control regulations, the
study found out that the average development control regulations’ compliance within
Kia Ng’ombe ‘B’ Zone was at 59.5% which is way above the country’s average
compliance of 30% (since only 30% of urban towns are settled on the basis of formal
plans (GoK, 2008).
Map 5-1: Developments within the Riparian Reserve
Source: Adopted form Google Maps with Modifications

85
Table 5-10: Summary of Development Control Regulations Compliance
Development Control Regulation Percentage of Compliant
Developments
1. Permitted Land Use 95%
2. Permitted Structure Type 57.5%
3. Plot
Setting
i. Permitted Minimum Plot Size 100%
ii. Permitted Maximum Plot
Coverage
42.5%
iii. Permitted Minimum Building
Line
25%
iv. Permitted Minimum Rear
Setback
32.5%
v. Permitted Minimum Side
Setback
25%
vi. Permitted Maximum Building
Height
100%
vii. Permitted Minimum number of
Parking Spaces
45%
4. Permitted Minimum Access Road Width 32.5%
5. Recommended Riparian Reserve Width 99.5%
Average Compliance Level 59.5%
Source: Field Survey, 2016
The most violated development control regulations include building line, rear and side
setbacks, access road widths, plot coverage and parking space provision stipulations a
phenomena common within the low income residential neighbourhoods (UN Habitat,
2000).
5.5 Factors Affecting Development Control Regulations’ Compliance
The study identified eight main factors contributing to the above development control
regulations’ non-compliance level which include;
i. Maximization of available space
ii. High Professional and Statutory Fees
iii. Low levels of Public Awareness
iv. Ignorance

86
v. Corruption
vi. Poverty
vii. Poor Enforcement (Inadequate Supervisions and Inspections)
viii. Complexity of the Development Control Process
However, contribution of these factors to development control regulations’ non-
compliance differed among the different respondents. Both the interviewed
developers and residents cited all of the above factors as contributing to development
control non-compliance while the interviewed development control officials only
cited maximization of available space, ignorance and poor/inadequate enforcement as
the main factors contributing to development control regulations’ non-compliance.
It was however important to note that there was a similarity of perception/view on the
level of contribution of the above factors to development control regulations’ non-
compliance between the interviewed residents and developers. Both the interviewed
developers and residents (of whom 51.3% having undertaken a development project)
cited high professional and statutory fees, corruption and aspiration and aims of
developers to maximise returns from land as the main contributors to development
control regulations’ non-compliance.
Table 5-11: Factors Affecting Development Control Regulations’ Compliance
Factors Affecting Development
Control Regulations’ Compliance
Percentage of
Contribution to Non-
Compliance
(According
Developers)
Percentage of
Contribution to
Non-Compliance
(According
Residents)
1. High Professional and Statutory
Fees
25.0 25.7
2. Corruption 22.5 23.1
3. Aspiration and Aims to
Maximise Returns from Land
17.5 17.9
4. Ignorance/Impunity 10.0 10.3
5. Lack of Public Awareness 7.5 7.7

87
6. Complexity of the Development
Control Process
7.5 7.7
7. Poverty 5.0 5.1
8. Poor Enforcement 5.0 2.6
Total 100.0 100.0
Source: Field Survey, 2016
5.5.1 High Professional and Statutory Fees
High professional and statutory fees were cited as the main contributor of
development control regulations’ non-compliance by both the interviewed developers
and residents at 25% and 25.7% respectively.
The preparation of development proposals require the services of professionals like
planners, architects, structural engineers and environmental experts depending on the
nature of development. However, the amount of fees charged by these professionals
has been unaffordable for some of the developers (Opata, Mulongo, Omuterema &
Ngetich, 2013). This has resulted to engagement of unqualified/underqualified
consultants in a bid to cut cost on the professional fees. In return, this has resulted to
preparation of non-compliant development proposals (due to the lack of knowledge
about the set development control regulations) by majority of these unqualified
consultants which when implemented result to development control non-compliant
developments.
In addition, with various development control agencies and each having its own
statutory fee, developers are finding the total amount of money spend on the statutory
fee consuming a significant percentage of their development budget and in some cases
exceeding the cost of erecting development and the value of the plot (Opata,
Mulongo, Omuterema & Ngetich, 2014). This results to low level of development
proposals submission for evaluation and subsequent advice on possible modification
to ensure compliance with the set development standards. In return, this leads to
implementation of non-compliant development proposals.
5.5.2 Corruption
The study found out that corruption was the second highest contributor of
development control regulations’ non-compliance at 22.5% (for developers) and
23.1% (for residents). According to the interviewed respondents (developers and

88
residents) corruption among development control officials and developers contributes
significantly to violation of development control regulations’ compliance. Non-
compliant development proposals are being granted development permission in
exchange for a specific amount of money depending on the nature of the development
hence encouraging double standards in granting or rejecting approval (Ogundele,
Odewumi and Aigbe (2011). This is instigated by both the developers as well as the
development control officials as in some cases it is the developers who offer the
development control officials money in exchange of approval of their non-compliant
development proposals while in other cases it is the development control officials who
ask for the money to approval development proposals which are non-compliant.
5.5.3 Aspirations and Aims of Developers to Maximise Returns on their Land
17.5% of the interviewed developers and 17.9% of the interviewed residents cited the
aspirations of developers of seeking to maximise returns from land through optimal
development of available space within the plot/land as one of the main factor
contributing to violating development control regulations. The quest by the
developers to maximize profit by increasing plot coverage and plot ratio of their plots
through unauthorized alteration/modification of development proposals during
construction was also noted by the interviewed development control officials as one
of the main contributors of development control regulations non-compliance.
Dissanayake (1987) and AAK (2011) asserts that the high cost of land in urban areas
and the increase in demand for rental buildings and residential units is one of the main
reason as to why developers are increasing plot coverage and plot ratio of their plots
resulting to violation of building line and setbacks provision which negatively affect
plot coverage and subsequently provision of parking spaces and other public
facilities/spaces within the plot.
5.5.4 Ignorance
The study found out that violation of development control regulations in some cases
has been out of ignorance/impunity by some of the developers according to the
interviewed development control officials and 10.0% of the interviewed developers
and 10.3% of the interviewed residents. Despite having sufficient knowledge about
the development control process as well as the development control regulations, some
developers choose not to follow the due process of development control nor adhere to

89
the set development standards out of impunity or lack of sufficient knowledge about
the resultant effects as noted by Dissanayake (1987).
This results to implementation of non-compliant developments since the due process
of development control is not followed hence advice by the development control
officials on possible modifications on development proposals are not made.
5.5.5 Lack of Public Awareness
For one to comply with any regulations, he/she ought to be aware about their
existence and contents. People cannot comply with regulations if they do not
understand what is required (OECD, 2000). The lack of this awareness about the set
development control regulations for each of the zones results to violation of some or
all of the development control regulations due to lack of knowledge about the ‘Dos
and Don’ts of development.
Within Kia Ng’ombe ‘B’ Zone within Kitengela Town, 17.5% of the interviewed
residents of do not know any development control regulation. To this effect, 7.7% of
the interviewed residents consider lack of public awareness about the various
development control regulations as the main factor contributing to violating
development control regulations which is echoed by 7.5% of the interviewed
developers. The lack of public awareness among the public has been as a result of
inadequate/lack of public sensitization about the set development control regulations
and overreliance on development professionals for information about the set
development control regulation some of which are quacks. The procedures that guide
development control have not been sufficiently shared with the public as relatively
high number of developers get to know of the existence of the development control
regulations during the submission of the development proposals (Ogundele, Odewumi
and Aigbe, 2011). The apparent lack of knowledge on development control
regulations directly impacts developers in their understanding of planning policy
requirements leading to poor development proposals, low levels of compliance and
ultimately weak attempts at enforcement of planning policy as it exists as noted by
AAK (2011).
5.5.6 Complexity of the Development Control Process
7.5% of the interviewed developers and 7.7% of the interviewed residents considers
the complexity of the development control process as the main cause of development

90
control non-compliance. The complexity of the development control process is seen in
term of the high number of departments/institutions involved as well as the time
taken. With the average number of institutions/departments for development control
within Kajiado County being five (physical planning, public health, public works,
NEMA and NCA), some of the developers are finding the number to be a hindrance in
submission of development proposals for evaluation. In addition, the time taken for
the evaluation of the development proposals in all the development control
departments/institutions is deemed to discourage developers in submitting
development proposals for evaluation. The inter-departmental movement of
development proposals is tiresome, costly and time consuming for developers. The
average time for evaluation of development applications (architectural and structural
drawings and planning briefs) is one month however, there are cases of some
development proposals evaluation up to six months.
With majority of the developers (53.8% of the interviewed developers) relying on
bank loans as the main source of capital for development, timely commencement of
construction works is key in ensuring that developments are completed on time for
repayment of the loans. Delays in evaluation of development application results to
developers proceeding with their developments without statutory approvals (AAK,
2011).
5.5.7 Poverty
5.0% of the interviewed developers considers poverty to be a contributor of
development control non-compliance which is echoed by 5.1% of the interviewed
residents. Poverty certainly plays an important role in accounting for variations in the
degree of compliance with planning regulations especially in the low-income
residential zones (Habitat International, 2000). The lack of adequate funds to develop
formal structures/developments is one of the reasons for existence of informal/semi-
permanent structures/developments. Majority of these informal/semi-permanent
structures are non-compliant to development control regulations since they lack
development proposals (such as architectural drawings) to guide their developments.
Their implementation is mainly guided by sketches made by the developers which do
not consider the set planning standards such as plot coverage, building line and
setbacks provision.

91
5.5.8 Poor Enforcement
Poor enforcement of development control was considered to be the highest
contributor of development control regulations non-compliance within Kitengela
Town and by extension Kajiado County by the interviewed development control
officials though the interviewed developers and residents had a contrary opinion. Only
5.0% of the interviewed developers and 2.6% of the interviewed residents cited poor
enforcement of development control as one of the main contributors of development
control regulations non-compliance.
The interviewed development control officials cited inadequacy of resources to
perform enforcing measures as the main reason for the unauthorized alterations of
development proposals during construction and lack of strict adherence to the
approved development proposals due to poor development supervision and/or
inspection. The poor supervision and/or inspection of developments has been
attributed to inadequacy of both human and financial resources and lack of relevant
supportive system for effective enforcement as noted by Kimani and Musungu (2010).
The inadequacy of human and financial resources has provided loop holes for
implementation of development control regulations’ non-compliant developments
projects. With only three physical planners, two engineers, three environmental
officers and two development officers doubling as development control enforcement
officials and lack of adequate vehicles for development supervisions and inspections,
the enforcement development control is very poor within Kitengela Town and
Kajiado County. Non-compliant developments takes place without being noticed
while other developers implement totally different developments from what is
indicated in the approved development proposals due to inadequacy of regular
development inspections and supervisions.
5.6 Effects of Development Control Regulations Non-Compliance
The study found out that the non-compliance to some of the development control
regulations had significant effects on arrangement of physical developments and
spaces at plot and neighbourhood level hence negatively affecting the overall urban
structure. This is evident in developments that are unplanned and lacking major public
purpose facilities and utility services including; efficient transportation system,
efficient drainage and sewer system, proper provisions of sanitation services, adequate

92
Plate 5-3: Roadside DumpingSource: Fieldwork, 2016
access to clean water and adequate access to open spaces and parking spaces as noted
by AAK (2011).
The study found out that the presence of these development control regulations’ non-
compliant developments with inadequate provision of public purpose facilities and
utility services have resultant negative effects to the residents living within the Kia
Ng’ombe B’ Zone which include;
Table 5-12: Effects of Development Control Regulations’ Non-Compliance
Effects of development control regulations non-compliance
Percentage ofResidents’ Responses
1. Environmental Degradation 30.82. Vulnerability to Loss of Lives and property 28.23. Congestion 23.04. Inadequacy of Public Purpose Spaces 7.75. Loss of Desirable Neighbourhood Character 7.76. Inadequacy of Parking Spaces 2.6
Total 100.0Source: Field Survey, 2016
5.6.1 Environmental Degradation
The study found out that non-compliance to development control regulations leads to
exacerbated environmental problems which contribute towards making settlements
inhabitable and hence derogating the right of the residents of a clean and healthy
environment as recognized and protected under the Kenyan Constitution (Opata,
Mulongo, Omuterema, Ngetich, 2013). Environmental degradation is considered to be
the greatest resultant effect of development control regulations’ non-compliance with
30.8% of the interviewed residents are experiencing the impacts of environmental
degradation which manifests inform of land, air and water pollution.

93
Plate 5-4: Connected StructuresSource: Fieldwork, 2016
Non-compliance to the recommended solid waste disposal mechanisms is greatly
contributing to land pollution through roadside dumping (as evident by the 2.5% of
the residents whose main mode of solid waste disposal is roadside dumping) and air
pollution through burning of waste by the residents who rely on burning as their main
mechanism of solid waste disposal (5% of the interviewed residents). These forms of
pollution are causing an increase in cases of disease outbreaks and flash flooding
during rainy seasons due to obstruction of drains.
5.6.2 Vulnerability to Loss of Lives and property
The study found out that there has not been incidents of loss of lives or property due
to collapse of development control non-compliant developments however, 28.2% of
the interviewed residents feel that they are vulnerable to loss of lives and property due
to fire outbreak due to the poor state of the developments they reside in. With 27.5%
of the sampled structures being informal developments (either semi-permanent or a
mix of permanent and semi-permanent row housing) which have very low compliance
levels, the occupants feel that the structures are prone to fire outbreaks which may
result to loss of lives and/or property. The lack of buffer areas between developments
(due to non-compliance to side and rear setbacks) leads to fast spread of fire between
developments increasing the number of developments affected by the fire outbreaks
(AAK, 2011).

94Plate 5-6: Non Uniformity Building TypologiesSource: Fieldwork, 2016
5.6.3 Congestion
23% of the interviewed residents cited congestion as the main resultant effect of
development control regulations’ non-compliance. The congestion is as a result of
non-compliance to plot coverage, building line and setbacks. With limited space for
movement and circulation within and around the development due to either
inadequate provision of setbacks and building line or ‘beacon to beacon’ form of
development, congestion of people within the development arises (Dissanayake,
1987). People are unable to move or carry objects freely within or around the
development due to the narrow nature of the passages between housing units. In
addition, the use of the passages as areas for drying clothes and storage of household
goods makes movement within the developments very difficult.
5.6.4 Loss of Desirable Neighbourhood Character
According to 7.7% of the interviewed residents, Kia Ng’ombe ‘B’ Zone lackscharacter due to the existing structure typology mix (flats, bungalows, agricultural
farms, maisonettes and row housing (some which are semi-permanent)) within the
same zone/neighbourhood resulting to undesirable look of the zone (loss of
aesthetics). This is due to lack of homogeneity/uniformity regarding building
typology and building heights.
Plate 5-5: Narrow PassagesSource: Fieldwork, 2016

95
Plate 5-7: Inadequacy of Open SpacesSource: Fieldwork, 2016
With the character of an area being a pattern that manifests itself in a visual
framework, neighbourhoods/areas with uncoordinated development patterns have
undesirable area character and lack place identity (Taylor, 1997).
5.6.5 Inadequacy of Children Playing Areas
The study found out that 7.7% of the interviewed residents of Kia Ng’ombe ‘B’ Zone
did not have adequate open spaces/children playing areas. As market forces take
centre stage in allocation of urban spaces, developers seek to use land in ways that
make maximum returns to them and hence very few if not none are interested in
provision of public purpose spaces and where they exists developers look for ways to
convert them to other more profitable uses (AAK, 2011).
Inadequacy of the children playing areas is caused by non-compliance to plot
coverage. As more space within a plot is covered by the physical development, less
space is left for public purpose. This results to use of passages, road reserves and
neighbouring undeveloped plots as children playing grounds and open spaces since
majority of the available open spaces are either too small or heavily populated for use
as children playing ground.
5.6.6 Inadequacy of Parking Spaces
2.6% of the residents interviewed also raised concerns on inadequacy of parking
spaces. With more than half (52.5%) of the developments lack parking spaces
entirely, the residents have resulted to use of passages and adjacent roads for parking
resulting to congestion along the passages and the abutting access roads.

96
Plate 5-8: Use of Passages as Parking SpacesSource: Fieldwork, 2016
The inadequacy has been attributed to the non-compliance to the parking space
provision specification occasioned by the quest of developers to maximize profit by
increasing plot coverage of their plots hence negatively affecting parking space
provision as noted by AAK (2011).
5.7 Suggestions on Possible Intervention Measures for the Effective Development
Control Regulations Compliance
The study identified seven main possible intervention measures for ensuring effective
development control regulations’ compliance within Kia Ng’ombe ‘B’ Zone and by
extension Kitengela Town.
Table 5-13: Suggestions of Possible Intervention Measures for Effective
Development Control Regulations’ Compliance
Intervention Measures Percentage of
Residents’
Responses
Percentage of
Developers’
Responses
Development
Control
Officials
Responses
1. Strict Enforcement 48.8 8.3 √
2. Regular Development
Supervisions and Inspections
17.9 41.7 √
3. Public Sensitization 12.8 16.7 √
4. Simplification of the
Development Control Process
7.7 8.3 √

97
5. Listing of Development
Professionals
5.1 -
6. Curbing Corruption 5.1 8.3
7. Revision of Statutory Fees 2.6 16.7
Total 100.0 100.0
Source: Field Survey, 2016
5.7.1 Strict Enforcement of Development Control
48.8% of the interviewed residents and 8.3% of the interviewed developers suggest
that strict enforcement of development control would enhance compliance to
development control regulations. Similarly, the interviewed development control
officials were of the same opinion. Stiffer penalties on offenders would deter
developers from violating development control regulations (Yuen, 2007). This would
help in addressing ignorance among developers.
5.7.2 Regular Development Supervisions and Inspections
41.7% of the interviewed developers, 17.9% of the interviewed residents and the
interviewed development control officials suggested regular development
supervisions and inspections as a way of enhancing development control regulations’
compliance. The development control officials suggested with adequate staffing and
financial resources provision would increase the level of development supervisions
and inspections and hence increase development control regulations’ compliance
level. On the other hand, the developers and residents suggested regular development
supervisions and inspections to boost the level of development applications
submission for evaluation.
5.7.3 Public Sensitization
The study found out that public sensitization was considered as a remedy to low
levels/lack development control awareness level which contribute to development
control regulations non-compliance. 16.7% of the interviewed developers, 12.8% of
the interviewed residents and the interviewed development control officials suggested
adoption of various means of informing the public about the development control
process as well as the development control regulations for each zone. Some of the
suggested means of sensitizing the public include regular workshops, seminars, focus
group discussion and forums. This would change the negative perception the

98
development control process of being a hindrance rather than a means to achieving
sustainable developments (Ogundele, Odewumi and Aigbe, 2011).
5.7.4 Simplification of the Development Control Process
8.3% of the interviewed developers and 7.7% of the interviewed residents suggested
simplification of the development control process as a possible intervention measure
for effective development control regulations’ compliance a suggestion seconded by
the interviewed development control officials. The development control officials
suggested automation of the development application process as a way of reducing
time taken for evaluation of development proposals. This is in agreement with AAK
(2011) who asserts that computerization of development applications submission
improves on the timelines of granting planning decisions and saves applicant time. On
the other hand, the residents and developers suggested the reduction of the number of
the development control agencies as a way of saving time, manpower and resources in
making follow ups of the development applications.
5.7.5 Listing of Development Professionals
With cases of engagement of unqualified professionals in preparation of development
proposals and undertaking of development project implementation, 5.1% of the
interviewed residents suggest that the names and addresses of the qualified
development professionals should be availed to the general public. This would
enhance preparation of development control regulations’ compliant development
proposals as well as effective implementation of development projects through
engagement of qualified professionals in construction works/supervision.
5.7.6 Curbing Corruption
With corruption being one of the main contributors of development control
regulations non-compliance, 8.3% of the interviewed developers and 5.1% of
interviewed residents suggested curbing of corruption among the development control
officials would enhance development control regulations compliance. With stiff jail
penalties or jail terms for rouge officials, there would be fewer cases of granting
development permission to non-compliant development proposals.

99
5.7.7 Revision of Statutory Fees
As a way of enhancing development proposals submission for evaluation and
subsequent advice on possible modification to ensure compliance with the set
development regulations, 16.7% of the interviewed developers and 2.6% of the
interviewed residents suggested downward revision of statutory fees. This would
make the fees more affordable and hence encourage development proposal
submissions.
100
CHAPTER SIX: SUMMARY OF FINDINGS, CONCLUSIONS
AND RECOMMENDATIONS
6.1 Introduction
This chapter presents summary of the findings presented in chapter five and the
conclusions made by the researcher from the findings. In addition, it also presents the
recommendations made by the researcher regarding possible intervention measures
for the effective development control regulations compliance.
6.2 Summary of the Study Findings
The purpose of this study is identification and documentation of development control
tools used to guide and control physical development in Kitengela Town,
investigation of the development control regulations compliance levels, assessment of
factors affecting development control regulations compliance and establishment of the
resultant effects of development control regulations non-compliance. In addition, the
study ought to propose possible intervention measures for the effective development
control regulations compliance.
6.2.1 Development Control Tools for Kitengela Town
The study identified the seven main development control tools used for guiding and
controlling development in Kitengela Town. Two of them (Physical planning Act of
1996 and the Environmental Management and Coordination Act of 1999) are
statutory while five are non-statutory (Physical Planning Handbook, Building Code,
Kitengela/Isinya/Kipeto Integrated Development Plan, Kitengela Zoning Plan and
Registry Index Maps). Currently, the main development control tool for Kitengela
Town is the Kitengela Zoning Plan of 2012. Being a zoning plan, it is considered to
be the main tool of development for orderly and sustainable development (AAK,
2015). The plan has the ability to be used by the various development control
agencies (i.e. Public Health and Public Works/Engineering Departments and NEMA)
due to its safety, public health and environmental considerations. In addition, the plan
provides detailed development control regulations covering all the zones in the whole
town hence making it the most effective development control tool for Kitengela town.

101
6.2.2 Development Control Regulations Compliance Levels in Kia Ng’ombe ‘B’
Zone
The study found out that the overall development control regulations’ compliance
within Kia Ng’ombe ‘B’ Zone in Kitengela Town is slightly above average (at
59.5%). The most adhered development control regulations include plot size and
building height specifications both at 100% compliance while the most violated
include; building line specification (at 25%), side setback (at 25%) and rear setback
(at 32.5%). This low compliance of building line and setback specifications is
common among the high density (low income) residential areas due to the need to
maximize the use to which the plot of land is put (Habitat International, 2000).
6.2.3 Factors Affecting Development Control Regulations Compliance
The study identified eight main factors contributing to development control
regulations non-compliance in Kia Ng’ombe ‘B’ Zone within Kitengela Town which
include high professional and statutory fees, corruption, maximization of available
space, ignorance, lack of public awareness, poverty, complexity of the development
control process and poor enforcement. The study found out that the factors with the
highest level of contribution to development control regulations non-compliance
according to the development control officials are aspiration and aims of developers
to maximise returns from land, ignorance and poor enforcement while the residents
and developers cited high professional and statutory fees, corruption and aspiration
and aims of developers to maximise returns from land contributing to more
approximately 65% of the non-compliance.
These factors are not unique to Kitengela Town since they have been identified in
other studies on development control even though not clearly ranked in terms of their
level of contribution to development control regulations non-compliance. UN Habitat
(1990 a) and AAK, (2010) in their re-assessment of urban planning and development
regulations in African cities identified six of the above factors; high professional fees,
lack of public awareness, poverty, maximization of available space, poor enforcement
and complexity of the development control process due to laxity in evaluating
development applications. Ogundele, Odewumi and Aigbe (2011) on their paper on
challenges and prospects of physical development control in Nigeria identified;
corruption, ignorance, lack of public awareness and poor enforcement while AAK
(2015) in their policy paper on managing building development identified lack of

102
public awareness on development control procedures and poor enforcement. It is
however important to note that there are some factors identified by these studies that
are not considered to contribute to development control regulations non-compliance in
Kia Ng’ombe ‘B’ Zone within Kitengela Town according to the interviewed
respondents. Some of these factors include; lack of physical development plan,
political interference and restrictive planning and planning regulations.
6.2.4 Effects of the Development Control Regulations Non-Compliance
The study found out that non-compliance to development control regulations has a
significant effects on arrangement of physical developments and spaces which
negatively affects the overall urban structure of the zone and by extension Kitengela
Town. This undesired arrangement of physical developments and spaces at both plot
and neighbourhood levels has resultant negative effects on the inhabitants/residents of
the area. Therefore, study identified the six main resultant effects of development
control regulations’ non-compliance within Kia Ng’ombe ‘B’ Zone within Kitengela
Town which include environmental degradation, vulnerability to loss of lives and
property, congestion, inadequacy of open spaces, loss of desirable neighbourhood
character and inadequacy of parking spaces. The effects affecting majority (82%) of
the residents include environmental degradation (pollution), vulnerability to loss of
lives and property and congestion. AAK (2011) on their study on development control
frameworks in Kenya asserts that environmental degradation (pollution) and
vulnerability to loss of lives and property are among the most adverse effects of non-
adherence of urban development control regulations.
6.2.5 Possible Intervention Measures for the Effective Development Control
Regulations Compliance
The study identified seven main possible intervention measures for effective
development regulations’ compliance which include; strict enforcement, regular
development supervisions and inspections, public sensitization, simplification of the
development control process, listing of development professionals, curbing corruption
and revision of statutory fees. These proposals (by interviewed residents, developers
and development control officials) are expected to enhance development control
regulations’ compliance in Kia Ng’ombe ‘B’ Zone within Kitengela Town and by
extension Kajiado County if adopted. The proposals are in line with recommendations
made by AAK (2011) and AAK, (2010) on their studies on development control

103
frameworks in Kenya and re-assessment of urban planning and development
regulations in African cities where they proposed strict enforcement, public
sensitization, simplification of the development control process and regular
development supervisions and inspections as ways of enhancing development control
regulations’. These recommendations have been tested and proven in other countries
that are more advanced in development control like Botswana and Switzerland
6.3 Study Conclusions
The study concludes that local physical development plans such as zoning plans are
the most effective development control tools tool for guiding and controlling
developments in urban centers due to their detailed area/zone specific development
control regulations. However, in their absence, county government planning and
building regulations and gazetted rules and regulations such as building codes and
physical planning handbook can be used as it has been the case in Kitengela Town
before preparation of the town’s zoning plan in 2012.
In relation to development control regulations’ compliance, the study concludes that
the overall compliance level of a zone/neighbourhood is determined by the
compliance level of individual development/buildings. The compliance level of a
zone or neighbourhood is the aggregate of individual developments’ compliance. The
resultant effects of development control regulations’ non-compliance affects both the
occupants of the individual developments as well as the occupants of the
neighbourhood and town at large.
Regarding factors affecting development control regulations’ compliance, the study
concludes there is need for accountability among the development control
stakeholders (policy makers, development control officials, developers and the
general public) for effective development control regulations’ compliance. With
formulation of informed development control policies by the development control
policy makers, strict enforcement of development control by the development control
officials and adequate participation and compliance of development control
regulations by the developers and the public in general, development control
regulations’ compliance would be enhanced.

104
6.4 Recommendations
The study has several recommendations regarding challenges faced in the
development control process. These recommendations act as the possible intervention
measures for the effective development control regulations compliance in Kitengela
Town and other urban centres within the country. They are based on the study
findings and review of the best practice case studies in development control.
6.4.1 Introduction of a Computerized Development Application System and
adoption of One Stop Shop Concept
With complexity of the development control process being one of the key contributor
of development control regulations non-compliance, there is a need to simplify the
development control process. The simplification can be done in two main ways: First,
development control agencies can introduce a computerized development application
system and secondly, location of all development control agencies under one roof.
The computerized development application system would improve on the timelines of
granting planning decisions and save applicant time, manpower and resources. This
would enable online consultations and checks on status of development applications.
This system has been a success in Kigali-Rwanda and the neighbouring County of
Nairobi City which have adopted e-construction permit management system (online
development applications submission) reducing the development application
evaluation time form one month to two weeks and cutting bureaucracy associated
with manual development application submission.
The location of all development control agencies under one roof would enable one
stop development application evaluation and reduce the time and resources associated
with inter-development control agency movement of development applications. This
would to a great extend enhance the level of submission of development application
submission. This concept (one stop shop concept) has been a success in delivery of
public services in Kenya through the famous Huduma Centers. In addition, the
concept has also been adopted by City of Kigali in Rwanda through the web-based
information management system for development permits. This has facilitated access
various services and information from a single location and through integrated service
platforms.

105
6.4.2 Establishment of an E-Consultation Portal for Development Control
With the low of public awareness on the existing development control regulations
among developers, it is important to sensitize the public on the existing development
control regulations for their neighbourhood/zone as well as the importance of
development control regulations compliance. The public sensitization can be
undertaken through regular workshops, seminars, media focus group discussion,
public dialogues, forums and exhibition. In addition, the development control
agencies can introduce online consultation system with the public through
establishment of an e-consultation portal to engage the population on existing
development control regulations and proposed new physical development plans. This
would enhance public participation in formulation of new physical development plans
as well as give the public a clear idea of what they can or cannot build on their land
parcels. This also provides certainty and transparency in the planning system and
makes development control objectives predictable and accountable. This program has
worked in Singapore where government agencies hold public consultations through
media focus group discussion, public dialogues, forums, exhibition and competitions.
The community works with planners in the plan making process with the key goal
being consensus building to create and foster a greater sense of community.
6.4.3 Development of a GIS based Development Control System
As a way of addressing poor development control enforcement, a development control
GIS system can be development to aid in approval and monitoring of developments.
This would be facilitate effective analysis of the appropriateness of planning
applications through provision of data pertaining to planning application (spatial
information with their attributes) for the purpose of administrative functions as well as
for facilitating planning at strategic level. With its powerful capacity for spatial data
management, spatial analysis and visualization, GIS provides planners with tools to
implement their work more efficiently especially with support of the interactive and
user-friendly interface developed to ease the use of the sophisticated system without
the need of advanced technical skill. The system will be able to support planning and
decision-making because it offers relatively quick response to analytical questions and
monitoring issues.
The adoption of a development control GIS system has been a success in Malaysia
where the city of Kuala Lumpur has developed an integrated development control

106
system designed to cover all the necessary work process involved in development
control and approval supported by Geographical Information System (GIS)
application. The developed system has facilitated fast and accurate data retrieval,
spatial information references and data sharing and integration among the various
development control departments/institutions. This has not only facilitated time
saving but also helped minimize workload and reduce the use of paper for the
development control agencies in Kuala Lumpur.
6.4.4 Devolution of Development Control Institutions to the Sub-County Level
In order to address the challenge of poor enforcement as a result of poor development
supervision and inspection, the study recommends devolution of development control
to the sub-county level. This would facilitate thorough and regular development
supervision and inspection due to reduction in the size of the area the development
control officials have to cover. Each of the devolved unit can formulate a timetable
for development supervisions and inspections at on least weekly basis. This has been
successful with some of the development control agencies within the county such as
the public health department which has fully functional offices in each of the sub-
county within Kajiado County. It is however important to note that the devolution has
to be accompanied by adequate budgetary allocations (to the development control kit)
to facilitate hiring of additional development control officials to curb the current
shortfall as well as facilitate purchase, servicing and fuelling of vehicles required for
development supervisions and inspections.
6.4.5 Enforcement of Development Control through Criminal Offence
As the study has found out that a significant number of developers (approximately
10%) violate development control regulations out of ignorance, there is need for strict
enforcement of development control. In this regard, the study recommends
enforcement of development control through criminal offence. Enforcement notices in
writing ought to be served to developers of non-compliant developments stating the
breach of development control, measures and time to be taken to remedy the situation.
The offenders can either be jailed, fined heavily (a significant percentage of the
project cost) or their non-compliant developments can be demolished at their own
cost. This would address the ignorance among developers as well as curb the problem
of unauthorized alteration/change of development proposals during implementation of
development projects.
107
This approach of enforcing development control through criminal offence has worked
in Singapore where development control regulations’ violators are fined of up to
S$10,000 (approximately Kshs 1,000,000) per day for a continuing offence. With
adoption of such high fines for offenders, ignorance among developers would be
effectively dealt with.
6.4.6 Establishment/Empowerment of Neighbourhood/Residents Associations
As a way of increasing public awareness about development control regulations,
supporting development control enforcement and addressing ignorance/impunity
among developers, there is a need for establishment of neighbourhood/resident
associations in area where they do not exist as well as empowering of the existing
ones. The neighbourhood/resident associations can organize for regular workshops,
seminars and focus group discussion where the residents can be sensitized on issues
touching on development control as a way of increasing the level of development
control public awareness.
In addition, through consultation and cooperation with the development control
officials, the neighbourhood/resident associations can used as the preliminary
development control agencies where residents can first submit their development
proposals for evaluation (to check whether they compliance with the set
neighbourhood development control regulations) before submission to the formal
development control agencies. Developers would then be required to get
recommendations letters from their neighbourhood/resident associations to avert any
possible disputes occasioned by implementation of the development projects. This
would ensure that the residents are aware of the proposed developments within their
neighbourhoods as well as aid in monitoring implementation of development projects
within their neighbourhood. In the neighbouring Nairobi City County, neighbourhood
associations are having positive impacts on development control regulations’
compliance especially where they are strong (Karengata, Runda and Kahawa Sukari)
since they enforce policing, zoning plans and the building code.

108
6.4.7 Establishment of an Independent Development Control Oversight
Institution
In order to address corruption associated with development control officials, an
independent institution can be set up for undertaking regular audits of all the existing
developments and the development control officials responsible for granting
development permission or supervising non-compliant developments held
accountable. Developers would be provided with development inspection chart sheet
where the development control officials would record their particulars, the date of
development supervision and the stage of the development project implementation.
This would enhance accountability of the development control officials in regards to
development supervisions and inspections and would be used as a basis for
identifying the development control officials involved in cover-up of implementation
of non-compliant developments. In addition, stiff penalties (fines and jail terms) for
government officials involved in corruption related activities can be established.
This concept of independent oversight institutions has been adopted by the Kenyan
Government in various departments (i.e. Independent Policing Oversight Authority)
to promote accountability though most of these institutions are facing challenges in
regard to staffing. With proper staffing, an independent development control oversight
institution would promote accountability among development control officials and
hence address corruption issues associated with the development control process.
6.4.8 Zone Based Statutory Fee
Due to the different in land values in the different zones of urban centres, it would be
important that the statutory fee would be based on zone’s land value. This would
enhance equity in regards to statutory fee as developers of developments in
areas/zones with high land value would pay more per meter squared than for
developers in areas/zones with lower land value. This would significantly increase the
number of development proposals which are submitted for evaluation due to the
affordability of the statutory fee which is currently a great impediment to submission
of development proposals. Just like the model of paying stamp duty in Kenya where a
percentage of land value (4%) is paid for land transfer, a percentage of land value
depending on a zone can be adopted in determination of statutory fee for development
application.

109
6.4.9 Gazettement and Listing of Registered and Licensed Development
Professionals
As a way of curbing engagement of unqualified development experts, all the
registered and licensed development professionals should be gazetted and the list of
their names and physical addresses be availed to the public either online or as hard
copies displayed at all development control offices. Although most of the professional
registration boards/bodies do gazette their registered and licensed members, most of
these lists are not available to the general public hence the need to provide a platform
for accessing the qualified development professionals. This would enhance
preparation of development control regulations’ compliant development proposals as
well as effective implementation of development projects through engagement of
qualified professionals in construction works/supervision.
6.5 Suggestions for Further Research
Due to the contextual scope of the study, the study was unable to assess the
appropriateness of development control regulations, technical capacity of the
development control agencies and effectiveness of devolution of development control
to the sub-county level. Therefore the study suggest further research on;
i. The appropriateness of the development control regulations
ii. The technical capacity of the development control agencies
iii. Effectiveness of development control devolution to the sub-county level

110
REFERENCES
1. Aguilar, A. and Ward P. (2003), Globalization, regional development and
mega-city expansion in Latin America: Analysing Mexico City‘s peri-urban
hinterland.
2. Ahmed A, and Dinye R.D, (2011), Urbanisation and the Challenges of
Development Controls in Ghana: A Case Study of Wa Township, Journal of
Sustainable Development in Africa (Volume 13, No.7, 2011)
3. Alexander E.R. (2001). A Transaction –Cost Theory of Land Use Planning
and Development Control: Towards the Institutional Analysis of Public
Planning. The Town Planning Review, 72(1), 45-75. Retrieved from
http//www.jstor.org/stable/40111825
4. Architectural Association of Kenya, (2011a): A study on Development
Control Frameworks in Kenya, AAK Nairobi.
5. Architectural Association of Kenya, (2011b): The Role of Built Environment
Practitioners in the Implementation of the Consititution, AAK, Nairobi.
6. Daily Nation (2012b): April 5, 2012, Nation Media Group, Nairobi.
7. DCDM Botswana. (2006). Consultancy services for the Botswana public
officers’ housing fund feasibility study: Feasibility Report. Gaborone: DCDM
Botswana Limited.
8. Desu, M. M. and Raghavarao, D. (1990), Sample Size Methodology, Boston:
Academic Press.
9. Dissanayake L, (1987). Effectiveness of the development control system for
the city of Colombo, Sri Lanka. Working Papers No. 36
10. Gichohi, H. W., 1996, The Ecology of a Truncated Ecosystem - The Athi-
Kapiti Plains. Ph.D. University of Leicester, Leicester.
11. GOK (Government of Kenya), 2001, Population and housing census. Volume
I. Counting our people for development. Population distribution by
administrative areas and urban centres. Ministry of Finance and Planning,
Nairobi, Kenya. 446 pp.
12. Government of Kenya (1986). The Agriculture Act, Cap 318. Nairobi:
Government Printers.
13. Government of Kenya (1987). Building Code. Nairobi: Government Printers.

111
14. Government of Kenya (2000). Environment Management and Coordination
Act, 1999, Nairobi: Government Printers.
15. Government of Kenya (2007). Kenya Vision 2030. Nairobi: Government
Printers.
16. Government of Kenya. (2014), Physical Planning Bill, Nairobi: Government
Printers.
17. Government of Kenya. 2009 Census Results
18. Government of Kenya. The Public Health Act cap of 242, Laws of Kenya.
19. Hall, P. and Pfeiffer, U., Urban future 21: A global agenda for twenty-first
century cities. (Routledge) (2000).
20. Heimlich R.E. and Anderson W.D (2011), Development at the Urban Fringe
and Beyond: Impacts on Agriculture and Rural Land. Economic Research
Service, U.S. Department of Agriculture. Agricultural Economic Report No.
803
21. Joubert, P., 1957. "Geology of the Namanga-Bissel area." Report No. 39,
Geological Survey, Kenya.
22. Kazungu, R., Gitau, J and Gichuru, P. (2011), Planning challenge of Karen
and Ongata-Rongai peripheral locations, 47th ISOCARP Congress 2011
23. Kenya National Bureau of Statistics (2009), Demographic and Healthy Survey
2008/9, CBS, Nairobi.
24. Kimani, Mary (2008). Agricultural Land Management for Sustainable
Development in Rural Kenya. Africa Habitat Review Journal (2) (2008). pp.
100-110.
25. Mace, A. E. (1964), Sample-Size Determination, New York: Reinhold.
26. Maina A.D. (2013). Impacts of Urbanization on Land Use Planning,
Livelihood and Environment in the Nairobi Rural-Urban Fringe, Kenya,
International journal of scientific and technology research volume 2
27. Ministry of Lands, (2008). Physical Planning Handbook. Nairobi: Government
Printers.
28. Ministry of Natural Resources and Wildlife (1966), Geology of Athi Kapiti
plains, Government Printer, Nairobi
29. Mosha, A.C. (1996). The City of Gaborone Botswana: Planning and
management. Ambio, 25 (2), pp.118 – 125.

112
30. Mwangi, L.K. (1988). An Appraisal of Plan Implementation and Development
Control in Nairobi. University of Nairobi. M.A Planning Thesis Nairobi:
Unpublished M.A Planning Thesis.
31. Nkedianye, D. 2004, Testing the attitudinal impact of a conservation tool
outside a protected area: the case for the Kitengela Wildlife Conservation
Lease Programme for Nairobi National Park. MSc. Thesis, University of
Nairobi, Kenya.
32. Obabori A.O, Obiuwevbi D.A. and Olomu J.I. (2007). Development Control
an Important Regulator of Settlement Growth: A Case Study of Ekpoma,
Nigeria. J. Hum. Ecol., 21(4): 285-291 (2007).
33. Odeh, R. E., and Fox, M. (1991), Sample Size Choice: Charts for Experiments
with Linear Models (2nd ed.), New York:Marcel Dekker.
34. Omwenga M. 2010, Nairobi -Emerging Metropolitan Region: Development
Planning and Management Opportunities and Challenges, Nairobi
Metropolitan Region, 46th ISOCARP Congress 2010.
35. Opata .G, Mulongo .L, Omuterema .S, Ngetich .K, (2013), Urban
Environmental Planning and Development Control of Medium Sized Towns in
Kenya. A Case of Eldoret Municipality, Journal of Emerging Trends in
Economics and Management Sciences (JETEMS) 5(3):351-363
36. Opata .G, Mulongo .L, Omuterema .S, Ngetich .K, (2013), Urbanization and
Urban Environmental Development Control Policies and Practices in Kenya,
Research Journal in Organizational Psychology & Educational Studies 2(3)
132-138
37. Owuor S, (2011). Trends and Patterns of Urbanization Process in Kenya. A
Paper Presented at the International Workshop on “The impact on mining on
urbanization and poverty in Africa” Bagamoyo, Tanzania, 25-28 February
2011.
38. Physical planning Department (2012), Kitengela Zoning Plan, Nairobi:
Ministry of Lands
39. Physical planning Department (2013), Ongata Rongai Zoning Plan, Nairobi:
Ministry of Lands
40. Reade E., (1987): British Town and County Planning, Milton Keynes,
Philadelphia, Open University Press.

113
41. Republic of Kenya (2009), Sessional Paper No. 3 of 2009 on National land
Policy, Government Printer, Nairobi
42. Republic of Kenya, (1996): Physical Planning Act Cap 286 of Laws of Kenya,
Government Printer, Nairobi.
43. Republic of Kenya, (2010 a): Constitution of Kenya; Government Printer
44. Republic of Kenya, (2010): Citizen Service Delivery Charter, Ministry of
Lands, Nairobi.
45. Republic of Kenya, (2010b): Statistical Abstract 2010, Kenya National Bureau
of Statistics, Nairobi.
46. Segopa, Jo’Joseph. (2009). Review of Botswana’s Building Standards.
Gaborore: Government Printers.
47. Tacoli, C. (1998). Rural–urban interactions: A guide to the literature.
Environment and Urbanization (10) 1 pp. 147–166.
48. Thompson, M., 2006, Valuing land-use options in the Maasai Mara. ILRI
Report of the 2004 socio-economic survey. ILRI, Nairobi, 40pp.
49. UN Habitat (1999): Re-Assessment of Urban Planning and Development
Regulations in African cities, UN Habitat, Nairobi.
50. UNCHS (UN- Habitat). The state of the world's cities. (Nairobi, Kenya: UN-
Habitat) (2001).
51. UNPD (2008), An Overview of Urbanization, Internal Migration, Population
Distribution and Development in the World, United Nations Secretariat, New
York
52. Wagura N.C. (1996). The Problem of Planning and Need for Development
Control. University of Nairobi. Nairobi: Unpublished B.A. Thesis.
53. Wanjogu A.W. (1996). Poor implementation: Its effects in urban areas.
University of Nairobi, Nairobi: Unpublished B.A Thesis.
54. Yaakup A.B., Johar F., Mohamed M. and Ngah M.C. (2002a). GIS for
Development Control: The Case of City Hall of Kuala Lumpur, Malaysia.
Paper presented at the GIS Conference, Ho Chi Minh City, Viet Nam, October
17-18.

114
APPENDICES
Appendix 1-Developers Questionnaire
University of Nairobi
School of Built Environment
Department of Urban and Regional Planning
Analysis of Development Control Regulations Compliance in Kitengela Town
Declaration: This information is confidential and will only be used for academic purposes.
Date of interview …………………….. Questionnaire number …………………………
Name of interviewer ………………………………………………………………………
DEVELOPERS QUESTIONNAIRE
A. BACKGROUND INFORMATION
1. a) Name of respondent (optional) …………………………………………………………
b) Age of respondent ……………………………….
c) Sex of respondent: i) Male ii) Female
d) Level of education of respondent: i) No education ii) Informal iii) Pre-primary
iv) Primary v) Secondary vi) Tertiary vii) Others (specify) ……………….
2. What is your occupation? ……………………………………………………………
B. DEVELOPMENT
3. What is the nature of your development?
a. Type of development? i. Residential flat ii. Mixed use flat iii. Commercial flat iv.
Row housing v. Maisonette vi. Bungalow vii. Others
(Specify)...........................................................
b. Number of levels/floors? ...............................................
4. What is the size of your land in acres?
………………………………………………………………….
5. What is the approximate cost of your development?
Kshs.......................................................................
6. What is the source of capital for undertaking your development?
a. Own savings
b. Bank loan
c. Micro financial institutions

115
d. Cooperative loan
e. Others (specify) ………………………………………………………..
7. What is the average monthly income from your development?
Kshs…………………………………
C. DEVELOPMENT CONTROL
8. a. Do you have any plan/drawing for your development? Yes No
b. If Yes, which one? …………………………………………………………..………..
c. If No, what guides your development? ……………………………………………..…
…………………………………………………………………………………………
9. Which professionals where involved in preparation of the development
application/proposal and the cost of development application/proposal for each
professional?
Professionals Component Cost
(Kshs)
1.
2.
3.
4.
5.
10. a. Do you have any development approvals for your development? Yes No
b. If Yes, which ones? …………………………………………………………………
………………………………………………………………………………………………
c. If No, why? ……………………………………………………………………………
………………………………………………………………………………………………
………………………………………………………………………………………………
11. When did you get the development application approvals? ……………………..…………
12. What is the total time taken to process your development applications?
………………………..……………………………………………………………………
13. Which institutions/government departments where involved in development application
approval process and the cost of approval at each institution?
Institution/Government Department Component Cost
(Kshs)
1.
2.
3.

116
4.
5.
6.
14. Which development control regulations do you know?
……….……………………………..………...............................…………………………
………………………………………………………….…………………………………
…………………………………………………………………………….………..……
15. What are some of the development control regulations you are uncomfortable with and
why?
……………………………………………………………………………...……………………
…………………………………………………….……………………………………………
…………………………………………………………………………………………………
16. What challenges did you face in getting the development approvals named above?
………………………………………………………………………………………………
………………………………………………………………………………………………
………………………………………………………………………………………………
17. In your opinion, what are the causes of non-compliance to development control
regulations?
………………………………………………………………………………………………
………………………………………………………………………………………………
………………………………………………………………………………………………
………………………………………………………………………………………………
18. In your opinion, what are the effects of non-compliance to development control
regulations? ……….
………………………………………………………………………………………………
………………………………………………………………………………………………
………………………………………………………………………………………………
In your opinion, what are the measures which can be adopted to enhancing development
control regulations in Kitengela town? ………………………………………………..
………………………………………………………………………………………………
…………...…………………………………………………………………………………
Thank you

117
Appendix 2-Interview Schedules
University of Nairobi
Department of Urban and Regional Planning
School of Built Environment
Analysis of Development Control Regulations Compliance in Kitengela Town
Declaration: This information is confidential and will only be used for academic purposes.
INTERVIEW SCHEDULE FOR KAJIADO COUNTY PHYSICAL PLANNER
1. What is the development application process in Kajiado County?
2. What development control tools/instruments were used to guide and control
development before the preparation of the Kitengela Zoning Plan in 2012?
3. What are the set development control regulations for Kia Ng’ombe B zone?
4. What is the general level of development control regulations compliance in
Kitengela town?
5. Compared to other zones in Kitengela Town, what is the development
control regulations compliance level for Kia Ng’ombe ‘B’ Zone and the
reasons behind the compliance level?
6. What are the main factors affecting development control regulations
compliance in Kitengela town in general?
7. What are the effects of the development control regulations compliance
level in Kitengela town to the local population?
8. What do you (as a planning department) do to ensure development control
regulations compliance in Kajiado County in general?
9. What is the rate the success of the planning department in ensuring effective
development control regulations compliance within the county?
10. What do you think can be done to improve the development control
regulations compliance level in Kitengela town and Kajiado County in
general?
Thank you

118
University of Nairobi
Department of Urban and Regional Planning
School of Built Environment
Analysis of Development Control Regulations Compliance in Kitengela Town
Declaration: This information is confidential and will only be used for academic purposes.
INTERVIEW SCHEDULE FOR DIRECTOR OF NEMA KAJIADO COUNTY
1. What is your role in development control?
2. What are the set environmental regulations for Kia Ng’ombe ‘B’ zone within
Kitengela Town?
3. What is the general level of development control regulations compliance in
Kitengela town?
4. What are the main factors affecting development control regulations
compliance in Kitengela town in general?
5. What are the effects of the development control regulations compliance level
in Kitengela town to the environment?
6. What do you (as NEMA) do to ensure development control regulations
compliance in Kajiado County in general?
7. What is the rate the success of NEMA in ensuring effective development
control regulations compliance within the county?
8. What do you think can be done to improve the development control
regulations compliance level in Kitengela town and Kajiado County in
general?
Thank you

119
University of Nairobi
Department of Urban and Regional Planning
School of Built Environment
Analysis of Development Control Regulations Compliance in Kitengela Town
Declaration: This information is confidential and will only be used for academic purposes.
INTERVIEW SCHEDULE FOR PUBLIC HEALTH OFFICER-KAJIADO
EAST SUB COUNTY
1. What is your role in development control?
2. What is the general level of development control regulations compliance in
Kitengela town?
3. What are the main factors affecting development control regulations
compliance in Kitengela town in general?
4. What do you (as Public Health Department) do to ensure development control
regulations compliance in Kajiado County in general?
5. What is the rate the success of the Public Health Department in ensuring
effective development control regulations compliance within the county?
6. What do you think can be done to improve the development control
regulations compliance level in Kitengela town and Kajiado County in
general?
Thank you

120
University of Nairobi
Department of Urban and Regional Planning
School of Built Environment
Analysis of Development Control Regulations Compliance in Kitengela Town
Declaration: This information is confidential and will only be used for academic purposes.
INTERVIEW SCHEDULE FOR PUBLIC WORKS OFFICER/COUNTY
ENGINEER
1. What is your role in development control?
2. What is the general level of development control regulations compliance in
Kitengela town?
3. What are the main factors affecting development control regulations
compliance in Kitengela town in general?
4. What do you (as Public Works/Engineering Department) do to ensure
development control regulations compliance in Kajiado County in general?
5. What is the rate the success of the Public Works/Engineering Department in
ensuring effective development control regulations compliance within the
county?
6. What do you think can be done to improve the development control
regulations compliance level in Kitengela town and Kajiado County in
general?

121
Appendix3-Checklist
University of Nairobi
School of Built Environment
Department of Urban and Regional Planning
Analysis of Development Control Regulations Compliance in Kitengela Town
Item Comments
Land use
Structure type
Size of land
Width of access road
Building height
Plot coverage
Building line
Rear setback
Side setback
Number of parking
spaces
Solid waste disposal
mechanism
Liquid waste disposal
mechanism

122
Appendix 4-Household Questionnaire
University of Nairobi
School of Built Environment
Department of Urban and Regional Planning
Analysis of Development Control Regulations Compliance in Kitengela Town
Declaration: This information is confidential and will only be used for academic purposes.
Date of interview ……………………….. Questionnaire number …………………………
Name of interviewer ………………………………………………………………………
HOUSEHOLD QUESTIONNAIRE
A. BACKGROUND INFORMATION
1. a) Name of respondent (optional) …………………………………………………………
b) Age of respondent ……………………………….
c) Sex of respondent: i) Male ii) Female
d) Level of education of respondent: i) No education ii) Informal iii) Pre-primary
iv) Primary v) Secondary vi) Tertiary vii) Others (specify) ……………….
2. What is your occupation? ......................................................................................................
3. What is your monthly income in kshs?
i) 1-10,000
ii) 10,000-20,000
iii) 20,000-30,000
iv) 30,000-40,000
v) 40,000-50,000
vi) 50,000-100,000
vii) Above 100,000
4. Are you the owner of this housing unit or just a tenant? Owner Tenant

123
B. DEVELOPMENT CONTROL
5. Which development control regulations do you know? ………………………...................
………………………………………………………………………………………………
………..……………………………………………………………………………………
6. a. Have you or any member of your household undertaken a development project? Yes
No
b. If yes, did you apply for development permission? Yes No
7. Which challenges did you face in getting the development approvals named above?
………………………………………………………………………………………………
………………………………………………………………………………………………
………………………………………………………………………………………………
………………………………………………………………………………………………
8. Which department/institution did you have challenges with? …………..…………………
………………………………………………………………………………………………
9. In your opinion, what are the causes of non-compliance to development control
regulations?
………………………………………………………………………………………………
………………………………………………………………………………………………
………………………………………………………………………………………………
………………………………………………………………………………………………
10. In your opinion, what are the effects of non-compliance to development control
regulations?
………………………………………………………………………………………………
………………………………………………………………………………………………
………………………………………………………………………………………………
………………………………………………………………………………………………
11. In your opinion, what are the measures which can be adopted to enhance development
control regulations adherence in Kitengela town?
...……………………………………………………………………………………………
………………………………………………………………………………………………
………………………………………………………………………………………………
………………………………………………………………………………………………
Thank you
Top Related