


Languages
Pages
Legal


•An Overview of Solving
Spatial Problems using
ArcGIS
• Joseph B Bowles
• esri

Objectives
What can you do with spatial analysis?
How to apply analysis to solve spatial problems?
Where can you go next to learn more?

Topics Covered
• Introduction to Spatial Analysis
• Vector Data Analysis and Statistical Modeling
• Raster Data Analysis and Interpolation
• Automating Analysis Workflow
• Take away points
3
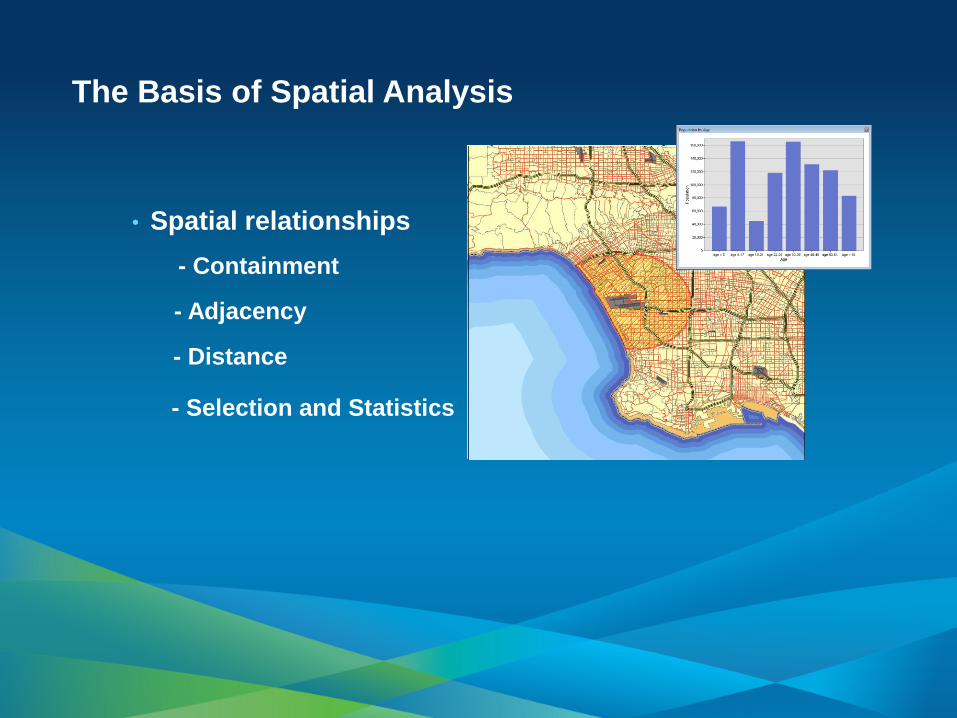
The Basis of Spatial Analysis
• Spatial relationships
Los Angeles is
contained in CA
Hwy 405 is adjacent
to the coast
LAX is 3.2 miles west
off Hwy 105 - Containment
- Adjacency
- Distance
- Selection and Statistics

Frame question
Explore Data
Choose method
Perform analysis
Examine results
Share analysis
The Spatial Analysis Workflow
5
Projection
Accuracy
Scale
Format
Break it down
Audience?
Identify requirements
Automation:
Use models, code
Visually but …
importantly,
statistically
Identify tools
Review question
Common approaches
Data suitable?
Present the results
Share with other
GIS Professionals?
On the web?

The Collaborative Workflow
6
Analysis
To help solve real problems
by real people
GIS Professionals

Tobler's first law of geography
7
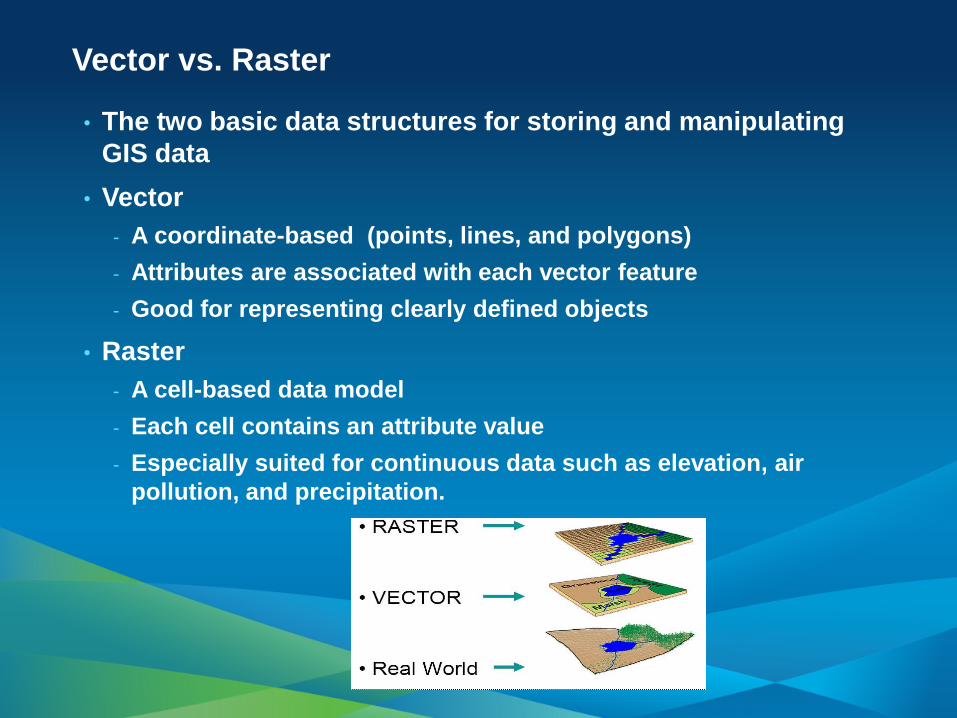
Vector vs. Raster
• The two basic data structures for storing and manipulating
GIS data
• Vector
- A coordinate-based (points, lines, and polygons)
- Attributes are associated with each vector feature
- Good for representing clearly defined objects
• Raster
- A cell-based data model
- Each cell contains an attribute value
- Especially suited for continuous data such as elevation, air
pollution, and precipitation.

Vector Data Analysis and
Statistical Modeling

Solving problems:
• What is inside an idea?
• What is nearby?
• What is the spatial pattern?
• Where are clusters of high and low values?
• How do things move over time?
• Why things occur where they do?
10

What is inside an area?
• Step 1: Frame the question:
- How do gas prices differ in different counties in Southern
California?

What is nearby?
Step 1: Frame the question
− Where is the closest gas stations from each freeway exit?

What is nearby?
Step 2: Explore the data
− Gas station locations

What is nearby?
Step 2: Explore the data
- Freeway exits

What is nearby?
Step 3: Choose a Method
- Create a (1 mile) buffer around freeway and locate gas stations
inside

What is nearby?
Step 3: Choose a Method (within Buffer)

What is nearby?
Step 3: Choose a Method
- Calculate the crow’s flight (Euclidean distance) from each exit with
the Near tool.

What is nearby?
Step 3: Choose a method (crow’s flight)

Third Approach
Use network analysis tools (Closest Facility) that consider street
network

What is the spatial pattern?
Step 1: Frame the question:
- Are there areas where gas stations have similar prices (high or low)?

Where are clusters of high and low values?
Step 1: Frame the question:
- Where are areas with high gas prices and where are areas with low
prices ?

How does spatial pattern change over time?
Step 1: Frame the question:
- When the gas price goes up, do gas stations in different areas
increase the price at the same time?
- If not, which areas are leading the pack? Which areas are trailing
behind and catching up later?

How does spatial pattern change over time?

What contributes to the spatial pattern and by how
much?
Step 1: Frame the question:
- Why the gas price is higher in Beverly Hills than in Pomona ?

Raster Data Analysis and
Interpolation

Raster Data Analysis
• Spatial Analyst - powerful spatial modeling and raster
based spatial analysis features
- How steep is it at this location?
- What direction is this location facing?
- Where is the best location for a new facility?
- What is the least-cost path from A to B?
• GeoStatistical Analyst - data exploration and
interpolation for continuous spatial data
- What are the trends in the data?
- How to estimate values for the whole area based on the
measured samples?
- How confident can I be with the estimation?

Spatial Data Exploration
• Understanding the
data:
- Spatial dependency
- Stationarity
- Data distribution
- Trend
- Outliers
• Tools to prepare data
for analysis

Distance and Proximity Analysis
• Straight line distance
- From the cell to the closest source
• Cost weighted distance
- Modifies distance by a weight or ‘cost’ of travelling
through any given cell
• Shortest path
- Finds the path from a destination point to a source
including by cost
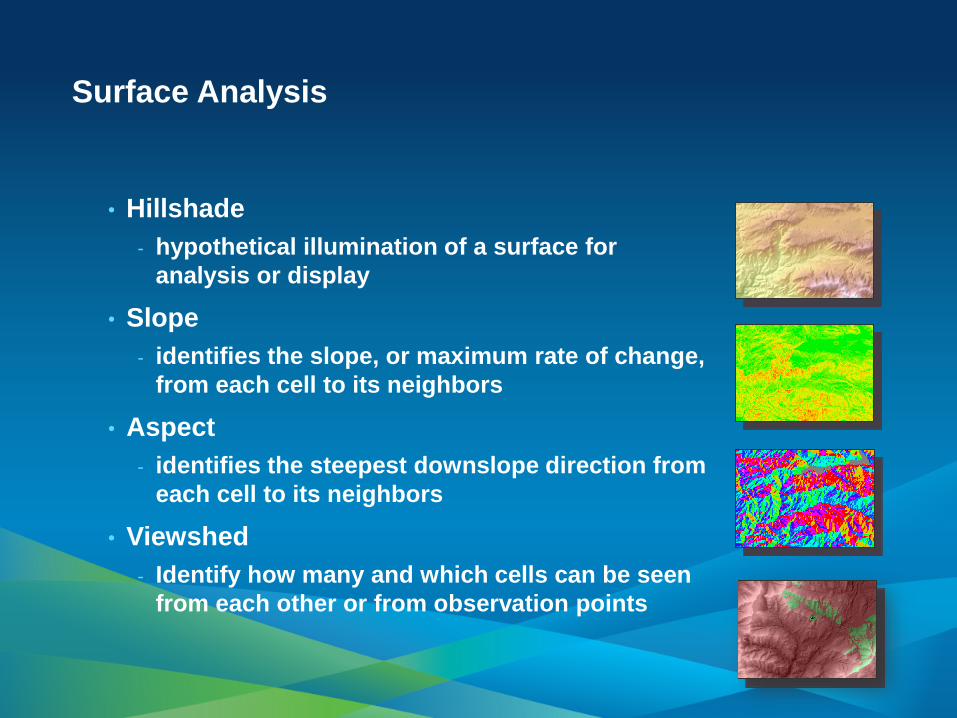
Surface Analysis
• Hillshade
- hypothetical illumination of a surface for
analysis or display
• Slope
- identifies the slope, or maximum rate of change,
from each cell to its neighbors
• Aspect
- identifies the steepest downslope direction from
each cell to its neighbors
• Viewshed
- Identify how many and which cells can be seen
from each other or from observation points

Adding complexity
• Create contours from surfaces
- Contours that honor barriers, faults, and void areas
• Create hydrological surfaces
- Interpolates a hydrologically correct raster surface from
point, line, and polygon data.
30

• Count occurrences of a phenomena within an area and
distribute it through the area
- Show where point or line features are concentrated
- Use points or lines as input
- Population per km
- Road density per mile
Density Analysis
2
2

Suitability Modeling “where is the best place”
Slope
Distance to
Road
Elevation
1 to 5
1 to 5
1 to 5
Weight and add together: New Vineyard = ([Slope] * 0.35) + ([Elevation] * 0.45) + ([Distance] * 0.2)

Statistical Analysis - Interpolation
• From sample points to a continuous surface
33

Interpolation Techniques
• All based to a certain degree on a basic principle of
geography
• Data defines the correct approach:
- All predictions area made from the weighted average of
neighboring points
- The method by which the weights are determined differs
by technique
- Different data assumptions must be met
34

Automating Analysis
Workflow

Automating Analysis Workflow
• ModelBuilder
- Process flow diagram
• Scripting
- Python
• System Languages
- C++, .Net, Java
36

Why Build Models?
• Automate analysis workflow
• Record and document a methodology
• Share analysis knowledge
• Easily communicates what is being done
• Create custom tools
• Aggregate common operations into one tool
37

Take away points…
• Spatial analysis is the true power of GIS. It is our core
competence
• ArcGIS spatial analysis capabilities help advanced users
to do their work better with sophisticated analytical tools
• Being able to share the GIS Analysis online reduces the
learning curve for complex analysis

Features of the Analysis Resources Center
• Features Stories
• Model and script
tools
• Education Gallery
• Blogs
• Forums
• Videos
• Twitter feed

•Creating Geoprocessing
Services

Geoprocessing Services
• The geoprocessing service allows you to publish custom
tools to be used via ArcGIS Server
• Geoprocessing services can be used by many different
client applications
- ArcGIS Desktop
- ArcGIS Engine
- ArcGIS Explorer
- WSDL
- REST
- JavaScript
- FLEX
- Silverlight

Geoprocessing Services
• The service is composed of both the tools and the data
needed by the tools
• Endless array of tasks can be created
- Spatial analysis (vector, raster, network…)
- Data Management (geodatabase, file based data)
- Conversion (ETL and data loading )
• You need to be knowledgeable about using
geoprocessing tools to create a good geoprocessing
service

Geoprocessing Service Behavior
• Geoprocessing Services are very flexible and allow many
different behaviors
• Before Authoring and Publishing, identify what you want
your service to do and how you want it to behave with
clients. Key questions:
- Does the input data come from the client or data on the
server?
- Do you want to draw results with map server or download
and draw data on the client?
- Do you want to save data on the server?

How to create a service
• All services start from a successful result
• The result acts as a template to build the service
Quick Tour of Publishing: http://esriurl.com/gpSrvQuick

Documenting your task
• All tasks must be documented
• Fill out the Item Description
• You can update
metadata specific
to the task you are
publishing inside
the Service Editor
Documenting your service:
http://esriurl.com/gpSrvDoc

Publishing Wizard
• Manages parameter types
• Makes model or script portable
- Fixes paths to data inside model and scripts
• Makes sure data is accessible to the service
- What data is needed is packaged

Analysis and Geoprocessing Resource Center
Quick Links:
Education Gallery: you can find User
Conference presentations here
About the tool gallery: learn all about
the new gallery of geoprocessing tools
and analysis hosted on ArcGIS Online

Landuse Report

Landuse Report Characteristics
• Synchronous
• Inputs: polygon features (area of interest)
• Output: featureclass (attributes used to chart results)
• Project Data: raster

Parameter transformation
• Unsupported parameter types are handled through
publishing
• You can update the Input Mode depending on the parameter
type
• User Defined Value: allows the end user to interactively add
features or enter text and number values
• Choice list: allows the end user to select from a list of layers
already on the server
• Constant value: hard codes the parameter; the end user will
not be able to provide input

Accessing your data
• Data Store tells ArcGIS Server about your data
• Without a Data Store entry, all required data is copied to
the server
• Data Store acts as a lookup table
Update Paths • C:\data\analysis
• SDE: sqlserver:dtuser
• E:\fileShare\gisdata\landAnalysis
• SDE: sqlserver:agsuser
Same Paths • C:\gisdata\projects
• SDE: oracle:sdeuser
• C:\gisdata\projects
• SDE: oracle:sdeuser
Data Store: http://esriurl.com/datastore

What happens during publishing?
• Project data
- Copied if not in data store
- Path updated if registered with the data store
• Output and Intermediate paths
- Changed to scratchFolder and scratchGDB

Multiple Tasks
• Use Add Result to create a service with multiple tasks
• Use Preview to see how the task would appear to a user
consuming the service from ArcMap

Sharing your service
• Make your service discoverable on ArcGIS.com
• Provide good metadata and search tags

Interpolate Lead

Interpolate Lead Service Characteristics
• Asynchronous
• Inputs : Area of interest (provide by a feature set in ArcMap,
or the map extent in a web application)
• Output: Surface (raster)
• Project Data: Points (with observed lead values. These
points are from an enterprise database. A feature service is
used to update the points)

Result Map Service
• A result map service (RMS) provides an alternative way
to get results from the Geoprocessing Service.
• An image is returned to the client.
- The data can still be downloaded.
• Use a RMS when:
- Want better cartography than the client can support
- It is impractical to render a large dataset in a client.
• Execution must be Asynchronous when using a RMS

Synchronous vs. Asynchronous
• Execution mode defines how the application interacts
with the geoprocessing service
• Synchronous
• Application waits until job is
completed and results are
returned
• Application always draws
results
• Appropriate for faster
processing jobs. (<10
seconds)
• Asynchronous
• Application is free to do other
tasks during this time.
• Results are saved on the
server
• Results can be drawn by the
server
• Results can also be
downloaded if desired
• Appropriate for longer
processing jobs.
• Can only use a Result Map
Service with Async.

Creating Script Tools
• Paths and data handled the same as models
• Importing of modules
- First looked in the same folder as source script
- Second the PythonPath is searched
• Output and Intermediate paths
- os.path.join(arcpy.env.scratchFolder, “out.shp”)
- os.path.join(arcpy.env.scratchGDB, “out”)
- In_memory\out

Enhancements at 10.1
• Easier publishing
• Native 64bit
• Dynamic legend in Result Map Service
• Local Jobs Directory
- No longer have to set this. Its automatically used when
server participates in multimachine cluster
• Grid path limit expanded
- Can now use paths of up to 255 characters when working
with grids
• Raster supported in_memory workspace
• Multivalue for all supported parameter types
• Better handling of feature sets in the WebAPIs

Publishing Custom GPFunctions
• Can publish custom GPFunctions: .net, c++, java
• Publishing DOES NOT package the dll
• You have to install the dll on the server machine before
publishing
• Need to build 64 bit or Any compiler
• Need to register separately for server install
- Desktop 32 bit
- Server 64 bit

•Questions

Top Related