


Languages
Pages
Legal


An Introduction to Data and
Information Visualization
Beatriz Sousa Santos, University of Aveiro, 2016
Universidade de Aveiro
Departamento de Electrónica,
Telecomunicações e Informática

Outline of the lectures:
Data and Information Visualization: Introduction
- Data Characteristics
Computer graphics:
- Interactive graphics systems; Primitives and attributes
- Geometric transformations and projections
- Visualization pipeline, visibility, illumination and surface rendering
- Visual Perception
Information Visualization:
- Main issues
- Representations
- Presentation
- Interaction
- Evaluation
2

3
Definition
Objectives
History
Applications
Model
How to obtain and evaluate a Visualization?

6
• Visualization aims at exploring data as to gain a better comprehension of phenomena through the capacities of the Human Visual System
• Which agrees with the purpose of computing in general:
“The purpose of computing is insight not numbers”
(Hamming, 1962)
• We can say:
“The purpose of Visualization is insight not graphics”
Objectives

7
• Intelligence Amplification as opposed to Artificial Intelligence
(Fred Brooks, 1999)
• Visualization may have a significant role in the amplification of human capacities
• Several scientific disciplines contribute to Visualization:
– Computer Graphics
– Human-Computer Interaction
– Software Engineering
– Image Processing
– Signal Processing

9
• Visualization is different from Computer Graphics and Image
Processing since:
1- it deals mainly with multi-dimensional data
( >= 3D, time varying)
2- data transformation is fundamental
(may be changed to increase insight)
3- it is essentially interactive,
(including the user in the process of data creation,
transformation and visualization)
• However, there is some overlap:
– The output of a visualization process is an image
– In general uses much CG
10
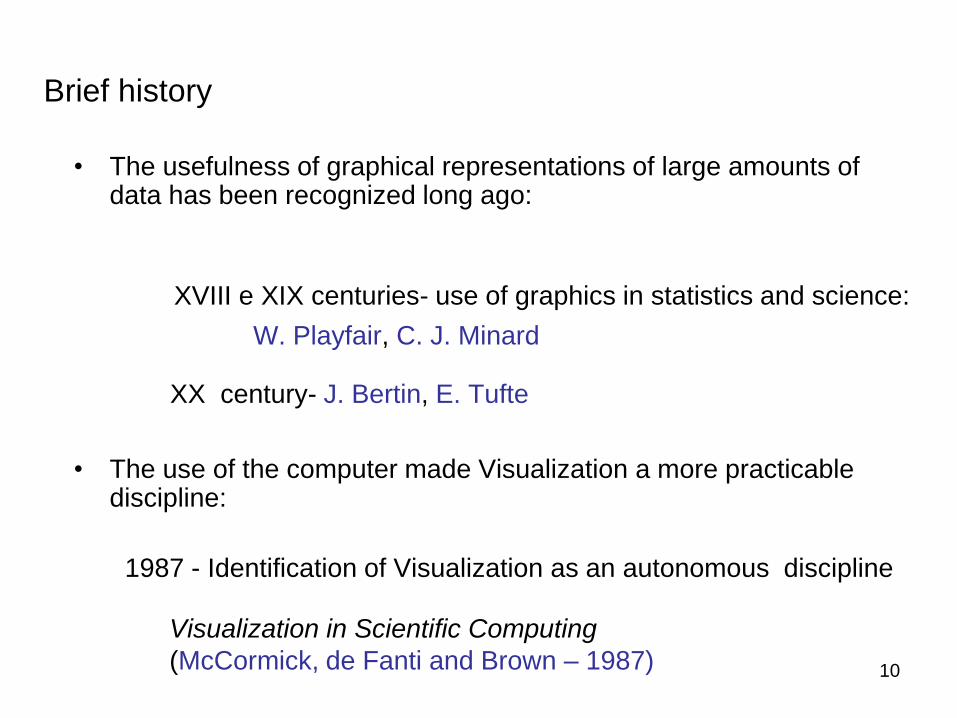
• The usefulness of graphical representations of large amounts of data has been recognized long ago:
XVIII e XIX centuries- use of graphics in statistics and science:
W. Playfair, C. J. Minard
XX century- J. Bertin, E. Tufte
• The use of the computer made Visualization a more practicable discipline:
1987 - Identification of Visualization as an autonomous discipline
Visualization in Scientific Computing
(McCormick, de Fanti and Brown – 1987)
Brief history

12
One of the oldest known Visualizations
Inclination of orbits along the time - Xth century (Tufte,1983)

13
One of the first Visualizations used in “business”
Import/export during the period from1770 to1782
by William Playfair (Tufte, 1983)
One of the first visualizations
using contours (isolines)
Magnetic declination 1701
Edmund Halley (Tufte,1983)

14
Multidimensional Visualization
6 dimensions: place (2), n. of men and direction of the army, date, temperature
Russia campaign of Napoleon 1861 by Charles Minard (Tufte,1983)

15
Visualization in scientific discovery
Discovering the cause of the London cholera out brake, 1853-54
(Wikipedia)
16
Definition
Objectives
History
Applications
Model
How to obtain a Visualization?

17
Applications
• Data Visualization is currently used in many scientific areas:
– Medicine
– Meteorology, climatology, oceanography
– Fluid dynamics
– Cosmology
– etc., etc.
• Let us see some examples …
• Can you think of an area where data visualization cannot be applied?

19
Medicine (e.g. surgery training)
• VOXELman, University of Hamburg
http://www.voxel-man.de/simulator/temposurg/video.html
• Temporal bone surgery
• Movement of the drill is
controlled with a force
feedback device

20
Stereoscopic displays
- dextroscope
- screen
Interaction devices:
- phanton (force feedback)
- touch

22
http://tidesandcurrents.noaa.gov
/sltrends/sltrends.shtml

24
• In general:
Data (scientific) Visualization (DV) - Data having an inherent spatial structure
(e.g., CAT, MR, geophysical, meteorological, fluid dynamics data)
Information Visualization (IV) – Data not having an inherent spatial structure
(e.g., stock exchange , S/W, Web usage patterns, text)
• These designations may be misleading; both DV and IV start with (raw) data and allow to extract information
• Borders between these areas are not well defined, neither it is clear if there is any advantage in separating them (Rhyne, 2003)
Data and Information Visualization

Ground
Penetrating Radar (1999) Tomography
(2004)
Data (Scientific) Visualization (examples “made in UA”)
Tomography
(2008)
Tomography and SPECT
(1996)
Electrical and mechanical
ground resistivity (2010)
Tomography (2011)
Laser scanner (2015)

Web site usage
(UA, 2004)
Information Visualization (examples “made in UA”)
Pedigree trees
(UA, 2011)
Human Migrations
(UA, 2015)
Ranking Visualization
(UA, 2015)
www.portugal-migration.info

28
Botanical Visualization of Huge Hierarchies
Unix Home-directory
Ipod Echosystem
2001
2004
Road traffic between Swedish counties
http://www.Visualcomplexity.com
(http://www.oculusinfo.com/demos.html#)
Stock market
Information Visualization (examples)
competitors
content providers/distributors
technology providers
accessory makers

30
Data
acquisition Data
Computing
Results
User
Hypothesis
Understanding
Framework
(Brodlie et al., 1992)
• Visualization includes not only image production from the data, but also
their transformation and manipulation (if possible their acquisition)
• It is a “human-in-the-loop” problem
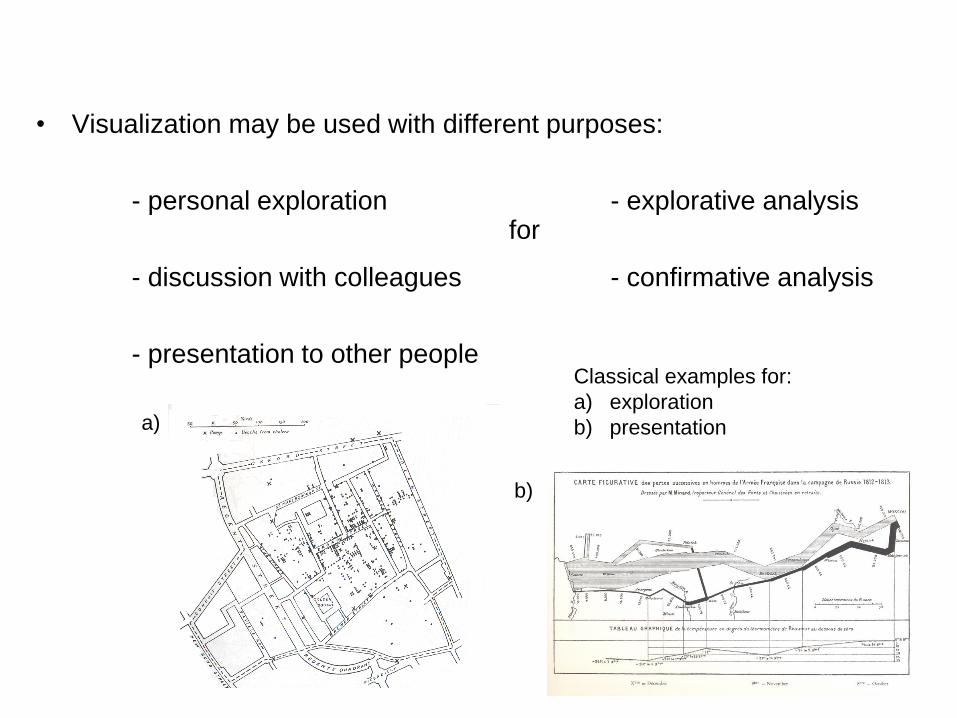
• Visualization may be used with different purposes:
- personal exploration - explorative analysis
- discussion with colleagues - confirmative analysis
- presentation to other people
32
Classical examples for:
a) exploration
b) presentation a)
b)
for
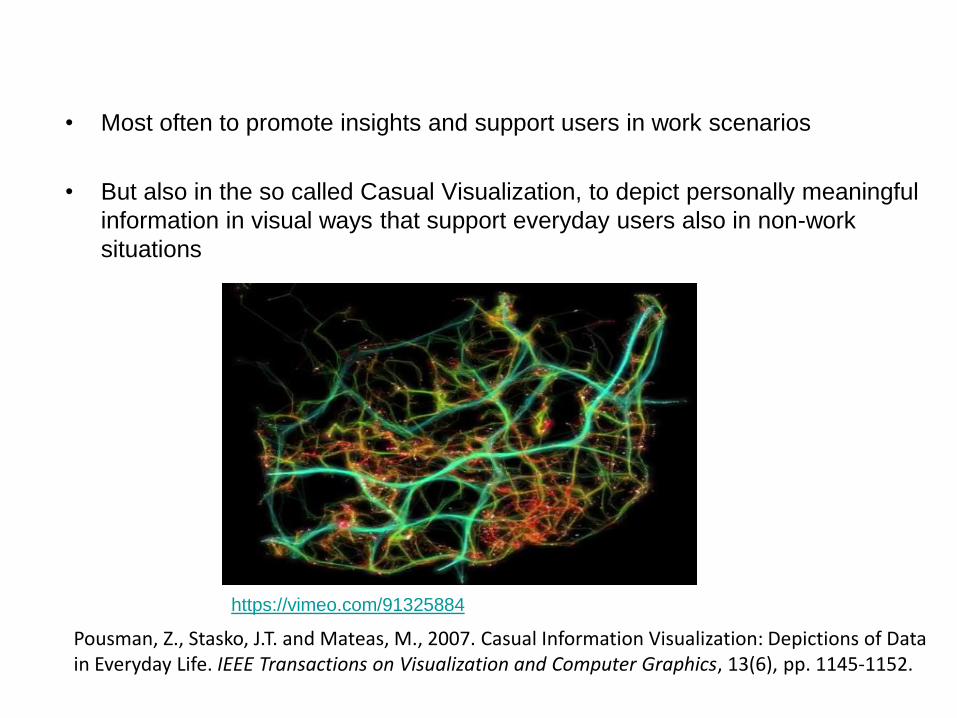
• Most often to promote insights and support users in work scenarios
• But also in the so called Casual Visualization, to depict personally meaningful
information in visual ways that support everyday users also in non-work
situations
https://vimeo.com/91325884
Pousman, Z., Stasko, J.T. and Mateas, M., 2007. Casual Information Visualization: Depictions of Data in Everyday Life. IEEE Transactions on Visualization and Computer Graphics, 13(6), pp. 1145-1152.

Presentation example: World health
34 https://www.youtube.com/watch?v=jbkSRLYSojo

• “The use of computer-supported, interactive, visual representations of data
to amplify cognition” (Card et al., 1999)
• However, it can be used with different meanings:
– the field within Computing
– the representations obtained using methods and systems
35
Visualization: meaning

36
Data Visualization reference model
Measured data:
CAT, MR, ultra-sound
laser Digitizers,
Satellites, …..
Data
Transform Map Display
Visualization technique
Simulated data:
Finite Element
Analysis, Numeric
methods, ……
(adapted from Schroeder et al., 2006)

37
• Then a visualization technique is applied, involving:
- data transformation through several methods
(e.g. noise filtering, outlier elimination, changing resolution, scale
transformation, etc.)
- mapping to an adequate form to representation (e.g. graphic primitives and attributes, color)
- producing an image or sequence of images (rendering)
• This process is repeated as needed to provide insight
• Data can be:
- simulated
(e.g. stress of a mechanical part,
phantom of the human body, etc.)
- measured from real phenomena Visualization technique
map transform display
Data
Simulated
Data
Measured
Data

40
• The choice of the right mapping is
fundamental, and is particularly difficult in InfoVis
• It’s generally easier in Data Visualization, since the data are inherently spatial
• Consider terrain altitude data or values of a function:
- different mappings or abstract visualization objects can be used,
e.g.
- contours (iso-lines)
- pseudo-color
- three-dimensional surface
Patent landscape (Cheng, 2003)
http://www.ipo.gov.uk/informatic-
recycleseparate.pdf

43
Information Visualization Reference Model
Visualization can be described as the mapping of data to visual form
supporting human interaction for visual sense making
(Card et al., 1999)
Raw
data
Data
tables
Visual
structures Views
task
Data
Transformation
Visual
Mappings
View
Transformation
Human interaction

44
(Chi et al., 1998)
General template for visualization applications
(http://www.infovis-wiki.net)
Information visualization application development requires balancing:
- data management
- visual mappings
- computer graphics
- interaction

46
• Visualization is evolving as a scientific discipline:
– It started as a "craft“ - solutions where obtained ad hoc using a few
heuristics
– Then a more scientific phase - researchers started to build
foundations and theories
– It is in an engineering phase - engineers refine theories and try to
establish guidelines
Finally, is becoming common

47
But after all:
– How can we produce a Visualization?
– And evaluate it?

48
• There are no “recipes” to chose adequate Visualization techniques
• There are principles derived form human perception and cognition
• A correct definition of goal is fundamental to efficacy
How can we produce a Visualization?
Reveal shape Analyze structure
(Simulation of an astrophysical phenomenon) (Keller & Keller, 1993)

51
What future?
• Visualization seems to become:
– More 3D
– More interactive
– More beyond desktop
– More accurate
– More intelligent
– More multimodal
– More distributed
– More collaborative
– More mobile
– More remotely controllable
– More web based
– …
– Integrating more other technologies

52
• This course will address:
– Data characteristics
– Representations, presentation and interaction
– The Human Visual System and perception
– Evaluation

InfoVis Books
• Spence, R., Information Visualization, Design for Interaction, 2nd ed., Prentice Hall, 2007
• Munzner, T., Visualization Analysis and Design, A K Peters/CRC Press, 2014
• Mazza, R., Introduction to Information Visualization, Springer, 2009
• Ware, C., Information Visualization, Perception to Design, 2nd ed.,Morgan Kaufmann, 2004
• Card, S., J. Mackinlay, B. Shneiderman, Readings in Information Visualization: Using Vision to Think, Academic Press, 1999
• Bederson, B. , B. Shneiderman, The Craft of Information Visualization: Readings and Reflections, Morgan Kaufmann, 2003
• Tufte, E., The Visual Display of Quantitative Information, Graphics Press, 1983
• Tufte, E., Envisioning Information, Graphics Press, 1990
• Friendly, M., "Milestones in the history of thematic cartography, statistical graphics, and data visualization“, 2008

54
Data Vis Books and reports
• Brodlie, K., L. Carpenter, R. Earnshaw, J. Gallop, R. Hubbold, A. Mumford, C.
Osland, P. Quarendon, Scientific Visualization, Techniques and Applications,
Springer Verlag, 1992
• Hansen, C., C. Jonhson (eds.), The Visualization Handbook, Elsevier, 2005
• Jonhson, C., R. Moorhaed, T. Munzner, H. Pfister, P. Rheingans, T. Yoo,
Visualization Research Challenges, NHI/NSF, January, 2006
• Keller, P., M. Keller, Visual Cues, IEEE Computer Society Press, 1993
• Rosenblum, L., R. Earnshaw, J. Encarnação, H. Hagen, A. Kaufman, S.
Klimenko, G. Nielson, F. Post, D. Thalmannn (eds.), Scientific Visualization,
Advances and Challenges, IEEE Computer Society Press, Academic Press,
1994
• Schroeder, W., K. Martin, B. Lorensen, The Visulization Toolkit- An Object
Oriented Approach to 3D Graphics, 4th ed., Prentice Hall, 2006
• Ward, M. G. Grinstein and D. Keim, Interactive Data Visualization: Foundations,
Techniques, and Applications, A K Peters/CRC Press , 2010

56
Bibliography-papers
• Rhyne, T. M., "Does the Difference between Information and Scientific Visualization Really Matter?“, IEEE Computer Graphics and Applications, May/June, 2003, pp. 6-8
• Rhyne, T. M., “Scientific Visualization in the Next Millennium”, IEEE Computer Graphics and Applications, Jan./Feb., 2002, pp. 20-21
• Hibbard, B., “ Top Ten, Visualization Problems”, SIGGRAPH Computer Graphics Newsletter, VisFiles, May 1999, Vol. 33, N.2
• Johnson, C., “Top Scientific Visualization Research Problems”, IEEE Computer Graphics and Applications: Visualization Viewpoints, July/August, 2004, pp. 13-17
• Eick, S., "Information Visualization at 10," IEEE Computer Graphics and Applications, vol. 25, no. 1, Jan/Feb, 2005, pp. 12-14
• Keefe, D., “Integrating Visualization and Interaction Research to Improve Scientific Workflows”, IEEE Computer Graphics and Applications, vol. 30, no. 2, Mar/April, 2010, pp. 8-13
• Globus, A., E. Raible, “Fourteen Ways to Say Nothing With Scientific Visualization”,
Computer, 27, 7, July 1994, pp. 86-88

57
Interesting links:
• http://www.infovis-wiki.net/
• http://www.visualcomplexity.com/vc/
• http://selection.datavisualization.ch/
Images of the 1rst slide:
S. Silva, B. Sousa Santos, J. Madeira (2012). Exploring different parameters to assess left ventricle global and regional functional analysis from coronary CT angiography. Computer Graphics Forum, vol. 31, n. 1, 146–159.
V. Gonçalves, P. Dias, M. J. Fontoura, R. Moura, and B. Sousa Santos, “Investigating landfill contamination by visualizing geophysical data.,” IEEE Comput. Graph. Appl., vol. 34, no. 1, pp. 16–21, 2014.
P. Dias, L. Neves, D. Santos, C. Coelho, M. T. Ferreira, S. Silv, B. Sousa Santos (2015) “CraMs: Craniometric Analysis Application Using 3D Skull Models,” IEEE Comput. Graph. Appl., vol. 35, no. 6, pp. 11–17.

R. Mazza, Introduction to Information Visualization, 2004 (cap.1)
Top Related