


Languages
Pages
Legal


An example of how the environment may contribute to health disparities:
Estimates of mortality that could be prevented if Interior and Northern
British Columbia had the same air quality as Vancouver
Dr. Catherine Elliott1 and Dr. Ray Copes2 Canadian Public Health Association Conference
June 2008, Halifax, Nova Scotia1Community Medicine, University of British Columbia
2British Columbia Centre for Disease Control, Environmental Health Division
Objectives
• To highlight the concept: environmental health inequity
• To illustrate the differences in ambient fine particulate matter between British Columbia’s Lower Mainland and Interior and Northern communities
• To estimate the mortality attributable to this unequal exposure

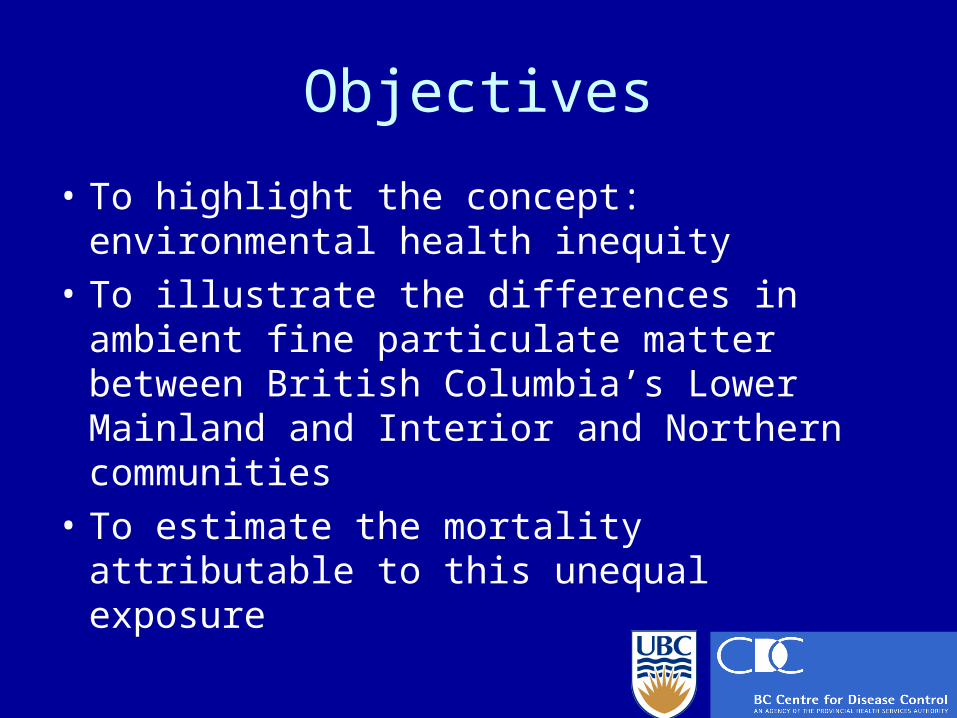
Environmental Health Inequity
• Disproportionately high human health outcomes result from inequitable distribution of environmental hazards.
• Includes physical, chemical, biological pollution as well as the built environment
Northridge et al. AJPH 2003;29(2)
Gee and Payne-Sturges 2004

Fine particulate matter
health outcomes
PM2.5PM2.5PM10PM10
70 70 mm70 70 mm
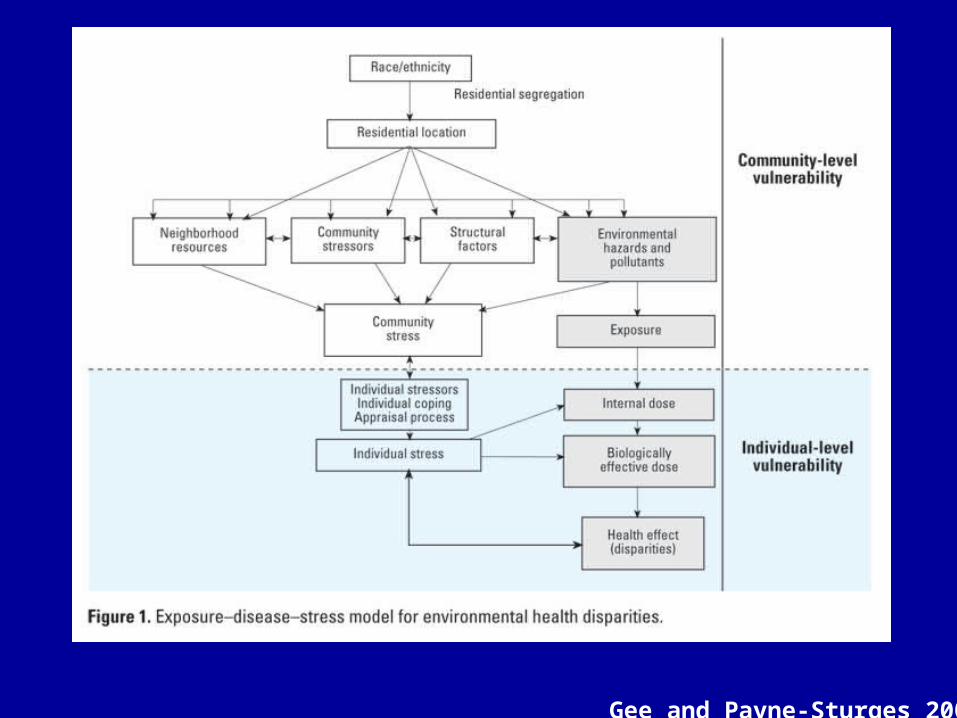
SOURCE: BC Ministry of Water, Land and Air Protection, Air Resources Branch, 2001.
Distribution of fine particulate matter pollution in British Columbia

Mean Annual PM 2.5 in Northern and Interior BC 2001-2005
0 2 4 6 8 10 12
Fort St. John
Kitimat
Terrace
Smithers
Houston
Prince George
Quesnel
Williams Lake
Kamloops
Vernon
Kelowna
Golden
Vancouver
Mean Annual PM 2.5 Concentration 2001-05* (ug/m3)
Methods
• Risk Assessment Approach – to estimate the mortality burden, given the currently available information.
• Mortality attributable to ambient air pollution is estimated based on attributable risk for each increment in PM 2.5 above an a priori low level

Attributable Mortality
• Estimates of attributable mortality are based on:– Measured annual mean PM 2.5 concentration– The reference PM 2.5 that we set– Mortality count in the region– The relationship between mortality and PM
concentration from the literature

Results

Estimated Mortality Attributable to Ambient PM 2.5 above the level in Attainable
(reference exposure level, Vancouver: 5.79 ug/m3)
0 2 4 6 8 10 12
Fort St. John
Kitimat
Terrace
Smithers
Houston
Prince George
Quesnel
Williams Lake
Kamloops
Vernon
Kelowna
Golden
Vancouver
Mean Annual PM 2.5 Concentration 2001-05* (ug/m3)
0 5 10 15 20 25
Prince George
Vernon
Kelowna
Quesnel
Kamloops
Golden
Williams Lake
Houston
Smithers
Fort Saint John
Terrace
Kitimat
Fort Nelson
Estimated Annual Mortality

Estimated Mortality Attributable to Ambient PM 2.5 above Background
(Terrace as the reference exposure level, 3.39 ug/m3)
0 10 20 30 40 50
KelownaPrince George
KamloopsVernon
QuesnelWilliams Lake
GoldenHoustonSmithers
Fort Saint JohnKitimat
Fort NelsonTerrace
Estimated Annual Mortality
0 2 4 6 8 10 12
Fort St. John
Kitimat
Terrace
Smithers
Houston
Prince George
Quesnel
Williams Lake
Kamloops
Vernon
Kelowna
Golden
Vancouver
Mean Annual PM 2.5 Concentration 2001-05* (ug/m3)
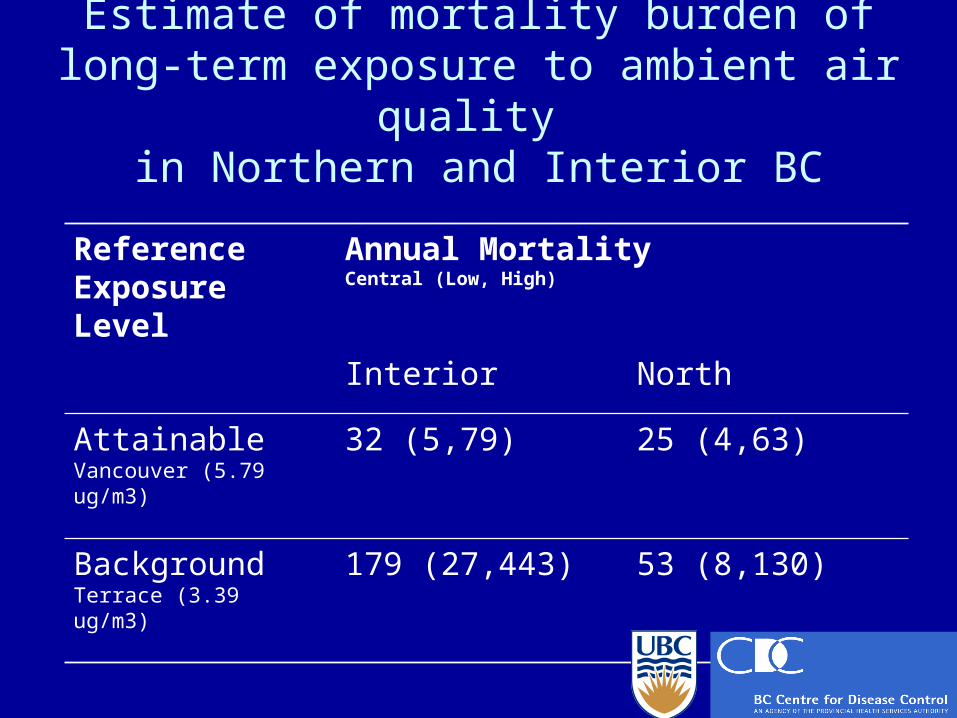
Estimate of mortality burden of long-term exposure to ambient air quality
in Northern and Interior BC
Reference Exposure Level
Annual Mortality Central (Low, High)
Interior North
AttainableVancouver (5.79 ug/m3)
32 (5,79) 25 (4,63)
BackgroundTerrace (3.39 ug/m3)
179 (27,443) 53 (8,130)

Annual mortality attributable to PM2.5 compared with other contributing and immediate causes of death
in Northern Health 2001-2005.
Cause of DeathAnnual Mortality
Air pollution 25 (4,63)
Smoking attributable mortality* 319
Alcohol related mortality 168
Cardiovascular disease 297
Stroke/CVA 82
Chronic Pulmonary Disease 73
Diabetes 61
Drug Induced 57
Influenza and Pneumonia 51* Smoking attributable mortality does not include environmental tobacco smoke (second-hand smoke).

Annual mortality attributable to PM2.5 compared with other contributing and immediate causes of death
in Northern Health 2001-2005.
Cause of DeathAnnual Mortality
Air pollution 32 (5,79)
Smoking attributable mortality* 1217
Alcohol related mortality 463
Cardiovascular disease 1415
Stroke/CVA 437
Chronic Pulmonary Disease 283
Influenza and Pneumonia 228
Diabetes 187
Drug Induced 173* Smoking attributable mortality does not include environmental tobacco smoke (second-hand smoke).

Limitations
• Risk Assessment Methodology: provides an estimate of attributable mortality incremental to the reference PM 2.5 concentration.
• We did not include different susceptibilities to particulate matter in our analysis.

Gee and Payne-Sturges 2004

Conclusion
If ambient air pollution were reduced to Vancouver levels, then approximately 57 (range 9-142) deaths each year in the Northern and Interior Health Authorities would be avoided.
Acknowledgements
Dr. Ray Copes, Scientific Director, Environmental Health, BCCDC NCCEH
Dr. Bob Fisk, BC Ministry of Health
Natalie Suzuki, BC Ministry of the Environment

Questions?

End of presentation

Northern and Interior British Columbia
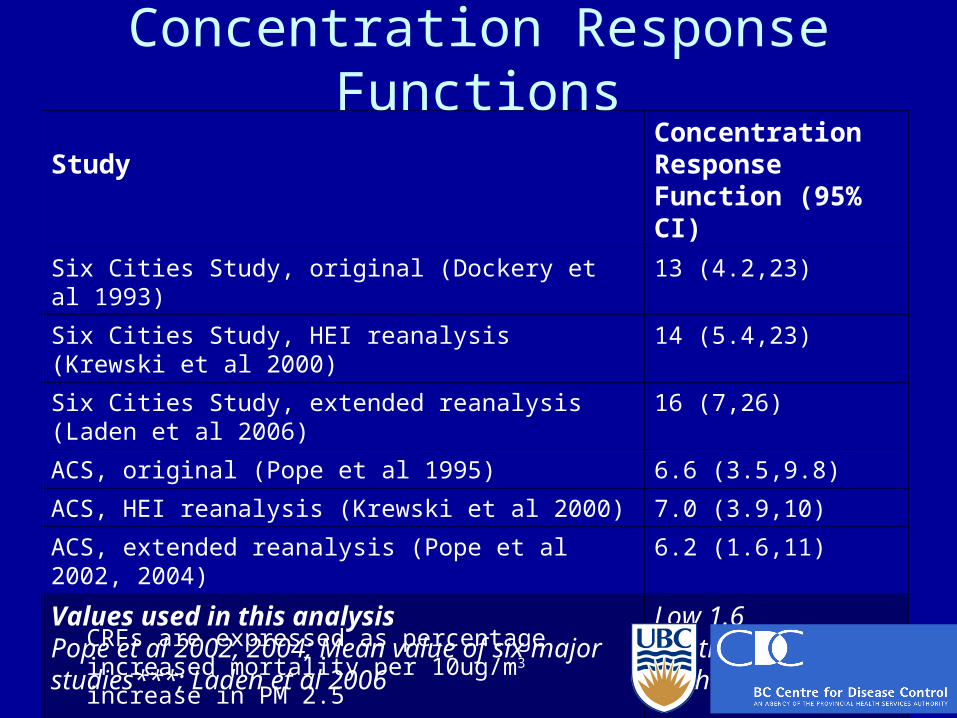
Concentration Response Functions
StudyConcentration Response Function (95% CI)
Six Cities Study, original (Dockery et al 1993) 13 (4.2,23)
Six Cities Study, HEI reanalysis (Krewski et al 2000) 14 (5.4,23)
Six Cities Study, extended reanalysis (Laden et al 2006)
16 (7,26)
ACS, original (Pope et al 1995) 6.6 (3.5,9.8)
ACS, HEI reanalysis (Krewski et al 2000) 7.0 (3.9,10)
ACS, extended reanalysis (Pope et al 2002, 2004) 6.2 (1.6,11)
Values used in this analysisPope et al 2002, 2004; Mean value of six major studies***; Laden et al 2006
Low 1.6Central 10.5High 26
CRFs are expressed as percentage increased mortality per 10ug/m3 increase in PM 2.5

Inversions and trapping

Methods II: Model to derive number of cases
attributable to ambient air pollutionM
ort
alit
y
PM 2.5 (ug/m3)
Concentration Response Function(derived from RR)
Air Quality Standard

Reference exposure level
Measured PM 2.5 level
Number of cases attributable to increase in exposure by 10 ug/m3
PM 2.5 (ug/m3)
Methods II: Model to derive number of cases attributable
to ambient air pollution
A
B
100
104
Mo
rtal
ity
11 21
Top Related