


Languages
Pages
Legal


• AN EVALUATION Of
THE CALIFORN IAPROB,AT~ON SUBSiDY PR GRAiVl
AN EVALUATION OF THE EFFECTS
ON STATE AND LOCAL COSTS OF THE CALIFORNIA PROBATION SUBS1DY PROGRAM
by
Janice Halve
CENTER ON ADMINISTRATION OF CRIMINAL JUSTICE University of California, Davis
SEPTEMBER i975
If you have issues viewing or accessing this file contact us at NCJRS.gov.

•
•
An Evaluation of the California
Probation Subsidy Program
Volume III
AN EVALUATION OF THE EFFECTS ON STATE AND LOCAL COSTS
OF THE CALIFORNIA PROBATION SUBSIDY PROGRAM
by
Janice Holve
LOAN DOCUMENT. "11 RETURN TO: NCJRS P. O. BOX 24036 S. W. POST OFFIce WASHINGTON, D.C. 20024 .
NCJR
JUL 1 1975
Center on Administration of Criminal Justice
University of California, Davis
Edward L. Barrett, Jr. UCD School of Law
Co-Directors
Lloyd D. Musolf Institute of Governmental
Affairs

•
•
AN EVALUATION OF THE EFFECTS ON STATE AND LOCAL COSTS
OF THE CALIFORNIA PROBATION SUBSIDY PROGRAM
Chapter
One:
Two:
Three:
Fou.r:
Table of Contents
The Impact on State Costs
A. Subsequent History
B. Cost Evaluation to Date
C. Career Cost Concept
D. Estimating Commitment Reduction
E. Actual State Costs
F. The Increasing Cost of State Care
Indirect Effects on State Costs
A. California Rehabilitation Center
B. CDC Diagnostic Facilities
C. CYA Diagnostic Facilities
The Impact on County Costs
A. The Cost of Special supervision
B. Some Other Possibilities
C. Some Cost Comparisons
D. Career vs. Annual Cost
E. Trends in Local Costs
Indirect Effects on County Costs
A. Jails
B. Juvenile Camps and Ranches
1
fi
9
14
28
31
33
38
38
48
52
59
61
63
70
72
76
82
82
82

C. Foster Care and Private Institutional Placements 89
D. School Costs and Probation Subsidy 102
E. Welfare Costs 104
Notes:
A. Chapter One 106
B. Chapter Two 108
C. Chapter Three 109
D. Chapter Four 111
•

•
•
AN EVALUATION OF THE CALIFORNIA PROBATION SUBSIDY PROGRAM
Volume I
Volume II
Volume III
Volume IV
Volume V
Volume VI
Commitment Reduction and Probation Subsidy: A Summary of Available Data
by Travis Hirschi and David Rudisill
Offenders in the Community: The Operation of Subsidy in California Counties
by Edwin M. Lemert and Forrest Dill
An Evaluation of the Effects on State and Local Costs of the California Probation Subsidy Program
by Janice Holve
Impact of the California Probation Subsidy Program on the State Correctional System
by Janice Holve and Sheila Smith
Impact of Commitment Reduction on the Recidivism of Offenders
by Floyd Feeney and Travis Hirschi
A Summary
This study was made possible by grants from the National I t'tute of Law Enforcement and Criminal Justice (NI-70-022) 72NI-99-0029 <i2NI-OO-002~S-1), and from the Ford Foundation. The indings and conclusions are, however, solely those of the authors and not necessarily those of the Department o~ Justice or the Foundation.

~ AN EVALUATION OF THE CALIFORNIA PROBATION SUBSIDY PROGRAM
•
Project Staff
Principal Investigators: Floyd Feeney, Travis Hirschi, Edwin M. Lemert
Co-Investigators:
Volume I David Rudisill
Volume II Forrest Dill
Volume III Janice Holve
Volume IV Janice Holve, Sheila Smith
Data Collection Director:
Volume V
Special Contributors:
Programming:
Tom Aceituno Roberta Armoneit Mike Berger Gary Binkerd Clara Bissell Larry Bolton Robert Burnham Robert Campbell Janice Cary Robert Chase Gloria Clifford
Lainda Boosembark Lorraine Gale Carol Loscutoff
Adrianne Weir
Lowell Kuehn, Virginia Netto, Robert Totschek
Michael Spedick
Research Assistants
Lois Franck Kirby Gordon Michael Gottfredson George Graham Ruth Herch William Hight Douglas Hitchcock Patrick Jackson Craig Kubey Karen Landsman Clayton Lloyd
Support Staff
Darleen McNa!T1.er Cindy O'Dell Suesan Wagnon
Barbara Lombardo William Martin Carol Sue Nichols George Norricks John Sewart Ed,lTard Simmons Stephen Teller Pamela Utz Selene Nolf Margaret Zettel
Jacqueline Winegarden Jo Ann White

Acknowledgements
4It Many people have assisted in making this evaluation possible.
•
•
Foremost among these is the California Department of the Youth Authority and its Director, Allen Breed. Without the help and encouragement of the department and the director, the enterprise simply would not have been possible. In a time when much of government has developed a reputation for secrecy and self-serving, the fact that this department has been willing to open its doors and subject itself to critical appraisal by outside, independent, and undoubtedly at times annoying, observers has been both refreshing and worthy of note. Special appreciation is due Keith Griffiths and Dennis Johns, who provided a steady stream of helpful advice and assistance, and to Sheldon Berkowitz, Bea Covey, Robert Craft, George Davis, Lyle Egan, Tom McGee, George Roberts, George Saleeby, and Robert Smith, who assisted in many different ways.
The California Department of Corrections also extended itself greatly to assist with the project" Particular appreciation is extended to former Director Raymond Procunier, and to Lawrence Bennett, Ruth Black, Robert Dickover, and Marie Vida Ryan, each of whom assisted in special and important ways.
Like most other studies of criminal justice in California much of this study would not have been possible without the unique resources provided by the California Bureau of Criminal Statistics. Special appreciation is due the late Ronald Beattie, the Bureau's first Director, the current Director, Willard Hutchins, and Dave Miller, Pete Narloch, and Charlotte Rhea of the Bureau staff. Special appreciation is also due the California Bureau of Identification, particularly Pete Castro, Rolf Owre, and James Rasmussen of its staff.
Among the many probation people who assisted with the project at one stage or another, particular appreciation is due James Callahan, Norman Andresen, Richard Deming, Louis Garcia, Louis Johnson, and Lawrence Townsend, Alameda County; John Davis, Wallace Donavan, James Gray, and Charles Richards, Contra Costa County; Clarence Cabell, Kenneth E. Kirkpatrick, Michael Herring, Calvin Hopkinson, Art Livers, Robert Looper, Thomas Meeks, Harold Muntz, Alfred Parsell, Christine Reeves, Ruth Rushem, William Salstrom, Robert Todd, Rene Topalian, Robert Wells, and Lawrence Yonemura, Los Angeles County; Margaret Grier, Jerry Bush,. David De Young, Don Felton, Jay Hunes, Roger Jones, and Delmar Quackenbush, Orange County; Larry Smith, Riverside County; James Mercer, Warren Thornton, Max Rose, and Ray Roskelley, Sacramento County; Kenneth Fare, Howard Toone, and George Watson, San Diego County; Stewart Smith, La:rry Ferronato, and Harry Mays, San Bernardino County; Warren Jenkins, Ann Billyard, and David Melton, San Francisco County Adul't Probation, and Joseph Botka, San Francisco County Juvenile Probation; Loren Beckley, Ronald Brothers, Robert Ludlovv, l,eAnn Mailey, and Earl Smith, San Mateo County; Richard Bothman, Robert Nino, Lysle Smith, Gary Aquistapace, Roy Clark, Larry Elrod, Thomas Hanna, Kenneth Hines, and

ie
• i
David Lagasse, Santa Clara County; and LeRoy Ford, Yolo County.
Equally helpful were Superior Court Judges Spurgeon Avakian, James Focht, William Hogoboom, Thomas LeSage, Alfred McCourtney, Lloyd Phillips, Jr., John Purchio, Joseph DeCristoforo, and Richard Vaughn; Municipal Court Judges Vincent Erickson, Sheldon Grossfeld, Harry Low and Robert O'Connor; and county and court clerks and administrators George Dickey and Andrew Schultz, Alameda County; Willard Ballenger, Contra Costa County; Clarence Cabell, James DePriest, Ron Johnson, Clark Saito, and Pete Tolmachoff, Los Angeles County; James Arnold and Paul Norbrhyn, Sacramento County; Paul Data and Steve Tampos, San Diego County; and Bruno Fardin, San Francisco County. Edrena Alexander and Larry Mulligan of the Los Angeles District Attorney's staff also provided important assistance at several key points, as did the Sacramento Police Department, and the Alameda, Sacramento, and San Diego County Sheriff's Offices. Numerous other people both in the agencies listed and elsewhere also made important contributions.
Richard McGee, Administrator of the Youth and Adult Corrections Agency at the time the program was proposed, provided important background information on the intent and legislative history, while Robin Lamson, formerly of the Assembly Office of Research, assisted in the early stages of the project.
John Conrad and Bob Burkhart of the National Institute were largely responsible for bringing the project into being, while Ann Sadowsky, Karen Joerg, Kay Harris, George Bohlinger and Cynthia Sulton all made major contributions to the not always easy task of keeping it going •

•
•
An Evaluation of the California
Probation Subsidy Program
Summary and Conclusions
In 1965 the State of California adopted a p."Cogram of state
subsidies to local probation departments designed to reduce com'
mi tments to state correctional facilities. On J'uly 1, 1966, this
program went into effect with 31 of the state's 58 counties--
representing 91 percent of the population--participating. By
1972-73, 47 counties, representing 98 percent of the population
were participating. By the end of 1973-74 the program had been
credited with reducing first admissions to state correctional
agencies by nearly 30,000 cases, and participating counties had
earned subsidies totaling more than 119 million dollars.
The basic idea of the subsidy program was to reduce prison
and juvenile commitments by providing more effective correctional
services in the community, primarily intensive probation super-
vision in small caseloads. The program was seen as accomplishing
several important purposes: reducing state costs hy halting the
spiral of increased commitments and ever greater capital construc
tion budgets, while at the same time providing a greater degree
of rehabilitation and services for the offenders involved.
From the start, the program contained one highly unique,
and ultimately very controversial, feature: payments to the
counties were to be geared wholly to reducing commitments. Coun-
ties failing to reduce commitments would receive no subsidy.
Counties which did reduce commitments" under a state formula for
• making such determinations, would receive a subsidy approximating
$4,000 for each reduction achieved. All subsidies received were
i

to be applied to the creation of intensive supervision programs.
4It Participation in the program was essentially voluntary on the
part of the counties, but the attraction, and sometimes the
pressure, to participate was substantial.
It did not take long for the program to register its impact.
Commitments to the California Youth Authority almost immediately
began to drop and those to the Department of Corrections leveled
off. Richard McGee, long-time head of corrections in California,
spoke of the program "as having greater impact on California
corrections than any program in the last 25 years. 11 Interest
began to be expressed by other states and jurisdictions, and the
program rapidly achieved a reputation as a fresh and promising
new approach to age-old problems. Other observers, however,
particularly in law enforcement and including Los Angeles Police
.4t Chief Edward Davis, came to see the program and the commitment
4t
reduction principle in a very different way--viewing it as one
of the central causes of increasing crime rates in the state.
The program thus became something of a political football, with
charges and countercharges ringing constantly in the press, the
legislature, and in other places where criminal justice is dis-
cussed.
The Evaluation
This evaluation was undertaken to produce answers to five
of the most important questions raised:
--The extent to which the program has actually achieved a
reduction in local commitments to the state agencies.
--The economic impact of the program on both the counties
and the state.
ii

--The changes brought about by the program in county proba
tion departments.
--The changes brought about in the state correctional
agencies.
--The impact on recidivism in the state.
Each of these questions is addressed in a separate volume.
This volume concerns the effects on state and local costs.
Volume III
THE CALIFORNIA PROBATION SUBSIDY PROGRAM:
THE EFFECTS ON STATE AND LOCAL COSTS
by Janice Holve
In California, as in many states, responsibility for correc
tional programs is shared by both state and local government.
The prison system (Department of Corrections) is operated and
financed by the state, as is the institutional and community
treatmenc system that has been developed for caring for the more
serious juvenile offenders (Department of the Youth Authority) .
Parole is a state responsibility, while probation, jails and
other local correctional programs are county functions and are
essentially financed and operated at that level. Most commitments
to the state under 18 years of age go to the Youth Authority and
those over 21 go to the Department of Corrections. The in-between
group may go to either, in the discretion of the sentencing judge.
One of the central purposes of the probation subsidy program
was to save the state money. Whether the program accomplished
this goal and if so what the financial impact of the program on
• the counties was are among the most important questions about
the program. This volume seeks to answer these questions.
iii

Briefly its findings and conclusions are that:
--The only accurate basis for measuring costs is career cost
including recidivism.
--Even after payment of the probation subsidy the state
saved over $60 million in the first six program years
(over $115 million at 1975 prices) .
--The cost of operating the state correctional agencies has
increased but not nearly as much as it would have in the
absence of the subsidy program.
--The probation subsidy program has reduced the impact of
inflation on the state buqget.
--The saving to the state from each additional reduction in
commitments is now over $12,000.
--The counties have fared much more poorly than the state.
--The monies received have by law been spent for intensive
probation supervision--a service not previously provided
by the counties.
--Cases not committed to the state have generated other
costs for which no compensation has been received. The
counties are therefore out-of-pocket these additional
amounts which may total more than $3 million per year
(nearly $5 million at 1975 prices).
--The largest of these costs is due to increased jail incar
ceration of adult offenders.
--In addition, as the cases received have gotten harder, the
monies received by the counties have not only not increased
but have been shrunk by inflation.
--Overa.ll the savings to the state government far exceed the
iv

additional costs to county government.
--Not including capital savings, taxpayers were saved some
$35-45 million in the first six program years or about $6
million per year (about $10 million at 1975 prices).
v

Chapter One
THE IMPACT ON STATE COSTS
The 1964 estimates developed by the California Youth Authority
and Department of Corrections indicated that at then-current rates
at which offenders were being committed to the state, there would
be a need for construction of one new correctional institution each
year for the next ten years. Estimated total construction costs
for these facilities exceeded $90 million, not including allowances
for inflation or other increased costs by the time of projected conI
struction.
Faced with these enormous new expenses, state correctional and
budgetary authorities began to search for less expensive, and hope
fully more effective, alternatives. A study by the California Board
of Corrections suggested that 25 percent of fi~st admissions to the
state could be treated safely within the community. This 25 percent
estimate was made on the basis 6f studies conducted by the CDC-and
the CYA in 1963.
In e:'tttending the preliminary inquiry .•• an analysis was made of all 1963 male new admissions with a view to determining how many cases could have been considered good risks for probation. In using the demographic data available and analysing the 1963 intake by one of the critical base expectancy instruments, it was determined that 20 percent of all new admissions could-be recommended for probation instead of imprisonment. 2
This meant that 1000 of the new CDC admissions were considered good
probation risks on the basis of their base expectancy scores. From
these, officials could expect that not less than 75 percent of the
group would be successful in community supervision situations. How-
ever, this group included a number of men sentenced for violent
crimes and the researchers felt that these cases might not be accepted
-1-

in the community. Consequently, these cases were eliminated.
t\l'hen all of the men with the more violent coromi tment offenses against persons we~e dropped as probation eligibles, this still left 500, or 10%, of the 1963 new admissions that were eligible for probation and were betterthan-avera~e risks for probation even under minimum su-pervision. .
Depending on the standard applied, this data indicated between 10
and 20 percent of the 1963 first admissions were good probation risks
and did not need state institutionalization.
The CYA study results as described in the 1964 study were
similar.
Of 785 Youth Authority first admissions processed during April and May of 1964, 314 cases, or 40%, were judged to be cases that could have been safely handled in the community on probation, providing adequate community services had been available •••.
Clinical staff selected 471 wards, or 60% of the total, as not safe for retention in the community without institutional training. Of the wards selected as safe, 231 were male and 83 were female .•.•
Foster horne placement and psychiatric services were the main rehabilitative needs specified as associated with wards selected for retention in the community. Foster horne placement was often prescribed for the girls, psychiatric care
'for the boys.
When clinical staff judged a ward as not safe for retention in the community, the seriousness of the commitment offense a,nd the negative nature of family support were most often given as the reasons for the judgement ••••
Although somewhat different in its approach, the Youth Authority study supports the contention that a large num-ber of wards now corning into the state correctional facilities could be retained in the community with good probation services if their prerequisite rehabilitative needs, particularly foster honles, psychiatric services, and speciali zed training facilities, were available in the community.4
Extrapolating the results of the two-month CYA study over
the entire year of 1964 indicated that close to 2,000 of the sliqhtly
~ more than 5,500 new admissions could have been kept in the community
if special supervision and adequate closed county facilities had
-2-

existed. Coupled with the estimated 10 to 20 percent of the 5,000
new CDC admissions that had been determined to be safely returnable
to their counties, this made a total of 2,500 to 3,000 probation
eligibles or from 25 to 30 percent of the approximately 10,500 5
combined CYA-CDC first admissions.
The 1964 study then went on to say:
On the basis of these two studies and the information growing out of the earlier studies of diagnostic services, it may be reasonably inferred that at least 25% of the adult and juvenile first admissions to California state correctional facilities can be retained in the community with good probation supervision services.~ •• As Mr. Davis so aptly put it in his article, "There is at present no statistical evidence to suggest that a reasonable increase in the rate of probation will produce a compensating increase in the rate of recidivism. There is probably an upper area where this phenomenon occurs, but it is problematical whether many counties are approaching this saturation point at this time."6
The 1964 study emphasized that improved probation services were
a prerequisite for reducing the state correctional populations and
that from a total cost perspective it was in the state's fiscal self
interest to encourage better local supervision. In certain counties
probation caseloads were too large for effective supervision and
in others the level of expertize in dealing with ca~es was inade-
quate. If the state could find a means of encoura9ing local depart-
ments to improve local service and to keep more offenders in the
community, then the state would save substantial amounts of money
while maintaining a quality correctional system.
The probation subsidy concept addressed itself to most of these
concerns. By giving the county part of the money saved by reducing
commitments to improve probation services, the state could curb the
expansionary trend in state corrections. Importantly, the state
could also save significant sums even after providing the subsidy.
-3-
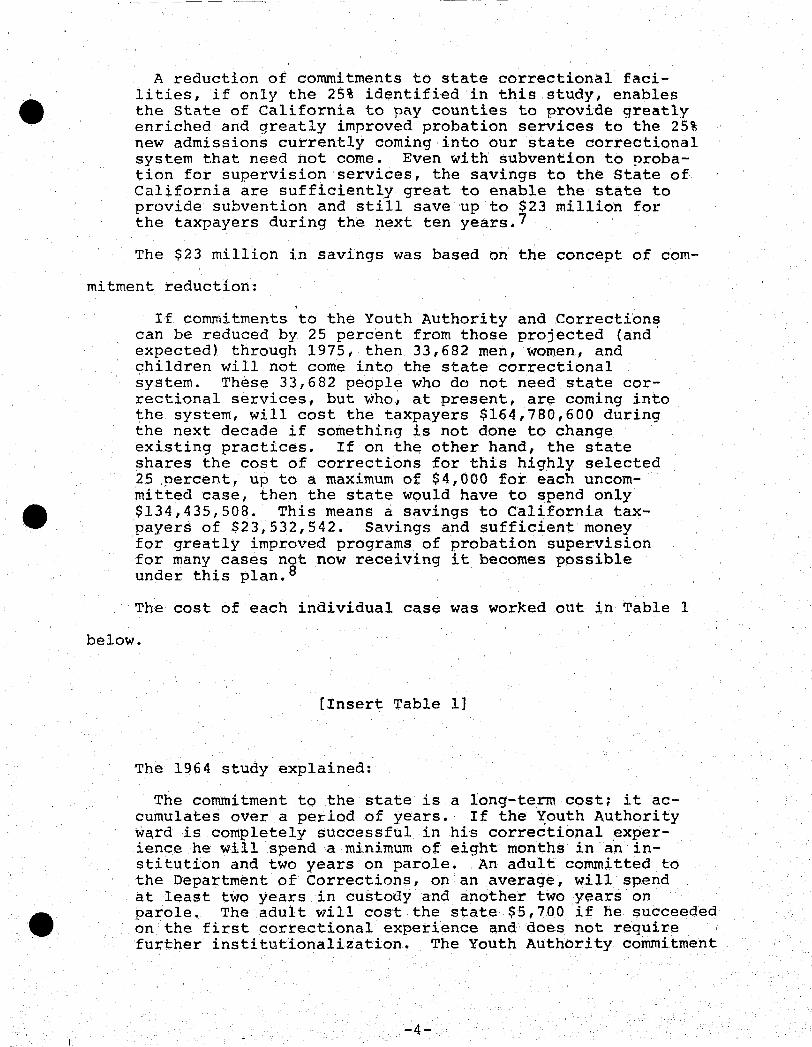
A reduction of commitments to state correctional facilities, if only the 25% identified in this study, enables the state of California to pay counties to provide greatly enriched and greatly improved probation services to the 25% new admissions currently coming into our state correctional system that need not corne. Even with subvention to ~robation for supervision services, the savings to the State of California are sufficiently great to enable the state to provide subvention and still save up to $23 million for the taxpayers during the next ten years.?
The $23 million in savings was based on the concept of com-
mitment reduction: .
If cornnlitments to the Youth Authority and Corrections can be reduced by 25 percent from those projected (and expected) through 1975, then 33,682 men, women, and children will not corne into the state correctional system. These 33,682 people who do not need state correctional services, but who, at present, are corning into the system, will cost the taxpayers $164,780,600 during the next decade if something is not done to change existing practices. If on the other hand, the state shares the cost of corrections for this highly selected 25 percent, up to a maximum of $4,000 for each uncommitted case, then the state would have to spend only $134,435,508. This means a savings to California taxpayers of $23,532,542. Savings and sufficient money for greatly improved programs of probation supervision for many cases not now receiving it becomes possible under this plan. 8
The cost of each individual case was worked out in Table 1
below.
[Insert Table lJ
The 1964 study explained:
The commitment to the state is a long-term cost; it accumulates over a period of years. If the ~outh Authority ward is completely successful in his correctional experience he will spend a minimum of eight months in a·n institution and two years on parole. An adult committed to the Department of Corrections, on an average, will spend at least two years in custody and another two years on parole. The adult will cost the state $5,700 if he succeeded on the first correctional experience and does not require further institutionalization. The Youth Authority commitment
-4-

Table 1
cost to state .for a First Admission "Good Risk" Who Stays slightl~ Less Tha"n the Average Time
In an Instl. tution and on Par"ole
Operations Costs
Institutional cost per year
Time in institution
Institutional cost
Parole costs per year
Time on parole
Parole costs
Total operations cost
Capital Outlay Cost Per Admission
Cost per bed
"Life" of bed
Percent of bed life used by inmate
Pro-rated capital outlay cost/admission
Total cost for each successful new admission
Minimum cost of any new admission to the State
C.Y.A.
$ 4,500
8 months
$ 3,000
$ 300
2 years
$ 600
$ 3,600
$18,000
30 years
2.2%
$ 400
$ 4,000
$4,000
C.D.C.
$ 2,050
2 years
$ 4,100
$ 300
2 years
$ 600
$ 4,700
$15,000
30 years
6.7%
$ 1,000
$ 5,700
Source: California Board of Corrections, Probation Study (1964), p. 181.
-5-

will cost not less than $4,000 if he or she is completely ~uccessful in the training experience. If either the adult or the juvenile violates parole, then the cost to the state will increase by another 30 or 40 percent. 9
A. Subsequent History
On the basis of these projections and the other aspects of
the plan presented, the probation' subsidy program was adopted by 10
the California legislature in 1965. In 1966 the program went
into effect and in the initial year some 31 of the state's 58
counties participated. This number has now grown to 47, including
all of the state's major counties and over 9S percent of the total 11
population. Among other important results that the program has
had is a substantial decline in both the rate and number of com-
mitments to the state correctional institutions. The number of
first commitments to the state institutions for 1960-72 are shown
in Table 2.
[Insert Table 21
The 25 percent reduction in commitments projected by the study
was rapidly reached, and soon surpassed. Table 3 indicates the
average and median decreases in rate of commitment of the partici
pating counties.
[Insert Table 3]
-6-

• Table 2
First Commitments to CYA and CDC
CYA CDC Total
1960-1961 5,263 6,167 11,430
1961-1962 5,151 5,594 10,745
1962-1963 5,371 5,261 10,632
1963-1964 5,593 5,262 10,855
1964-1965 6,061 5,620 11,681
1965-1966 5,371 5,834 11,665
1966-1967 5,177 5,370 10,547
1967-1968 4,713 5,083 9,796
1968-1969 4,588 4,600 9,188
1969-1970 4,201 4,907 9,108
1970-1971 3,441 4,678 8,119
1971-1972 2,925 4,667 7,592
Source: California Department of Finance, Youth Authority and County Representatives, State Aid for Probation Services (1970), Appendix J-4; California Youth Authority, Office of Research, unpublished data.
-7-

•
•
Table 3
Decrease in Rate of Commitment Counties Participating in Probation SUbsidy Program
Average Median (percent) (percent)
1966-67 16.1 36.7
1967-68 25.4 49.0
1968-69 29.3 41.5
1969-70 29.7 35.8
1970-71 38.6 40.9
1971-72 43.4 49.4
Source: Governor of California, Budget Supplement for Health and Welfare, Education 1973-74, p. 447 •
-8-
•
•
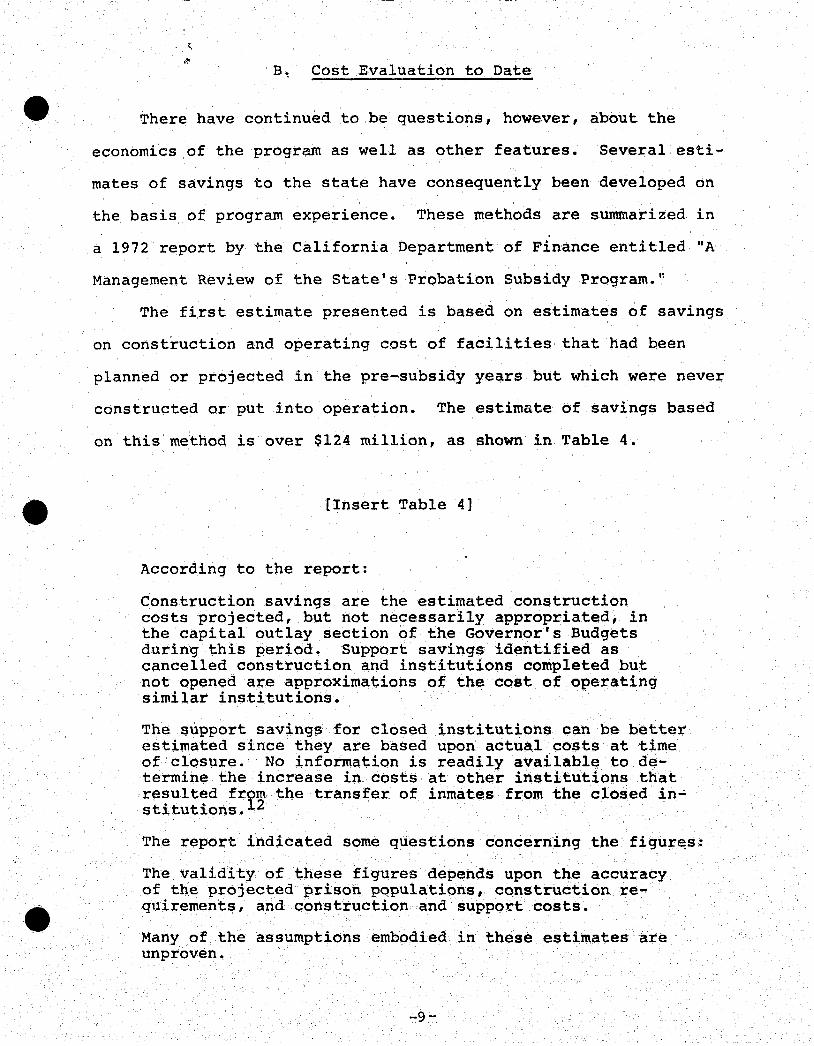
B~ Cost Evaluation to Date
There have continued to be questions, however, about the
economics of the program as well as other features. Several esti-
mates of savings to the state have consequently been developed on
the basis of program experience. These methods are summarized in
a 1972 report by t.he California Department of Finance entitled "A
Management Review of the State's Probation Subsidy Program."
The first estimate presented is based on estimates of savings
on construction and operating cost of facilities that had been
planned or projected in the pre-subsidy years but which were never
constructed or put into operation. The estimate of savings based
on this method is over $124 million, as shown in Table 4.
[Insert Table 4]
According to the report:
Construction savings are the estimated construction costs projected, but not necessarily appropriated, in the capital outlay section of the Governor's Budgets during this period. Support savings identified as cancelled construction and institutions completed but not opened are approximations of the cost of operating similar institutions.
The support savings for closed institutions can be- better estimated since they are based upon actual costs at time of closure. No information is readily available to determine the increase in costs at other institutions that resulted fr£m the transfer of inmates from the closed in~ stitutions. 2
The report indicated some questions concerning the figur~s:
The validity of these figures depends upon the accuracy of the projected prison populations, construction requirements, and construction and support costs •
Many of the assumptions embodied in these estimates are unproven.
-9-

•
Table 4
Estimated State Savin2s (From June 1, 1966 to June 30, 1972)
Annual Cost
Support Savings Due to:
Cancelled construction $22,090,000
Closed institutions 5,302,820
New institutions·not opened 4,700,000
Construction savings
Total $32,092,820
Total subsidy payments
Total savings
Accumulative Cost to June 30, 1972
$ 67,590,000
9,012,820
13,800,000
93,576,000
$183,978,820
59,925,705
$124,053,115
Source: California Department of Finance, A Management Review of the State's Probation Subsidy Program (1972), p. 35.
-10-
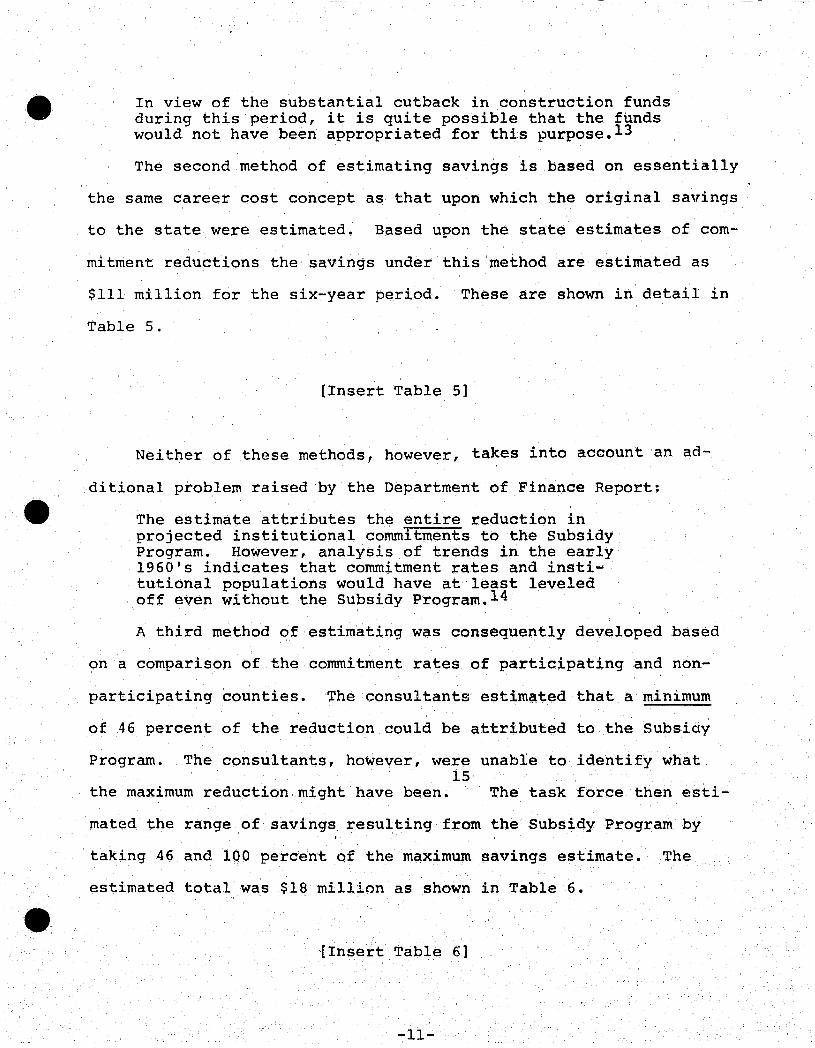
In view of the substantial cutback in construction funds during this period, it is quite possible that the funds would not have been appropriated for this purpose.13
The second method of estimating savings is based on essentially
the same career cost concept as that upon which the original savings
to the state were estimated. Based upon the state estimates of com-
mitment reductions the savings under this method are estimated as
$111 million for the six-year period. These are shown in detail in
Table 5.
[Insert Table 5]
Neither of these methods, however, takes into account an ad-
ditional problem raised by the Department of Finance Report:
The estimate attributes the entire reduction in projected institutional commitments to the Subsidy Program. However, analysis of trends in the early 1960's indicates that commitment rates and institutional populations would have at'least leveled off even without the Subsidy Program. 14
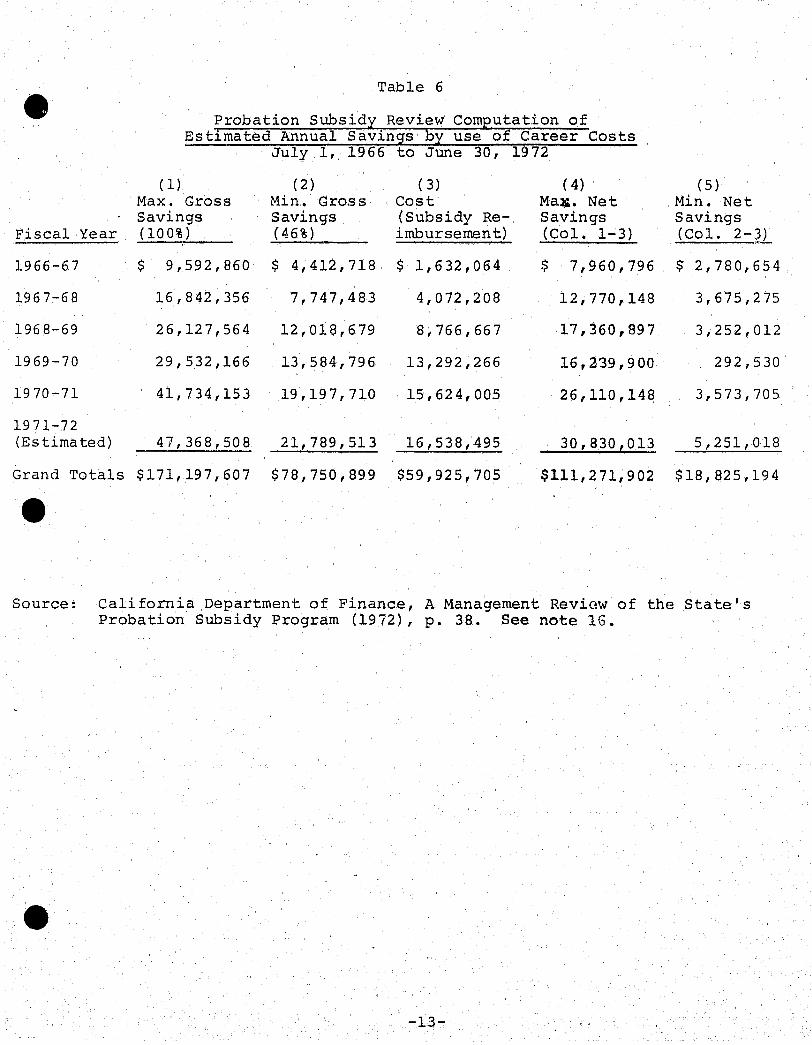
A third method of estimating was consequently developed based
on a comparison of the commitment rates of participating and non-
participating counties. The consultants estimated that a minimum
of 46 percent of the reduction could be attributed to the Subsiciy
Program. The consultants, however, were unable to identify what 15
the maximum reduction might have been. The task force then esti-
mated the range of savings resulting from the Subsidy Program by
taking 46 and 100 percent of the maximum savings estimate. The
estimated total was $18 million as shown in Table 6.
{Insert Table 6]
-11-

e Table~ e Probation Subsidy Review Computation of Estimated Savings by use of Career Costs
CYA
1966/67 F.Y. 1967/68 F.Y. 1968/69 F.Y. 1969/70 F. Y . 1970/71 F.Y. 3/ 1971/72 F.Y.-
Totals
Reduction in Number of Conunitmerits
460 1,194 1,432 1,793 2,542 3,107
10,528
CDC {Department of Corrections
1966/67 F.Y. 1967/68 F.·Y. 1968/69 F.Y. 1969/70 F.Y. 1970/71 F. Y. 3/ 1971/72 F.Y.-
Totals
Grand Totals
938 1,222 1,887 1,764 1,953 2,070
9,834
20,362
Career Costs,!/
$ 4,541 .5,123 5,727 6,362 7,594 7,594
$ 8,000 8,777 9,500
10,275 11,485 11,485
Deduct Costs - State Reimbursement1/
Estimated net savings--six-year period
Extension
$ 2,088,860 6,116,862 8,201,064
11,407,066 19,303,948 23,594,558
$ 70,712,358
$ 7,504,000 10,725,494 17,926,500 18,125,100 22,430,205 23,773,950
$100,485,249
$171,197,607
Computation of Savings (Based upon allowing credit to
Probation Subsidy in the amount of)
46%~/ 100% ----~~-------
$78,750,899 $171,197,607
59,925,705 59,925,705
$18,825,194 $111,271,902
17Career-costs-computed by CYA for juveniles and by Department of Finance for adults. 2/Source, Probation Subsidy Report (1970 Joint Study, Department of Finance & CYA) pg. 20 and Appendix G. 3/Estimated--current information not available. !/Actua1 costs for first five years plus estimated for 1971-72 F.Y. (same as used by CYA).
Source: California Department of Finance, A Management Review of the State's Probation Subsidy program (1972), p. 41.
Fiscal Year
1966-67
1967-68
1968-69
1969-70
1970-71
1971-72 (Estima ted)
Table 6
Probation Subsidy Review Computat.ion of Estimated Annual Savings by use of Career Costs
July 1, 1966 to June 30, 1972
( 1) (2 ) ( 3) ( 4) Max. Gross Min. Gross Cost Mal.'. Net Savings Savings (Subsidy Re- Savings (100%) (46%) imbursernen t) (Col. 1-3)
$ 9,592,860 $ 4,412,718 $ 1,632,064 $ 7,960,796
16,842,356 7,747,483 4,072,208 12,770,148
26,127,564 12,018,679 8,766,667 17,360,897
29,532,166 13,584,796 13,292,266 16,239,900
41,734,153 19,197,710 15,624,005 26,110,148
47,368,508 21,789,513 16,538,495 30,830,013
(5) Min. Net Savings (Col. 2-3)
~ ... .:...:-
$ 2,780,654
3,675,275
3,252,012
292,530
3,573,705
5,251,018
Grand Totals $171,197,607 $78,750,899 $59,925,705 $111,271,902 $18,825,194
Source: California Department of Finance, A Management Reviaw of the State's Probation Subsidy Program (1972), p. 38. See note 16.
-13-

C. The Career Cost Concept
The career cost concept used in the 1964 study and in several
of the subsequent estimates was an attempt to define the cost to
the state government of caring for a commitment to the state. This
cost was seen as including the cost of (1) any institutionalization
and (2) any parole involved. This was worked out in terms of the
annual cost of caring for one person for the particular service
multiplied by the average lengths of time served by offenders in
the two different kinds of care. An additional amount was added
to the total based on the capital costs of the institutional fa
cilities amortized over an estimated lifespan (in this case 30
years) .
All of the figures used are subject to further examination.
This can be seen most easily in the case of the capital costs.
Arguably, lifespan should be calculated at 20 or 40 years instead
of 30: 20 because the times are changing rapidly and facilities be
come outmoded~ 40 because that more closely approximates the time
that many facilities have remained in use. Similarly, one can argue
whether the capital component of cost should be based on original
construction cost, present value, or replacement cost either at the
present or at some future contemplated replacement time. Each of
these figures will be different, and the highest will be quite dif
ferent from the lowest. Even current construction costs differ
greatly by the type of facility. For example, CYA facilities in the
planning stage at the time of the 1964 study ranged from $12,350 per
bed for a projected boys camp to $37,500 per bed for a girls training.
-14-

school. And compared with the $18,000 cost per bed used in the
1964 study, the average projected cost at 1964 prices for the more
than 2,000 beds in the then-projected building program was $23,600 17
per bed.
There are also some questions concerning the operating cost
components of the career cost computation. The 1964 career cost
estimates were based on the cost of the units responsible for in-
stitutions and the units responsible for parole divided by the
number of offenders under the jurisdiction of the particular units 18
involved. The estimates as computed, however, did not include
any cost allocations for the higher level administrative parts of
the agencies. If these had been included, the average cost would 19
have increased about five percent.
An even more important complication in analyzing the 1964
cost questions involved in the probation subsidy program is the
fact that the cost of each case is d{fferent. Approximately 16
percent of the CYA cases in 1964, for example, were paroled to the 20
street almost immediately. Others stayed many months or years
longer than the eight months institutional stay upon which the
study estimates were based.' A commitment reduction from the direct
parole caseS might save only a few hundred dollars. A reduction
of the cases involving extended institutional care on the other
hand might save many thousands.
The key question in terms of state costs is how the cost of
the commitment reduction cases compares with the $4,000 which t~le
state pays the counties for making commitment reductions.
Unfortunately it is not possible to answer this question
-15-

directly. Once the subsidy program is underway there is no way
of identifying the specific cases which become commitment reduc-
tions and even if there were there is no way of knowing what the
cost of handling these cases by the state would be.
The best available method for comparing the cost of handling
the commitment reductions cases at the state level with the $4,000
figure is therefore necessarily based on an analysis of the cost 21
of handling the state correctional population prior to subsidy.
This method is quite different from that used in the Depart-
ment of Finance study shown in Table 5. That study estimates
career costs by multiplying the number of commitment reductions
for each year by the estimate for career costs for the same year.
Thus, in 1969-70 there were an estimated 1764 commitment reductions
for CDC while the estimated career cost for a CDC case committed
in 1969-70 was $10,275. Based on these figures the gross savings 22
is estimated as over $18 million. Since the CDC career costs
incr~ase dramatically over the period under study--from $5,700 in
1964 to $11,485 in 1970-7l--this m~thod has the apparent virtue
of taking into account the increasing state cost of handling com
~itments.
It ignores the fact, however, that the commitment reductions
which are being valued are reductions from the commitment level
which existed in the pre-subsidy period.
If the kind of case going into the state correctional system
now is considerably more difficult than that going in in 1964, as
many observers believe, then the Department of Finance method of
tit estimate increasingly overvalues the savings to the state of
-16-

•
-------
commitment reductions. The current career cos~ may be appropriate
as a measure of the increasing cost of cases handled by the state,
and therefore the savings represented by one additional commitment
reduction, but is not appropriate as a basis for measuring the total
number of reductions. (The issue here is the kind of case involved
not whether its cost should be valued in 1964 or 1972 dollars.)
Even from the perspective of 1964, however, there are a number
of p~ob1ems in estimating the impact of the subsidy program. The
1964 Board of Corrections study projected commitment reductions
equal to 25 percent of the new admissions to the state system. Its
cost projections, however, appear to have been based on lengths of
stay calculated from the total correctional populations rather than
from data specific to the populations which it expected to become
commitment reductions.
Because of this and other limitations on available data, it
is not possible to describe accurately the proportion of low cost
to high cost cases in the earlier state correctional population
(the marginal cost curve for the state). It is conceivable that
the population consisted of a large portion of cases with handling
costs less than $4,000. In such an event the state could be paying
out more in subsidy payments than it is avoiding.in state costs.
One theoretical possibility along these lines is set forth in Table
7.
[Insert Table 7)
On the other hand it is also possible, as illustrated in
Figure 1, that the great majority of the cases cost about the same
-17-

- ---~-------
Table 7
One Theoretical Distribution of state costs
cost }2er case Number of Cases Total cost
$ 2,500 100 $ 250,000
3,000 500 1,500,000
6,000 60 360,000
9,000 50 450,000
11;000 40 440,000
Total 750 $3,000,000
Average cost $4,000
Average cost first 80 percent of cases--$2,900
•
• -18--

•
to handle and that the state therefore reaches the point at which
it saves as much as pays out very quickly. Still a third possi-
bi1ity is that costs start low and progress gradually but steadily
upward.
[Insert Figure 1J
It is not really possible to determine which of these possi-
bi1ities is the case. What information there is, however, suggests
that there is considerable variability in the lengths of stay in-
vo1ved and, since that is one of the prime determinants of cost,
this in turn suggests considerable variability in the cost of in-
dividua1 cases. In 1963, for example, one CYA institution had a
mean lenqth of stay of 6.7 months while another averaged 12.4 23
months.
This may not be too important, however. As the number of
comntitment reductions increases, the length of stay that these
cases would have required if they had been committed to the state
presumably increases also. The average length of stay attributable
to these cases thus becomes closer to the overall average (and the
base from which the $4,000 figure was calculated). Since the rate
of commitment reduction is now estimated at more than 40 percent
of the number of commitments that might have been expected in the
absence of the subsidy program, it seems safe to say that the
average length of stay for the commitment reduction kind of case
is close to that upon which the original calculations were based.
Indeed it seems possible, given the proportion of commitment
reductions, that the average length of stay in 1964 for the kind
-19-
24

--- --.
Figure 1
Another Theoretical Distribution of State costs
~ 1J6000 o . . ~
E ~ II '1.000 ~:\:~ L;-~.;"i' o~o - -
(.)
o--------------------------------------------------------~;>~ +
-20-

of case now being treated locally would exceed the averages used
4It in the original computations. This is particularly true in that
the lengths of stay used in calculating the original $4,000 figure
were not the average figures for the CYA and CDC, but were in fact
less than the average for first commitments. Thus, the table
which set forth these costs was titled, "cost to state for a first
admission 'good risk' who stays slightly less than the average
time in an institution and on parole." The figures used in the
computation are compared in Table R with the averages given in the
departmental reports for the year.
[Insert Table 8]
Thus far in this paper it has been more or less assumed that
the cases which are the safest to handle in the community are also
the ones which would be the cheapest for the state to handle as
commitments. This is not .necessarily true, however. The CYA in-
stitution, for example, with the longest average length of stay
in 1963 was not the one with the most dangerous cases but rather 25
the one with the youngest. As a group, however, it is probably
true that the safest cases are also the cheapest. It will be as-
sumed consequently for the purposes of this study that the cheapest
cases are the first to become commitment reductions.
The question of recidivism costs is even more complicated.
It seems clear that in any true cost sense that the cost of behavior
resulting in additional institutionalization, additional payole or
4It both is a cost to the state.
The study authors recognized the fact that recidivism was a
-21-

Table 8
Comparison of -?\verage Lengths of Stay
Board of Corrections Annual Reports Computation 1963
Time in institution--CYA 8 months 8.7 months
--CDC 2 years 29.4 months*
Time on parole --CYA 2 years 24.9 months**
--CDC 2 years 24 months**
*Including discharge cases.
**Median rather than average.
Source: CYA, Annual Statistical Report--1967, p. 25; CDC, California Prisoners, 1961, 1962, and 1963, pp. 100, lID, 132.
-22-

factor in the state cost but did not include such a cost in the
$4,000 estimate. The authors did, however, indica,te that if such
costs were included that the total might be increased by as much 26
as 30 to 40 percent. No calculations to this effect were in-
eluded in the study.
The question is an important one because half or more of the
1963-1964 cases involved some costs beyond those of initial institu-27
tiona1ization and initial parole. These cases include among
others both those cases with new offenses and new commitments to
the state and those returned to institutions on the basis of a
parole violation not involving a new offense.
One way to view the relationship between these cases and the
probation subsidy program is to consider that no case involving
any additional costs is a commitment reduction until all cases which
do not involve such costs have become commitment reductions. That
is, to assume that commitment reductions occur in some ordered
sequence, starting with the least recidivist cases and proceeding
to the more recidivist cases. Under this assumption the kind of ,
case that was discharged in 1964 without violation would be assumed
to be the first group that would not be sent to the state under the
subsidy program. Such an assumption might be justified on the ground
that this is the way in which the program is intended to work.
This assumption was not the assumption made by the authors of
the 1964 study, however. Their calculations indicated that the
group thought to be safely releasable to the community had about a 28
65 percent chance of finishing parole successfully. In effect,
they recognized that while it is possible after the fact to identify
those individuals with a successful probation or parole record that
-23-

the task of identifying them in advance is much harder. Since the·
commitment reduction determination is in effect made at the time
of sentencing, the advance perspective seems the more appropriate
for analyzing the cost effects of commitment reductions.
The cost of cases in which there is some return to institu-
tionalization is obviously the cost of the first stay plus the time
on parole plus the cost of the second stay plus the second time on
parole and so forth as below:
Time in institution + time on parole + time in institution + time on parole, etc. to discharge.
If the cases not committed to CYA are as successful as the
1964 study projected, they could be expected to have a failure
rate of about 35 percent. Considering the fact that over 60 per
cent of all CYA cases in 1964 and 1965 had violations of some kind,
a failure rate of 35 percent for the commitment reductions does 29
not seem unduly pessimistic or unrealistic. Based on CYA figures
over two-thirds of the violators would likely be returned to CYA 30
institutions. The remaining one-third could be expected to be
discharged--often, however, because in CDC or some other custody.
No specific data is available concerning the length of time served
by violators upon return. The average length of stay computations,
however, include returns. If the same eight month length of stay
as that used in th~ 1964 study to calculate time to first release is
assumed, the average cost of a case returned to the institution in
terms of the 1964 study figure is $7,850. If the one-third of the
violation cases which are discharged rather than returned to an in-
stitution are taken into account as costing no more than a success
ful case, the average cost for a repeat case would be $5,677. This
-24-
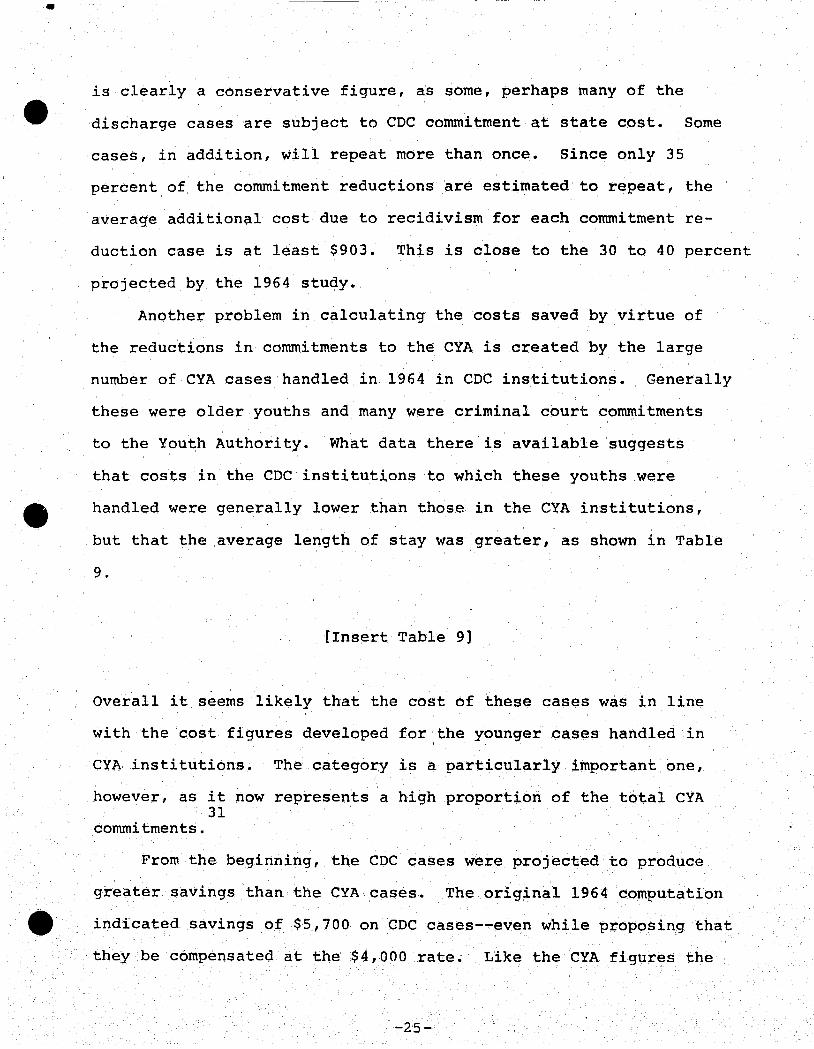
is clearly a conservative figure, as some, perhaps many of the
discharge cases are subject to CDC commitment at state cost. Some
cases, in addition, will repeat more than once. Since only 35
percent of the commitment reductions are estimated to repeat, the
average additional cost due to recidivism for each commitment re-
duction case is at least $903. This is close to the 30 to 40 percent
projected by the 1964 study.
Another problem in calculating the costs saved by virtue of
the reductions in commitments to the CYA is created by the large
number of CYA cases handled in 1964 in CDC institutions. Generally
these were older youths and many were criminal court commitments
to the Youth Authority. What data there is available suggests
that costs in the CDC institutions to which these youths were
handled were generally lower than those in the CYA institutions,
but that the average length of stay was greater, as shown in Table
9.
[Insert Table 9]
Overall it seems likely that the cost of these cases was in line
with the cost figures developed for ,the younger cases handled in
CYA institutions. The category is a particularly important one,
however, as it now represents a high proportion of the total CYA 31
commitments.
From the beginning, the CDC cases were projected to produce
greater savings than the CYA cases. The original 1964 computation
indicated savings of $5,700 on CDC cases--even while proposing that
they be compensated at the $4,000 rate. Like the CYA figures the
-25-

Table 9
Comparison of Wards Handled in CYA Institutions With Wards Handled in CDC Institutions
CYA CDC
Cost per year $3,060 $2,417
Average length of stay 9.0 months 13.4 months
Source: CYA, Annual Statistical Report, 1967, p. 25; California Budget, FY 1964-65, p. 121 (Deuel Vocational Institution, 1963-64) .
-26-
-------

..
•
CDC length of stay figures used in these computations were shorter
than those for the department as a whole (24 months of institutional
stay as opposed to 30), thus making it likely that the state break-
even point would be reached very early in the commitment reduction 32
process. Although no specific figures are available, it seems
likely that for CDC cases the $4,000 figure is reached almost im
mediately, and that the $5,700 figure used in the 1964 study is
safely I or more tl\an safely, reached as an average figure exclusive
of recidivism costs.
The recidivism cost for CDC cases based on data and assumptions
similar to those used in the CYA calculations is $1,817. The re-
cidivism estimate for CDC cases is based on an assumed return 33
rate of 30 percent. (The overall rate for 1963 was 49.9 percent.)
The median institution time served on return was 25 .• 7 months and 34
the median parole time was 24 months.
The bonc1usion from the analysis in this section is that the
cost in 1964 of handling the kinds of cases that have now become
commitment reductions was at least the amounts indicated in the
1964 Board of Corrections study. While the marginal costs of in-
dividual cases cannot be determined from available data, the num-
ber of cases has become sufficiently great that the lengths of stay
used can be safely taken as minimum averages for the commitment re
ductions as a group. In addition in order to reflect accurately
the true cost of handling these cases at the state level, the cost
of recidivism and repeat behavior must be included as a part of the
total cost.
Based on these concepts a revised estimate for probation sub
sidy savings to the state is shown in Table 10.
-27-

..
Since counties are required to reimburse the state at the
rate of $25 per month for institutionalized juvenile commitments,
the effect cost to the state is reduced by the total amount of 35
these payments. As the $4,000 estimated cost that was computed
for the 1964 study was based on an average length of stay of eight
months, the repayment would amount to $200.
[Insert Table 10]
These savings are calculated in terms of 1964 dollars. If
adjusted for the amount of inflation to the year in which they
accrue, the total value of the savings would be about $77 million.
This estimate of savings is based on the costs avoided by the
4It state because of cases not committed minus the payments made by
the state to the counties under the probation subsidy program.
Counties are paid under the probation subsidy program, however,
only for monies expended under an approved plan. Because of this
and some lag time involved in getting county programs under way,
counties actually earned about $24 million more than the $59 mil-36
lion which the state paid out. If the estimate of state savings
is based on county earnings rather than payments, the total savings
are $40,296,630, or about $49 million if adjusted for inflation.
D. Estimating Commitment Reductions
Obviously this estimate, as those made by the state, depends
almost wholly upon an accurate determination of the number of com-
4It mitment r~ductions. The principal method used thus far for makinq
these determinations has been that which was developed in the subsidy
-28-

Table 10
Estimated Savings By Use of Career Costs
July 1, 1966 to June 30, 1972
Reduction In Number of Commi tmen ts Career Costs
CYA 10,528 $3,800
CYA Recidivism 10,528 903
CYA Total 10,528 $ 4,703
CDC 9,834 $5,700
CDC Recidivism 9,834 1,817
CDC Total 9,834 $7,517
• Grand Total 20,362
Deduct costs--State reimbursement payments
Estimated net savings--six-year period
-29-
Extension
$ 40,006,400
9,506,784
$ 49,513,184
$ 56,053,800
17,868,378
$ 73,922,178
$123,435,362
59,925,705
$ 63,509,657

formula itself. This method is in essence based on comparinq
current commitments with the number that might be expected from
the average during certain pre-subsidy years. This method, as
any method for making the determinations, presents a number of
complicated statistical issues. These are the subject of another
study in this evaluation which has not yet been completed. This
paper will consequently use the state estimates of commitment re-
ductions.
There is a further point about the number of commitment re-
ductions which was made by the Department of Finance in its cost
evaluations of the program. This has to do with the question of
whether the subsidy program is the cause of whatever commitment
reductions there have been or whether those reductions are attri-
butable to some other cause, such as an increasing tendency on the
part of judges to grant probation or to be unfavorable to prison 37
commitments.
This subject is also being looked into in greater detail in
another portion of this evaluation, and no results of that study
are yet available. Some examination should be given, however, to
the, implied assumptions of the question posed. That assumption
would seem to be that to the extent that there are commitment re-
ductions but that these reductions are due to factors not brought
about by the probation subsidy program that the state should bear
no responsibility for the cost shift involved in the change. This
obviously is a pos~ible, and perhaps a correct, conclusion. In
states which have traditional state-county splits for correctional
costs, however, it would seem likely that major changes in the
pattern of these traditional splits are likely to be issues whether
-30-

tied to a specific program change or not.
E. Actual State Costs
Thus to the three estimates of savings developed in the state
reports a fourth has been added.
[Insert Table 11]
Each of these estimates is in excess of the original pro
jection of $23 million savings by 1975.
Given these more or less universal estimates of cost savings,
one logical question is what happened to the state correctional
costs during this period. This is indicated in Table 12.
[Insert Table 12]
The state correctional budget, including the amounts spent
for subsidy, for this period increased about 70 percent. This in
crease was only 33 percent, however, if controlled for inflation,
and only 20 percent if controlled for both population and inflation.
In a time of rising crime, increasing concern about prisons and
intense cost pressure on services, and particularly public services,
the fact that the increases have been held to this amount is a
solid indica'tion of the favorable cost impact of the probation sub
sidy program on the state correctional budget.
It does not necessarily follow from this, however, that the
,tit state has been able to realize fully the total amount of the savings.
How and when potential savings are actually realized depends a great
-31-

•
Table 11
Estimates of Savings
July 1, 1966 to June 30, 1972
Operating and construction savings estimate
Career cost estimate
Proportional care~r cost estimate
Career cost estimate with recidivism (payments)
Career cost estimate with recidivism (earnings)
Source: Tables 4, 5, 6, and 10 .
-32-.
$122 million
111 million
18 million
63 million
40 million

and the organizations involved become better able to plan for
these changes in a rational way.
Given these more or less universal estimates of cost savings,
one logical question is what happened to the state correctional
costs during this period. This is indicated in Table 12.
[Insert Table 12]
The state correctional budget, including the amounts spent
for subsidy, increased about 70 percent between 1965 and 1970-71.
This increase was only 33 percent, however, if controlled for
inflation, and only 20 percent if controlled for both population
and inflation. In a time of rising crime, increasing concern about
prisons and intense cost pressure on services, and particularly
public services, the fact that the increases have been held to
this amount is a solid indication of the favorable cost impact
of the probation subsidy program on the state correctional budget.
F. The Increasing Cost of State Care
As the counties retain the more readily treatable cases, the
low cost units from the state's perspective are removed. It would
be expected consequently that the cost of the remaining cases would
be higher--thus pushing the average cost upward. This effect can
be seen in the increasing value of the career cost estimates for
CYA and CDC cases: as shown in Table 13.
[Insert Table 13 here]
A substantial part of this increase is due to inflation. Part
4It is also due to the method of calculating the increasing career cost.
Part is also due no doubt to the inevitable time lag involved in
, I
-33-

Table 12
State Correctional A2encies Non-Capital Expenditures (In millions of dollars)
Total* in CYA CDC Total* 1967 Dollars
1963-64 $25.8 $61.1 $86.9 $94.6
1964-65 28.3 67.3 95.6 102.2
1965-66 32.4 74.5 106.9 112. O·
1966-67 39.6 79.6 119.2 122.5
1967-68 46.7 82.4 129.1 129.1
1968-69 53.2 89.2 142.4 136.8
1969-70 61.1 98.5 159.6 146.0
1970-71 67.8 103.5 171. 3 149.1
*Inc1udes probation subsidy payments to counties.
Source: Governor of California, Annual Budgets.
-34-

Table 13
Career Costs
Fiscal Year CYA CDC
1963-64 $4,000 $ 5,600
1966-67 4,541 8,000
1967-68 5,123 8,777
1968-69 5,727 9,500
1969-70 6,362 10,275
1970-71 7,594 11,485
1971-72 (estimated) 7,594 11,485
Source: See Table 5.
-35-

•
bringing institutional costs into line with reduced populations
(the state cost function discussed in the last section). Part,
however, is due to increasing average lengths of stay, as shown in
Table 14.
[Insert Table 14 here]
These have been attributed by state officials to a tougher,
more violent population. Thus the 1973-74 budget statement for
the Department of Corrections indicated:
The profile of the inmate population has changed significantly in recent years. The drop in population from 28,600 in 1969 to today's 19,200 leaves a tougher, more volatile individual in prison ..•. 38
While these figures are based on the average cost throughout
the whole system, they nevertpeless suggest that the present
marginal saving for an additional commitment reduction is con-
siderably above that of the original $4,000.
G. Conclusion
The principal conclusion of this chapter is that the proba-
tion subsidy program has resulted in substantial cost savings to
the state of California and that the amount of this saving is
still increasing. The effect of inflation is to increase the
state's savings even more .
-36-
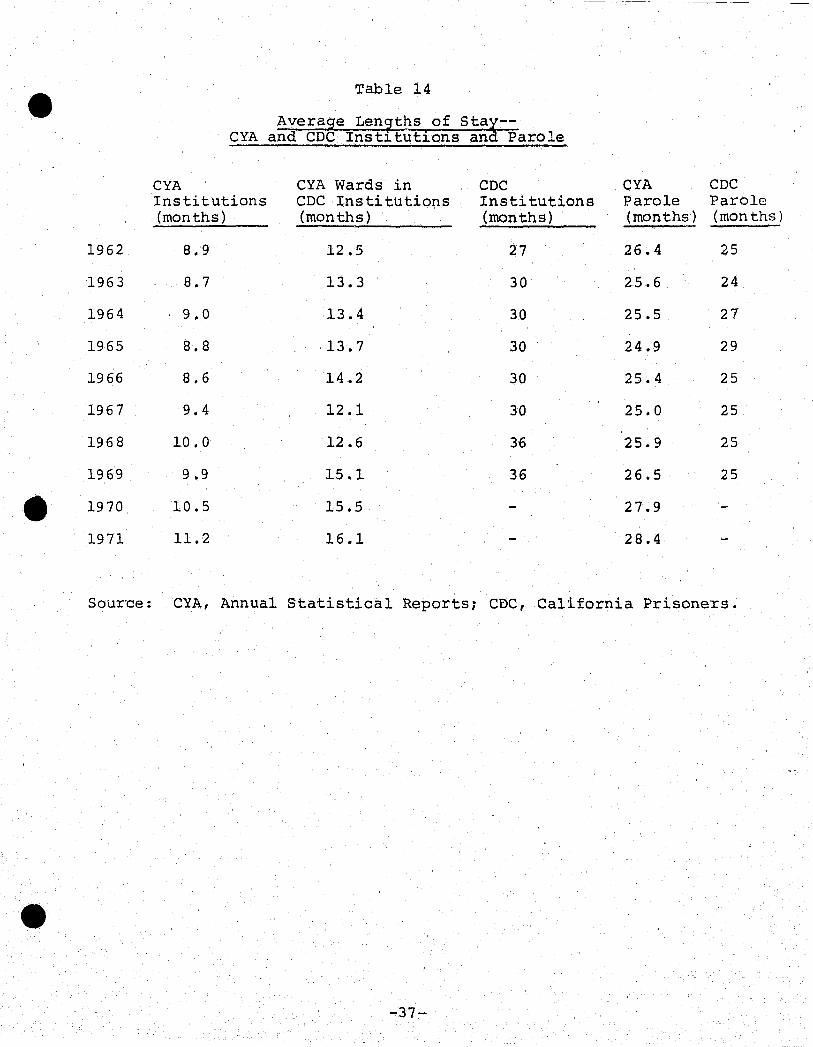
Table 14
CYA Average Len~ths of staa--
and CDC Inst~tutions an- Parole
CYA CYA Wards in CDC CYA CDC Institutions CDC Institutions Institutions Parole Parole (months) (months) (months) (months) (mon ths)
1962 8.9 12.5 27 26.4 25
1963 8.7 13.3 30 25.6 24
1964 9.0 13.4 30 25.5 27
1965 8.8 13.7 30 24.9 29
1966 8.6 14.2 30 25.4 25
1967 9.4 12.1 30 25.0 25
1968 10.0 12.6 36 25.9 25
1969 9 .9 15.1 36 26.5 25
1970 10.5 15.5 27.9
1971 11.2 16.1 28.4
Source: CYA, Annual Statistical Reports; CDC, California Prisoners .
• -37-

•
•
Chapter Two
INDIRECT EFFECTS ON STATE COSTS
Not all effects of the probation subsidy program are of the
direct kind discussed in Chapter One. Rather some effects result
from increased usage of facilities or services which are not
formally tied to the subsidy program. At the state level the
principal programs involved are the California Rehabilitation
Center and the state diagnostic facilities in both the Youth
Authority and the Department of Corrections.
A. California Rehabilitation Center
The California Rehabilitation Center (CRC) is a compulsory
treatment program for persons addicted to narcotics or in danger
of becoming so. Commitments to CRC are considered civil in nature
and may come from a number of sources. If a criminal defendant's
prior record does not indicate a pattern of criminality that would
make him an unfit subject, the judge may after conviction suspend
the proceedings and commit him to CRC. Addicts may also be com-
mitted to CRC without criminal involvement, either at their own
initiative or that of another.
Since the CRC program began full operation in 1962, the
number of felony defendants committed to CRC has more than tripled,
as shown in Table 1. The admission rate per 100,000 population
in the state has also increased at a very rapid rate.
[Insert Table 1 here]
The total number of admissions from all categories has also
_ incre.ased substantially, as shown in Table 2.
[Insert Table 2 here]
-38-

1962
1963
1964
1965
1966
1967
1968
1969
1970
• 1971
1972
Source:
Table 1
C.R.C. Conuhitments of Felony Defendants
Number per Number 100,000 population
597 3.5
772 3.8
896 4.2
869 4.7
961 5.1
1,195 6.2
1,389 7.1
1,855 9.4
1,903 9.5
2,350 11.5
2,084 10.6
California Bureau of Criminal Statistics, Delinquency and Probation in California, 1963, 1964; Crime and Delinquency in California, other year.
It should be noted that not all defendants committed by the courts are admitted to CRC. Some are returned as inappropriate for admission. The trend of admissions is essentially the same as the. trend of commitments, however.
-39-

--~-~----~- - - --..- ----
Table 2
Civil Narcotic Addicts Admitted to CRC
Admitted with Admitted with Admitted without Fe lony Charge Misdemeanor Charge Criminal Charge Total
1962 661 280 238 1179
1963 796 289 159 1244
1964 903 320 80 1303
1965 816 177 63 1056
1966 854 192 185 1231
1967 1122 208 315 1645
1968 1266 241 276 1783
1969 1801 200 244 2245
Source: Statistics: Civil Commitment Pro ram for Narcotic Department of Correct~ons, Research D~v~s~on.
-40-

The CRC figures pose a special problem in connection with
the probation subsidy program. Although operated by the Department
of Corrections and financed by the state, CRC cases do not count
as county corrections commitments for purposes of the subsidy
program. The overall number of CRC cases occuring in the base
rate years, howev.er, were included as county commitments in the
development of the base rate tables upon which the subsidy payment
is based.
These facts plus the fact that there are state costs involved
have led some observers, including the State Legislative Analyst
and the Department of Finance, at various times to conclude that
CRC commitments should be counted as part of the county total for
subsidy purposes. l
Several issues seem involved in this question. The most
basic of these undoubtedly is whether the subsidy has been the
cause of the increase in CRC admissions. A second question is
the extent to which the reasons for encouraging local handling
of criminal defendants through the subsidy program apply to the
kind of drug problems handled by CRC. Third,. assuming that these
reasons do not apply, there is an economic issue as to where the
financial burden for CRe cases should be placed. Finally, there
is the question as to whether any CRC commitments counted against
the counties should be limited solely to felony defendants--the
only CRC category from which prison commitments might come--or
whether other kinds of commitments should also be counted against
the counties as well.
The first question is perhaps the easiest to answer. It
seems quite clear that probation subsidy is not the principal
-41-

cause of the increase in the CRC program. CRC did not open its
doors until September 1961 and during the early subsidy years was
still in its build-up stage. 2 The CRC population would have in
creased whether there had been a subsidy program or not.
In addition to the process of expanding to its planned size,
the CRC program increased because the drug problem itself increased.
Adult felony drug arrests increased by more than 500 percent be
tween 1960 and 1972, as shown in Table 3, and the rate per 100,000
population by over 400 percent (from 89 to 416).3
[Insert Table 3 here]
That the build-up in the CRC program was caused by factors
other than simply committing the drug cases to eRC that had pre
viously been committed to state prison can be seen even more clearly
in the CDC commitment figures. These show, in Table 4, an increase
in CDC drug commitments during the subsidy years.
[Insert Table 4 here]
It is no doubt true that in the absence of the eRC program,
counties would probably have made more commitments to CDC or CYA.
Given the incentive of the subsidy program, however, it seems
likely that the rate of commitment would have been substantially
less than the previous rate. The consequences of the additional
cases the counties would have had to have handled, however, clearly
would have been substantial increased economic pressure on the
correctional resources available to the local communities.
Should the counties have been discouraged from making this
kind of commitment to CYA and CDC in the same way they were dis
couraged from making other commitments to the CYA and CDC? One
of the major premises of the subsidy program was that some per-
-42-

Table 3
Adu1 t DrUg Arres ts Reported
By California Law Enforcement Agencies
Dangerous Marijuana Opiates Drugs Others Total
1960 4245 9135 3533 736 17,649
1961 3386 8171 4530 830 16,917
1962 3433 5939 5865 1040 16,277
1963 4883 5939 5865 1164 16,787
1964 6323 7597 4577 1210 19,707
1965 8383 6104 5930 1268 21,685
1966 14,209 6364 6064 1630 28,2"67'
1967 26,527 8197 9558 2750 47,032
1968 31,185 9402 6577 2110 49,274
1969 24,408 9707 22,246 3028 69,389
1970 44,718 10,876 23,044 3279 81,655
1971 42,745 12,293 26,067 3279 84,384
1972 52 F 0 27 15,637 23,652 3935 95,251
NOTE: Data for years 1960 through 1967 are based on an individual reporting project; for yea~s 1968 through 1972, the basis is on statewide summary reporting. Data for years 1968 through 1972 are based only on felony arrests.
Source: Crime and Delinquency in California, 1972 - Dru~ Arrests Dispositions; Bureau of Criminal Statistics, Div1sion of criminal Investigation and Information.
-43-

Table 4
New Drug Commitments to CDC
1960 941 1967 911
1961 888 1968 631
1962 576 1969 737
1963 532 1970 834
1964 628 1971 921
1965 664 1972 818
1966 698 1973 905
Source: CDC Research Division, California Prisoners •
• -44-
...
centage of the state committed cases could be handled better or at
least as well at the local level. The major reason for starting
the eRe program, however, was that a problem existed which was
not being handled well by either the state agencies or the local
communities. It seems clear, therefore, that the policy basis for
the eRe program was exactly the opposite of that of the subsidy
program, that is, that in the case of eRe, state handling for ap-
propriate cases were to be encouraged rather than discouraged.
The subsidy base rate formula makes no allowance for in
creases in the number of crimes. It is based solely on the his-
toric number of commitments and the amount of population increaseS
in the county. This means that according to the sUbsidy formula
the whole burden of the increase in the drug problem would have
4It been borne by the counties. 4
The effect of the decision not to count eRe cases against
the counties was that the state absorbed the cost of some of the
increase in drug cases, particularly the more serious cases.
The state clearly did not assume anything like the overall burden,
however, and the state share even for the more serious cases clearly
declined. Had judges continued to commit the same proportion of
felony drug defendants to eRe in the 1966-71 period as they did
in 1962-65, there would have been 311 more eRe commitments in
1966, 2,715 more in 1969 and 3,202 in 1971. In light of the policy
objective to be obtained and the fact that neither the state nor
the localities anticipated the increases ~hich carne, the split in
costs which evolved does not seem unreasonable and certainly was
not unfair to the state.
There is something to be said for the argument that if eRe
-45-

cases are not to be counted as commitments for subsidy during the
subsidy years they should not De included in the base rate to.bles
from which reduction in commitments are computed. For most counties
this is not really an issue. For these counties, commitment re
ductions are computed projections based on 1959-6l--years prior
to the beginning of eRe and in which there are no eRe admissions.
Some few counties, however, compute commitment reductions on the
basis of an alternate method which uses 1962 and 1963 as the base
years. In these years there were eRe admissions, and these were
included in the base rates. Statewide in 1962 the total number
of felony defendants admitted to eRe was 661 and in 1963, 796.
Even if all of these were persons who would today be counted as
state commitments, these figures compare with total commitments
of over 10,500 for each of these years. 5
Subtracting the eRe cases from this total would lower the
base commitment rate by about six percent. This would make it
somewhat more difficult for counties to reduce commitments but
'would have a relatively minor effect on the overall program.
Because of the growth in the eRe program, counting all the
present eRe admissions on felony charges as commitments, however,
~ould knock many counties out of the program altogether and would
substantially reduce the program in others, as shown in Table 5.
{Insert Table 5 here]
The effects of including all eRe cases including those ad
mitted voluntarily and on misdemeanor charges as commitments would
have an even more serious effect on the program. Tnere is no
real argument for including these cases, however, as they were
-46-

Table 5
Impact on County Probation Subsidy Programs
Counting All Felony CRC Sentences as Cornmi tments (In Percent of Reduction in Funds to the County)
Alameda
Contra Costa
Los Angeles
Orange
Sacramento
San Bernadino
San Diego
San Francisco
San Mateo
Santa Clara
State Total
1966
-4.2
-6.3
would have resulted in no earnings
no commitment reduction
-3.8
-31. 7
-3.5
-13.0
1967
-2.2
-15.4
-21.0
no commitment reduction
-8.2
-39.0
-42.0
-9.7
-16.3
1968
-7.4
-16.5
-20.4
-7.0
no commitment reduction
-3.0
-17.0
-24.6
1969
-13.7
-91. 2
-20.6
-28.9
-33.3
-90.7
-28.5
1971
-43.7
-81. 5
-13.9
-16.4
-30.7
-77.9
-21. 5
would have would have resulted resulted in no earnings
in no earnings
would have would h~ve would have resulted resulted resulted in no earnings
-18.0
-17.6
in no earnings
-53.3
-29.6
in no earnings
no·cotnmitment reduction
-33.8
Note: These figures were calculated by subtracting CRC commitments from total commitment reductions for each county. As the commitment reduction data is in fiscal years and the CRC data is in Calendar years, the results are necessarily approximations.
-47-

•
never included in the base rate tables and are not cases that
could legally be sentenced to prison.
B. CDC Diagnostic Facilities
Since 1957 California law has provided that in the case of
defendants "convicted of an offense punishable by imprisonment
in the state prison" the judge before passing sentence may refer
the case to the Department of Corrections "for a period not to
exceed 90 days," for a "diagnosis and recommendations II as to what
the sentence should be. 6
This program was intended to assist judges in determining
the most appropriate sentence, particularly those in smaller
counties which did not have diagnostic facilities of their own.
For the first six years of the program, between 1957 and
1962, only 62 defendants were committed under this program. 7
Following adoption of the sUbsidy program, however, the program
increased to 763 cases in 1965, to 1,035 in 1966, and to 2,644
in 1972 as shown in Table 6.
[Insert Table 6 here]
The timing of this increase has led some observers to con
clude that the subsidy program was responsible for the increase.
This would seem to be a wrong conclusion, however, at least in
large part. The key factor in the increase appears to be a change
in the cost of the diagnostic program brought about by the legis
lature in 1963. Prior to this counties using state diagnostic
services had been obliged to pay the full cost of the service.
After 1963, however, the entire cost was absorbed by the state.
In addition the Department of Corrections began actively to sell
the program to the judges and the counties, through presentations
-48·-

I ~ \D I
e e e Table 6
Defendants Convicted; Committed to Prison and Diagnosed
1961 1962 1963 1964 1965 1966 1967 1968 1969 1970 1971 1972
Total sentenced 27,960 27,084 28,393 27,830 30,840 32,000 24,683 40,477 50,568 ~9,950 56,018
Adjusted 55,050 64,518
Total to Prison 7,248 6,420 6,606 6,365 7,184 6,731 5,990 5,492 4,940 5,025 5,386
% to Prison 25.9 23.7 23.3 22.9 23.3 21.0 17.3 13.5 9.8 10.1 9.6
Adjusted 9.1 8.3
Total Diagnosed 271 763 1,035 1,275 1,325 1,714 2,172 2,424 2,644
% Diagnosed (of convicted) 1.0 2.5 3.2 3.7 3.3 3.5
Adjusted -----
Source: K. Mann, Sentencing in California: A Study in Organization Interaction. (Draft thesis for Master's in Law and Society, University of California, Berkeley, 1973), p. 45.
4.3 4.3
3.9 3.8

tit at sentencing insti,tutes a.nd other meetings. In 1966, the
Director of Corrections stated to that year's sentencing insti-
tute: "We had only 114 cases in 1963 but after we talked to you
last year the number grew to 1,001 for the year just finished. u8
Much of the increase in the diagnostic program thus took
place prior to the actual beginning of the subsidy program. It
is also clear, however, that one of the purposes which the state
had in mind in 1963 in lowering the cost of the diagnostic facili-
ties was that of reducing commitments. Since this was also on~
of the major reasons for the subsidy program two years later, these
two programs can be seen as parallel efforts to the same end.
It is not possible at this time and with the data available
to say which program has played the more important role in the
reduction of commitments of adults to CDC which has taken place.
Program figures indicate that a larger percentage of the marginal
cases--the group from which commitment reduction almost surely
come--have gone through the diagnostic centers, as shown in Table 7.
[Insert Table 7 here]
From this and other data it also seems clear that the availability
of the diagnostic centers has enabled judges ultimately to make
more dispositions to the community than they otherwise would have
done. This results in part from the additional information provided
from the diagnosis, in part because the judge is taken off the
political hook as to the final disposition to some extent, and
in part because some judges look upon the diagnostic commitment
itself as a short prison term. (If I'll let them see the walls, get
a taste of what's in store for them if they turn up in court again."l
On the other hand it seems even clearer that the diagnostic
-50-

Table 7
Number of Defendants Diagnosed by Year
(1967-1971)
1967 1968 1969 1970 1971
Recommended to community 513 524 669 851 1026
Committed as felon 22 26 38 54 80
Percent committed 4.3 5.0 5.7 6.3 7.8
Recommended for Commitment 666 680 834 1000 1070
Commi tted as felon 477 525 633 645 576
Percent Committed 71.6 77.2 75.9 64.5 53.8
Number diagnosed minus other1179 1204 1503 1851 2096
Source: K. Mann, Sentencing in California: A Study in Organizational Interaction. (Draft thesis for Master's in Law and Society, University of California, Berkeley, 1973),p.89.
-51-

centers are by no means the most powerful influence on the trend
toward community dispositions. Diagnostic center recommendations
for prison sentences, for example, are often rejected, as shown
in Table 8. From this the most comprehensive study to date of
the diagnostic center program concluded: If [C]ourts are decreas
ing their reliance on state prisons at a faster rate and in a
more comprehensive way than the CDC .•. [I]ndependent factors are
causing courts to modify their sentencing criteria.,,9 One of
these factors presumably is the probation subsidy program.
[Insert Table 8 here]
From a cost point of view it seems clear that the diagnostic
center program requires the expenditure of state funds and that
it results in some commitment reductions.
These expenditures can be analyzed in at least two different
ways. One is to look at the marginal increases during the subsidy
period and ascribe these as additional costs to the subsidy pro
gram. When looked at in this way the cost of the diagnostic pro
gram appears as a very minor part of the entire picture, as shown
in Table 9.
IInsert Table 9 here]
The other way is to consider the total cost of the diagnostic
program as part ,of the state's costs for reducing commitments.
Even if this is done, however, the impact when weighed against
the savings are not great, as shown in Table 10.
[Insert Table 10 here)
C. CYA Diagnostic Facilities
The CYA also operates diagnostic facilities in order to help
counties make the most appropriate placement decision. The diag-
-52-
..

•
, Table 8
Court Response Impact by Year
(1967-1971)
1967 1968 1969 1970 1971
A. Number diagnosed (minus other) *1,179 1,204 1,503 1,851 2,096
B. Rate of recommendations for prison from probation depart-ments. 95 95 95 95 95
C. Rate of acceptances of prison recommendations by courts from probation departments " 72.3 69.0* 66.0 57.2 55.0*
D. Rate of acceptance of commu-nity recommendations by courts from probation departments. 97.0 96.5* 96.0 96.1 96.0*
E. Number committed to prison without diagnosis (based on A, B.,C,D) • ·812 791 945 1010 1070
F. Number committed to prison after diagnosis. 499 551 671 699 656
G. Number "diverted" (E minus F) • 313 240 274 311 433
H. Number committed (actual) to prison. 5,990 5,492 4,940 5,025 5,386
I . Number committed plus num-ber diverted. 6,303 5,732 5,214 5,336 5,829
J. Percentage reduction in commitment level H/I. 5.0 4.2 5.3 5.8 7.6
K. Percentage reduction in commitment of population diagnosed. 61.5 69.7 71.0 69.2 59.7
*Estimated.
Source: K. Mann, Sentencing in California: A study in Organization Interaction. (Draft thesis for Master's in Law and Society, University of California, Berkeley, 1973), p. 45.
-53-

Table 9 e CDC Diagnostic Cases - Cost of Marginal Increases
1966-67 1967-68 1968-69 1969-70 1970-71 1971-72
Diagnostic Cases (Rate per 100,000 population) 6.1 7.6 7.4 9.9 13.6 16.6
Rate increase over base year (In percent) • 25 21 62 123 172
Increase in Number of cases over base number 289 243 716 1421 1987
Average cost per case $.Ll1.30 $152.44 $162.19 $118.21 $112.54
e Total cost $32,166 $37,043 $116,128 $167,976 $223,617
• -54-

~-- -- - ~- -------------
1967 - 1968
1969 - 1969
1969 - 1970
1970 - 1971
1971 - 1972 (estimated)
1972 - 1973 (estimated)
Table 10
CDC Diagnostic Cases - Total Cost
Number of Diagnostic Average Cost Cases Per Case
1,461 $111. 30
1,436 $152.44
1,962 $162.19
2,720 $118.21
3,360 $112.54
3,900 $118.47
Total Cost to state
$162,616
$218,899
$318,222
$321,531
$378,134
$462,033
Source: Letter front Mr. Irwin F. Cohn, Program Analyst, Human Relations Agency, Department of Corrections, dated January 29, 1971 (data for years 1967-68 to 1970-71). Other figures from the California state Budget.
-55-
--- --- --------- --------------
nostic center shares the risk of placing the tougher cases locally
and serves to increase the percentage of probationers.
In the beginning the CYA encou:r::1ged the use of their diag
nostic centers by providing their service at low cost--generaliy
lower than could be found in-house or by contracting with private
facilities--and by a well organized information campaign throughout
the state. The diagnostic center was discussed widely with court
and probation department officials. The result was frequent use
by the counties of the gO-day observation initial commitment.
The state diagnostic centers soon had more applicants than
they could comfortably handle and so sought to limit commitments
by raising the price and, later, by establishing a county quota
on the number of commitments a county could have at CYA facilities
at one time. The cost schedule is shown in Table 11.
[Insert Table 11 here]
As the cost increased, usage by counties decreased. This
was especially true when the state facility approached or passed
the average cost of diagnosing a youth at the local level. It
became a question of the least expensive means of getting infor
mation. Cost is a major determinant of use.
Many counties now indicate that only highly political cases
are likely to be sent for CYA evaluation. Thus if community or
media pressure for institutionalization is such that a short
term diagnostic stay in a CYA facility provides some cooling off
time for thought and reflection such a disposition is likely.
Otherwise it is not. In all cases, though, the average length of
time a youth spends at the diagnostic facility has decreased over
the six-year-period.
-56-

Table 11
Cost of CYA Diagnostic Services
Prior to June 30 Rate Eer Person
1967 $140 plus $5.76 per day
1968 $155 plus $7.20 per day
1969 $165 plus $7.20 per day
1970 $180 plus $7.20.per day
1971 $24 per day or $705 per month
Present $25 per day or $750 per month
Source: California Youth Authority
-57 -
Initially, the subsidy program may have created some added
incentive for counties to use the state diagnostic centers. Such
a procedure had obvious appeal to officers or judges who were
reluctant to recommend placing more difficult cases on probation,
but who were willing to do so if the state recommended it. It
also provided a way for the county to temporarily remove a youth,
considered a good probation risk but involved in a sensational case,
with minimal ·cost to the county. And in some instances it may
at least have avoided adding to the number of CYA commitments from
the county. As local probation officers and psychological staffs
grew more confident in their recommendations to the court and
as the cost of state diagnosis increased, the larger counties
developed their own resources.
At this time, the subsidy program is having virtually no
impact on the number of youths sent to the CYA diagnostic centers
from the more urban counties which annually process a great many
cases. The $2,250 cost of a gO-day diagnostic commitment plus the
cost of final placement would likely be more than the county would
make by earning the $4,000 for commitment reduction.
For counties with few cases requiring psychological evalua
tion, it is still advantageous to use the state diagnostic center
both to avoid commitments and to save money in consultant fees.
-58-
, .

Chapter Three
THE IMPACT ON COUNTY COSTS
It is difficult to discuss a correctional program solely in
economic terms. Whether.a program is sound fiscally depends in
large part not only upon what the program costs but also upon what
it accomplishes. Ignoring all offenders either by making no arrests
or by turninq ali arrestees loose without any court processing what-
soever would be a very low cost program in terms of processing cost.
To the extent that this kind of policy fails to prevent further
criminal activity, however, other and later costs may be generated.
Ultimately, then it seems clear that one can measure fiscal
impact only when the correctional impact of the program is known.
For many programs, however, this impact is never known or known only
at times which are much later than those at which budgetary decisions
concerning the programs have to be made. It is common, therefore,
for budget planners and others to make judgments about prograrns on
the basis of initial cost as opposed to what might be called final
or ultimate costs. Even in this more usual process, however, some
assumptions concerning program effectiveness are usually made. A
few jurisdictions choose only minimum cost programs but most have
a mix of both cheap and more expensive programs. In the absence of
the detailed data necessary to focus on ultimate cost, this chapter
will focus primarily on the immediate costs and impacts of probation
subsidy upon the counties.
Examination of a program operating at one level of government
but funded from a different level introduces several additional
questions. From the point of view of the unit receiving the funds
-59-

(and operating the program) budget and other officials will pre
sumably want to know (a) whether the payments received cover the
direct costs of the program itself, (b) whether the program gen
erates any indirect costs, and (c) if so, whether the payments
received cover these amounts as well. Even if the answer to these
questions is that the program costs more than it brings in, the
governmental unit receiving the funds--in the case of the proba
tion subsidy, the county--may well conclude that it wishes to
participate. Decision-makers will now know, however, how much
the county is paying for the program in addition to the amounts
received from somewhere else.
One other set of assumptions is necessary in order to
discuss this problem. The California probation subsidy program
is based on the concept that if a county reduces its commitments
to state correctional institutions it will receive approximately
$4,000 for each person who is not so committed. l The determination
as to whether as commitment reduction has taken place or not is
based upon a set of base rate tables. These tables in turn are
based upon the average number of commitments made in certain
pre-subsidy years. To the extent that· this formula accurately
measures the extent of commitment reduction the amounts received
by the county are in line with the $4,000 per reduction figure.
If the formula understates the number of commitment reductions,
however, the amounts received are less than $4,000 per reduction.
Conversely, if the formula overstates the reductions, the amounts
received per reduction are more than $4,000. For the purposes
of this chapter it will be assumed that the state formula accurately
measures the extent of commitment reduction.
-60-

A. The Cost of Special Supervision
One way of looking at the probation subsidy program is to con
sider it as a method for transferring marginal pri~on eases handled
by the state to the care of local probation services utilizing in-
tensive supervision units. As a condition of receiving subsidy
payments, these units must meet certain standards, including super-
vision caseloads no higher than 50 per officer and the provision of 2
aaequate clerical support services for each unit. If, for the pur-
pose of illustration, an assumption is made that this is the standard
method of handling commitment reductions, the basic cost plan of the
subsidy program from the local point of view can be examined.
The budget for a special supervision uni't in a typical county
is shown in Table 15.
[Insert Table 15]
It indicates that the direct cost of handling a typical special 3
supervision case for one year is between $911 and $1,025.. This COJTI-
pares with the estimated average of $350 for the handling of a case
under regular supervision.
Since cases normally stay under intensive su~ervision for longer
than one year, this figure must be multipliE7d by the average dUra
tion of supervision.
The median stay in a special supervision unit is slightly over
11 months for juveniles and about two years for those adults who stay 4
unde.r special supervision for the duration of their local sentence.
Based on the length of stay for those cases in special
-61-
....

Table 15
A Typical Subsidy Unit
1 supervisor
6 deputy probation officers
3 clerks
Other cos.ts
. Total
-62-
cost
$ 16,000
78,000
20,000
22,800
$136,8'00
-

•
supervision caseloads for the duration of their stay and assuming
no other costs such as foster care, the average cost for special
supervision cases is about $900 for juveniles and $2,200 for adults.
Based on the state reimbursement rate of $4,000 per case, this in
dic~tes a surplus to the county for each case of this kind. Many
cases, however, particularly adult cases, spend some part of their
time under special supervision and the remainder in some other kind
of care, usually regular supervision. These cases ar~ much harder to
cost out because of the absence of population movement data.
B. Some Other Possibilities
This method of looking at the direct costs to the county of
the probation subsidy program may be too simple, however. This is
because there is no requirement in the subsidy program that cases
not committed to prison be placed in special supervision units~ In
fact it is not usually even possible to identify which persons are
held locally rather than being sent to prison. This is because the
calculation of commitment reductions is based on a comparison of
commitments this year with commitments in prior years rather than
on the basis of some identification by the judge of the offender as
a person not being sent to prison at the time of his being sentenced.
Thus, in theory at least, it is possible that an adult offender
who would have gone to prison prior to subsidy could since the adoption
of the subsidy program wind up with a jail sentence, under regular
probation supervision, in intensive supervision, in some special pro
gram or in some mixture of these alternatives.
The basic decision as to whether a particular offender receives
a prison sentence or a local sentence is, of course, that of the
-63-

judge. If he opts for a local sentence, he also makes the decision
as to whether the offender goes to jail and as to how long the jail
sentence will be--within the limits of a one-year maximum jail sen-5
tence. If he decides on a local sentence, he also decides whether
probation will be part or all of the sentence. within this general
framework, the decision as to whether the offender will be placed
within a regular or a special supervision program is usually made
by the probation department.
This variety of placement options creates a greater range of
oossible financial impacts than that based solely on the cost of
intensive supervision alone. It is not possible to discuss se-
parately the impact of each of these alternatives, or to unravel
on the basis of existing data the many possible combinations that
can result from them. In order to better understand these ef-
fects, however, three alternatives to special supervision will be
discussed: assignment of all commitment reduction cases to regular
supervision, assignment to jailor other institutional programs,
and assignment among the various programs in some normal distribu-
tion. A fou~th alternative, that of not participating in the pro- •
gram and therefore continuing to send the cases which could have been
commitment reductions to the state will also be discussed.
Regular Supervision. Regular supervision is the normal proba
tion service offered by the county in the absence of the subsidy
program. This kind of supervision varies enormously by county, and
even within individual departments may include a variety of dif-
ferent kinds of caseloads. The cost of regular supervision is es-6
timated at $350 per year on a statewide basis. No statewide datn
is available but there are indications from some counties that
-64-

juvenile programs cost more than adult on a pe'r month basis. Thus,
in Santa Clara County the cost of juvenile supervision is $90 for
juveniles as compared with $18 for adult. The cost differential 7
in other counties may be much less or nonexistent.
The average length of stay on regular supervision is 1.3 years
for juveniles and two years for adults. Using the $350 average cost
figure, the career cost for juveniles is $455 and $700 for adults.
If all commitment reduction cases were placed under regular
supervision, such placement would free between $3,300 and $3,545 per
case to be used in some other way. Whether such a strategy would
bring an additional economic benefit, however, is not certain. Sub-
sidy earnings can be claimed only if the county has set up a special 8
subsidy program. Any subsidy monies received, consequently, would
have to be spent in placing cases of some kind under special super-
vision or in some other kind of approved program. If the cOMmitment
reduction cases are not placed in such supervision or programs, then
other kinds of cases would have to be. If these cases carne from
regular supervision, there would be no economic benefit to the county
beyond that where the commitment reductions go into subsidy. The
regular and commitment reduction cases would simply have switched'
places. However, if the cases going into the subsidy treatment pro-
gram carne from a program that cost the county more than the subsidy
treatment program, there would be a benefit to the county. This
benefit would amount to the difference between the institutional
career cost involved and the cost of subsidy treatment.
Institutional Care. Another alternative is that of assignment
to some form of institutional care. This might be jailor a half-
way house for adults or a ranch, camp, school, foster horne or private
-65-

•
placement for juveniles. Caring for offenders in this way is more
costly than probation treatment. Consequently, whenever a local
institutional stay is included in the correction plan, the career
cost increases. The cost of this kind of care varies greatly and
it is not possible to establish averages that are very precise.
Some idea of the ~verage cost is, however, given in Table 16.
[Insert Table 16]
It is theoretically possible for an offender to be kept in a
juvenile or adult facility for the full time under local correc-
tional care. Such a stay, however, is usually accompanied by pro-
bat ion involving either regular or special supervision, for at least 9
a year • Often the length of time involved is greater. In the case
of foster care, supervision is usually involved from the beginning
and continues throughout the foster care.
For the purpose of illustration, a series of career costs have
been computed for each of the different kinds of institutional care.
These assume a total career length of two years, which is f~gured on
the basis of the average length of institutional stay plus the
period of probation stay necessary to complete the two-year time
span. These are shown in Table 17.
[Insert Table 17]
-66-

•
Table 16
Cost of Institutional Stay
Average Month~y Length of Average Cost StaX Cost
Jail $180 6 months $1,080
Juvenile Camp or Ranch $500 6" 3 months-' $3,150
Private Placement $500 10 months $5,000
Foster Care $130 12 months::' $1,560
Source: See note 10.
-67-

Table 17
Cost of Institutional Stay Plus Probation
Total Total Added With With
Insti tutional Time on Regular Special Cost Probation SU}2ervision Supervision
Jail $1,080 18 months $1,620 $2,610
Juvenile Camp or Ranch $3,150 17.7 months $3,681 $4,655
Private Placement $5,000 14 months $5,420 $6,190
Foster Care $1,560 24 months * $2,280 $3,600 .
*Cases in foster care are assumed to remain undeJ:.'active probation supervision throughout the out-of-home placement period.
-68-

Placement in a local institution and on probation for an average
length of time thus results in a career cost averaging from $1,620
to $7,190 per commitment reduction depending on the type of place-
ment and supervision. Since. in most counties~ jail is the only
local placement option available for adults, the adult career cost
is more clearly defined than the juveniles. It ranges from $1,620
to $2,610. The juvenile career cost on the other hand fluctuates
from $1,920 to $7,190, depending upon the type and cost of the in-
stitution involved.
Normal Distribution. If the commitment reduction cases, in-
stead of all being handled in one specific treatment program, are
divided among the various sentencing options in some normal way,
such as the normal sentencing pattern for a county, the average
career cost would vary between $874 and $3,082 per case. The as-
sumption for the lower figure is that most cases are placed on
regular probation and that smaller numbers are sent to other options.
This is the usual sentencing pattern for counties. The higher figure
assumes that commitment reduction cases are somewhat tougher than
other cases and that they will therefore be placed on regular pro-
bation less. The division of cases among intensive supervision,
jail, camps, foster care and private institutions in this assumption 11
is similar to the actual division of cases among these programs.
More than likely the actual average career cost in any "normal"
distribution for commitment reduction cases lies within the top
third of the range given.
Commitment to the State. The final alternative for the county
is, of course, simply not to participate and to send all its cases
to the state. The career cost of juvenile cases should be $25 a
-69-

month for juveniles times the average length of stay of nine , 12
months or $225 per case. The state does not charge the counties
anything for keeping adult inmates, and thus the cost for an adult
commitment would be zero. Counties not participating in the program
tend to be affected, however, by the trends in criminal justice
around them. A nonparticipating county might therefor~ experience
an increase in local placeme~ts without any offsetting state pay-
ment.
C. Some Cost Comparisons
The impact on the counties of these career cost options can
be seen more clearly in Table 18.
[Insert Table 18]
The lowest cost care of the various options is obviously that
of regular supervision. For the reasons already discussed, however,
the effecti.ve cost of that care is the same as that of special super
vision. The effective cost of care consequently ranges from $900 to
$6,190 for juveniles and from $2,200 to $2,600 for adults. The
highest cost option for adults is that of commitment to the state,
and all of the adult local treatment options cost the county less
than the $4,000 subsidy payment. Insofar as the juveniles are con-
cerned, however, at least two of the possihil:i.1:ies involving insti-
tutional care cost the county more than the $4,000. One of these
is the higher'cost private placement; the other is a camp or ranch
stay followed by intensive supervision.
-70-

Table 18
Adult and Juvenile Career Cost Comparisons
Fiscal Year 1970-71
Regular supervision
Special supervision
Institutional care "
Normal distribution
Commitment to state
Source: . See note 13.
Adult
$ 700
-71-
2,200
2,115
4,000
$2,050
Juvenile
$ 455
900
4,361
4,000

D. Career vs. Annual Cost
The cost to the county of handling a commitment reduction can
be computed in several different ways. Sometimes, for example, such
costs have been computed on an annual basis. Thus, the State Finance
Department report states:
As ... [the table] shows, where the per capita cost is $274, the $4,000 subvention level will serve 14.6 probationers annually, while where the per capita cost is $1,740, the sUbvention will serve only 2.3 probationers annually. 14 . ..
The true cost to the county, however, for handling a cornmitment
reduction would seem to be the local career cost--based on length of
stay as well as annual cost of treatment. This is easily seen in the
case of a person is not committed to prison, who is placed in an
intensive supervision unit, and remains there for a three-year period.
The total cost to the county is clearly the three-year rather than
simply thefirst-year cost. And since the county receives the $4,000
payment for the co~nitment reduction only once rather than each year,
the appropriate method of analy~is is that of the local career cost.
This is the way in which this report has proceeded thus far.
It follows from this method, however, that the true cost to the
county includes the cost of recidivism as well. This seems obvious
as long as the offender stays in the county correctional system--for
as long as this occurs, the county is continuing to expend funds on
account of the offender. Had the offender involved been sentenced to
the state, county costs would have ended at the time of commitment.
Any subsequent offenses would be more likely to extend time in state
incarceration or on state parole than to involve any additional county
cost.
-72-
Insofar as the probation subsidy program is conceJ~ned, the cost
• of recidivism is particularly a county cost. For undeJ~ the counting
rules relating to the subsidy program a commitment is c:harged to the
county only once. If the offender involved is subsequE~ntly paroled,
commits a n.ew offense and is then sent back to state prison, the
recommi tm~nt does not count as another II commi tment" frc)m the county.
The case thus remains a state responsibility insofar an subsidy is
concerned (at least until after the entire state sentence including
any rec~rnrnitments is served).
15
The other side of this coin, however, is that the $4,000 payment
is received at the time the reduction first occurs, and no matter
how long the individual stays out of prison is never again repeated.
In a statistical sense, he is a county responsibility for the same
length of time he would have been a state responsibility had he been
committed to the state. Moreover, if the commi.tment reduction commits
a new offense at some later time and is then committed to the
the $4,000 payment is in effect wiped out. He is no longer a comrnit-
ment reduction, but rather a delayed commitment. The county has had
the use of the $4,000 for the time period involved but has incurred
whatever cost there has been expended upon the case in the meantime.
The implications of recidivism thus 100m large for the counties.
If the 35 percent rate of recidivism assumed for the commitment re
duction cases in evaluating the impact of state costs is also assumed
for the purpose of evaluating county costs, some of these implications 16
can be seen.
At the county level a further offense may produce further treat-
ment of the same kind as before or some kind of more intensive or more
-73-

closed treatment. Ultimately it may produce commitment to the state.
~ It seems likely that overall there is some progression toward the
more serious dispositions. Since some cases commit more than one
additional offense, this tendency becomes somewhat more pronounced
over time.
Juvenile cases present a particularly wide range of options.
For example, a youth could be originally placed in a foster home and
after a time reassigned to a private institution before completing
his wardship orr probation.' The mix of the particular placements has
significant cost implications. A number of different possible mixes·
are indicated in Table 19. All.of these are based on a three-year
career length.
[Insert Table 191 I
The cost of these options ranges from $1,080 for a case under
regular supervision for three years to a cost of over.$II,OOO for a
case with many expensive components.
For the purpose of evaluating these possibilities further in-
sofar as a whole caseload is concerned and in the absence of more
specific data, it will be assumed that of those· cases involved in
repeat criminal behavior (either once or more), 60 percent receive
an additional year of the same treatment, 30 percent receive one year
of a treatment that is mere intensive than that previously received,
and ten percent are committed to the state.
The implications of such a pattern of recidivism is a very sub-
stantial increase in the average career cost of the recidivist cases.
This may be seen by comparing Tables. 18 and 20. If the increases
-74-

•
e
Table 19
Career Cost Possibilities--Juveniles Three Year Period of Stay - Fiscal Year 1970-71
Foster Care (Caree:r: Cost $1,560) w~th
IPrivate Institutional 1P1acement (Career Cost $5,000 ) w~th
Cos
Diagnoeti Treatment (car. ... ~~· ~reerl
~ . ~~. $"'Z.5 OJ 0 s t
w~t
without
=$11,319 =$10 653
8 402 7 737
ubs~dy ($84 a month) wl.th
without ~without
w~th w~thout w~th
<without
7,159 6 493 4: 242 3 576
Note:
with
without
Pr~vate
Institutional Placement (Career Cost $5,000) with
without
with
without
=$10,767 =$10,101 =$ 7,~50 =$ 7 ,1·84
Td...:th ___ -<"'~~:;_;;t:".- =~ 6, 607 ~ =$ 5,941
~agnost~c
amps an~ reatmel1.t anch (Career
I (Career Cos . ost $750) 1$3,446 )
with -<Wfthout
w~th
,without with without w~th w~thout
with w~thout w~th w~thotlt w~th w~thout w~th w~thout
=$ 3,690 =$ 3 024
=$10 957 =$10:237 =$ 7 700 =$ 6,980 =$ 6£257 =$ 5 537 =$ 3 000 =$ 2,280
=$ 9 757 =$ 9 037 =$ 6,500 =$ 5,780 =$ 5 057 =$ 4 337 =$ 1 800 =$ 1,080
Total career cost assumes an average stay of three years. A stay in any county facility is calculated for the following periods: juvenile carnp--6.3 months, foster care--12 months, private institutional placement--10 months, and CYA diagnostic center--l month. The sum of the average lengths of institutional stay is subtracted from three years. The additional time is calculated as if the case is on probation.
-75-
..
involved are discounted by the 65 percent of the cases that are
assumed not to recidivate, the increases are less but nonetheless
substantial.
[Insert Table 20]
The county still accrues a surplus or at least breaks even under
all the options involved except those relating to institutional care
for juveniles. The possibility that county costs will exceed county
income from the subsidy program are increased in this category, how
ever.
E. Trends in Local Costs
If county costs for handling commitment reduction cases had
in fact been substantially greater than the $4,000 payment received
from the state for any appreciable number of cases, some of these
increased costs might be expected to show up in the county correc
tional budgets. No such impact is apparent, however, in the state
wide figures for the counties.
During the 1954-65 period, county correctional costs, excluding
costs for foster care and private placements for which adequate
figures are not available, rose steadily from about $28 million in
1954-55 to just under $100 million in 1965-66. In the post sub
sidy period this increase continued--going from around $113 million
in 1966-67 to nearly $185 mill.ion in 1970-71 (not including the amounts
received from the state pursuant to the subsidy program). The rate
of increase in the post-subsidy years was about 15 percent a year as
compa\red with a rate of about seven percent in the pre-subsidy period.
-76-

Table 20
Average Career Cost of a Recidivist Case
Regular supervision
Special supervision
Institutional care
Adult
$1,640
3,577 ,
3,846
Juvenile
$1,127
2,224
6,859
Source: Based on Table 18 and disposition distribution discussed in text.
-77-

Corrected for inflation and population growth, however, the rates
of increase for pre and post-subsidy periods are remarkably similar,
averaging about six percent per year over the entire period, as shown
in Figure 2.
[Insert Figure 2]
The advent of the subsidy program thus appears to have brought
no appreciable change to the overall pattern for county correctional
budgets and on the basis of available figures does not appear to
have generated any substantial new county correctional expenditures
beyond those for which the county has been reimbursed.
The pre-subsidy increases are clearly not releated to the sub
sidy program and seem explained by other factors such as inereasing
crime rates, improved standards of local care, and the extent to
which public service costs have risen fas'ter than general price
levels. These same factors also seem a much more persuasive ex
planation for the post-~ubsdiy increases than does the subsidy pro-
gram.
Analysis of the individual components of the county correctional
bUdgets also suggest that there has been no identifiable drain on
county budgets as a result of subsidy. Had such a drain occurred
it could be expected to show up primarily in the budgets for insti-
tutional facilities--carnps, ranches, placements, foster homes or
jails. As indicated in Table" 21 below, however, costs for those in-
stitutions for which figures are available have risen less than the
tit costs for probation.
-78-

I
~: CD Ii
0
.§ ,...-
-rt ~
t,rj X
I '"d -.J CD ~ ::s I n.. ,...-
rt s:; Ii CD
1'0
I,
llb
."
t~
e
'1 (.O~ 19(;'1
19"-19~.
It
Figure 2
Per capita County Expenditures for Corrections (In terms of 1967 dOllars)
/9'~Ifi(P~
/9'3- 19(;1"/-1'16'1 1%5"
FiS<lo.l Yeo.-r
111$-
19M"
I'tI.lg. 19"7
1967-191/&
1~6'i-
196q 19'-9-1'170
e
/970-
" " Note: County expenditures for corrections -include probation, jail; and county camps--ario'- ranclico"s6L-'
Source: California Controller's Report "Financial Transactions Concerning counties--Annual Report." Base year for California Consumer Price Index is 1967 (1967 prices = 100).

------------------"----
[Insert Table 21]
Costs for probation, excluding subsidy payments, and con
trolling for both inflation and population have risen about 43
percent since 1966-67. Camp and ranch costs during this same
period grew about 37 percent and jail costs about 28 percent.
Population data for camps, ranches and jails also suggests
that costs in this area have not increased in a~y disproportionate
way during this period. This data indicates that while admissions
to these kinds of facility have increased, the average lengths of
stay have decreased, thus enabling the cost of these institutions
overall to remain under control.
-80-

...
Table 21
County Correctional Bud~ets: Fiscal Years 1965-66 to 1970-71 (In m~llions of dollars)
1965-66 1966-67 1967-68 1968-69 1969-70 1970-71
Probation $38.2 $ 40.2 $44.9 $50.9 $61.4 $72.2
Juvenile camps & ranches 8.1 8.4 9.5 12.6 12.1 14.4
Jail 22.9 27.1 29.2 32.5 39.1 44.7
County farrn·or camp 13.3 12.7 11.1 12.7 13.1 16.1
Juvenile hall 21.1 26.3 26.9 27.6 33.5 37.1
Coun ty budget total 103.4 114.7 121. 4 136.3 154.0 184.5
state subsidy payments* 1.6 4.1 8.8 13.3 15.6
*Not included in total.
Source: California Taxpayers Association, California Counties Departmental Budgets.
-81-

Chapter Four
INDIRECT EFFECTS ON COUNTY COSTS
When a defendant is handled within the county as opposed to
state prison, the county immediately incurs certain costs directly
related to the probation subsidy program, such as the cost of pro
bation for that defendant. These costs are discussed in Chapter
Two. These costs do not end the economic effects of the program,
however, for many other county services may also be affected-
either positively or negatively. This chapter discusses these
effects--principally those involving jails, juvenile camps and
ranches, foster care and private institutional placement, schools
and welfare.
A. Jails
The question of the probation subsidy p~ogram's impact on the
county jails is one that has aroused considerable controversy.
Many sheriffs feel that probation subsidy has been responsible
for dumping large numbers of difficult inmates into jails which
are prepared neither to handle the number of prisoners involved
nor prisoners of this degree of difficulty. Their concern is
heightened by the fact that they do not receive any increase in
resources for dealing with these prisoners, while the probation
departments do. As a consequence, there have been a number of
efforts made to have jail programs made eligible for subsidy pro
grams funds. l
Several questions are involved in this controversy: (1)
whether there has been an increase in county jail populations,
(2) whether the character of these populations has become more
difficult, (3) whether this is attributable to the probation sub-
-82-

-.-----=~'~>'-~-.......
/

sidy program, (4) the cost implications of the above, and, (5)
whether jails should be included in the subsidy program. These
questions are interrelated.
Increase in County Jail Populations. There is no question
that the overall jail population is now larger than it was in the
years preceding adoption of the program. Based on the annual one
day census taken each year by the Bureau of Criminal Statistics
the average county jail population increased from 18,829 in 1960
to 24,332 in 1972, an increase of 36 percent. Nearly all of this
increase, however, is due to a larger number of unsentenced prisoners.
The number of sentenced prisoners has increased only 5 percent
from 13,696 in 1960 to 14,074 in 1972, as shown in Table 1. More
over, if increases in the overall state population are taken into
acount, the number of inmates sentenced to jail actually decreased,
from 86.3 per 100,000 in 1960 to 68.6 per 100,000 in 1972.
[Insert Table 1 here]
Based on these facts one study concluded that: "Probation
subsidy has not shifted state institutional costs to city and county
jails and/or farms. Per capita rates for incarceration are less
"2 today than they were in 1965, prior to the probation subsidy.
These figures do not completely settle the matter, however.
While the number of sentenced L!1nates overall hds declined on a
per capita basis, this decline is largely attributable to a de
crease in the number of persons sentenced for drunkenness. The
decline in the number of sentences for drunkenness is particularly
important because of the fact that this offense accounts for such
a large proportion of the jail population. While statewide figures
are not available with respect to this decline, it is clearly
-83-
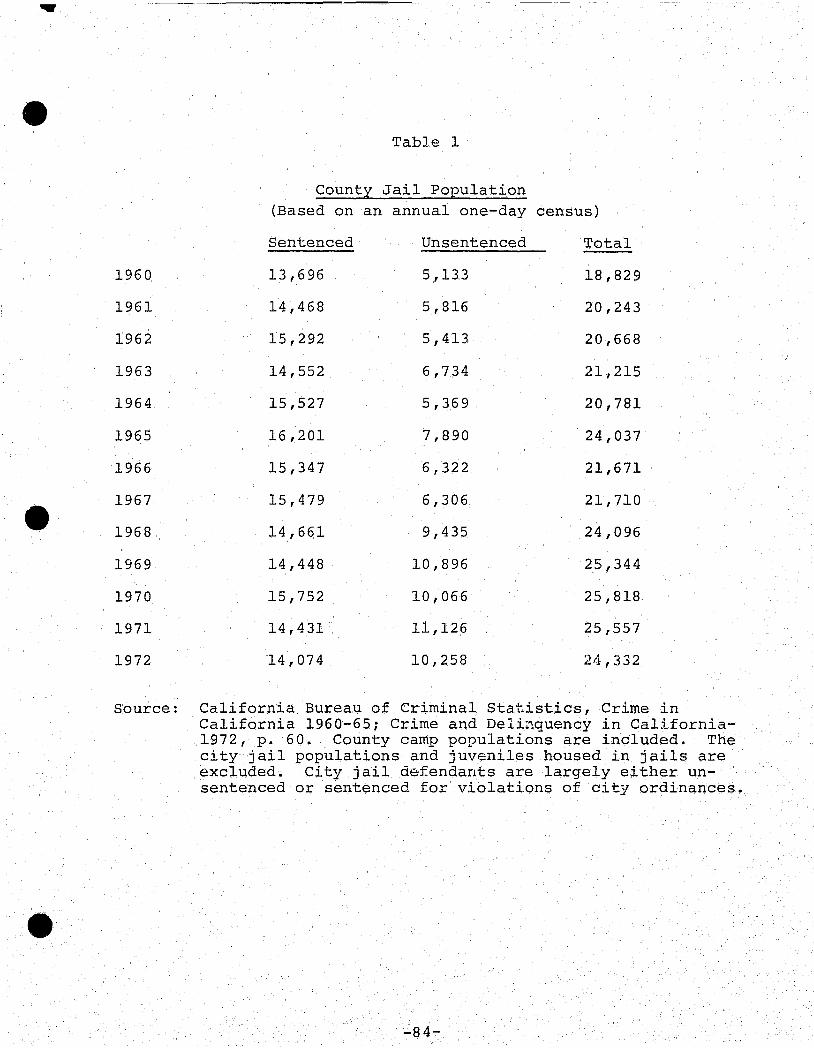
1960
1961
1962
1963
1964
1965
1966
1967
1968
1969
1970
1971
1972
Table 1
County Jail POEulation (Based on an annual one-day
Sentenced Unsentenced
13,696 5,133
14,468 5,816
15,292 5,413
14,552 6,734
15,527 5,369
16,201 7,890
15,347 6,322
15,479 6,306
14,661 9,435
14,448 10,896
15,752 10,066
14,431 11,126
14,074 10,258
census)
Total
18,829
20,243
20,668
21,215
20,781
24,037
21,671
21,710
24,096
25,344
25,818
25,557
2d,332
Source: California Bureau of Criminal Statistics, Crime in California 1960-65; Crime and Delinquency in California-1972, p. 60. County camp populations are included. The city jail populations and juveniles housed in jails are excluded. City jail defendants are largely either unsentenced or sentenced for violations of city ordinances.
-84-

------------------- ---------
, illustrated in Table 2 with respect to San Joaquin county.
[Insert Table 2 here]
Reductions in commitments to state prison do not come from
drunkenness cases, however. 2 They come from felonies, and the
number of persons sentenced to jail for these has increased dra-
matically. In 1960 the number of Superior Court jail sentences
was 9,656; in 1972 it was over 21,000--an increase of more than
130 percent. Even when adjusted for population increase, the
change is over 60 percent. 3
These figures still do not settle the issue, however. The
total number of straight probation dispositions not involving a jail
sentence has increased at least as much as the jail disposition,
and the total number of dispositions has increased nearly as much. 4
The increase in jail sentences can thus be seen in one light as
simply a manifestation of the fact that the system has been required
to handle a much larger number of offenders than previously--not
just jail but all parts of the system. The question of whether
subsidy was wholly or partly responsible for this increase in crime
and defendants is dealt with in another study.5 Here the concern
is the extent to which subsidy has caused the jails to receive more
than their share of the increased number of defendants.
The upper limit of any subsidy effect of this kind presumably
is the number of commitment reductions. To the extent that indi-
viduals have been diverted from prison to some form of local dis-
pdsition, it is possible that they may have would up in jail.
Projected on the basis of average number of prior commitments,
the number of adults diverted from prison is about 2,000 per year.
-85-

Table 2
Sentencing Patterns-San Joaquin County
1966 1968 1971
Municipal Court -Drunkenness and disturbing the peace 3,096 2,441 891
-Traffic 670 536 510
-Other 516 321 534
Superior Court 225 279 346
Total 4,511 3,671 2,381
Source: California Bureau of Criminal Statistics, Extended Tables, Adult Detention.
-86-

Projected on the basis of the ratio of prison to other commitments,
this number would be around 6,000 per year.6 Some of these reduc-
tions are undoubtedly due to factors other than sUbsidy. The
program is probably responsible statewide for a reduction of 1,500
to 3,000 state commitments per year. 7 Given the fact that the
commitment reductions are presumably the more serious cases, it
seems likely that most, perhaps all, of these offenders receive
some jail sentence--usually as a condition of probation.
From this it seems possible to conclude that as a consequence
of the subsidy program there has been some increase in the number
of felony offenders sentenced to county jails. It also seems clear,
however, that subsidy accounts for a relatively small percentage
of the total increase that has taken place. Based on a total
increase of some 10,500 felony-based jail sentences, the 1,500
to 3,000 cases attributable to sUbsidy would account for 10 to
30 percent of the total change in jail admissions, as shown in
Table 3.
IInsert Table 3 here]
Statewide figures on average jail days served for felony
defendants are not available. Based on figures from a number of
individual counties, however, it can be estimated that all de-
fendants sentenced to jail as a result of a felony charge served
roughly one million days in jail in 1971. 8 Thirty percent of
this would be 300,000 days. If $10 per day is the cost of this
confinement, the cost of these jail stays would total $3 million
to the counties.9
In 1972 the legislature appropriated two million dollars
additional to the regular probation subsidy funds in order to
-87-
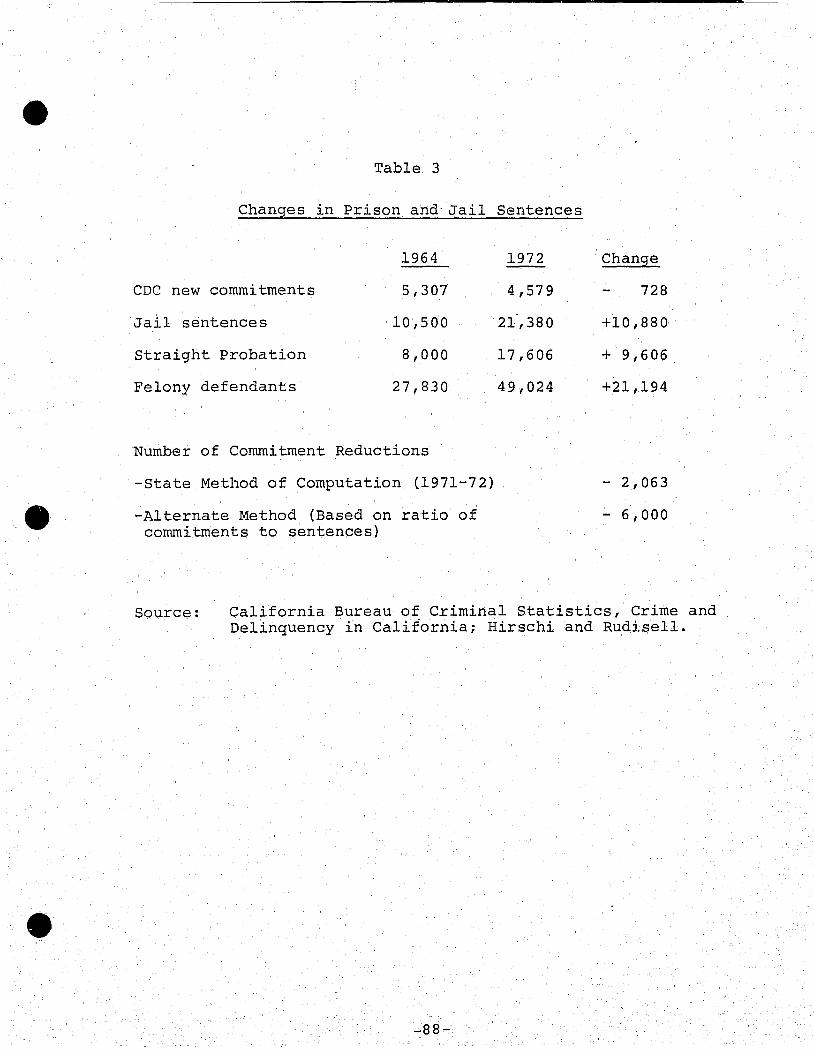
.e
Table 3
Changes in Prison and-Jail
1964
CDC new commitments 5,307
Jail sentences 10,500
Straight Probation 8,000
Felony defendants 27,830
Number of Commitment Reductions
-State Method of Computation (1971-72)
-Alternate Method (Based on ratio of commitments to sentences)
Sentences
1972 Change
4,579 728
21,380 +10,880
17,606 + 9,606
49,024 +21,194
- 2,063
- 6,000
Source: California Bureau of Criminal Statistics, Crime and Delinquency in California; Hirschi and Rudisell.
-88-

assist local law enforcement agencies in the "diagnosis, control
10 or treatment of offenders or alleged offenders. 1I This in
effect recognized to a limited extent the impact of the program on
the jail and other agencies.
B. Juvenile Camps and Ranches
California counties, with the assistance of an earlier and
different state subsidy begun in 1960, have developed an exten-
sive system of juvenile camps, ranches and schools. The camps
and ranches are in one sense to the juvenile system what jails
are to the adult system. They are the local institutions of
last resort. Generally they are also expensive.
Many of the issues raised with respect to the relationship
between j ails and the subsidy program have also been rai,sed with
respect to camps and ranches. Some feel that the number of juve-
niles assigned to the camps and ranches has increased as a result
of subsidy, and that the type of juvenile sent to the ranches
has become IIharder core. 1I Some of the same feelings about fi-
nances also apply. Although camps and ranches, unlike jails, are
generally part of the probaton department, like jails they have
not benefited directly from the subsidy program. In fact, like
jails, they are specifically prohibited from receiving funds under
subsidy.ll This is in part due to the existence of the earlier
camp subsidy and in part a reflection of a preference under the
probation subsidy program for non-institutional programs.
The average daily population in California county youth camps
has shown a steady increase over the past 25 years, as shown in
Table 4. The maximum period of this increase occurred during the
pre-subsidy years of 1955-65. Since this time, the average daily
-89-
...

-~-- ---~~~------------------
population has increased less than has the population aged 10-17.
According to the Bureau of Criminal statistics, the increase in the
population of the state's 45 county-operated juvenile treatment faci
lities closely paralleled the rise in the youth pop'llation during the
period from 1960 to 1968. 12
[Insert Table 4 here]
The average length of stay during the period 1960-67 remained
relatively constant at around seven months. From 1968 on, however,
this began to drop, as indicated in Table 5.
[Insert Table 5 here]
With the average daily population remaining relatively stable,
the decrease in length of stay suggests the number of juveniles
sent to camps and ranches increased during the period. The available
data indicates that this did occur to some extent. Thus in 1966
there were 4,976 admissions to camp and ranches, while in 1971 there
were 5,707. The increase is thus less than a thousand admissions
per year.13
As in the case of adults, however, it is not clear whether this
increase is due to the subsidy program or to other factors. The
total number of juvenile court dispositions involving juveniles, for
example, has increased much more dramatically during this period.
Figures are not available as to all petitions, but the number of
initial petitions has increased from 27,319 in 1960 to 49,788 in
1972. Other indicators such as juvenile arrests have also increased
substantially from 182,715 in 1960 to 353,232 in 1972, as shown in
Table 6.
[Insert Table 6 here]
Thus even in the absence of the subsidy program there probably
-90-
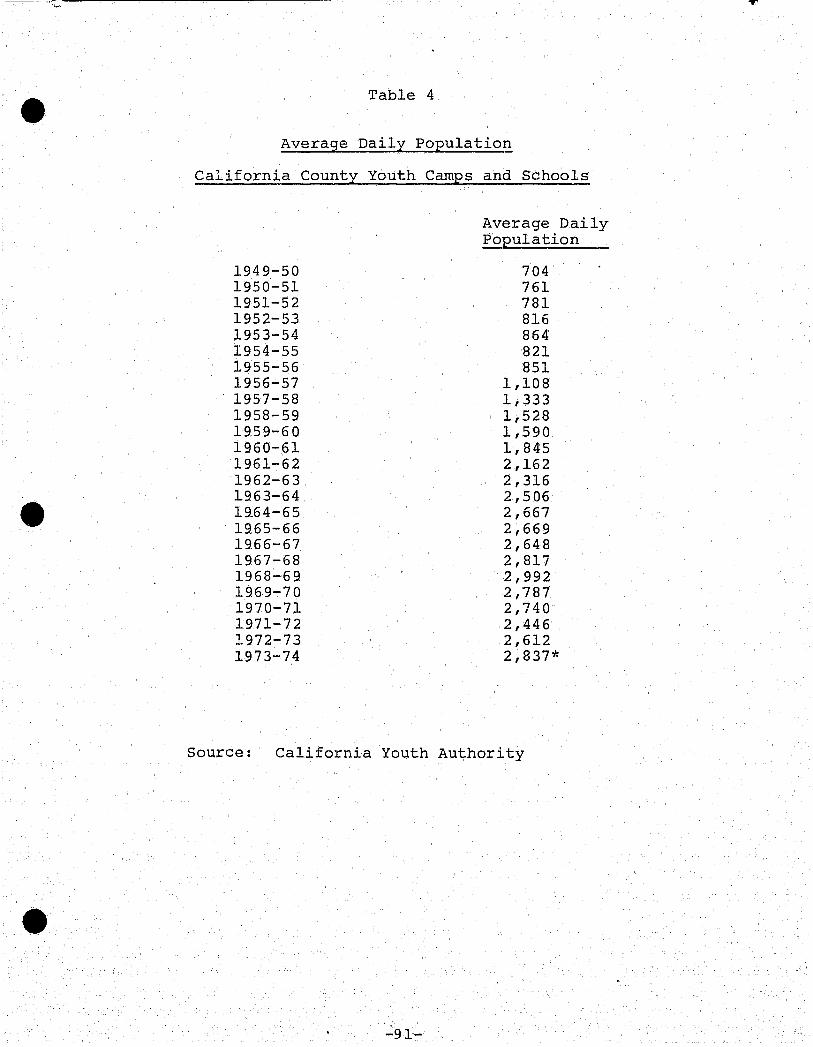
Table 4
Average Daily Population
California County Youth Camps and Schools
1949-50 1950-51 1951-52 1952-53 1953-54 1954-55 1955-56 1956-57 1957-58 1958-59 19.59-60 1960-61 1961-62 1962-63 1963-64 19.64-65 19.65-66 1966-67 1967-68 1968-69 1969-70 1970-71 1971-72 1972-73 1973-74
Average Daily Population
704 761 781 816 864 821 851
1,108 1,333 1,528 1,590 1,845 2,162 2,316 2,506 2,667 2,669 2,648 2,817 2,992 2,787 2,740 2,446 2,612 2,837*
Source: California Youth Authority
-91-
..,..
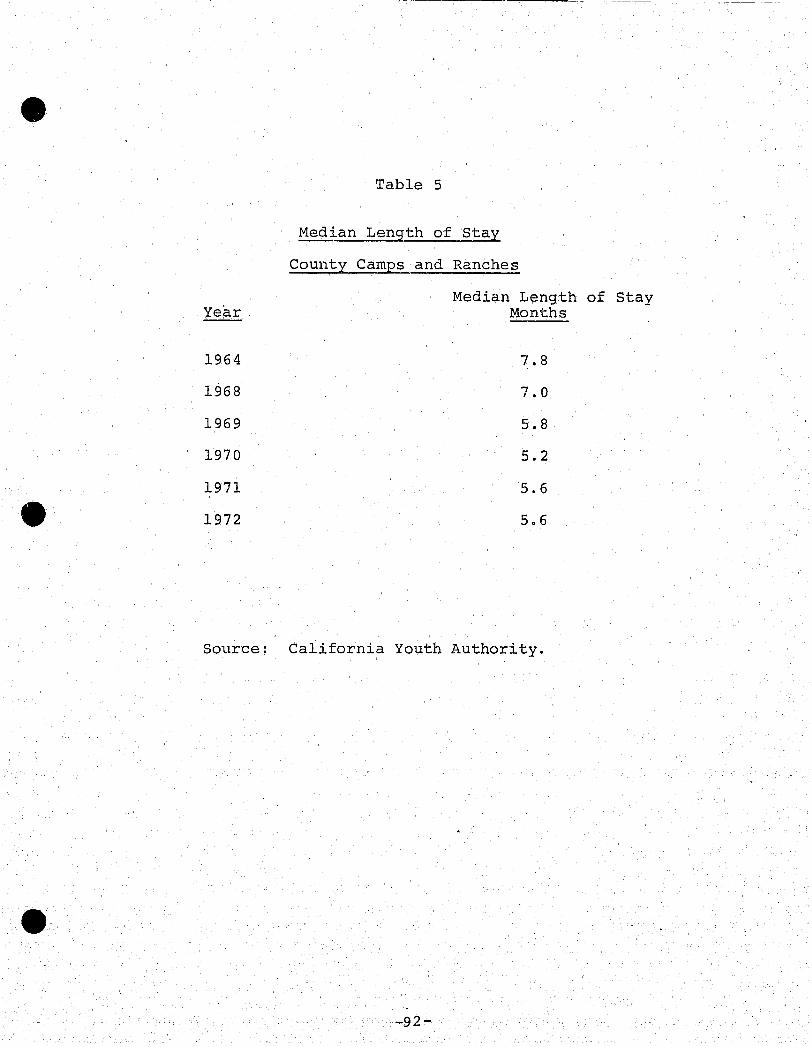
Table 5
Median Length of stay
county Camps and Ranches
Median Length of stay Year Months
1964 7.8
1968 7.0
1969 5.8
1970 5.2
1971 5.6
1972 5.6
Source: California Youth Authority.
-92-
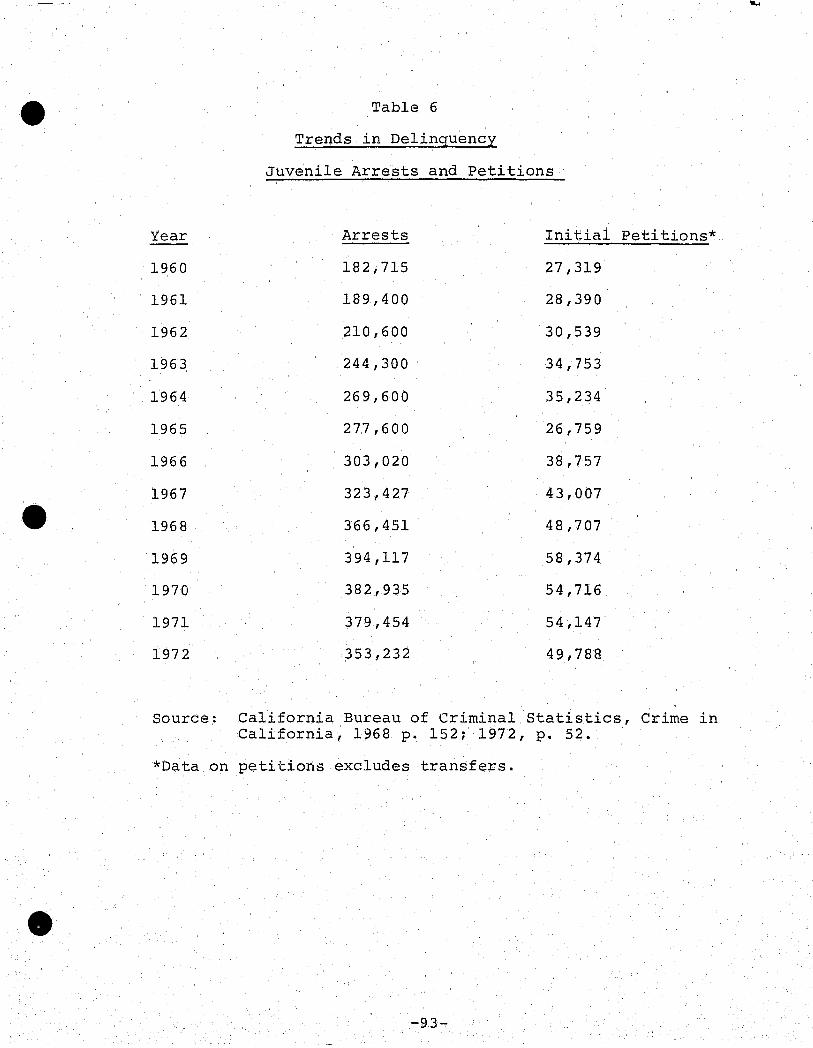
Table 6
Trends in Delinquency
Juvenile Arrests and Petitions
Year Arrests Initial Petitions*
1960 182,715 27,319
1961 189,400 28,390
1962 210,600 30,539
1963 244,300 34,753
1964 269,600 35,234
1965 277,600 26,759
1966 303,020 38,757
1967 323,427 43,007
1968 366,451 48,707
1969 394,117 58,374
1970 382,935 54,716
1971 379,454 54,147
1972 353,232 49,788
Source: California Bureau of Criminal Statistics, Crime in California, 1968 p. 152; 1972, p. 52.
*Data on petitions excludes transfers.
-93-
......

4It would have been some increase in the number of ranch and camp com
mitments. It is also likely, however, that subsidy has increased
usage somewhat. Based on the average number of commitments per
year and population changes, the number of juvenile commitment re
ductions is about 2,000 per year. Based on other methods of pro
jecting, this number is about 3,500. 14 Given the fact that commit-
ment reductions are likely to be the more serious cases, it seems
reasonable to assume that some of these did in fact wind up in camps
and ranches. Overall, perhaps as many as 500 camp and ranch commit
ments annually could fairly be attributed to the subsidy program.
This is about half the total increase in admissions.
Whether these cases resulted in any costs fairly attributable
to the subsidy program is another question, however. As previously
indicated, the average daily population remained relatively stable
during the period. As the increase in number of cases including
commitment reductions were handled primarily through decreasing
lengths of stay, it could be argued that the admissions brought
about by subsidy imposed no costs.
From this point of view, the decrease in len~th of stay could
be seen as attributable to pressures created by the subsidy program
for handling more of the serious cases in the community. Undoubtedly
this did occur to some extent. By far the greater amount of the
change, however, appears to have resulted from a state study of
recidivism of juveniles in camp programs which showed that youths
held for periods of three to four months did as well as those held
for much longer periods. 15 The significance of these findings was
aggressively sold to the counties--both to the probation departments
and the juvenile court judges--by CYA, which used the study as a
-94-

basis for arguing for shorter lengths of stay. The possible con
nection between reducing camp stays and further reducing CYA com
mitments was undoubtedly lost on no one. The push would almost cer
tainly have been made, even in the absence of the subsidy program,
however, and cannot logically be attributed to it.
Thus in the absence of the subsidy program, camp and ranch stays
might have gone down anyway. Given the huge increase in intake not
related to subsidy, however, it seems likely that, in the absence of
subsidy, populations would not have declined, but bedspace would
simply have been used to help handle this increased workload. The
consequence of this might have meant somewhat less change in com
position of the camp population, but no great change in the number
of admissions.
One other factor bearing on this picture is that of increasing
c~unty bed capacity. Overall this seems related to population growth
rather than pressures from sUbsidy.
Bed capacity statewide went from about 3,000 beds in 1963-64
to nearly 3,700 in 1969-70. By 1972, the total was down somewhat-
to 3,465, largely due to closings in Los Angeles County. This total
was still nearly 20 percent above the 1963-64 total. By far the
largest increase was in Orange County, the county with the largest
increase in population. Santa Clara and Contra Costa, two other
counties which grew rapidly during this period, also had substantial
increases in bed capacity. San Francisco was the only county studied
which showed both a sUbstantial increase in bed cap~city and a stable
or declining population. Statewide, the number of beds per 100,000
youths aged 10-17 remained static. Virtually all the capacity in
creases that have occurred in the subsidy period were planned before
-95-

-'
the subsidy began.
The actual costs of ranch and camp programs in the period studied
increased considerably, as shown in Table 7. Fr?m the above analysis,
however, this seems attributable more to inflation and population
growth than to subsidy.
[Insert Table 7 here]
Changes in Camp Operation. Interviews with county camp and
ranch personnel on the effect of the subsidy program show great
differences of opinion.16
Virtually no one believes that subsidy
has had no impact on camp operation. Some say subsidy has created
enormous problems in two major areas: (1) changes in the caseloads
received by the camp and the staff's ability to deal with the youths,
and (2) organization and staff problems that have been growing for
many years which sUbsidy accelerated. Others, while agreeing that
these changes have occurred during subsidy years, believe it is
impossible to blame sUbsidy for these changes. They indicate that the
changes in camp commitments and in camp programs would have occurred
without subsidy.
In one respect, however, it seems clear that camp operations
have changed drastically as a result of the SUbsidy program. In
the years prior to the sUbsidy program runaways from county camps
or failures in the camp program quite frequently were committed to
the CYA. In the years following introduction of the subsidy pro-
" 1 '1 d 17 gram, however, thlS practlce has been sharp y curtal e .
Many camp and ranch personnel also believe there have been
qualitative changes in the populations they must handle. They feel
that youths are kept on probation much longer and tha~t by the time
the camp receives the case the adolescent is in many cases more
.-96-

t 1.0 ,.J I
- e -Table -7
Expenditures for Juvenile Camps and Ranches
1965-66 1966-67 1967-68 1968-69 1969-70 1970-71
Alameda $ 899,616 933,155 917,250 920,461 976,606 1,057,211
Contra Costa 452 , 944 578,919 676,096 863,295 1,001,494
Los Angeles 4,202,330 4,526,400 4,687,612 4,880,225 5,224,352
Orange 470,983 503,531 551,574 872,888 1,498,715 1,895,245
Sacramento 304,327 324,311 333,322 360,236 399,751 487 1.554
San Bernadino 270,579 343,756 358,401 384,600 4.64,879 578,670
San Diego 436,573 616,045 761,115 924,841 924,841 1,032,561
San Francisco 354,412 663,251 790,841 790,841 820,624
San Mateo 282,280 360,650 398,232 479,927 479,927 576,290
Santa Clara 658,433 732,556 824,353 1,156,308 1,156,308 1,262,932
Source: County final budgets. Some care should be exercised in making comparison due to varying procedures in regard to capital improvements, fringe benefits, rent of facilities, fixed assets and school costs.
'.
.. - ----------,------------- ---~-
criminally experienced. Most see little change in the kind of criminal
offense for which youths are sent to camp, but believe the youths
find it more difficult to accept a camp sentence when a past and
often more serious offense brought only.probation.
A few camp staff members feel that, as the county has sought
to reduce commitments, the camps have been forced to take and keep
youths who would have been in the Youth Authority prior to subsidy
(and some whom they feel belong there now). Others within the camp
system feel that in the attempt to reduce commitments more psycho-
logically disturbed, drug oriented youths have been accepted, and
that the staff is not able or has not been trained to deal with these
18 problems. This is again a plea for training and program funds
for what the staff feels is a subsidy-induced change in their work-
load.
Camp personnel are often junior, inexperienced, and have had
Ii ttle training. Tl._-=y question how they can succeed where the better
trained subsidy staff has failed. This dilemma is the foundation
of the argument that sUbsidy money should be used to improve camp
and ranch training. Some camp staff members perceive that regular
and sUbsidy units are "dumping" their failures in the camps. The
logic is that "the Probation Department doesn't think enough of us
to upgrade our training and working conditions, but on the other
hand expects us to clean up their messes and save the probation
subsidy program." In some camps this attitude is prevalent enough
to cause suspicion that the subsidy program's existence has severely
strained the intra-departmental relations.
During the subsidy years some probation departments have exerted
more central control over camp admission and release procedure. 17
It is questionable whether all of this organizational change can be
-98-

attributed to subsidy, but some camp officials think so. Some
counties are trying to reroute youths who would have gone to the Youth
Authority to the camp system and in their effort to reduce commit
ments many departments have concentrated considerable effort in re
ducing the number of youths going to CYA after release or escape from
a camp. This can be seen most clearly in the reduced number of CYA
cases admitted for camp and ranch runaways. Thus, there were 374
such admissions in 1964 but only 202 in 1972. 20 In many camps, the
formal decision-making on these matters has been more centralized
with the result that the individual camp deputy, counselor and super
visor has less discretion in handling a case.
Despite their viewpoint of the impact of the subsidy program
on camp and ranch operations, all the officials interviewed sup
ported the subsidy philosophy. That is, that in most cases local
treatment is preferable to state institutionalization. Most of
their complaints centered on the exclusion of camps from receipt
of the program's burden.
Overall it does not appear that the subsidy program has increased
the cost to the counties of operating the camp and ranch program.
C. Foster Care and Private Institutional Placements
Many youths on probation live in foster homes or in privately
operated group homes or schools. The impact of the probation sub
sidy program on the number of youths handled in this way is one of
the most difficult but economically important effects to measure.
Considering the costs of these programs surprisingly little is known
about them.
One recent study by 'the Joint Legislative Audit Committee
estimated the total number of children receiving foster care in the

state from all sources at 50,000 to 120,000 youths. 21 Those financed
by county welfare programs alone were estimated to cost $125 million
per year. An earlier study by the state Social Welfare Board esti
mated the total foster care c?seload for the state for 1972 at
33,550. 22 This total was found to be an increase of 100 percent
over 1964. The increase from 1960 to 1964 was nearly as great,
however, and that between 1948 and 1960 even greater, as shown in
Table 8.
[Insert Table 8 here]
No statewide figures are available as to the percentage of
these totals attributable to probation cases. A sample of cases
in counties representing 70 percent of the state, however, indi
cated that in 1972 about 10 percent were probation cases. 23
No figures are available on a statewide basis to indicate
whether the probation totals have increased in the same proportion
as the other kinds of cases or whether they have increased at a
greater rate. An attempt was made, however, to examine this question
in a number of individual counties. In most this proved impossible
because the county figures lump dependent and neglect cases which can
not be sentenced to the Youth Authority (and are therefore not in
volved in the probation subsidy program) together with delinquency
cases which are eligible (and therefore involved). In addition, in
most counties studied it was not even possible to compare the totals
for foster care during the pre-subsidy period with those of the post
subsidy period. This is because the dependent and negelect cases
were shifted during this time from the probation department budget to
the welfare or social service department. {This shift enabled the
counties to obtain partial federal funding for the handling of these
-100-
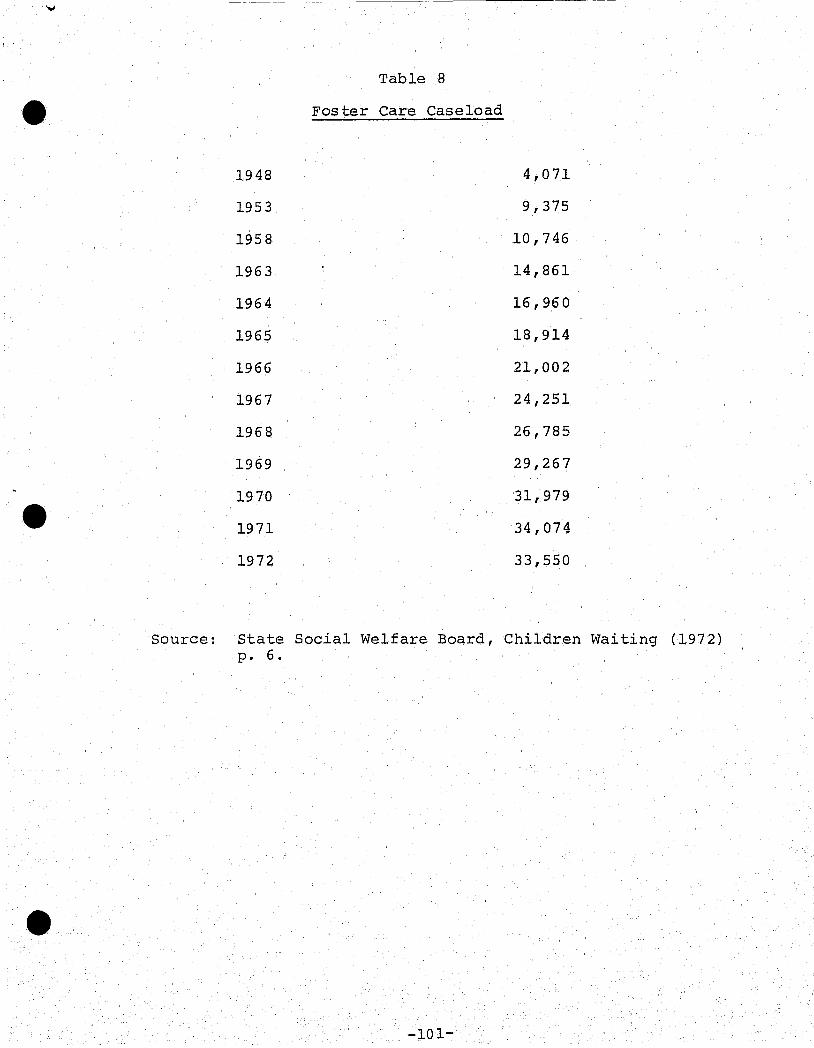
e
Table 8
Foster Care Case10ad
1948 4,071
1953 9,375
1958 10,746
1963 14,861
1964 16,960
1965 18,914
1966 21,002
1967 24,251
1968 26,785
1969 29,267
1970 31,979
1971 34,074
1972 33,550
Source: State Social Welfare Board, Children Waiting (1972) p. 6.
-101-

cases.)
What little data there is, however, suggests that the budgets
for the care of court wards have increased substantially. In Los
Angeles County, for example, both foster home placements and pri
vate institutional placements have increased in recent years, as
shown in Table 9.
[Insert Table 9 here]
D. School Costs and Probation Subsidy
Another area of possible cost to the county is that of schooling.
If juvenile commitments to the Youth Authority are reduced, it is
reasonable to assume that more youths will be enrolled in local
schools. Some school officials have also argued that, since school
problems and juvenile delinquency often go hand in hand, the youths
not committed to the CYA are particularly likely to be school a,nd
discipline problem cases.
Obviously a number of commitment reductions--even if all are
assumed to be in school--is only a very minor proportion of the
total school population. At its maximum the number of juveniles not
committed is estimated at 3,000 in 1971-72 as compared with a total
school population of the year of over 4,000,000. 24 Based on a
statewide average cost of $800 per pupil per year the cost to the
counties of educating all the commitment reductions would be roughly
$2.5 million. 25 While this is only a small portion of the total
state school budget of $4 billion, it is a sizeable portion of the
subsidy payments of $15 million.
A survey conducted by CYA staff in 1969, however, found that
"the number of persons attending school who are granted probation
in lieu of state commitment is relatively small considering that
-102-

.. ----,...-
Table 9
Foster Home and Private Institution Placements
Los Angeles County
Foster Home Private Institutional Placements Placements
Non-Criminal Criminal Non-Criminal Criminal Delinquencies Offenses Delinquencies Offenses
1968 302 122 577 376
1969 391 136 513 247
1970 378 113 511 344
1971 509 167 779 438
Source: Los Angeles Probation Department, Division of Research.
-103-

most of these offenders have either completed their secondary edu
cation, dropped out, or are employed. "26
The impact of those who do remain is further reduced by the
fact that 30 to 40 percent of the cost of the schools is borne by
27 the state and federal governments. Moreover, even CYA cases in-
volve some educational expense to the counties. When returned to
the local community on parole, these cases are generally in the local
schools to the extent that they are in schools at all.
If it is assumed that one third of the commitment reduction
cases are in some kind of school, the additional county expense for
handling these is probably no greater than $350,000. This figure
of course assumes that these students are like all others and does
not take into account any particular problems attributable to them.
School officials tend to feel that these students pose special pro-
blems. This has not been demonstrated in any significant way, how
ever. In addition, some probation departments have developed special
liaison programs with the schools to minimize any added problems.
For these reasons, a 1970 study by a state task force concluded
that the problem was not of sufficient magnitude to warrant any shift
in funds to the school system for the probation sUbsidy program. 28
E. Welfare Costs
The desire to keep convicted men and women gainfully employed
while they pay their debt to society was one of the motivations behind
the probation subsidy program. A person who has a steady job is
more likely to avoid future criminal activity and to make restitution
to the injured party than an unemployed defendant. Additionally, if
the breadwinner is able to stay on the job while completing his
sentence, his family is less likely to go on welfare.
-104-

----------------------------------------------' .... ----
Approximately five percent of all AFDC families indicated that
they needed help from welfare because the husband was incarcerated. 29
Based on the total number of persons incarcerated, this suggests
that as many as 20 to 40 percent of men in prison in California
have families that are enrolled in the Aid to Families with Depen-
dent Children Program.
Assuming that these families were not already on welfare at
the time of the breadwinner's commitment to prison, this means that
statistically, for every five men retained in the community, one or
two families avoid being placed on welfare. Based on these figures,
the existence of the subsidy program has kept from 200 to 600 families
per year off ·the welfare rolls. In economic terms this means savings
of something on the order of $360,000 to $1,200,000 per year. Based
on 1972 formulas, approximately half of these savings accrue to the
federal government, 30 plus percent to the state, and less than 20
1 l ' 'd' t' 30 percent to the oca Jurls lC lone
Economically these savings hardly make a dent in the welfare
budget, but in terms of the probation subsidy budget the sums are
considerable. More importantly, the integrity of the family unit
is often·maintained and one fewer problem exists for the family
trying to rehabilitate its head of the household. Overall, the state
and local savings in welfare costs offset one to six percent of the
total cost of the probation subsidy program.
-105-

Notes
Chapter One
1 R. Smith, A Quiet Revolution, (U.S. Department of Health, Educa-tion and Welfare, 1972), p. 11.
2 California Board of Corrections, Probation Study (1964), pp. 91-92 [referred to as 1964 study].
3 Id. at 93.
4 Id. at 94-96.
5 The number of first commitments in 1963-64 was 5,593 CYA and
6
7
8
9
10
5,262 CDC for a total of 10,855. Californi.a Department of Finance, Youth Authority, and County Representatives, State Aid for Probation Services (1970), Appendix J-4.
19§4 Study, supra note 2, at 96-97.
Id. at 97.
Id. at 180.
Ibid.
California Welfare and Institutions Code §1820-26 (West 1972) .
11 Governor of California, Budget Supplement for-Health and Welfare, Education, 1973-74, p. 447.
12 California Department of Finance, A Management R~view of the State's Probation Subsidy Program (1972), pp. 35-36.-
13 Id. at 36.
14 Id. at 37.
15 Ibid.
16 Id. at 38.
17 R. Smith, supra note 1, at 70.
18 See California Department of Finance, Youth Authority and County Representatives, supra note 5, at Appendix K.
19 See Governor of California, Budget, 1964-65, pp. 155-57.
20 1964 Report, supra note 2, at 95.
21 An alternative method. would be to try to identify the specific kinds of cases not now being committed and to cost these cases.
-106-

22 Se(~ Table 5.
23 California Youth Authority, Anm':lal Statistical Report, 1967, p. 2.5.
24 See Governor of California, note 11 supra. The current percentag'e for participating counties is given as an average of 43.4 percent and a median of 49.4 percent.
25 See note 23 supra.
26 See note 9 supra.
27 The CYA and CDC figures are computed somewhat differently. The CYA figures, computed on the basis of parole violations, indicate that 62.8 percent of the wards released to parole supervision in 1964 and 1965 had violated parole status as of December 31, 1970. CYA, Annual Statistical Report, 1970, p. 37. The CDC figures calculated on the basis of returns to institution indicate 49.9 percent of the male inmates released in 1963 had been returned to prison by the fifth year of release. CDC, California Prisoners, 1968, p. 125.
28 See 1964 study, supra note 2, at 90-97.
29 See note 27 supra.
30 CYA, Annual Statistical Report, 1967, p. 28.
31 CYA, Annual Statistical Report, 1971, p. 19. Criminal court commitments have remained relatively stable while juvenile cou.rt commitments have decreased from 6,190 in 1965 to 3,218 in 1971.
32 CDC, California Prisoners, 1964, p. 89.
33 See note 27 supra.
34 CDC, California Prisoners, 1964, pp. 89, 113.
35 California Welfare and Institutions Code §9l2, (West 1972) .
36 See note 11 supra.
37 See note 14 supra.
38 See note 11 supra, at 349.
-107-

Chapter Two
1. This was an important legislative issue in 1970 but has not been since.
2. See CDC Research Division, Civil Commitment Program for Narcotic Addicts, Summary Statistics 1961-62. Pp. 1-3 provide a description of the origin of the CRC program, while the remainder of the report describes the build-up period.
3. Proportionately, a smaller number of marijuana offenders are sentenced to CRC than are other drug offenders. The number of these offenders, however, have increased at a particularly rapid rate. Exclusion of this category, however, would not appreciably affect the increase. It would still- be over 400 percent.
4. See Hirschi and Rudisell, Commitment Reduction and Probation Subsidy; A Summary of Available Data. (Center on Administration of Criminal Justice, University of California, Davis. 1974).
5. It seems likely that at least some of those committed to CRC were CDC or CYA parole cases. These cases would not be considered new commitments and would not be charged against the county.
6. California Penal Code §1203. 03 (a) (West's 1970).
7. K. Mann, Sentencing in California: A Study in Organization Interaction. (Draft thesis for Master's Degree in Law and Society, University of California, Berkeley, 1973, p. 15.
8. Ibid. at 33.'
9. Ibid. at 80.
-108-

Chap'te'r Th'ree
1 California Welfare and Institutions Code § 1825 (West 1972). Payments start at $2,080.
2 See California Youth Authority, Rules, Regulations and Standards of Performance for Special Supervision Programs (October 1969) • R. Smith, A Quiet Revolution (U.S. Department of Health, Education and Welfare, 1962), p. 36.
3 Estimates calculated by dividing end of year (December 31) subsidy case load into total subsidy expenditures 1970-71. Variation in estimate due to totals for case10ads. Cost data from California Taxpayers Association Annual Report, County Budget Appropriations, Case10ad data from California Bureau of Criminal Statistics; Crime and Delinquency in California.
4 California Bureau of Criminal Statistics, Subsidy Ann'l,la1. 1971, pp. 15, 26, 27.
5 See California Penal Code § 19a (West 1972).
6 Budget information from California Taxpayer's Association, Annual Report on County Budget Appropriations, Probation Case10ad data and in the California Bureau of Criminal Statistics, Crime and Delinquency in California, Santa Clara data from Santa Clara County Board of Supervisors, 1970-71 Annual Budgei:, and unpublished material from the Santa Clara County Adult and Juvenile Probation Departments.
7 At least one county has roughly equal costs for adult and juvenile supervision.
8 See note 2 supra.
9 This is common agency practice.
10 The average jail monthly cost is estimated from interview data from Contra Costa, San Mateo and Santa Clara counties, 1970. Juvenile camp and ranch data is from the CYA, !J,npub1ishedrdata, 1970. Private institutional placement costs are estimated from San Mateo county information and from the monthly costs of the available private institutions in Northern California. Actual monthly costs run from practically nothing in some church or charity run facilities to over $1,000 per month in speciality centers. Foster care costs estimated from cost information provided by Orange, San Mateo, and Santa Clara counties. Jail average length of stay approximated from Bureau of Criminal Statistics data coupled with interview material from Santa Clara and San Mateo County. Camps and ranch average length of stay from California Department of the Youth Authority, unpublished data. Average length of stay was 5.2 months during 1970 and 5.6 months for 1971 and 1972. Average length of stay in private placement estimated from San Mateo County data. Foster care stay established from San Mateo County data and from interview material from other counties visited.
-109-

11 Actual distribution of cases determined from the December 31, 1970 case loads of the institutions discussed. California Bureau of Criminal Statistics, Crime and Delinquency, 1970 and 1971 reference tables. Foster care and private institutional case loads estimated from unpublished Los Angeles and San Mateo County data.
12 See California Welfare and Institutions Code § 912 (West 1972).
13 The career costs are taken from the preceding sections. Where ranges were given in the text, they have been averaged for purposes of this table.
14 California Department of Finance, A Management Review of the State's Probation Subsidy Program (1972), pp. 17-18.
15 California Youth Authority, Rules, Regulations and Standards, note 2 supra, at 24-26.
16 See Chapter One, note 28 supra.
-110-

Chapter Four
1. See California Assembly, 1970 Session, A.B. 1968.
2. Robert Smith, A Quiet Revolution, U.S. HEW Pub. No. (SRS) 72-26011 (1972), p. 50.
3. California Bureau of Criminal Statistics, Crime in California, 1960; Crime and Delinquency in California 1972, Reference Tables, Adult Prosecution, p. 20. The rate per 100,000 population was 60.9 in 1960 and 104.2 in 1972.
4. Table 3.
5. See Hirschi and Rudisell, Commitment Reduction and Probation Subsidy: A Summary of Available Data (Center on Administration of Criminal Justice, 1974).
6. See Table 3.
7. See Hirschi and Rudisell, note 5 supra.
8. Based on averages found in the sources cited in note 3 supra.
9. There is no reliable cost data available. The 1970 National Jail Census reported operating expenditures of $60.9 million for all California jails in 1970. Based on the one day jail census figures, this would average $6.45 per inmate per day in operating costs. See U.s. Department of Justice, Local Jails (1973), p.333.Unpublished data from individual counties, however, suggest that this figure is too low.
10. California Welfare and Institutions Code l825(j) (West's Supp. 1974).
11. California Youth Authority, Rules, Regulations, and Standards of Performance for Special Supervision Programs (1969 Revised), p. 3.
12. California Bureau of Criminal Statistics, Crime in California, 1968, p. 168.
13. California Bureau of Criminal Statistics, Juvenile Camp runaway Repo~t (1967), p. 2. Juvenile Probation and Debention, 1971, p. 53. The total went to 8554 in 1969 but declined to 6941 in 1970 and 5707 in 1971. Ibid., 1969, p. 65.
14. See Hirschi and Rudisell, note 5 supra.
15. California Bureau of Criminal Statistics', California Juvenile Camps and Recidivism (1960), p. 22.
16. The following information was compiled from interviews with camp and ranch personnel in Alameda, Contra Costa, Los Angeles, Santa Clara, San MatAo and San Diego Counties.
-111-

17. See e.g., California Bureau of criminal Statistics, Juvenile Camp Runaway Report (1967) for a description of camp runaways.
18. These feelings are similar to those of both the jail staff and the prison staff.
19. See Leroert and Dill, Offenders in the Community: Probation Subsidy in California (Center on Administration of Criminal ,Justice, 1974), chapter 3.
20. CYA Annual Report, 1964, p. 11; 1972, p. 22. Examination of individual camp records in several counties also supported this conclusion.
21. California Legislature, Joint Legislative Audit COronQttee, Report on Foster Care in California (1973) ,p. 1. The committee estimated that the 40,000 to 50,000 children covered by its report included 60 to 75 percent of all foster care cases in the state.
22. State Social Welfare Board, Children Waiting (1972), p.l.
23. Ibid., unpublished table 31.
24.
25.
California State Department of Education, Enrollment in California Public Schools, Spring and Fall, 1972.
This figure is. computed by dividing the total non-capital expenditures for elementary, high school and unified school districts by the enrollments. The figure used is the 1968-69 figure. Later figures would be higher and earlier oneS lower.
26. See California Department of Finance, Report on State Aid for Probation Service (1970), p. 26.'
27. The formulas vary by county and year.
28. See note 26 supra.
29. See U.S. Department of Health, Education and Welfare, Social Rehabilitiation Service, 1967 Study Data, Table 22; 1969, Table 14.
30. California Statistical Abstract, 1973, p. 53.
-112-

Top Related