


Languages
Pages
Legal


An Empirical Study on Economic Prosperity and Peace
KaManHo
Ivo Dinov
Department of Mathematics and Department of Statistics
Given that the world is a more integrated global system than ever before, trad
ing is recognized as a fundamentally important component of economic
prosperity. However, economic prosperity of a particular country can also de
pend heavily on the peacefulness of a given country. Peacefulness may only serve
as the key component that permits a country to achieve economic prosperity.
Moreover, it is possible that peacefulness has a mechanical impact on econom
ic prosperity. The motivation of this research was to investigate the permissive
and the potential mechanical influence of peacefulness in economic prosperity.
Economic prosperity and peacefulness were measured quantitatively using the
Multiple-Variable Log-Linear Regression Model and the Discrimination Analysis
statistical methods. The first approach showed an overall trend asserting a sig
nificant positive correlation between economic prosperity and peace. The second
approach was an attempt to classify countries into groups. Further examination
of shared characteristics within each group affirmed the classification results of
this approach and the positive correlation from the Multiple-Variable Log-Linear
Regression Model. The results generated by the two methods were integrated by
combining the residuals generated by the first approach and the colored labels
generated by the second approach. The integration stated a fair challenge to the
Neoclassical Modem Growth Theory's assumption that exogenous forces do not
have any mechanical impact on economic development.
UCLA UNDERGRADUATE SCIENCE JOURNAL I VOLUME 26, SPRING 2013 30
KA MAN HO
INTRODUCTION
Economic factors are likely part of the forces that help explain why conflicts develop, or on the contrary,
why peaceful societies exist. The principle economic
reason for countries to fight is to secure more resources.
Conversely, countries have incentives to avoid engaging in wars and military disputes with their trading partner
countries in order to maintain their commercial interests. The Capitalist Peace Theory asserts that economic development increases interdependence of commerce among nations and as a result, the profits generated provide strong incentives to avoid wars (Weede, 1996). The
relationship between economic development and war can take one of two forms: the Capitalist Peace Theory
(economic prosperity decreases wars) or its converse
(wars decrease economic prosperity). The roots of the
Capitalist Peace Theory can be traced back to German
philosopher Immanuel Kant when he wrote "the spirit of commerce that sooner or later takes hold of every na
tion and is incompatible with war" (Butler, 1939).
John Maynard Keynes also wrote about the interplay
of economics and peace. In his book "The Economic Consequences of the Peace after World War I," he
presented his criticisms of the Versailles Treaty, stating that the economic terms of the treaty prevented Europe
from prospering by failing to provide an equitable, ef
fective, and integrated economic system (Keynes, 1919). Nevertheless, empirical studies and the litera
ture in economics and social science show contradicting
"results in the discussion of the relationship between peace and economic prosperity. Erik Gartzke argued
that capitalism leads to peace (Gartzke, 2007). The word capitalism in Gartzke 's work indicated economic
freedom, including economic development, financial
markets and monetary policy coordination (Gartzke and Li, 2003). In a 2012 case study of Palestine, Raul Caruso and Evelina Gavrilova investigated the qualitative
association between Palestine's internal violence and the
economic variable unemployment rate among male and
female youth. Unemployment of among male youth was identified to be a significant component of Palest inian
violence (Caruso and Gavrilova, 2012). The contradicting results in these empirical studies demonstrate
that the role of peacefulness on economic prosperity remains ambiguous.
The Neoclassical Growth Model has been one of the most important economic frameworks that underline
long-run economic growth. In the Solow Growth Model,
economic development or prosperity are driven by labor,
capital, and technology under the assumption that firms in the economy are competitive (Solow, 1956). Labor, capital, and technology serve as endogenous forces that
determine economic development (Solow, 1956). Based
on this model, Cass, Koopmans, Lucas, and Romer formed the modern Neoclassical Growth Theory
in which technology and capital are the endogenous driving forces of long-run economic growth (Solow, 1956; Cass, 1956; Koopmans, 1963; Lucas, 1988;
Romer, 1991). The Neoclassical Growth Theory
assumes that exogenous factors, i.e. factors other than labor, capital, and technology, have neither
mechanical nor deterministic effects on economic
development. The exogenous factors, including
peacefulness, policies, history, and culture, only serve as a necessary framework or suitable environment that
permit an economy to prosper (Harberger, 2005). In
essence, under the Neoclassical Growth Theory,
labor, capital, and technology are the prerequisites
for economic growth, while peacefulness serves as an element that contributes to economic growth rather
than being a prerequisite. Despite the fact that interna
tional trade generally was not present in Solow's original
model, Lucas and Romer expanded the analysis to
include international trade across the borders of close
economies because of the growing importance of
commerce in the globalized world. The inclusion of
international trade was crucial to this paper because it
begged the question of whether "the spirit of commerce"
is compatible with war (Butler, 1939). If labor is assumed to be mobile, that it can move from country to
country, the wage rate of labor for a given skill level will
enhance the wealth of the country if and only if trade of
capital goods is included in the model (Lucas, 1988).
Lucas supported his argument with the growth miracles
of Korea, Taiwan, Hong Kong, and S ingapore by
suggesting that increases in exports were associated with
economic development (Lucas, 1988).
Compared to the endogenous forces, exoge
nous forces such as policy, historical events, and social
structure provide a suitable environment for economic prosperity. In other words, economic growth is not
guaranteed if a given country maintains efficient
policies and peaceful conditions. However, the absence of such an environment hinders prosperity. Peacefulness
is a complicated state influenced by policy, history,
social structure, and many other exogenous forces. The
purpose of this present paper is to investigate whether
peacefulness has real effects on a country's economic
state beyond merely providing a suitable environment
for economic prosperity to occur. This paper discusses
empirical analyses carried by the Multiple-Variable Log
Linear regression model and the Discrimination Analysis
to see whether economic prosperity and peace interact
with each other.
31 UCLA UNDERGRADUATE SCIENCE JOURNAL I VOLUME 26, SPRING 2013

MATERIALS AND METHODS
DATA
The data in this research came from the
following sources. For the Log-Linear Model, Global
Peace Index (GPI) and Global Competitiveness Index
(GCI) was provided by the Institute of Economics and
Peace and the World Economic Forum accordingly
(Institute of Economics and Peace, 2012; World
Economic Forum, 2010). The exports and imports data
came from the United Nations Statistics Commodity
Trade Statistics Database (United Nations Statistics
Commodity Trade Statistics Database, 2012). The
remaining data, exports and imports as a percent
age of Gross Domestic Product (GOP), in the Log
Linear Model was provided the World Bank (World
Bank, 2012a; World Bank, 2012b). The data used
in this study is available from 2007 -2011 (2011 data
was partially incomplete when this study was conduct
ed). The Log-Linear Model and the Discrimination
Analysis of data from 2007 -2011 yielded similar
results. This manuscript only presented the result
of 2010 by the Log-Linear Model and the results of
2010 and 2011 by the Discrimination Analysis.
AN EMPIRICAL STUDY ON ECONOMIC PROSPERITY AND PEACE
SELECTION OF VARIABLES AND MODELS
Economic prosperity in this research was
captured quantitatively by variables including the Global
Competitiveness Index (GCI), exports, and imports with
exports as a fraction of GOP and imports as a fraction
of GOP. International trade is a crucial component in
economic prosperity and it is well represented by these
variables. GCI is a quantitative component of over 110
variables, including the nature of comparative advan
tage, productivity, and technological innovation (Sala
i-Martin et aI., 2010). The index is a synthesis from
macroeconomic and microeconomic perspectives. In
addition, peacefulness was captured quantitatively by
the variable Global Peace Index (GPI) by the Institute
for Economics and Peace (IEP) which had 23 indica
tors, including neighboring country relations, access to
weapons, and violent demonstrations. As a frequently
used measurement of national peacefulness, Global Peace
Index (GPI) is used by governments and institutions all
over the world including the World Bank, the OECD,
and the United Nations. As a frequently- used measure
ment of national peacefulness, Global Peace Index (GPI)
is used by governments and institutions all over the
world including the World Bank, the OECD and the
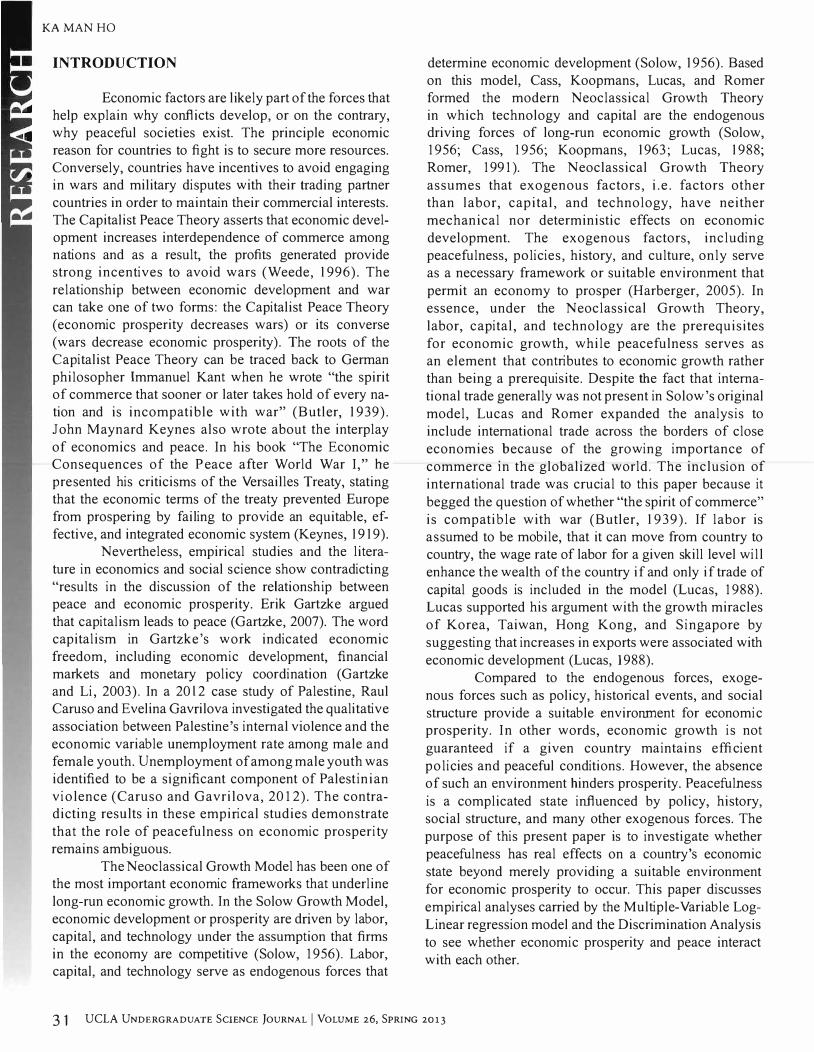
United Nations. A higher value of GPI indicates an
Figure 1. 2010 Global Peace Index (GPI) Map, courtesy Institute for Economics and Peace. Countries in green had smaller values of GPI scores, meaning they
tended to be more peaceful. More red colored countries indicated larger GPI values, or countries more prone to conflicts. Reprinted 2012 Global Peace Index Map
with permission from the Institute for Economics and Peace.
UCLA UNDERGRADUATE SCIENCE JOURNAL I VOLUME 26, SPRING 2013 32
KA MAN H O
increased presence of wars, disputes, or internal conflicts
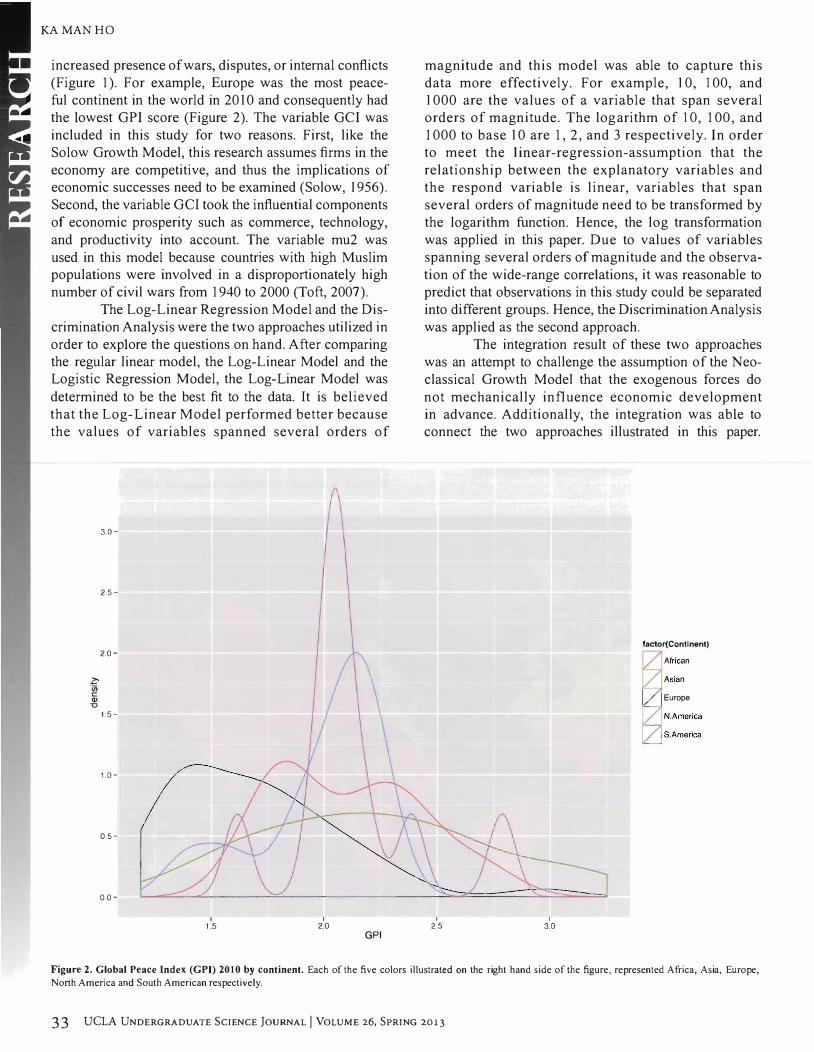
(Figure 1). For example, Europe was the most peaceful continent in the world in 2010 and consequently had the lowest GPl score (Figure 2). The variable GCl was
included in this study for two reasons. First, like the
Solow Growth Model, this research assumes firms in the
economy are competitive, and thus the implications of economic successes need to be examined (Solow, 1956).
Second, the variable GCI took the influential components
of economic prosperity such as commerce, technology,
and productivity into account. The variable mu2 was
used in this model because countries with high Muslim populations were involved in a disproportionately high
number of civil wars from 1940 to 2000 (Toft, 2007).
The Log-Linear Regression Model and the Dis
crimination Analysis were the two approaches utilized in order to explore the questions on hand. After comparing the regular linear model, the Log-Linear Model and the Logistic Regression Model, the Log-Linear Model was
determined to be the best fit to the data. It is believed
that the Log-Linear Model performed better because
the values of variables spanned several orders of
z. "(ij c <V u
3.0 -
2.5 -
2.0-
1.5-
1.0 -
0.5 -
0.0-
I 1.5
I 2.0
GPI
magnitude and this model was able to capture this
data more effectively. For example, 10, 100, and 1000 are the values of a variable that span several orders of magnitude. The logarithm of 10, 100, and
1000 to base 10 are 1, 2, and 3 respectively. In order to meet the linear-regression-assumption that the
relationship between the explanatory variables and the respond variable is linear, variables that span
several orders of magnitude need to be transformed by
the logarithm function. Hence, the log transformation
was applied in this paper. Due to values of variables spanning several orders of magnitude and the observa
tion of the wide-range correlations, it was reasonable to predict that observations in this study could be separated
into different groups. Hence, the Discrimination Analysis
was applied as the second approach. The integration result of these two approaches
was an attempt to challenge the assumption of the Neo
classical Growth Model that the exogenous forces do
not mechanically influence economic development in advance. Additionally, the integration was able to connect the two approaches illustrated in this paper.
I 2.5
I 3.0
factortConllnenl) r
Europe
Figure 2. Global Peace Index (GPI) 2010 by continent. Each of the five colors illustrated on the right hand side of the figure, represented Africa, Asia, Europe, North America and South American respectively.
33 UCLA UNDERGRADUATE SCIENCE JOURNAL I VOLUME 26, SPRING 2013

The role of the residual, G, in the Log-Linear Regression
Model was an estimate of factors that the model did not embrace. For instance, some factors of the residual in
clude historical events, economic policy, and beliefs that people collectively share in society. The Discrimination
Analysis, on the other hand, classified countries into
colored labels according to values of GCI and GPI. Since
both the residual and the colored labels were engendered numerically so they could be compared, it may prove
beneficial to combine the two. Therefore, this study pre
sented the integration of the two approaches.
THE MULTIPLE-VARIABLE LOG-LINEAR REGRESSION
MODEL
loge GPI) = �o + �l Gel + �2 Mu2 +�) 10g(Military) + �410g(Trade) + G
Tn the above Multiple-Variable Log-Linear Re
gression Model, log was the mathematical logarithmic
function, GPI (Global Peace Index) was the response
variable, GCI was the Global Competitiveness Index,
mu2 (dummy variable) was the population proportion that self-identified itself as a percentage of Muslim population, military was military expenditures as a frac
tion of Gross Domestic Products (GDP), trade was total
imports and exports per capita :trade = eXPOrtB+irnpOrtB), and G populaoon was the residual or the error term. Table 1 presents some
selected data from the Log-Linear Model. Assumptions
of the Log-Linear Model had to be checked before the
model was applied to the data. Major assumptions of the
Log-Linear Model include homoscedasticity, normality, the independence of errors, and linearity. First, homoscedasticity asserts all variables have the same variance.
Second, normality means that variables are normally
distributed because relationships and significance tests can be distorted if distributions are highly skewed. Third, independence of errors assumes errors of observations
are uncorrelated. Lastly, linearity states that an accurate
linear relationship between the explanatory variables and
the response variable exists. There were no violations of homoscedasticity (Figure 3A) or normality (Figure 3B).
The two additional assumptions, the independence of errors and linearity, were further examined to ensure that
the linear regression model is a good fit to the data.
THE DISCRIMINATION ANALYSIS
The second method, the Discrimination Analy
sis, classifies countries into different groups in order to
further investigate the relationship between economic
prosperity and peace. Traditional discrimination analysis
attempts to minimize type I and type II errors in order
to exclude them. A type I error is a false positive while
a type II error represents a false negative. This paper
AN EMPIRICAL STUDY ON ECO NOMIC PROSPERITY AND PEACE
Country GPI -I
Gel E�ports Imporl!1 Mul Miljl..llr�· Pupulation
���T962-- 3�5--" 68,134,07T4'i7---- ·S6·.��of29jj061 0.9 '403is])5i--Cyprus 2.0D 4.5 1.506.457,95.3 8.644.721,987 2.2 801.851
Ucorgia 297 :1.86 1,58).J37.� 5:095:2-4'f80�" --+c;---+'-J .9;;--- r"""/I . .JSi;ooo-4.896.700 �may- T:;n- ri�f "TIT39-f4J4 ]40- n 151.682.439 i 1.6
. RUSSIa 'io"f:3- U.i.� i 460TOO,OO(Y:�� �fiOO:OOO.ooo 12 . 11·----j"14·I,'J27.297
Table I. Select countries in the Multi-variable Log-Linear Model. In the Log-Linear Model, the variables GPI, GCI, exports, imports, M u2, military and population indicated peacefulness, competitiveness, exports, and imports of all categories of commodities, M uslim population proportion, military expenditure as a fraction of GOP, and population respectively. All available data for each country was included from the Institute of Economics and Peace, World Economic Forum, the World Bank and the United Nations Statistics Division. GPI was the response variable.
A
;;;
�
0 ci
9
'/' 0.3
B M �
! N J
Residuals vs Fitted
.. '
o c --'b--,. ;;--
o 00
o 0
0.4 0.5 0.6 0.7 0.8 0.9 Fitted values
Im(IogGPI,... Gel + Mu2 + logMilitary + logTrade)
Normal a'-'-Q=--_____ �_. _____ . _____ _
-2 -1 TheoreTica! Ouanlifes
Im(logGPI - Gel + Mu2 + IogMilitary + IogTrade)
0 0
1.0
Figure 3. Checking assumptions for the Log-Linear Model. (A) The Residual vs. Filted-Value Plot. There were no identifiable patterns iu this plot so the standard deviation error was constant with respect to predictors that the assumption of homoscedasticiry held. (B) This QQ-Plot indicated that residuals were approximately nom1ally distributed.
presented a different approach: high values of type I and
type II errors were allowed as a means to further examine observations that fell into these groups.
Including the type I and type II errors groups, there were four groups of countries classified by the Discrimination
Analysis in total.
UCLA UNDERGRADUATE SCIENCE JOURNAL I VOLUME 26, SPRING 2013 34
". ..
!: " ..-".
; ••

KA MANHO
The Discrimination Analysis consisted of two
steps of classifications that are analogous to cutting a
cake into two pieces and then further cutting each piece
into two. This would separate countries into four groups
by the classification strategy of the Discrimination
Analysis: in the data from 20 11, the median GCI was
4.72. If GCr > 4.72, a country was classified as True,
otherwise it was classified as False (Table 2). This
classification rule was also used for data from 2010.
This process separated countries into two distributions
(Figure 4). The intersection of these two distributions
under GPr was the next splitting-point for further
classification, which was approximately GPr = 1.68.
Let the next splitting-point be X, if GPI < X that particular
country was classified to be labeled True, otherwise
it was classified to be Labeled False (Figure 4). If
GPI < 1.68, the country was classified as labeled True,
otherwise it was classified labeled False. Therefore, a
country could be classified as True or False in the first
step, and the very same country could also be classified
to be labeled True or False in the second step. Two-by
two matrices were created by this classification strategy
in order to capture each country's designation (Table 3).
The terms "more/less competitive" and "morel
less peaceful" were used for convenience to describe
countries in this paper. A country was "more competi
tive" if GCI was larger than 4.72 and "less competitive"
otherwise. This classification rule was noted as "the first
classification" in the present paper. A country was "more
peaceful" if GPI was larger than the intersection point
of the two distributions in the first classification. The
colored labels were used to clarify classifications. With
lower GCI and higher GPr scores, "yellow" represented
"less competitive, less peaceful" countries. "Green"
represented "more competitive, more peaceful"
countries. "Blue" represented "less competitive, more
peaceful" countries. "Red" represented "more competi
tive, less peaceful" countries (Table 3). For instance, in
2010, the United States' GCI and GPI were 5.43 and
2.06 respectively. Since GCr = 5.43, the country was
classified to be True or more competitive in the first
step. The intersection point of the intersection point of
the two distributions generated in the first classification
was 1. 68. Since GCr = 2.06, the country was classified
to be labeled False or less peaceful in the second step.
Hence, United States was classified as a "red" country
in the year 2010. Lastly, the two methods displayed in
this paper were integrated by analyzing the role of
residuals generated in the first approach on colored
labels generated by the second approach.
More data was missing for 2011 compared to
that of 2010 because the 2011 data was incomplete when
this research was conducted. The missing values of2011
Classification (Labeling)
Countr,Y classitication conditions
GCI S 4.72
Index
GPI2: x
Table 2. The classification strategy of the Discrimination Analysis. If GCI > 4.72, a country was classified as True, otherwise it was classified as False. This classification was based on GCI being equal to a certain value, i.e.
GCI = 4.72, generating two distributions. Let the intersection of these distributions be X. A country was claimed to be Labeled True if GPI < X, otherwise it is claimed to be Labeled False.
f �(Yl)
o
Figure 4. Discrimination Analysis 2011. The Median of Global Competitive
ness lndex (GCI) was 4.72. If GCI > 4.72, a country was classified as True (the green distribution as factor Y I = I illustrated in the plot), otherwise it was classified as False (the red distribution as factor Yl=O illustrated in the plot).
In this figure, both the green and the red distributions were plotted under the Global Peace Index (GPI). The intersection was approximately GPI = 1.68. If GPI < 1.68, the country was classified as labeled True, otherwise it was classified as labeled False. Type I error was filled with red color while type
II error was filled with blue color. The four colors represented four groups of countries classified by the Discrimination Analysis.
Labeled FAlse Labeled True
F 76 16
Table 3. The Discrimination Analysis o f the year 2011 and 2010. In this
paper, a country was "more competitive" if GCI was larger than 4.72 and
"less competitive" otherwise. A country was "more peacefUl" if GPI was
larger than the intersection point of the two distributions generated in the first classification. With lower GCI and higher GPI scores, "yellow" represented "less competitive, less peaceful" countries. "Green" represented "more
competitive, more peacefUl" countries. "Blue" represented "less competitive, more peaceful" countries. "Red" represented "more competitive, less peacefUl countries." (A) Two-by-two matrix (2011) created by the mechanism in Figure
3. (B) Two-by-two matrix (2010) created by the mechanism in Figure 3. The
first splitting point in the classification was GCI=4.72 (same as the median of GCI in the analysis of 201 I) instead of the median of Gel in the 2010 data
for convenience.
35 UCLA UNDERGRADUATE SCIENCE JOURNAL I VOLUME 26, SPRING 2013

distorted a few classification results produced by the
Discrimination Analysis compared to the 2010 results. For instance, the country Botswana's GPI and GCI are respectively 1.641 and 4.05 in 20 10, and 1.69 and
4.05 in 20 II. The country was classified to be a "blue" country in 2010, yet with similar values of GPI and GCI
it was classified to be a "yellow" country in 2011. This
is because the "yellow" countries tended to have more
missing values on the variable GCI. Despite the distor
tion by the missing values, the conclusions from analyses of both years yielded similar results, which strengthened
the overall conclusion since similar results are given regardless of number of observations in the classification.
THE INTEGRATION OF THE LOG-LINEAR MODEL AND THE
DISCRJMINATION ANA LYSIS
The set of observations in the integration result is a proper subset of the set of observations in the Discrimination Analysis. There were unequal numbers of countries of different colors in the integration part
compared to the previous Discrimination Analysis part.
F or instance, there were 16 "blue" countries in the Discrimination Analysis, while the numbers of the "blue" countries dropped to 13 in the integration part. It is
because a country was qualified to be an observation
in the Discrimination Analysis if there were no missing
values in GPI and GCI. In comparison, a country was qualified to be an observation in the integration part
only if there were no missing values in GPI, GCI, mu2, military, exports, imports, and population, which
were necessary for the Log-Linear Regression Model. The colored labels for each country produced by the Dis
crimination Analysis were paired up with the residuals £
produced by the Log-Linear Model. The residuals were
ranked in descending order in order to inquire whether
there was a numerical relationship or pattern between the colored labels and the residuals. These patterns revealed
the interaction between the outside forces represented by the residuals and economic prosperity.
RESULTS
THE MULTIPLE-VARJABLE LOG-LINEAR MODEL
ASSERTED AN OVERALL TREND OF A POSITIVE CORRELA
TION BETWEEN ECONOMIC PROSPERJTY AND PEACE
As an example calculation, in 2010, the GPI, in
tercept GCI, mu2, military, trade, and the residual £ of United States were 2.06, 1.57, 5.43, 0,4.8 10464.09 and -0.503 respectively as shown in the equation below.
log(2.06) = 1.57 - 0.108 * 5.43 + 0.00112 * 0 + 0.122 * 10g(4.8) - 0.0624 * log(l0464.09) - 0.5 = 0.313
AN EMPIRICAL STUDY ON ECONOMIC PROSPERITY AND PEACE
Estimating the result of the Log-Linear Model regression
function was as follows:
10g(GPJ) = 1.57 + 0.108 Gel + 0.00112 Mu2 + 0.122 10g(Military) + 0.0624 10g(Trade)+ £
The p-values of the explanatory variables GCI, mu2, military, and trade were 0.0250, 0.899, 2.82 and 0.00223
respectively. Except for mu2, all the explanatory varia
tions were statistically significant at the significance level of 0.05. For every unit increased in GCI, GPI tended to decrease by 0.108%. For every percentage
increased in military expenditure, GPI tended to
increase by 0. 122%. For every percentage increased
in the United States' trade, GPI tended to decrease by 0.0624%. Upon expanding this calculation to all
the countries for which data was available, this model indicated that 55% (R2 = 0.55) of the variability of peacefulness (GPI) was explained by the four indepen
dent variables in the Log-Linear Model.
THE D1SCRIMfNATION ANALYSIS CLASSIFIED COUNTRIES
INTO FOUR TYPES IN WHICH THE POSITIVE RELATION
SHIP BETWEEN ECONOMIC PROSPERITY AND PEACE WAS
FURTHER ILLUSTRATED
The relationship between economic prosperity
and peacefulness was further investigated by the Discrim
ination Analysis, in which the corresponding variables
Global Competiveness Index (GCI) and Global Peace
Index (GPI) were studied. The classifying mechanism in
Figure 4 generated the matrices in Table 3. The type I
and type II errors were quite high in this analysis. There
were four groups of countries, i.e. "yellow," "green,"
"blue," and "red" countries produced by the Discrimi
nation Analysis (Figure 4 and Table 3). The "yellow"
and the "green" countries indicated positive correlations
between economic prosperity and peacefulness, or in
other words, a negative correlation between Global Peace
Index and Global Competitiveness Index. It is because
a larger GPI value indicated less peace while a larger
GCI value indicated greater economic competition. In
both the 20 I 0 and the 2011 analyses, the number of the
"yellow" and the "green" countries exceeded the
number of the "red" and the "blue" countries (Table 3).
From both the Log-Linear Regression Model and the
Discrimination Analysis, there are clear associations
between economic prosperity and peace among the
"yellow" and the "green" countries. The "red" and the
"blue" countries would be further investigated.
UCLA UNDERGRADUATE SCIENCE JOURNAL I VOLUME 26, SPRING 2013 36

KA MAN HO
FURTHER INVESTIGATION OF THE DISCRIMINATION
ANALYSIS RESULTS OF THE "RED" AND THE "BLUE"
COUNTRJES CONSOLIDATED THE POSITIVE CORRELATION
OF ECONOMIC PROSPERITY AND PEACE
In 2011, Israel, South Korea, France, United States, and China were the only five "red" countries produced by the analysis. The ongoing Israeli-Palestinian conflict, poor relations between North and South Korea, United States' and France's war with Afghanistan, and China's participation in disputes in Pacific Asia were all elements that would help to explain the negative correlations between economic prosperity and peacefulness among these "red" countries (Table 4A). The "blue" countries were Slovenia, Portugal, Slovakia, Hungary, and Poland in 20 11 (Table 4B). The ranking of GDP by capita of the countries in Table 4B were 36, 39, 44, 49, and 51 out of 194 respectively. Exports and imports constituted a large proportion of GDP in these countries. In fact, Table 4B showed the medians of exports and imports as percentage of GDP were 72 and 71 accordingly. Except for Poland, all the four countries were considered developed countries. There are different definitions and criteria in terms of determining a developed country. Including income per capita, GDP per capita, and industrialization, these economic criteria dominate in developed countries. The index used in this paper was World Bank High-Income Economies (WB HIE). In 2010, there were 16 countries classified as "blue" (Table 4C). These 16 countries were considered less competitive by the classification strategy in Figure 4, yet they were very competitive compared to the 16 countries with the highest GPI in terms of exports and imports as a fraction of GDP (Table 4D). Interestingly, the median of exports (% of GDP) and imports (% of
Rwanda, Pakistan, Panama, Russia and Mexico
.u;.''''U'. '--'III.UI •. ':)Jngapore.
Slovenia, Portugal, Slovakia, Hungary and Poland (all)
Israel, South Korea, France, United States and China (all)
B �81ue" Country Exports (% of GDP) Imports (% of GDP) GPI
(2011)
Slovenia 72 71 1.36
Portugal 36 39 1.45
Slovakia 89 86 1.58
. -Hungary 92 85 1.5
Poland 40 42 1.54
Median 72 71 1.5
c "Blu." Country Exports (% of GDP) Imports (% ofGDP) GPI
(2010)
Iceland 56 46 1.212
Italy 24 24 1.701
Spain 27 29 1.588
Oman 56 39 1.561
Slovenia 65 65 1.358
Portugal 31 38 1.366
Czech Republic 66 63 1.360
Slovakia 81 83 1.536
Croatia 39 40 1.707
Chilc 38 32 1.616
Hungary 87 80 1.495
Poland 42 43 1.618
Lithuania 69 70 1.713
Botswana 33 40 1.641
Costa Rica 38 40 1.590
Tunisia 49 54 J .678
Median 40.5 43 1.589
D Country 2010 Exports (% ofGDP) Imports (% ofGDP) GPI
Afghanistan 20 67 3.252
Pakistan 14 19 3.050
Israel 37 35 3.019
Russia 30 22 3.013
Georgia 35 53 2.970
Colombia 16 18 2.787
Nigeria 35 30 2.756
Zimbabwe 48 78 2.678
Lebanon 22 50 2.639
Sri Lanka 22 31 2.62 1
Myanmar N .A. N.A. 2.580
Burundi 6 37 2.577
Philippines 35 37 2.574
In dia 23 27 2.516
Ethiopia 14 33 2.444
Turkcy 21 27 2.420
Median 22 33 2.678
Table 4. Examples of the four types of countries and the "Blue" countries investigation in terms of exports & imports (% of GDP). (A) Examples of the "yellow," "green," "blue," and "red" countries in 2010. All countries were listed for the "blue" and the "red" countries. (B) The five "blue" countries and their corresponding exports (% of GOP), imports (% of GDP), and GPI in 2010. (C) The 16 "blue" countries and their corresponding exports (% of GOP), imports (% of GOP), and Global Peace I ndex. (0) 16 countries with highest Global Peace rndex (GPI) in 2010 and their corresponding exports and imports (% of GOP).
37 UCLA UNDERGRADUATE SCIENCE JOURNAL I VOLUME 26, SPRING 2013

GDP) of the more peaceful "blue" countries were 40.5 and 43 accordingly, while for the non-peaceful countries (countries with highest GPl scores of the year) they were 22 and 33. The data from "red" countries implies that political concerns may outweigh economic incentives to avoid wars in order to trade. Along with the "yellow" and the "green" countries, a positive relationship between economic prosperity and peace can be consolidated among the "blue" countries when economic competitiveness was measured by some different criteria such as imports and exports as a fraction of GDP. The results complemented the initial prediction that observations can be nicely classified into groups.
Moreover, the data of GPl was expanded to additional new countries in a more rapid pace than the data of Gel each year. As a result, the number of missing values for Gel increased every year. In 20 11, there were 25 "new" countries that had their GPI score available, but not the corresponding Gel scores. The median of GPI scores (154 countries) was 1.92 while within the 25 "new" countries, 22 had their GPI scores larger than the overall median of 1.92. The average GPI score indicated that these missing values of Gel might not be at random. The newly investigated countries tended to be less peaceful and had missing values on Gel. A missing value on Gel reflected that the country was paid less attention to in terms of competiveness. With these missing values on Gel, the Discrimination Analysis between Gel and GPI could not be performed and the positive relationship between economic prosperity and peacefulness was underestimated: if there were less missing values on Gel, the statistical evidences of the finding of the significant positive association between economic prosperity and peace would be even stronger.
THE INTEGRATION OF THE DISCRIMINATION ANALYSIS
AND THE LOG-LINEAR REGRESSION MODEL CONNECTED
THE TWO APPROACHES
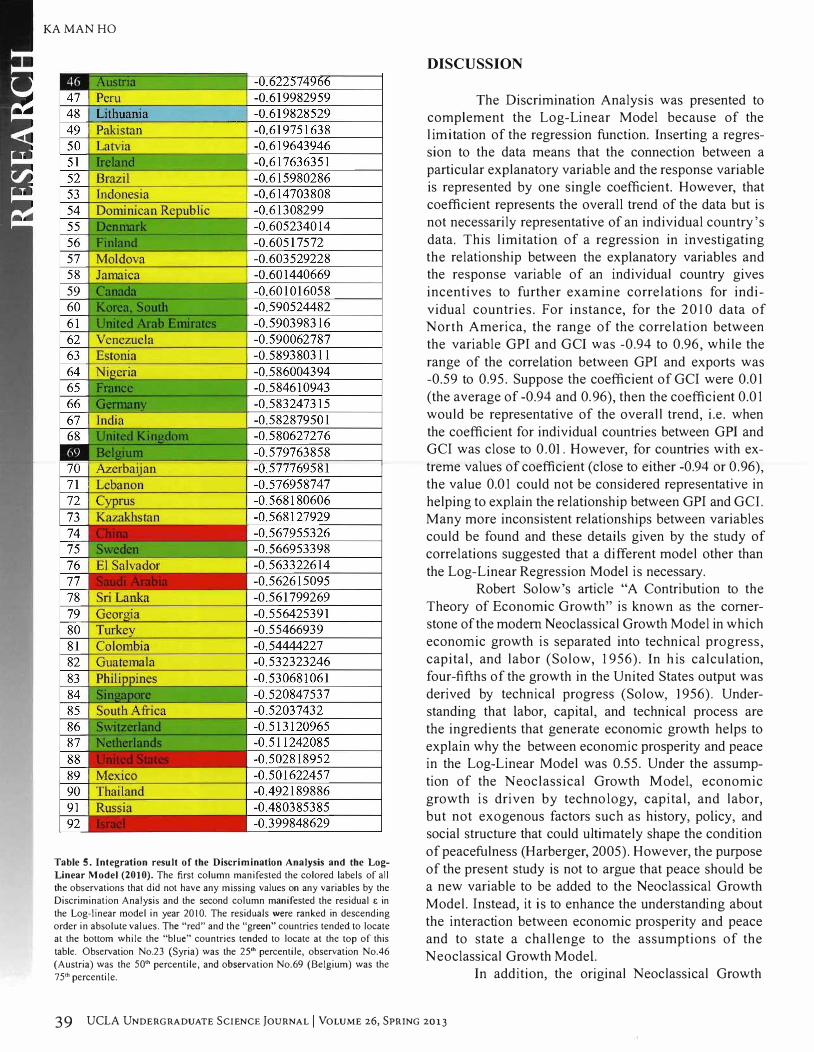
In Table 5, the first column displayed the colored labels produced by the Discrimination Analysis while the second column displayed the residuals £ produced by the Log-Linear Regression Model of all the observations (without missing values in any variables) in the year 2010. In the second column, the residuals £ were ranked in descending order in terms of absolute values. Interesting patterns can be discovered in the observation of the two columns of 92 observations: since the residuals £ were ranked in the table, the "location" of a country (top or bottom in Table 5) indicated some information about the group that the particular country belonged to. Let observation No.23 (Syria) be the 25th percentile, observation No.46 (Austria) be the 50th percentile, and observation No.69 (Belgium) be the 75th percentile. All the "red" countries located at the bottom of the table above 7yh percentile. Twelve out of thirteen (92.31 %)
AN EMPIRICAL STUDY ON ECONOMIC PROSPERITY AND PEACE
"blue" countries located from 0 to 50th percentile. Fifteen out of twenty (75%) "green" countries were located from 50th to 100th percentile. Lastly, the "yellow" countries were uniformly distributed in the table (Table 5). In other words, the "red" and "green" countries tended to attach with smaller residuals £ in absolute values while the "blue" countries tended to attach with bigger residuals £ in absolute values of the Log-Linear Model.
Country and colored Residual £
labels generated by the generated by the Discrimination Analysis Log-linear model
(2010) (2010)
1 Burkina Faso -0.838488888
2 Nepal -0.777859031
3 Zambia -0.770664654
4 Portugal -0.749459608
5 Uganda -0.744212689
6 Egypt -0.74268386
7 Mali -0.739995253
8 Botswana -0.738069924
9 Madagascar -0.73397731
10 Morocco -0.731671492
11 Senegal -0.727057482
12 Ghana -0.717736967
13 Slovenia -0.711872332
14 Nm.rZeaJaad -0.710279302
15 Cameroon -0.700457679
16 Bolivia -0.70020084
17 Jordan -0.699096101
18 Bosnia and Herzegovina -0.696172691
19 Ecuador -0.693202297
20 Nicaragua -0.69314794
21 Armenia -0.690522306
22 Croatia -0.69003018
Syria -0.688728014
24 Albania -0.685593049
25 Czech Republic -0.682888998
26 Greece -0.682543538
27 Chile -0.675182256
28 Kenya -0.673635341
29 Paraguay -0.673112612
30 Ukraine -0.664684744
31 Romania -0.663928797
32 Poland -0.662193962
33 Hungary -0.661920027
34 Slovakia -0.656723093
35 Bulgaria -0.656331974
36 Algeria -0.643262107
37 Zimbabwe -0.642506804
38 JaJaa. -0.640830624
39 Italy -0.638164307
40 T unisia -0.63670312
41 Spain -0.63593585
42 -0.630789828
43 Argentina -0.628588437
44 -0.625316101
45 -0.624558694
UCLA UNDERGRADUATE SCIENCE JOURNAL I VOLUME 26, SPRING 2013 38
KA MAN HO
Table 5. Integration result of the Discrimination Analysis and the LogLinear Model (2010). The first column manifested the colored labels of all the observations that did not have any missing values on any variables by the Discrimination Analysis and the second column manifested the residual & in the Log-linear model in year 2010. The residuals were ranked in descending order in absolute values. The "red" and the "green" countries tended to locate at the bottom while the "blue" countries tended to locate at the top of this table. Observation No.23 (Syria) was the 25'h percentile, observation No.46 (Austria) was the 50'h percentile, and observation No.69 (Belgium) was the 75'h percentile.
DISCUSSION
The Discrimination Analysis was presented to complement the Log-Linear Model because of the l imitation of the regression function. Inserting a regression to the data means that the connection between a
particular explanatory variable and the response variable is represented by one single coefficient. However, that
coefficient represents the overall trend of the data but is
not necessarily representative of an individual country's
data. This limitation of a regression in investigating the relationship between the explanatory variables and the response variable of an individual country gives
incentives to further examine correlations for indi
vidual countries. For instance, for the 20 10 data of North America, the range of the correlation between
the variable GPI and GCI was -0.94 to 0.96, while the
range of the correlation between GPI and exports was -0.59 to 0.95. Suppose the coefficient of GCI were 0.01
(the average of -0.94 and 0.96), then the coefficient 0.01
would be representative of the overall trend, i.e. when
the coefficient for individual countries between GPI and GCI was close to 0.01. However, for countries with ex
treme values of coefficient (close to either -0.94 or 0.96),
the value 0.01 could not be considered representative in
helping to explain the relationship between GPI and GCr. Many more inconsistent relationships between variables could be found and these details given by the study of correlations suggested that a different model other than
the Log-Linear Regression Model is necessary. Robert Solow's article "A Contribution to the
Theory of Economic Growth" is known as the corner
stone of the modem Neoclassical Growth Model in which
economic growth is separated into technical progress,
capital, and labor (Solow, 1956). In h is calculation,
four-fifths of the growth in the United States output was
derived by technical progress (Solow, 1956). Understanding that labor, capital, and technical process are
the ingredients that generate economic growth helps to
explain why the between economic prosperity and peace in the Log-Linear Model was 0.55. Under the assump
tion of the Neoclassical Growth Model, economic
growth is driven by technology, capital, and labor, but not exogenous factors such as history, policy, and
social structure that could ultimately shape the condition
of peacefulness (Harberger, 2005). However, the purpose
of the present study is not to argue that peace should be
a new variable to be added to the Neoclassical Growth
Model. Instead, it is to enhance the understanding about
the interaction between economic prosperity and peace and to state a challenge to the assumptions of the
Neoclassical Growth Model. In addition, the original Neoclassical Growth
39 UCLA UNDERGRADUATE SCIENCE JOURNAL I VOLUME 26, SPRING 2013

Theory assumed that capital was subject to diminishing returns in a closed economy. Diminishing returns im
plies that marginal or per-unit output of production decreases as the amount of product ion increases. A closed economy is a self-sufficient system without
international trade or external assistance. A model capturing economic growth in a closed economy may
not be sufficient for discussion of the present empirical
study because in real life international trade is a signif
icant component in the world economy. Therefore, it
was necessary to take Lucas (1988) and Romer's (1991)
expansion with international trade into consideration.
Economic prosperity in this study was captured by the
variables trade, Ge l, and exportslimports as a percentage of GDP. The selection of these variables in the two approaches was justified by Lucas's finding of the positive assoc iat ion between exports and economic development (Lucas, 1988). The variables in the Log
Linear Model were representative of the endogenous fac
tors including labor, wage rate of labor, capital, tech
nology, and international trade in an open economy. The underlying justification was that large amounts of exports
and imports entailed correspondingly large amounts of labor, capital, and technology as long as international
trade, an indicator that the Log-Linear Model was a good candidate to represent elementary components of the Neoclassical Growth Model, was present. The interac
tion between the explanatory variables and the response variable GPI provided helpful insights into the interaction between economic prosperity and peace. The Log-Linear
Model presented an overall statistically significant trend between economic prosperity and peace.
The Discrimination Analysis presented a further investigation between economic prosperity and peace
by divid ing countries into four types. The results of the "yellow" and the "green" countries complemented the f inding in the Log-Linear Model such that econom ic
prosperity and peacefulness have a positive association, or alternatively a negative cOITelation between Ge l
and GPI. In addition, the discussions of the "red" and
the "blue" countries revealed that each set of countries
shared some characteristics, for instance the "red" countries tended to involve in certain armed conflicts.
In this approach, the classification method, without
intentionally maximizing the success rate in the analysis,
fitted the evidence of similar characteristics between countries that fell into the same group. Shared characteristics, such as engagements in conflicts, could be
found by further investigation among different groups
of countries implied that these countries truly belonged to the same group. For example, based on the numerical
values of Gel and GPI, France and the Un ited States in
2011 were classified to be "red" countries, both of which
AN EMPIRICAL STUDY ON ECONOMI C PROSPERITY AN D PEACE
were simultaneously involved in the armed conflict in
Afghanistan. Furthermore, this classification exposed
that the overall trend of the Log-Linear Model could be interpreted as four distinct groups. The four groups,
i.e. four performance groups distinguished by colors, demonstrated how economic prosperity and peace
interacted with each other at a certain level of
competi tiveness and peacefulness.
In the integration part, the "red" and the "green" countries had a tendency to have smaller values of
residuals £ compared to other countries, which implied
that the statistically signif icant variables Ge l, military, and trade explained a larger proportion of peace within
the "red" and the "green" countries. A small residual in a regression indicated that the geometric distance
between the point of the observat ion and the fitting
straight line of the linear model. One common characterist ic of the "red" and the "green" countries was that they
were more competitive relative to other countries with
a Ge l > 4.72, meaning that these econom ies are prosperous or would potentially become prosperous. These more competitive economies were equipped with suf
ficient labor, capital, technology, population, and other
endogenous elements that determined economic growth
according to the mechanisms of the Neoclassical Mod
em Growth Model. In the present study, these endog
enous elements were represented by the variables Ge l,
exports, imports, and population. To compare, correlating with larger residuals £ within the "blue" countries,
the endogenous forces of the growth theory explained the smaller proportion of peacefulness. In other words,
the exogenous forces such as history, policy, and other factors beyond the endogenous mechanisms of economic
development played a larger role in explaining peace
fulness for the "blue" countries. When the endogenous
forces (for example trading and competitiveness) of the
growth mechanism were more active, they contributed more in terms of explaining economic prosperity; when
they were less active, the exogenous forces entered
the fray and played a more important role in expla in
ing economic prosperity. If the exogenous forces serve as criteria that enable growth, then there should not be any discernible differences of residuals among different
types of countries.
Table 5 compared the color labels produced by
the Discrimination Analysis and the residuals produced by the Log-Linear Model. The four colors were classi
f ied according to Ge l and GPI, which reflected both
endogenous and exogenous forces. On the other hand, the
residuals overwhelmingly reflected exogenous forces.
The result of the integration of the two approaches
showed that less competitive countries were usually attached to larger residuals. The difference in magnitude
UCLA UNDERGRADUATE SCIENCE JOURNAL I VOLU ME 26, SPRING 20 1 3 40

KA MAN HO
of the residuals implied that the exogenous forces '
potentially present a mechanical impact on economic prosperity. The integration result stated a fair challenge to the model Neoclassical Growth Theory's assumption that the exogenous forces do not have any mechanical
impact on growth. The different residuals among various types of countries were not produced by luck because
observations were classified according to the variables Ge l and GPI in magnitude instead of any random
classification rules. In conclusion, this study explored the relation
ship that peacefulness, as a condition shaped by
exogenous factors, interacted with economic growth
or prosperity-there was a clear association between economic prosperity and peacefulness. Peaceful countries participated more in trading activities and achieved
greater economic prosperity. The endogenous forces including trading and competitiveness explained
the larger proportion of peace in more competitive
economies, while the proportion became smaller in
less competitive economies. This result challenges
the Neoclassical Modern Growth Theory's assumption that exogenous forces do not have any mechanical
impact on growth. Moreover, this study paved the
way for future research on the interactions between economic prosperity and peace and the interplay
between the endogenous and exogenous factors of economic growth. However, the linear association determined in this research does not necessarily indicate
causality. Further studies are important in determining
true causality. If significant and valid findings of the
causality are found, these results could change the foundation of the Neoclassical Modern Growth Theory.
ACKNOWLEDGMENTS
The author would like to sincerely thank Prof.
Ivo D. Dinov for his guidance, advice, and support
throughout the entirety of this project . His deliberate
editing contributed enormously to the production of
this paper.
REFERENCES
Kant, I . ( 1 939). Perpetual peace: a philosophical essay, translated by N.M. Butler (New York, NY: Columbia University Press), pp. 7-9.
Caruso, R., and Gavrilova, E. (20 1 2). Youth unemployment, terrorism and political violence, evidence from the Israeli/Palestinian contl ict. Peace Economics, Peace Science and Public Policy. 1 8 .
Cass, D. ( 1 965). Optimum growth i n an aggregative model o f capital accumulation. Rev Econ Stud. 32 :233-240.
Gartzke, E., and Li , Q. (2003). War, peace, and the invisible hand: positive political externalities of economic globalization. Int Stud Quart. 47:56 1 -586.
Gartzke, E. (2007). The capital ist peace. Am J Polit Sci. 5 1 : 166- 1 9 1 .
Harberger, A. (2005). On the process of growth and economic policy i n developing countries (Washington, D.C.: U.S. Agency for I nternational Development), pp. 5-8.
Institute of Peace and Economics (2012). Global Peace Index. <hnp://www. visionofhumanity.org/gpi-dataf>.
Keynes, J. M . ( 1 9 1 9). The economic consequences of the peace (New York., NY: Harcourt, Brace, and Howe, Inc.) pp. 56- 1 1 2 .
Koopmans, T. C. ( 1 963). On the concept of optimal economic growth. Pontificiae Academiae Scientiarum Scripta Varia. 28:225-300.
Lucas, R. E. ( 1 988). On the mechanics of economic development. J Monetary Econ. 22:3-42.
Romer, P. ( 1 99 1 ) . Endogenous technological change. J Polt Econ. 98:7 1 - 102.
Sala-i-Martin, X. et al. (20 I 0). The global competitiveness index 201 0-20 I I : looking beyond the global economic crisis. The global competitiveness report. 201 1 :3-56.
Solow, R. M. ( 1 956). A contribution to the theory of economic growth. Q J Bus Econ. 70:65-94.
Toft, M. D. (2007). Gening religion? The puzzling case of Islam and civil war. Int Security. 3 1 :97- 13 1 .
United Nations Statistics D ivision (201 2). Commodity Trade Statistics Database. <hnp://comtrade.un.org/db/mr/daCommoditiesResults.aspx?px=BE>
Weede, E. ( 1 996). Economic development, social order, and world politics (Boulder, CO: Lynne Rienner Publishers).
World Bank (20 1 2a). Exports of goods and services (% of GOP). <hnp://data. worldbank.org/indicatorfNE.EXP.GNFS.ZS>
World Bank (20 1 2 b). Imports of goods and services (% of GOP). <hnp://data. woridbank.org/indi catorfNE.IMP.GNFS.lS>
World Economi c Forum (2010). The Global Competitiveness Report 2010-201 1 . <hUp ://www3 .weforum.org/docs/WEF _Global CompetitivenessReport_20 I O- l l .p df>
41 UCLA UNDERGRADUATE SCIENCE JOURNAL I VOLUME 26, SPRING 2013
Top Related