


Languages
Pages
Legal


An Analysis of Consumer Decision-Making Pro-cesses When Purchasing Clothing Accessories in Finland: a Case Study for Suomi Accessory Oy
Qi, Yuechan; Ke, Xue
2017 Laurea

Laurea University of Applied Sciences
An Analysis of Consumer Decision-Making Processes when Purchasing Clothing Accessories in Finland: a Case Study for Suomi Accessory Oy
Qi, Yuechan; Ke, Xue Degree Programme in Bachelor’s Thesis April 2017

Laurea University of Applied Sciences Abstract Degree Programme in Business Management Bachelor’s Thesis Qi, Yuechan; Ke, Xue An Analysis of Consumer Decision-Making Processes when Purchasing Clothing Accessories in Finland: a Case Study for Suomi Accessory Oy
Year 2017 Pages 44
The study analyzes how gender, age and income level, as three independent variables, affect the consumer decision-making process when buying the clothing accessories in Finland. The purpose of the research is to get insight into the consumer characteristics and behaviors when buying clothing accessories, helping the case company Suomi Accessory Oy. to improve their marketing strategies and to build the consumer relationships. The research is planned based on the theories of consumer decision-making process and con-sumer behavior, and the study of clothing accessories. The quantitative method is utilized as the main methodology. Correspondingly, a questionnaire is designed to gather the primary data. The samples are potential consumers of clothing accessories in Finland. Among 200 an-swers that the authors receive, the number of valid answers is 170. The data is gathered by three ways: the online survey through emails, the street intercept survey, and the paper sur-vey distributed in the store of the case company. Gender, age and income level are selected as three variables to make the analysis. To process the data, the authors make descriptive analyses on each question, and deeply analyze the statistics by means of correlation and Chi-square analysis methods, supported by software SPSS 24. Through the three-month investigation, the findings on how variables influence ‘purchase frequency’, ‘importance for self-image’, ‘purchase motivations’, ‘information sources’, ‘ref-
erence groups’, ‘evaluation criteria’, ‘planned or impulsive purchase’ and ‘post-purchase shop selection’ are examined, according to the order of the five stages of the decision-making process. In the future research, qualitative research, such as group interviews, can be conducted for the deeper understanding on the target groups. Additionally, specific aspects can be explored, i.e, how emotion affects consumer behavior, or how different categories of clothing accesso-ries influence consumer behavior. Keywords: consumer purchasing behavior; consumer decision-making process; clothing acces-sory marketing

Table of Contents
1 Introduction ......................................................................................... 6
1.1 Background .................................................................................. 6
1.2 The objectives and aims .................................................................. 7
1.3 Limitation.................................................................................... 8
1.4 The structure of the study ................................................................ 8
2 Theoretical background ........................................................................... 9
2.1 Consumer behavior ........................................................................ 9
2.1.1 Concept of consumer behavior .................................................. 9
2.1.2 Consumer decision-making process ........................................... 10
2.1.3 Internal influencing factors .................................................... 12
2.1.4 External influencing factors .................................................... 14
2.2 Clothing accessories ..................................................................... 15
2.2.1 Consumer types ................................................................... 15
2.2.2 Customization ..................................................................... 17
2.2.3 In-store communications ........................................................ 17
2.2.4 Brand loyalty ...................................................................... 18
3 Research approach ............................................................................... 18
3.1 Research methods ........................................................................ 18
3.2 Questionnaire Design .................................................................... 19
3.3 Validity & Reliability..................................................................... 20
3.4 Data collection ........................................................................... 21
3.5 Analysis methods ......................................................................... 21
4 Empirical study ................................................................................... 22
4.1 General statistics ......................................................................... 22
4.2 Reliability statisics analysis ............................................................ 23
4.3 Profile demographics .................................................................... 23
4.4 Analysis on decision-making processes ............................................... 25
4.4.1 Need recognition ................................................................. 26
4.4.2 Information search ............................................................... 29
4.4.3 Evaluation of alternatives ...................................................... 32
4.4.4 Purchase decision ................................................................ 35
4.4.5 Post-purchase behavior ......................................................... 36
4.5 Summary of the research ............................................................... 37
4.6 Suggestions for the case company .................................................... 38
5 Conclusion ......................................................................................... 38
5.1 Self evaluation ............................................................................ 38
5.2 Vision on future research ............................................................... 39

References ................................................................................................ 40
Figures ..................................................................................................... 42
Tables ...................................................................................................... 43
Appendixes ................................................................................................ 44

5
1 Introduction
The first chapter provides the general background information of the research including: the
aims and objectives of this thesis research, the specific research problems the authors try to
solve, followed by the brief introduction of the research approaches the authors utilize, the
limitation and risks the authors confront with, as well as the structure and frame of this doc-
ument.
1.1 Background
According to Cumming, C. Cunnington and P. Cunnington (2010, 1), clothing accessory is an
item used to complement an outfit for the comprehensive promotion of one’s appearance. In
the contemporary Finnish society characterized by advanced living standard and state of the
art design, clothing accessory becomes indispensable for the appearance, since it contributes
to the symbolization of one’s personal style and make him or her out of the ordinary. The ex-
panding of the clothing accessory market is accelerating as the consumption capacity and
demand potential are growing.
Jackson and Shaw (2010, 5) deem that in many cases, the motivations for buying fashion
clothing and accessories are more likely to be associated with the top three levels of ‘belong-
ingness and affective needs’, ‘esteem needs’ and ‘self-actualisation needs’, in Maslow's Hier-
archy of Needs. The attitudes and choices on brands, and the pursuit of the latest trends, re-
inforce social intercourse and display personal status and identity to some extent.
In the information age, there are some common trends on the factors influencing fashion con-
sumers in western societies, proposed by Jackson and Shaw (2010, 16-17). The most promi-
nent factor is ‘the wider availability and access to fashion products’. The emergence of e-
commerce has credibly become alternative to ‘bricks-and-mortar’ shopping (traditional shop-
ping mode) since the late 1990s. Another factor, ‘the access to the wider range of media’,
has dramatically changed consumer habits in relation to the information search. Online media
replaced the traditional media such as broadcast, becoming the major information source in
daily life. The interest in celebrities flourishes a series of popular fashion magazines. The fac-
tors mentioned above reflect the complexity and dynamics of consumer behavior.
The certain thoughts and debates are aroused on the topics regarding consumer decision-
making process and consumer characteristics. From authors’ observation, knowing customer
behavior is the key to marketing, which can help build better marketing strategies, define
opportunities and generate potential solutions. Hence customer satisfaction and experience
can be improved and longer customer relationship can be built. The sophisticated decision-
7
making process, affected interactively by both internal and external aspects, is worth study-
ing in depth.
Therefore, a research is conducted by the authors for the case company Suomi Accessory,
which is operating an exclusive store authorized by the Finnish brand Marja Kurki, selling
clothing accessories as an agent. The authors make conversations with the personnel of the
case company to get the background information.
Marja Kurki, the founder, started her business with her own name in 1976, and in the follow-
ing year made an agreement with a Chinese company China Silk on exclusive rights for the
delivery of silk. The brand provide lines diverse products including silk scarves, wool scarves,
ties, leather goods, sunny umbrellas, gloves, hats and bags. The market has been expanded
from Finland Helsinki to Sweden, then south Europe, and nowadays Asia. Marja Kurki is fa-
mous for its design inspired by diverse elements of nature, and each product has its own
unique name which symbolized the specific culture. The products are appreciated by the poli-
tics and royal family, regarded by Finnish government as the gifts for guests. Customers value
the unique design concept and customized service in both business and art perspective.
The research utilizes the quantitative method, collecting data from the potential consumers
of clothing accessories. The data is analyzed by means of cross-tabulation analysis, correla-
tion analysis and Chi-square analysis.
1.2 The objectives and aims
The purpose of the research is to get insights into consumer characteristics and behavior in
clothing accessory industry, for the case company to improve their marketing strategies and
build consumer relationships and loyalty. Specifically, the main research issue is investigated:
What are the factors influencing each stage of the process when purchasing clothing
accessories in Finland?
The authors assume that gender, age, and income level, as three independent variables,
exert effects to consumer behavior in the five stages of the decision-making process.
Subsequently, the following sub-questions are set:
a) Do the females and the males behave differently in each stage of the consumer
decision-making process when purchasing clothing accessories in Finland?
b) Do people from different age groups behave differently in their decision-making
process when purchasing clothing accessories in Finland?
c) Does income level impact consumer decision-making when purchasing clothing
accessories in Finland?

8
1.3 Limitation
Possible risks exist in during the research progress. The background information is from the
personnel of Suomi Accessory. As the case company requires, the disclosure of the
confidential information should be avoided.
Considering the limitation of time, resources, accessibility and reachability, the sample size
of the questionnaire that the authors expect is 200. The target group is originally set to be
five age groups (18 to 25 years old, 26 to 35 years old, 36 to 45 years old, 46 to 55 years old,
over 55 years old). However, the authors do not receive sufficient responses from people over
35 years old. On the other hand, the survey scope is set as the store of the case company and
some public areas, such as shopping centers ranging from Helsinki to Espoo. As a result, the
survey lacks sufficient evidences to reflect the conditions in the whole Finnish market,
therefore affecting the generalization of the outcome.
1.4 The structure of the study
The first section provides the brief introduction of the research background and the
objectives of the study by listing questions and risks. In the second section, the authors
intensively review the theoretical literature regarding consumer behavior, customer decision-
making process and clothing accessory marketing. Methodology used are introduced in the
third section, such as quantitative method (questionnaire) and correlation analysis method.
The analysis of the outcomes is illustrated in the empirical study section, followed by the
suggestions the authors provide for the case company. Last but not the least, the authors give
the visions for the future research and development.

9
Figure 1: Structure of the study
2 Theoretical background
2.1 Consumer behavior
2.1.1 Concept of consumer behavior
According to Kumra (2007, 2) consumer behavior is the study of how individuals or
organizations act in the process of the obtainment, use and disposal of goods or services. The
study of consumer behavior could include all problems with respect to the perspectives from
the what, when, where, how, from whom, and how often products or services are bought.
The whole process of consumer behavior starts from pre-purchase activities to post-purchase
and evaluation activities, involving all the participants, who have ever influenced, both
directly and indirectly, the purchase behavior. The participants could be either opinion
leaders who indirectly give advice on purchase, or salespersons with whom the customer
directly contacts.
Understanding consumer behavior, considered to be of practical significance, can be solutions
to marketing strategic problems. Hawkins, Mothersbaugh and Mookerjee (2011, 7) suggest
that all marketing decisions and strategies are made on the basis of knowledge and
assumptions of the survey on consumer behavior. Moreover, Dubois (2000, ix) believes that
“customer is the core of business”, therefore understanding consumer behavior is regarded as
the keystone of well-planned marketing programs. Through strategic marketing, marketers
could better predict the needs of customers and guide customers to form certain consumption

10
habits, thus influences can be exerted on the consumer behavior correspondingly with the
goal of stimulating consumption achieved as well.
2.1.2 Consumer decision-making process
The EKB model (Figure 2), developed by Engel, Kollat, and Blackwell in 1968, is a classical
and comprehensive depiction of a complete consumer decision-making process. The stimulus,
as the input exposing information, firstly evoke consumers. Subsequently, consumers step
into the information-processing stage based on their own acceptance, experience and
memory. Decisional variables and external factors are influencing the whole purchase process,
which are reviewed in the section 2.1.3 and the section 2.1.4. The core decision-making
process is composed of five main stages.
Figure 2: Engel Kollat Blackwell (EKB) Model of consumer behavior
(Engel, Kollat & Blackwell 1968)
Consumer decision-making process involves all the consequences influenced by the internal
and external factors. According to Dubois (2000), ‘the idea of a purchasing process refers to a
sequence of successive stage until the final decision’. A purpose decision always corresponds
to a consumer problem.
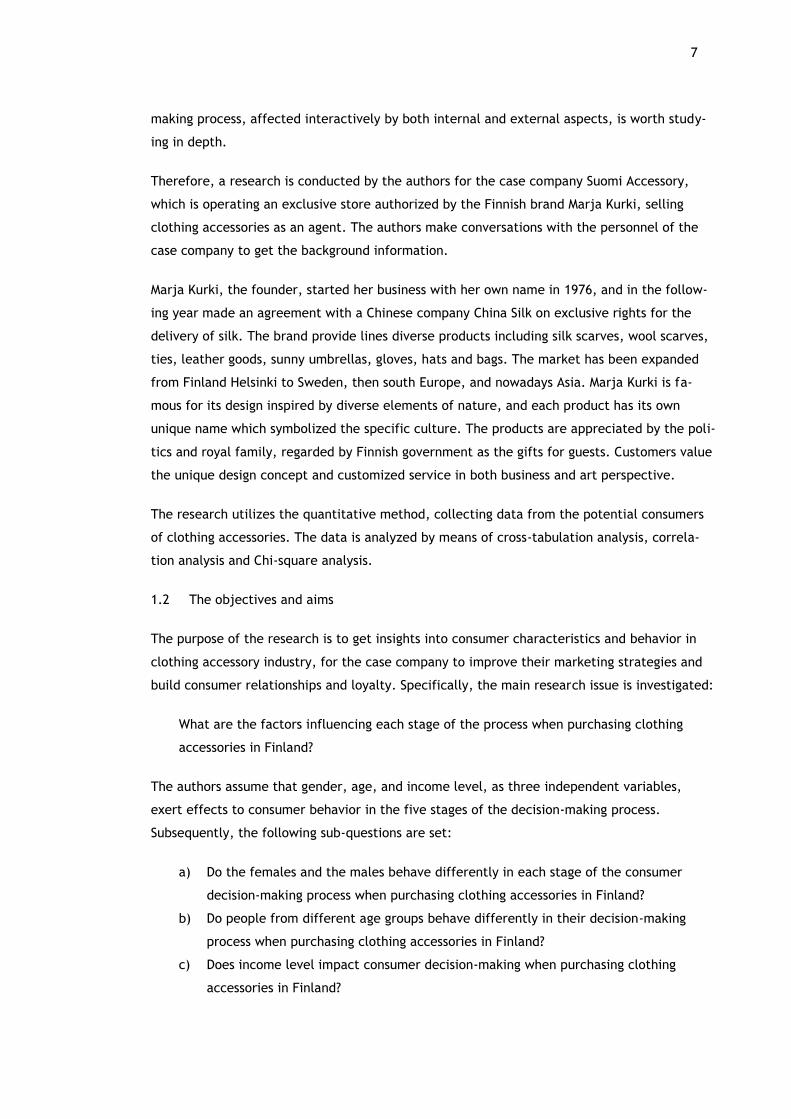
As is illustrated in figure 3, the first step of the process is need recognition when the
problems are identified by customers and their motivation arises. The theories of needs are
reviewed by the authors in the section 2.1.3. Entering the second stage, the customers search
for alternatives to satisfy their needs. The internal memory, and the external advertisement
and suggestions are two main sources. The availability of and access to the certain products
and brands limits their choices as well. When there are many choices in minds, customers
11
start to evaluate the value of the product itself and its added-value, involving the
consideration of various consequences and possible risks generated from the purchase as well.
The final decision is made in the second to last phase, followed by the post-purchase behavior
when the customers measure the extent that the purchase satisfies their needs, with the
criteria from their initial expectation and the performance of the product.
Figure 3: The buyer decision-making process in EKB model
Dubois (2000, 10) provides a model (Figure 4) explaining buying and consumption behavior
factors at three levels. Individual level, interpersonal level and sociocultural level are
respectively presented as three concentric circles from inside to outside, which vividly
describes the fact that consumers are affected by internal and external aspects. The authors
specifies more in the sections 2.1.3 and 2.1.4.

12
Figure 4: The three levels of explanation of buying and consumption behavior
(Dubois 2000, 10)
2.1.3 Internal influencing factors
Figure 4 reveals that at the individual level, four key factors exert influences on consumer
behavior: motivations, perceptions, learning experiences, and attitudes, which are specified
by the authors in this section.
The motivations and needs of the consumers are studied as the starting point, since the
purchasing behavior stems from needs identification. The theory of needs, proposed by
McClelland (1961) explains that the human motivations can be ascribed to the needs for
achievement, affiliation and power, which can be generalized and applied to all individuals
with different ages, gender, races and cultural backgrounds. Specifically, the fact that
humans are in pursuit of success and the sense of accomplishment generated by the feedback
from tasks and work, exposes the need for achievement. To meet the need for affiliation,
people tend to create links and interpersonal relationship with others, desiring to become a
member of groups and feel connected and loved by the others. People in need of power
desire competences and competition. They compete with others for winning higher status and
dominant positions, enjoying the recognition from the others and the impacts that they can
exert on people.
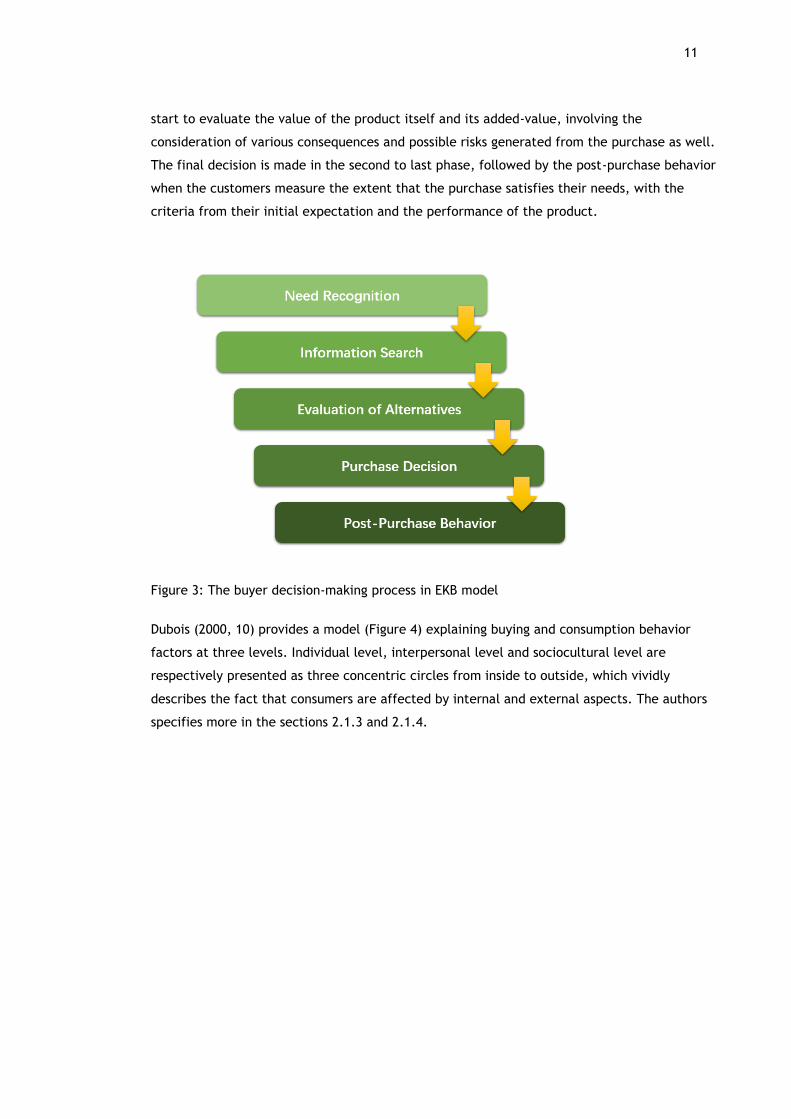
Another known theory, proposed by psychologist Abraham Maslow (1943), describes a
hierarchy of the combination of human’s biogenic and psychogenic needs. Maslow deems that
13
people will seek to satisfy their current needs firstly, and then turn to the upper level needs.
According to the hierarchy illustrated in the figure 5, human needs can be categorized into
the following five incremental levels. Physiological Needs, as the foundation, represents the
biological needs such as hunger, thirst, and rest. Security Needs, stressing the shelter and
protection, is in the second place, followed by Belonging and Affective Needs which stands
for love, friendship and recognition from the others. Climbing to Esteem Needs, people attain
prestige, status and accomplishment. The top level comes the Accomplishment Needs, where
the self-fulfillment and enriched experience are required.
Figure 5: Maslow hierarchy of needs
(Maslow 1943)
Perception is the second significant factor at the individual level. Solomon (2011, 82-83) in-
terprets that that perception is the entire process of one’s selection, organization and inter-
pretation on the sensory stimulus, such as sights, sounds, smells, taste and textures. Figure 6
presents an overview of the perception process, the sensory stimulus serve as the exposure,
which would arouse consumers’ attention before their interpretation of information. Market-
ers try to make use of and give meanings to the raw sensations in order to attract consumers
by stimulating their senses. Through the study on how consumers observe and perceive the
products or brands, they manage to establish the emotional and interactive association be-
tween consumers’ perception and the products themselves. The unique sensory quality of
products or services could leave a strong impression on consumers, making them differentiat-
ed from other brands and competitors.

14
Figure 6: The perceptual process
(Solomon 2011, 82-83)
The applications of classical conditioning and instrumental conditioning in the marketing have
proved the practical significance of the study on consumers’ learning experiences. The feed-
back and conclusions that people receive from the experiences over time shape their
knowledge, cognition and perspectives. Solomon (2011, 121) deems that people are aware
that the actions they take connect with either punishments or rewards based on their learned
experiences over time. Similarly, learning experiences would strongly affect consumers’ reac-
tion on the brands names, scents, jingles and other stimulus. An unsatisfied shopping experi-
ence that a person had influences choices on the same brand in the future.
Attitudes, describing how people generally value and evaluate certain objects or issues, are
formed from one’s long-term learned experiences. Marketers study on consumer attitudes in
order to make a well-planned marketing which can guide their behavior by giving psychologi-
cal hints, seeking the common values that the consumers could agree with. For example, the
attitudes could be towards the animal testing, green energy or healthy lifestyle.
2.1.4 External influencing factors
The external factors, classified into interpersonal level(reference group and opinion leader)
and sociocultural level(social class, lifestyles and culture), exert subtle but strong influences
on customers purchasing behavior. All specific influencing factors are associated and
dependent mutually (Figure 4).
A decision is often made with advice, confirmation and even approval from groups. The
concept of group is defined into different catalogues by different standards. Burnkrant (1975)
describes reference group as an realistic or imaginary community, which has significant
relations with one’s assessment, desire or behavior’. A reference group could be either the
relatives and friends of the buyer, or a political celebrity and a movie star. Buyers would

15
listen to their reference groups to find a sense of identity and support, which helps them to
choose from alternatives, to affirm their certain consideration, or even to approve their
selections.
The opinion leader is the person who enjoys dominant position among the certain interest
followers group, but he or her could meanwhile be the follower of another opinion leader in
another community. An opinion leader is a medium of information for his or her followers,
and this requires expertise, honor and empathy. According to Dubois (2000), an opinion leader
should be a disinterested outsider: ‘Leaders are much better accepted if their actions are
perceived to be in the general interest, rather than being partisan’.
The sociocultural factors(socio-demographic variables), play an indispensable role in affecting
purchase behavior since it shapes individual behavior patterns in general. A society is formed
by social norms, values, conventions, rituals, institutions, communications and language,
which contributes its unique culture. Consequently, individuals are marked by the culture in
terms of lifestyles, the dominant personality types, the modes of expression, the value of
time, as well as the preferences towards other issues.
Social class, as another external factor, is defined by Krech, Ballachey and Crutchfield (1983,
338) as ‘a division of society made up of possessing certain common social characteristics’.
People are distinguished by the social identity and status, as well as the income level. Those
from the same social grade share the common buying behavior habits in terms of interests,
budget levels, values and the way of life. Through the study on the social grades, consumer
segmentations can be identified.
2.2 Clothing accessories
2.2.1 Consumer types
Customers are defined by specific attributes. The demographics, such as nationality, age,
gender, income, and profession, makes up different target groups. A blogger named
Missmeasured (2012), generally divides female fashion customers into three target groups by
ages, which are the markets of teenager (below twenties), twenties to thirties and forties
plus. Each target group shares similar buying habits and psychological characteristics.
To be specific, teenager consumers tend to be strongly affected by celebrity culture and the
latest trends, from which they get inspirations. They replicate their styles and looks by fol-
lowing celebrities. The teenager market is lower end due to their limited disposable budget.
Twenties to thirties consumers are in pursuit of distinctiveness, expecting that their fashion
styles can reflect their personalities. Most of them, who still have neither child to bring up,
nor any budget for the family to shoulder, are usually with more disposable income. Twenties

16
to thirties consumers pay attention to fashion products ranging from low to high end, while
forties plus consumers, who are with the most disposable income, would buy high end brands
mostly from department stores.
Mintel (2006) finds out 9 different types of fashion consumers through the survey on clothing
retailing in UK conducted in 2004, which is presented in table 1 below. Another research
conducted by Cox (2011), Fashion Segments Handbook Females, introduces typical fashion
segments among women. The authors notice the shared points between these two researches.
Table 1: Fashion consumer typologies
(Mintel 2006)
The individualists and the fashion-conscious, are usually young urban women who desire to
stand out in a crowd and keep up with the trends. These two groups read fashion magazines
frequently and are conscious of the trends. Their values, attitudes, personality are expressed
through the clothing and accessories they wear. They usually do window shopping and online
shopping, spending much more time to find certain objects from a wide range of products for
matching and complementing their styles.
Practical and sporty styles are usually favored by middle aged women, who are with relatively
low income. When buying clothing and accessories, instead of regarding the latest trend as a
top priority, functions, comfortableness and prices are given most consideration. Their new
clothing and accessories are usually bought until the old ones are worn out.
Big spenders are usually middle aged women (aged 36 to 55), who are with high disposable
income level and consuming level among the groups. They would stick to customized and best
quality clothing and accessories, such as superb natural fabrics. They are most likely to firstly
visit the key stores which they are loyal to, and to pay by credit and store membership cards.

17
2.2.2 Customization
Okonkwo (2007, 249) defines the customization as an action to make adjustments on products
and services based on individual consumer demand. Customization is neither the product
variety, nor the same as personalization.
There are several ways for a brand to customize goods and services. Bespoke products are
mostly produced by high-end and exclusive brands. Standardized products can be customized
by alternating varieties (prices, colors, size, and materials), which can make multiple options
on customized clothing accessory products. Added values can be put into delivery process
with more choices on payment methods and personalized packaging, even a printing gift card.
In addition, a brand can involve customers into the clothing and accessory designing process
and give them more sense of controlling. The online and in-store shopping experiences can be
optimized by providing wide range of selections or asking for their preferences directly. The
authors emphatically discuss the communication in store environment in the next section.
After being satisfied with the basic functions and designs of the clothing and accessory
products, the majority of current fashion consumers require the customization of goods and
services they get from the brand, including special design, bespoke products and additional
services. Customization, according to the specific preferences of individual customer, can
give customers chances to differentiate themselves in a crowd, promoting individualization.
Simultaneously, customer relationship and customer satisfaction are boosted. Therefore,
customization is one of the core aspects which improves the brand loyalty.
2.2.3 In-store communications
According to Mazzalovo and Chevalier (2013), ‘communication is to provide meaning to infor-
mation’. Communications help to draw the attention of consumers, make the information
memorized and infused by consumers, and make consumers generate desires and motivations.
The information contained in the advertising and branding can be effectively conveyed to the
potential consumers through the good application of communication program. A strategic and
complete communication program makes a brand stand out and become more aware of.
Store is an effective channel from where consumers can obtain a great deal of information. It
is a powerful communication tool for branding, especially in fashion clothing and accessory
industry. Except for the products in stores, the multisensory features in stores such as deco-
rations, layouts, colors, lights, logos, music, and materials, make up physical information.
While wandering the shops, consumers can observe, touch, hear, smell and feel, to gain in-
sight into the brands and the values behind spontaneously. In most cases, consumer decisions
are firmly associated with their emotions produced from the whole purchase experience,
when buying clothing accessory products.

18
The external architecture style, as well as the internal design of the stores help consumers to
distinguish the brand. The beautiful window displays, as one way of street advertising, can
draw attention of potential consumers. In addition, sales personnel, who makes direct com-
munication with the consumers, are representatives of the brand concept and image. Their
uniforms and grooming maintain consistency with the brand identity. All of the manifestations
in stores contribute to the building of brand loyalty.
2.2.4 Brand loyalty
Brand loyalty is the consequence of consumer purchasing habits and preferences. According
to Okonkwo (2007, 118), brand loyalty decreases the cost for consumers to search for the
information, as well as for the company itself to attract and service the customers. When
consumers become loyal to a certain brand, they purchase with more frequency and larger
amount, and are more likely to neglect the price.
Being valued by consumers is the key for a company to build brand loyalty. Among various
alternatives with the same features, the consumers repeatedly choose their prefered brands
and return to the same shops, to meet their specific growing needs upon the basic function,
such as the quality, the certain design, the individualization, the special customized services,
the building of their self-image, the symbolization of their status.
In addition, some people are in pursuit of special designs or the limited editions in different
seasons, which shrinks the range of their choices. The limited availability of the stylish
products binds a group of consumers who are with high level of brand loyalty.
3 Research approach
3.1 Research methods
The research oriented approach are mainly categorized into qualitative research methodology
and quantitative research methodology. Snape and Spencer (2003, 3) argue that, qualitative
research mainly studies on the social, material circumstances, experiences, histories and
perspectives of the respondents, trying to understand the social world of research
respondents deeply. Salmons (2016, 2) deems that qualitative researchers aims for
understanding the nuance of one’s experience and perspectives seems to be much favored,
rather than the general answers that quantitative research requires.
By contrast, the purpose of quantitative research is to gather the results and sort out the
interest groups, in order to conclude certain regular patterns. Saunders, Lewis and Thornhill
(2009, 414) deem that unprocessed numbers from quantitative research are originally not
valuable. However, by utilizing a series of analysis methods, for example, charts, graphs and
statistics, the data could be turned into values which assists to determine and find the

19
profound trends and links among the numbers. Meanwhile, Dr. Shirish (2014, 37) believes that,
in quantitative research, unbiased outcomes which could be generalized and applied to larger
population are expected by the researchers.
Questionnaires are better applied to descriptive research rather than exploratory research.
Since questionnaires cannot include many open-ended questions, all the respondents are
asked to answer standardized questions (Saunders, Lewis and Thornhill 2009).
The authors utilize the quantitative research as the main methodology. Correspondingly, a
questionnaire is conducted for collecting primary data.
3.2 Questionnaire Design
A questionnaire is designed differently according to the way it is administered, and contact
resources that the researchers possess. (Saunders, Lewis and Thornhill 2009, 363-366). As fig-
ure 7 shows, questionnaire is categorized as self-administered and interviewer-administered.
This thesis research applies two self-administered questionnaires, the internet and intranet-
mediated questionnaires, as well as the delivery and collection questionnaire, as a result of
the limited access to the respondents.
Figure 7: Types of questionnaire
(Saunders, Lewis & Thornhill 2009, 363-366)
There are some factors to be considered when making the choices of questionnaire, such as
the size of sample, the possible response rate, the number of questions listed, the respond-
ent’s characteristics, the way to reach potential respondents, and the correct comprehension
on the answers, suggested by Saunders, Lewis and Thornhill (2009, 363-366).

20
The object of the survey is the potential consumers of clothing accessories in Finland. One
with a decent salary, has bought or could afford, is qualified for the survey sample. The sam-
ple size is expected to be 200.
Table 2: Questionnaire design
The total number of questions listed is 15, which is divided into two sections. The first section
provides the personal information of the respondents for identifying their demographic
characteristics. The respondents are required to inform their gender and age, and are
voluntary to provide their education and income level. The second part is the main body of
the survey regarding respondents’ attitudes and perspectives towards purchasing accessory
products, containing nine key questions. The nine questions are categorized according to the
order of five stages of the consumer decision-making process, followed by two open-ended
questions in the end which are not required to answer.
The questions are created, selected and formed based on the review on the theories of
consumer purchasing behavior, consumer decision-making and clothing accessory marketing.
The questions are logically organized from the elementary to the profound. Additionally, the
choices of questions are presented in random order. The detailed questionnaire is listed in
the appendix.
3.3 Validity & Reliability
For the measurement of the questionnaire, validity and reliability are the most significant
elements. Reliability stands for the accuracy of the measurement, including consistency and
Question No. Question
1 Gender
2 Age
3 Education level
4 Average monthly income
5 Purchase frequency
6 Peak season
8 Importance for self-image
9 Influencing motivations
12 Information sources
11 Reference groups
Evaluation of alternatives 10 Purchase criteria
Purchase decision 7 Planned or impulsive purchase
Post-purchase behavior 13 Post-purchase shop selection
14 Open-ended comments
15 Email addressOpen-ended questions
Need recognition
Information search
Questionnaire design
Decision-
making
process
Demongraphic profile

21
stability. Validity is an aspect reveals the extent, amount and depth, to which the
questionnaire gathers the data.
To ensure the goodness of data collected, the authors conduct simulation tests on a group of
25 respondents. Based on the feedback, adjustment and revision are made correspondingly.
The authors receive 200 responses, from which 170 valid answers are reserved.
Cronbach’s alpha is used to analyze the reliability of the statistics, which is a common
reliability test method to assess the average correlation of a set of items. A high value of
Cronbach’s alpha means high internal consistency. Usually, a reliability coefficient of 0.60 or
higher is considered to be acceptable in the research. The authors describe the reliability test
process and results in detail in the section 4.2.
3.4 Data collection
The primary data is obtained from the questionnaires and the secondary data is collected
from the existing literatures and academic researches. Under any circumstances, a survey
consists of a sample of the population of the interest and the methods of data collection. The
quality of a survey mostly depends on how representative the samples are, and how serious
the respondents’ attitudes on the survey are.
The samples of the questionnaire are the potential customers of clothing accessories in Fin-
land. The authors mainly choose online surveys which are distributed to the schoolfellow by
email invitation to the survey website. Meanwhile, street intercept survey are carried out in
shopping centers in Helsinki and Espoo. The collection period is one week from 23th of March
to 30th of March. Simultaneously, paper questionnaires are handed out orienting the custom-
ers of the case company, which has been authorized to be the retailer by the Finnish local
brand Marja Kurki. Their main market and target group are Finland and Finns, in which Hel-
sinki is the core and representative consuming market, and their exclusive store is located in
Helsinki.
3.5 Analysis methods
The authors set gender, age and income level (euro after tax) as three main independent
variables. Several analysis methods below are utilized during the research, which are
supported by software SPSS 24, to summarize and conclude general regulations out of the
statistics.
Cross tabulation is one of the descriptive analysis methods, which illustrates the statistics in
the form of dimensional tables, examining the relationship between different variables. In
this way the author make comparative analysis and average analysis on the question No. 10
‘evaluation criteria’ and the question No. 12 ‘information sources’.

22
Chi-square test method, also known as χ2 test, is a method for statistical hypothesis test. An
asymptotic significance value lower than 0.05 represents a highly significant relationship
between the variables. In this research, the method is used for the questions No. 10 and No.
12 as well, to test whether there is any significant associations between ‘evaluation criteria’
and gender and between ‘information sources’ and gender.
Correlation analysis method studies into the level of association between continuous variables,
and whether the association is positive (if the Pearson correlation value is more than 0) or
negative (if the Pearson correlation value is less than 0). If the significance value is lower
than 0.05, it can be inferred that the variables have a significant association between each
other.
4 Empirical study
4.1 General statistics
Table 3: Statistics results
The statistics report is summarized in table 3 above. 236 questionnaire are distributed by
means of online, street intercept and in-store survey. Among 236 questionnaires, 200 ques-
tionnaires are responded. The recovery rate is 84.7%. After the collection period, the authors
examine answers individually to check whether they are filled in according to the settings and
requirements. Finally, the authors reserve 170 valid answers and eliminate 30 invalid answers.
Correspondingly, the effective questionnaire returns-ratio is 85%.

23
4.2 Reliability statisics analysis
Table 4: Reliability statistics analysis
The single choice questions No. 5 to No. 9, No. 11, and No. 13 are set to be the core
questions investigating consumer attitudes towards purchasing clothing accessories. The
authors use the software SPSS 24 to make the reliability statistics analysis. As revealed in
table 4, the Cronbach’s alpha value of all the questions are 0.577, which is under the
acceptance level. However, the authors exclude each question to measure the differences.
The Internal consistency is acceptable (Cronbach’s alpha value is 0.651) only if the question
No. 6 is excluded, as is shown in the figure 8 below. Consequently, the authors decide to only
descriptively analyze the data of question No. 6.
Figure 8: Reliability statistics of questions No. 5, 7, 8, 9, 11, 13
4.3 Profile demographics
The section describes the background profile information of the respondents in detail, gath-
ered from the question No. 1 to No. 4 in the questionnaire, regarding gender, age, education
level and income level. The valid answers are from 170 residents in Finland, who are the po-
tential consumers of clothing accessories.
AllIf exclude
question No.Difference
5 Purchase frequency 0.567 -
6 Peak season 0.651 +
7 Planned or impulsive decision 0.587 +
8 Importance of self-image 0.553 -
9 Motivations 0.334 -
11 Reference groups 0.489 -
13 Post-purchase shop selections 0.571 -
Reliability statistics analysis
Question
No.Question
Cronbach's alpha
0.577

24
Figure 9: Question No. 1 ‘Gender’
As shown in the pie chart above, the population (170 respondents) consists of 58.8% females
with the amount of 100, and around 41.2% males with the number of 70.
Figure 10: Question No. 2 ‘Age’
The respondents are separated into five age groups, ranging respectively from 18 to 25 years
old (64.1%), 26 to 35 years old (28.8%), 36 to 45 years old (3.5%), 46 to 55 years old (1.8%),
and older than 55 years old (1.8%). However, the figures of the over 35-year-olds with limited
sample amounts, are not sufficient to represent the consumer behavior of the age groups typ-
ically.

25
Figure 11: Question No. 3 ‘Education level'
The majority of the population hold bachelor's degree with the amount of 106 (62.4%), fol-
lowed by the people with education level of high school degree (15.3%) and master’s degree
(12.9%). The share of people with degree from vocational school is 8.2%, while those with
other advanced degree beyond a master’s degree occupy merely 1.2%.
Figure 12: Question No. 4 ‘Income level (euros after tax)’
The survey reveals that, 105 out of 170 respondents are with low monthly income of 0-1000
euros, (62.5%), while 22.6% of the population earn 1001-2000 euros monthly. The statistics of
people with 2001-3000 euros’ monthly salary and over 3000 euros’ monthly salary are respec-
tively 10.7% and 4.2%.
4.4 Analysis on decision-making processes
The authors make the intensive analysis on each stage of the consumer decision-making pro-
cess by utilizing the software SPSS 24.

26
4.4.1 Need recognition
How consumers value clothing accessories influences their needs and purchase frequency.
Simultaneously, purchase frequency reflects the level of demand and the motivations and
needs could vary from gender and ages.
Figure 13: Question No. 5 ‘Frequency of purchase’
The aim of the question No. 5 is to know consumers purchase frequency when buying clothing
accessories. The data reveals that the majority of people purchase clothing accessories once
or twice in a month or in a season, together accounting for 73% of the respondents. The num-
ber of frequent buyers (more than once per week) takes up 8.2%. 18.8% of people do not buy
clothing accessories frequently, merely for once or twice in a year or less.
Table 5: Correlation analysis - Question No. 5 ‘Frequency of purchase’
The table 5 is the correlation analysis of the purchase frequency. The Pearson Correlation
value ‘between frequency and gender’ and ‘between frequency and age’ are relatively -0.248
and -0.208, the significance of which are 0.001 and 0.007. Therefore, gender and age both
have significant negative correlation with the purchase frequency. The purchase frequency of
females is higher than that of males. Most women go shopping once or twice per month, and
Frequency
Pearson Correlation -.248**
Sig. (2-tailed) 0.001
N 167
Pearson Correlation -.208**
Sig. (2-tailed) 0.007
N 167
Pearson Correlation -0.127
Sig. (2-tailed) 0.101
N 167
Correlations
Gender
Age
IncomeLevel
**. Correlation is significant at the 0.01 level (2-tailed).

27
men are more likely to shop once or twice a quarter. Simultaneously, the purchase frequency
is decreasing with the growing age.
Figure 14: Question No. 6 ‘Seasons of purchase’
Another frequency-related topic discussed in the question No. 6, inquires consumers of their
purchase season. The order of the selected season comes summer (33.5%), spring (11.8%),
winter (10%) and autumn (5.3%). However, around one third of people do not see any differ-
ences between these periods, and 7.1% of the respondents neglect the influences of seasons
(Figure 14).
Figure 15: Question No. 8 ‘Importance for self-image’
The question No. 8 is to investigate the importance of clothing accessories for consumers'
self-image, which reflects their level of demand on the clothing accessory products. From the
figure 15, most of the respondents score the importance of clothing accessories for their self-
image as 4, with the proportion of 42.4%. Simultaneously, 32.4% of the population give an
average score of 3.

28
Table 6: Correlation analysis - Question No. 8 ‘Importance of self-image’
The correlation analysis method is used to analyze the correlation between the importance of
clothing accessories for consumers’ self-image, and three variable groups. However, the
figure indicates that there is no significant correlation between them, since the significance
values are all higher than 0.05 (Table 6).
Figure 16: Question No. 9 ‘Motivations’
The question No. 9 investigates the influencing motivations for people when purchasing cloth-
ing accessories. The authors set seven choices which involves almost all the motivating fac-
tors when buying clothing accessories: ‘functional need’, ‘demand for individualization’,
‘pursuit of fashion trends’, ‘need for suitable clothing accessories for different occasions’,
‘symbolization of personal status’, ‘symbolization of religion and faith’, and ‘need for acces-
sories as gifts’.
The statistic shows that, 43 of 170 respondents choose ‘very influencing’ for the ‘functional
need’, winning the most votes among these seven motivating factors. Meanwhile, the least
influencing motivation is ‘symbolization of the religion and faith’, which receives 62.4% nega-
tive votes, and merely 10% positive votes. All the motivations gain ‘neutral’ votes from over a
quarter of the population. Over 25% people vote for ‘fairly influencing’ for motivations except
for the ‘symbolization of religion and faith’. (Figure 17)
Importance
Pearson Correlation -0.103
Sig. (2-tailed) 0.181
N 170
Pearson Correlation 0.036
Sig. (2-tailed) 0.640
N 170
Pearson Correlation 0.008
Sig. (2-tailed) 0.914
N 170
Correlations
Gender
Age
IncomeLevel

29
Table 7: Correlation analysis – Question No. 9 ‘Motivations’
The correlation analysis of purchase motivations (Table 7) shows that, between functional
need and gender, the Pearson correlation value of 0.152 and significance value of 0.048 indi-
cates a significant positive association. Meanwhile, the Pearson correlation value between
fashion trends and gender is -0.164 with a significance value of 0.032. It can be inferred that
the need for fashion trends is significantly related to gender. Therefore, the males have high-
er demand level for functional need than the females do, and have lower demand level for
the need for fashion trends than the females do.
Besides, the Pearson correlation value of 0.182 with the significance value of 0.018 reveals a
significant positive association between functional need and age. As age growing, the demand
level for products’ functions is increasing.
4.4.2 Information search
Table 8: Cross tabulation - Question No. 12 ‘Gender*Sources of information’
The information search is the second step of consumer decision-making process. Seven
different sources are listed randomly in the question No. 12, for respondents to choose at
most two frequently-used sources. The result reveals that the top two selections for the
females are ‘people around you’ and ’shop windows’, and males choose ’people around you’
and ‘social media’.
Functional
Need
Individualiz
ation
Fashion
Trends Occasions
Personal
Status Religion Gifts
Pearson Correlation .152* -0.096 -.164
* -0.017 -0.043 -0.054 0.053
Sig. (2-tailed) 0.048 0.212 0.032 0.829 0.582 0.485 0.495
N 170 170 170 170 170 170 170
Pearson Correlation .182* -0.029 -0.126 -0.055 -0.010 0.000 -0.114
Sig. (2-tailed) 0.018 0.704 0.101 0.474 0.893 0.996 0.139
N 170 170 170 170 170 170 170
Pearson Correlation 0.026 -0.070 -0.134 -0.025 -0.090 0.031 -0.100
Sig. (2-tailed) 0.735 0.364 0.082 0.745 0.245 0.687 0.195
N 170 170 170 170 170 170 170
Correlations
Gender
Age
IncomeLevel
*. Correlation is significant at the 0.05 level (2-tailed).
subscription
People
around you
Shop
windows
TV &
Broadcast
Social
media
Newspapers
& Magazines
Shopping
websites
Count 11 49 44 6 43 11 30 100
% within Gender 11.0% 49.0% 44.0% 6.0% 43.0% 11.0% 30.0%
% within
$InformationSources
73.3% 58.3% 64.7% 37.5% 61.4% 57.9% 54.5%
% of Total 6.5% 28.8% 25.9% 3.5% 25.3% 6.5% 17.6% 58.8%
Count 4 35 24 10 27 8 25 70
% within Gender 5.7% 50.0% 34.3% 14.3% 38.6% 11.4% 35.7%
% within
$InformationSources
26.7% 41.7% 35.3% 62.5% 38.6% 42.1% 45.5%
% of Total 2.4% 20.6% 14.1% 5.9% 15.9% 4.7% 14.7% 41.2%
Count 15 84 68 16 70 19 55 170
% of Total 8.8% 49.4% 40.0% 9.4% 41.2% 11.2% 32.4% 100.0%
Gender*$InformationSources Crosstabulation
$InformationSourcesa
Total
Gender female
male
Total
Percentages and totals are based on respondents.
a. Dichotomy group tabulated at value 1.

30
Table 9: Chi-square analysis - Question No. 12 ‘Gender*Sources of information’
As table 9 illustrated, there is no significant association between different information
sources and gender. Only the Pearson Chi-square value between TV & Broadcast and gender is
3.316 and the asymptotic significance value is 0.069, closely approaching the significance
level of 0.05.
Table 10: Cross tabulation - Question No. 12 ‘Age*Sources of information’
Table 10 illustrates that most age groups select ‘People around you’ as the top frequently-
used information source when gathering information about clothing accessories. It is also
worth mentioning that the utilization of social media is different between age groups. 18 to
25-year-old people are more inclined to gain information by surfing the internet.
Criteria Email
subscription
People
around you
Shop
windows
TV &
Broadcast
Social
media
Newspapers
& Magazines
Shopping
websitesTotal
Pearson Chi-square
Value1.430
a.016
a1.619
a3.316
a.333
a.008
a.614
a5.894
a
Asymptotic
Significance (2-sided)
0.232 0.898 0.203 0.069 0.564 0.930 0.433 0.435
Gender*Information Sources Chi-square
subscription
People
around you
Shop
windows
TV &
Broadcast
Social
media
Newspapers
& Magazines
Shopping
websites
Count 11 52 37 11 51 11 36 109
% within Age 10.1% 47.7% 33.9% 10.1% 46.8% 10.1% 33.0%
% within
$InformationSources
73.3% 61.9% 54.4% 68.8% 72.9% 57.9% 65.5%
% of Total 6.5% 30.6% 21.8% 6.5% 30.0% 6.5% 21.2% 64.1%
Count 3 26 26 4 17 3 16 49
% within Age 6.1% 53.1% 53.1% 8.2% 34.7% 6.1% 32.7%
% within
$InformationSources
20.0% 31.0% 38.2% 25.0% 24.3% 15.8% 29.1%
% of Total 1.8% 15.3% 15.3% 2.4% 10.0% 1.8% 9.4% 28.8%
Count 0 2 5 1 1 3 0 6
% within Age 0.0% 33.3% 83.3% 16.7% 16.7% 50.0% 0.0%
% within
$InformationSources
0.0% 2.4% 7.4% 6.3% 1.4% 15.8% 0.0%
% of Total 0.0% 1.2% 2.9% 0.6% 0.6% 1.8% 0.0% 3.5%
Count 1 2 0 0 1 0 2 3
% within Age 33.3% 66.7% 0.0% 0.0% 33.3% 0.0% 66.7%
% within
$InformationSources
6.7% 2.4% 0.0% 0.0% 1.4% 0.0% 3.6%
% of Total 0.6% 1.2% 0.0% 0.0% 0.6% 0.0% 1.2% 1.8%
Count 0 2 0 0 0 2 1 3
% within Age 0.0% 66.7% 0.0% 0.0% 0.0% 66.7% 33.3%
% within
$InformationSources
0.0% 2.4% 0.0% 0.0% 0.0% 10.5% 1.8%
% of Total 0.0% 1.2% 0.0% 0.0% 0.0% 1.2% 0.6% 1.8%
Count 15 84 68 16 70 19 55 170
% of Total 8.8% 49.4% 40.0% 9.4% 41.2% 11.2% 32.4% 100.0%
Age*$InformationSources Crosstabulation
$InformationSourcesa
Total
Age
18 to 25
years old
26 to 35
years old
36 to 45
years old
46 to 55
years old
56 years
old and
the older
Total
Percentages and totals are based on respondents.
a. Dichotomy group tabulated at value 1.

31
Table 11: Cross tabulation - Question No. 12 ‘Income level*Sources of information’
The data in table 11 indicates that people with different income level seem to gain
information about clothing accessories mostly from ‘People around you’.
Generally, regardless of gender, age and income level, the top two selection of information
sources are ‘people around you’ and ‘social media’. It seems that the advanced information
technology development accelerates the retirement of traditional media such as ‘TV and
broadcast’ and ‘Newspapers and Magazines’.
Figure 17: Question No. 11 ‘Reference groups’
Reference group is one of the essential information sources for consumers buying clothing
accessories. The question No. 11 inquires the respondents to assess the reliability of advices
from different source groups.
subscription
People
around you
Shop
windows
TV &
Broadcast
Social
media
Newspapers
& Magazines
Shopping
websites
Count 11 50 40 9 45 8 37 105
% within IncomeLevel 10.5% 47.6% 38.1% 8.6% 42.9% 7.6% 35.2%
% within
$InformationSources
73.3% 59.5% 58.8% 56.3% 64.3% 42.1% 67.3%
% of Total 6.5% 29.4% 23.5% 5.3% 26.5% 4.7% 21.8% 61.8%
Count 2 19 18 3 17 6 12 39
% within IncomeLevel 5.1% 48.7% 46.2% 7.7% 43.6% 15.4% 30.8%
% within
$InformationSources
13.3% 22.6% 26.5% 18.8% 24.3% 31.6% 21.8%
% of Total 1.2% 11.2% 10.6% 1.8% 10.0% 3.5% 7.1% 22.9%
Count 1 9 9 4 7 3 5 19
% within IncomeLevel 5.3% 47.4% 47.4% 21.1% 36.8% 15.8% 26.3%
% within
$InformationSources
6.7% 10.7% 13.2% 25.0% 10.0% 15.8% 9.1%
% of Total 0.6% 5.3% 5.3% 2.4% 4.1% 1.8% 2.9% 11.2%
Count 1 6 1 0 1 2 1 7
% within IncomeLevel 14.3% 85.7% 14.3% 0.0% 14.3% 28.6% 14.3%
% within
$InformationSources
6.7% 7.1% 1.5% 0.0% 1.4% 10.5% 1.8%
% of Total 0.6% 3.5% 0.6% 0.0% 0.6% 1.2% 0.6% 4.1%
Count 15 84 68 16 70 19 55 170
% of Total 8.8% 49.4% 40.0% 9.4% 41.2% 11.2% 32.4% 100.0%
IncomeLevel*$InformationSources Crosstabulation
$InformationSourcesa
Total
Percentages and totals are based on respondents.
a. Dichotomy group tabulated at value 1.
Income
Level
0-1000
1001-
2000
2001-
3000
over
3000
Total

32
‘Family members’ and ‘friends and colleagues’ get the same number of positive votes (21).
Advices from the ‘Celebrities’ group seem to be the most unreliable with a share of 33.5%
negative votes, closely followed by ‘salesperson’ (28.8%) and ‘expertise’ (26.5%). It is worth
mentioning that ‘advertisements’ gains 98 neutral votes (57.6%).
Table 12: : Correlation analysis - Question No. 11 ‘Reference groups’
According to the table 12, the authors make correlation analyses on different reference
groups with gender age and income level respectively. Only the reference group ‘expertise’ is
inferred to have a significant negative correlation with gender, since the Pearson correlation
value is -0.157 and the significance value is 0.040 (lower than 0.05). Therefore, females are
more likely to listen to the suggestions from expertise, such fashion bloggers, than males do.
4.4.3 Evaluation of alternatives
Table 13: Cross tabulation - Question No. 10 ‘Gender*Evaluation criteria’
Investigating purchase criteria is the core of understanding consumers’ evaluation process
when purchasing clothing accessories. The authors randomly list 11 different choices in the
question No. 10 for respondents to select at most three answers. Table 13 shows that, regard-
less of gender, ‘quality and material’ ranks the first place, and the second comes ‘style and
matching’, followed by ‘price and promotion’.
Family Friends Advertisements Celebrities Expertise Salesperson
Pearson Correlation -0.092 -0.068 -0.065 -0.092 -.157* -0.117
Sig. (2-tailed) 0.233 0.376 0.398 0.232 0.040 0.129
N 170 170 170 170 170 170
Pearson Correlation 0.048 -0.123 0.015 -0.061 -0.101 0.013
Sig. (2-tailed) 0.534 0.110 0.842 0.429 0.192 0.864
N 170 170 170 170 170 170
Pearson Correlation 0.076 -0.038 -0.033 -0.093 -0.094 -0.045
Sig. (2-tailed) 0.325 0.626 0.669 0.227 0.222 0.561
N 170 170 170 170 170 170
*. Correlation is significant at the 0.05 level (2-tailed).
Correlations
Gender
Age
IncomeLevel
After-sale
services
Quality &
materials
In-store
services
Individuali
zation Brand Package
Display
in store
Style &
matching Availability Function
Price &
promotion
Count 14 72 6 7 41 3 8 66 8 16 44 100
% within
Gender
14.0% 72.0% 6.0% 7.0% 41.0% 3.0% 8.0% 66.0% 8.0% 16.0% 44.0%
% within
$Criteria
63.6% 56.7% 46.2% 53.8% 64.1% 75.0% 66.7% 60.0% 61.5% 44.4% 61.1%
% of Total 8.2% 42.4% 3.5% 4.1% 24.1% 1.8% 4.7% 38.8% 4.7% 9.4% 25.9% 58.8%
Count 8 55 7 6 23 1 4 44 5 20 28 70
% within
Gender
11.4% 78.6% 10.0% 8.6% 32.9% 1.4% 5.7% 62.9% 7.1% 28.6% 40.0%
% within
$Criteria
36.4% 43.3% 53.8% 46.2% 35.9% 25.0% 33.3% 40.0% 38.5% 55.6% 38.9%
% of Total 4.7% 32.4% 4.1% 3.5% 13.5% 0.6% 2.4% 25.9% 2.9% 11.8% 16.5% 41.2%
Count 22 127 13 13 64 4 12 110 13 36 72 170
% of Total 12.9% 74.7% 7.6% 7.6% 37.6% 2.4% 7.1% 64.7% 7.6% 21.2% 42.4% 100.0%
a. Dichotomy group tabulated at value 1.
Gender*$Criteria Crosstabulation
$Criteriaa
Total
Gender
female
male
Total
Percentages and totals are based on respondents.

33
Table 14: Chi-square analysis - Question No. 10 ‘Gender*Evaluation criteria’
Chi-square analysis is applied to test whether different evaluation criteria have significant
relationship with gender. According to table 14, the Pearson Chi-square value between crite-
ria ‘function’ and gender is 3.899 with the asymptotic significance value of 0.048(lower than
0.05), which means that there is highly significant association between criteria ‘function’ and
gender.
Table 15: Cross tabulation - Question No. 10 ‘Age*Evaluation criteria’
Despite of age, the total number of votes for ‘quality and materials’ and ‘style and matching’
rank the top two that consumers consider when buying clothing accessories, followed by
‘price and promotion’.
Criteria After-sale
services
Quality &
materials
In-store
services
Individuali
zationBrand Package
Display
in store
Style &
matchingAvailability Function
Price &
promotionTotal
Pearson Chi-square
Value.242
a.941
a.933
a.144
a1.163
a.443
a.328
a.178
a.043
a3.899
a.270
a6.221
a
Asymptotic
Significance (2-sided)0.623 0.332 0.334 0.704 0.281 0.506 0.567 0.673 0.836 0.048 0.603 0.796
Gender*Criteria Chi-square
After-sale
services
Quality &
materials
In-store
services
Individuali
zationBrand Package
Display
in store
Style &
matchingAvailability Function
Price &
promotion
Count 17 77 9 12 41 4 9 68 7 21 46 109
% within Age 15.6% 70.6% 8.3% 11.0% 37.6% 3.7% 8.3% 62.4% 6.4% 19.3% 42.2%
% within
$Criteria
77.3% 60.6% 69.2% 92.3% 64.1% 100.0% 75.0% 61.8% 53.8% 58.3% 63.9%
% of Total 10.0% 45.3% 5.3% 7.1% 24.1% 2.4% 5.3% 40.0% 4.1% 12.4% 27.1% 64.1%
Count 5 41 4 1 21 0 3 31 5 11 19 49
% within Age 10.2% 83.7% 8.2% 2.0% 42.9% 0.0% 6.1% 63.3% 10.2% 22.4% 38.8%
% within
$Criteria
22.7% 32.3% 30.8% 7.7% 32.8% 0.0% 25.0% 28.2% 38.5% 30.6% 26.4%
% of Total 2.9% 24.1% 2.4% 0.6% 12.4% 0.0% 1.8% 18.2% 2.9% 6.5% 11.2% 28.8%
Count 0 5 0 0 1 0 0 6 0 1 5 6
% within Age 0.0% 83.3% 0.0% 0.0% 16.7% 0.0% 0.0% 100.0% 0.0% 16.7% 83.3%
% within
$Criteria
0.0% 3.9% 0.0% 0.0% 1.6% 0.0% 0.0% 5.5% 0.0% 2.8% 6.9%
% of Total 0.0% 2.9% 0.0% 0.0% 0.6% 0.0% 0.0% 3.5% 0.0% 0.6% 2.9% 3.5%
Count 0 2 0 0 0 0 0 3 1 1 1 3
% within Age 0.0% 66.7% 0.0% 0.0% 0.0% 0.0% 0.0% 100.0% 33.3% 33.3% 33.3%
% within
$Criteria
0.0% 1.6% 0.0% 0.0% 0.0% 0.0% 0.0% 2.7% 7.7% 2.8% 1.4%
% of Total 0.0% 1.2% 0.0% 0.0% 0.0% 0.0% 0.0% 1.8% 0.6% 0.6% 0.6% 1.8%
Count 0 2 0 0 1 0 0 2 0 2 1 3
% within Age 0.0% 66.7% 0.0% 0.0% 33.3% 0.0% 0.0% 66.7% 0.0% 66.7% 33.3%
% within
$Criteria
0.0% 1.6% 0.0% 0.0% 1.6% 0.0% 0.0% 1.8% 0.0% 5.6% 1.4%
% of Total 0.0% 1.2% 0.0% 0.0% 0.6% 0.0% 0.0% 1.2% 0.0% 1.2% 0.6% 1.8%
Count 22 127 13 13 64 4 12 110 13 36 72 170
% of Total 12.9% 74.7% 7.6% 7.6% 37.6% 2.4% 7.1% 64.7% 7.6% 21.2% 42.4% 100.0%
Age*$Criteria Crosstabulation
$Criteriaa
Total
Age
18 to
25
years
old
26 to
35
years
old
36 to
45
years
old
46 to
55
years
old
56
years
old and
the
older
Total
Percentages and totals are based on respondents.
a. Dichotomy group tabulated at value 1.

34
Table 16: Cross tabulation - Question No. 10 ‘Income level*Evaluation criteria’
Divided by income level, ‘quality and materials’, ‘style and matching’ and ‘price and promo-
tion’. are also the top three criteria that consumers take into account when shopping clothing
accessories.
Furthermore, respondents are voluntary to answer open-ended questions on other specific
factors that they weigh important, which are not mentioned in the questionnaire above. We
receive 44 valid comments, which are sorted out and explained below.
Four respondents mention that their budgets limit their buying behavior. Most of them are
with the monthly income of 0-1000 euros, who may be part-time workers or students. Even
though they have strong willingness to promote their appearance and strong motivation to
buy additional clothing accessories, the disposable income is unneglectable factor for them.
Special offers and seasonal promotions are fairly welcomed by the group of people with less
disposable income. Meanwhile, there are three respondents evaluating their emotion as prin-
cipal factors for them. The buying behavior of this group of people may be fairly depended
and driven by their mood and feeling. Another three respondents believe that their purchases
are only depended on whether they like the products or not. However, the “like” is a very
vague concept driven by emotion, rather than reason. In this case, those consumers may not
be very loyal to any specific brands as well. Besides, a few people provide specific answers,
i.e. their partners’ opinions and even decisions, the person they go shopping with, the repu-
tation of the brand or the company, online reviews, suitable colors for kids, brand actions on
sustainable development goals (SDG), and the level of cost performance.
After-sale
services
Quality &
materials
In-store
services
Individuali
zationBrand Package
Display
in store
Style &
matchingAvailability Function
Price &
promotion
Count 12 75 9 11 41 3 7 64 10 21 44 105
% within
IncomeLevel
11.4% 71.4% 8.6% 10.5% 39.0% 2.9% 6.7% 61.0% 9.5% 20.0% 41.9%
% within
$Criteria
54.5% 59.1% 69.2% 84.6% 64.1% 75.0% 58.3% 58.2% 76.9% 58.3% 61.1%
% of Total 7.1% 44.1% 5.3% 6.5% 24.1% 1.8% 4.1% 37.6% 5.9% 12.4% 25.9% 61.8%
Count 9 27 3 2 14 1 2 26 2 8 20 39
% within
IncomeLevel
23.1% 69.2% 7.7% 5.1% 35.9% 2.6% 5.1% 66.7% 5.1% 20.5% 51.3%
% within
$Criteria
40.9% 21.3% 23.1% 15.4% 21.9% 25.0% 16.7% 23.6% 15.4% 22.2% 27.8%
% of Total 5.3% 15.9% 1.8% 1.2% 8.2% 0.6% 1.2% 15.3% 1.2% 4.7% 11.8% 22.9%
Count 1 19 1 0 8 0 3 14 0 4 7 19
% within
IncomeLevel
5.3% 100.0% 5.3% 0.0% 42.1% 0.0% 15.8% 73.7% 0.0% 21.1% 36.8%
% within
$Criteria
4.5% 15.0% 7.7% 0.0% 12.5% 0.0% 25.0% 12.7% 0.0% 11.1% 9.7%
% of Total 0.6% 11.2% 0.6% 0.0% 4.7% 0.0% 1.8% 8.2% 0.0% 2.4% 4.1% 11.2%
Count 0 6 0 0 1 0 0 6 1 3 1 7
% within
IncomeLevel
0.0% 85.7% 0.0% 0.0% 14.3% 0.0% 0.0% 85.7% 14.3% 42.9% 14.3%
% within
$Criteria
0.0% 4.7% 0.0% 0.0% 1.6% 0.0% 0.0% 5.5% 7.7% 8.3% 1.4%
% of Total 0.0% 3.5% 0.0% 0.0% 0.6% 0.0% 0.0% 3.5% 0.6% 1.8% 0.6% 4.1%
Count 22 127 13 13 64 4 12 110 13 36 72 170
% of Total 12.9% 74.7% 7.6% 7.6% 37.6% 2.4% 7.1% 64.7% 7.6% 21.2% 42.4% 100.0%
IncomeLevel*$Criteria Crosstabulation
$Criteriaa
Total
Percentages and totals are based on respondents.
a. Dichotomy group tabulated at value 1.
Income
Level
0-1000
1001-
2000
2001-
3000
over
3000
Total

35
4.4.4 Purchase decision
Purchase decisions are made according to the assessment of alternatives as well as the previ-
ous experiences. After the analytical consideration on prices, conditions and payment meth-
ods, consumers decide whether they forward to the paying step or give up the products. This
phase of the process is not significantly affected by the varing variables the authors set.
Figure 18: Question No. 7 ‘Planned or impulsive purchase’
The statistics of the question No. 7 show that the amount of people making impulsive deci-
sions (40.6%) overweights the number of planners (32.4%). Still, 27.1% respondents either plan
for their purchase in advance or purchase on the spur of the moment (Figure 19).
Table 17: : Correlation analysis - Question No. 7 ‘Planned or impulsive purchase’
The authors make a correlation analysis on whether people’s decisions are planned or made
on the spur of the moment, to test if it is influenced significantly by gender, age or income
level. The result in table 17 illustrates that there is a highly significant association between
consumer purchase decisions and income level, since the Pearson correlation value between
them is -0.188 and the significance value is 0.014 (lower than 0.05).
Pearson Correlation -0.005
Sig. (2-tailed) 0.953
N 170
Pearson Correlation -0.150
Sig. (2-tailed) 0.051
N 170
Pearson Correlation -.188*
Sig. (2-tailed) 0.014
N 170
Correlations
Gender
Age
IncomeLevel
*. Correlation is significant at the 0.05 level (2-tailed).
Inpulsive or planned purchase

36
4.4.5 Post-purchase behavior
Post-purchase behavior occurs when consumers are evaluating the product performance.
Based on consumer satisfaction, they make future choices on stores or brands. Gradually they
accumulate purchase experiences and build up their own buying habits.
Figure 19: Question No. 13 ‘Shop selections’
The question No. 13 is a single-choice question, linking with consumer post-purchase behavior
and consumer loyalty. Besides, the selection of shops involves the process of information
search. The respondent selects the only and the most usual one among the choices according
to his or her habit.
The proportion of respondents trying new shops randomly and returning to the same shop, are
similarly and respectively 33.5% and 32.9%. Meanwhile, 17.1% people are inclined to search
for the exact information before directly visiting the store, and the rest respondents (15.9%)
are fairly attracted by discounts and offers (Figure 20).
Table 18: Correlation analysis - Question No. 13 ‘Shop selections’
PostPurchase
Pearson Correlation 0.146
Sig. (2-tailed) 0.059
N 169
Pearson Correlation 0.001
Sig. (2-tailed) 0.993
N 169
Pearson Correlation -0.038
Sig. (2-tailed) 0.624
N 169
Correlations
Gender
Age
IncomeLevel

37
The correlation analysis is utilized on the consumers’ shop selections. However, the
significance values are all higher than 0.05, which indicates that consumers’ shop selections
have no significant association with gender, age or income level (Table 18).
4.5 Summary of the research
The aim of the research is to understand consumer characteristics when buying clothing ac-
cessory products, and get insights into their decision-making processes in detail. The poten-
tial consumers are segmented by three variables (age, gender, and income level) in the study,
by which different behaviors and characteristics of target consumers are investigated.
Through the analysis on the investigation results, in the first stage of the decision-making
process, needs recognition, the authors conclude that consumers generally believe that
clothing accessories highly contribute to their self-image, and that the peak shopping season
is summer. However, the correlation test reveals that the ‘level of the importance for self-
image’ and the ‘purchase peak season’ are not associated with three variables selected. From
the analysis, the purchase frequency varies with gender and age. Females consume clothing
accessories more frequently than males do, and the frequency is decreasing with the age
growing. In addition, ‘functional need’ and the ‘need for fashion trends’ are highly
significantly related with gender. Females are more in pursuit of fashion trends, while males
are in need of functions more. Meanwhile, growing age also raises people’s demand for
products’ function.
Secondly, in the information search procedure, two main sources that consumers gather
information about clothing accessory products from, are ‘people around you’ and ‘social
media’. Within the reference groups, suggestions from ‘family members’ and ‘friends and
colleagues’ are believed as the most credible. According to the correlation test, females are
more inclined to take the advices from ‘expertise’ than the males do.
Next, consumers evaluate the alternatives based on their own criteria and principles.
According to the survey, the ‘quality and material’, ‘style and matching’, and the ‘price and
promotion’ are the most influencing measurements. The result of Chi-square test reveals that
there is significant relationship between criteria ‘functions’ and gender. Specifically, males
value products’ functions more than females do.
Purchases are either planned or impulsive. For the clothing accessories products, more
consumers shop on the spur of the moment. The exact decisions are made after consumers’
assessments on the alternatives and consideration on the payment. This procedure is
influenced only by income level.

38
Lastly, consumers’ post purchase behavior is based on the product performance and the past
purchase experiences, which determines whether the consumer will repeat their purchase or
even become loyal. The analysis indicates that this procedure is not affected by gender, age
and income level.
4.6 Suggestions for the case company
The marketing implications gained based on the research are summarized. Firstly, the
frequency and time for launches of the new products could be adjusted based on the
consumer shopping frequency.
Secondly, since consumers value ‘functional needs’ and ‘the need for suitable products for
different occasions’ as the top two motivations for shopping clothing accessories, a single
product would be popular when it is equipped with different functions which is suitable for
different occasions.
Thirdly, different media could cater for different target groups for effective advertisements
correspondingly. For example, younger age groups are more likely to gather information from
social media more than the older age groups. Meanwhile, consumers are taking the advices
from people around, so that the reputation of the brand and the store accounts much. A
product is not sold alone, but is with added value of the service, which could be emphasized
more by the company. Additionally, shop window, as another important information source, is
a very important advertising and communication channel, whose design could be very eye-
catching.
5 Conclusion
5.1 Self evaluation
Through the three-month investigation, the authors make a comparison and analysis of theory
and realistic situations, and makes use of quantitative research (questionnaire). Cross-
tabulation is utilized to categorize the data descriptively. Correlation analysis and Chi-square
test are used for examining the associations between variables. The authors analyze the
results and summarize the general regulations of the consumer decision-making process when
buying clothing accessory products.
However, the authors conclude the shortages of the research under the limitations of time,
range and sample size. Firstly, the cultural factor could have been considered and analyzed.
The respondents of the questionnaire are potential clothing accessories consumers in Finland
market. However, the respondents are with different cultural backgrounds, which may also
exert subtle influences on their behaviors. Secondly, to ensure the validity and reliability, the
authors test 25 preliminary respondents in advance. However, the pre-test could have been

39
conducted for several more times and in different target groups, in order to enhance the
quality of the questionnaire. Last but not the least, the questionnaire consists of merely 15
questions, which is not sufficient to cover all the research aspects in depth. In the open-
ended question, some respondents describe that, there are several specific factors that they
also weigh important when making choices on clothing accessories, but neglected by the
authors when designing the questionnaire, i.e. disposable budget limits, emotion, and brand
actions on sustainable development goals.
5.2 Vision on future research
The present research investigates into the whole consumer decision-making processes and
consumer characteristics when buying clothing accessories. However, there are gaps between
theories and realistic situations. The future research will benefit from deeper and more spe-
cific analysis on consumer behavior.
Firstly, in terms of content, our research investigates the whole decision-making process
comprehensively, which is a wide topic including many aspects of consumer behavior. There-
fore, deeper research into one or several specific aspects could be conducted. To be specific,
the authors find out in the current research that consumers are more likely to buy clothing
accessory on the spur of the moment, which is to a large degree linked with their emotions.
For example, the topic regarding how emotion makes impacts on consumer behavior when
purchasing clothing accessories, deserves further researching. And the topic on how a brand
can attract consumers by stimulating their emotion, involves the marketing implications.
Besides, due to wide classification of clothing accessories, consumer behavior varies when
buying distinct categories. Therefore, a further research can be explored into customer be-
havior of purchasing different sorts of clothing accessories.
In terms of the future methodology, qualitative research such as group interviews with target
consumers could be combined with the existing quantitative research, contributing to the
study. In addition, the confidence interval could be taken into account when determining the
sample size, based on which, enlarging the sample size can contribute to the generalization
of the regular patterns concluded from the statistics.

40
References Books Cumming, V., Cunnington, C. & Cunnington, P. 2010. The dictionary of fashion history. 1st edition. Oxford: Berg. Dubois, B. 2000. Understanding the consumer. 1st edition. London: Prentice Hall. Engel, J., Kollat, D. & Blackwell, R. 1968. Consumer behavior. 1st edition. New York: Holt, Rinehart and Winston. Hawkins, D., Mothersbaugh, D. & Mookerjee, A. 2011. Consumer behavior. 1st edition. New Delhi: Tata McGraw Hill. Jackson, T. & Shaw, D. 2010. Mastering fashion marketing. 1st edition. Basingstoke: Palgrave Macmillan. Krech, D., Ballachey, E. & Crutchfield, R. 1983. Individual in society. 1st edition. New York: McGraw-Hill. Kumra, R. 2007. Consumer behavior. 1st edition. Mumbai: Himalaya Pub. House. Mazzalovo, G. & Chevalier, M. 2013. Luxury brand management. 1st edition. Hoboken, N.J.: Wiley. McClelland, D. 1961. Achieving society. 1st edition. Princeton, NJ: D. Van Nostrand. Mintel. 2006. Fashion consumer typologies. In Jackson, T. & Shaw, D. 2010. Mastering fashion marketing. 1st edition. Basingstoke: Palgrave Macmillan. Okonkwo, U. 2007. Luxury fashion branding. 1st edition. New York: Palgrave Macmillan. Salmons, J. 2016. Doing qualitative research online. 1st edition. Los Angeles: Sage. Saunders, M., Lewis, P. & Thornhill, A. 2009. Research methods for business students. 5th edition. Harlow: Edinburgh Gate. Snape, D. & Spencer, L. 2003. The foundations of qualitative research. In J. Ritchie and J. Lewis (Eds.). Qualitative research practice: a guide for social science students and research-ers London: Sage. Solomon, M. 2011. Consumer behavior. 1st edition. Boston: Pearson. Electronic sources Burnkrant, R. and Cousineau, A. 1975. Informational and Normative Social Influence in Buyer Behavior. Journal of Consumer Research, 2 (3), 206-15. Artical from ResearchGate. Accessed 19 March 2017. https://www.researchgate.net/publication/24098793_Informational_and_Normative_Social_Influence_in_Buyer_Behavior Cox, D. 2011. Fashion Segments Handbook Females. Article from Experian. Accessed 24 March 2017. http://www.experian.co.uk/assets/business-strategies/brochures/fashion_segments_handbook_females_small[1].pdf

41
Maslow, A. 1943. A theory of human motivation. Psychological Review, 50(4), 370-396. Article from American Psychological Association. Accessed 20 February 2017. http://psycnet.apa.org/journals/rev/50/4/370/ Missmeasured. 2012. Fashion Target Markets. Posted 30 March. Accessed 23 March 2017. https://fashiontriangle.wordpress.com/2012/03/30/fashion-target-market/ Shirish, T. 2014. Research Methodology in Education. 1st edition. Lulu Publication, 37. Ac-cessed 15 March 2017. http://bookreview.isrj.org/PublishedBooks/49.pdf

42
Figures
Figure 1: Structure of the study ......................................................................... 9 Figure 2: Engel Kollat Blackwell (EKB) Model of consumer behavior ........................... 10 Figure 3: The buyer decision-making process in EKB model ..................................... 11 Figure 4: The three levels of explanation of buying and consumption behavior ............. 12 Figure 5: Maslow hierarchy of needs ................................................................. 13 Figure 6: The perceptual process ..................................................................... 14 Figure 7: Types of questionnaire ...................................................................... 19 Figure 8: Reliability statistics of questions No. 5, 7, 8, 9, 11, 13 ............................... 23 Figure 9: Question No. 1 ‘Gender’ .................................................................... 24 Figure 10: Question No. 2 ‘Age’ ....................................................................... 24 Figure 11: Question No. 3 ‘Education level' ......................................................... 25 Figure 12: Question No. 4 ‘Income level (euros after tax)’ ...................................... 25 Figure 13: Question No. 5 ‘Frequency of purchase’ ............................................... 26 Figure 14: Question No. 6 ‘Seasons of purchase’................................................... 27 Figure 15: Question No. 8 ‘Importance for self-image’ ........................................... 27 Figure 16: Question No. 9 ‘Motivations’ ............................................................. 28 Figure 17: Question No. 11 ‘Reference groups’ .................................................... 31 Figure 18: Question No. 7 ‘Planned or impulsive purchase’ ..................................... 35 Figure 19: Question No. 13 ‘Shop selections’ ....................................................... 36

43
Tables
Table 1: Fashion consumer typologies ............................................................... 16 Table 2: Questionnaire design ......................................................................... 20 Table 3: Statistics results .............................................................................. 22 Table 4: Reliability statistics analysis ................................................................ 23 Table 5: Correlation analysis - Question No. 5 ‘Frequency of purchase’ ...................... 26 Table 6: Correlation analysis - Question No. 8 ‘Importance of self-image’ ................... 28 Table 7: Correlation analysis – Question No. 9 ‘Motivations’ .................................... 29 Table 8: Cross tabulation - Question No. 12 ‘Gender*Sources of information’ ............... 29 Table 9: Chi-square analysis - Question No. 12 ‘Gender*Sources of information’ ........... 30 Table 10: Cross tabulation - Question No. 12 ‘Age*Sources of information’ .................. 30 Table 11: Cross tabulation - Question No. 12 ‘Income level*Sources of information’ ....... 31 Table 12: : Correlation analysis - Question No. 11 ‘Reference groups’ ........................ 32 Table 13: Cross tabulation - Question No. 10 ‘Gender*Evaluation criteria’ ................... 32 Table 14: Chi-square analysis - Question No. 10 ‘Gender*Evaluation criteria’ ............... 33 Table 15: Cross tabulation - Question No. 10 ‘Age*Evaluation criteria’ ....................... 33 Table 16: Cross tabulation - Question No. 10 ‘Income level*Evaluation criteria’ ............ 34 Table 17: : Correlation analysis - Question No. 7 ‘Planned or impulsive purchase’ ......... 35 Table 18: Correlation analysis - Question No. 13 ‘Shop selections’ ............................ 36

44
Appendixes
Appendix 1: Questionnaire ............................................................................. 45

45 Appendix 1
Appendix 1: Questionnaire

46 Appendix 1

47 Appendix 1

48 Appendix 1
Top Related