


Languages
Pages
Legal


ALVAREZ & MARSAL
EUROPEAN DISTRESSED
CREDIT WATCH LIST
July 2016
I. Capital Markets Overview
II. List of Distressed Credits
CONTENTS

CAPITAL MARKETS
OVERVIEW

MARKET HIGHLIGHTS
● The quarterly decrease in leveraged finance in 1Q’16 stems from a large fall in high yield bonds issuance, which decreased by 24.1%
QoQ, while leveraged loan issuance increased by 2.9% in the same period
● High yield bonds were also the main driver for the YoY fall, decreasing by 73%, while leverage loan issuance decreased by 47% in the
same period
● As per the European Central Bank lending survey, improving loan supply conditions and the continued increase in loan demand across
all loan categories suggested an on-going recovery in loan growth
● There was a net easing of credit standards in the period driven by increased competition, while risk perceptions and banks’ reduced
cost of funds also had a marginal impact
● Credit standards were eased more strongly to large firms than medium and small sized firms. By country, standards were eased to Italy
and Germany, remained unchanged in Spain and the Netherlands and continued to tighten in France
● Major issuers during the quarter were Faurecia SA , Fiat Chrysler Automobiles NV, HeidelbergCement AG, Intelsat Jackson Holdings
SA, Lincoln Finance Ltd, Telecom Italia SpA, ThyssenKrupp AG and Southern Gas Corridor CJSC
● High-yield bond default rates decreased in March 2016, with S&P reporting a default rate of 1.6%, down from 2.3% in 4Q’15
● There was only one bond default in Q1’16, namely CB Intercommerz Ltd., a Russian Bank
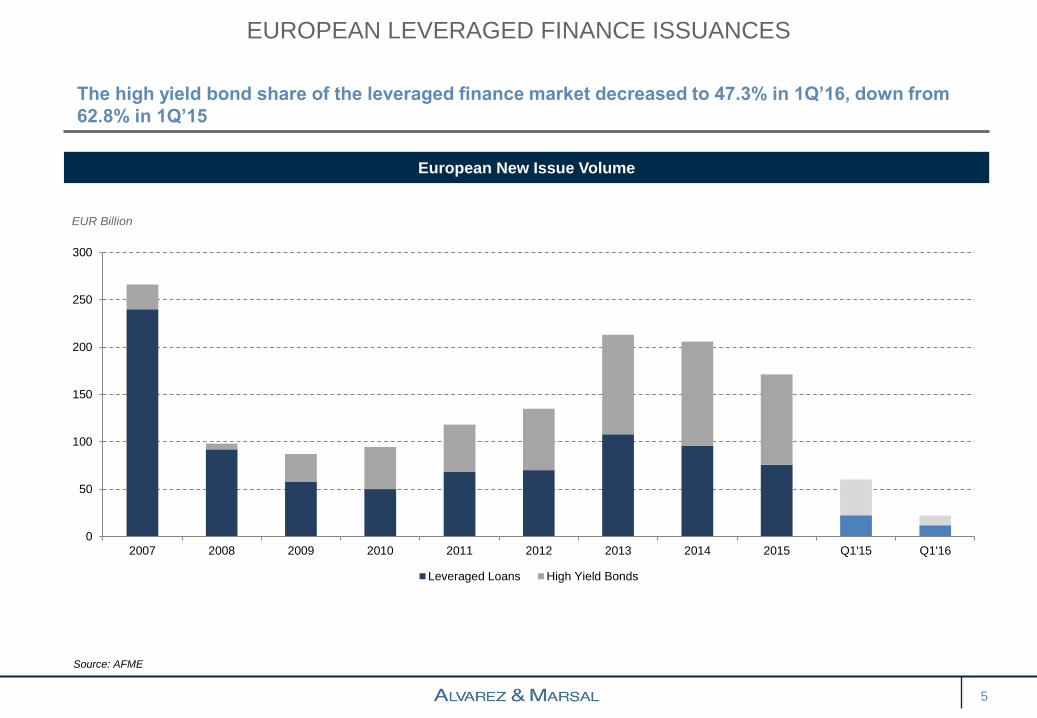
European leveraged finance issuance decreased in 1Q’16 to €22.6 billion, a 12% QoQ decrease from
€25.6 billion in 4Q’15 and a 62.5% YoY decrease from €60.1 billion in 1Q’15
Source: AFME
4
EUROPEAN LEVERAGED FINANCE ISSUANCES
5
The high yield bond share of the leveraged finance market decreased to 47.3% in 1Q’16, down from
62.8% in 1Q’15
European New Issue Volume
EUR Billion
Source: AFME
0
50
100
150
200
250
300
2007 2008 2009 2010 2011 2012 2013 2014 2015 Q1'15 Q1'16
Leveraged Loans High Yield Bonds
EUROPEAN LEVERAGED LOAN ISSUANCES
6
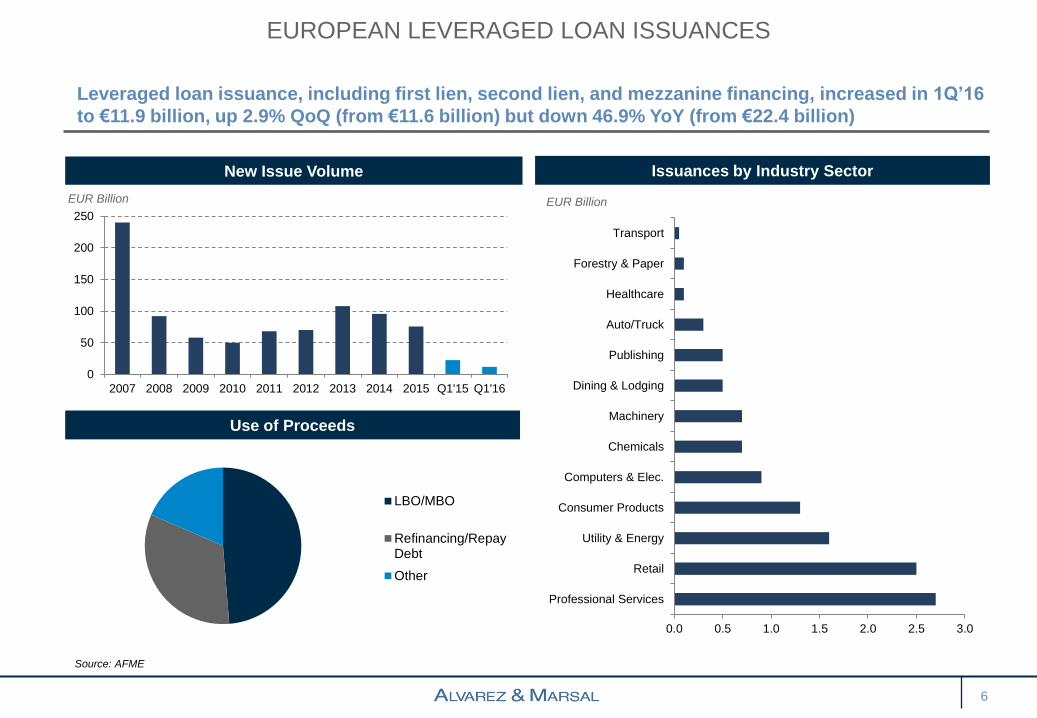
Leveraged loan issuance, including first lien, second lien, and mezzanine financing, increased in 1Q’16
to €11.9 billion, up 2.9% QoQ (from €11.6 billion) but down 46.9% YoY (from €22.4 billion)
New Issue Volume
EUR Billion
Use of Proceeds
Issuances by Industry Sector
EUR Billion
Source: AFME
0
50
100
150
200
250
2007 2008 2009 2010 2011 2012 2013 2014 2015 Q1'15 Q1'16
0.0 0.5 1.0 1.5 2.0 2.5 3.0
Professional Services
Retail
Utility & Energy
Consumer Products
Computers & Elec.
Chemicals
Machinery
Dining & Lodging
Publishing
Auto/Truck
Healthcare
Forestry & Paper
Transport
LBO/MBO
Refinancing/RepayDebt
Other
EUROPEAN HIGH YIELD ISSUANCES
7
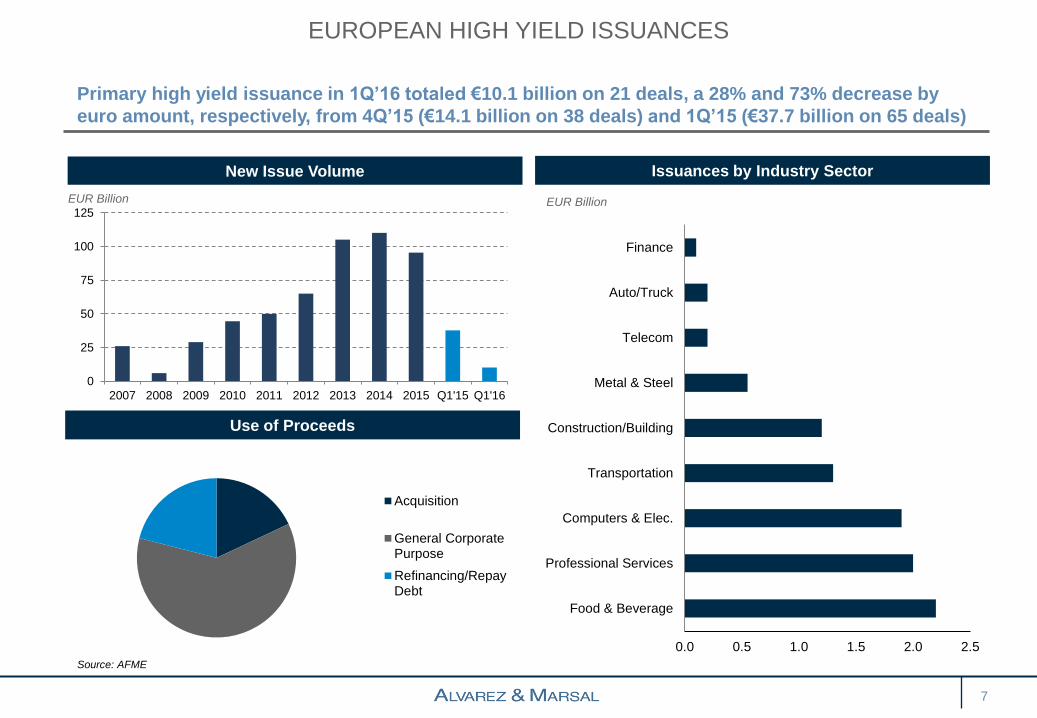
Primary high yield issuance in 1Q’16 totaled €10.1 billion on 21 deals, a 28% and 73% decrease by
euro amount, respectively, from 4Q’15 (€14.1 billion on 38 deals) and 1Q’15 (€37.7 billion on 65 deals)
New Issue Volume
EUR Billion
Use of Proceeds
Issuances by Industry Sector
EUR Billion
Source: AFME
0.0 0.5 1.0 1.5 2.0 2.5
Food & Beverage
Professional Services
Computers & Elec.
Transportation
Construction/Building
Metal & Steel
Telecom
Auto/Truck
Finance
0
25
50
75
100
125
2007 2008 2009 2010 2011 2012 2013 2014 2015 Q1'15 Q1'16
Acquisition
General CorporatePurpose
Refinancing/RepayDebt

MATURITY PROFILE
8
€ 5.1tn of European corporate debt is expected to mature by 2021
Source: AFME
European Corporate Bonds – Maturity Wall
EUR Billion
0
200
400
600
800
1000
1200
1400
1600
1800
2016 2017 2018 2019 2020 2021 2022 2023 2024 2025 2026 2027 2028 2029 2030
€ B
illio
n

DEBT MATURITY PIPELINE – NEXT 6 MONTHS (FACILITIES >EUR 100M)
9
Source: Debtwire, CapitalIQ, Company Reports
Company Country Sector Debt Instrument Cur. Out (m) Out (EUR
m) Maturity
Total
Debt
(EURm)
% of Total
Debt
EBITDA
(EURm)
Debt/
EBITDA
Fiat S.p.A Italy Automotive Bond EUR 1,000 1000 01-Apr-16 26,555 4% 7,832 3.4x
Rallye SA France Retail Bond EUR 601 601 01-Apr-16 15,756 4% 1,973 8.0x
Fresenius SE & Co. KGaA Germany Healthcare Bond EUR 156 156 04-Apr-16 14,625 1% 5,050 2.9x
Fresenius SE & Co. KGaA Germany Healthcare Bond EUR 129 129 04-Apr-16 14,625 1% 5,050 2.9x
Stora Enso Oyj Finland Paper Bond USD 412 345 15-Apr-16 3,956 9% 1,341 3.0x
The Rank Group Plc UK Gambling Term Loan GBP 140 166 25-Apr-16 166 100% 172 1.0x
Energias de Portugal S.A. Portugal Utilities Bond EUR 164 164 30-Apr-16 19,271 1% 3,924 4.9x
Sacyr S.A. Spain Construction Convertible Bond EUR 189 189 01-May-16 4,985 4% 278 17.9x
Styrolution Group GmbH Germany Manufacturing Bond EUR 482 482 15-May-16 1,435 34% 742 1.9x
Hellenic Petroleum SA Greece Oil and Gas Bond USD 328 328 16-May-16 3,228 10% 421 7.7x
Hellenic Telecommunications Organisation SA Greece Media Bond EUR 630 630 20-May-16 2,190 29% 1,197 1.8x
Diana Shipping Inc. Greece Transportation Rev. Credit Facility USD 210 191 24-May-16 541 35% 9 58.4x
Styrolution Group GmbH Germany Manufacturing A/R Facility EUR 251 251 30-May-16 1,435 17% 742 1.9x
ArcelorMittal SA Luxembourg Steel Bond USD 1,373 1007 03-Jun-16 17,730 6% 2,597 6.8x
Vedanta Resources Plc UK Mining Bond USD 750 549 07-Jun-16 15,597 4% 2,031 7.7x
Mauser Group BV Netherlands Industrial products and services Bank Debt USD 192 148 13-Jun-16 1,210 12% 187 6.5x
Mauser Group BV Netherlands Industrial products and services TLC Credit Facility EUR 116 116 13-Jun-16 1,210 10% 187 6.5x
Energias de Portugal S.A. Portugal Utilities Bond EUR 500 500 13-Jun-16 19,271 3% 3,924 4.9x
Seat Pagine Gialle S.p.A Italy Media & Communications Bond EUR 571 571 15-Jun-16 1,177 49% 26 44.8x
Norske Skogindustrier ASA Norway Manufacuturing Bond EUR 130 130 15-Jun-16 1,018 13% 64 15.9x
Barry Callebaut AG Switzerland Food Rev. Credit Facility CHF 137 112 15-Jun-16 1,683 7% 458 3.7x
United Biscuits Limited UK Packaged food Term Loan GBP 159 184 15-Jun-16 1,238 15% 243 5.1x
Mylan NV UK Healthcare Bond USD 499 369 20-Jun-16 6,552 6% 2,578 2.5x
Anglian Water Group UK Utilities Bond EUR 500 483 27-Jun-16 8,072 6% 1,015 8.0x
Cementos Portland Valderrivas SA Spain Construction Term Loan EUR 805 805 30-Jun-16 1,429 56% 94 15.2x
SGL Carbon SE Germany Manufacturing Convertible Bond EUR 135 135 30-Jun-16 741 18% 94 7.9x
Cementos Portland Valderrivas SA Spain Construction Credit Facility EUR 170 170 30-Jun-16 1,429 12% 94 15.2x
Numericable-SFR France Telecommunications TLB Credit Facility EUR 107 107 30-Jun-16 17,317 1% 3,286 5.3x
Kerling plc UK Manufacturing Financing Facility EUR 116 116 30-Jun-16 999 12% 0 na
Cementos Portland Valderrivas SA Spain Construction Term Loan EUR 530 530 30-Jun-16 1,429 37% 94 15.2x
Cementos Portland Valderrivas SA Spain Construction Term Loan EUR 105 105 30-Jun-16 1,429 7% 94 15.2x
Ardagh Group S.A. Luxembourg Manufacturing Bond EUR 297 297 01-Jul-16 5,392 6% 934 5.8x
Vedanta Resources Plc UK Mining Convertible Bond USD 1250 919 13-Jul-16 15,597 6% 2,031 7.7x
OC Oerlikon Corporation AG Switzerland Technology Bond CHF 299 245 13-Jul-16 703 35% 387 1.8x
Lafarge S.A. France Construction Bond USD 592 606 15-Jul-16 12,266 5% 2,655 4.6x
Fresenius Medical Care AG & Co. KGaA Germany Healthcare Bond USD 343 249 15-Jul-16 7,851 3% 2,671 2.9x
Fresenius SE & Co. KGaA Germany Healthcare Bond EUR 249 249 15-Jul-16 14,625 2% 5,050 2.9x
Abengoa, S.A. Spain Technology Term Loan EUR 1777 1777 20-Jul-16 10,090 18% 242 41.6x
Abengoa, S.A. Spain Technology Term Loan EUR 101 101 31-Jul-16 10,090 1% 242 41.6x
Virgin Media Inc UK Telecommunication Bond EUR 180 175 01-Aug-16 13,590 1% 2,489 5.5x
Virgin Media Inc UK Telecommunication Bond USD 1350 981 01-Aug-16 13,590 7% 2,489 5.5x
HeidelbergCement AG Germany Construction Bond USD 562 562 15-Aug-16 7,977 7% 2,339 3.4x
British Airways Plc UK Aviation Bond GBP 250 297 23-Aug-16 1,043 28% 2,316 0.5x
Alain Afflelou S.A. France Retail TLA Credit Facility EUR 220 220 23-Aug-16 652 34% 70 9.3x
CEVA Logistics B.V. Netherlands Transportation Term Loan USD 317 220 31-Aug-16 6,249 4% 1,871 3.3x
Travelport Worldwide Limited UK Technology Bond USD 229 168 01-Sep-16 2,136 8% 376 5.7x
Tesco Plc UK Retail Bond GBP 307 434 09-Sep-16 17,170 3% 2,552 6.7x
Tesco Plc UK Retail Bond EUR 1,500 1209 12-Sep-16 17,170 7% 2,552 6.7x
Brakes Group UK Food TLC Credit Facility GBP 236 285 12-Sep-16 1,250 23% 215 5.8x
NXP Semiconductors N.V. Netherlands Semiconductors Bond USD 500 362 15-Sep-16 7,926 5% 1,602 4.9x
REN - Redes Energeticas Nacionais, SGPS, S.A. Portugal Utilities Bond EUR 300 300 21-Sep-16 2,594 12% 454 5.7x
Energias de Portugal S.A. Portugal Utilities Bond EUR 1,000 1000 26-Sep-16 19,271 5% 3,924 4.9x
ArcelorMittal SA Luxembourg Steel Other USD 345 252 27-Sep-16 17,730 1% 2,597 6.8x
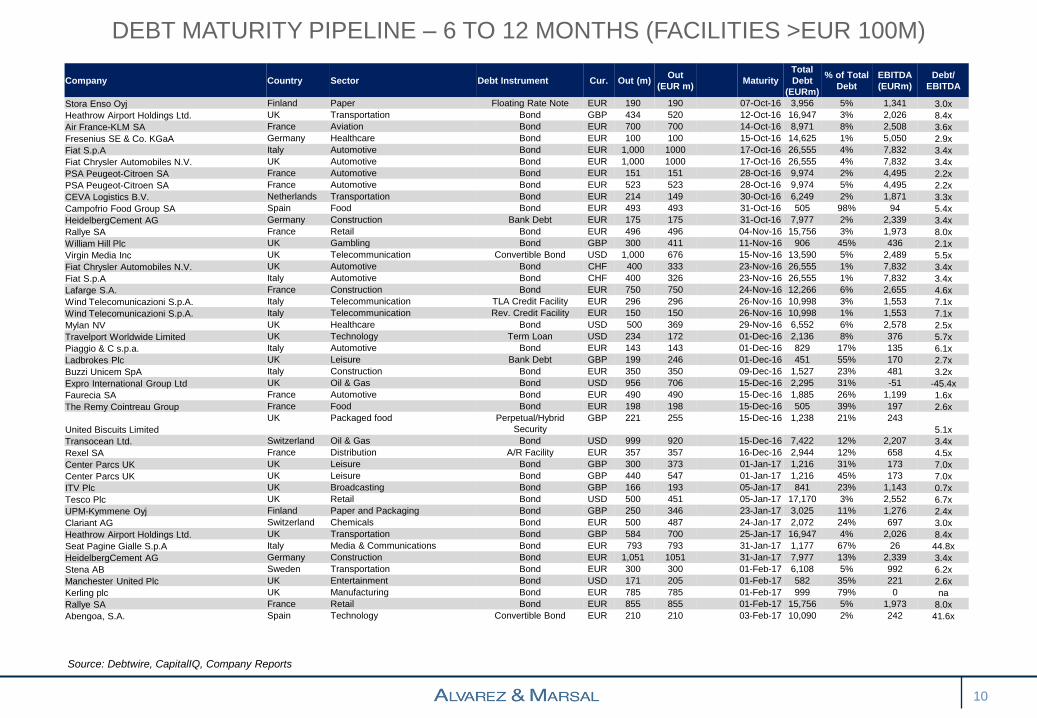
DEBT MATURITY PIPELINE – 6 TO 12 MONTHS (FACILITIES >EUR 100M)
10
Source: Debtwire, CapitalIQ, Company Reports
Company Country Sector Debt Instrument Cur. Out (m) Out
(EUR m) Maturity
Total
Debt
(EURm)
% of Total
Debt
EBITDA
(EURm)
Debt/
EBITDA
Stora Enso Oyj Finland Paper Floating Rate Note EUR 190 190 07-Oct-16 3,956 5% 1,341 3.0x
Heathrow Airport Holdings Ltd. UK Transportation Bond GBP 434 520 12-Oct-16 16,947 3% 2,026 8.4x
Air France-KLM SA France Aviation Bond EUR 700 700 14-Oct-16 8,971 8% 2,508 3.6x
Fresenius SE & Co. KGaA Germany Healthcare Bond EUR 100 100 15-Oct-16 14,625 1% 5,050 2.9x
Fiat S.p.A Italy Automotive Bond EUR 1,000 1000 17-Oct-16 26,555 4% 7,832 3.4x
Fiat Chrysler Automobiles N.V. UK Automotive Bond EUR 1,000 1000 17-Oct-16 26,555 4% 7,832 3.4x
PSA Peugeot-Citroen SA France Automotive Bond EUR 151 151 28-Oct-16 9,974 2% 4,495 2.2x
PSA Peugeot-Citroen SA France Automotive Bond EUR 523 523 28-Oct-16 9,974 5% 4,495 2.2x
CEVA Logistics B.V. Netherlands Transportation Bond EUR 214 149 30-Oct-16 6,249 2% 1,871 3.3x
Campofrio Food Group SA Spain Food Bond EUR 493 493 31-Oct-16 505 98% 94 5.4x
HeidelbergCement AG Germany Construction Bank Debt EUR 175 175 31-Oct-16 7,977 2% 2,339 3.4x
Rallye SA France Retail Bond EUR 496 496 04-Nov-16 15,756 3% 1,973 8.0x
William Hill Plc UK Gambling Bond GBP 300 411 11-Nov-16 906 45% 436 2.1x
Virgin Media Inc UK Telecommunication Convertible Bond USD 1,000 676 15-Nov-16 13,590 5% 2,489 5.5x
Fiat Chrysler Automobiles N.V. UK Automotive Bond CHF 400 333 23-Nov-16 26,555 1% 7,832 3.4x
Fiat S.p.A Italy Automotive Bond CHF 400 326 23-Nov-16 26,555 1% 7,832 3.4x
Lafarge S.A. France Construction Bond EUR 750 750 24-Nov-16 12,266 6% 2,655 4.6x
Wind Telecomunicazioni S.p.A. Italy Telecommunication TLA Credit Facility EUR 296 296 26-Nov-16 10,998 3% 1,553 7.1x
Wind Telecomunicazioni S.p.A. Italy Telecommunication Rev. Credit Facility EUR 150 150 26-Nov-16 10,998 1% 1,553 7.1x
Mylan NV UK Healthcare Bond USD 500 369 29-Nov-16 6,552 6% 2,578 2.5x
Travelport Worldwide Limited UK Technology Term Loan USD 234 172 01-Dec-16 2,136 8% 376 5.7x
Piaggio & C s.p.a. Italy Automotive Bond EUR 143 143 01-Dec-16 829 17% 135 6.1x
Ladbrokes Plc UK Leisure Bank Debt GBP 199 246 01-Dec-16 451 55% 170 2.7x
Buzzi Unicem SpA Italy Construction Bond EUR 350 350 09-Dec-16 1,527 23% 481 3.2x
Expro International Group Ltd UK Oil & Gas Bond USD 956 706 15-Dec-16 2,295 31% -51 -45.4x
Faurecia SA France Automotive Bond EUR 490 490 15-Dec-16 1,885 26% 1,199 1.6x
The Remy Cointreau Group France Food Bond EUR 198 198 15-Dec-16 505 39% 197 2.6x
United Biscuits Limited
UK Packaged food Perpetual/Hybrid
Security
GBP 221 255 15-Dec-16 1,238 21% 243
5.1x
Transocean Ltd. Switzerland Oil & Gas Bond USD 999 920 15-Dec-16 7,422 12% 2,207 3.4x
Rexel SA France Distribution A/R Facility EUR 357 357 16-Dec-16 2,944 12% 658 4.5x
Center Parcs UK UK Leisure Bond GBP 300 373 01-Jan-17 1,216 31% 173 7.0x
Center Parcs UK UK Leisure Bond GBP 440 547 01-Jan-17 1,216 45% 173 7.0x
ITV Plc UK Broadcasting Bond GBP 166 193 05-Jan-17 841 23% 1,143 0.7x
Tesco Plc UK Retail Bond USD 500 451 05-Jan-17 17,170 3% 2,552 6.7x
UPM-Kymmene Oyj Finland Paper and Packaging Bond GBP 250 346 23-Jan-17 3,025 11% 1,276 2.4x
Clariant AG Switzerland Chemicals Bond EUR 500 487 24-Jan-17 2,072 24% 697 3.0x
Heathrow Airport Holdings Ltd. UK Transportation Bond GBP 584 700 25-Jan-17 16,947 4% 2,026 8.4x
Seat Pagine Gialle S.p.A Italy Media & Communications Bond EUR 793 793 31-Jan-17 1,177 67% 26 44.8x
HeidelbergCement AG Germany Construction Bond EUR 1,051 1051 31-Jan-17 7,977 13% 2,339 3.4x
Stena AB Sweden Transportation Bond EUR 300 300 01-Feb-17 6,108 5% 992 6.2x
Manchester United Plc UK Entertainment Bond USD 171 205 01-Feb-17 582 35% 221 2.6x
Kerling plc UK Manufacturing Bond EUR 785 785 01-Feb-17 999 79% 0 na
Rallye SA France Retail Bond EUR 855 855 01-Feb-17 15,756 5% 1,973 8.0x
Abengoa, S.A. Spain Technology Convertible Bond EUR 210 210 03-Feb-17 10,090 2% 242 41.6x

DEBT MATURITY PIPELINE – 6 TO 12 MONTHS (FACILITIES >EUR 100M)
11
Source: Debtwire, CapitalIQ, Company Reports
Company Country Sector Debt Instrument Cur. Out (m) Out
(EUR m) Maturity
Total
Debt
(EURm)
% of Total
Debt
EBITDA
(EURm)
Debt/
EBITDA
Heathrow Airport Holdings Ltd. UK Transportation Bond GBP 272 326 08-Feb-17 16,947 2% 2,026 8.4x
Eco-Bat Technologies plc UK Production Bond EUR 300 296 15-Feb-17 1,569 19% 63 24.9x
Repsol SA Spain Oil & Gas Bond EUR 886 886 16-Feb-17 19,219 5% 2,377 8.1x
ArcelorMittal SA Luxembourg Steel Bond USD 1,394 1023 25-Feb-17 17,730 6% 2,597 6.8x
ThyssenKrupp AG Germany Manufacturing Bond EUR 1,245 1245 28-Feb-17 8,361 15% 2,171 3.9x
British Car Auctions Limited UK Automotive Retail Bank Debt GBP 96 113 28-Feb-17 391 29% 95 4.1x
Heathrow Airport Holdings Ltd. UK Transportation Bond GBP 325 390 01-Mar-17 16,947 2% 2,026 8.4x
NXP Semiconductors N.V. Netherlands Semiconductors Rev. Credit Facility EUR 363 361 01-Mar-17 7,926 5% 1,602 4.9x
NXP Semiconductors N.V. Netherlands Semiconductors Term Loan USD 400 289 04-Mar-17 7,926 4% 1,602 4.9x
Ladbrokes Plc UK Leisure Bond GBP 223 267 05-Mar-17 451 59% 170 2.7x
Brakes Group UK Food Term Loan GBP 336 405 12-Mar-17 1,250 32% 215 5.8x
Serco Group Plc UK Facilities Management Rev. Credit Facility GBP 170 202 15-Mar-17 578 35% 147 3.9x
Moto Hospitality Ltd UK Services Bond GBP 173 217 15-Mar-17 695 31% 130 5.3x
Alcatel-Lucent SA France Telecommunication Convertible Bond USD 931 701 15-Mar-17 5,265 13% 1,326 4.0x
Sanoma Oyj Finland Publishing Bond EUR 399 399 20-Mar-17 902 44% 327 2.8x
Continental Aktiengesellschaft Germany Auto Parts & Equipment Bond EUR 743 743 20-Mar-17 4,878 15% 6,077 0.8x
Fiat Chrysler Automobiles N.V. UK Automotive Bond EUR 850 850 23-Mar-17 26,555 3% 7,832 3.4x
Fiat S.p.A Italy Automotive Bond EUR 850 850 23-Mar-17 26,555 3% 7,832 3.4x
Fiat Chrysler Automobiles N.V. UK Automotive TLB Credit Facility EUR 2,587 2587 24-Mar-17 26,555 10% 7,832 3.4x
SNAI S.p.a. Italy Gambling TLA Credit Facility EUR 104 104 29-Mar-17 590 18% 80 7.4x
IVG Immobilien AG Germany Real Estate Convertible Bond EUR 381 381 29-Mar-17 2,723 14% 398 6.8x
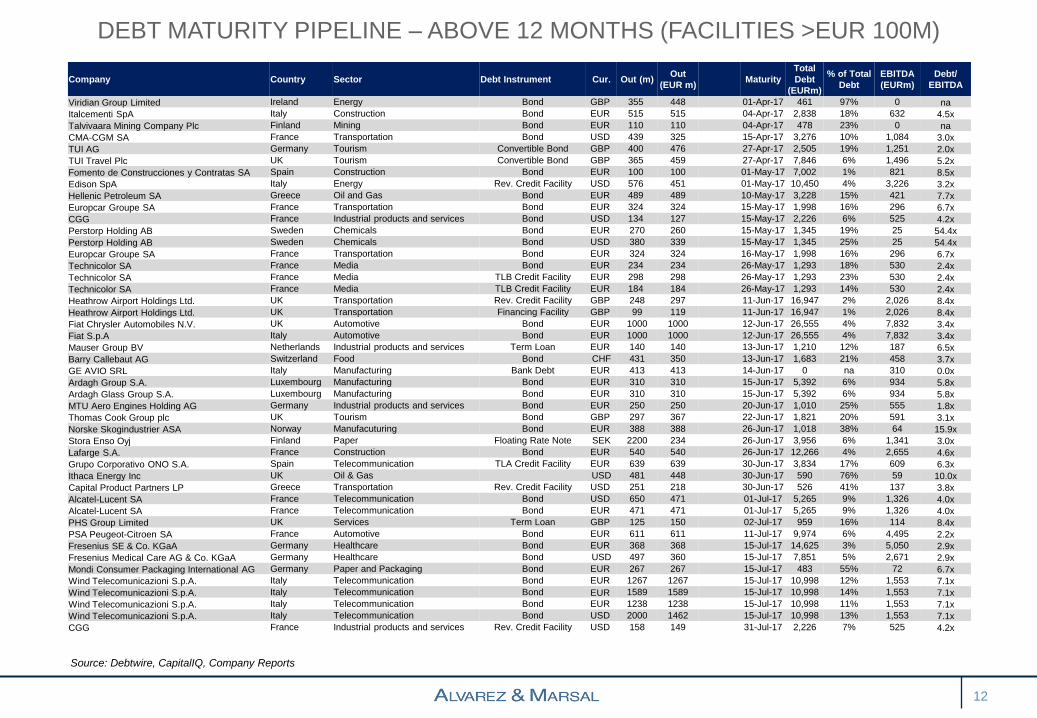
DEBT MATURITY PIPELINE – ABOVE 12 MONTHS (FACILITIES >EUR 100M)
12
Source: Debtwire, CapitalIQ, Company Reports
Company Country Sector Debt Instrument Cur. Out (m) Out
(EUR m) Maturity
Total
Debt
(EURm)
% of Total
Debt
EBITDA
(EURm)
Debt/
EBITDA
Viridian Group Limited Ireland Energy Bond GBP 355 448 01-Apr-17 461 97% 0 na
Italcementi SpA Italy Construction Bond EUR 515 515 04-Apr-17 2,838 18% 632 4.5x
Talvivaara Mining Company Plc Finland Mining Bond EUR 110 110 04-Apr-17 478 23% 0 na
CMA-CGM SA France Transportation Bond USD 439 325 15-Apr-17 3,276 10% 1,084 3.0x
TUI AG Germany Tourism Convertible Bond GBP 400 476 27-Apr-17 2,505 19% 1,251 2.0x
TUI Travel Plc UK Tourism Convertible Bond GBP 365 459 27-Apr-17 7,846 6% 1,496 5.2x
Fomento de Construcciones y Contratas SA Spain Construction Bond EUR 100 100 01-May-17 7,002 1% 821 8.5x
Edison SpA Italy Energy Rev. Credit Facility USD 576 451 01-May-17 10,450 4% 3,226 3.2x
Hellenic Petroleum SA Greece Oil and Gas Bond EUR 489 489 10-May-17 3,228 15% 421 7.7x
Europcar Groupe SA France Transportation Bond EUR 324 324 15-May-17 1,998 16% 296 6.7x
CGG France Industrial products and services Bond USD 134 127 15-May-17 2,226 6% 525 4.2x
Perstorp Holding AB Sweden Chemicals Bond EUR 270 260 15-May-17 1,345 19% 25 54.4x
Perstorp Holding AB Sweden Chemicals Bond USD 380 339 15-May-17 1,345 25% 25 54.4x
Europcar Groupe SA France Transportation Bond EUR 324 324 16-May-17 1,998 16% 296 6.7x
Technicolor SA France Media Bond EUR 234 234 26-May-17 1,293 18% 530 2.4x
Technicolor SA France Media TLB Credit Facility EUR 298 298 26-May-17 1,293 23% 530 2.4x
Technicolor SA France Media TLB Credit Facility EUR 184 184 26-May-17 1,293 14% 530 2.4x
Heathrow Airport Holdings Ltd. UK Transportation Rev. Credit Facility GBP 248 297 11-Jun-17 16,947 2% 2,026 8.4x
Heathrow Airport Holdings Ltd. UK Transportation Financing Facility GBP 99 119 11-Jun-17 16,947 1% 2,026 8.4x
Fiat Chrysler Automobiles N.V. UK Automotive Bond EUR 1000 1000 12-Jun-17 26,555 4% 7,832 3.4x
Fiat S.p.A Italy Automotive Bond EUR 1000 1000 12-Jun-17 26,555 4% 7,832 3.4x
Mauser Group BV Netherlands Industrial products and services Term Loan EUR 140 140 13-Jun-17 1,210 12% 187 6.5x
Barry Callebaut AG Switzerland Food Bond CHF 431 350 13-Jun-17 1,683 21% 458 3.7x
GE AVIO SRL Italy Manufacturing Bank Debt EUR 413 413 14-Jun-17 0 na 310 0.0x
Ardagh Group S.A. Luxembourg Manufacturing Bond EUR 310 310 15-Jun-17 5,392 6% 934 5.8x
Ardagh Glass Group S.A. Luxembourg Manufacturing Bond EUR 310 310 15-Jun-17 5,392 6% 934 5.8x
MTU Aero Engines Holding AG Germany Industrial products and services Bond EUR 250 250 20-Jun-17 1,010 25% 555 1.8x
Thomas Cook Group plc UK Tourism Bond GBP 297 367 22-Jun-17 1,821 20% 591 3.1x
Norske Skogindustrier ASA Norway Manufacuturing Bond EUR 388 388 26-Jun-17 1,018 38% 64 15.9x
Stora Enso Oyj Finland Paper Floating Rate Note SEK 2200 234 26-Jun-17 3,956 6% 1,341 3.0x
Lafarge S.A. France Construction Bond EUR 540 540 26-Jun-17 12,266 4% 2,655 4.6x
Grupo Corporativo ONO S.A. Spain Telecommunication TLA Credit Facility EUR 639 639 30-Jun-17 3,834 17% 609 6.3x
Ithaca Energy Inc UK Oil & Gas USD 481 448 30-Jun-17 590 76% 59 10.0x
Capital Product Partners LP Greece Transportation Rev. Credit Facility USD 251 218 30-Jun-17 526 41% 137 3.8x
Alcatel-Lucent SA France Telecommunication Bond USD 650 471 01-Jul-17 5,265 9% 1,326 4.0x
Alcatel-Lucent SA France Telecommunication Bond EUR 471 471 01-Jul-17 5,265 9% 1,326 4.0x
PHS Group Limited UK Services Term Loan GBP 125 150 02-Jul-17 959 16% 114 8.4x
PSA Peugeot-Citroen SA France Automotive Bond EUR 611 611 11-Jul-17 9,974 6% 4,495 2.2x
Fresenius SE & Co. KGaA Germany Healthcare Bond EUR 368 368 15-Jul-17 14,625 3% 5,050 2.9x
Fresenius Medical Care AG & Co. KGaA Germany Healthcare Bond USD 497 360 15-Jul-17 7,851 5% 2,671 2.9x
Mondi Consumer Packaging International AG Germany Paper and Packaging Bond EUR 267 267 15-Jul-17 483 55% 72 6.7x
Wind Telecomunicazioni S.p.A. Italy Telecommunication Bond EUR 1267 1267 15-Jul-17 10,998 12% 1,553 7.1x
Wind Telecomunicazioni S.p.A. Italy Telecommunication Bond EUR 1589 1589 15-Jul-17 10,998 14% 1,553 7.1x
Wind Telecomunicazioni S.p.A. Italy Telecommunication Bond EUR 1238 1238 15-Jul-17 10,998 11% 1,553 7.1x
Wind Telecomunicazioni S.p.A. Italy Telecommunication Bond USD 2000 1462 15-Jul-17 10,998 13% 1,553 7.1x
CGG France Industrial products and services Rev. Credit Facility USD 158 149 31-Jul-17 2,226 7% 525 4.2x
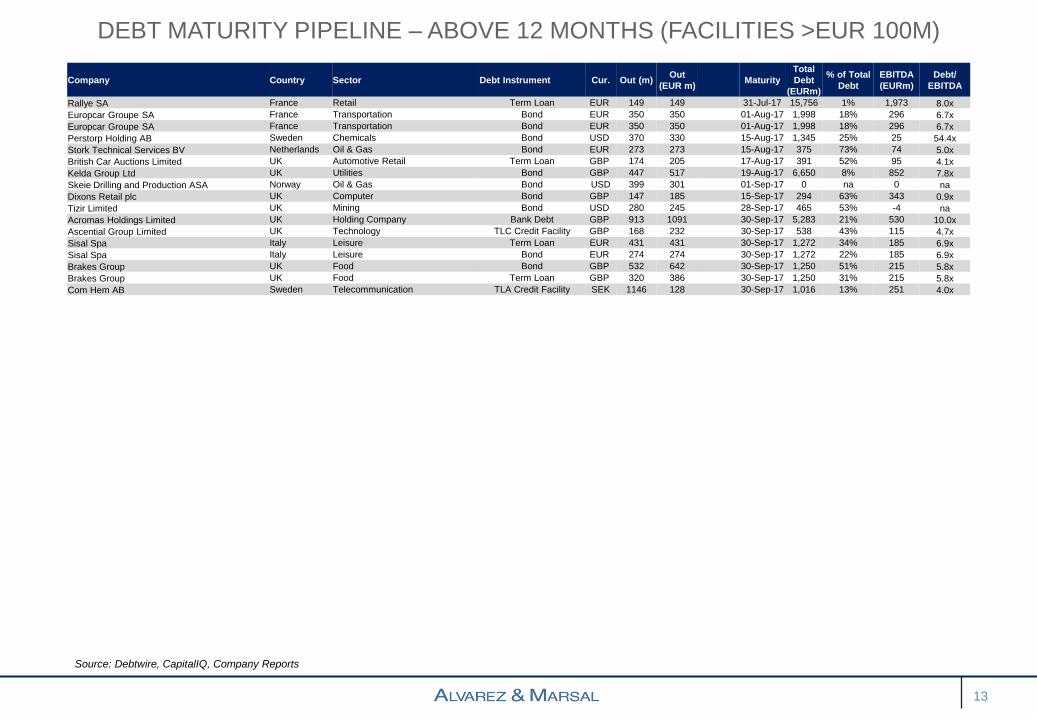
DEBT MATURITY PIPELINE – ABOVE 12 MONTHS (FACILITIES >EUR 100M)
13
Source: Debtwire, CapitalIQ, Company Reports
Company Country Sector Debt Instrument Cur. Out (m) Out
(EUR m) Maturity
Total
Debt
(EURm)
% of Total
Debt
EBITDA
(EURm)
Debt/
EBITDA
Rallye SA France Retail Term Loan EUR 149 149 31-Jul-17 15,756 1% 1,973 8.0x
Europcar Groupe SA France Transportation Bond EUR 350 350 01-Aug-17 1,998 18% 296 6.7x
Europcar Groupe SA France Transportation Bond EUR 350 350 01-Aug-17 1,998 18% 296 6.7x
Perstorp Holding AB Sweden Chemicals Bond USD 370 330 15-Aug-17 1,345 25% 25 54.4x
Stork Technical Services BV Netherlands Oil & Gas Bond EUR 273 273 15-Aug-17 375 73% 74 5.0x
British Car Auctions Limited UK Automotive Retail Term Loan GBP 174 205 17-Aug-17 391 52% 95 4.1x
Kelda Group Ltd UK Utilities Bond GBP 447 517 19-Aug-17 6,650 8% 852 7.8x
Skeie Drilling and Production ASA Norway Oil & Gas Bond USD 399 301 01-Sep-17 0 na 0 na
Dixons Retail plc UK Computer Bond GBP 147 185 15-Sep-17 294 63% 343 0.9x
Tizir Limited UK Mining Bond USD 280 245 28-Sep-17 465 53% -4 na
Acromas Holdings Limited UK Holding Company Bank Debt GBP 913 1091 30-Sep-17 5,283 21% 530 10.0x
Ascential Group Limited UK Technology TLC Credit Facility GBP 168 232 30-Sep-17 538 43% 115 4.7x
Sisal Spa Italy Leisure Term Loan EUR 431 431 30-Sep-17 1,272 34% 185 6.9x
Sisal Spa Italy Leisure Bond EUR 274 274 30-Sep-17 1,272 22% 185 6.9x
Brakes Group UK Food Bond GBP 532 642 30-Sep-17 1,250 51% 215 5.8x
Brakes Group UK Food Term Loan GBP 320 386 30-Sep-17 1,250 31% 215 5.8x
Com Hem AB Sweden Telecommunication TLA Credit Facility SEK 1146 128 30-Sep-17 1,016 13% 251 4.0x
Company

DEFAULT RATE
14
According to S&P, in 1Q’16 downgrades exceeded upgrades with 50 downgrades and 20 upgrades
across the spectrum. The majority (14) of downgrades were in oil and gas
European High Yield Default Rate European Industry Rating Actions by #
Source: AFME, S&P, Moody’s, Fitch
Total Debt to EBITDA
0.0%
0.5%
1.0%
1.5%
2.0%
2.5%
3.0%
3.5%
4.0%
Sep-1
2
De
c-1
2
Ma
r-1
3
Jun-1
3
Sep-1
3
De
c-1
3
Ma
r-1
4
Jun-1
4
Sep-1
4
De
c-1
4
Ma
r-1
5
Jun-1
5
Sep-1
5
De
c-1
5
Ma
r-1
6
-
1.0
2.0
3.0
4.0
5.0
6.0
7.0
2006 2007 2008 2009 2010 2011 2012 2013 2014 2015 Q1'16
0 5 10 15
Oil & Gas
Metals, Mining & Steel
Bank
Media & Entertainment
Consumer Products
Transportation
Capital Goods
Healthcare
Retail/Restaurants
Telecommunications
Chemicals, Packaging and Envir
Sovereign
Utilities
Insurance
Automotive
Diversified
Forest Products
High Technology
Finance Companies
Upgrades Downgrades
LIST OF
DISTRESSED CREDITS
15
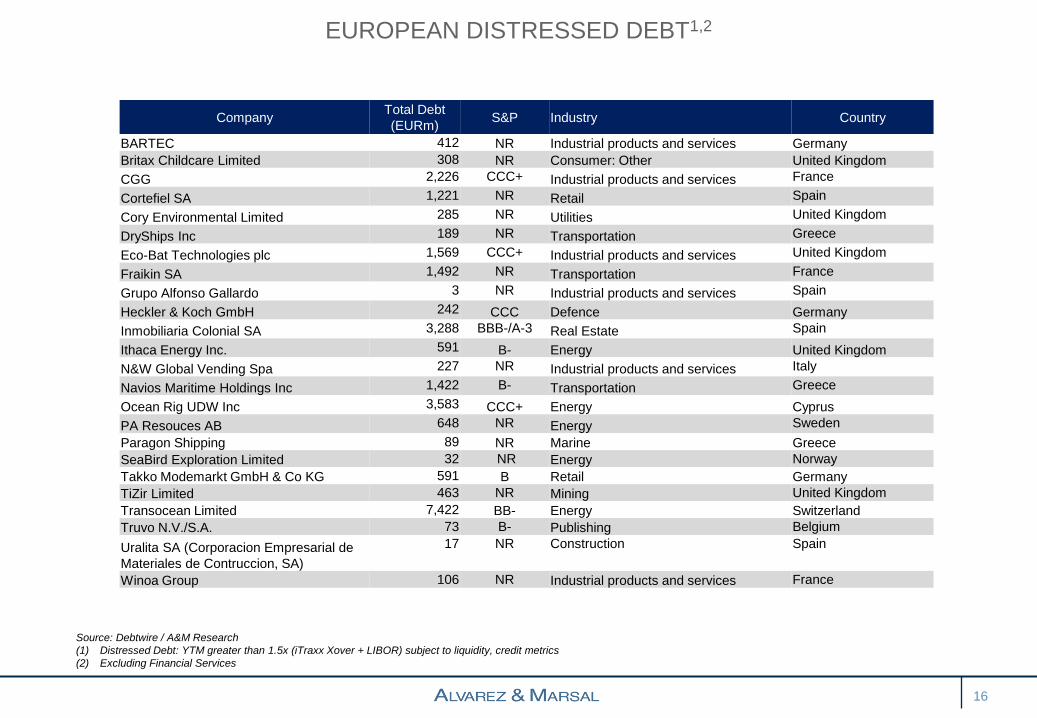
EUROPEAN DISTRESSED DEBT1,2
Source: Debtwire / A&M Research
(1) Distressed Debt: YTM greater than 1.5x (iTraxx Xover + LIBOR) subject to liquidity, credit metrics
(2) Excluding Financial Services
16
Company Total Debt
(EURm) S&P Industry Country
BARTEC 412 NR Industrial products and services Germany
Britax Childcare Limited 308 NR Consumer: Other United Kingdom
CGG 2,226 CCC+ Industrial products and services France
Cortefiel SA 1,221 NR Retail Spain
Cory Environmental Limited 285 NR Utilities United Kingdom
DryShips Inc 189 NR Transportation Greece
Eco-Bat Technologies plc 1,569 CCC+ Industrial products and services United Kingdom
Fraikin SA 1,492 NR Transportation France
Grupo Alfonso Gallardo 3 NR Industrial products and services Spain
Heckler & Koch GmbH 242 CCC Defence Germany
Inmobiliaria Colonial SA 3,288 BBB-/A-3 Real Estate Spain
Ithaca Energy Inc. 591 B- Energy United Kingdom
N&W Global Vending Spa 227 NR Industrial products and services Italy
Navios Maritime Holdings Inc 1,422 B- Transportation Greece
Ocean Rig UDW Inc 3,583 CCC+ Energy Cyprus
PA Resouces AB 648 NR Energy Sweden
Paragon Shipping 89 NR Marine Greece
SeaBird Exploration Limited 32 NR Energy Norway
Takko Modemarkt GmbH & Co KG 591 B Retail Germany
TiZir Limited 463 NR Mining United Kingdom
Transocean Limited 7,422 BB- Energy Switzerland
Truvo N.V./S.A. 73 B- Publishing Belgium
Uralita SA (Corporacion Empresarial de
Materiales de Contruccion, SA)
17 NR Construction Spain
Winoa Group 106 NR Industrial products and services France
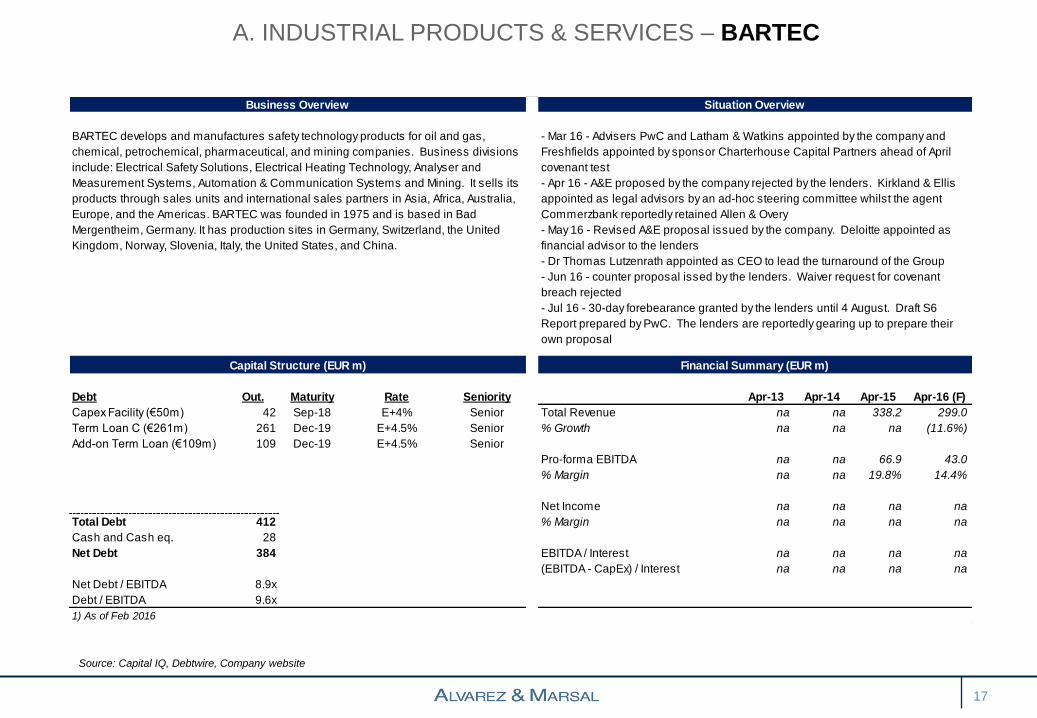
A. INDUSTRIAL PRODUCTS & SERVICES – BARTEC
Source: Capital IQ, Debtwire, Company website
17
Business Overview Situation Overview
Capital Structure (EUR m) Financial Summary (EUR m)
Debt Out. Maturity Rate Seniority Apr-13 Apr-14 Apr-15 Apr-16 (F)
Capex Facility (€50m) 42 Sep-18 E+4% Senior Total Revenue na na 338.2 299.0
Term Loan C (€261m) 261 Dec-19 E+4.5% Senior % Growth na na na (11.6%)
Add-on Term Loan (€109m) 109 Dec-19 E+4.5% Senior
Pro-forma EBITDA na na 66.9 43.0
% Margin na na 19.8% 14.4%
Net Income na na na na
Total Debt 412 % Margin na na na na
Cash and Cash eq. 28
Net Debt 384 EBITDA / Interest na na na na
(EBITDA - CapEx) / Interest na na na na
Net Debt / EBITDA 8.9x
Debt / EBITDA 9.6x
1) As of Feb 2016
BARTEC develops and manufactures safety technology products for oil and gas,
chemical, petrochemical, pharmaceutical, and mining companies. Business divisions
include: Electrical Safety Solutions, Electrical Heating Technology, Analyser and
Measurement Systems, Automation & Communication Systems and Mining. It sells its
products through sales units and international sales partners in Asia, Africa, Australia,
Europe, and the Americas. BARTEC was founded in 1975 and is based in Bad
Mergentheim, Germany. It has production sites in Germany, Switzerland, the United
Kingdom, Norway, Slovenia, Italy, the United States, and China.
- Mar 16 - Advisers PwC and Latham & Watkins appointed by the company and
Freshfields appointed by sponsor Charterhouse Capital Partners ahead of April
covenant test
- Apr 16 - A&E proposed by the company rejected by the lenders. Kirkland & Ellis
appointed as legal advisors by an ad-hoc steering committee whilst the agent
Commerzbank reportedly retained Allen & Overy
- May 16 - Revised A&E proposal issued by the company. Deloitte appointed as
financial advisor to the lenders
- Dr Thomas Lutzenrath appointed as CEO to lead the turnaround of the Group
- Jun 16 - counter proposal issed by the lenders. Waiver request for covenant
breach rejected
- Jul 16 - 30-day forebearance granted by the lenders until 4 August. Draft S6
Report prepared by PwC. The lenders are reportedly gearing up to prepare their
own proposal
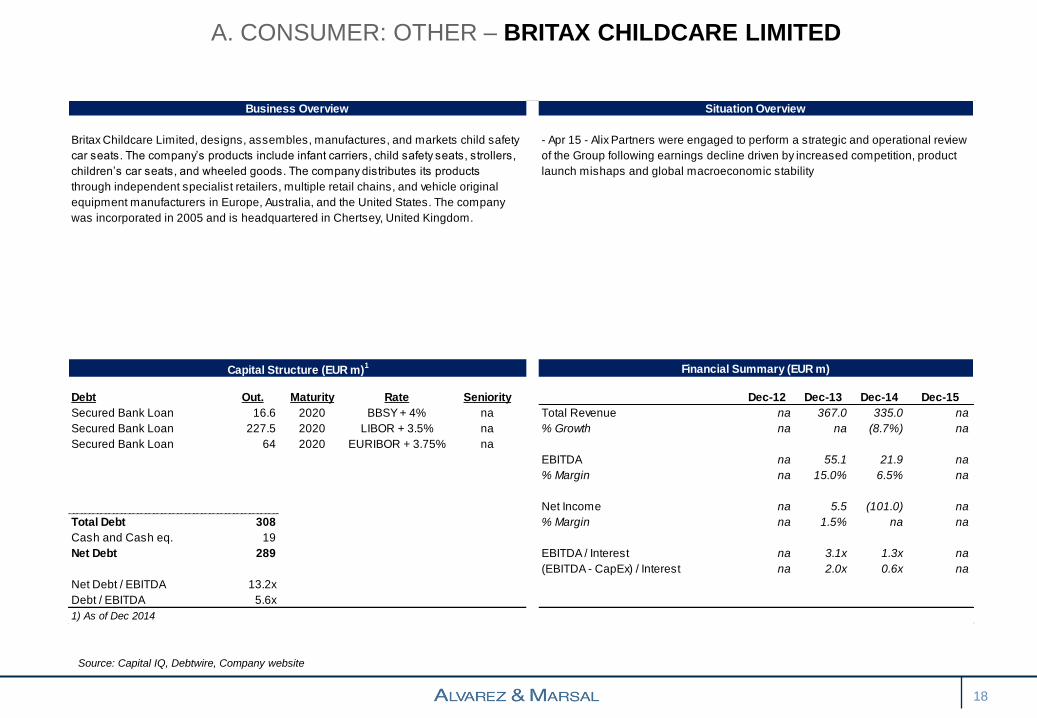
A. CONSUMER: OTHER – BRITAX CHILDCARE LIMITED
Source: Capital IQ, Debtwire, Company website
18
Business Overview Situation Overview
Capital Structure (EUR m)1 Financial Summary (EUR m)
Debt Out. Maturity Rate Seniority Dec-12 Dec-13 Dec-14 Dec-15
Secured Bank Loan 16.6 2020 BBSY + 4% na Total Revenue na 367.0 335.0 na
Secured Bank Loan 227.5 2020 LIBOR + 3.5% na % Growth na na (8.7%) na
Secured Bank Loan 64 2020 EURIBOR + 3.75% na
EBITDA na 55.1 21.9 na
% Margin na 15.0% 6.5% na
Net Income na 5.5 (101.0) na
Total Debt 308 % Margin na 1.5% na na
Cash and Cash eq. 19
Net Debt 289 EBITDA / Interest na 3.1x 1.3x na
(EBITDA - CapEx) / Interest na 2.0x 0.6x na
Net Debt / EBITDA 13.2x
Debt / EBITDA 5.6x
1) As of Dec 2014
Britax Childcare Limited, designs, assembles, manufactures, and markets child safety
car seats. The company’s products include infant carriers, child safety seats, strollers,
children’s car seats, and wheeled goods. The company distributes its products
through independent specialist retailers, multiple retail chains, and vehicle original
equipment manufacturers in Europe, Australia, and the United States. The company
was incorporated in 2005 and is headquartered in Chertsey, United Kingdom.
- Apr 15 - Alix Partners were engaged to perform a strategic and operational review
of the Group following earnings decline driven by increased competition, product
launch mishaps and global macroeconomic stability
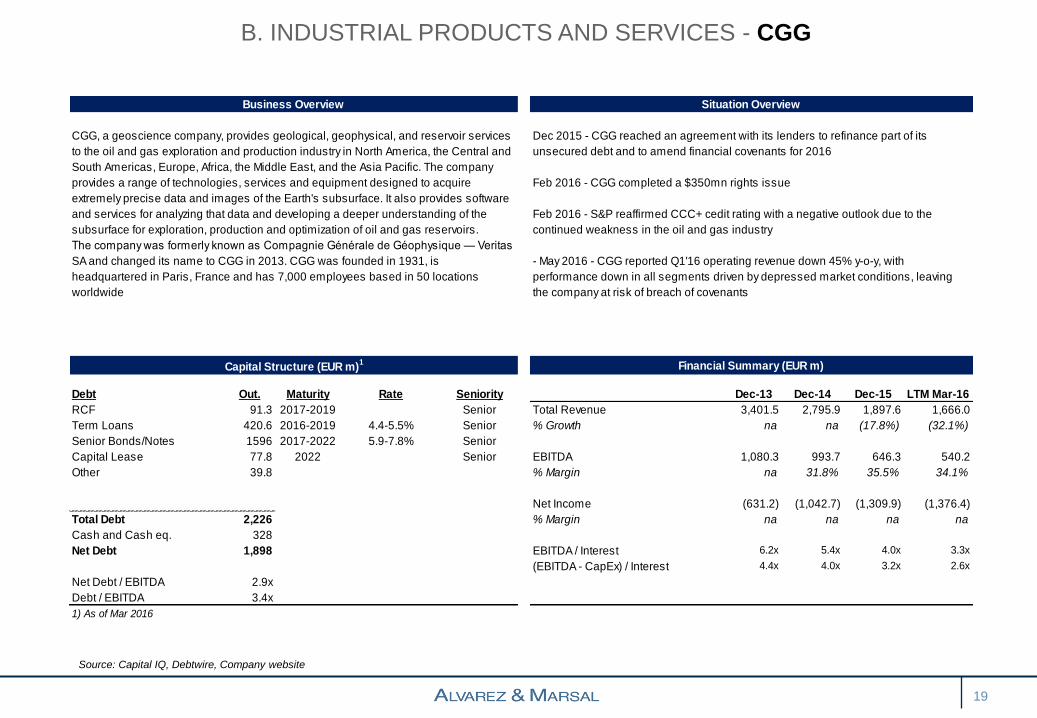
B. INDUSTRIAL PRODUCTS AND SERVICES - CGG
Source: Capital IQ, Debtwire, Company website
19
Business Overview Situation Overview
Capital Structure (EUR m)1 Financial Summary (EUR m)
Debt Out. Maturity Rate Seniority Dec-13 Dec-14 Dec-15 LTM Mar-16
RCF 91.3 2017-2019 Senior Total Revenue 3,401.5 2,795.9 1,897.6 1,666.0
Term Loans 420.6 2016-2019 4.4-5.5% Senior % Growth na na (17.8%) (32.1%)
Senior Bonds/Notes 1596 2017-2022 5.9-7.8% Senior
Capital Lease 77.8 2022 Senior EBITDA 1,080.3 993.7 646.3 540.2
Other 39.8 % Margin na 31.8% 35.5% 34.1%
Net Income (631.2) (1,042.7) (1,309.9) (1,376.4)
Total Debt 2,226 % Margin na na na na
Cash and Cash eq. 328
Net Debt 1,898 EBITDA / Interest 6.2x 5.4x 4.0x 3.3x
(EBITDA - CapEx) / Interest 4.4x 4.0x 3.2x 2.6x
Net Debt / EBITDA 2.9x
Debt / EBITDA 3.4x
1) As of Mar 2016
CGG, a geoscience company, provides geological, geophysical, and reservoir services
to the oil and gas exploration and production industry in North America, the Central and
South Americas, Europe, Africa, the Middle East, and the Asia Pacific. The company
provides a range of technologies, services and equipment designed to acquire
extremely precise data and images of the Earth's subsurface. It also provides software
and services for analyzing that data and developing a deeper understanding of the
subsurface for exploration, production and optimization of oil and gas reservoirs.
The company was formerly known as Compagnie Générale de Géophysique — Veritas
SA and changed its name to CGG in 2013. CGG was founded in 1931, is
headquartered in Paris, France and has 7,000 employees based in 50 locations
worldwide
Dec 2015 - CGG reached an agreement with its lenders to refinance part of its
unsecured debt and to amend financial covenants for 2016
Feb 2016 - CGG completed a $350mn rights issue
Feb 2016 - S&P reaffirmed CCC+ cedit rating with a negative outlook due to the
continued weakness in the oil and gas industry
- May 2016 - CGG reported Q1'16 operating revenue down 45% y-o-y, with
performance down in all segments driven by depressed market conditions, leaving
the company at risk of breach of covenants
C. RETAIL– CORTEFIEL SA
20
Source: Capital IQ, Debtwire, Company website
Business Overview Situation Overview
Capital Structure (EUR m)1 Financial Summary (EUR m)
Debt Out. Feb-14 Feb-15 Feb-16
Term Loan B1 264.4 Total Revenue 964.2 1,011.1 1,095.0
Term Loan B2 290.6 % Growth na 4.9% 8.3%
Term Loan B3 465.7
RCF 200.0 EBITDA 94.8 98.6 108.3
% Margin 9.8% 9.8% 9.9%
Net Income (12.9) (13.9) na
Total Debt 1,221 % Margin na na na
Cash and Cash eq. na
Net Debt na EBITDA / Interest na na na
(EBITDA - CapEx) / Interest na na na
Net Debt / EBITDA na
Debt / EBITDA 12.4x
1) As of Mar 2014
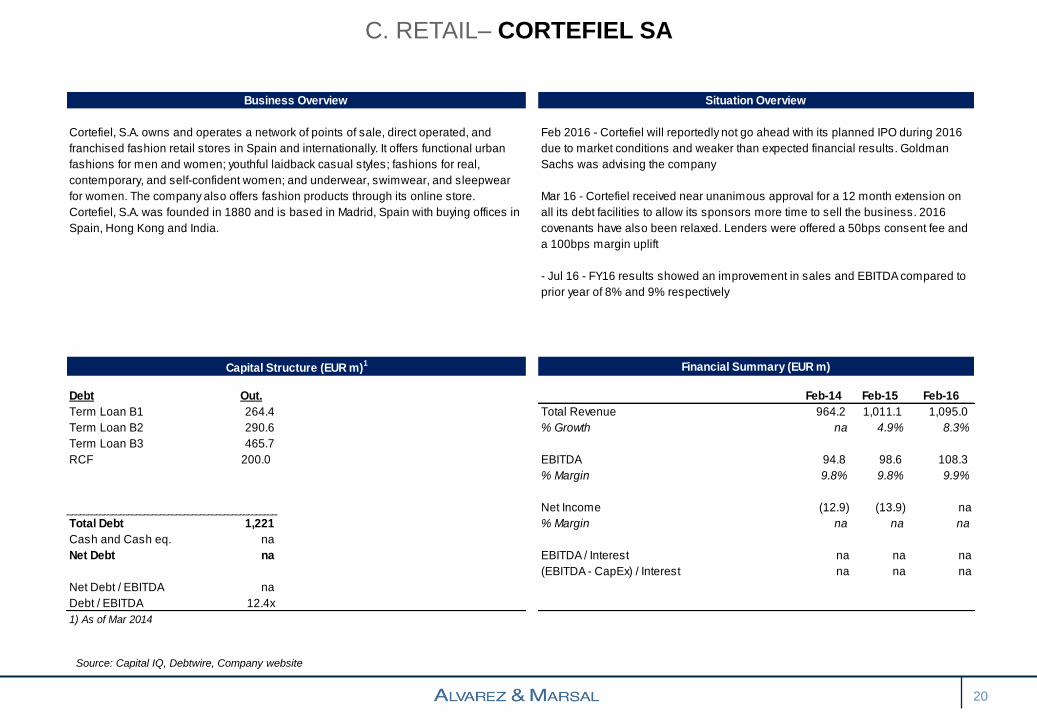
Cortefiel, S.A. owns and operates a network of points of sale, direct operated, and
franchised fashion retail stores in Spain and internationally. It offers functional urban
fashions for men and women; youthful laidback casual styles; fashions for real,
contemporary, and self-confident women; and underwear, swimwear, and sleepwear
for women. The company also offers fashion products through its online store.
Cortefiel, S.A. was founded in 1880 and is based in Madrid, Spain with buying offices in
Spain, Hong Kong and India.
Feb 2016 - Cortefiel will reportedly not go ahead with its planned IPO during 2016
due to market conditions and weaker than expected financial results. Goldman
Sachs was advising the company
Mar 16 - Cortefiel received near unanimous approval for a 12 month extension on
all its debt facilities to allow its sponsors more time to sell the business. 2016
covenants have also been relaxed. Lenders were offered a 50bps consent fee and
a 100bps margin uplift
- Jul 16 - FY16 results showed an improvement in sales and EBITDA compared to
prior year of 8% and 9% respectively

D. UTILITIES – CORY ENVIRONMENTAL LIMITED
Source: Capital IQ, Debtwire, Company website
21
Business Overview Situation Overview
Capital Structure (EUR m)1 Financial Summary (EUR m)
Capital Structure Out. Maturity Floating Rate Seniority Dec-12 Dec-13 Dec-14 Dec-15
Term Loan 200 2019 LIBOR + 3.25% Senior Total Revenue 147.4 132.8 150.7 160.8
Term Loan 85 2019 PIK % Growth na (9.9%) 13.5% 6.7%
LOC 0 LIBOR + 2%
RCF 0 LIBOR + 2% EBITDA 18.7 11.3 8.2 11.8
% Margin 12.7% 8.5% 5.4% 7.3%
Net Income 10.6 6.4 4.0 0.6
Total Debt 285 % Margin 7.2% 4.8% 2.7% 0.4%
Cash and Cash eq. na
Net Debt na EBITDA / Interest na na na na
(EBITDA - CapEx) / Interest na na na na
Net Debt / EBITDA na
Debt / EBITDA na
1) As of Dec 2015
Cory Environmental Limited operates as a recycling, waste management, and energy
recovery company in the United Kingdom. It collects, recycles, and disposes waste, as
well as municipal cleaning. The company was formerly known as William Cory and
Son Ltd and changed its name to Cory Environmental Limited in 1990. The company
was founded in 1896 and is based in London, United Kingdom. Cory Environmental
Limited operates as a subsidiary of Cory Environmental Management Ltd.
- Aug 15 - senior lenders took control of the Group through a financial restructuring
delivered via a Scheme of Arrangement. Obligations of £358M were released in
exchange for a new £200M senior debt facility and a £85M junior facility both
maturing in December 2019. Under the restructuring, shares in a parent company
were sold to a new structure owned by the senior creditors. In addition, the Group
secured a £75M revolving LOC and a £30M RCF. Cory Environmental Ltd is
guarantor to the new facilities
- Jun 16 - Following a strategic review conducted by the Board, the Group sold its
collection business to Biffa Waste Services for EV of GBP 23M

E. TRANSPORTATION – DRYSHIPS INC.
Source: Capital IQ, Debtwire, Company website
22
Business Overview Situation Overview
Capital Structure (EUR m)1 Financial Summary (EUR m)
Debt Out. Maturity Rate Seniority Dec-13 Dec-14 Dec-15 LTM Mar-16
RCF 49.8 na na na Total Revenue 1083.4 1805.6 893.0 429.9
Term Loans 187.3 na na na % Growth na 66.7% (50.5%) (51.9%)
Other (48.5)
EBITDA 440.4 857.4 397.2 161.5
% Margin 40.6% 47.5% 44.5% 37.6%
Net Income (162.0) (39.3) (2,621.4) (2,541.7)
Total Debt 189 % Margin na na na na
Cash and Cash eq. 0
Net Debt 189 EBITDA / Interest 2.3x 2.6x 2.4x 1.9x
(EBITDA - CapEx) / Interest na 0.6x na 1.7
Net Debt / EBITDA 1.2x
Debt / EBITDA 1.2x
1) As of Mar 2016
DryShips Inc. provides ocean transportation services for drybulk and petroleum
cargoes, and offshore deepwater drilling services. The company operates through the
Drybulk, Tanker, and Drilling segments. The Drybulk segment provides drybulk
commodities transportation services for the steel, electric utility, construction, and agri-
food industries. The Drilling segment offers ultra deep water drilling services. The
Tanker segment provides transportation services of crude and refined petroleum
cargoes. As of February 25, 2015, it owned a fleet of 39 drybulk carriers comprising 13
Capesize, 24 Panamax, and 2 Supramax carriers with a combined deadweight
tonnage of approximately 4.3 million tons; 10 tankers, including 4 Suezmax and 6
Aframax tankers with a combined deadweight tonnage of approximately 1.3 million
tons; and 13 offshore ultra deepwater drilling units comprising 2 ultra deepwater
semisubmersible drilling rigs and 11 ultra deepwater drillships. The company was
founded in 2004 and is based in Athens, Greece.
- Feb 16 - The company announced that it is in discussions with its lenders to
restructure its debts in light of the continued depressed outlook for freight rates. It
may elect to suspend principal payments to preserve liquidty
Mar 16 - Dryships announced that it had not made the final balloon installments on
three bank faciliites that had matured and that it would suspend all future principal
payments to preserve liquidity
- Jun 16 - Dryships defaulted on its debt and is in discussions with lenders about
a restructuring

F. INDUSTRIAL PRODUCTS AND SERVICES – ECO-BAT TECHNOLOGIES
23
Source: Capital IQ, Debtwire, Company website
Business Overview Situation Overview
Capital Structure (GBP m)1 Financial Summary (GBP m)
Capital Structure Out. Maturity Rate Seniority Dec-13 Dec-14 Dec-15 LTM Mar-16
Senior Secured Debt 130 Sep-16/Oct-20 Sr Sec Total Revenue 1,621.3 1,498.3 1,464.5 1,477.0
Notes 238 Feb-17 7.75% Sr Unsec % Growth na (7.6%) (2.3%) 0.9%
Holdco PIK Notes 1,200 Mar-17 11.00%
Other 1 EBITDA 91.0 69.0 73.0 83.0
% Margin 5.6% 4.6% 5.0% 5.6%
Total Debt 1,569
Cash and Cash eq. 419 EBITDA / Interest 4.2x 3.2x 3.8x 3.8x
Net Debt 1,150 (EBITDA - CapEx) / Interest 2.0x 0.8x 1.3x 1.9x
Net Debt / EBITDA 13.9x
Debt / EBITDA 18.9x
1) As of Dec 2015
Eco-Bat Technologies, through its subsidiaries, engages in the production and
sale of recycled and primary lead. It is also involved in financing and mineral
extraction activities, as well as operates as an importer, stockist, and distributor
of batteries for the auto, leisure, marine, and electric vehicle sectors. Eco-Bat
Technologies Limited offers its products to automotive and industrial lead-acid
battery manufacturers, chemical producers, and lead fabricators. It has
operations in the United States, Germany, the United Kingdom, France, Italy,
Austria, and South Africa. The company is headquartered in Matlock, United
Kingdom. Eco-Bat Technologies Limited is a subsidiary of EB Holdings, Inc.
- Dec 15 - hedge funds (Goldentree, Castle Hill, Centerbridge and Fortress)
holding the HoldCo PIK Notes appointed Houlihan Lokey as financial adviser and
Quinn Emmanuel and Schulte Roth & Zabel as legal advisers
- Feb 16 - Eco-Bat downgraded to B2 with a negative outlook by Moodys
- Mar 16 - S&P revised its outlook from stable to negative on the expectation that
Eco-Bat's parent will default on the PIK notes which will lead to a restructuring that
may negatively affect the company
- Jul 16 - 98% of claimants on the Holdco PIK loan due in 2017 voted in favour of
unwinding the structure. The notes are expected to be exchanged for a pro-rata
participation rights in the PIK loan issued by EB Holdings II
G. TRANSPORTATION – FRAIKIN SA
24
Source: Capital IQ, Debtwire, Company website
Business Overview Situation Overview
Capital Structure (EUR m)1 Financial Summary (EUR m)
Capital Structure Out. Maturity Floating Rate Seniority Dec-12 Dec-13 Dec-14 LTM Aug-15
Securitisation 900 Dec-18 E + 2.25% Total Revenue 671.0 653.0 643.0 651.0
OpCo Bond 76 Mar-17 5% % Growth na (2.7%) (1.5%) 1.2%
Bilateral Leasing Agreements108
Senior HoldCo 334 Mar-17 4% EBITDA 337.0 326.0 322.0 322.0
Mezzanine 59 Sep-17 4% % Margin 50.2% 49.9% 50.1% 49.5%
Accrued interest 15
Total Debt 1,492
Cash and Cash eq. 100
Net Debt 1,392
EBITDA / Interest 3.6x 5.6x 5.4x 5.6x
Net Debt / EBITDA 4.3x (EBITDA - CapEx) / Interest na na na na
Debt / EBITDA 4.6x
1) As of Aug 2015
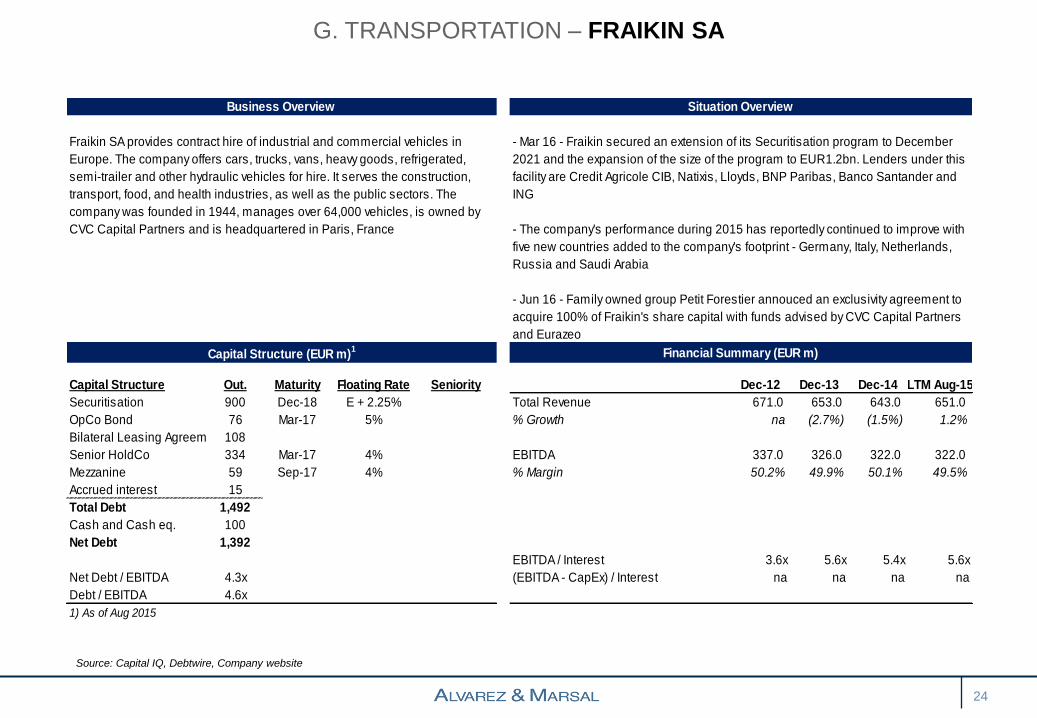
Fraikin SA provides contract hire of industrial and commercial vehicles in
Europe. The company offers cars, trucks, vans, heavy goods, refrigerated,
semi-trailer and other hydraulic vehicles for hire. It serves the construction,
transport, food, and health industries, as well as the public sectors. The
company was founded in 1944, manages over 64,000 vehicles, is owned by
CVC Capital Partners and is headquartered in Paris, France
- Mar 16 - Fraikin secured an extension of its Securitisation program to December
2021 and the expansion of the size of the program to EUR1.2bn. Lenders under this
facility are Credit Agricole CIB, Natixis, Lloyds, BNP Paribas, Banco Santander and
ING
- The company's performance during 2015 has reportedly continued to improve with
five new countries added to the company's footprint - Germany, Italy, Netherlands,
Russia and Saudi Arabia
- Jun 16 - Family owned group Petit Forestier annouced an exclusivity agreement to
acquire 100% of Fraikin's share capital with funds advised by CVC Capital Partners
and Eurazeo

I. DEFENSE – HECKLER & KOCH GMBH
Source: Capital IQ, Debtwire, Company website
25
Business Overview Situation Overview
Capital Structure (EUR m)1 Financial Summary (EUR m)
Debt Out. Maturity Coupon Seniority Dec-13 Dec-14 Dec-15 LTM Mar-16
Notes 242 May-18 9.5% Secured Total Revenue 221.0 155.0 177.0 179.0
EUR30mn RCF 0 Jun-17 Sup Senior % Growth na (29.9%) 14.2% 1.1%
EBITDA 61.6 22.4 30.0 37.0
% Margin 27.9% 14.5% 16.9% 20.7%
Total Debt 242
Cash and Cash eq. 28
Net Debt 214 EBITDA / Interest 2.2x 0.8x 1.0x 1.3x
(EBITDA - CapEx) / Interest 1.8x 0.4x 0.8x 1x
Net Debt / EBITDA 5.8x
Debt / EBITDA 6.5x
1) As of March 2016
Heckler & Koch GmbH manufactures and sells small arms to the security forces,
police, and special forces of the German Federal Armed Forces, and NATO and NATO-
associated states. The company offers military and law enforcement products,
including machine pistols, machine and submachine guns, assault rifles, machine
guns, precision rifles, and 40 mm systems, as well as training systems; and full size,
compact and sport small arms. It also provides military and law enforcement, and sport
products related accessories. The company was formerly known as Heckler & Co. and
changed its name to Heckler & Koch GmbH in December 1949. Heckler & Koch GmbH
was founded in 1948 and is based in Oberndorf am Neckar, Germany.
- Nov 15 - H&K received a EUR60mn cash injection as a repayment of a
shareholder loan to allow the company to make the coupon payment on its
outstanding Notes
- Dec 15 - H&K announced that it had repurchased EUR45mn of its Notes for
EUR40mn. While this reduced its leverage, the outlook for its credit ratings remain
negative because of high leverage and uncertain cashflow generation
- Jan 16 - H&K's Chairman appointed CEO and its main shareholder resigns from
the Board
-Mar 16 - Liquidity includes cash of EUR28mn and an undrawn RCF of EUR30mn
(maturing June 2017)
-Jun 16 - continued uncertainty on sales to non-NATO countries due to delays in
license policy by the German government. Despite this sales to the US remained
strong in 2015 and Q1'16.
J. REAL ESTATE – INMOBILIARIA COLONIAL SA
26
Source: Capital IQ, Debtwire, Company website
Business Overview Situation Overview
Capital Structure (EUR m)1 Financial Summary (EUR m)
Debt Out. Maturity Coupon Seniority Dec-13 Dec-14 Dec-15 Dec-15
Total Revolving Credit 230 2019-2020 E+270bps Senior Total Revenue 238.2 211.9 234.3 245.3
Total Term Loans 341 2019-2022 E+160bps Senior % Growth na (11.0%) 10.6% 4.7%
Total Senior Bonds and Notes 2707 2016-2023 1.9-4.6% Senior
Total Capital Leases 27 Senior EBITDA 181.8 114.2 171.2 178.3
General/Other Borrowings -16 % Margin 76.3% 53.9% 73.1% 72.7%
Net Income (546.9) 492.0 415.4 421.4
Total Debt 3,288 % Margin na 232.2% 177.3% 171.8%
Cash and Cash eq. 218
Net Debt 3,070 EBITDA / Interest 0.9x 0.6x 1.5x 1.6x
(EBITDA - CapEx) / Interest 0.9x 0.6x 1.5x 1.6x
Net Debt / EBITDA 17.2x
Debt / EBITDA 18.4x
1) As of Dec 2015
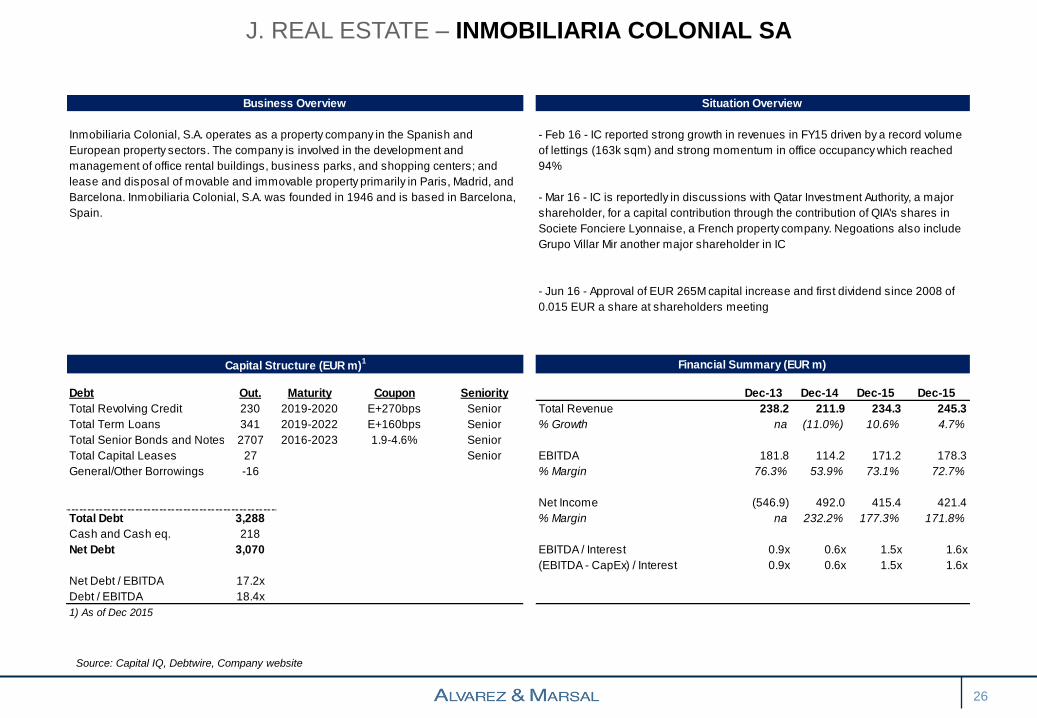
Inmobiliaria Colonial, S.A. operates as a property company in the Spanish and
European property sectors. The company is involved in the development and
management of office rental buildings, business parks, and shopping centers; and
lease and disposal of movable and immovable property primarily in Paris, Madrid, and
Barcelona. Inmobiliaria Colonial, S.A. was founded in 1946 and is based in Barcelona,
Spain.
- Feb 16 - IC reported strong growth in revenues in FY15 driven by a record volume
of lettings (163k sqm) and strong momentum in office occupancy which reached
94%
- Mar 16 - IC is reportedly in discussions with Qatar Investment Authority, a major
shareholder, for a capital contribution through the contribution of QIA's shares in
Societe Fonciere Lyonnaise, a French property company. Negoations also include
Grupo Villar Mir another major shareholder in IC
- Jun 16 - Approval of EUR 265M capital increase and first dividend since 2008 of
0.015 EUR a share at shareholders meeting

K. ENERGY – ITHACA ENERGY INC.
Source: Capital IQ, Debtwire, Company website
27
Business Overview Situation Overview
Capital Structure (EUR m)1 Financial Summary (EUR m)
Debt Out. Maturity Coupon Seniority Dec-13 Dec-14 Dec-15 LTM Mar-16
8.125% Notes 263 Jul-19 8.125% Snr Unsecured Total Revenue 300.6 312.8 190.6 149.1
RBL facility 309 Sep-18 LIBOR + 3.4% Snr secured % Growth na 4.1% (39.1%) (21.8%)
Finance Lease 26 Senior
Adjustments -8 EBITDA 170.3 88.0 77.8 58.9
% Margin 56.7% 28.1% 40.8% 39.5%
Net Income 105.1 (20.3) (111.4) (67.8)
Total Debt 591 % Margin 35.0% (6.5%) (58.4%) (45.5%)
Cash and Cash eq. 24
Net Debt 567 EBITDA / Interest 95.7x 7.8x 3.5x 2.8x
(EBITDA - CapEx) / Interest NM NM NM NM
Net Debt / EBITDA 9.6x
Debt / EBITDA 10.0x
1) As of Mar 2016
Ithaca Energy Inc., together with its subsidiaries, engages in the exploration,
development, and production of oil and gas in the North Sea. Its principal properties
are located in the Northern, Central, and Southern North Sea; and Southern England.
As of December 31, 2015, the company had proved and probable reserves of 57
million barrels of oil equivalent. Ithaca Energy Inc. was founded in 2004 and is
headquartered in Aberdeen, the United Kingdom.
- Apr 2016 - Reserve Based Lending (RBL) review completed with USD 100mn of
headroom maintained. De-leverging commenced in 2015 with net debt reducing
from a peak of USD 800M in 1H'15 to USD 630mn in 1Q'16
- May 2016 - 1Q'16 financial results down 53% y-o-y but average production of
9,000 boepd in line with guidance and material reduction in operating costs to
25/boe vs forecast of USD 30/boe. On line for first production from Stella field in
September 2016 with production set to double to 20-25,000 boepd and operating
cost to reduce to below USD 20/boe
L. INDUSTRIAL PRODUCTS AND SERVICES – N&W GLOBAL VENDING SPA
28
Business Overview Situation Overview
Capital Structure (EUR m)1 Financial Summary (EUR m)
Capital Structure Out. Maturity Floating Rate Seniority Dec-12 Dec-13 Dec-14 Dec-15
Short term debt 120.5 Total Revenue 262.1 259.5 269.2 269.4
Long term debt 106.3 % Growth na (1.0%) 3.7% 0.1%
EBITDA 43.6 49.6 55.3 54.1
% Margin 16.6% 19.1% 20.5% 20.1%
Total Debt 227 Net Income (66.4) (16.5) (29.8) (20.8)
Cash and Cash eq. 27 % Margin (25.3%) (6.4%) (11.1%) (7.7%)
Net Debt 200
EBITDA / Interest na na na na
Net Debt / EBITDA 3.6x (EBITDA - CapEx) / Interest na na na na
Debt / EBITDA 4.1x
1) As of Dec 2015
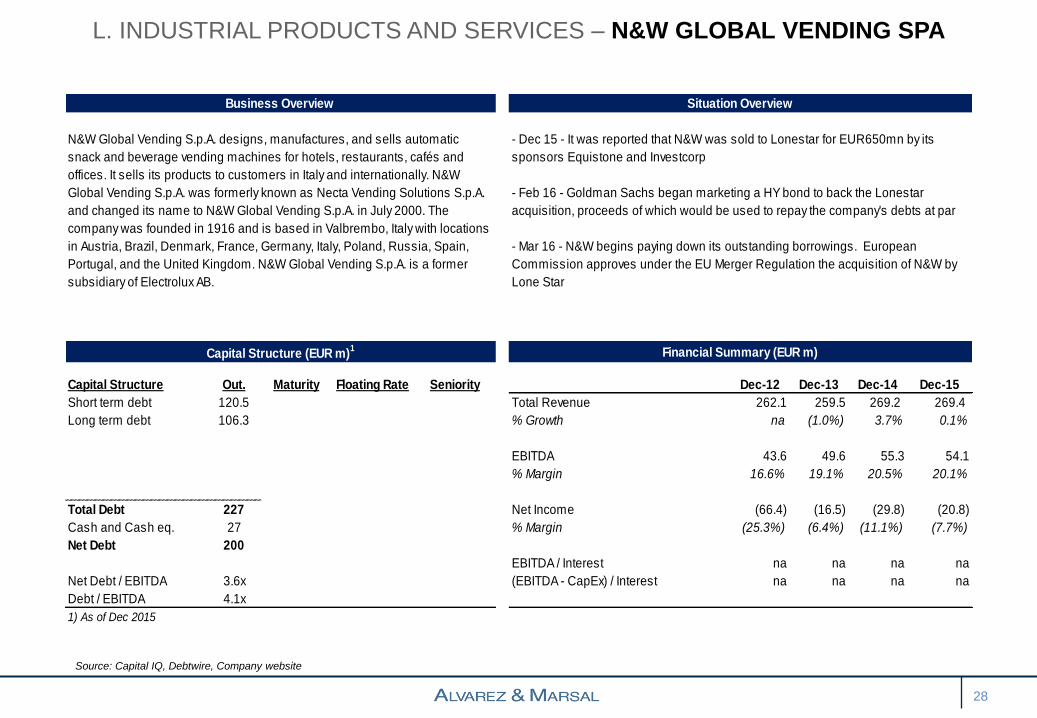
N&W Global Vending S.p.A. designs, manufactures, and sells automatic
snack and beverage vending machines for hotels, restaurants, cafés and
offices. It sells its products to customers in Italy and internationally. N&W
Global Vending S.p.A. was formerly known as Necta Vending Solutions S.p.A.
and changed its name to N&W Global Vending S.p.A. in July 2000. The
company was founded in 1916 and is based in Valbrembo, Italy with locations
in Austria, Brazil, Denmark, France, Germany, Italy, Poland, Russia, Spain,
Portugal, and the United Kingdom. N&W Global Vending S.p.A. is a former
subsidiary of Electrolux AB.
- Dec 15 - It was reported that N&W was sold to Lonestar for EUR650mn by its
sponsors Equistone and Investcorp
- Feb 16 - Goldman Sachs began marketing a HY bond to back the Lonestar
acquisition, proceeds of which would be used to repay the company's debts at par
- Mar 16 - N&W begins paying down its outstanding borrowings. European
Commission approves under the EU Merger Regulation the acquisition of N&W by
Lone Star
Source: Capital IQ, Debtwire, Company website
M. TRANSPORTATION – NAVIOS MARITIME HOLDINGS INC.
29
Business Overview Situation Overview
Capital Structure (EUR m)1 Financial Summary (EUR m)
Debt Out. Maturity Floating Rate Seniority Dec-13 Dec-14 Dec-15 LTM Mar-16
Bank Facilities 214.7 2018-2022 L+225-360bps Secured Total Revenue 377.7 481.9 457.6 423.0
Notes 1207.3 2019-2022 7.25% - 8.125% % Growth na 27.6% (5.0%) (7.6%)
EBITDA 73.5 96.1 34.4 50.0
% Margin 19.5% 19.9% 7.5% 11.8%
Net Income (79.2) (46.4) (123.5) (100.9)
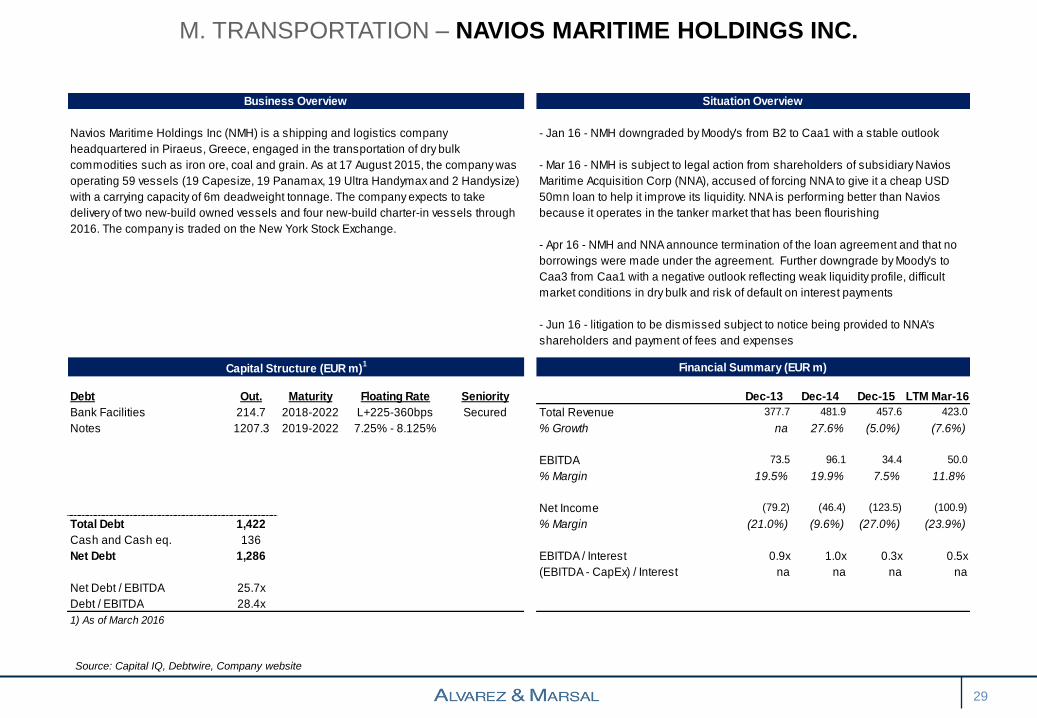
Total Debt 1,422 % Margin (21.0%) (9.6%) (27.0%) (23.9%)
Cash and Cash eq. 136
Net Debt 1,286 EBITDA / Interest 0.9x 1.0x 0.3x 0.5x
(EBITDA - CapEx) / Interest na na na na
Net Debt / EBITDA 25.7x
Debt / EBITDA 28.4x
1) As of March 2016
Navios Maritime Holdings Inc (NMH) is a shipping and logistics company
headquartered in Piraeus, Greece, engaged in the transportation of dry bulk
commodities such as iron ore, coal and grain. As at 17 August 2015, the company was
operating 59 vessels (19 Capesize, 19 Panamax, 19 Ultra Handymax and 2 Handysize)
with a carrying capacity of 6m deadweight tonnage. The company expects to take
delivery of two new-build owned vessels and four new-build charter-in vessels through
2016. The company is traded on the New York Stock Exchange.
- Jan 16 - NMH downgraded by Moody's from B2 to Caa1 with a stable outlook
- Mar 16 - NMH is subject to legal action from shareholders of subsidiary Navios
Maritime Acquisition Corp (NNA), accused of forcing NNA to give it a cheap USD
50mn loan to help it improve its liquidity. NNA is performing better than Navios
because it operates in the tanker market that has been flourishing
- Apr 16 - NMH and NNA announce termination of the loan agreement and that no
borrowings were made under the agreement. Further downgrade by Moody's to
Caa3 from Caa1 with a negative outlook reflecting weak liquidity profile, difficult
market conditions in dry bulk and risk of default on interest payments
- Jun 16 - litigation to be dismissed subject to notice being provided to NNA's
shareholders and payment of fees and expenses
Source: Capital IQ, Debtwire, Company website

O. ENERGY – OCEAN RIG UDW INC.
30
Source: Capital IQ, Debtwire, Company website
Business Overview Situation Overview
Capital Structure (EUR m)1 Financial Summary (EUR m)
Capital Structure Out. Maturity Floating Rate Seniority Dec-13 Dec-14 Dec-15 LTM Mar-16
$1.3bn Term Loan B 1,127 Jul-21 L+450bps Sr Sec Total Revenue 857.0 1,501.2 1,609.7 1,628.0
$1.9bn Term Loan B 1,631 2020 L+450bps Sec % Growth na 75.2% 7.2% 1.1%
$462mn Credit Facility 372 2020 L+210bps Sr Unsec
6.5% Notes 405 2017 6.50% Sr Unsec EBITDA 398.2 791.0 981.3 1,043.3
7.25% Notes 115 2019 7.25% Sr Unsec % Margin 46.5% 52.7% 61.0% 64.1%
Other -67
Net Income 46.0 214.6 73.7 287.0
Total Debt 3,583 % Margin 5.4% 14.3% 4.6% 17.6%
Cash and Cash eq. 712 EBITDA / Interest 3.5x 3.4x 3.7x 4.3x
Net Debt 2,871 (EBITDA - CapEx) / Interest na 0.7x 1.5x 3.6x
Net Debt / EBITDA 2.8x
Debt / EBITDA 3.4x
1) As of Mar 2016
Ocean Rig UDW Inc., an offshore drilling contractor, provides oilfield services for
offshore oil and gas exploration, development, and production drilling worldwide. It
specializes in the ultra-deepwater and harsh-environment segment of the offshore
drilling industry. The company owns and operates two fifth generation harsh weather
ultra-deepwater semisubmersible offshore drilling units under the Leiv Eiriksson and
Eirik Raude names; four sixth generation ultra-deepwater drilling units under the
Ocean Rig Corcovado, Ocean Rig Olympia, Ocean Rig Poseidon, and the Ocean Rig
Mykonos names; and four seventh generation drilling units under the Ocean Rig
Mylos, Ocean Rig Skyros, Ocean Rig Athena, and Ocean Rig Apollo names. It serves
oil companies, integrated oil and gas companies, state-owned national oil
companies, and independent oil and gas companies. The company is based in
Nicosia, Cyprus.
- Feb 16 - The company was downgraded to CCC+ from B- by S&P with a negative outlook
due to an unstable capital structure and inadequate liquidity
- Apr 16 - DryShips agrees to sell its stake in Ocean Rig to an unrestricted subsidiary of
Ocean Rig for a cash consideration of USD 50mn removing uncertainty regarding potential
negative intervention. DryShips no longer has an equity interest
- Apr 16 - announcement of acquisition of ultra deepwater drillship for USD 65mn and
movement of corporate domicile to the Cayman Islands
- May 16 - Evercore reportedly retained to assist with restructuring negotiations due to
upcoming maturities and a roll-off of contract backlog over the next two years
- Jul 16 - a group of lenders have reportedly lined up Houlihan Lokey as Financial Advisor

P. ENERGY – PA RESOURCES
31
Source: Capital IQ, Debtwire, Company website
Business Overview Situation Overview
Capital Structure (EUR m)1 Financial Summary (EUR m)
Capital Structure Out. Maturity Floating Rate Seniority Dec-12 Dec-13 Dec-14 Dec-15
Reorganisation notes 10 500 bps Sr Sec Total Revenue 230.1 108.7 62.5 24.9
Working Capital Facility 28 300 bps Sec % Growth na (52.8%) (42.5%) (60.2%)
NOK 675M Bond 399 2017 300 bps Unsec
SEK 750M Bond 211 2017 300 bps Unsec EBITDA 132.3 45.9 36.2 1.7
% Margin 57.5% 42.2% 57.9% 6.8%
Net Income (207.1) (128.4) (311.6) 82.1
Total Debt 648 % Margin (90.0%) (118.1%) (498.6%) 329.7%
Cash and Cash eq. 677 EBITDA / Interest 3.3x 1.6x 1.3x 0.2x
Net Debt -29 (EBITDA - CapEx) / Interest 2.6x 0.6x 0.7x NM
Net Debt / EBITDA -17.1x
Debt / EBITDA 381.2x
1) As of Dec 2015
PA Resources engages in the acquisition, extraction, and sale of oil and gas
reserves. The company was founded in 1994 and is headquartered in Stockholm,
Sweden.
- Following the failure of the Azurite field in the Republic of Congo to deliver expected
production levels in 2011-2013, PA Resources has been burdened with unsustainably
high level of debt
- In 2013-2014 the Company entered into farm out agreements for its key development
assets in order to raise cash and reduce investment needs. The drop in oil price in 2014
together with Enquest's reversal of the farm out in January 2015 resulted in a situation
where the company was unable to service its debts
-The Company negotiated a potential refinancing plan but filed for corporate re-
organisation on 26 March 2015. In parallel with the re-organisation process the board
initiated a strategic review which was completed in Nov 2015. Despite the reorganisation
process and strategic review the company does not have long term financing and has
decided to sell its assets
Q. MARINE – PARAGON SHIPPING INC.
32
Source: Capital IQ, Debtwire, Company website
Business Overview Situation Overview
Capital Structure (EUR m)1 Financial Summary (EUR m)
Capital Structure Out. Maturity Floating Rate Seniority Dec-12 Dec-13 Dec-14 Dec-15
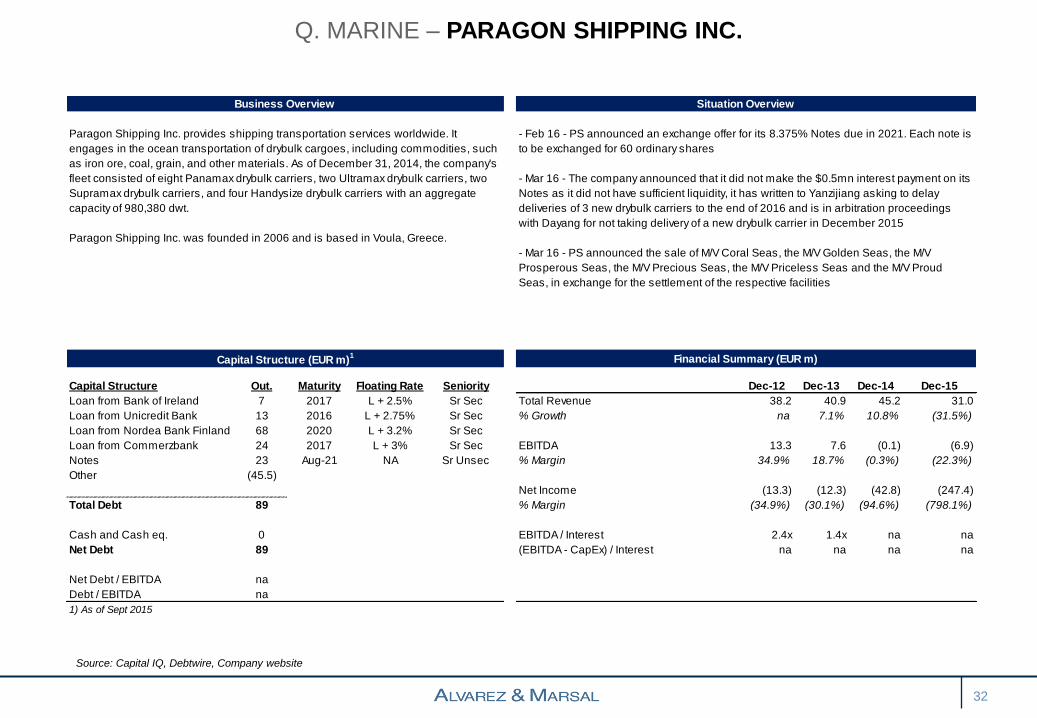
Loan from Bank of Ireland 7 2017 L + 2.5% Sr Sec Total Revenue 38.2 40.9 45.2 31.0
Loan from Unicredit Bank 13 2016 L + 2.75% Sr Sec % Growth na 7.1% 10.8% (31.5%)
Loan from Nordea Bank Finland 68 2020 L + 3.2% Sr Sec
Loan from Commerzbank 24 2017 L + 3% Sr Sec EBITDA 13.3 7.6 (0.1) (6.9)
Notes 23 Aug-21 NA Sr Unsec % Margin 34.9% 18.7% (0.3%) (22.3%)
Other (45.5)
Net Income (13.3) (12.3) (42.8) (247.4)
Total Debt 89 % Margin (34.9%) (30.1%) (94.6%) (798.1%)
Cash and Cash eq. 0 EBITDA / Interest 2.4x 1.4x na na
Net Debt 89 (EBITDA - CapEx) / Interest na na na na
Net Debt / EBITDA na
Debt / EBITDA na
1) As of Sept 2015
Paragon Shipping Inc. provides shipping transportation services worldwide. It
engages in the ocean transportation of drybulk cargoes, including commodities, such
as iron ore, coal, grain, and other materials. As of December 31, 2014, the company's
fleet consisted of eight Panamax drybulk carriers, two Ultramax drybulk carriers, two
Supramax drybulk carriers, and four Handysize drybulk carriers with an aggregate
capacity of 980,380 dwt.
Paragon Shipping Inc. was founded in 2006 and is based in Voula, Greece.
- Feb 16 - PS announced an exchange offer for its 8.375% Notes due in 2021. Each note is
to be exchanged for 60 ordinary shares
- Mar 16 - The company announced that it did not make the $0.5mn interest payment on its
Notes as it did not have sufficient liquidity, it has written to Yanzijiang asking to delay
deliveries of 3 new drybulk carriers to the end of 2016 and is in arbitration proceedings
with Dayang for not taking delivery of a new drybulk carrier in December 2015
- Mar 16 - PS announced the sale of M/V Coral Seas, the M/V Golden Seas, the M/V
Prosperous Seas, the M/V Precious Seas, the M/V Priceless Seas and the M/V Proud
Seas, in exchange for the settlement of the respective facilities
S. ENERGY – SEABIRD EXPLORATION PLC
Source: Capital IQ, Debtwire, Company website
33
Business Overview Situation Overview
Capital Structure (EUR m)1 Financial Summary (EUR m)
Debt Out. Maturity Floating Rate Seniority Dec-13 Dec-14 Dec-15 LTM Mar-16
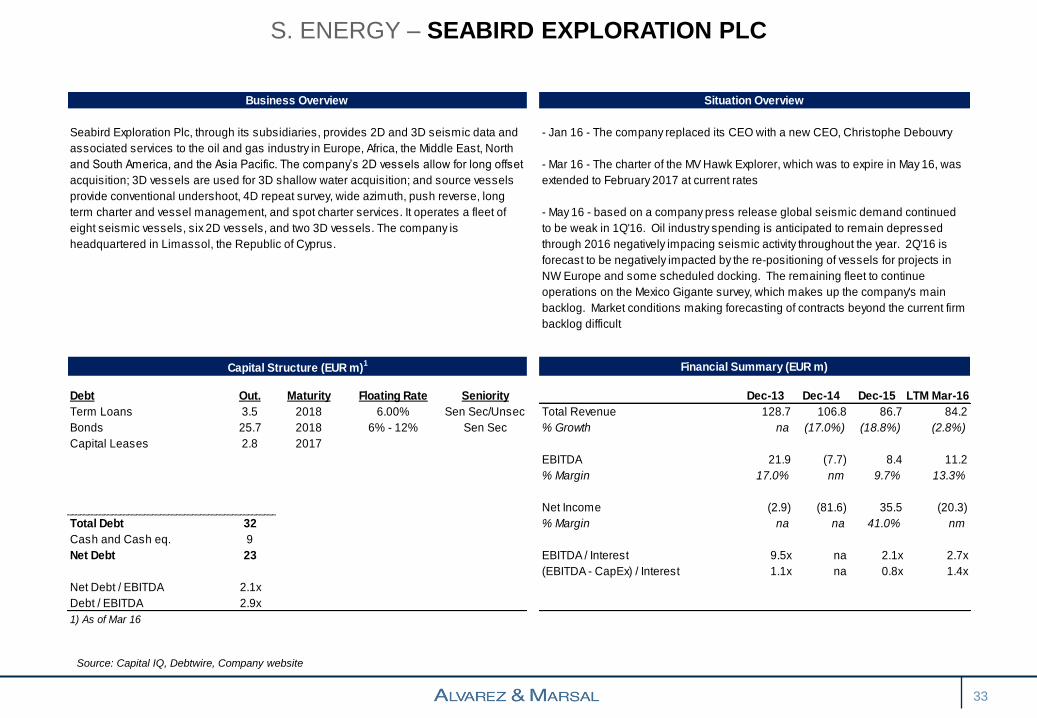
Term Loans 3.5 2018 6.00% Sen Sec/Unsec Total Revenue 128.7 106.8 86.7 84.2
Bonds 25.7 2018 6% - 12% Sen Sec % Growth na (17.0%) (18.8%) (2.8%)
Capital Leases 2.8 2017
EBITDA 21.9 (7.7) 8.4 11.2
% Margin 17.0% nm 9.7% 13.3%
Net Income (2.9) (81.6) 35.5 (20.3)
Total Debt 32 % Margin na na 41.0% nm
Cash and Cash eq. 9
Net Debt 23 EBITDA / Interest 9.5x na 2.1x 2.7x
(EBITDA - CapEx) / Interest 1.1x na 0.8x 1.4x
Net Debt / EBITDA 2.1x
Debt / EBITDA 2.9x
1) As of Mar 16
Seabird Exploration Plc, through its subsidiaries, provides 2D and 3D seismic data and
associated services to the oil and gas industry in Europe, Africa, the Middle East, North
and South America, and the Asia Pacific. The company’s 2D vessels allow for long offset
acquisition; 3D vessels are used for 3D shallow water acquisition; and source vessels
provide conventional undershoot, 4D repeat survey, wide azimuth, push reverse, long
term charter and vessel management, and spot charter services. It operates a fleet of
eight seismic vessels, six 2D vessels, and two 3D vessels. The company is
headquartered in Limassol, the Republic of Cyprus.
- Jan 16 - The company replaced its CEO with a new CEO, Christophe Debouvry
- Mar 16 - The charter of the MV Hawk Explorer, which was to expire in May 16, was
extended to February 2017 at current rates
- May 16 - based on a company press release global seismic demand continued
to be weak in 1Q'16. Oil industry spending is anticipated to remain depressed
through 2016 negatively impacing seismic activity throughout the year. 2Q'16 is
forecast to be negatively impacted by the re-positioning of vessels for projects in
NW Europe and some scheduled docking. The remaining fleet to continue
operations on the Mexico Gigante survey, which makes up the company's main
backlog. Market conditions making forecasting of contracts beyond the current firm
backlog difficult
U. RETAIL – TAKKO MODEMARKT GMBH & CO.
34
Source: Capital IQ, Debtwire, Company website
Business Overview Situation Overview
Capital Structure (EUR m)1 Financial Summary (EUR m)
Debt Out. Maturity Floating Rate Seniority Apr-13 Apr-14 Apr-15 LTM Jul-16
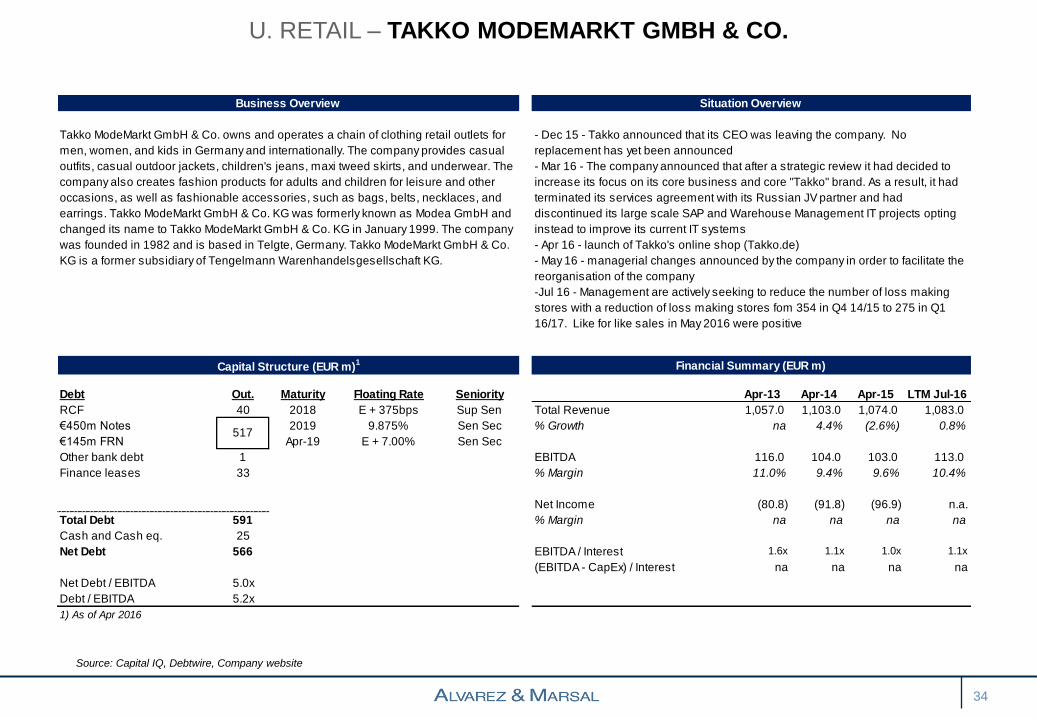
RCF 40 2018 E + 375bps Sup Sen Total Revenue 1,057.0 1,103.0 1,074.0 1,083.0
€450m Notes 2019 9.875% Sen Sec % Growth na 4.4% (2.6%) 0.8%
€145m FRN Apr-19 E + 7.00% Sen Sec
Other bank debt 1 EBITDA 116.0 104.0 103.0 113.0
Finance leases 33 % Margin 11.0% 9.4% 9.6% 10.4%
Net Income (80.8) (91.8) (96.9) n.a.
Total Debt 591 % Margin na na na na
Cash and Cash eq. 25
Net Debt 566 EBITDA / Interest 1.6x 1.1x 1.0x 1.1x
(EBITDA - CapEx) / Interest na na na na
Net Debt / EBITDA 5.0x
Debt / EBITDA 5.2x
1) As of Apr 2016
Takko ModeMarkt GmbH & Co. owns and operates a chain of clothing retail outlets for
men, women, and kids in Germany and internationally. The company provides casual
outfits, casual outdoor jackets, children's jeans, maxi tweed skirts, and underwear. The
company also creates fashion products for adults and children for leisure and other
occasions, as well as fashionable accessories, such as bags, belts, necklaces, and
earrings. Takko ModeMarkt GmbH & Co. KG was formerly known as Modea GmbH and
changed its name to Takko ModeMarkt GmbH & Co. KG in January 1999. The company
was founded in 1982 and is based in Telgte, Germany. Takko ModeMarkt GmbH & Co.
KG is a former subsidiary of Tengelmann Warenhandelsgesellschaft KG.
- Dec 15 - Takko announced that its CEO was leaving the company. No
replacement has yet been announced
- Mar 16 - The company announced that after a strategic review it had decided to
increase its focus on its core business and core "Takko" brand. As a result, it had
terminated its services agreement with its Russian JV partner and had
discontinued its large scale SAP and Warehouse Management IT projects opting
instead to improve its current IT systems
- Apr 16 - launch of Takko's online shop (Takko.de)
- May 16 - managerial changes announced by the company in order to facilitate the
reorganisation of the company
-Jul 16 - Management are actively seeking to reduce the number of loss making
stores with a reduction of loss making stores fom 354 in Q4 14/15 to 275 in Q1
16/17. Like for like sales in May 2016 were positive
517

V. MINING – TIZIR LIMITED
35
Source: Capital IQ, Debtwire, Company website
Business Overview Situation Overview
Capital Structure (EUR m)1 Financial Summary (EUR m)
Capital Structure Out. Maturity Floating Rate Seniority Dec-12 Dec-13 Dec-14 Dec-15
GCO WC Facility 23 Dec-16 Total Revenue 175.3 146.2 133.7 155.6
TTI WC Facility 36 % Growth na (16.6%) (8.5%) 16.3%
Senior Bonds & Notes 250 Sep-17 9.0%
Shareholder Loan 155 EBITDA 81.5 31.9 (1.7) (6.2)
0 % Margin 46.5% 21.8% (1.2%) (4.0%)
Total Debt 463 Net Income 37.1 10.9 (133.0) (73.7)
% Margin 21.2% 7.4% na na
Cash and Cash eq. 2
Net Debt 461 EBITDA / Interest na 51.9x na na
(EBITDA - CapEx) / Interest na na na na
Net Debt / EBITDA na
Debt / EBITDA na
1) As of Dec 2015
TiZir Limited engages in the mining business in Norway and Senegal. It holds
a 100% interest in the Tizir titanium and iron ore ilmenite upgrading facility that
produces titanium slag and high purity pig iron in Tyssedal, Norway; and a
90% interest in the Grande Côte mineral sands project that produces zircon,
rutile, leucoxene, and ilmenite located in Senegal, West Africa. The company
was incorporated in 2011 and is based in London, the United Kingdom.
- Dec 15 -Tizir secured consent to relax bond covenants in exchange for a 2.75% fee
- TiZir has been struggling due to the slowdown in demand for titanium dioxide due
to a slowdown in the construction industry
- Jun 16 - Tizir successfully combined operations at its Grande Cote and Tyssedal
facilities. Despite commissioning issues and the planned shutdown impacting
performance during the year the company is reportedly expected to benefit from
synergies going forward

W. ENERGY – TRANSOCEAN
36
Source: Capital IQ, Debtwire, Company website
Business Overview Situation Overview
Capital Structure (EUR m)1 Financial Summary (EUR m)
Capital Structure Out. Maturity Floating Rate Seniority Dec-13 Dec-14 Dec-15 LTM Mar-16
Term Loans 157 2018 4.150% Snr secured Total Revenue 6,716.2 7,579.1 6,402.0 5,305.2
Senior Bonds & Notes 6,751 2016-41 Snr unsecured % Growth na 12.8% (15.5%) (17.1%)
Capital Leases 514
EBITDA 2,458.0 3,136.1 2,746.1 2,206.5
% Margin 36.6% 41.4% 42.9% 41.6%
Total Debt 7,422 Net Income 1,021.7 (1,580.4) 728.3 1,337.3
% Margin 15.2% (20.9%) 11.4% 25.2%
Cash and Cash eq. 2,260
Net Debt 5,162 EBITDA / Interest 5.8x 7.9x 6.9x 6.2x
(EBITDA - CapEx) / Interest 2.0x 3.4x 2.3x 0.9x
Net Debt / EBITDA 2.34x
Debt / EBITDA 3.36x
1) As of Mar 2016
Transocean Ltd., together with its subsidiaries, provides offshore contract
drilling services for oil and gas wells worldwide. The company primarily offers
deepwater and harsh environment drilling services. As of February 11, 2016, it
owned or had partial ownership interests in, and operated 61 mobile offshore
drilling units that consist of 28 ultra-deepwater floaters, 7 harsh environment
floaters, 5 deepwater floaters, 11 midwater floaters, and 10 high-specification
jackups. The company serves government-controlled oil companies and
independent oil companies. Transocean Ltd. was founded in 1953 and is
based in Vernier, Switzerland.
- Mar 16 - Transocean downgraded to B2 from Ba2 with stable outlook due to weak
dayrates and utilization, new rig commitments and debt maturities in 2018. The B2
rating is supported by proactive measures to reduce operating costs, strong liquidity
and a large and diverse offshore drilling rig fleet
- Mar 16 - the Company announced the delay of five high-spec jackups and related
payments until 2020
- Apr 16 - announcement of the delay of and final payment for two dynamically
positioned ultra-deepwater drillships
- Jul 16 - Transocean Inc, the Company's wholly owned subsidiary announced a new
bond offering of USD 1.5 Bn, with a portion of the net proceeds to fund the purchase
of its existing notes due in 2020, 2021 and 2022. Moody's rates new notes as B1,
but downgrades existing notes to Caa1
X. PUBLISHING – TRUVO N.V./S.A.
37
Source: Capital IQ, Debtwire, Company website
Business Overview Situation Overview
Capital Structure (EUR m) Financial Summary (EUR m)
Capital Structure Out. Maturity Floating Rate Seniority Dec-12 Dec-13 Dec-14 Dec-15
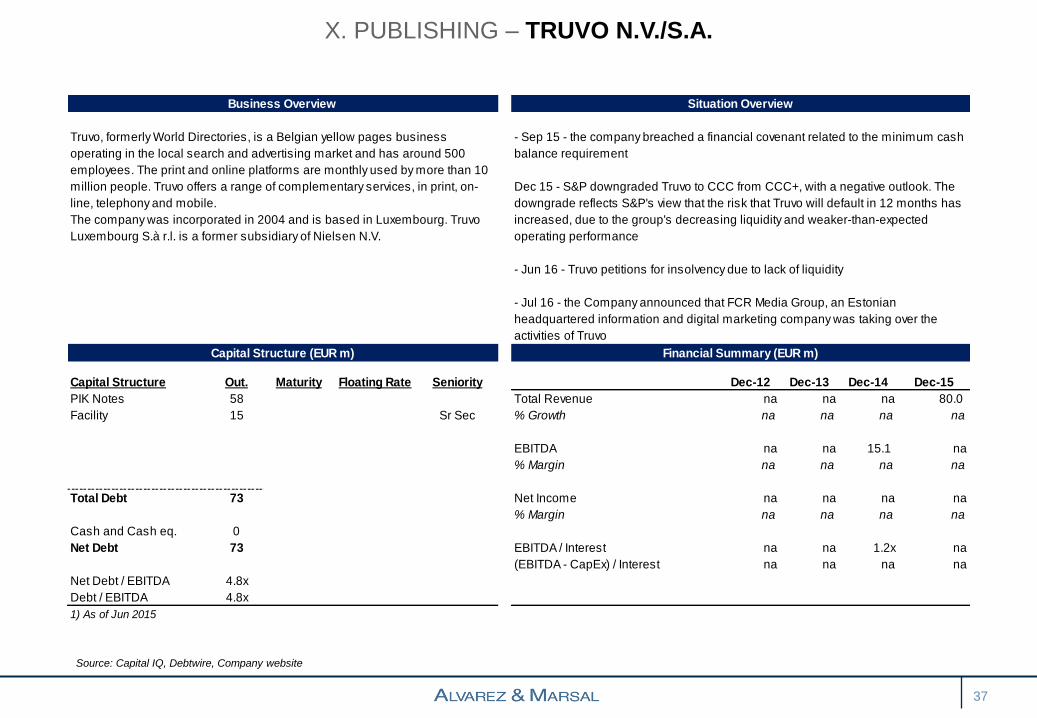
PIK Notes 58 Total Revenue na na na 80.0
Facility 15 Sr Sec % Growth na na na na
EBITDA na na 15.1 na
% Margin na na na na
Total Debt 73 Net Income na na na na
% Margin na na na na
Cash and Cash eq. 0
Net Debt 73 EBITDA / Interest na na 1.2x na
(EBITDA - CapEx) / Interest na na na na
Net Debt / EBITDA 4.8x
Debt / EBITDA 4.8x
1) As of Jun 2015
Truvo, formerly World Directories, is a Belgian yellow pages business
operating in the local search and advertising market and has around 500
employees. The print and online platforms are monthly used by more than 10
million people. Truvo offers a range of complementary services, in print, on-
line, telephony and mobile.
The company was incorporated in 2004 and is based in Luxembourg. Truvo
Luxembourg S.à r.l. is a former subsidiary of Nielsen N.V.
- Sep 15 - the company breached a financial covenant related to the minimum cash
balance requirement
Dec 15 - S&P downgraded Truvo to CCC from CCC+, with a negative outlook. The
downgrade reflects S&P's view that the risk that Truvo will default in 12 months has
increased, due to the group's decreasing liquidity and weaker-than-expected
operating performance
- Jun 16 - Truvo petitions for insolvency due to lack of liquidity
- Jul 16 - the Company announced that FCR Media Group, an Estonian
headquartered information and digital marketing company was taking over the
activities of Truvo

Y. CONSTRUCTION – URALITA
38
Source: Capital IQ, Debtwire, Company website
Business Overview Situation Overview
Capital Structure (EUR m) Financial Summary (EUR m)
Capital Structure Out. Maturity Floating Rate Seniority Dec-12 Dec-13 Dec-14 Dec-15
RCF 1.7 Total Revenue 622.5 545.7 120.8 120.7
Term Loans 14.9 % Growth na (12.3%) (77.9%) (0.1%)
EBITDA 53.9 28.9 13.2 9.6
% Margin na (46.4%) (54.3%) (27.3%)
Total Debt 17 Net Income (42.9) (62.6) (118.4) (76.0)
% Margin (6.9%) (11.5%) (98.0%) (63.0%)
Cash and Cash eq. 6
Net Debt 11 EBITDA / Interest 2.1x 0.8x 18.1x 13.8x
(EBITDA - CapEx) / Interest 1.4x 0.3x na na
Net Debt / EBITDA 1.2x
Debt / EBITDA 1.7x
1) As of Dec 2015
Corporacion Empresarial de Materiales de Construccion, S.A. (COEMAC)
manufactures and markets construction materials in Spain and
internationally. It offers interior solutions, including insulating products and
gypsum; and piping systems. The company was formerly known as Uralita,
S.A. and changed its name to Corporacion Empresarial de Materiales de
Construccion, S.A. in June 2015. The company was founded in 1907 and is
headquartered in Madrid, Spain. Corporacion Empresarial de Materiales de
Construccion, S.A. operates as a subsidiary of Pool De Activos S.L.U.
- Jun 15 - Change of name from Uralita to Corporacion Empresarial de Materiales
de Construccion (COEMAC)
- Sept 15 - Completion of sale of 90% of the insulation business to a group of
creditors led by KKR in return for liberation from corporate guarantees via the
Mezzanine Facility Agreement and the Senior Facility Agreement for a total
consideration of €320M. The remaining Group comprises the plaster business -
Pladur and Algiss and pipelines business Adequa

Z. INDUSTRIAL PRODUCTS AND SERVICES – WINOA
39
Source: Capital IQ, Debtwire, Company website
Business Overview Situation Overview
Capital Structure (EUR m) Financial Summary (EUR m)
Capital Structure Out. Maturity Floating Rate Seniority Dec-12 Dec-13 Dec-14 Dec-15
Bank Loan & Overdraft 57 Total Revenue 97.6 92.3 90.8 na
Other 48 % Growth na (5.4%) (1.6%) na
EBITDA 7.4 7.7 5.8 na
% Margin na 4.1% (24.7%) na
Total Debt 106 Net Income 4.0 3.9 1.4 na
% Margin 4.1% 4.2% 1.5% na
Cash and Cash eq. 18
Net Debt 88 EBITDA / Interest 0.3x 0.4x 1.1x unknown
(EBITDA - CapEx) / Interest na na na na
Net Debt / EBITDA 15.1x
Debt / EBITDA 18.2x
1) As of Dec 2014
Winoa SA, formerly Wheelabrator Allevard, is a world leader in abrasion and
cutting technologies for the metal and stone industries. Its products are sold
through a network of agents and distributors in China, Asia and Oceania,
India, the Middle East and Africa, South America, North America, and Eastern
and Western Europe. The company was founded in 1961 and is based in Le
Cheylas, France with a plant in Kurgan, Russian Federation.
- The Group was acquired by KKR in November 2013, reducing the level of debt
from €340M to €188M and injecting €60M of cash. Plans to re-finance the debt via a
senior secured bond were shelved in 2014

KEY CONTACTS
40
Mike Corner-Jones
Co-Head of Restructuring Europe
London
Tel: + 44 (0) 207 663 0439
Mobile: + 44 (0) 774 776 8814
Email: [email protected]
Stefaan Vansteenkiste
Co-Head of Restructuring Europe
Netherlands
Tel: +31 20 767 1114
Mobile: +31 68 364 6717
Email: [email protected]
Adriano Bianchi
Head of Restructuring Italy
Tel:+39 028 596 4120
Mobile: +39 02 859 6411
Email: [email protected]
Bob Rajan
Co-Head of Restructuring Germany
Tel: +49 89 710 40 6061
Mobile: +49 151 1626 7598
Email: [email protected]

EUROPEAN OFFICES
41
A&M Europe HQ
Alvarez & Marsal Europe LLP One Finsbury Circus
London EC2M 7EB
United Kingdom
Tel: +44 207 715 5200
Fax: +44 207 715 5201
www.alvarezandmarsal.eu
Other European Offices
Alvarez & Marsal Italia S.r.l.
Piazzale Luigi Cadorna, 4
20123 Milano
Italy
Tel: +39 02 8596 411
Fax: +39 02 8596 4150
Alvarez & Marsal CIS LLP
9, Zemlyanoy Val Str. (4th Floor)
Moscow 105 064
Russia
Tel: + 74 959 887 745
Fax: + 74 959 887 745
Alvarez & Marsal Deutschland GmbH
Thierschplatz 6
D-80538 Munich, Germany
Phone: +49 89 71 04 06 00
Fax: +49 89 71 04 06 01
Alvarez & Marsal France SCS
24, rue Royale
75008 Paris
France
Tel: +33 1 44 50 01 11
Fax: +33 1 44 50 01 35
Alvarez & Marsal Benelux B.V.
WTC H-Tower
14th Floor
Zuidplein 118
PO Box 79061
1070 NC Amsterdam
Tel: +31 20 7671 111
Fax: +31 20 7671 122
Alvarez & Marsal Prague
Václavské náměstí 823/33
110 00 Prague 1
Czech Republic
Tel No. +420 212 240 905
Fax No. +420 212 244 355
Alvarez & Marsal Europe Limited
Calle de Velázquez
17 – 2º D
28001 – Madrid
Spain
Tel: +34 91 781 5521
Fax: +34 91 435 9185
Alvarez & Marsal Poland Sp. z o.o
PI. Trzech Krzyży 3
00-535 Warszawa
Tel: +48 22 397 82 00
Fax: +48 22 584 71 60
Alvarez & Marsal Greece
44 Zalokosta and Kifissias Avenue
152 33 Chalandri
Athens, Greece
Tel: +30 211 1069 417
Fax: +30 210 6838 221
Alvarez & Marsal Middle East Limited
Dubai
Level 3, Gate Village Building 4
Dubai International Financial Centre
PO Box 506729
Dubai, UAE
Tel: +971 4 401 9512
Fax: +971 4 401 9511
© Copyright 2014. Alvarez & Marsal Holdings, LLC. All rights reserved. ALVAREZ & MARSAL®,
® and A&M® are trademarks of Alvarez & Marsal Holdings, LLC.
Top Related